
Submitted:
27 November 2025
Posted:
28 November 2025
You are already at the latest version
Abstract
This paper focuses on the design and development of a decision support system (DSS) for the governance of intralogistics processes and, in particular, devoted to optimize capacity management and the workload of activities characterizing freight entry. This research activity was carried out as part of the Logistics Research and Development 4.0 Project launched by La Logistica Srl, a new player in the distribution of hydro-thermo sanitary products, with the support of the Puglia Region. The purpose of this study is to provide managers with a range of customized process information to improve workforce efficiency and management in receiving, controlling, and storing goods entering the newly established logistics hub. Other researchers’ work had shortcomings, as did the lack of this study’s practical approach. This study aims to overcome these constraints. To do so, the study introduces the Content Load Parameter (CLP) index. This index integrates three variables relevant to defining the workload, such as quantity, size and weights of the goods to be handled, using a single standard value. This makes it easier for managers to estimate the required capacity all along the work cycle. As part of the system development, a module analyzes and simulates operational scenarios. Simulation facilitates the management of analysis capacity by allowing alternatives to be compared and evaluated to bridge the gap between demand and availability of production capacity in various situations. Scenario simulation, combined with tools for concise and effective visualization of results, therefore allows organizations to identify critical capacity points and take preventative measures to manage overhead and minimize consequences. In summary, this study demonstrates how integrating the Content Load Parameter index into a decision support system can significantly contribute to making intralogistics process management more effective. By addressing quantifiable workload parameters and facilitating scenario-based operational analysis, the proposed system provides managers with useful information for capacity optimization. These advances not only overcome the limitations of previous research but also help develop resilient and efficient logistics operations, thus strengthening the critical role of empirically informed decision-making in contemporary logistics governance.
Keywords:
Decision-Support Systems (DSS)
; warehouse capacity planning
; data-driven logistics
; simulation and workload optimization
; artificial intelligence in supply chain management
1. Introduction
This study reports the results of an application-oriented research task undertaken by La Logistica S.r.l., headquartered in Monopoli, Southern Italy, as part of the Apulia Region’s industrial innovation initiative. This innovation target focuses on the redesign and optimization of goods-receiving operations, with particular attention to hydrosanitary products, which inherently exhibit high product variability and receive irregular shipments under strictly defined constraints on place, time, and personnel. Within this context, the goods-receiving operation, covering unloading, quality inspection, and subsequent warehousing, assumes special significance for the efficiency of warehouse capacity and the accuracy of the goods information recorded therein (Sapry et al. 2020). Despite this significance and the critical implications of these functions for supply chain management strategies, this particular activity is still managed on the basis of certain well-established yet dynamic rules that neglect the possibility of goods supply variability (Mulla, 2024). The specific problem emerged from the company’s experience with increased product diversity and variability in suppliers’ delivery patterns. In this context, the company faced common difficulties of the type typically studied in AI- and robotic-assisted data-oriented logistics system designs and analyses (Tang, 2025). This study overcomes these difficulties by developing a decision-support system that simulates alternative goods supply process scenarios and estimates supplier personnel requirements using its simulation algorithm (Khalil, 2023). This study introduces the CLP concept that merges the induced workload of products based on their quantity, dimensions, and weights into an integrated criterion of induced workload with the standardization potential of facilitating the calculation of the products’ personnel requirements based on the decision-support system approach initiated above with particular attention to the application of AI-analytics within the simulation of alternative decision scenarios of warehouses (Sodiya et al. 2024). Alongside the provision of dashboards and Key Performance Indicators (KPIs), this system enables real-time visualization of resource use, efficiency levels, and bottlenecks, enabling proactive management action (Chanda, 2024). This study offers a new approach to warehouse management by focusing on an underexplored aspect of the receiving process that still lags behind other areas of storage and picking optimization (Alfiya et al., 2025). As this study focuses on the real-life experience of the company La Logistica S.r.l. The results of this research can offer potential applications in other industries, given the different contexts in which the system is appropriately applied (Khalil, 2023).
2. Variability and Workforce Complexity in Hydrosanitary Goods Receiving
The image in Figure 1 illustrates a clear and structured business process actually used by La Logistica Srl to optimize the techno-management workflow of receiving goods in a hydro-thermosanitary warehouse. It provides an operating model for integrating various information sources –legacy systems, WMS, and archives– into a single repository to support the company’s decision-making functions. The diagram on the left side explains the sources of information that flow: the list of supplies, the operational dynamics and the suppliers’ delivery plans. All these sources of information are KPI report forms and what-if simulation forms. The fusion of static configuration information (process and constraint information) and dynamic information reveals the company’s transition from a rule-based to a predictive approach. Needs and feasibility analysis is at the heart of the above procedure, which provides valuable insights from input data. In essence, the needs and feasibility analysis help define the operational objectives of the procedure and help company management set priorities for assigning staff to unloading, inspection, and storage activities. In essence, the image illustrates the flow of the procedure that the company La Logistica Srl could adopt to efficiently manage its inbound processes characterized by high product varieties in terms of size, weight and handling requirements. Essentially, the image above illustrates the benefits of the procedure, which allow the company to improve the efficiency and predictability of its workload (Figure 1).
3. Adaptive Modelling and Decision-Support Logic for Capacity Evaluation and Bottleneck Detection
The methodological approach proposed within this study combines the results of an analytical model, the management of the workflow provided by the company’s data structure, and decision-making logic that deals with the complexity of goods reception tasks at La Logistica S.r.l. The logic of this methodology targets the conversion of the fragmented nature of the company’s multi-assessment tasks into quantitative results that could aid the decision makers of the company in assessing the feasibility of the workload of the company. Additionally, the methodology targets the detection of the company’s bottlenecks and the estimation of alternative structures of the company’s organization. The proposed methodology has the flexibility of being adapted according to the company’s needs with the aid of machine learning algorithms. This methodology is based on the reality of the company’s operation at the Monopoli branch.
CLP Model (Q × V × P). At the core of the modelling framework lies the CLP indicator, a composite metric designed to express the work content associated with incoming goods. It incorporates three dimensions: quantity (Q), volume (V), and weight (P). The basic formulation is:
where Q is measured in units of transport, V in cubic meters, and P in kilograms. These variables are the primary drivers of processing time across unloading, control, and storage activities. The daily CLP for each category is computed as:
This formulation generates an adimensional indicator that allows heterogeneous product categories—such as bars, hydrosanitary goods, small parts, pallets, tanks, and containers—to be compared within a unified workload representation. The composite formulation improves accuracy, reduces reliance on heuristics, and creates a foundation for future machine learning models capable of predicting CLP directly from operational documents such as transport notes or WMS data.
Data Inputs. The approach needs well-structured inputs of the type of goods arriving, operating factors, and system settings. The first type of input consists of the delivery schedule (daily or weekly), which offers the CLP values of each type of product. These values are calculated based on the CLP amount of each item taken out of the transport documents. Other variables include the productivity factors of every step of the process unloading, control, and storage phases in CLP/h. The availability of resources determines the number of workers at each step of the process and their working hours. At the Monopoli plant, there is one at the unloading step, two at the control step, and one at the other step with five bays. The variables encompassing the simulation scenarios include tardiness factors and workload peaks.
Productivity Model. The productivity model transforms available labor into daily processing capacity using the formula:
For example:
These values quantify the maximum processing potential for each phase. The model highlights interdependencies across unloading, control, and storage activities and enables the identification of bottlenecks when induced workloads exceed capacity. While deterministic at this stage, the model can be calibrated with historical data or enhanced through machine learning.
Workload Estimation. Workload estimation determines the hours needed to process incoming goods. For each category and phase:
Once hours are calculated, the number of required operators is computed as:
Excess demand relative to available workers signals a capacity imbalance. The estimation process supports both daily and weekly planning, identifying peak days and seasonal fluctuations.
Gap Analysis. Gap analysis compares workload with available capacity using:
Negative gaps indicate insufficient capacity, while positive gaps indicate underutilization. Integrated with dashboards and KPIs, gap analysis helps decision makers identify constraints, evaluate alternative operational configurations, and simulate the effects of changing staff, productivity, or incoming volumes.
Workflow and Model Assumptions. This workflow implements the methodology based on guiding users on uploading their data, setting up the productivity coefficient and availability of resources, calculation of the CLP values, workload calculation, and gap analysis. The system results can thus be interpreted rapidly using the dashboards and KPIs provided. Additionally, the system enables users to carry out what-if scenario analyses based on changes made with respect to staffing levels, productivity coefficient settings, or delivery distribution options based on alternative organizational structures. As the system works across different platforms with integrated systems based on the company’s WMS, ERP, and other enterprise systems, there is consistency of the analysis layer across the logistics environment of the company. This workflow assumes various simplifying hypotheses that facilitate the development of the system so that the theoretical model remains stable and computationally feasible during development phases. The hypothesis on delivery sequencing on the same day is not considered because every delivery makes its independent CLP value without considering the order of the preceding operations. Additionally, there are simplifying hypotheses on the assumption that the staff within the phases are homogenized without the rules of bay assignment or staff redistribution across phases. The above simplifying hypotheses form the base upon which further development of the system could add new elements based on employing stochastic models, dynamic systems approach, and AI-driven optimizing engines. This assumes the importance of offering a workflow based on well-conceived modeling hypotheses that aid the decision-making official with the complexity of goods receiving operations.
4. Intelligent Visualization and Simulation Architecture for Inbound Logistics Management
This model facilitates the creation and comparison of plans and allows managers to anticipate potential bottlenecks and optimize resource allocation. This ability to save and then reference simulation results introduces a more strategic mindset and encourages the application of the system not only in the daily planning horizon but also in the medium term. Finally, the visualization interface closes the environment with a set of interface dashboards and performance metrics designed to be clear and practical (Panigrahy, 2025). These dashboards provide a comprehensive view of task workloads, resource supply and demand, congestion levels, and workflow imbalances. Important performance metrics related to resource efficiency, system balance, and processing capacity provide the decision maker with information about the system’s ability to stay within feasible limits. Imbalance warnings allow for immediate intervention and indicate overload or underload conditions in the system. The visual interface system supports a dual application: interfacing with everyday tactics to verify the feasibility of daily delivery and pursuing more analytical strategies to observe trends and prepare for future changes. To avoid discrepancies in its computing platform in the system baseline, the system imports reliable enterprise systems, such as WMS and ERP systems, with computations based on reliable information sources (Vaičiūtė & Katinienė, 2025). Although the system at its earliest levels requires manual input for the delivery plan, at its structural levels it leverages its infrastructure to automatically update and has the potential to predict CLP values using machine learning algorithms (Andoh & Yu, 2023). This versatile system fully leverages its decision-making approach and provides an even stronger decision-making platform that assists organizations in strategically addressing the unpredictability and increased complexity introduced in the inbound logistics functions of their respective organizations (Dotti et al., 2024). See Figure 2.
5. Operational Dashboards and KPIs for Monitoring Capacity in the Receiving Workflow
Dashboards provide an efficient means to structure and organize productive capacity settings across the diverse stages involved in the receiving flow process. Its functionality is deliberately kept to a minimalist interface to facilitate entering productivity coefficients for varied product types in stages in an extremely intuitive fashion. These three stages in receiving products for analysis: ‘Unloading, Control, and Storage’ have optimized sectioning in clearly defined areas to provide an instant visual context for capacity allocation in varied stages. Within these defined stages, each section lists major product types, allocated to warehouses as follows: ‘Bars, Hydrosanitary Products, Small Parts, Containers, Tanks, Pallets.’ Each type has an accompanying text box to enable allocation or reduce productivity coefficients, thereby improving efficiency in instant data entry with fewer chances for error. The usage of the fine-tuning buttons for ‘+ and ‘-’ is geared to enable laymen to easily manipulate them. The strategic allocation of ‘Save Capacity’ at the end of pages forces its end-user to cross-check inputs for accuracy in utilization. On feasibility, its utilization is an essential activity for its parent decision support system in allocation. Such utilization in decision support systems establishes productivity coefficients for varied analyses across varied scenarios for decision support systems in its broader utilization. This page establishes the feasibility of extreme functionality in decision support systems, its utilization in decision support systems, and its broader functionality for establishing major productivity coefficients to be allocated in decision support systems (Figure 3).
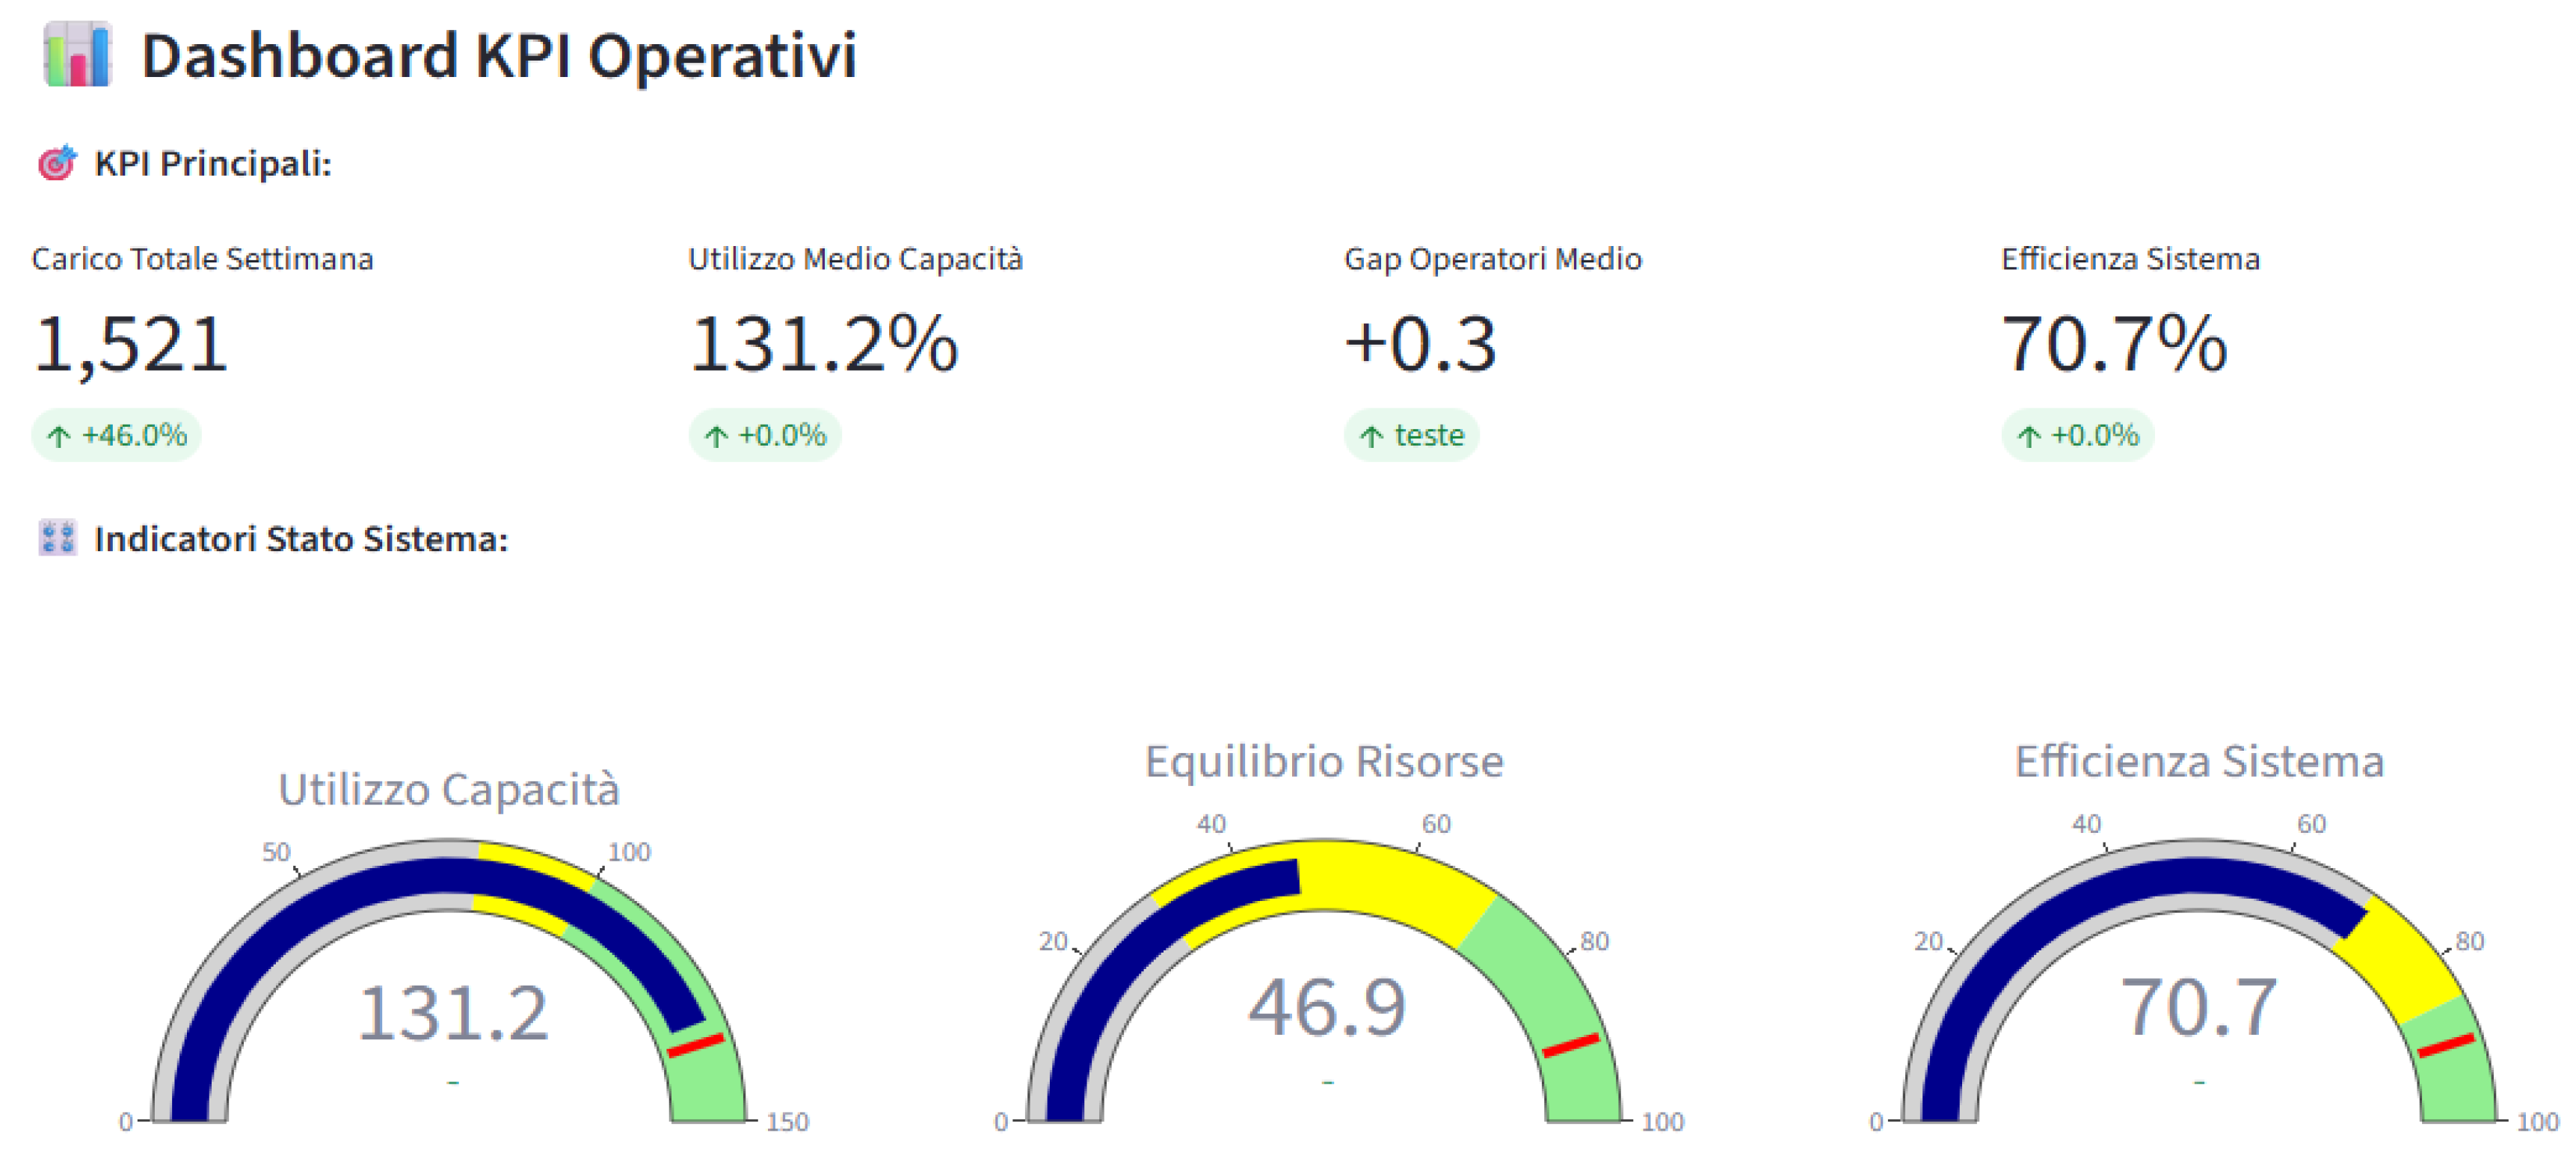
This KPI dashboard provides a summarized yet informative overview of operational performance for the goods receiving process. It is meant to inform management instantly on whether there is alignment between weekly workload and productive capacity, workforce allocation, and other related dynamics. The higher section forecasts four major indicators: Total Weekly Load, Average Capacity Utilization, Average Operator Gap, and Overall System Efficiency. These four indicators in particular offer an instant, big-picture view of what is really happening across the entire process, allowing management to quickly determine whether intervention is needed. Of particular note in Total Weekly Load is its high value (1,521 CLP), which shows the significant workload generated by received commodities, with its 46% increase indicating either an ‘off-peak’ or ‘peak’ period requiring close observation. Average Capacity Utilization, at 131.2%, unequivocally shows how overloaded the entire process is, with its operation pushed beyond optimal levels from 85% to significantly overloaded, which could lead to delays, congestion, or performance degradation. It also shows, with its substantial increase by ‘+0.3 operators’, simply how short-staffed the entire process is to meet its weekly workload, indicating, indeed, the necessity for support or reallocation. In the bottom section, these three circular graphics provide an almost intuitive insight into the entire operational performance. It shows, in its entire Capacity Utilization section, how significantly overloaded it is, with its entire value indicated in levels well above its ‘safe-zone’. It further shows in its Resource Balance section simply with its value being indicated at ‘46.9’ points, almost at its ideal point of ‘50’ points, with perhaps just some least balance needed between its resource availability, allocation, or alignment. And finally, in its entire System Efficiency section, it shows its entire complete performance dynamics in one major performance index, with a value of ‘70.7%’, which really isn’t optimal (Figure 4).
6. Insights from DSS-Driven Capacity Planning in Complex Receiving Operations
With the launch of the Decision-Support System based on the CLP model in mind, several aspects of capacity planning in receiving operations come to the fore. These aspects assume importance in contexts ranging from model reduction and capacity utilization to imbalance and performance variability. Among the primary learnings from these aspects is the importance of operational complexity due to the varying types of products received on a given day, along with their sizes, types, and quantities, which is difficult to capture adequately with fixed rules alone (Harris, 2020). At the same time, what is apparent from analysis done on the principles underlying the CLP model, for instance, is its novelty in translating an operational workload in ‘common, unitless, measurable units, taking into consideration different types of items, distinct operational steps on each given day, with varying quantities.’ It remains especially helpful in situations concerning unpredictable, fluctuating inbound logistics, such as food/grocery processing plants (Al Maruf, 2025). Another interesting observation is that capacity bottlenecks in receiving operations are not entirely due to excessive volume, but rather to deviations between operational capacity and the actual workload, in contrast to fixed capacity limits (Markhorst et al., 2021). On some days, minor variations in types or stages of particular items can lead to operational inefficiencies, such as queues, idleness, and decreased productivity. But for all these to be adequately identified, there would not have been any DSS assistance in mathematical simulations, for instance, with regard to capacity planning in such operational contexts (Harris, 2020). Another observation from these studies concerns slight variations in operational indicators, such as utilization rates exceeding 100 percent, which are clear indicators of operational overloading. At the same time, minor variations in employee availability, such as requiring an extra 0.3 operators, could lead to operational delays across entire cycles in receiving operations, especially on days with high volumes (Markhorst et al., 2021). These aspects emphasize the importance of predictive analysis, especially in planning and strategic simulation, as well as innovative operational models (Al Maruf, 2025). But there are some gaps in these studies, specifically to note, for example, whereby most studies point to requiring ‘future models to incorporate more modern methods such as stochastic models, real-time analysis, or AI simulations to effectively forecast/adjust to challenges/hardships, especially for food/grocery-related logistics, for example.’ Innovations in modeling and analytics have become crucial to deliver the desired accuracy in such settings (Al Maruf, 2025).
7. Managerial Benefits of a Predictive DSS for Workforce and Capacity Optimization
From an administrative perspective, the Decision-Support System (DSS) has, to begin with, proved to be an ultimate resource for managing, controlling, and optimizing the process of receiving products. One major advantage is its predictive nature, which allows it to forecast capacity problems before they occur. Instead of managing based on historical performance data, things have improved for administrators, who now have the capacity to evaluate, in advance, the feasibility of delivering products on a daily or weekly schedule, facilitating informed decision-making regarding labor allocation, scheduling, and load balancing (Dotti et al., 2024). Its predictive nature, in essence, has led to fewer congestion incidents, better performance, and greater consistency in warehouse storage systems. Moreover, its applicability in aligning performance with strategic planning has been crucial to its success. It precisely calculates workload relative to labor needs, equipping administrators with information on adjustments in labor size, temporary employees, or expansion in specific processing stages, among other changes (Komar et al., 2024). It facilitates risk-free scenario simulation across different settings, without halting regular warehouse operations. It not only helps offset risks associated with scenario simulation but also improves decision-making levels (Burdett et al., 2024). Its dashboard, to begin with, not only increases administrators’ awareness by providing real-time information on operational performance in understandable formats, thereby improving visual support (Komar et al., 2024). Its efficiency in utilization, balance in resource allocation, or overall operational performance, for example, equips administrators with the necessary information to take prompt action when operational performance deviates from desired targets. It, in essence, improves coordination among logistics, procurement, and warehouses, thereby enhancing communication among functions (Burdett et al., 2024). Over the long-term horizon, DSS facilitates administrative acquisition, acquiring data on operational performance in warehouses for evaluation to produce necessary information regarding demand patterns, seasonal demand changes, or capacity constraints in warehouses, prompting administrators to invest in necessary areas, such as technology, training, or procurement, in warehouses (Burdett et al., 2024). It, in essence, facilitates growth levels in warehouses, acting as an accelerator.
8. Conclusions
The case study analysis conducted at La Logistica S.R.L. demonstrates, in practice, the huge advantage of having an appropriate, data-driven management plan to significantly increase accuracy, transparency, and consistency in receiving workflow, especially in environments with high complexity levels, such as those in logistics. One crucial advantage resulting from the analysis process is, in fact, the adoption of the CLP Indicator, an index dimensionless in nature, optimized to calculate, in one value, quantity, volume, and weight. By taking into consideration all these elements in one optimized process, it’s now feasible to analyze different types of products in one dimension, overcoming performance obstacles brought about by common classification patterns. Of particular importance in such methodology is its utilization in hydrosanitary logistics, in which context, due to varying dimensions, sizes, and treatment needs, many unexpected variations in workflow levels could be considered normal, given the numerous receiving items. By incorporating CLP Indicator into an overall analysis process in combination with its implementation in Decision-Support System DSS, there’s solid evidence to support transforming theory into practice for real-life applications. Decision-Support System DSS incorporates various features such as workload calculation, productivity measurement, analysis regarding resource gap, and simulation on planning scenarios. By providing better understanding on resources allocation, on efficient process performance, on areas to face problems, it improves overall operation levels as well as strategic planning levels. It’s crucial to note in such analysis on hydrosanitary logistics operations management to understand performance discrepancies not resulting from resources availability solely, but from overall resources allocation, almost in sync with demand variation levels. Another crucial environment factor, communicating simulations on different personnel levels, adjustments on schedules, or reallocation on delivery, offers risk-free opportunities for improved planning. These conditions support more flexible, responsive planning levels. But on the other hand, there are some limitations in such overall prototype analysis, now in its developmental stages. Since analyzed productivity levels, optimum workflow patterns, or manually-entered data, such prototype analysis process is, in fact, not resonating with entire dynamic operational levels. Nevertheless, these limitations indicate in which directions improvements could be made in such a model in the future. These could include enhancements such as incorporating integration with warehouse management systems, transport management systems, machine-learning algorithms to calculate the value of CLP based on shipping information, stochastic productivity models, or real-time modifications to scheduling. Incorporating functionalities such as multiple shift planning, stage worker flexibility, or automated assignment to receiving bays would certainly bring such an analysis model closer to reality in logistics settings. Overall, however, this research work demonstrates not only what could be achieved with an enhanced workload model in such settings, but also what could be developed by combining such innovation with appropriate decision support in such settings to successfully convert the receiving process into a proactive, decision-driven process.
Future research. The industrialization project for this application platform should include integration with an appropriate system for collecting performance data from operational departments. This system, including the use of advanced analysis techniques, including artificial intelligence tools and machine learning algorithms, will allow for the extraction of additional knowledge aimed at increasingly efficient operation management. In the specific situation of the use case illustrated here, a first analysis objective could be aimed at realizing a retrofit system based on historical data and the detection of contingent department situations to arrive at the dynamic and more accurate determination of CLPs.
Data Availability Statement
The data used and the processes analyzed in the proposed simulation have been validated by the company “La Logistica s.r.l”.
Acknowledgments
The proposed work has been developed within the framework of the project “Logistics 4.0” (Regional call of Apulia for aid under exemption No. 17 of 30/09/2014 – BURP No. 139 supplement of 06/10/2014 and subsequent amendments – TITLE II, CHAPTER 2 OF THE GENERAL REGULATION, “Notice for the submission of projects promoted by Large Enterprises pursuant to Article 17 of the Regulation”).
References
- Al Maruf, A. A systematic review of ERP-integrated decision support systems for financial and operational optimization in global retails business. American Journal of Interdisciplinary Studies, 2025, 6, 236–262. [Google Scholar] [CrossRef]
- Alfiya, S., Minnu, S. R., Sankar, S., Shameera, S., & Janisha, R. S. (2025). Automated Warehouse Packing System. International Journal for Multidisciplinary Research. (Alfiya et al., 2025).
- Andoh, E.A.; Yu, H. A two-stage decision-support approach for improving sustainable last-mile cold chain logistics operations of COVID-19 vaccines. Annals of operations research, 2023, 328, 75–105. [Google Scholar] [CrossRef] [PubMed]
- Burdett, R.L.; Corry, P.; Cook, D.; Yarlagadda, P. Developing a personal decision support tool for hospital capacity assessment and querying. Expert Systems with Applications, 2024, 248, 123367. [Google Scholar] [CrossRef]
- Chanda, D. Automated ETL Pipelines for Modern Data Warehousing: Architectures, Challenges, and Emerging Solutions. The Eastasouth Journal of Information System and Computer Science, 2024, 1, 209–212. [Google Scholar] [CrossRef]
- Dotti, G., Iori, M., Subramanian, A., & Taccini, M. (2024). An Integrated Decision Support System for Intra-Logistics Management with Peripheral Storage and Centralized Distribution. In Proceedings of the 26th International Conference on Enterprise Information Systems (Vol. 1, pp. 612-619). SciTePress.
- Harris, R. M. (2020, December). Data warehousing and decision support system effectiveness demonstrated in service recovery during COVID19 health pandemic. In 2020 14th International Conference on Open Source Systems and Technologies (ICOSST) (pp. 1-5). IEEE.
- Khalil, E. B. (2023). In Recent developments in data-driven algorithms for discrete optimization. In Proceedings of the AAAI Conference on Artificial Intelligence (Vol. 37, No. 13; pp. 15443–15443.
- Komar, M. , Taborovskyi, A., Aliluiko, A., & Hutsal, S. (2024). Enhancing the Efficiency of Decision Support Systems in the Warehousing Sector. In AISD (pp. 26-35).
- Markhorst, B.; Zver, T.; Malbasic, N.; Dijkstra, R.; Otto, D.; van der Mei, R.; Moeke, D. A data-driven digital application to enhance the capacity planning of the COVID-19 vaccination process. Vaccines, 2021, 9, 1181. [Google Scholar] [CrossRef] [PubMed]
- Mulla, F. M. The influence of emerging technologies on future product management strategies.
- Panigrahy, S. Human-AI Interaction in Logistics: Augmenting Human Capabilities for Supply Chain Excellence. Journal Of Multidisciplinary, 2025, 5, 289–295. [Google Scholar]
- Sapry, H.R.M.; Ali, N.A.; Ahmad, A.R. Warehouse design and operation optimization. J. Crit. Rev, 2020, 7, 76–83. [Google Scholar]
- Shahidi Hamedani, S.; Aslam, S.; Shahidi Hamedani, S. AI in business operations: driving urban growth and societal sustainability. Frontiers in Artificial Intelligence, 2025, 8, 1568210. [Google Scholar] [CrossRef] [PubMed]
- Sodiya, E.O.; Umoga, U.J.; Amoo, O.O.; Atadoga, A. AI-driven warehouse automation: A comprehensive review of systems. GSC Advanced Research and Reviews, 2024, 18, 272–282. [Google Scholar] [CrossRef]
- Tang, F. , & Zhang, L. (2025). Impact of data element development on the application of artificial intelligence in enterprises: F. Tang, L. Zhang. Empirical Economics, 1-46.
- Vaičiūtė, K.; Katinienė, A. Improving the information systems of a warehouse as a critical component of logistics: The case of Lithuanian logistics companies. Systems: Special Issue: Intelligent Logistics Systems Applications: Enhancing Efficiency and Adaptability., 2025, 13, 1–25. [Google Scholar] [CrossRef]
Figure 1.
Data Integration and Decision-Support Workflow for Goods Receiving Operations.
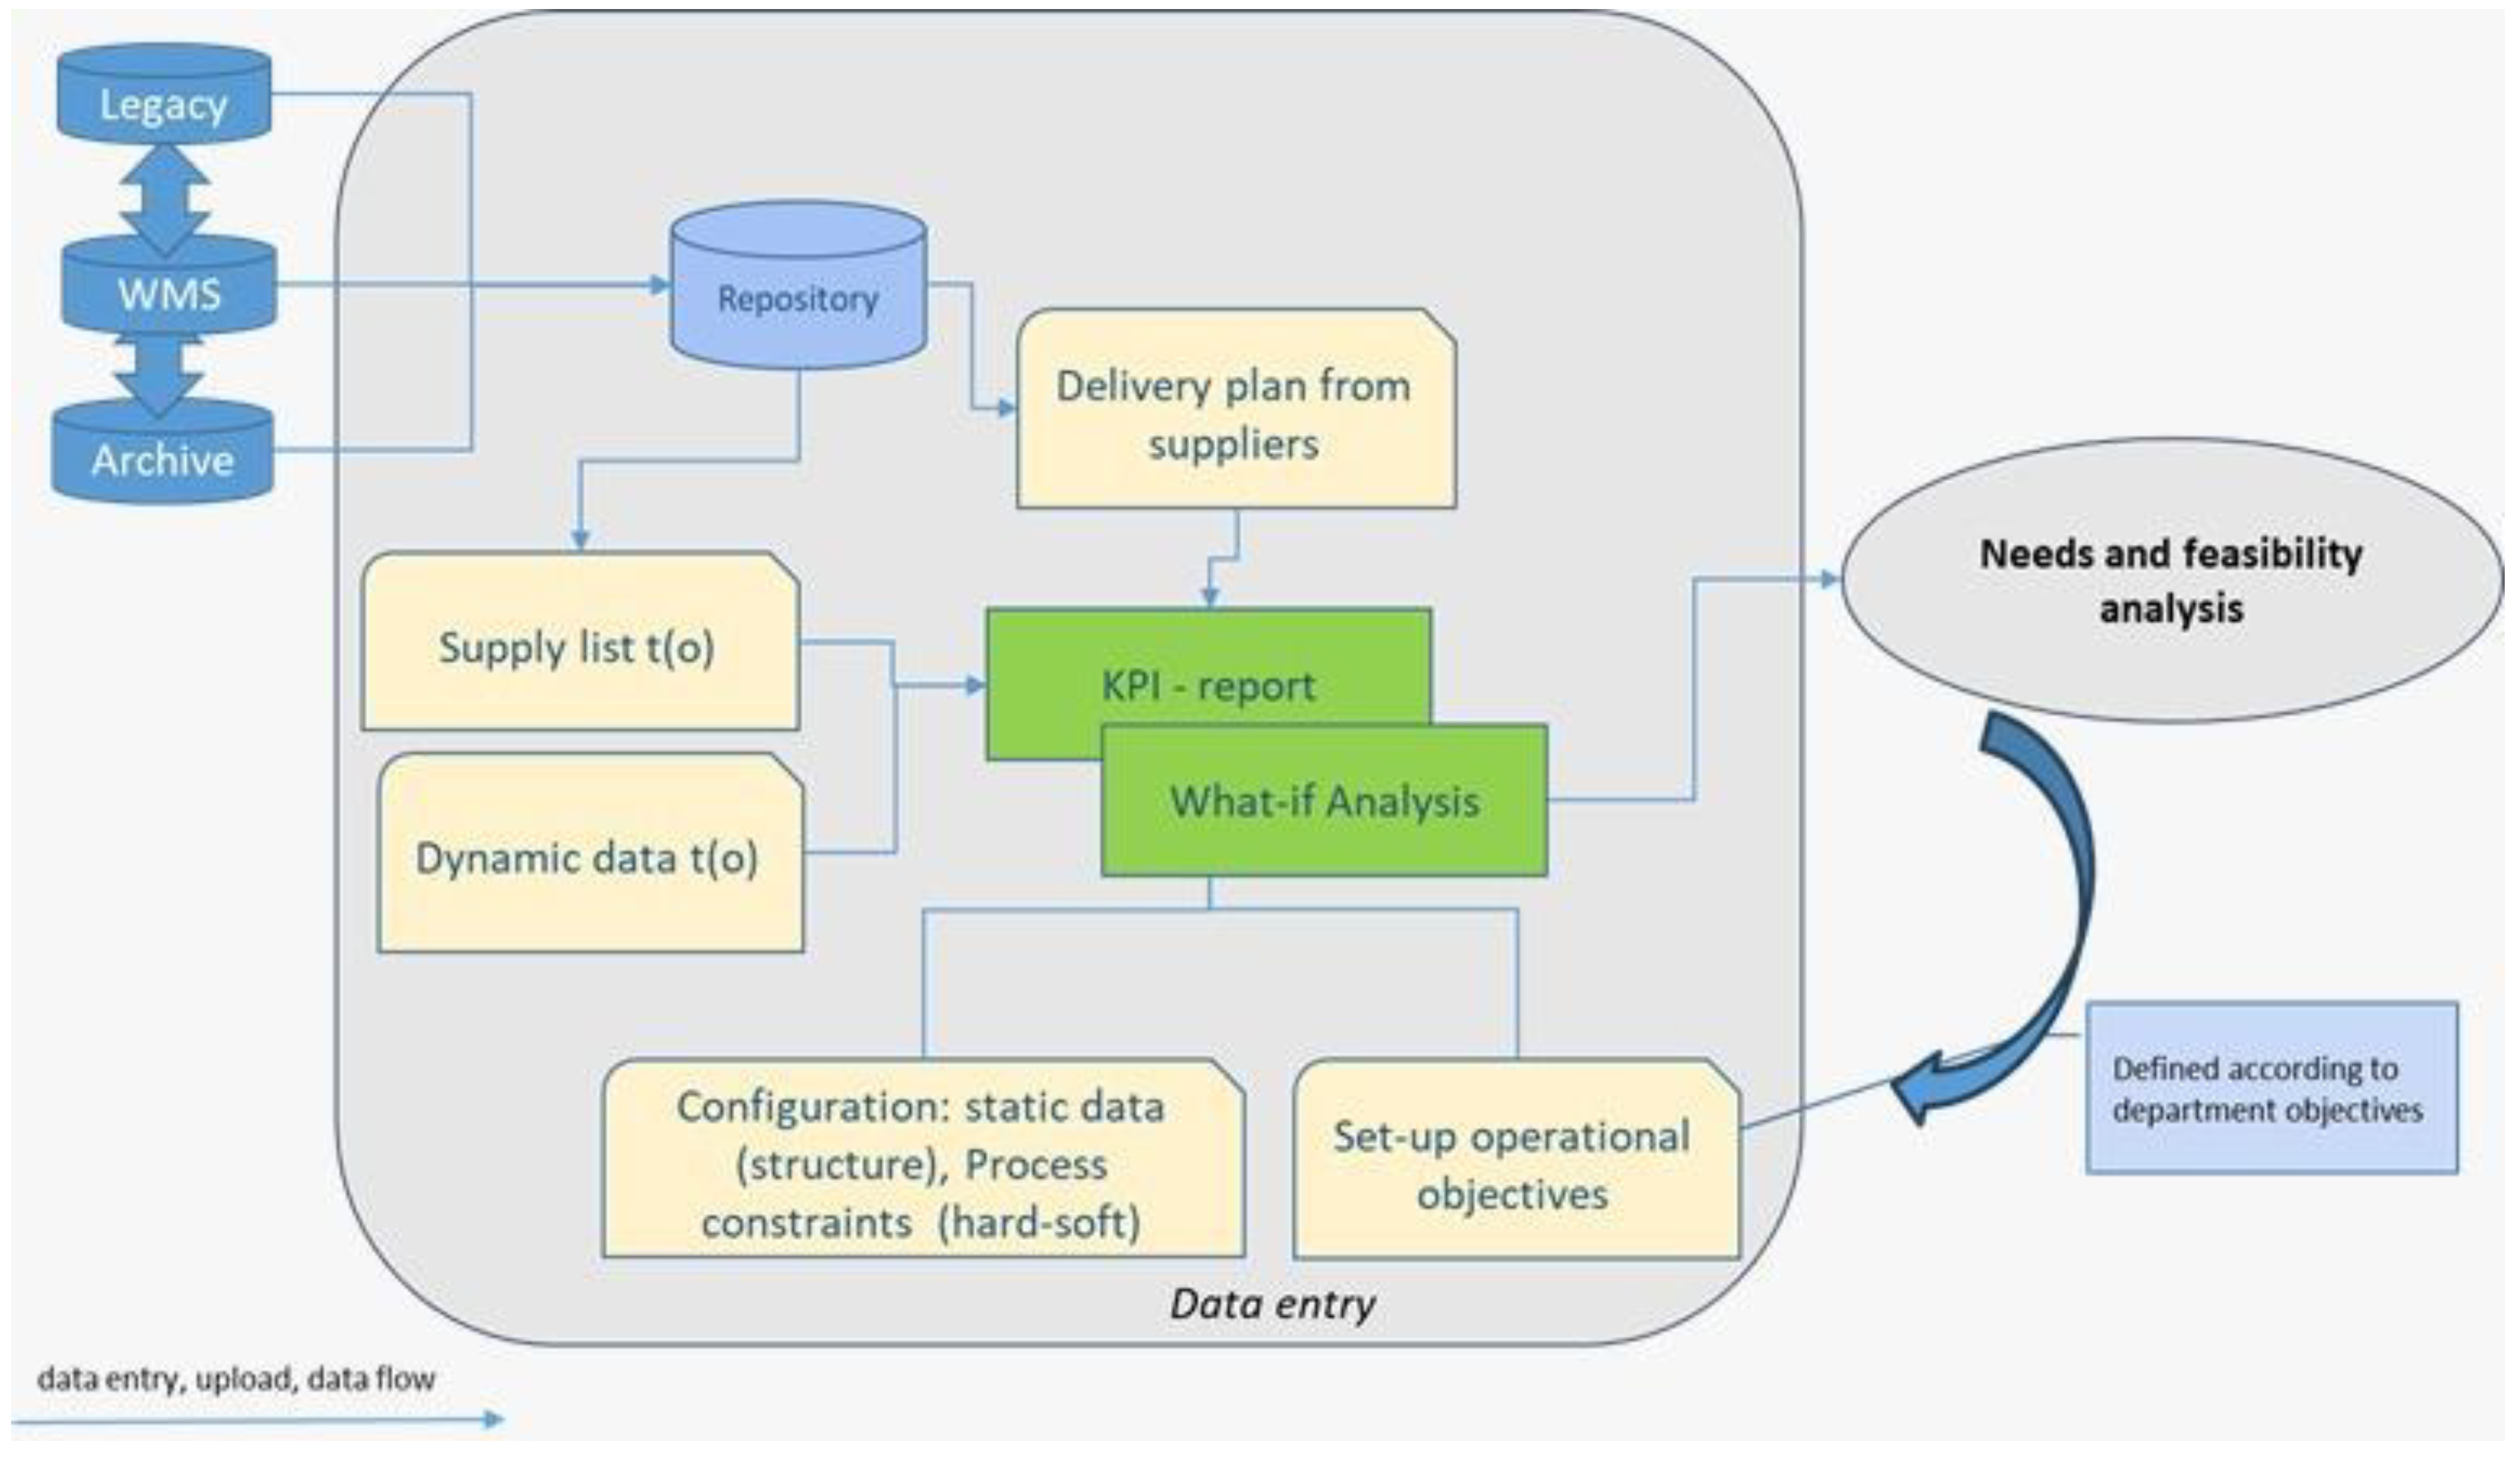
Figure 2.
Modular Architecture of the Decision-Support System for Goods Receiving Operations.
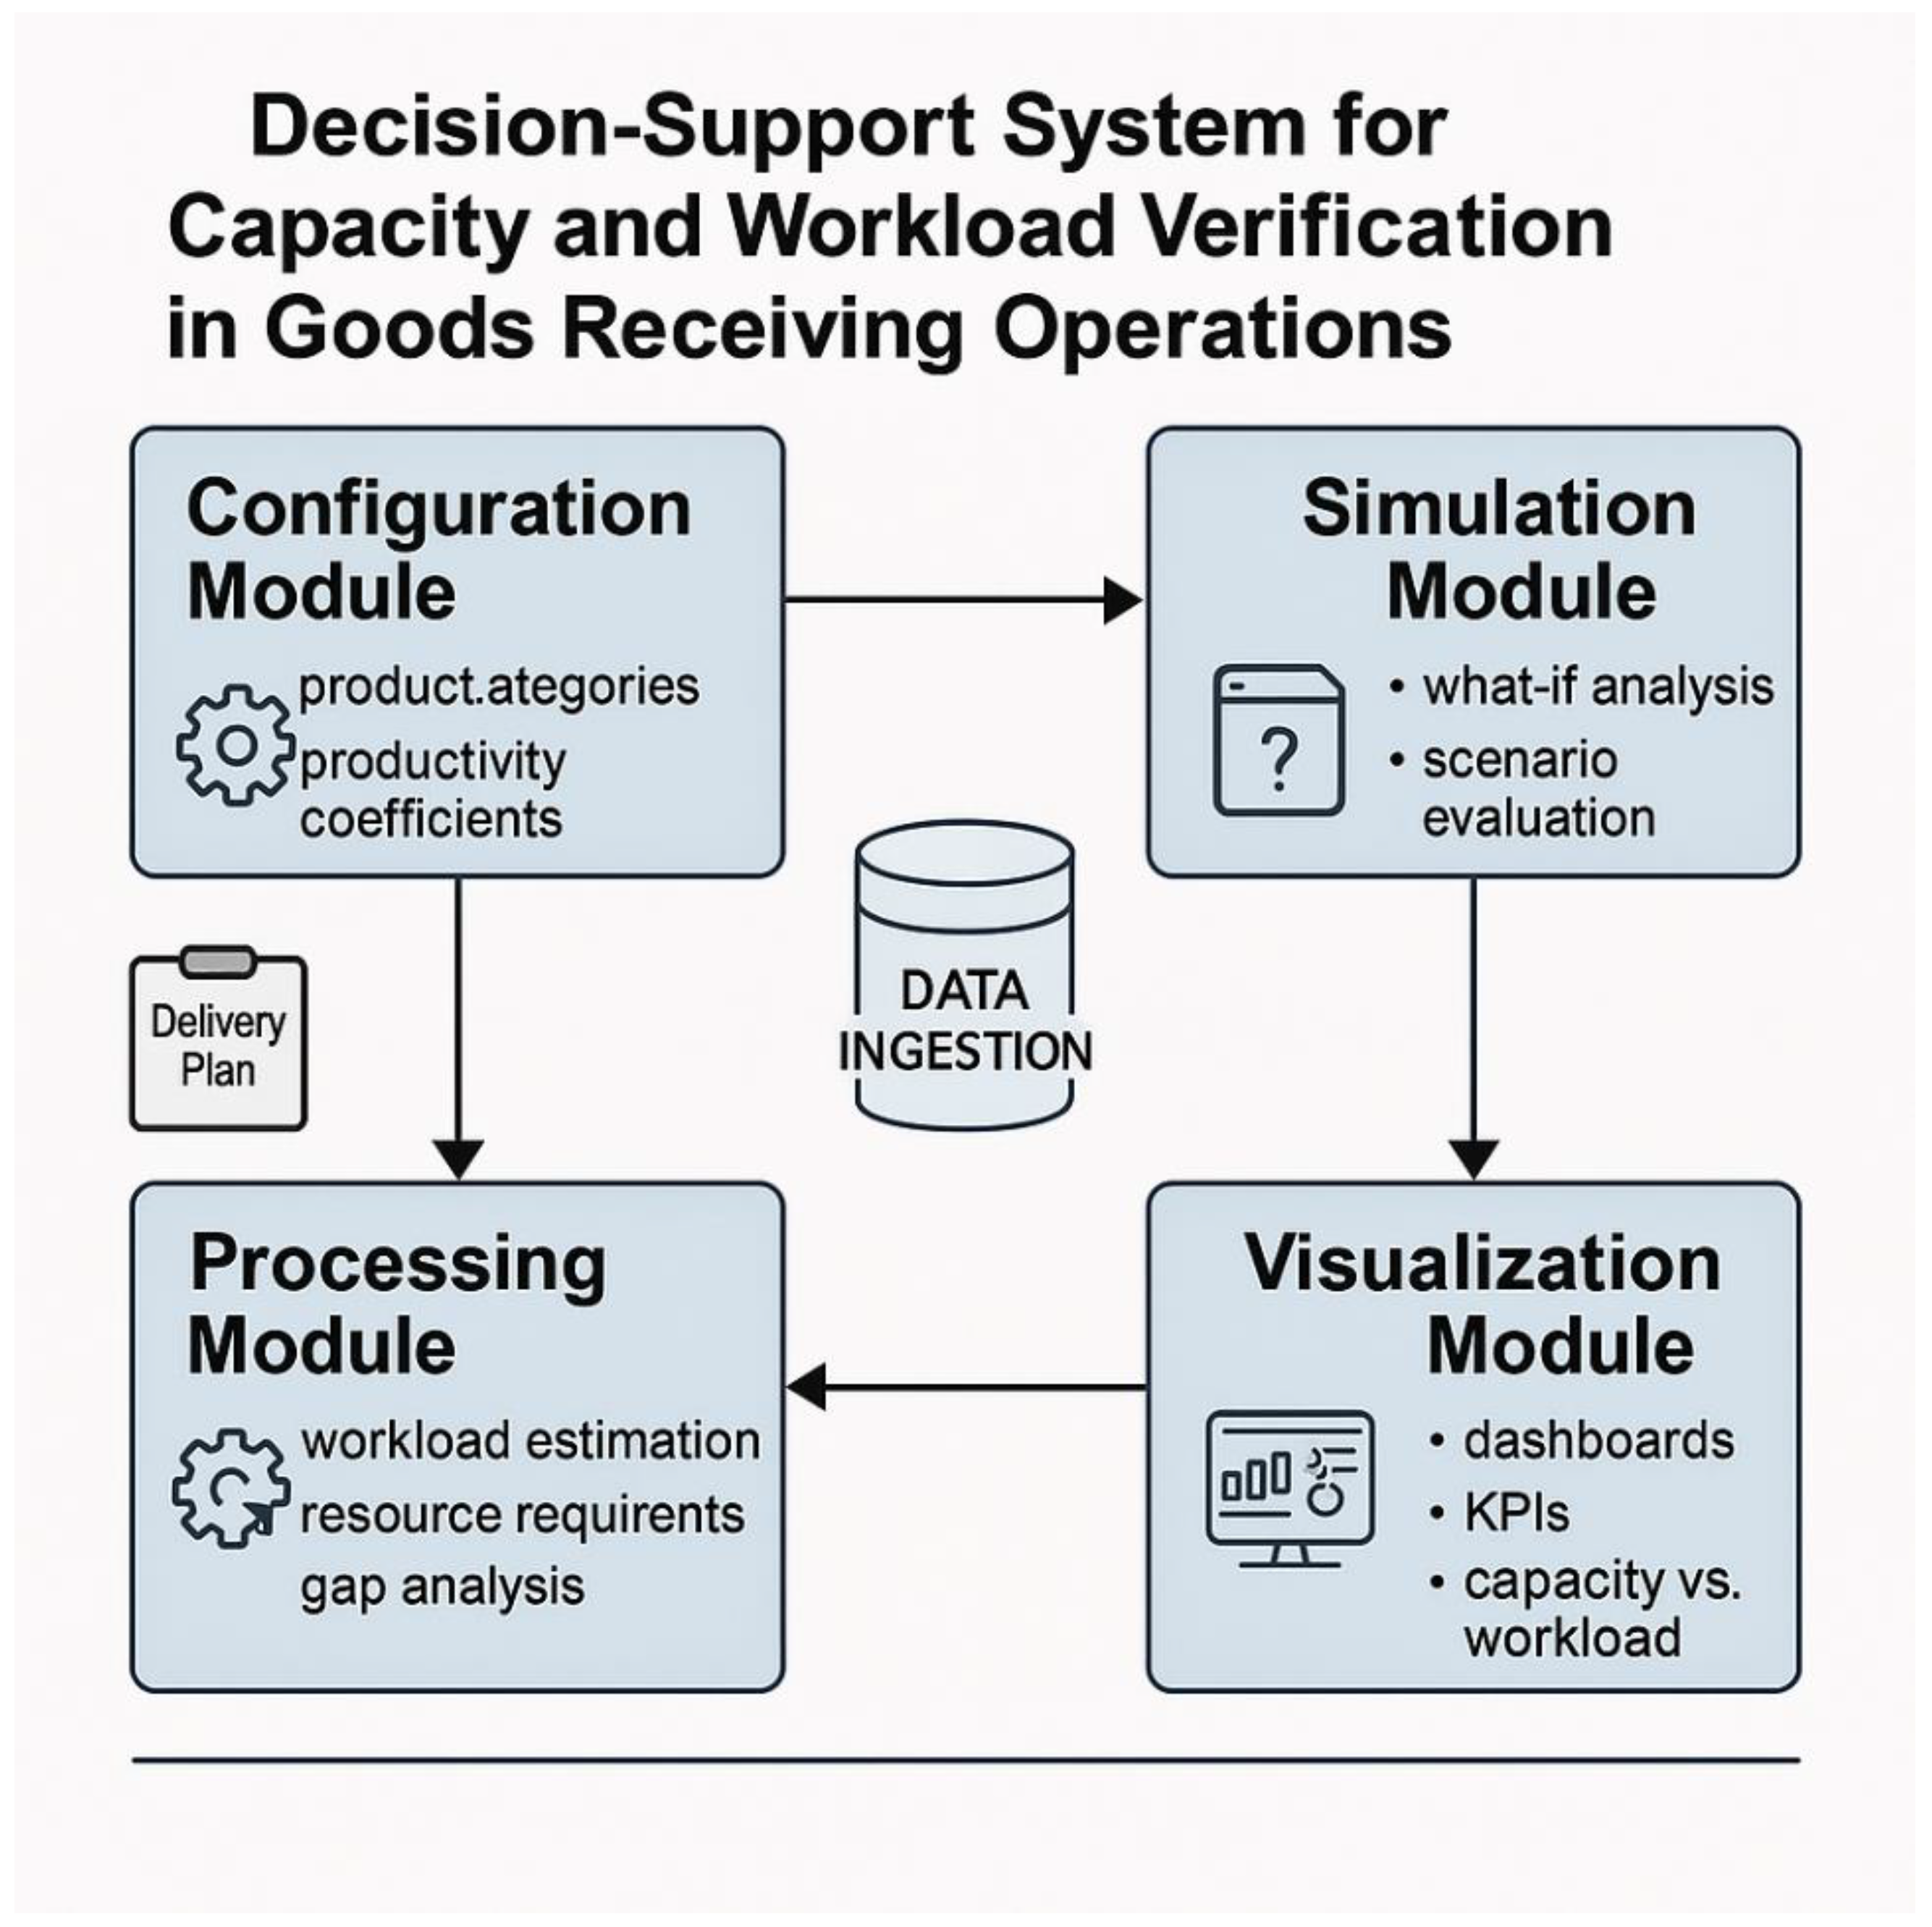
Figure 3.
Productivity Capacity Configuration Interface (CLP/h) for Receiving Operations.
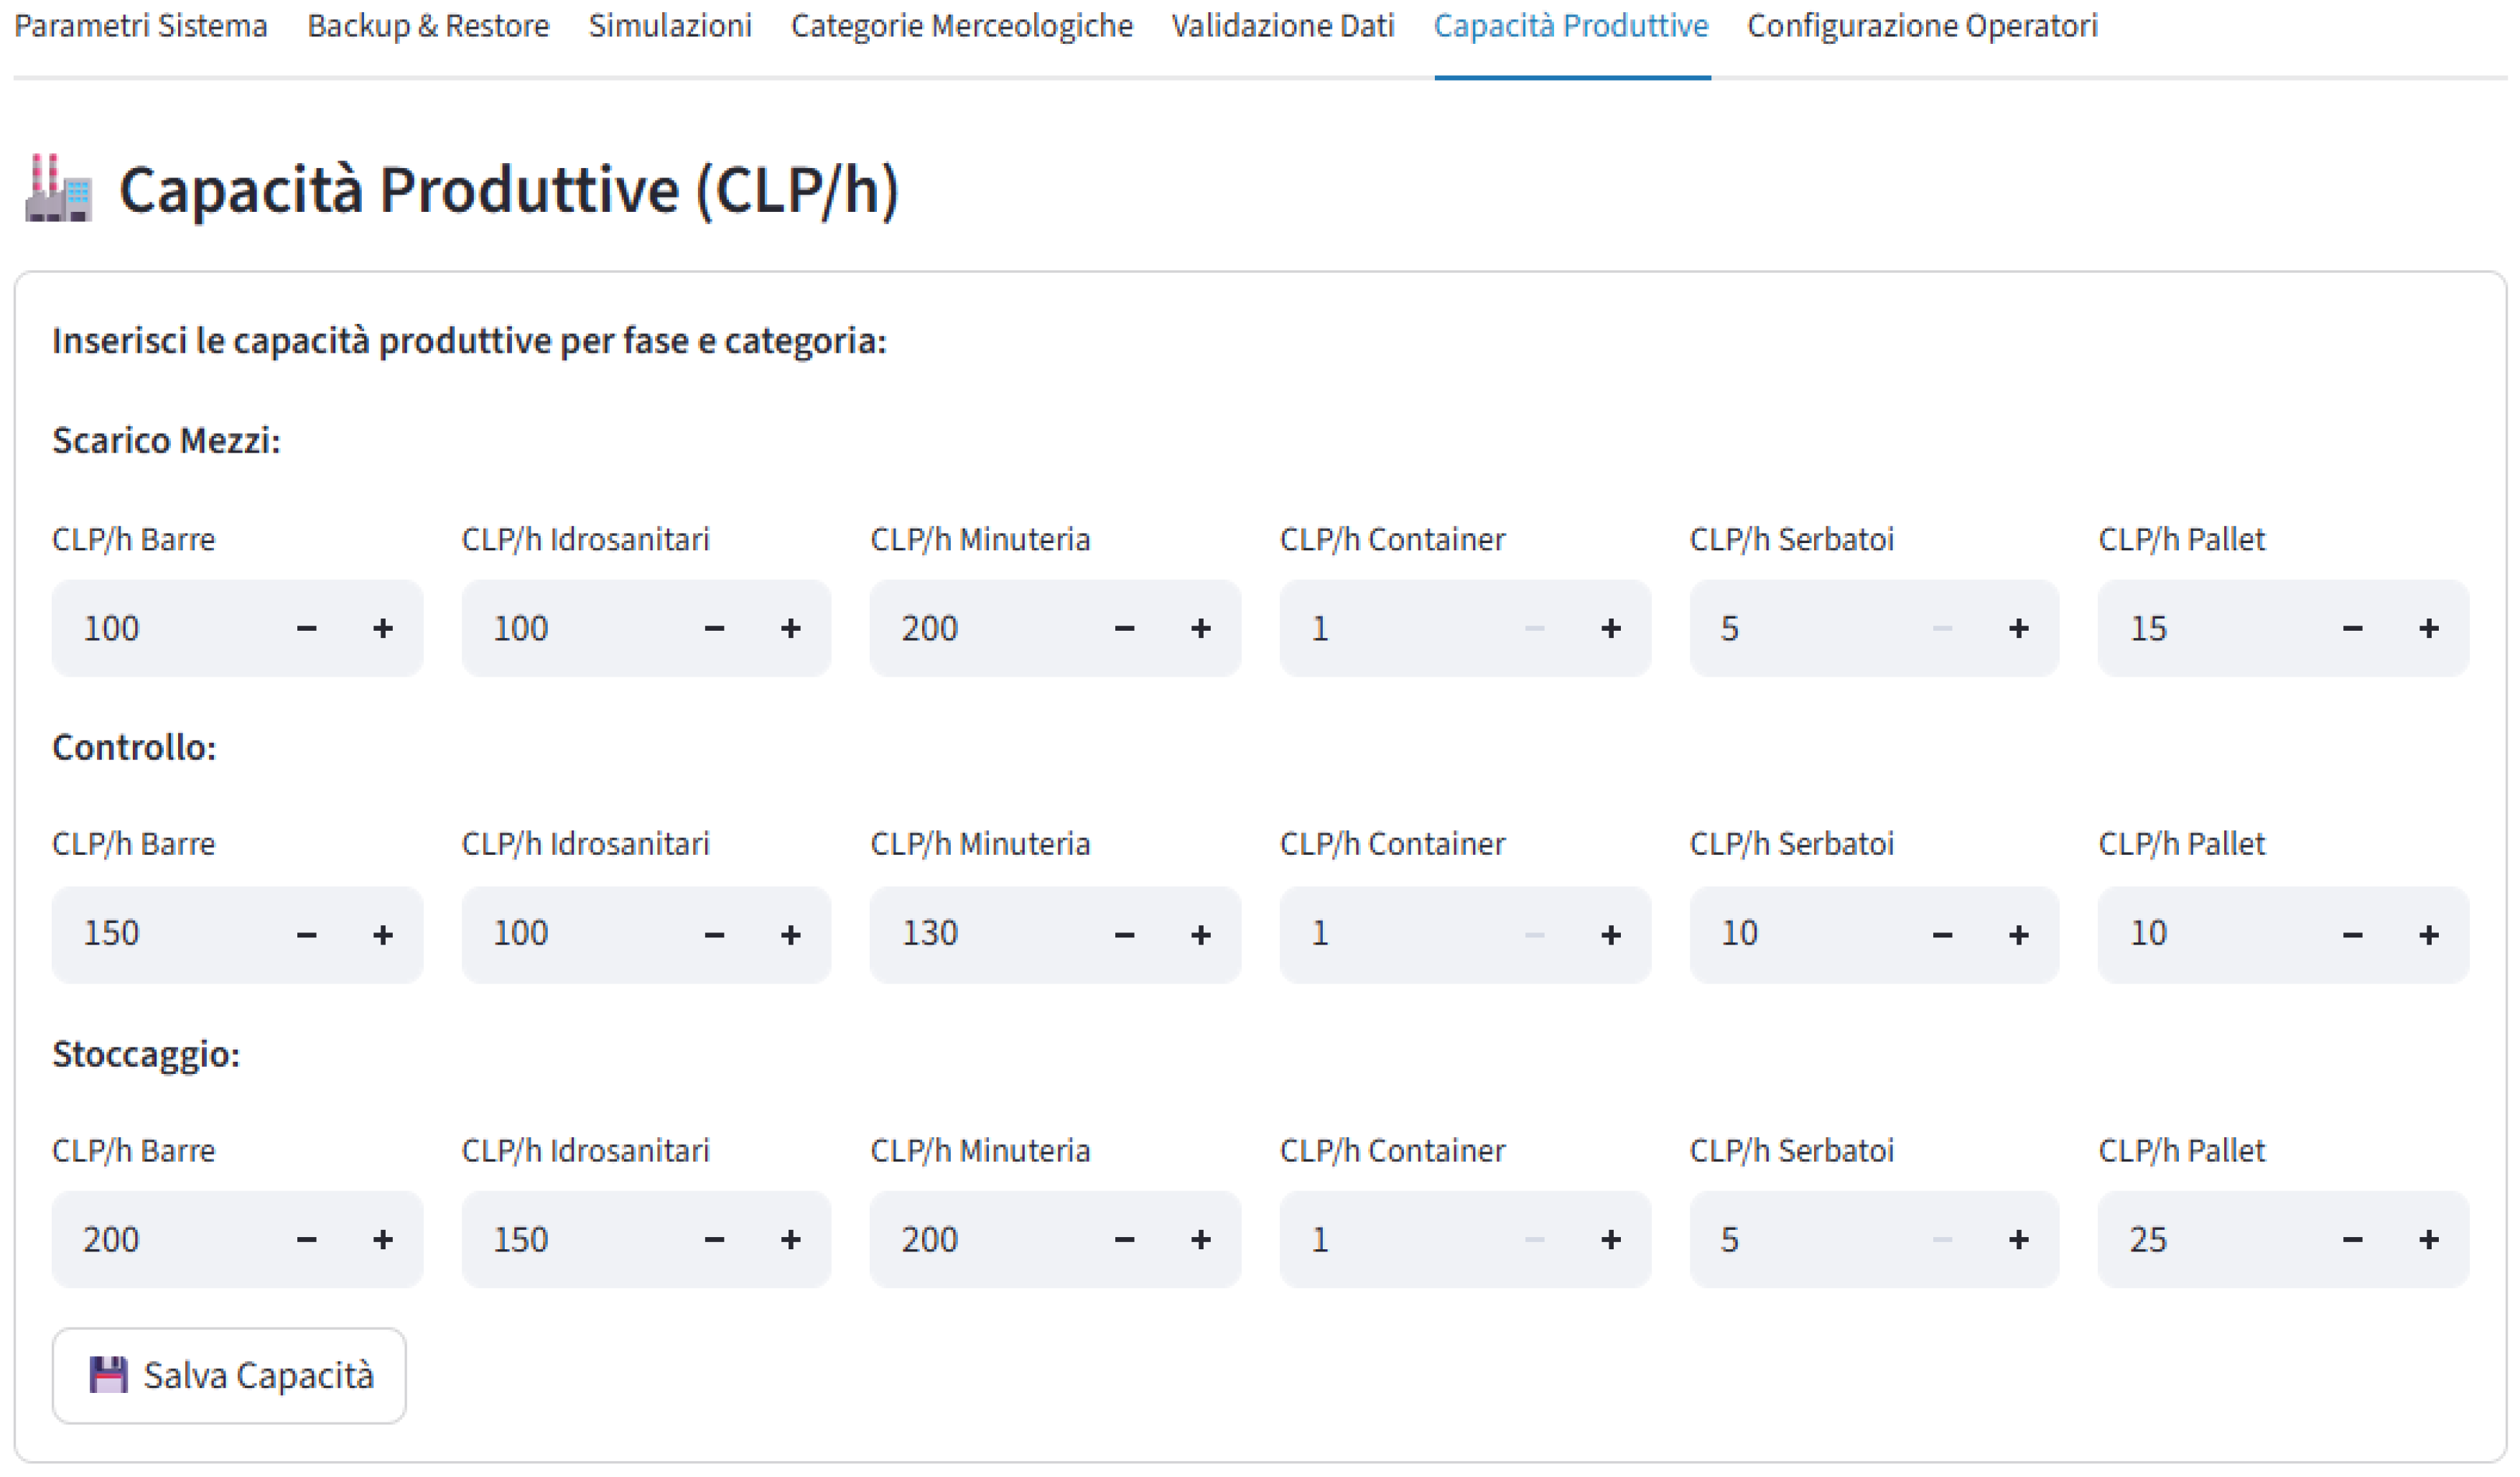
Figure 4.
Weekly Operational KPI Dashboard for Goods Receiving Activities.
Disclaimer/Publisher’s Note: The statements, opinions and data contained in all publications are solely those of the individual author(s) and contributor(s) and not of MDPI and/or the editor(s). MDPI and/or the editor(s) disclaim responsibility for any injury to people or property resulting from any ideas, methods, instructions or products referred to in the content. |
© 2025 by the authors. Licensee MDPI, Basel, Switzerland. This article is an open access article distributed under the terms and conditions of the Creative Commons Attribution (CC BY) license (http://creativecommons.org/licenses/by/4.0/).
Copyright: This open access article is published under a Creative Commons CC BY 4.0 license, which permit the free download, distribution, and reuse, provided that the author and preprint are cited in any reuse.


