
Submitted:
27 November 2025
Posted:
28 November 2025
You are already at the latest version
Abstract
In this work, the sintering behavior of tapes prepared via tape casting from stainless-steel and zirconia powders is investigated by optical – as well as push-rod – dilatometry. Both methods are compared in terms of sample preparation, measurement conditions and advantages and disadvantages. The experimental work shows the advantages of optical dilatometry in characterizing of the sintering behavior of load free sintering tapes and the possibilities of simultaneous observation of sample warpage and deformation. Push-rod dilatometry requires a constant load on the sample, which influences the sintering process in the case of tapes with lower mechanical stability but has advantages because of the higher accuracy in measuring dimensional changes. In the case of warpage, the shrinkage due to sintering of the sample is superimposed by an irregular deformation process that can be separated by analytical methods. No in-plane shrinkage anisotropy of the tapes is observed for either type of tape. In the case of the push-rod dilatometer, an additional peak in the shrinkage rate is observed in the early stage of compaction and a slight shift and increased maximum of the compaction rate. This is most likely due to the effects of the contact pressure of the push-rod.
Keywords:
optical dilatometry
; dilatometry
; tape casting
; sintering shrinkage
; ceramic
; ZrO2
; metal
; 17-4PH steel
; warpage
1. Introduction
Nowadays, sinter-based materials have become indispensable for industry and society. Sintered steel and ceramic tapes have a wide range of applications in the fields of electrical ceramics, membranes, batteries, fuel cells and electrolyzers, etc. [1,2,3,4]. A wide variety of material combinations and microstructures (including gradient microstructures, porous and gas-tight microstructures) are used. This results in complex sintering processes that require an exact determination of the sintering behavior in order to obtain defect-free components without sintering distortion.
To be able to meet the future demand for sintered materials, there are far-reaching scientific developments in the field of sintering to optimize sintering economically as well as ecologically (reduction of energy consumption). Among many other aspects (heating technique, temperature-time schedule, green body properties, powder properties, additives etc. [5,6,7,8,9]), modeling and computer simulation of the sintering process play a central role [10,11]. Depending on the scale considered, the sintering models are divided into microscopic and mesoscopic models, which primarily provide information about the underlying sintering physics, and macroscopic continuum models, which allow the description or fit of real macroscopic sintering processes [12]. A representative of the macroscopic continuum models is the phenomenological continuum mechanics model. It is based on the constitutive equations and correlates the shrinkage of a porous body with the viscous parameters and the generalized state of stress [13]. Such simulations, based on the continuum mechanics sintering model, could help to predict or estimate a green body shape for a defect-free sintering result without the time-consuming and expensive way of “trial and error” [11]. The development and validation of simulations based on these models usually require experimentally determined input parameters. It is of great importance to know the shrinkage behavior in terms of temperature and time. Dilatometric measurements provide direct access to the required macroscopic parameters, such as strain and strain rate, in addition to shrinkage. Other variables required for the models, such as uniaxial viscosity Poisson's ratio and sinter stress, can be measured with special setups, or derived from the measurements [14,15,16].
Thermodilatometry is the standard method for characterizing the shrinkage behavior of metallic and ceramic materials during sintering. Depending on the shape and stability of the green bodies, the optimal thermodilatometric measurement setup must be selected or, in some cases, adapted to the specific sample requirements in order to determine the shrinkage behavior without substantial external influences. In principle, two different thermodilatometric methods can be distinguished, the push-rod-type dilatometry and the optical dilatometry.
With a push-rod dilatometer, the change in length of the sample is measured one-dimensionally and the sample is exposed to the force of the push-rod, which transmits the change in length of the sample to the measuring unit (usually an inductive displacement transducer). A defined force is required to maintain permanent contact between the sample and the push-rod. This is a significant difference to the optical dilatometer, as the contact pressure can affect the sintering process and cause plastic deformation. With push-rod dilatometry, an undesirable change in shape of the sample due to the measuring forces in the final state can only be detected, if at all, when the sample is inspected after the measurement. In some cases, stresses between the push-rod and the sample or their relaxation superimpose on the measurement signal, for example in the form of jumps or drifts in the signal [17]. For most green bodies or already sintered samples with a large cross section, the contact pressure of the rod has little or no effect on the measurement of the length change behavior of the sample during thermal treatment [18,19]. For materials with relatively low viscosity, such as polymers, glass powders or samples with high amounts of liquid phases, this is often not the case. The high resolution of the push-rod dilatometer allows high precise measurement of small changes in length, such as the measurement of the coefficient of thermal expansion (CTE) [20,21].
The determination of sintering behavior with push-rod dilatometry methods usually uses bulk samples. The measurement of the sintering behavior of tapes is more complicated due to the specific properties of the tapes, such as low thickness, lower mechanical stability, and in some cases process- and microstructure-related anisotropies in the green tape [22]. This makes the use of optical dilatometry more favorable for such tasks.
An ideal thermodilatometric measurement would require zero mechanical load on the sample [17]. In the optical dilatometer the sample can sinter as freely as possible, under its own weight and without external forces. In practice, it is not feasible to overcome the influence of gravity, and some friction remains between the sample and the support. In most cases, the influence of these interactions is negligible. In the literature, optical dilatometry is therefore also referred to as non-contact dilatometry [17,23].
In the field of sintering and co-sintering of anisotropic green bodies, optical dilatometry plays an important role in the analysis of the sintering process. Deformation and anisotropic shrinkage of the sample can be observed and measured two-dimensionally (or even three-dimensionally) in situ. Video recordings of the sample shape (silhouette) allow the determination of shrinkage and other deformation processes as a function of temperature and time, e.g. swelling, bloating effects or distortions and their relaxation.
Further advantages of in situ high-temperature microscopy are discussed in detail by Boccaccini et al. [24] and Paganelli [25]. Other types of optical dilatometers have been developed and described by Paganelli [26] and Ayoub et al. [27]. A special optical dilatometer setup has been constructed by Kim et al. [28] to measure the sintering of films constrained by a substrate, where a laser is used to measures the change in length of the film thickness.
Experimental challenges of optical dilatometry may include a blurred image of the sample due to thermal expansion of the experimental setup, darkening of the image (e.g., condensation of debinding products on the viewing windows), or brightness at high temperatures due to thermal radiation.
Aim of this work is to evaluate and compare the usability of optical and push-rod dilatometry for measuring the sintering behavior of tapes. Therefore, green tapes of steel and zirconia, which differ in their properties regarding green density, solids content, particle size and shape, and elasticity, were investigated and discussed.
2. Experimental
2.1. Materials and Sample Production
The materials used in this work were powders of stainless steel (X5CrNiCuNb17-4-4, 17-4PH: delivered as sieved with a mesh size of 38 µm, measured particle size d50 = 19.43 µm; Sandvik Osprey Ltd., Neath, United Kingdom) and 3 mol% yttria-stabilized zirconia (ZrO2, TZ-3YS-E: measured particle size d50 = 0.49 µm; Tosoh K.K., Tokyo, Japan).
For the dilatometric investigations, tapes from both materials were prepared by tape casting by using water-based systems. The suspensions used were produced by homogenizing the powder with a solvent (deionized water), a dispersing agent (Dolapix CE 64; Zschimmer & Schwarz, Lahnstein, Germany), a polyvinyl alcohol binder (PVA; Mowiol 20-98; Ter Hell GmbH, Hamburg, Germany), a plasticizing agent (glycerin; Carl Roth GmbH, Karlsruhe, Germany), and a defoaming agent (Foamaster F-111; BASF, Ludwigshafen, Germany). In case of the ceramic suspension a wetting agent (Glydol; Zschimmer & Schwarz) was added. The tapes were cast by applying the suspension onto a carrier tape using the doctor blade method. The blade gap was adjusted to 1.0 mm. The tapes were then dried at room temperature and 50% humidity. The subsequent drying time depends on the layer thickness. The solids content of the suspensions is 23 vol% for 17-4PH and 22 vol% for TZ-3YS-E. Table 1 shows the compositions of the steel and zirconia suspensions to produce the steel and ceramic tapes used in this work. At the end of the manufacturing process, the green steel tape has a rough, less dense top side and a smoother, denser bottom side (facing the carrier tape). The roughness of the green ceramic tape is much less and the difference between the top and bottom side is less pronounced. Table 2 shows the general properties such as density, relative density, thickness and roughness (surface roughness ) of the dried green 17-4PH and TZ-3YS-E tapes.
2.2. Methods
2.2.1. Optical Dilatometry
The thermal expansion and shrinkage behavior as well as the distortion processes of the tapes during heat treatment were characterized by optical dilatometry. For this purpose, a heating microscope EM201 from HESSE Instruments (Osterode am Harz, Germany) was used. The sample to be investigated is placed in a tube furnace and illuminated from the front side, while the shadow image of the sample is recorded by a CCD camera from the back side. The sample silhouette changes in length (width) and height (x- or y- and z-direction respectively, see Section 2.3) during debinding and sintering is measured. The measurement software of the device (EMI by HESSE Instruments GmbH) analyzes the shadow images. The measured values are based on the comparison of the analysis results of several images taken per second, which are smoothed using a median filter. The software outputs the maximum value determined of the sample contour as the measured value of the measured dimension.
During the measurement, the tube furnace was purged with a gas mixture of 95% argon and 5% hydrogen (Varigon H5; Linde GmbH, Pullach, Germany) at a flow rate of 10 l/h at ambient pressure.
A gas mixture of argon and hydrogen was chosen to prevent oxidation of the steel samples. The disadvantage of a hydrogen-containing atmosphere is a more difficult debinding process. Residual carbon, which can result from incomplete pyrolysis, can interfere with the sintering process or change material properties. Hydrogen and residual carbon also have a reducing effect on zirconia. The latter can be easily identified by a gray discoloration of the zirconia component after heat treatment. However, to ensure consistent experimental conditions and subsequent comparison of data, the same atmosphere was used for all thermal treatments on all samples.
Two temperature schedules were used for the debinding of the samples with 1 K/min from room temperature to 600 °C or alternatively with 5 K/min to 250 °C and 2 K/min to 500 °C, both followed by 5 K/min to 1370 °C with 30 min dwell time for the sintering process.
If temperatures higher than 1370 °C are used, the steel will exhibit viscous flow or melting effects instead of further densification. The melting point of 17-4PH is 1425 °C ± 5 °C as determined by differential thermal analysis (DTA).
In this work only the length of the sample was evaluated for the optical dilatometry measurements. The height measurements in z-direction were not considered. This is due to the low height of the tapes, which leads to a high measurement uncertainty. Complications include reflections on the tape surface and deformation of the tape, resulting in a very noisy signal or a signal that cannot be meaningfully evaluated.
If the sample is debinded during optical dilatometry, it is possible that the windows of the furnace may be slightly fogged by the outgassing of the sample and the image may be partially shadowed. Under certain circumstances, this can temporarily lead to undesirable measurement artifacts, so that the measurement signal is noisy. At higher temperatures, this effect disappears due to the evaporation of organic residues on the windows. Since the focus was on the sintering behavior at temperatures above 900 °C, nothing was done to improve this situation. However, it can be counteracted by a previous (external) debinding step or by direct window flushing or by a correspondingly high gas flow of the flushing gas.
The optical dilatometry data for the plots were smoothed with Loess regression (using 0.1 fraction of the data to estimate each relative length value). To view a raw data set and compare it to the smoothed data, see Appendix A.
Previous investigations to determine the measurement uncertainty revealed a relative resolution of the heating microscope of 0.3% of the relative length (corresponding to u(Δl) < 25 µm).
2.2.2. Push-Rod Dilatometry
For the push-rod dilatometry measurements, a NETZSCH dilatometer (DIL 402 C, NETZSCH-Gerätebau GmbH, Selb, Germany) was used. In general, the (solid) sample to be examined is clamped with a defined force and aluminum oxide spacer between the push-rod and the sample holder (to see Figure 1). The linear change in length of the sample due to temperature change is then transferred by the push-rod to a sensor. The sensor is a strain gauge, a Linear Variable Displacement Transducer (LVDT) unit, which measures the positional displacement. The influence of thermal expansion of the measuring system (push-rod and sample holder) was corrected by taking into account the difference between the measured and known thermal expansion values of an alumina reference sample.
After a pre-vacuum of 5.2 × 10⁻² mbar, the atmosphere during debinding and the measurement consisted of 95% argon and 5% hydrogen or 80% argon and 20% hydrogen with a total flow rate of 5 l/h or 10 l/h at ambient pressure.
The organic additives were removed from the sample in a previous external debinding and pre-sintering step. This occurred with 1 K/min from room temperature to 540 °C followed by 5 K/min to 900 °C without dwell times. The subsequent sintering schedule was 10 K/min from room temperature to 700 °C and 5 K/min to 1370 °C with 30 min isothermal dwell time before cooling.
Push-rod dilatometry data were smoothed for the plots with a Savitzky-Golay filter in evaluation software (Proteus by NETZSCH-Gerätebau GmbH).
The measurement uncertainty of the relative length of the push-rod dilatometer is less than 0.03% (corresponding to u(Δl) < 2.5 µm).
2.3. Sample Preparation for the Dilatometry
The sketch in Figure 2 serves to describe the orientation of the tape during the tape casting process and in the dilatometric experiment. In the following, the direction of the doctor blade movement (casting direction) is always the x-direction of the tape. When the length of the sample is measured in optical dilatometry, it is the x- or y-direction of the tape, or perpendicular or parallel to the doctor blade movement direction respectively.
For the measurements two different sample preparations were used as shown in Figure 3.
For the first method of preparation, stripes of green tape before binder burnout, approximately 20 mm × 7-8 mm × sample height, were cut along the x-direction from the center of the tape and then rolled up along the x-direction of the tape. This ensures the measurement of the linear length change of the tape in the y-direction. To measure in the x-direction, stripes were cut and rolled up along the y-direction of the tape. To prevent these rolls from unwinding, they were held together in the center by an aluminum oxide ring with an inner diameter of 4 mm. Since this geometry fits well in both types of dilatometers, this experimental arrangement can be used to compare push-rod and optical dilatometry. For the push-rod dilatometry, the sample with the ring is placed between alumina spacers and is clamped between the push-rod and the sample holder with a constant force of 20 cN (see Figure 1). Depending on the contact surface of the sample, a certain contact pressure results. In the optical dilatometer, the ring with the rolled tape is placed between two supporting alumina strips to prevent the ring from rolling, as shown in Figure 3. To reduce the measurement uncertainty, the rolled ceramic tapes are ground to a trapezoidal shape on the sides. The distances between the lateral edges of the sample are then better defined with respect to the camera. When measuring rolled up cylindrical tapes with plane-parallel end faces, it cannot be ruled out that there is a very slight rotation of the sample. In this case, the length is measured between a side surface that is closer to the camera and a side surface that is further away. This effect would increase the measurement uncertainty and is reduced for samples with a trapezoidal shape.
The second preparation method is used only for optical dilatometry. Square green tapes measuring approximately 8 mm × 8 mm × sample height were cut from of the central area of the tape. The samples were either placed on an alumina support larger than the sample dimensions or they were centered on a smaller alumina support with dimensions 4 mm × 4 mm × 0.6 mm. These two types of placement are the simplest. Apart from gravity and interfacial friction (with the support), it allows the tape to sinter freely and allows deformations to occur. The sample deformation can be directly observed and evaluated. After measuring along the x-direction of the tape, the green tape pieces were rotated 90° in the plane to measure the sample length along the y-direction of the tape.
2.4. Measurements Before and After the Dilatometric Investigation
To double-check the dilatometric measurements or to compare them in case of undesired or irregular deformation of the sample, the sample dimensions were measured at room temperature before and after the measurement using a digital caliper (Vogel Germany GmbH & Co. KG, Kevelaer, Germany).
The microstructure of selected tapes pre-sintered at 1000 °C was characterized by optical or electron microscopy. The optical micrographs were taken with the Nikon EPIPHOT 300 (Nikon Metrology GmbH, Düsseldorf, Germany). Higher magnification images of the microstructures were acquired using a ULTRA 55 field emission scanning electron microscope (FESEM; Carl Zeiss Microscopy Deutschland GmbH, Oberkochen, Germany). The tapes were embedded in epoxy resin and then ground to 1 µm with a diamond suspension, followed by polishing with an oxide polishing slurry.
The geometric density of the green samples was determined after measuring the masses and the dimensions. The density of the sintered sample was also determined using the Archimedes’ principle with water as the medium according to DIN EN ISO 3369:2010-08. Dividing the density by the theoretical density (7.80 g/cm³ for 17-4PH and 6.05 g/cm³ for TZ-3YS-E) gives the relative density of the sample.
The roughness (surface roughness of the green tapes was determined using a 3D optical profilometer Keyence VR-5000 (Keyence Deutschland GmbH, Neu-Isenburg, Germany).
2.5. Calculation of Actual Shrinkage of Warped Tapes
If the measured sample itself exhibits some deformation that is not attributed to the sintering shrinkage (e.g. warpage), then the measured total length change is a superposition of the sintering shrinkage and the deformation induced length change. In this work, this superposition is only observed during optical dilatometric measurements on flat, free sintered steel tapes. Due to the superposition, the total length change measured in situ is higher than the true shrinkage due to sintering. This is clearly visible in the images of the sintered steel samples shown in Figure 4.
However, this can be estimated with the help of Equation (1) and an image evaluation of shadow images form the optical dilatometry (e.g., with the Digitizer, a tool in the Origin software) of the initial and sintered (final) state whereas Equation (1) represents the arc lengths by integration for a planar curve:
where (red line in Figure 4 (a)), along the neutral axis (representing the edge of the neutral layer) of the sample edge, represents the approximate length of the sample during or after sintering without warping. is the first derivative of the function (e.g. a polynomial) that fits the neutral axis of the sample edge in the shadow image. The distance corresponds to the horizontal distance between the start and end points of the neutral axis form the picture of sintered state.
A simpler method that provides the same accuracy is to split the line into small linear sections that are then added together as shown in Appendix B.
With the initial length taken from the picture of the initial sample state, the relative length change or the linear shrinkage can now be calculated using Equations (2) and (3).
In the case of isotropic sintering shrinkage, the calculated length (in the x-direction of the tape) should be comparable to the length of the sintered sample perpendicular to it (y-direction of the tape).
An example of the whole procedure is shown in Appendix B.
3. Results and Discussion
Measurements were made with flat, lying and rolled tapes of both materials. The lying tapes are used for optical dilatometry only. To detect possible shrinkage anisotropy, the samples were prepared to measure the x- or y-direction of the tape as described in detail in the previous Section 2.3.
3.1. Shrinkage Behavior of 17-4PH Tapes
Figure 5 shows the silhouettes for two lying 17-4PH tapes measured in the optical dilatometer at selected temperatures. Figure 6 shows the corresponding relative length and relative length change rate. The sample length is measured in the x- and y-directions of the tape. In the x-direction, a change in length of -36.7% is measured, while the measured shrinkage in the y-direction is 13.9%.
For the measurement in the y-direction of the tape, the curve shows the effects of debinding up to around 600 °C with a step at around 100 °C (approximately 1%), where the organic starts to soften. Shrinkage starts at around 980 °C. Shrinkage is not complete at the beginning of the isothermal period and continues to increase during the dwell time.
In the x-direction, a comparatively more pronounced step (approximately 3.2%) occurs at around 100 °C, followed by similar debinding effects up to 600 °C. Shrinkage starts at about 920 °C. For both directions, the relative length continues to decrease as the sample cools, due to the thermal contraction.
To understand and interpret the curves, it is necessary to look at the silhouettes in Figure 5. From Figure 5 (b), picture (ii), it is clear why the measured length of the tape in Figure 6 appears to decrease so much in the x-direction of the tape. The 17-4PH tape warps slightly during melting of the organic binder and debinding, and even more during sintering.
Therefore, this change in length is not just shrinkage due to sintering. Measuring the sintered, warped 17-4PH tape with the digital caliper shows an apparent shrinkage of 36.0% in the warped x-direction. This indicates that a correction of the data is necessary to determine the shrinkage in the x-direction caused by sintering (see below).
The green steel tape has a smoother, denser bottom (facing the carrier tape) and a rough, less dense top side (compare Figure 4 (a) and (b), Figure 7).
Due to softening or melting of the organic components, a slight warpage of the entire edge of the tape in direction of the less dense tape side occurs. The abrupt change in length at approximately 100 °C is associated with this warpage process. The pictures (ii) in Figure 5 (a) and (b) show the samples at 150 °C when the softening of the organic components was complete. Long-chain molecules, such as the PVA binder used, probably have a higher degree of polymer orientation and are stretched along the casting direction by the doctor blade shear [30]. As a result, the tape raised slightly more in the x-direction, which means that the tape is pre-embossed in the x-direction after debinding. It is assumed that the resulting state of stress will be conserved during the drying process and is reduced by a deformation of the steel tape as solid organic binder components are melted during heating (such stress relaxation combined with linear shrinkage is observed for aging alumina tapes [30]). This warpage reduces the recorded sample length and explains why the relative length decreases even before sintering. The warpage of a debinded sample remains stable during cooling. This can be seen in Figure 7 for a 17-4PH tape that has been debinded and pre-sintered at 1000 °C without dwell time or external loading and has retained its warpage.
In addition, the strong warpage during sintering is also caused by the production process of the tapes and can be explained by a density gradient over the vertical tape profile. When the suspension is applied to the carrier tape during production, the steel particles show different sedimentation behavior depending on the particle size and shape. Consequently, an increase in porosity is observed from the bottom to the top of the tape (Figure 7). Due to the higher particle concentration on the bottom side caused by the sedimentation process during casting and drying, this region shows less in-plane shrinkage during sintering. In conjunction with the pre-embossing of the tape in the x-direction during debinding, results in the observed warpage.
The described warpage in the x-direction occurred independently of the orientation or position of the sample in the furnace. Experimental influences, such as temperature gradients or magnetic alignment of the sample by the furnace magnetic field (below 600 °C, during binder burnout, 17-4PH is magnetizable) can thus be excluded. Experiments in the optical dilatometer were performed with different flat sample geometries and sample positioning. Round samples as well as strip-shaped samples always showed the described strong warpage to the rough, less dense side in the casting direction, independent of the upward or downward orientation of the less dense side, i.e. the deformation of the sample also takes place against the gravity. Figure 4 shows examples of the warpage behavior of steel tapes with different tape geometries and experimental arrangements.
In order to prevent the influence of the warpage, the sintering of rolled tapes was tested.
The silhouettes to the shrinkage measurements are shown in Figure 8. The rolled 17-4PH tape is fixed in the center with a vertical standing ring. Over temperature and time, the rolled tape shrinks due to sintering, while the ring remains in place without changing its shape.
The corresponding relative length and relative length change rate curves of the rolled 17-4PH tapes measured by optical dilatometry are shown in Figure 9. The black and red curves were determined by measuring the change in sample length along the x- and y-directions of the tape, respectively. With this type of sample preparation, the 17-4PH tapes show very similar sintering behavior in both directions of the tape. The total shrinkage for both measurements is 15.2%. This means that the shrinkage of the rolled tapes is slightly greater than the values measured for the flat tapes (Figure 6). The wobbling of both curves up to around 600 °C can again be attributed to the debinding process of the tapes. In the y-direction, the debinding behavior is similar to that of the lying tape. Shrinkage starts at about 940 °C and 980 °C for the x- and y-direction, respectively. However, it is not possible to accurately determine the sintering initiation temperature for the steel tapes from the optical dilatometry curves (see below). The maximum relative length change rate is observed at about 1220 °C for both directions. The values for both directions are higher than those for the lying tapes. At around 1320 °C the two curves separate slightly, and the tape measured in the y-direction (rolled up in x-direction) appears to shrink slightly more than in the x-direction, but not significantly. The sintering is still pronounced at the dwell time at 1370 °C. During cooling, there are deviations between the two tape directions, but these can be considered similar within the relative resolution of 0.3% of the relative length. The differences are most likely caused by scatter in the experimental data.
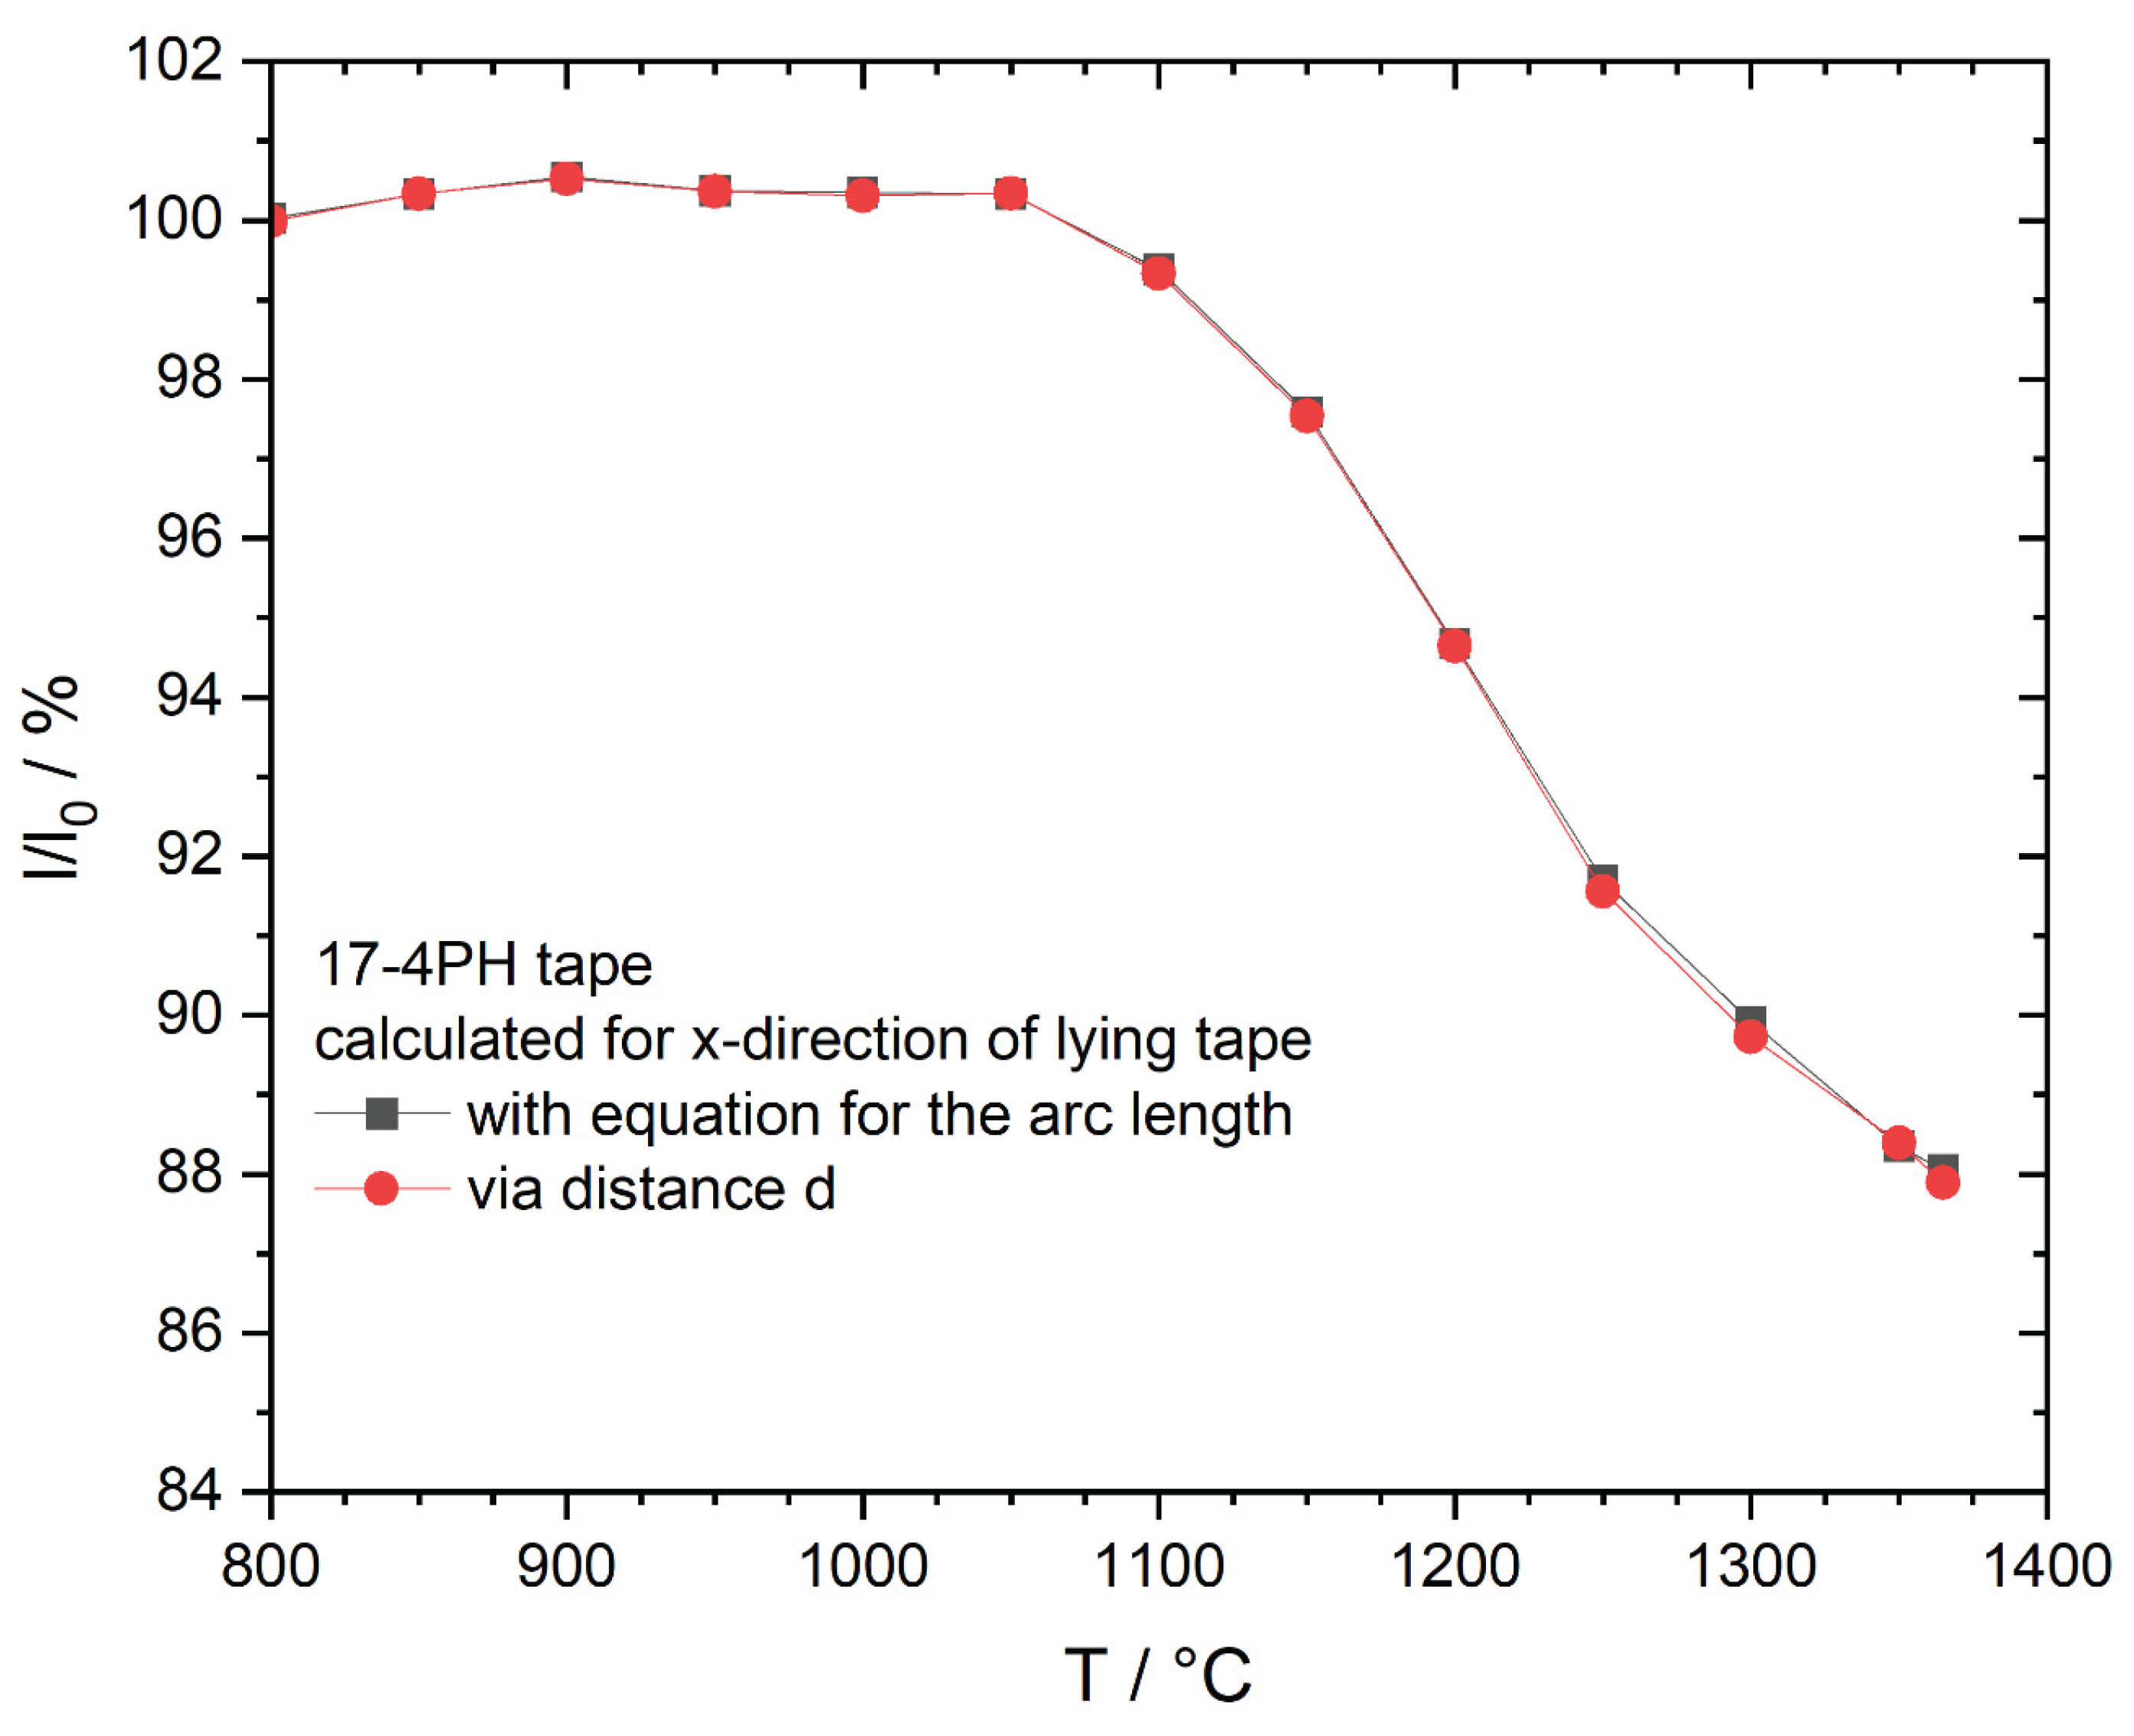
To get a true value for the shrinkage of the 17-4PH tape in the warped x-direction, the approximation as described in the previous Section 2.5 was used, resulting in a total shrinkage of 13.3%. The corrected curve for the x-direction is shown in Figure 10. It is compared to the measured values of the rolled 17-4PH tape in the x- and y-directions from Figure 9. The deviations between the calculated and measured values can be neglected in terms of measurement uncertainty. This indicates that there is no or only a negligible anisotropic shrinkage in the x- and y-directions of the 17-4PH tape when warpage is prevented. However, the shrinkage caused by sintering must be separated from the overall length change by additional processing of the warped tape data. Alternatively, it can be measured on rolled tapes that do not show warpage of the measured dimension. The higher shrinkage of 13.9% in the y-direction of the lying 17-4PH tape compared to its calculated value in the x-direction is explained by the position of the tape at the beginning. The steel tape was slightly bent and lay slightly twisted until sintering (see Figure 5 (a)).
The samples of the rolled tapes can also be analyzed in the push-rod dilatometer. The measurement results for 17-4PH tapes are shown in Figure 11. The sintering behavior is very similar in both directions, ending in a shrinkage of 16.4% for both directions of the tape. Since the samples were debinded prior to the push-rod dilatometric measurements, no similar effects of debinding are observed as with the not debinded samples from the optical dilatometry. The slight downward slope at around 630 °C indicates the austenitization (γ-phase) of 17-4PH. The phase transition is followed by a continuous increase due to thermal expansion until sintering starts at about 970 °C and 1000 °C for the x- and y-directions, respectively. As with optical dilatometry, it is difficult to determine the correct onset of sintering, so the values shown are for orientation. In contrast to the behavior determined in the optical dilatometer, an additional peak in the relative length change rate occurs at approximately 1120 °C. This could be due to the contact pressure used. The contact pressure accelerates the particle rearrangement in the initial state of sintering. In addition, a flattening of the not perfect cutting edges of the tap may contribute. The contact pressure also leads to a higher relative length change rate and a higher peak temperature for the main maximum compared to the heating microscope. The total shrinkage is also slightly higher than for optical dilatometry (16.4% versus 15.2%), indicating the influence of the contact pressure. The data indicate that the application of the contact pressure does not alter the sintering mechanism. However, it does influence the intensity and temperature ranges of the individual processes. Upon cooling below 200 °C, the γ-α-phase transition (to the martensitic α-phase) of 17-4PH takes place, accompanied by an increase in volume [29], which could not be clearly determined in the optical dilatometer due to the lower resolution (see Appendix A in Figure A3). In the x-direction cooling curve, there is an apparent end of contraction at approximately 300 °C before the phase transition. This is a measurement artifact where the measurement signal has exceeded the measurement range of the push-rod dilatometer.
Figure 12 compares the data normalized at 900 °C in the y-direction of rolled up 17-4PH tapes measured by optical dilatometry and push-rod dilatometry. The data used are the same as in Figure 9 and Figure 11. The shrinkage between the two types of dilatometers differs by about 1.2% and can be explained by the constant force of 20 cN when measuring with the push-rod dilatometer. The relative length change rate is higher and shows two peaks between 1075 °C and 1300 °C when measured with the push-rod dilatometer, while only one maximum is detected when measured with the optical dilatometer. Figure C1, Appendix C compares the two curves when the data are not normalized to 900 °C.
3.2. Shrinkage Behavior of TZ-3YS-E Tapes
TZ-3YS-E tapes show no significant warpage during sintering as shown in Figure 13. This indicates a high stability of the TZ-3YS-E suspension due to the much smaller grain size compared to the steel powder. Figure 14 shows the cross section of a pre-sintered TZ-3YS-E tape at 1000 °C. Regardless of the partly large zirconia agglomerates (bright areas), the zirconia particles and agglomerates are distributed homogeneously over the volume. The small dark gray areas are pores.
The relative length and relative length change rate for lying free sintering TZ-3YS-E tapes, measured in the optical dilatometer in the x- and y-directions of the tape, are shown in Figure 15. The general sintering behavior of both directions is similar. The shrinkage is 20.8% and 21.0% for the x- and y-directions, respectively. The observed wobble of the curve is attributed to debinding processes and disappears above 600 °C when debinding is complete. Beyond 600 °C, the thermal expansion of the sample can be observed until sintering starts at around 1000 °C. There is only one peak in the sintering rate, which occurs at approximately 1300 °C.
The silhouettes of rolled TZ-3YS-E tapes are shown in Figure 16. A similar setup is shown as for the rolled 17-4PH tapes, but in addition the lower part of the image is covered by a thicker alumina stripe, which should hold the ring with the rolled tape in its position and provide a better baseline (required by the software) for the measuring of the length.
The corresponding curves of the relative length and relative length change rate of the rolled TZ-3YS-E tapes measured by optical dilatometry are shown in Figure 17. The black and red curves were determined by measuring the sample length in x- and in the y-directions of the tape. As the lying sintered tapes, the rolled tapes show similar sintering behavior for the x- and y-directions with a shrinkage of 20.4% and 20.0%, respectively. However, the shrinkage in the x-direction is slightly greater than that in the y-direction, whereas the opposite was true in the unrolled state. This indicates that these differences are due to the relative resolution of 0.3%, measurement errors, and sample preparation. Again, in both measurements the detected relative length is influenced by the debinding process up to about 600 °C when the organic is removed. After further thermal expansion, the shrinkage process starts at about 1010 °C. Only one pronounced maximum of the sintering rate is observed at approximately 1270 °C and 1290 °C for the x- and y-directions, respectively. These values are close to, but lower than, those of the lying ceramic tapes.
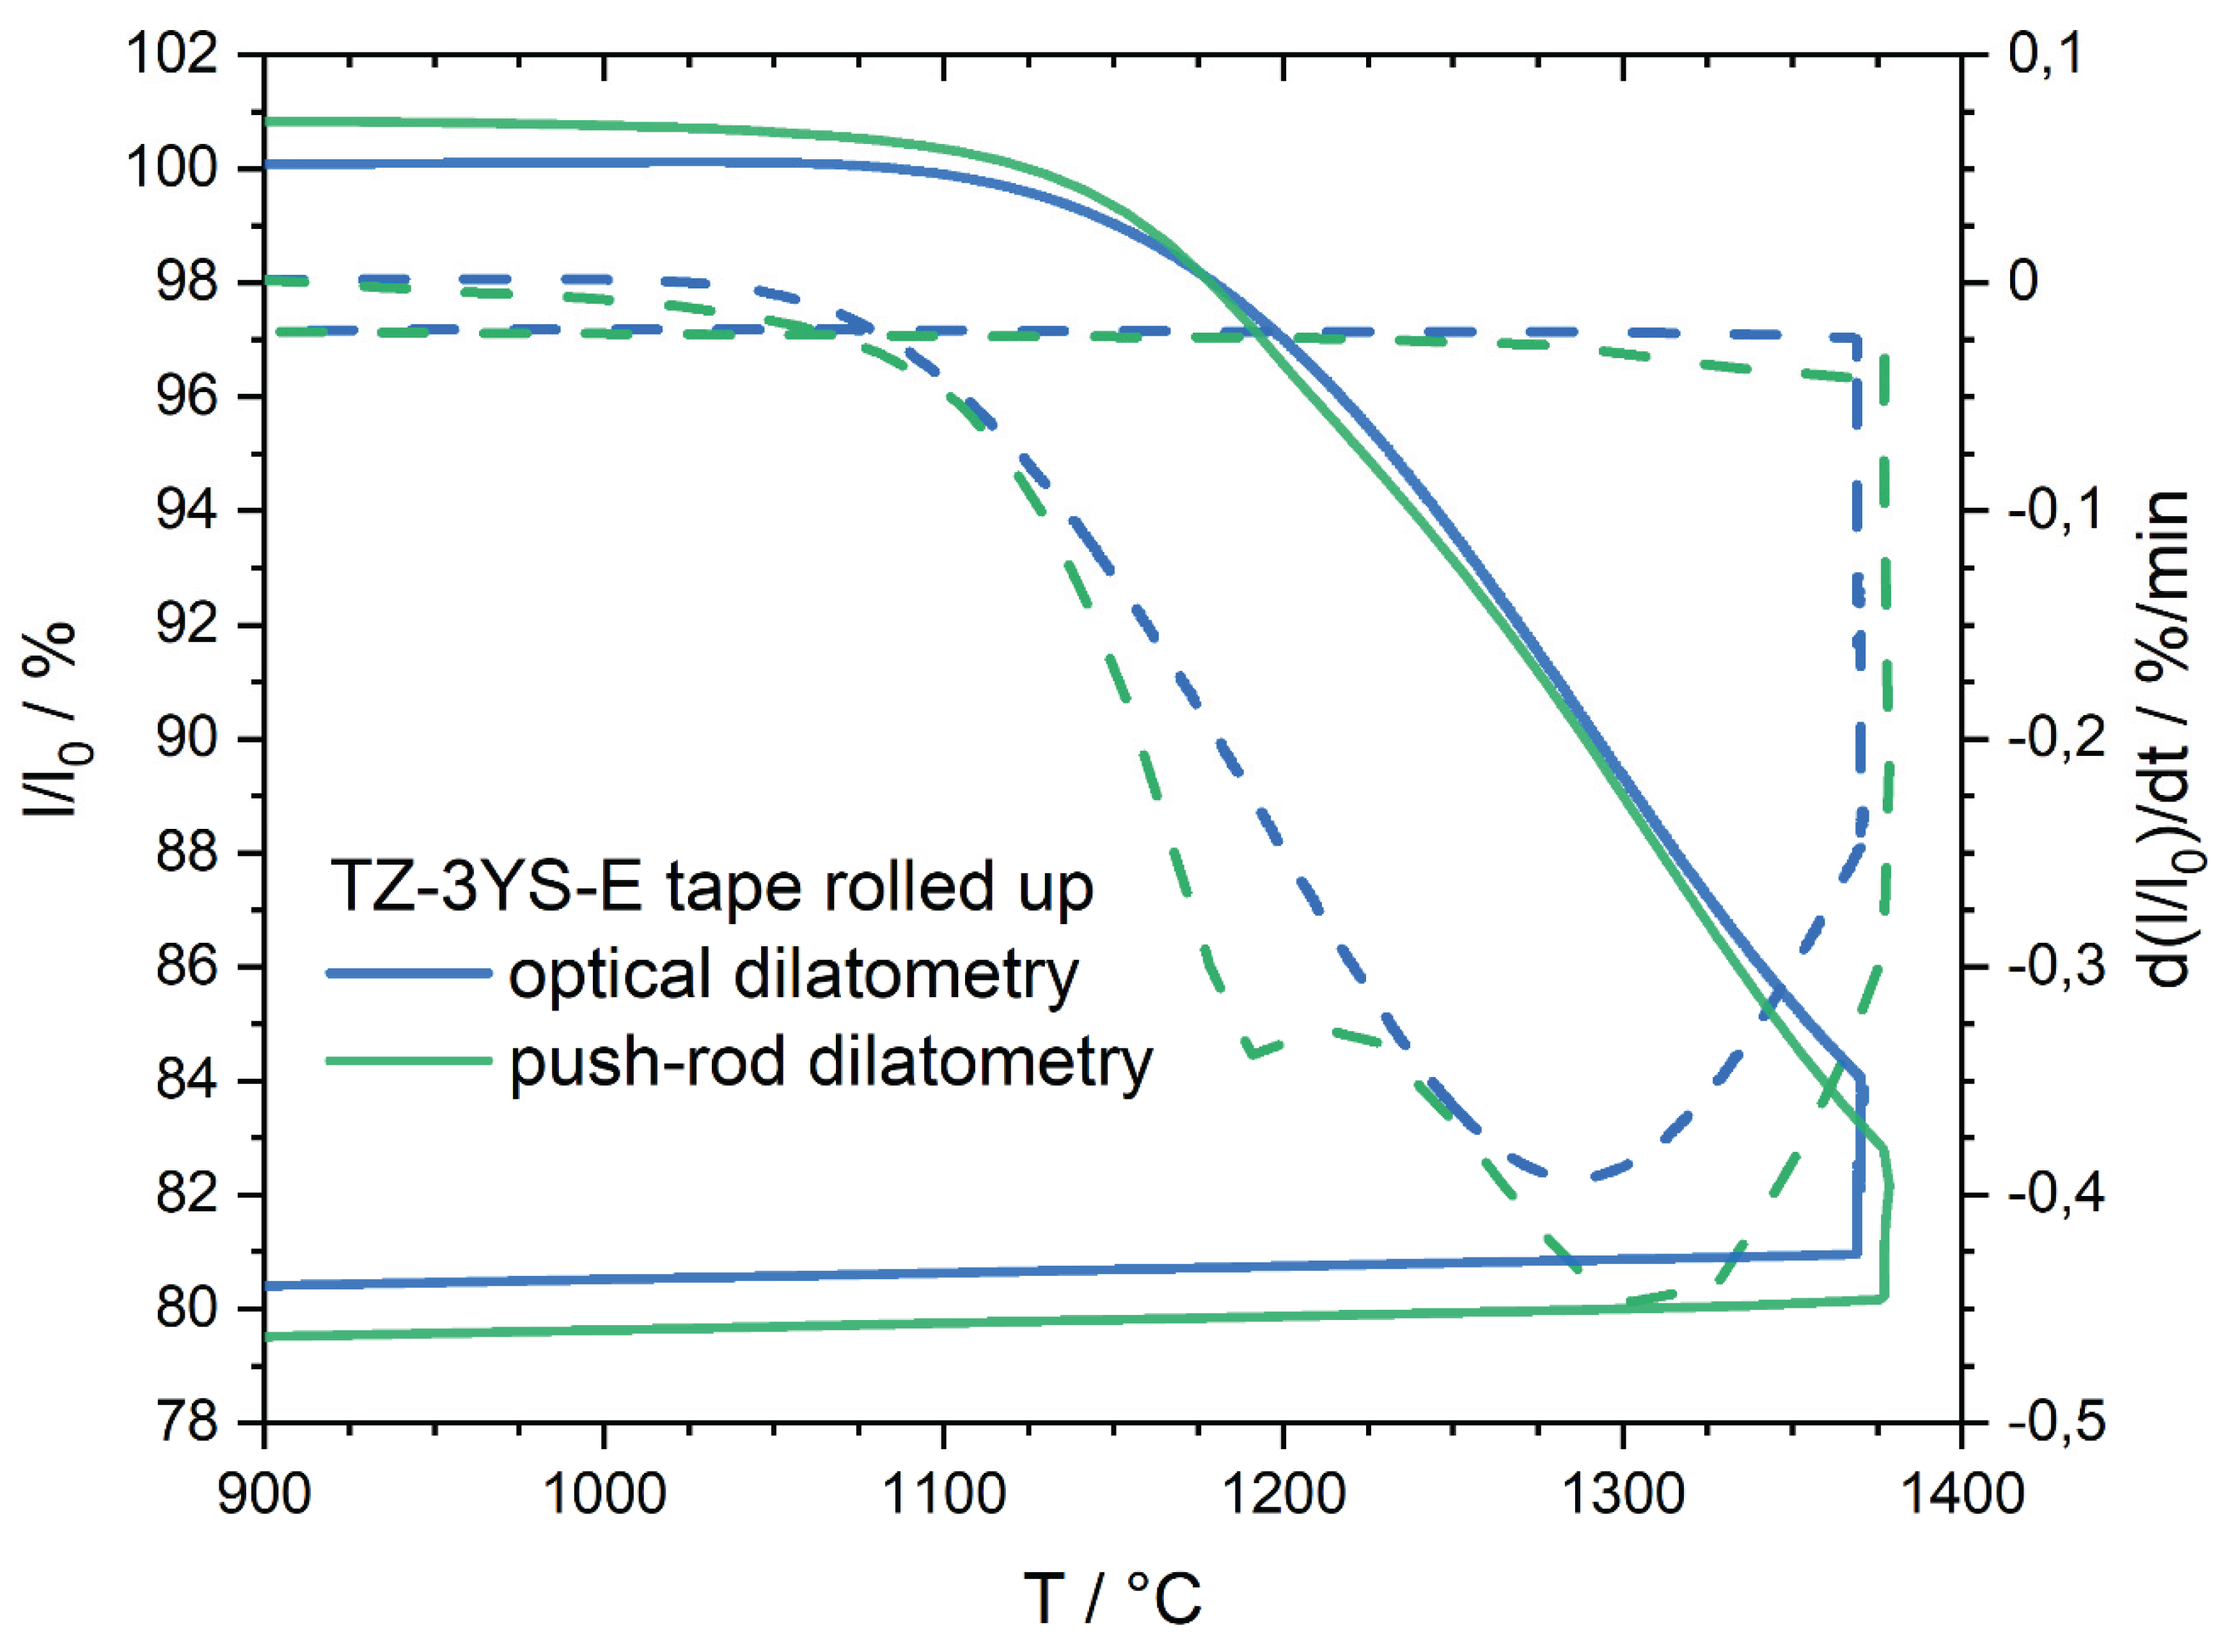
Push-rod dilatometer measurements of rolled up TZ-3YS-E tapes are shown in Figure 18. Overall, the two curves are similar. The shrinkage is 21.4% and 21.3% in the x- and y-directions of the tape, respectively. Since the samples were previously debinded, there is no effect other than thermal expansion prior to sintering. Figure 19 compares the data normalized at 900 °C in the y-direction of rolled TZ-3YS-E tapes measured by optical dilatometry and push-rod dilatometry. The data used are the same as in Figure 15 and Figure 17. Slight differences can be seen at the beginning of shrinkage and during the dwell time. The two curves differ slightly in sintering rate from the optical dilatometer data. As with the steel tapes, an additional peak occurs at about 1190 °C and the peak of the relative length change rate is shifted to higher temperatures and higher densification rates. This can be explained in a similar way to the steel tapes. The contact pressure results in a higher total shrinkage up to 1.3%. Figure C2, Appendix C compares the two curves when the data are not normalized to 900 °C.
From all the measurements made with the TZ-3YS-E tapes under different conditions, there is no shrinkage anisotropy recognizable between the x- and y-directions of the TZ-3YS-E tape. The difference in total shrinkage between the x- and y-directions is less than 0.4%.
3.3. Comparison of the Results for 17-4PH and TZ-3YS-E
Table 3 summarizes the results for linear shrinkage caused by densification and compares the measured values of the optical or push-rod dilatometer and the caliper, for the materials and the measurement directions of the tape.
In optical dilatometry lying 17-4PH tapes show less shrinkage than rolled tapes, with the difference being less than 2% for both tape directions. Lying TZ-3YS-E tapes in optical dilatometry show higher shrinkage than the rolled tapes, with a difference in shrinkage of less than 1%. This difference is probably caused due to experimental reasons and is not completely understood.
Push-rod dilatometry data for rolled tapes of both materials show higher shrinkage of about 1.0% to 1.3% compared to optical dilatometry. This is most likely due to the contact pressure of the push- rod.
The shrinkage in x-direction of the warped 17-4PH steel tape was corrected from 36.7% (with warpage) to 13.3%. This value is close to the value of 13.9% for the y-direction of the steel tape. In addition, the calculated curve follows the curve for the x- and y-direction of a rolled up tape measured in the optical dilatometer (whose warpage was suppressed).
The optical dilatometry results for rolled up 17-4PH tapes exhibits a shrinkage of 15.2% for both measured directions of the tape. The shrinkage measured with the push-rod dilatometer is also the same in both directions at 16.4%. This reveal, that there is no anisotropy in shrinkage. However, the contact pressure of the push-rod dilatometer influences the densification.
The optical dilatometry results show only 0.2% and 0.4% difference in shrinkage between the x- and y- directions for the lying and rolled TZ-3YS-E ceramic tapes respectively, which can be considered equal within the measurement uncertainty. The shrinkage measured with the push-rod dilatometer is similar in both directions, but also higher than with optical dilatometry, as observed with the steel tapes.
The following should be noted about the temperatures measured in this work. In addition to the measurement uncertainty of u(T) < 5 K, there is an error in the determination of the characteristic temperatures caused by the smoothing of the raw data. The determination of the sintering start temperature in optical dilatometry is particularly affected by this. Since the transition region between thermal expansion and the start of sintering is usually given by a flat curve, the smoothing process has a strong influence on the maximum value of the relative length and thus on the temperature position of the start of sintering to be determined. Depending on the data range selected for smoothing, the value for the sintering start temperature fluctuates by up to 60 K. The values given for the start of sintering are given with their largest deviation. Due to the resolution of the optical dilatometer, the noisy raw signal and the effects of data smoothing, the determination of the sintering start temperature is only useful for orientation. The double tangent extrapolation method (as described in DIN 51007-1:2024-08) is used for determining the onset of accelerated sintering. With push-rod dilatometry, the determination of the temperature position of the additional peak is less affected by the smoothing of the data, and for the characteristic temperatures, the differences due to smoothing are less than 2 K. The temperature values obtained have all been rounded to the nearest ten.
Table 4 summarizes the characteristic temperatures for the sintering process of the steel and ceramic tapes (onset: accelerated sintering, peak of the rate of change in relative length: maximum sintering rate). Appendix D contains an example for determining the characteristic temperatures and the total shrinkage.
For 17-4PH, the characteristic temperatures are generally lowest in optical dilatometry for the lying tape, are higher in optical dilatometry for the rolled tape, and are even higher in the push-rod dilatometer for the rolled tape. Thermal expansion dominates up to about 950 °C. A transition to shrinkage initiation cannot be clearly determined due to measurement uncertainties.
The characteristic temperatures of TZ-3YS-E tapes measured in the optical dilatometer and rolled up tapes measured in the push-rod dilatometer are similar for both directions of the tape. The temperatures of the beginning of sintering and the start of accelerated sintering of the rolled up tapes determined by optical dilatometry are higher, while the temperature of the maximum relative length change rate is again comparable to the other prepared and measured ceramic tapes.
4. Summary and Conclusions
In this work the sintering and deformation behavior of tapes prepared by tape casting based on 17-4PH steel and 3 mol% yttria-stabilized zirconia powders were examined by optical dilatometry and push-rod dilatometry.
The tapes were measured as lying tapes in the optical dilatometer or as rolled up tapes in the optical and the push-rod dilatometers.
Freely debinded and sintered 17-4PH tape always shows warpage on the top side (during casting) of the tape during optical dilatometry. An initial small warpage occurs during debinding and the main warpage effect is observed during sintering. Therefore, the warpage of the steel tape can be explained by the interaction of two effects. One is the slight warpage during debinding, which is related to the behavior of the organic binders (during melting and evaporation), where the anisotropic orientation of the organic binder molecules in the xy-plane of the tape most likely leads to a pre-embossing of the slightly warped tape in the x-direction. The second effect is a vertical density gradient across the tape profile caused by sedimentation processes of the steel particles during casting and drying, which then leads to severe warpage during sintering. The fine-grained homogeneous TZ-3YS-E tapes do not show such warpage. This indicates the decisive role of the homogeneity of the green tape structure.
Using the proposed correction method (see Section 2.5 and Appendix B), the shrinkage caused by sintering can be separated from the shrinkage caused by warpage. Rolled up steel tapes show a similar sintering behavior in both directions in optical dilatometry and end up with similar total shrinkage because warping is prevented.
A greater measured total shrinkage of the steel tapes in the push-rod dilatometer can be explained by the contact pressure of the push-rod. However, an additional peak in the relative length change rate is observed, indicating the influence of the applied pressure. Irrespective of this, the rolled steel tapes show a very similar sintering process for both tape directions in the push-rod dilatometer. Based on the different measurements, it can be concluded that the steel tape does not exhibit sintering shrinkage anisotropy.
The TZ-3YS-E tapes show very similar sintering shrinkage without warpage in both optical and push-rod dilatometry and for both types of sample preparation. However, due to the contact pressure of the push-rod, the total shrinkage of the ceramic tape is also higher than that measured by optical dilatometry, and the additional peak in the relative length change rate appears. This indicates the influence of the contact pressure. Nevertheless, the ceramic tape sinters in the same way in the x- and y-directions under the same experimental conditions.
In general, it is difficult to investigate the sintering of tapes using push-rod dilatometry. Deformations occur due to the force of the push-rod. From an experimental point of view, the most effective way to minimize this effect was to stabilize the tape by rolling it up. However, it is difficult to produce samples with precise end faces. In addition, the debinding of the rolled tape is made more complicated by covered surfaces. However, in push-rod dilatometry, the onset of sintering was affected even for rolled tapes, and a small additional apparent length change was observed for both steel and zirconia.
Optical dilatometry is a comfortable tool for investigating the debinding and sintering behavior of ceramic and powder metallurgical tapes. Effects such as the slight warpage of steel tapes during debinding can be directly observed and characterized. The shrinkage of tapes can be measured using rolled tapes. This prevented warping in the measured length direction. To measure the sintering shrinkage in the z-direction across the tape thickness, a special dilatometer setup is required as described in [28].
For the investigation of phase changes (or thermal expansion) as shown for the steel tapes the push-rod dilatometry is more suitable. However, with push-rod dilatometry it is very important to be careful when interpreting the results. Apparent changes in the sintering mechanisms (additional shrinkage peaks) may occur due to the contact pressure of the push-rod, or the total shrinkage may be overestimated.
Funding
This project was funded by the Deutsche Forschungsgemeinschaft (DFG) under the project number 441616349.
Acknowledgments
The authors wish to thank Regina Stockmann for the preparation of the tapes and Lutz Plietz for many laboratory activities. We would like to take this opportunity to acknowledge the funding from the DFG.
Conflict of Interest
The authors declare no conflicts of interests regarding this paper.
List of Abbreviations
| 17-4PH | X5CrNiCuNb17-4-4 Stainless Steel |
| CTE | Coefficient of Thermal Expansion |
| DIL | Push-rod Dilatometer |
| DTA | Differential Thermal Analysis |
| FESEM | Field Emission Scanning Electron Microscope |
| ODIL | Optical Dilatometer |
| PVA | Polyvinyl Alcohol |
| TZ-3YS-E | 3 mol% Yttria-stabilized Zirconia |
Appendix A
Raw Data from Optical Dilatometry
Without smoothing the optical dilatometry data, the derivative over the time is not meaningful (see Figure A1 and Figure A2).
Figure A1.
Raw data of relative length (solid line) and relative length change rate (dashed line) for 17-4PH flat lying tapes between room temperature and 1370 °C measured via optical dilatometry. The black and red curves were determined by measuring the sample length in the x- and y-directions.
Figure A1.
Raw data of relative length (solid line) and relative length change rate (dashed line) for 17-4PH flat lying tapes between room temperature and 1370 °C measured via optical dilatometry. The black and red curves were determined by measuring the sample length in the x- and y-directions.
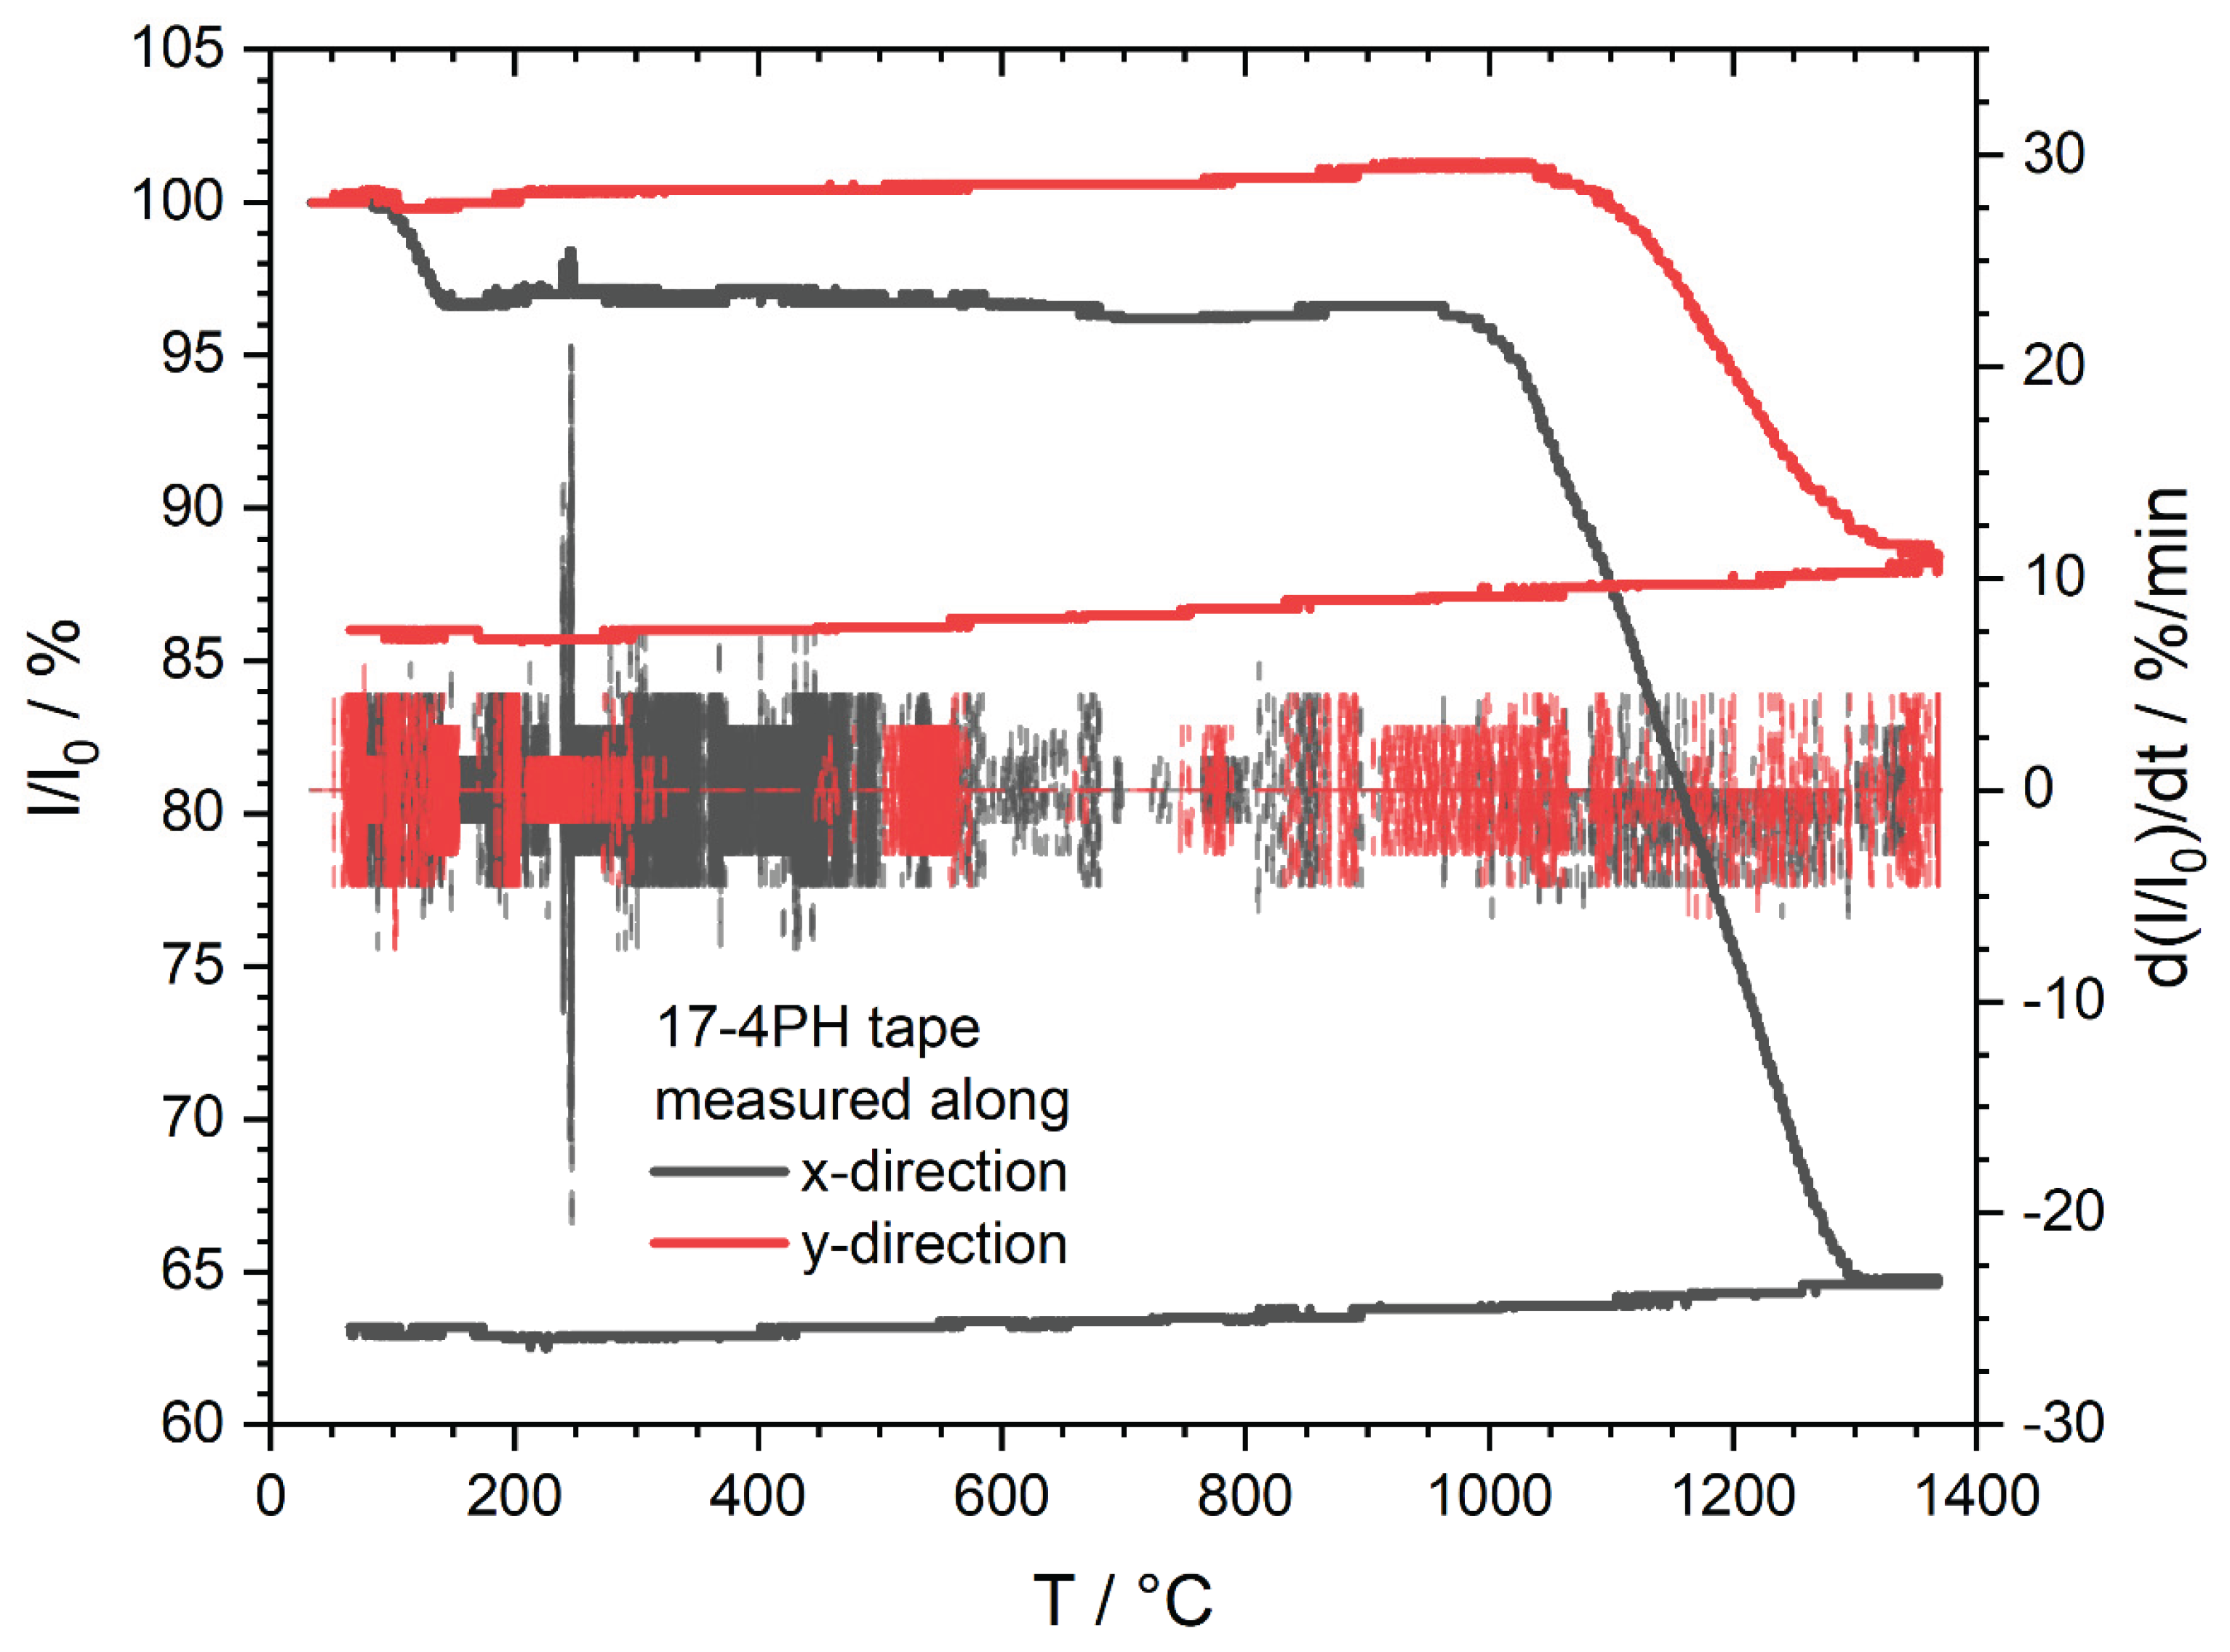
Figure A2.
Raw data of relative length (solid line) and relative length change rate (dashed line) for TZ-3YS-E flat lying tapes between room temperature and 1370 °C measured via optical dilatometry. The black and red curves were determined by measuring the sample length in the x- and y-directions.
Figure A2.
Raw data of relative length (solid line) and relative length change rate (dashed line) for TZ-3YS-E flat lying tapes between room temperature and 1370 °C measured via optical dilatometry. The black and red curves were determined by measuring the sample length in the x- and y-directions.
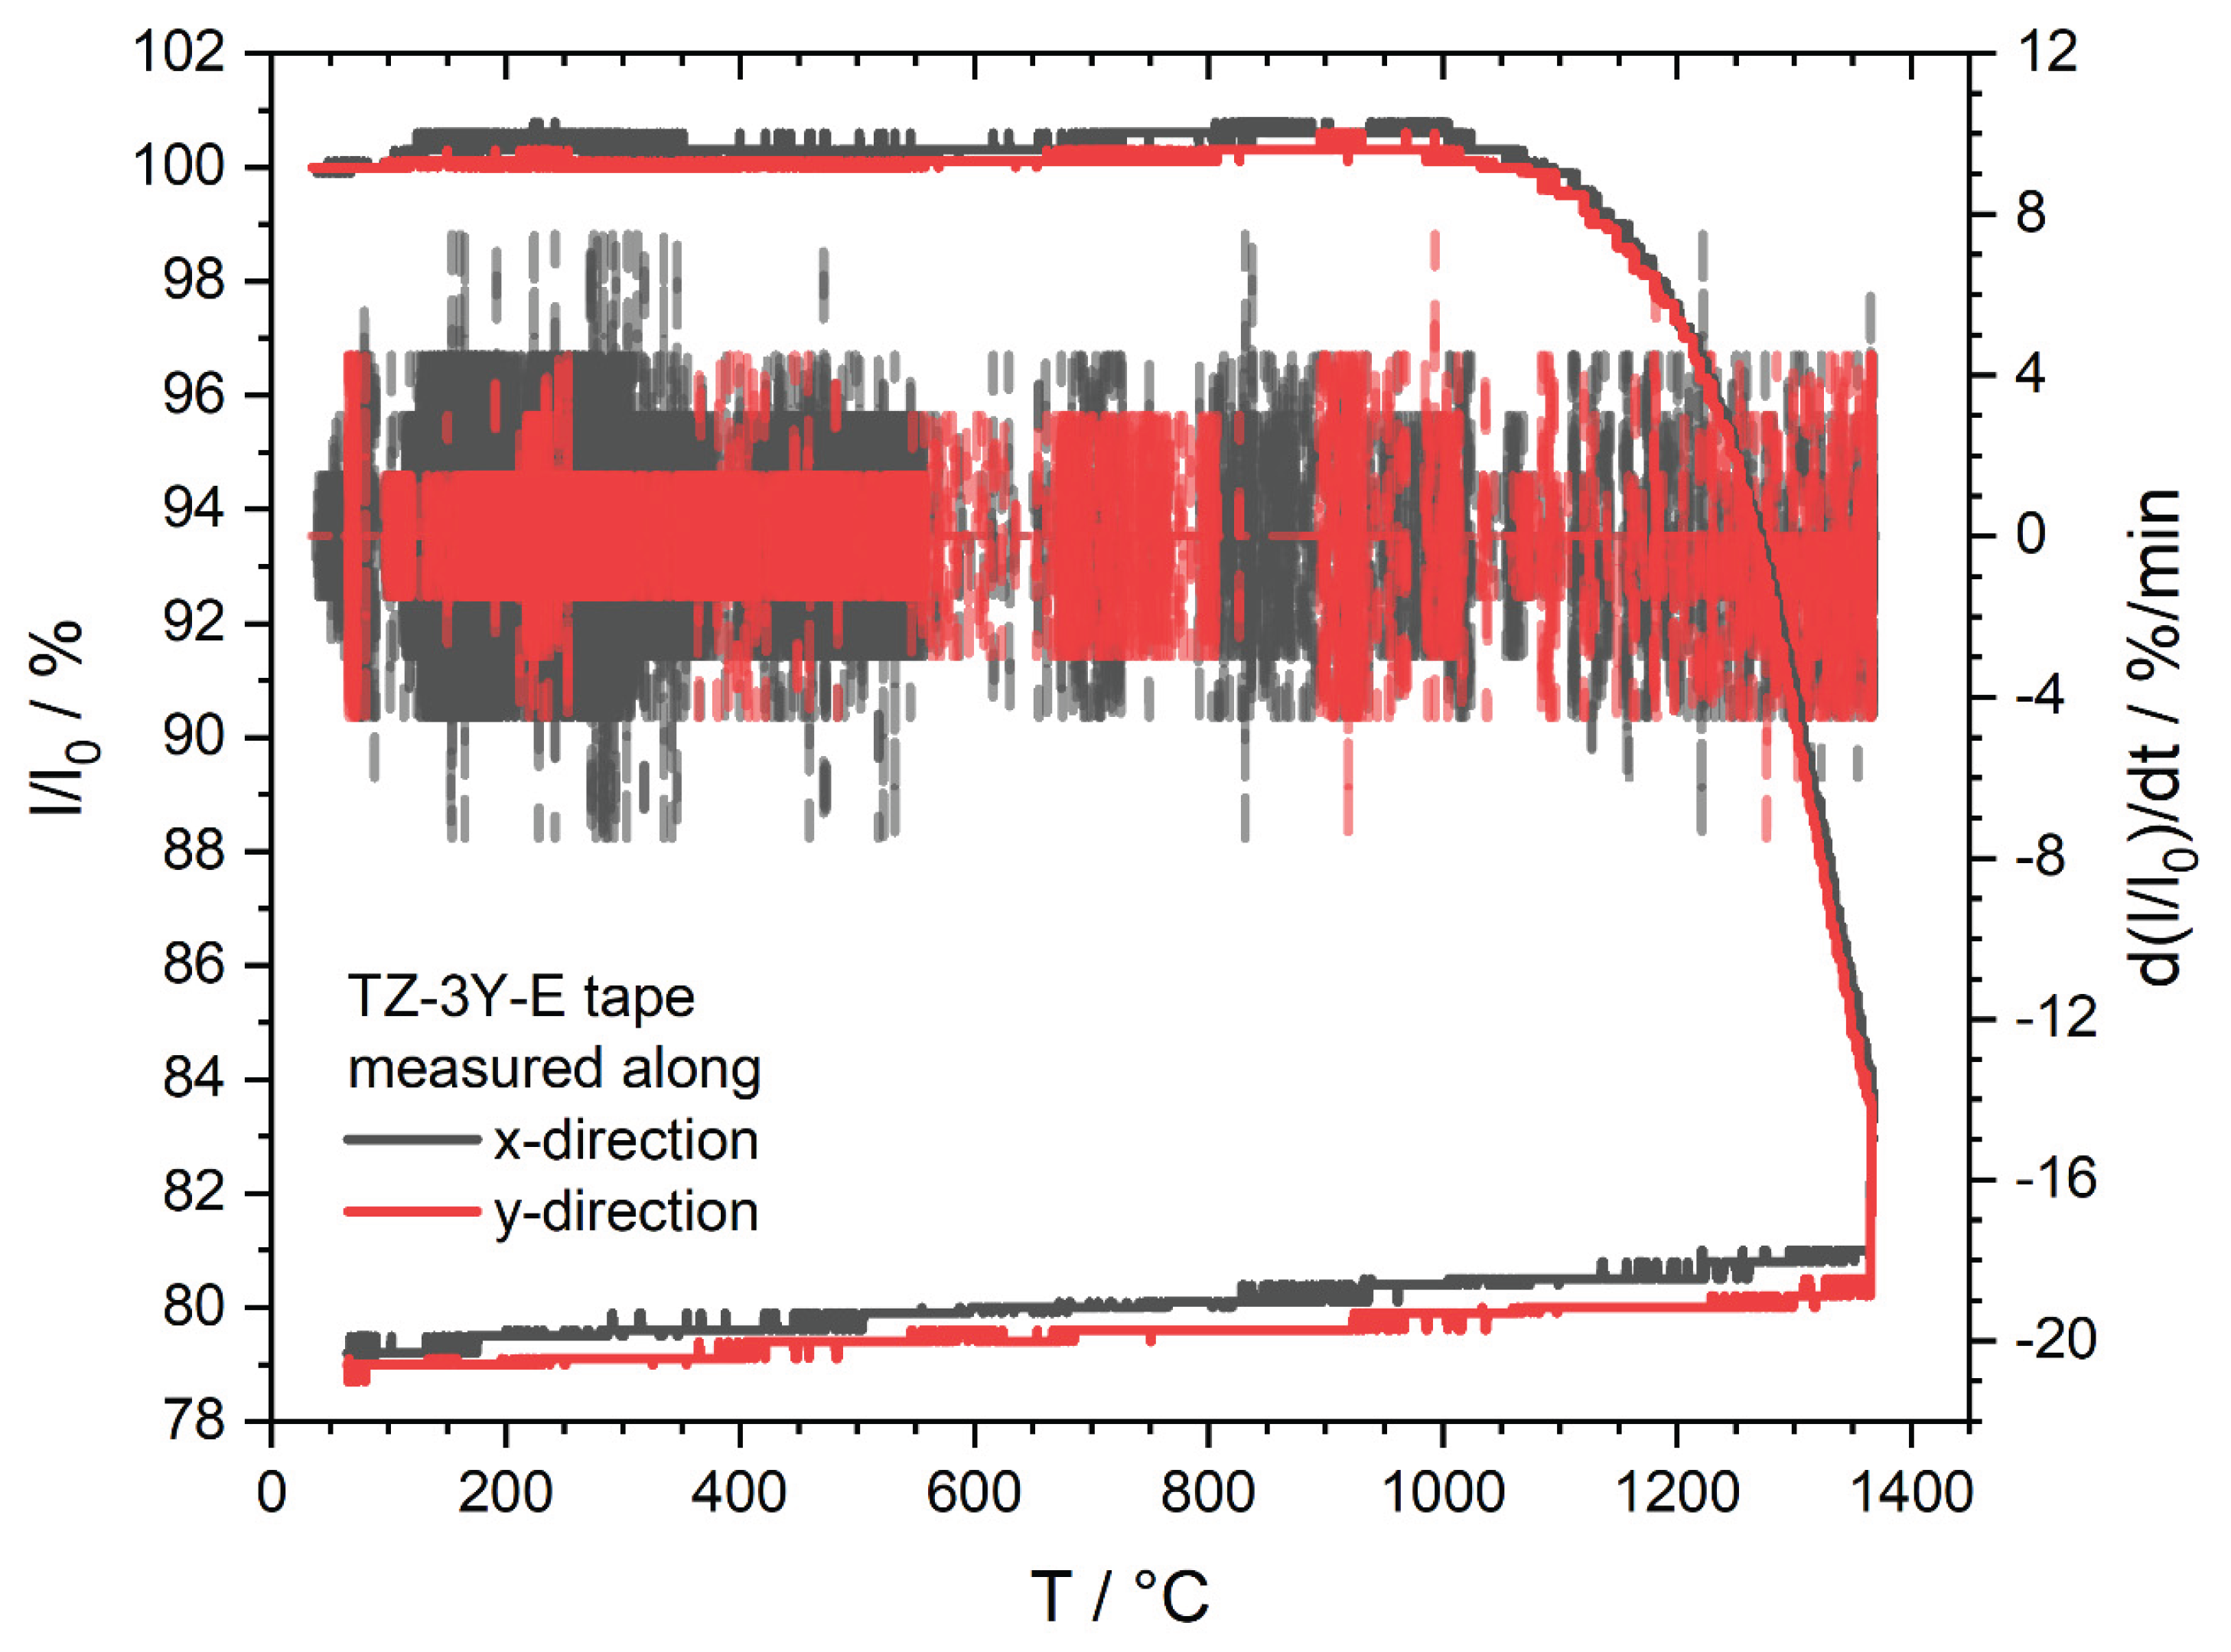
Figure A3.
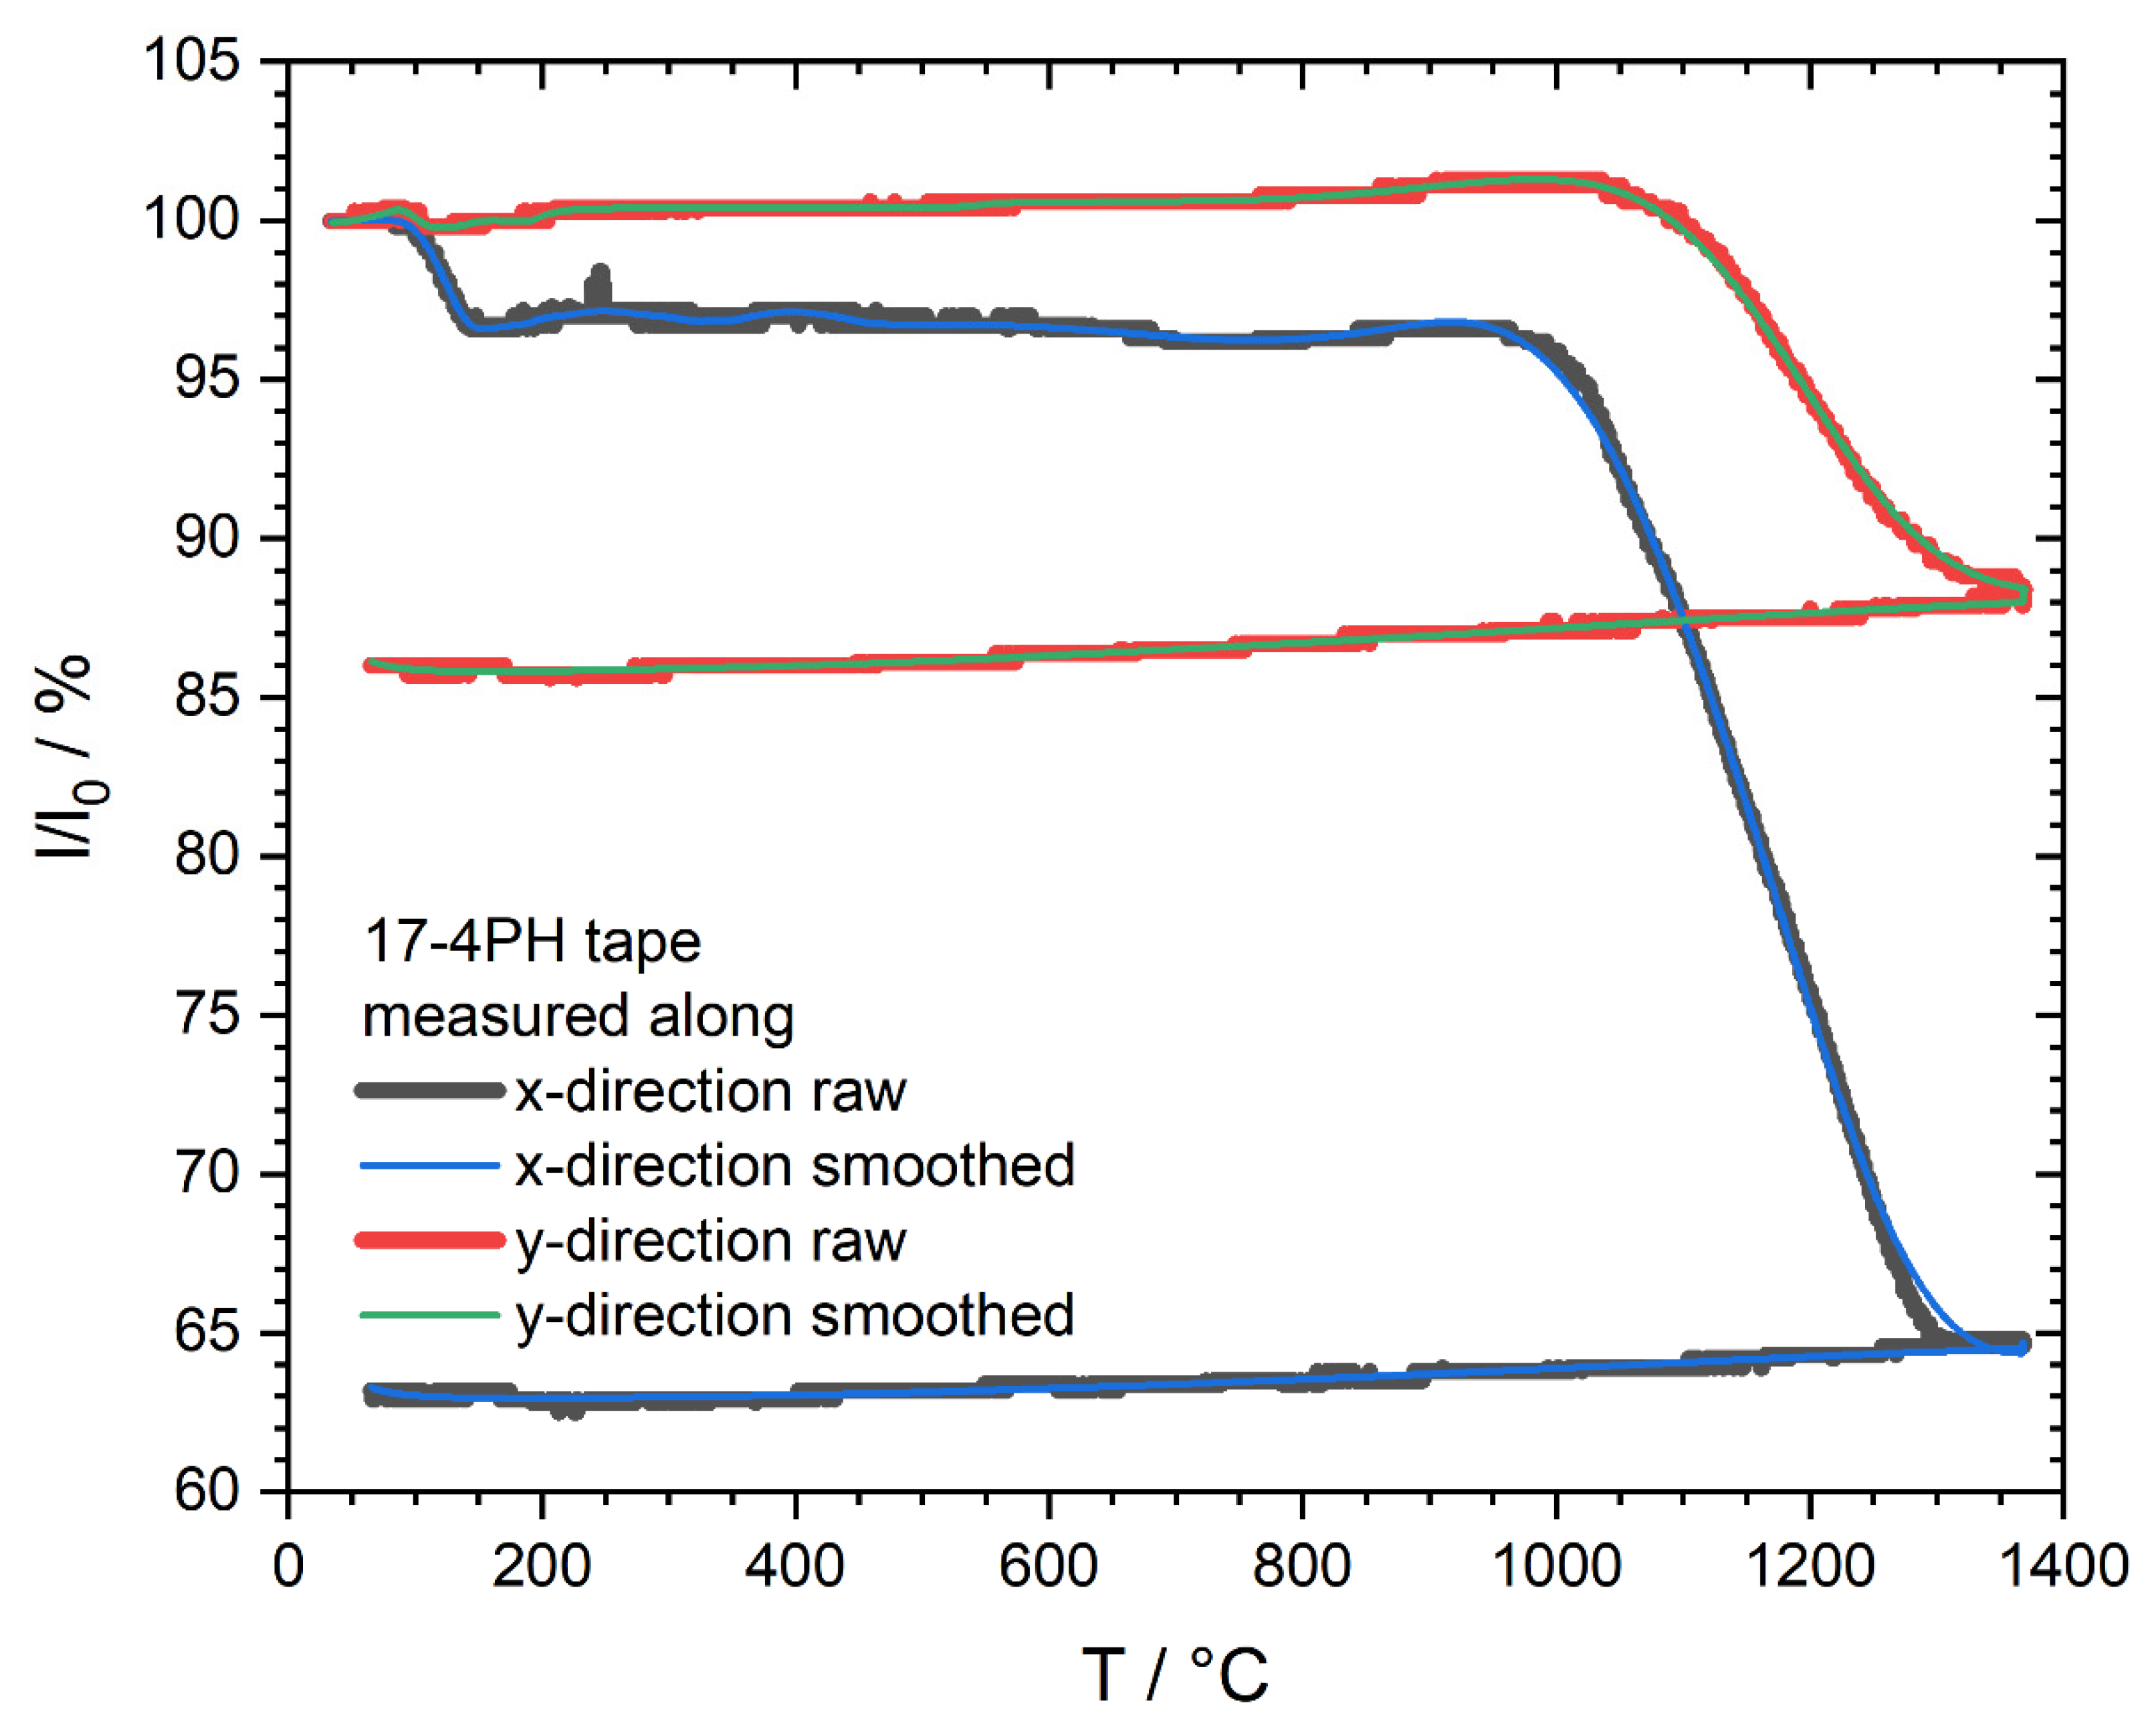
Comparison of raw (bold line) and smoothed (thin line) data of the relative length for flat lying 17-4PH tapes between room temperature and 1370 °C measured via optical dilatometry. The black and red curves were determined by measuring the sample length in the x- and y-directions.
Figure A3.
Comparison of raw (bold line) and smoothed (thin line) data of the relative length for flat lying 17-4PH tapes between room temperature and 1370 °C measured via optical dilatometry. The black and red curves were determined by measuring the sample length in the x- and y-directions.
Appendix B
Calculation of Actual Shrinkage of a Warped 17-4PH Tape
In this example, the approximation for the final (sintered) state of a lying 17-4PH tape measured along the x-direction using optical dilatometry is calculated.
Since only ratios (relative changes) are considered, it is not necessary to convert into a length measure. For the estimation it is sufficient to calculate with the respective number of pixels.
First step for the approximation is to get the pixel coordinates (by counting pixels) from silhouette images of the sample in initial and final (sintered) state. The coordinates should be chosen carefully, especially obtaining the neutral axis. The data were gathered with help of the Digitizer, a tool in the Origin software. The Figure B1 and Figure B2 show the pictures with marked coordinates. In this work the picture size was 320 × 240 pixel. The picked data are listed in Table B1.
Figure B1.
Silhouette of the 17-4PH tape initial state with the picked date (red dots) along the neutral axis along the x-direction of the tape.
Figure B1.
Silhouette of the 17-4PH tape initial state with the picked date (red dots) along the neutral axis along the x-direction of the tape.
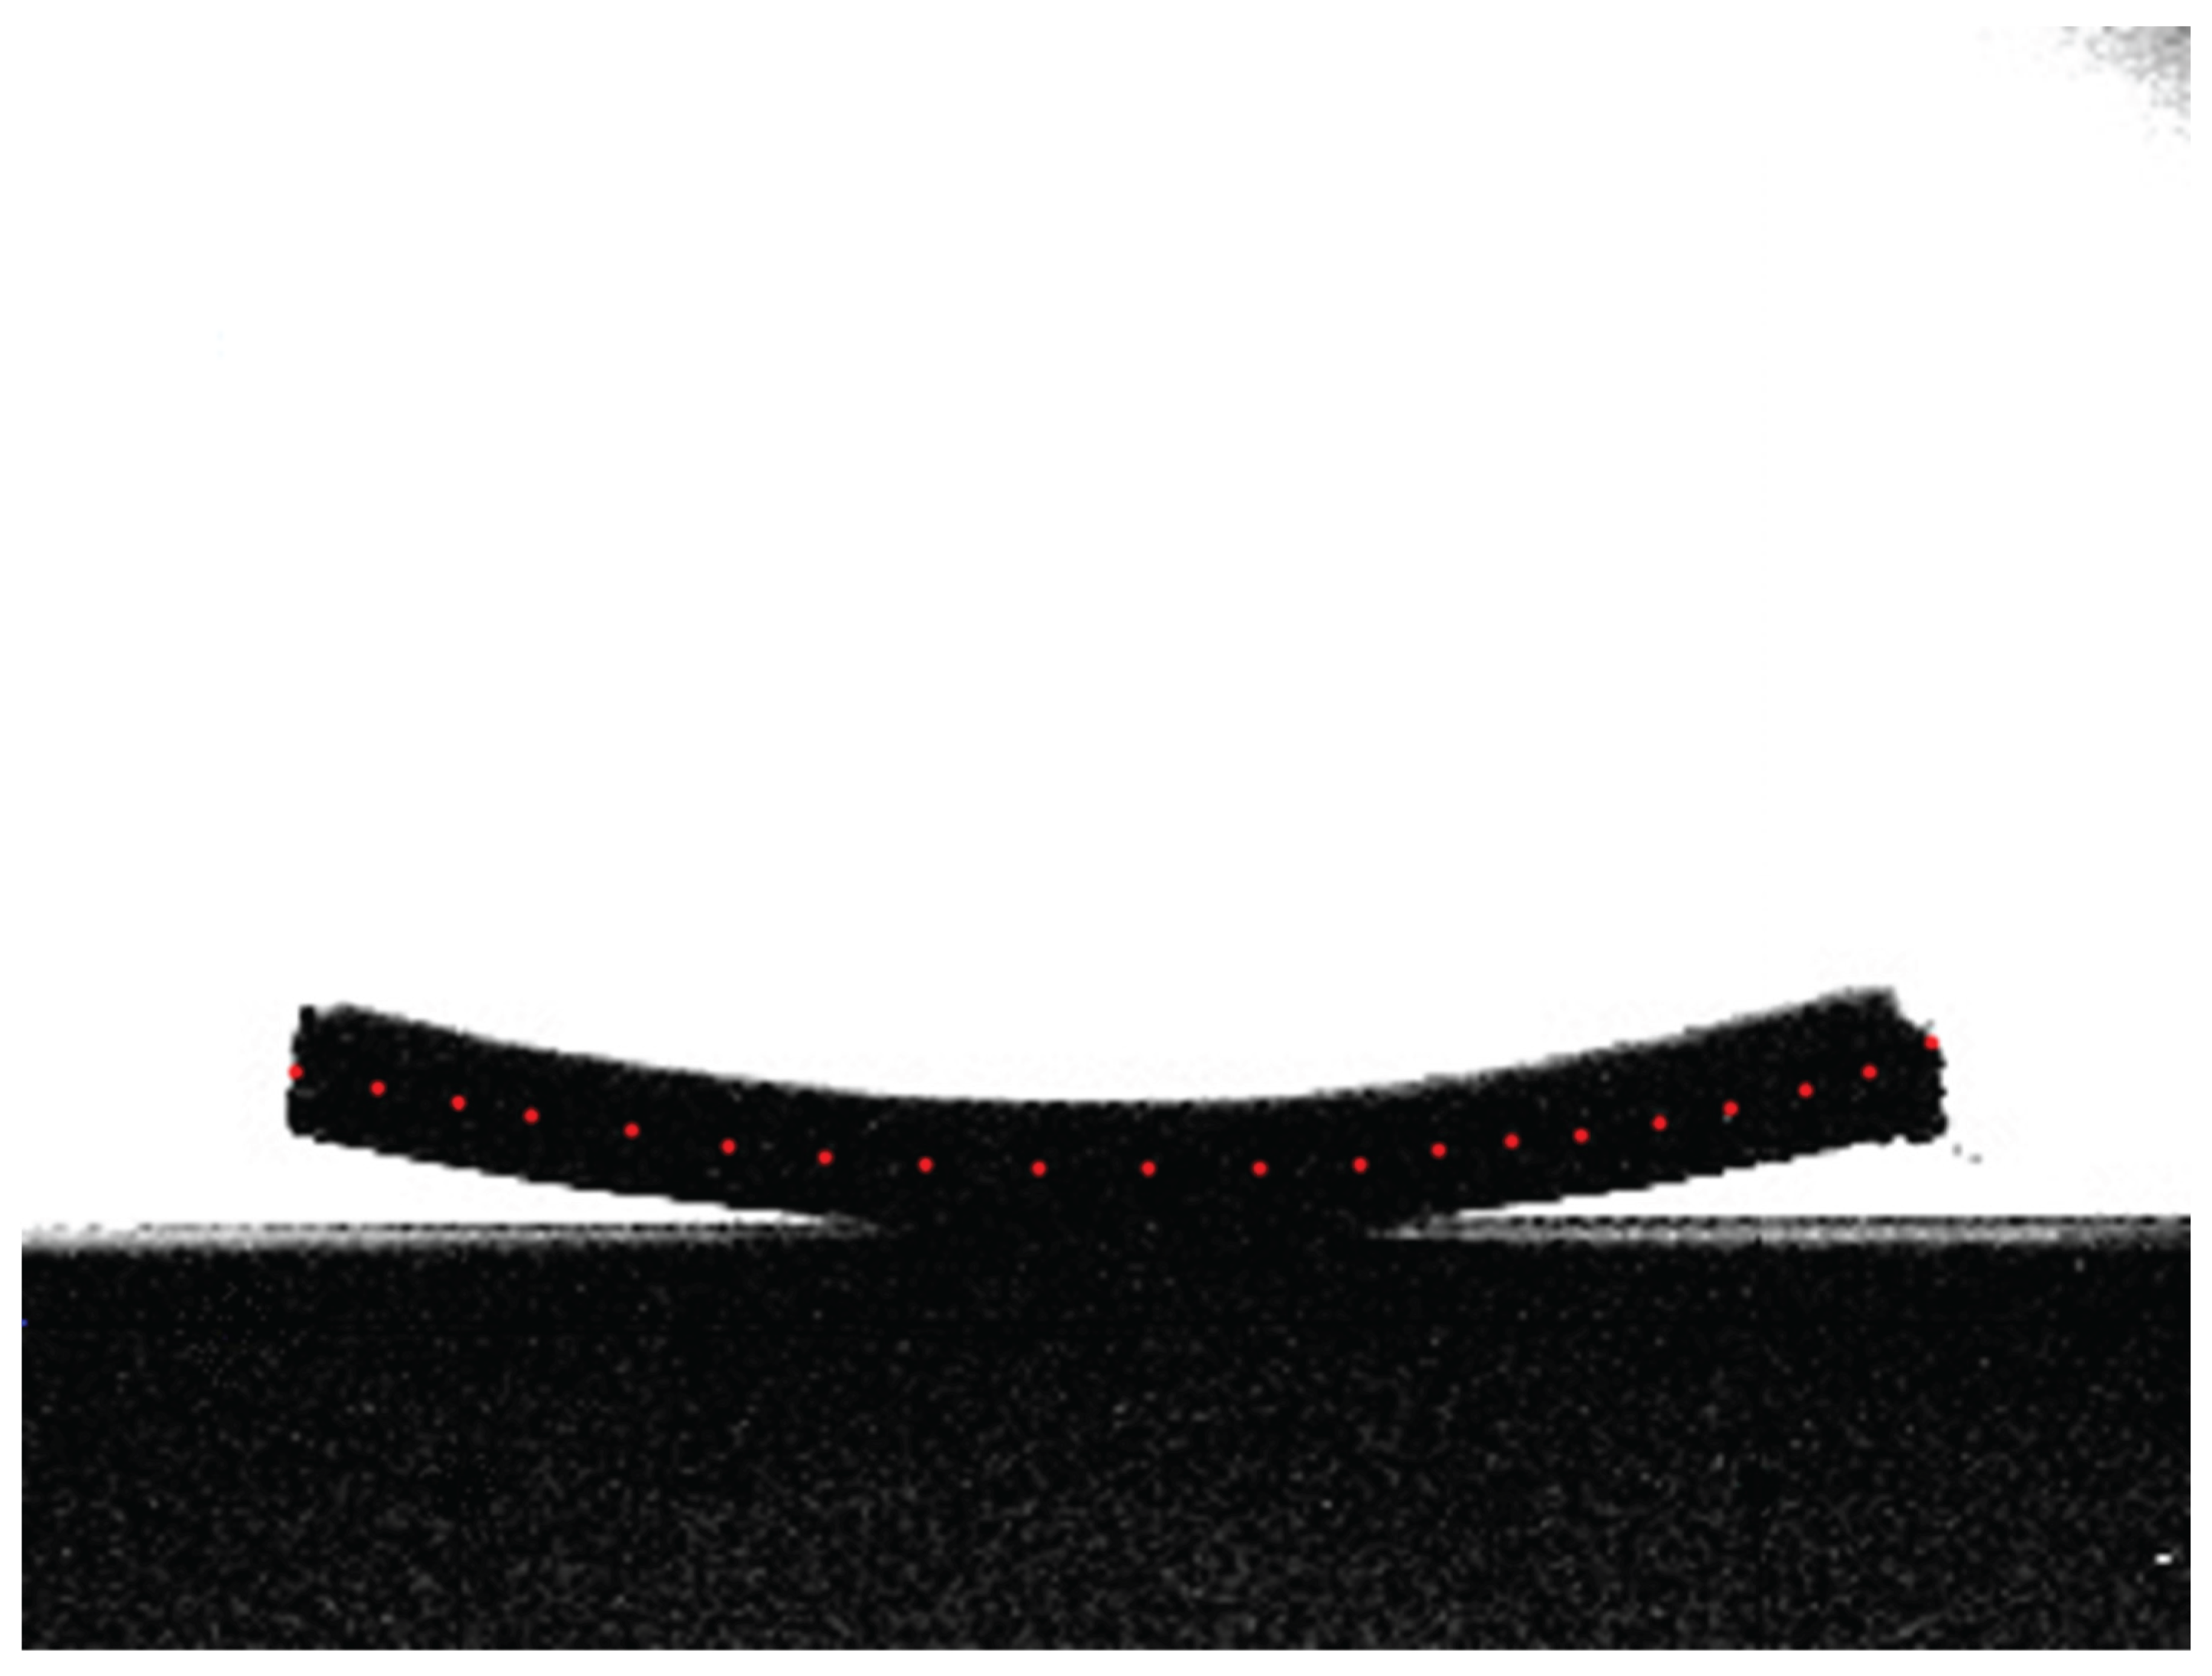
Figure B2.
Silhouette of the warped final (sintered) 17-4PH tape with the picked date (red dots) along the neutral axis along the x-direction of the tape.
Figure B2.
Silhouette of the warped final (sintered) 17-4PH tape with the picked date (red dots) along the neutral axis along the x-direction of the tape.
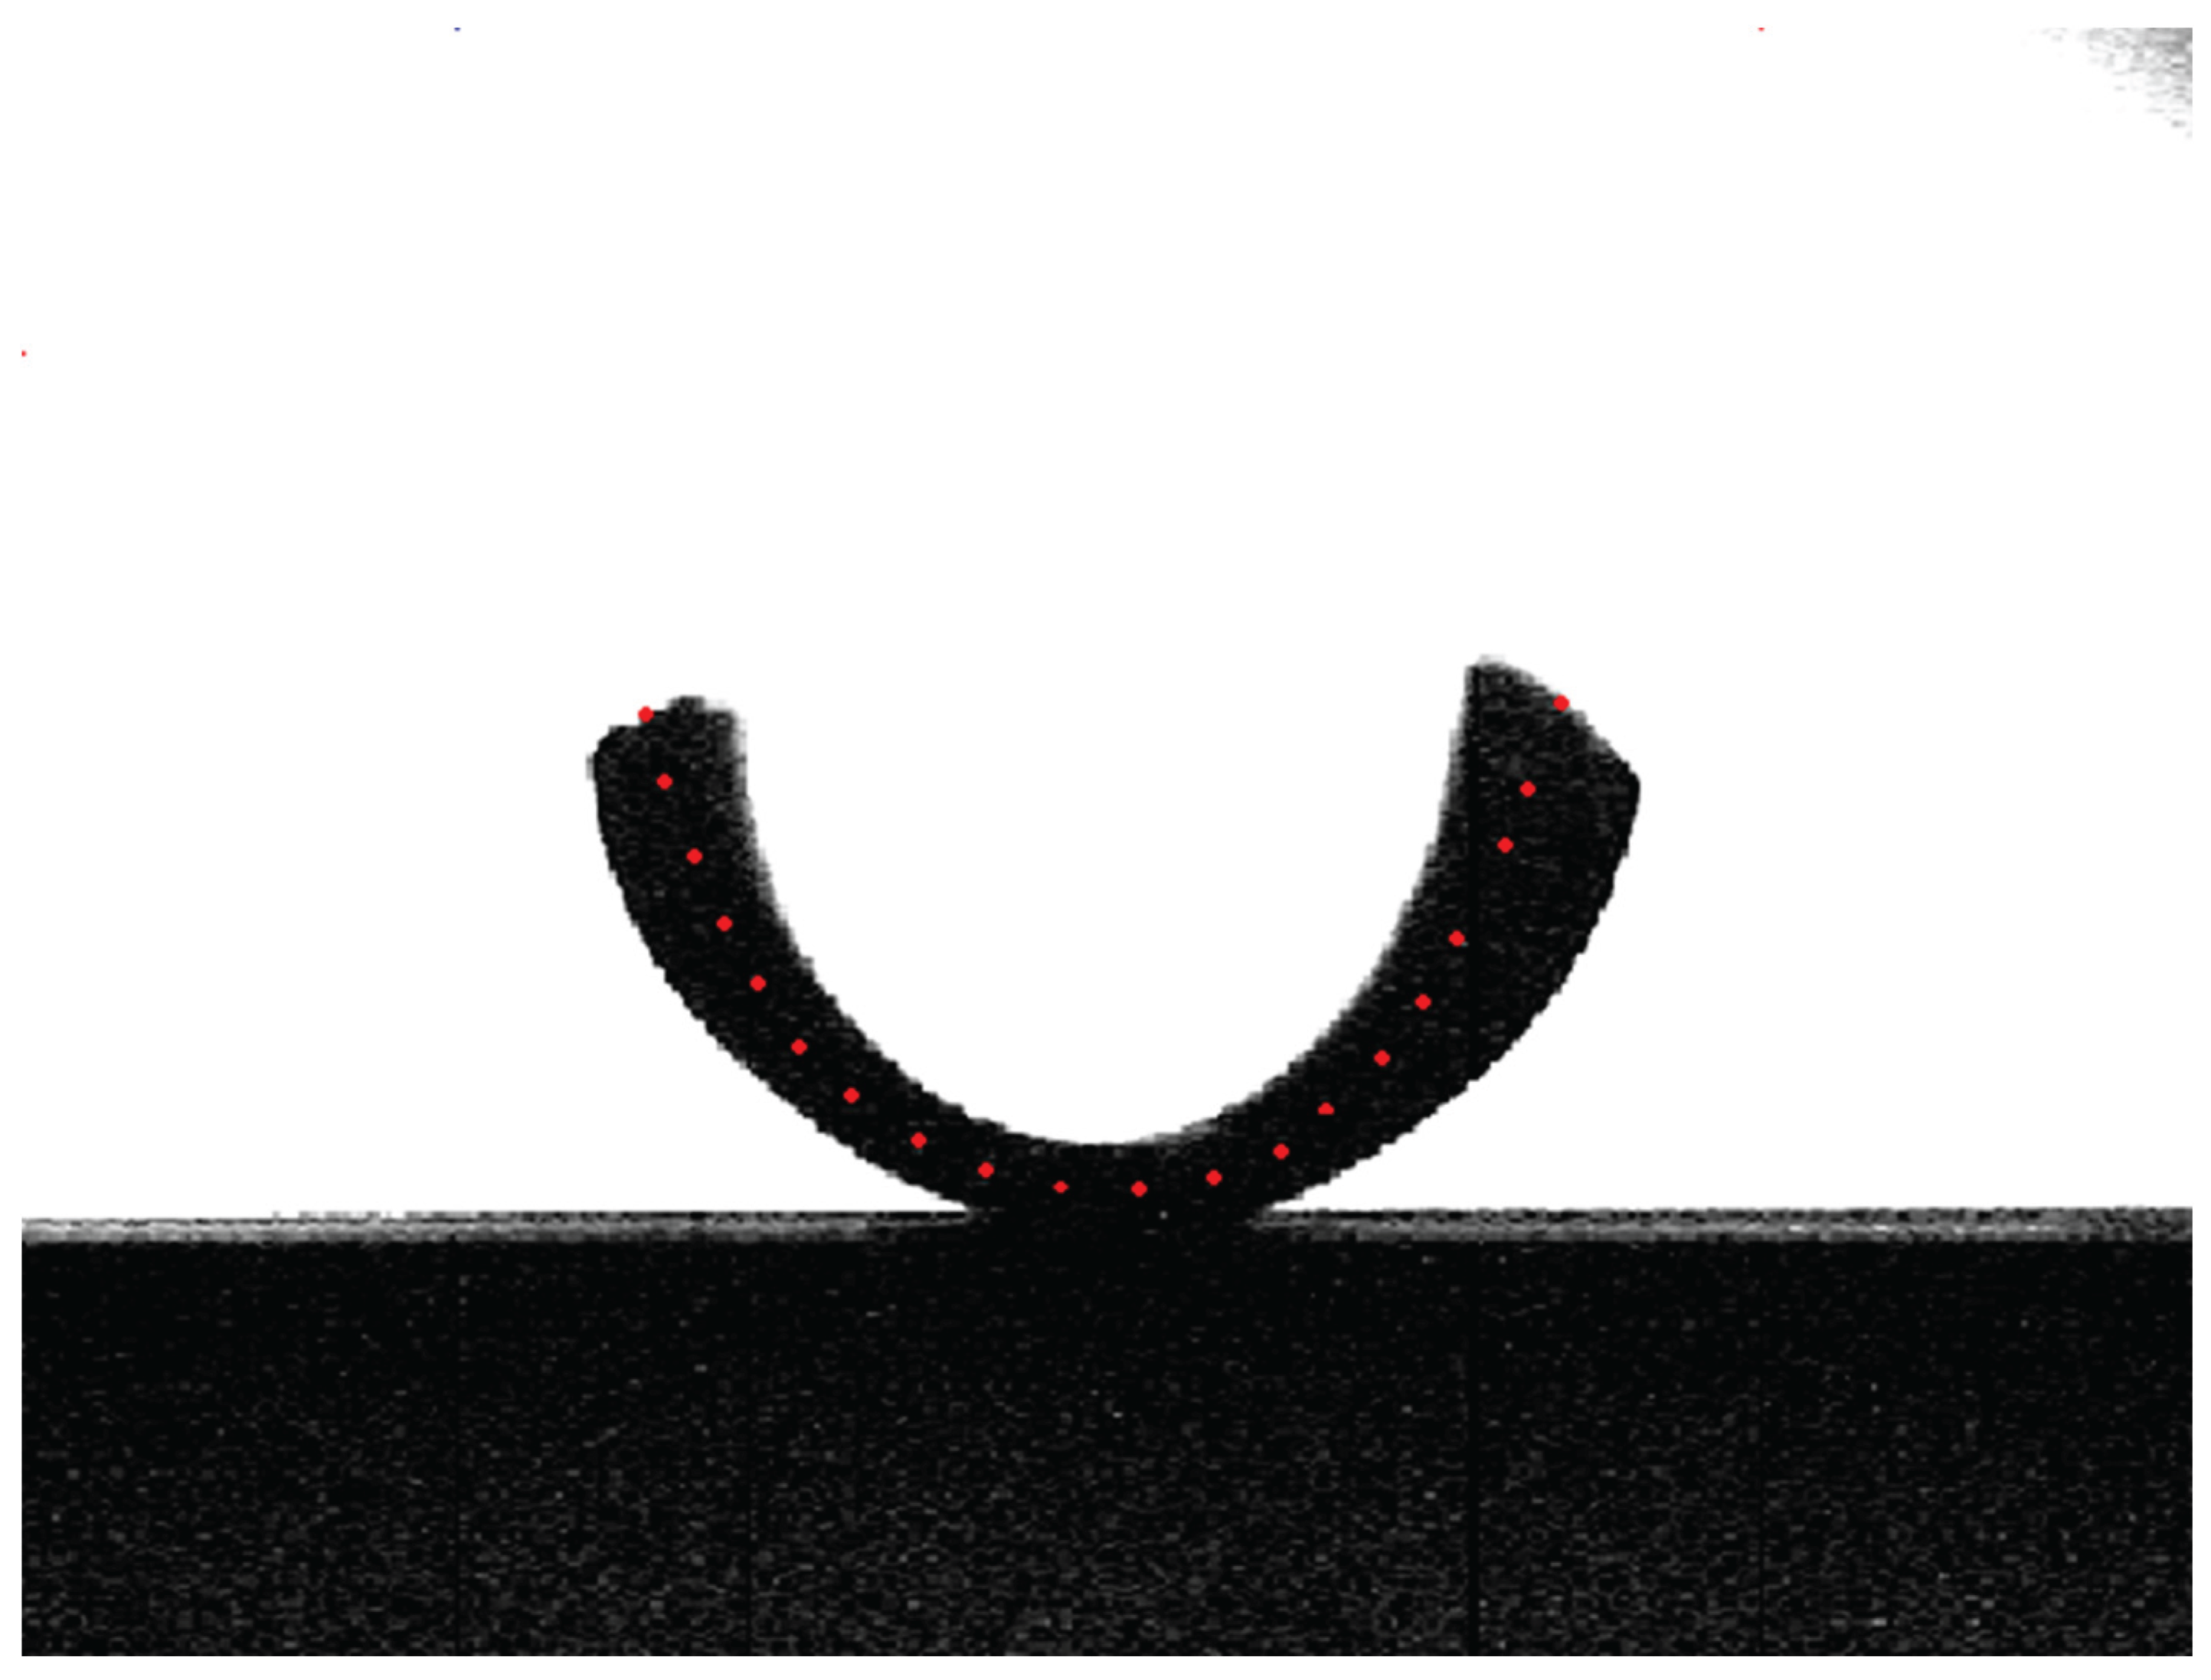

Table B1.
Picked coordinate data in number of pixels.
| Initial state | Final state | ||||||||||
| No. | x | y | No. | x | y | No. | x | y | No. | x | y |
| 1 | 40.4 | 85.2 | 11 | 182.6 | 70.9 | 1 | 92.2 | 138.5 | 11 | 164.4 | 68.9 |
| 2 | 52.5 | 82.7 | 12 | 197.4 | 71.5 | 2 | 94.8 | 129.0 | 12 | 175.6 | 70.3 |
| 3 | 64.4 | 80.6 | 13 | 209.0 | 73.6 | 3 | 99.2 | 117.6 | 13 | 185.5 | 74.4 |
| 4 | 75.1 | 78.7 | 14 | 219.8 | 74.9 | 4 | 103.4 | 108.1 | 14 | 192.2 | 80.2 |
| 5 | 90.0 | 76.6 | 15 | 230.0 | 75.8 | 5 | 108.5 | 99.0 | 15 | 200.5 | 88.1 |
| 6 | 104.2 | 74.2 | 16 | 241.6 | 77.6 | 6 | 114.8 | 89.8 | 16 | 206.6 | 96.5 |
| 7 | 118.5 | 72.6 | 17 | 252.1 | 79.8 | 7 | 122.0 | 82.6 | 17 | 211.7 | 105.6 |
| 8 | 133.3 | 71.5 | 18 | 263.2 | 82.5 | 8 | 131.9 | 75.9 | 18 | 218.7 | 119.4 |
| 9 | 150.0 | 70.9 | 19 | 272.6 | 85.2 | 9 | 142.1 | 71.7 | 19 | 222.1 | 127.6 |
| 10 | 166.2 | 70.9 | 20 | 281.7 | 89.4 | 10 | 153.0 | 69.1 | 20 | 227.0 | 140.5 |
| … | … | … | … | … | … | ||||||
In the second step the initial length of the initial state is calculated using the following expression in the Origin software, corresponding to Equation (1)
and yields . The integration interval corresponds to , the first and last x-coordinates of the initial state (see Table B1).
IntegrateXY(Col(x);sqrt(1+DerivativeXY(Col(x);Col(y);1)^2))
In the third step, the length of the final state is calculated using the same Origin expression as for the initial state, but choosing the integration interval corresponding to , the first and last x-coordinates of the final state (see Table B1). This gives .
Finally, the approximate shrinkage is calculated with and using Equation (3).
This procedure can be done for other temperatures of interest, e.g., during sintering.
Since the original data are discrete, a pair of adjacent values is used to form a trapezoid to approximate the area under the curve segment defined by two points. To numerically integrate the definite integral, the Origin software uses the following approximation function [31].
Where n is the number of points. The following is the derivative function applied to the discrete data points by the Origin software [32].
In a simpler way, the length can also be calculated using the distance between two data points and the subsequent summation of the distances. The following equation was used for this.
This gives and , resulting in . If more points are used, the result can be more accurate. Figure B3 compares the curves calculated by the two calculation methods.
Figure B3.
Comparison of results for actual shrinkage (for a lying 17-4PH tape measured in the x-direction) calculated using the arc length equation (squares) and using the summation of the distance between two points (circles).
Figure B3.
Comparison of results for actual shrinkage (for a lying 17-4PH tape measured in the x-direction) calculated using the arc length equation (squares) and using the summation of the distance between two points (circles).
Appendix C
Comparison of Curves Without Normalization
Figure C1 and Figure C2 compare the data from Figure 12 and Figure 19, respectively, without normalization at 900 °C.
Figure C1.
Relative length (solid lines) and relative length change rate (dashed lines) of rolled 17-4PH tapes measured in an optical dilatometer (blue) and push-rod dilatometer (green) between 900 °C and 1370 °C. Both curves were obtained by measuring the change in length corresponding to the y-direction of the tapes (perpendicular to the moving direction of the doctor blade).
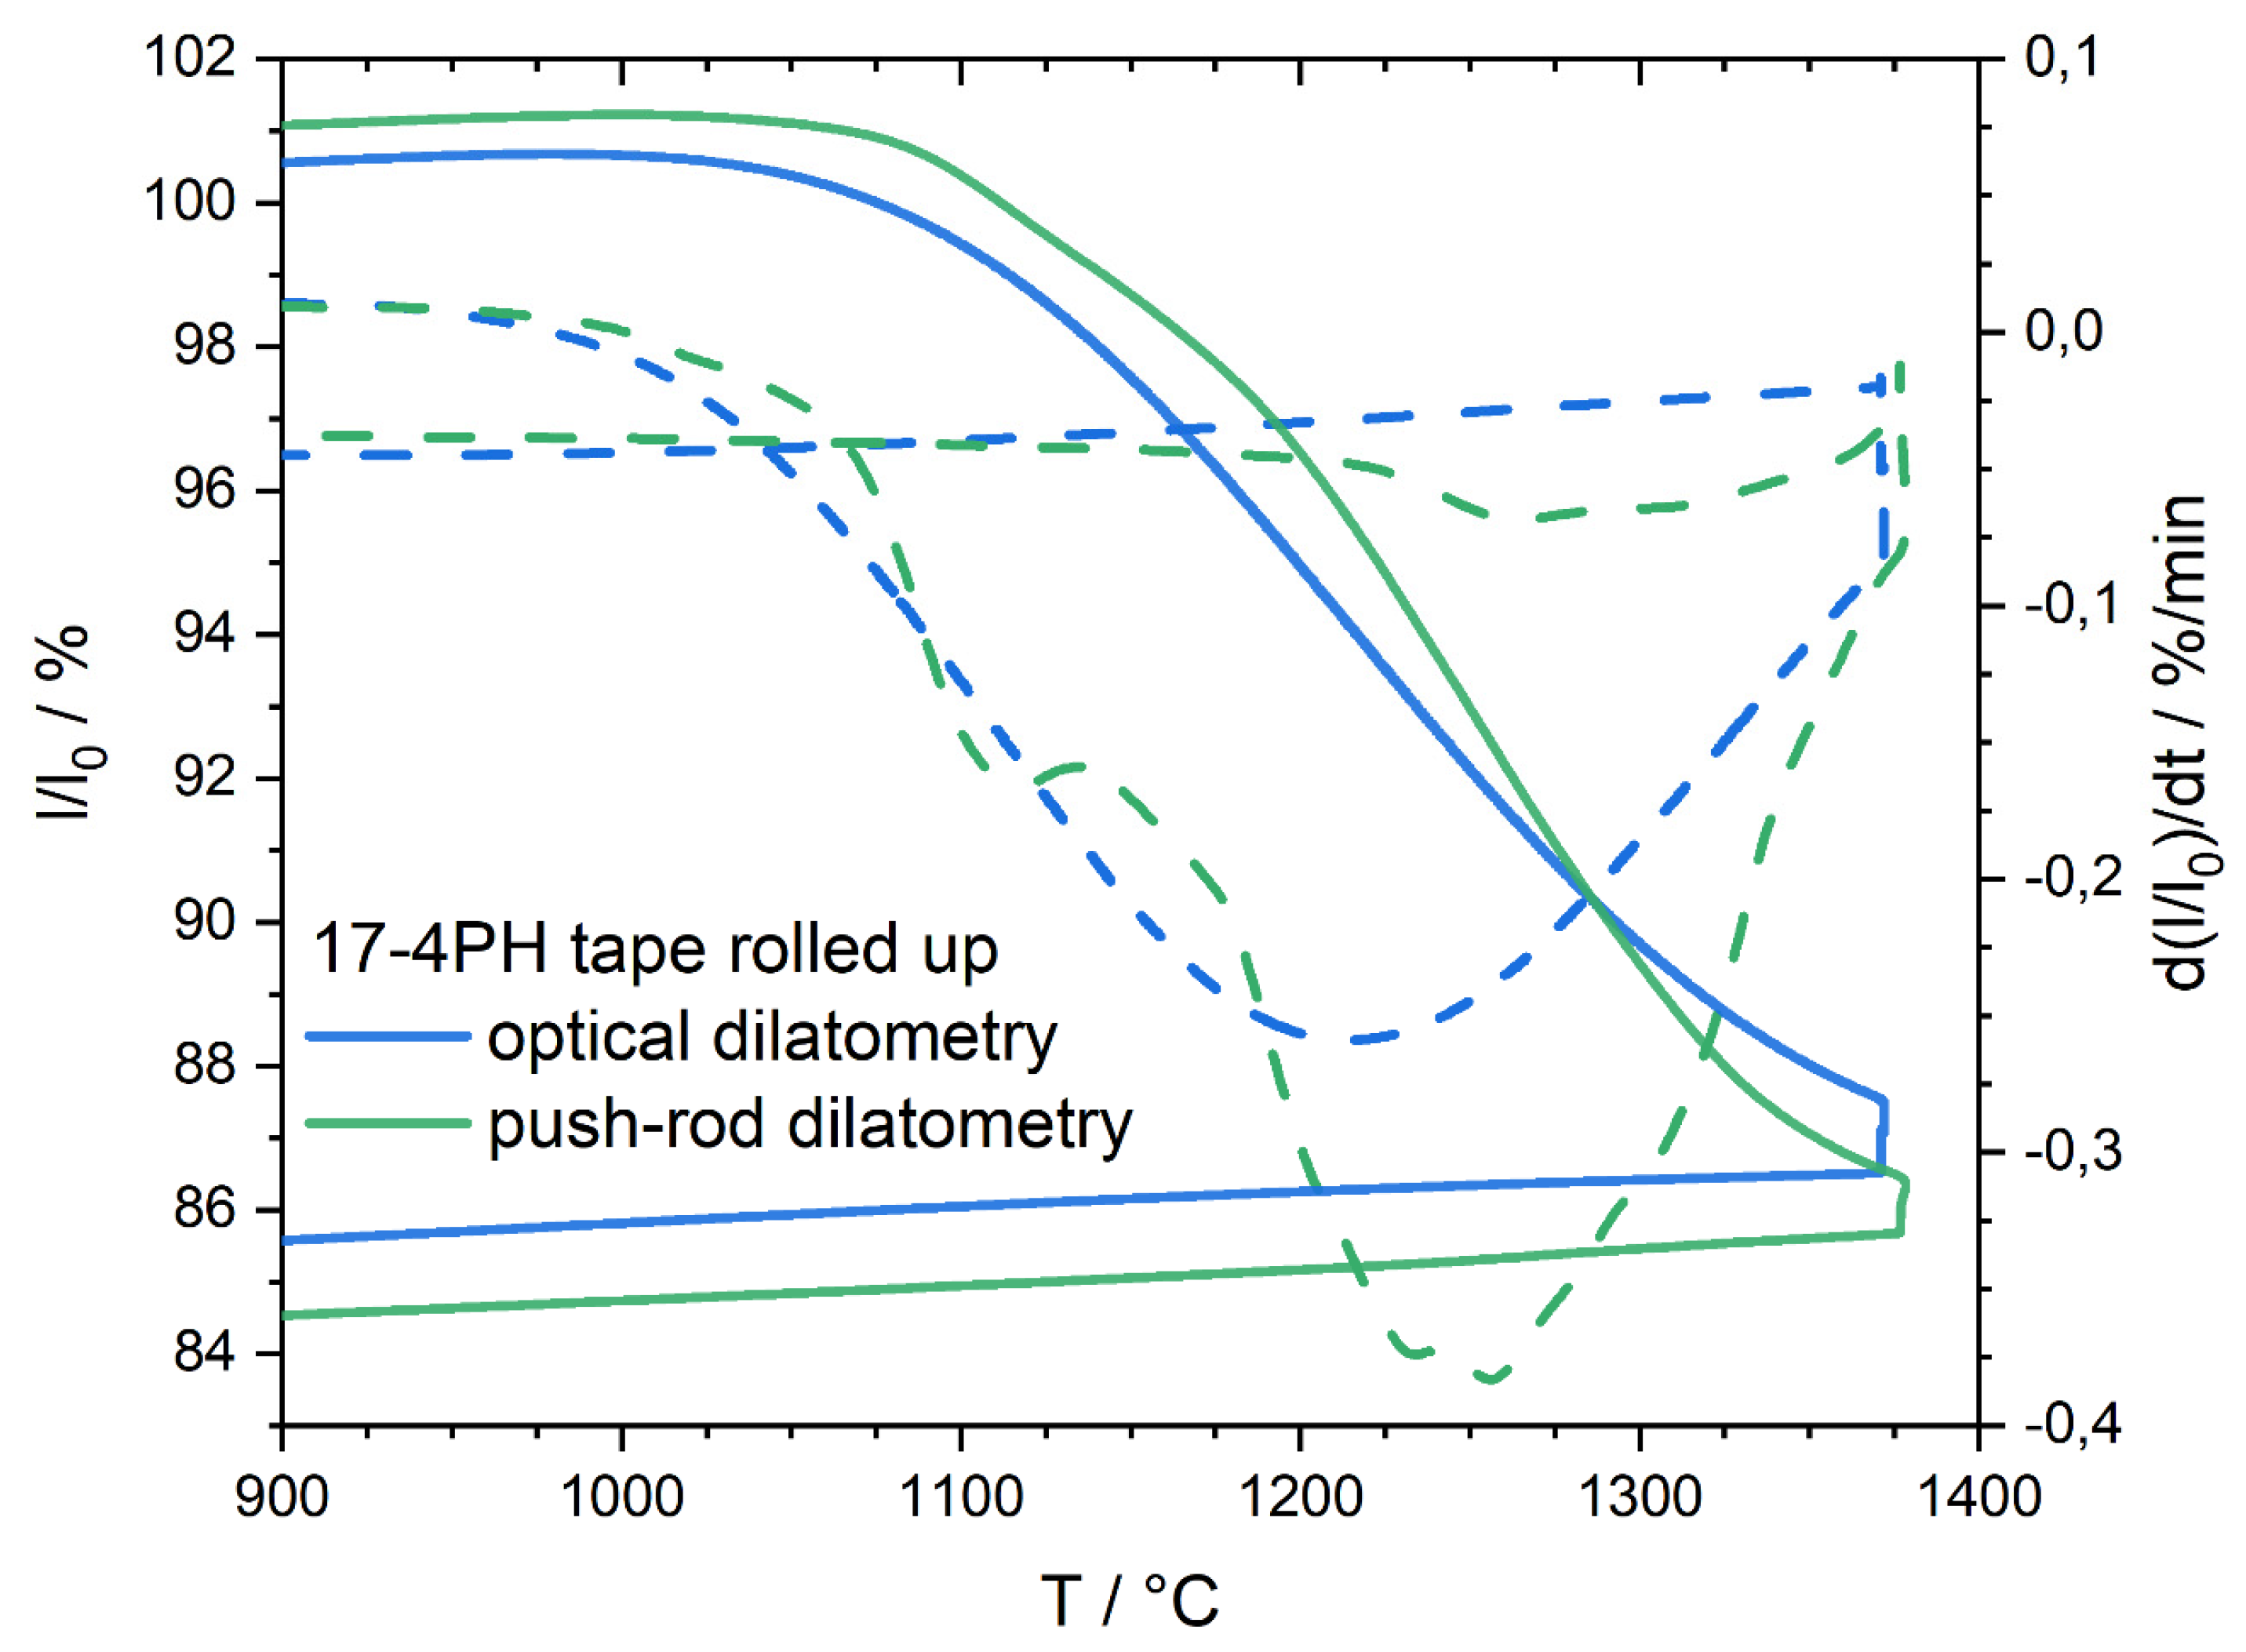
Figure C2.
Relative length (solid lines) and relative length change rate (dashed lines) of rolled TZ-3YS-E tapes measured in an optical dilatometer (blue) and push-rod dilatometer (green) between 900 °C and 1370 °C. Both curves were obtained by measuring the change in length corresponding to the y-direction of the tapes (perpendicular to the moving direction of the doctor blade).
Appendix D
How to Determine the Characteristic Temperatures
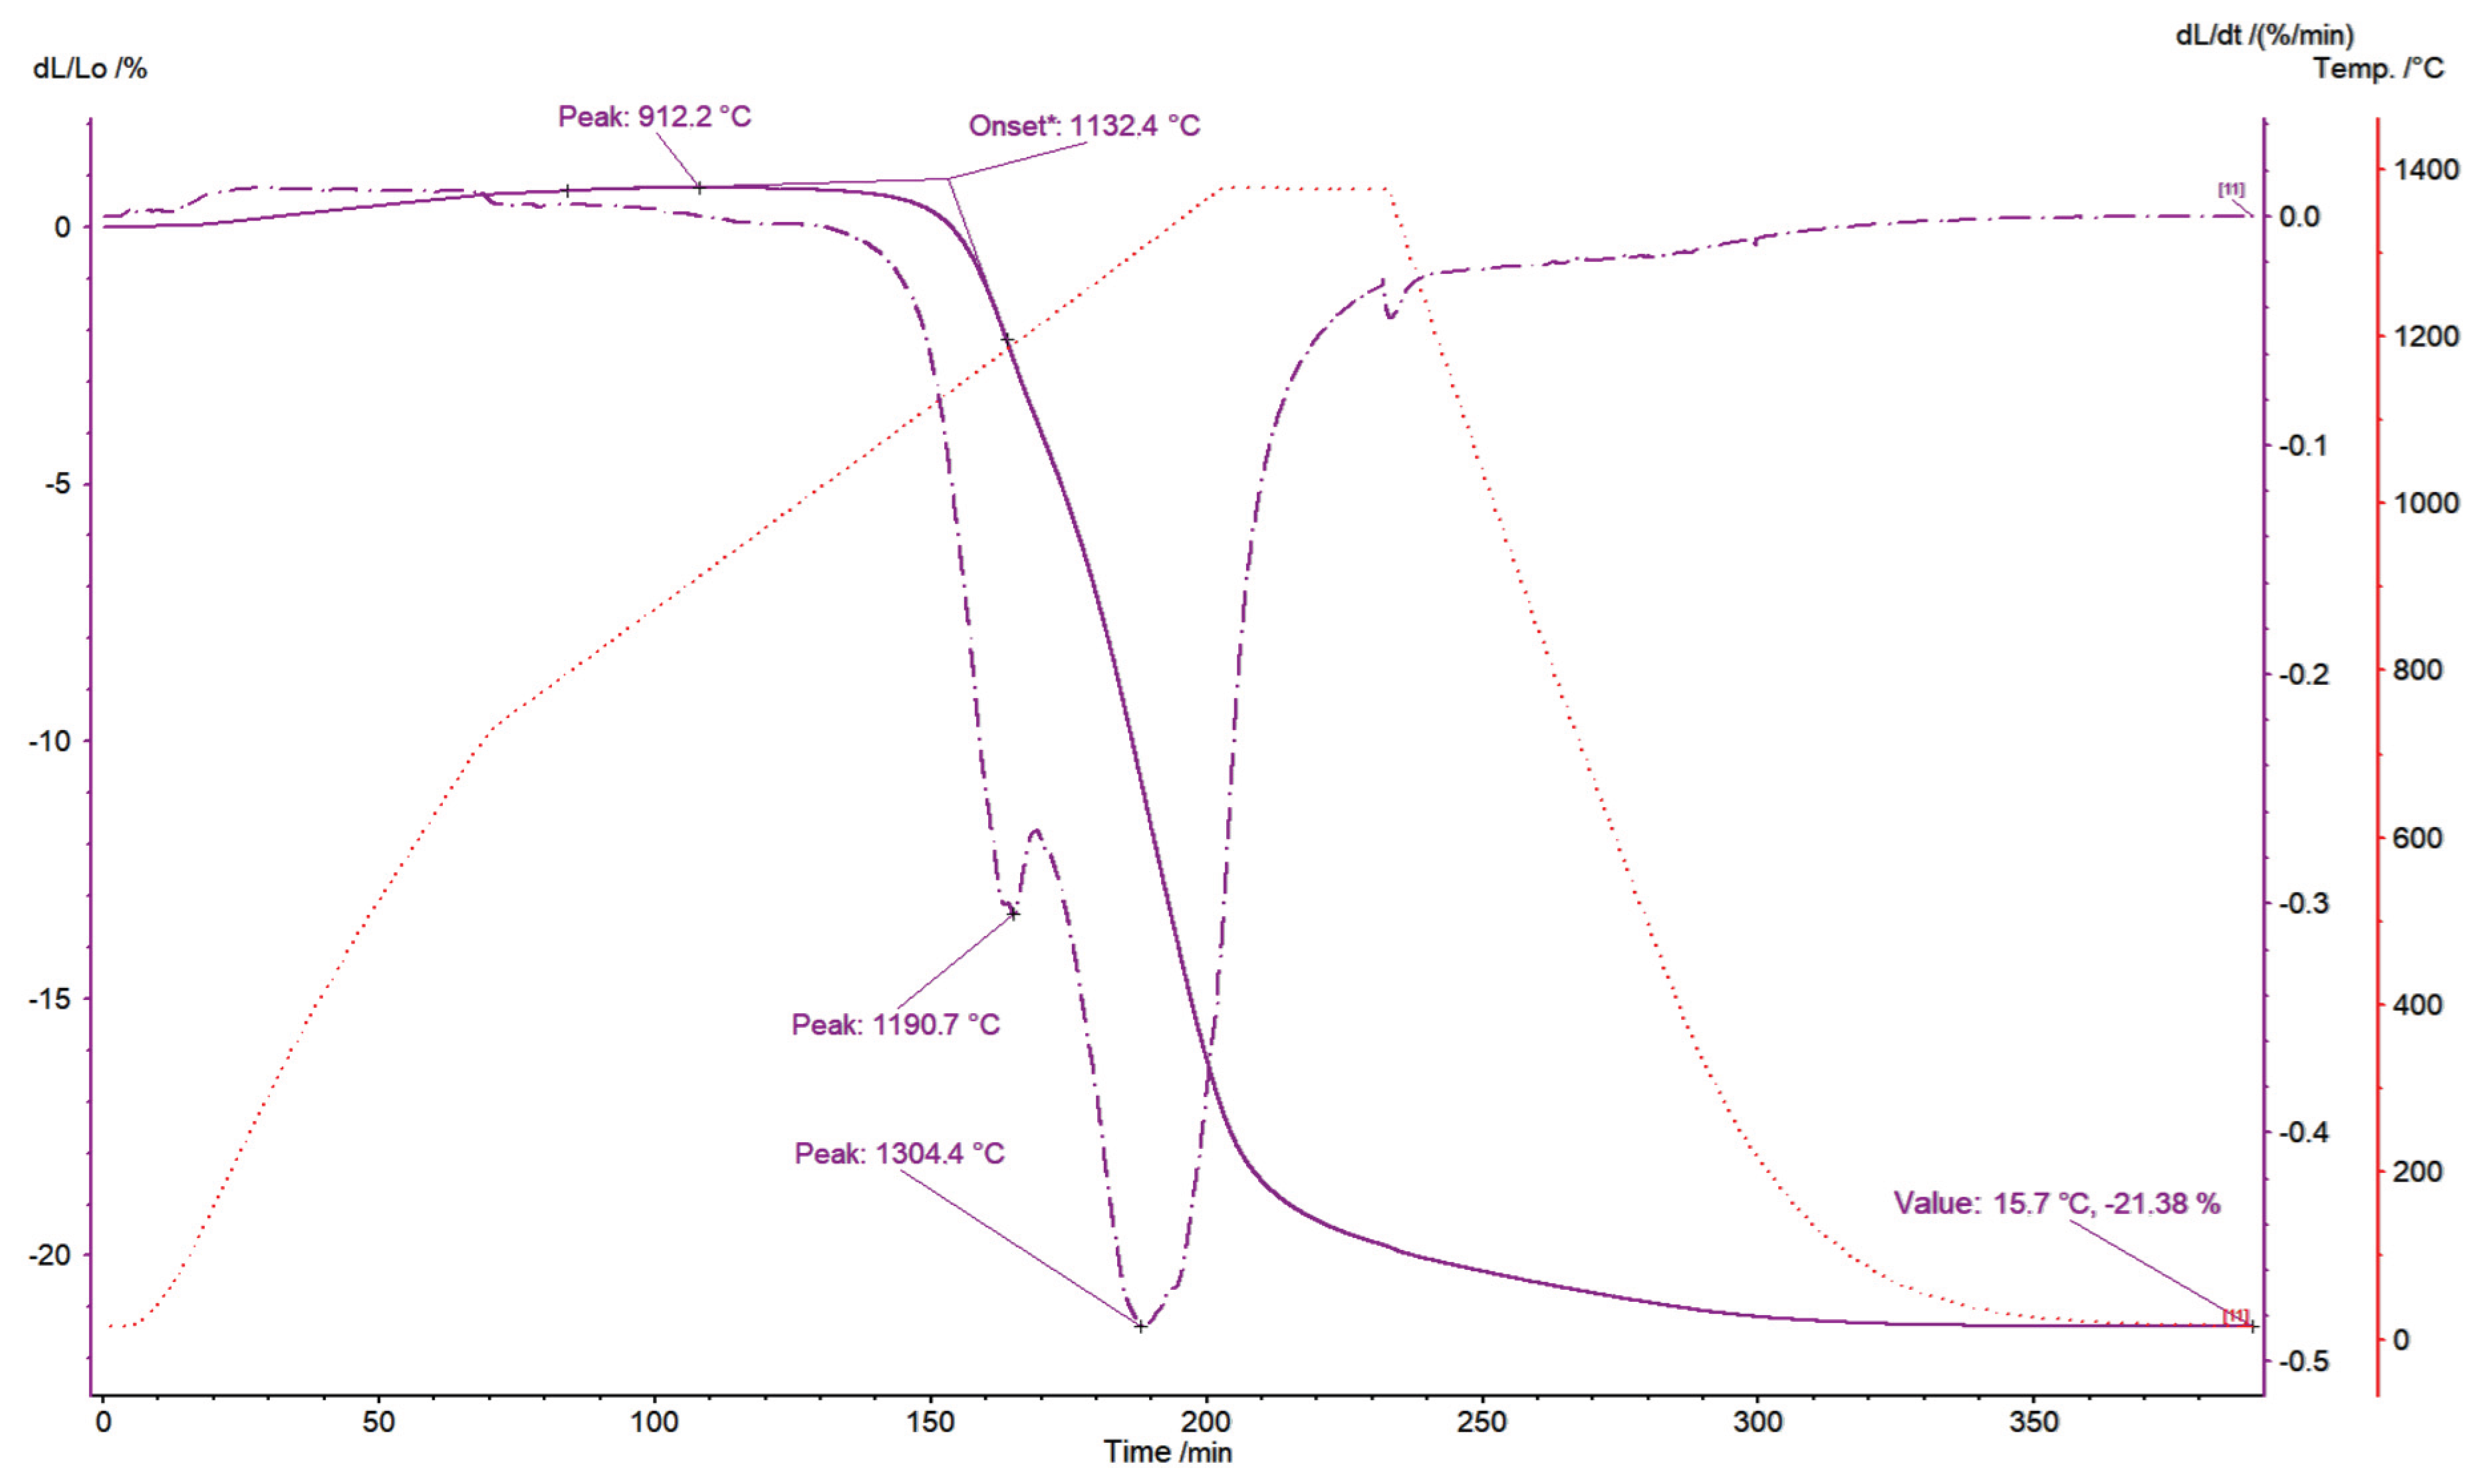
To illustrate the characteristic temperatures (peak of the relative length change: initial shrinkage, onset: start of accelerated sintering, peak of relative length change rate: maximum sintering rate) and the total shrinkage for discussion of the sintering process, a shrinkage curve of a ceramic tape typical for push-rod dilatometry is shown in Figure D1. The double tangent extrapolation method is used to determine the onset of accelerated sintering. When there is an additional local maximum in the relative length change rate, the onset temperature for accelerated sintering is extrapolated from this maximum rather than from the maximum relative length change rate.
Figure D1.
Shrinkage curve of a ceramic tape taken by the push-rod dilatometer. The solid line represents the linear length change, the dashed-dotted line the relative length change rate and the red dotted line the temperature. The characteristic data points used for the characterization of the sintering process from dilatometric experiments are shown. The total shrinkage is marked as value. Because of the additional local maximum in the relative length change rate, the onset temperature for accelerated sintering is extrapolated from this maximum rather than the maximum relative length change rate.
References
- Duan, C.; Tong, J.; Shang, M.; Nikodemski, S.; Sanders, M.; Ricote, S.; Almansoori, A.; O'Hayre, R. Readily processed protonic ceramic fuel cells with high performance at low temperatures. Science 2015, 349, 1321–1326. [Google Scholar] [CrossRef] [PubMed]
- Krishnan, V.V. Recent developments in metal-supported solid oxide fuel cells. Wiley Interdisciplinary Reviews: Energy and Environment 2017, 6, e246. [Google Scholar] [CrossRef]
- Tucker, M.C. Progress in metal-supported solid oxide electrolysis cells: A review. International Journal of Hydrogen Energy 2020, 45, 24203–24218. [Google Scholar] [CrossRef]
- Hagen, A.; Caldogno, R.; Capotondo, F.; Sun, X. Metal Supported Electrolysis Cells. Energies 2022, 15, 2045. [Google Scholar] [CrossRef]
- Minota-Yepes, I.C.; Álvarez-Roca, R.; Londoño-Badillo, F.A. Review: Densification process of ceramic materials. Respuestas 2020, 25, 199–212. [Google Scholar] [CrossRef]
- Guillon, O.; Gonzalez-Julian, J.; Dargatz, B.; Kessel, T.; Schierning, G.; Räthel, J.; Herrmann, M. Field-Assisted Sintering Technology/Spark Plasma Sintering: Mechanisms, Materials, and Technology Developments. Advanced Engineering Materials 2014, 16, 830–849. [Google Scholar] [CrossRef]
- Oghbaei, M.; Mirzaee, O. Microwave versus conventional sintering: A review of fundamentals, advantages and applications. Journal of Alloys and Compounds 2010, 494, 175–189. [Google Scholar] [CrossRef]
- Kuang, X.; Carotenuto, G.; Nicolais, L. A Review of Ceramic Sintering and Suggestions on Reducing Sintering Temperatures. Advanced Performance Materials 1997, 4, 257–274. [Google Scholar] [CrossRef]
- Varela, J.A.; Whittemore, O.J.; Longo, E. Pore size evolution during sintering of ceramic oxides. Ceramics International 1990, 16, 177–189. [Google Scholar] [CrossRef]
- Olevsky, E.A. Theory of sintering: from discrete to continuum. Materials Science and Engineering: R: Reports 1998, 23, 41–100. [Google Scholar] [CrossRef]
- Raether, F.; Seifert, G.; Ziebold, H. Simulation of Sintering across Scales. Adv. Theory Simul. 2019, 2, 1900048. [Google Scholar] [CrossRef]
- Yi, M.; Wang, W.; Xue, M.; Gong, Q.; Xu, B.-X. Modeling and Simulation of Sintering Process Across Scales. Arch Computat Methods Eng 2023, 30, 3325–3358. [Google Scholar] [CrossRef]
- H Camacho Montes; Y Espinosa Almeyda; J D Gamboa Garay; L E Barraza De León; R K Bordia. Ceramic Sintering And Properties Characterization Based On Solid Mechanics. In . Ceramic sintering and propertiescharacterization based on solid mechanics - TechConnect Briefs, 2022.
- Bordia, R.K.; Scherer, G.W. On constrained sintering—I. Constitutive model for a sintering body. Acta Metallurgica 1988, 36, 2393–2397. [Google Scholar] [CrossRef]
- Bordia, R.K.; Scherer, G.W. On constrained sintering—II. Comparison of constitutive models. Acta Metallurgica 1988, 36, 2399–2409. [Google Scholar] [CrossRef]
- Bordia, R.K.; Scherer, G.W. On constrained sintering—III. Rigid inclusions. Acta Metallurgica 1988, 36, 2411–2416. [Google Scholar] [CrossRef]
- Jankula, M.; Šín, P.; Podoba, R.; Ondruška, J. Typical problems in push-rod dilatometry analysis. Epitoanyag-JSBCM 2013, 65, 11–14. [Google Scholar] [CrossRef]
- Jagota, A.; Mikeska, K.R.; Bordia, R.K. Isotropic Constitutive Model for Sintering Particle Packings. Journal of the American Ceramic Society 1990, 73, 2266–2273. [Google Scholar] [CrossRef]
- Scherer, G.W. Viscous Sintering under a Uniaxial Load. Journal of the American Ceramic Society 1986, 69, C-206-C-207. [Google Scholar] [CrossRef]
- Kim, D.; Lee, S.; Lee, S.-H.; Kwon, S. Measurement of Thermal Expansion over a Wide Range of Temperatures by a Pushrod Dilatometer. J. Korean Phys. Soc. 2020, 77, 496–504. [Google Scholar] [CrossRef]
- Yamada, N.; Abe, R.; Okaji, M. A calibration method for measuring thermal expansions with a push-rod dilatometer. Meas. Sci. Technol. 2001, 12, 2121–2129. [Google Scholar] [CrossRef]
- Wang, H.; Zhang, Y.Y.; He, G.H.; Wang, B.Q.; Zhou, B.L. A Contactless CCD Dilatometer for Foil Materials. Int J Thermophys 1999, 20, 743–753. [Google Scholar] [CrossRef]
- James, J.D.; Spittle, J.A.; Brown, S.G.R.; Evans, R.W. A review of measurement techniques for the thermal expansion coefficient of metals and alloys at elevated temperatures. Meas. Sci. Technol. 2001, 12, R1–R15. [Google Scholar] [CrossRef]
- Boccaccini, A.R.; Hamann, B. Review In Situ high-temperature optical microscopy. Journal of Materials Science 1999, 34, 5419–5436. [Google Scholar] [CrossRef]
- Paganelli, M. Using the Optical Dilatometer: To Determine Sintering Behavior. Amer Ceramic Soc 2002, 81, 25–30. [Google Scholar]
- Double Beam Optical Dilatometry: A Novel Research Tool For Ceramic Research; Mariano Paganelli, Ed. Qualicer, Castellón, 2004.
- Ayoub, H.; El-Sherif, A.; Hassan, H.; Khairy, S. Dilatometry of Refractory Metals and Alloys Using Multi- Wavelength Laser Shadowgraphy of Filament Samples. The International Conference on Mathematics and Engineering Physics 2018, 9, 1–10. [Google Scholar] [CrossRef]
- Kim, J.-S.; Rudkin, R.A.; Wang, X.; Atkinson, A. Constrained sintering kinetics of 3YSZ films. Journal of the European Ceramic Society 2011, 31, 2231–2239. [Google Scholar] [CrossRef]
- Tammann, G.; Scheil, E. Die Umwandlungen des Austenits und Martensits in gehärteten Stählen. Z. Anorg. Allg. Chem. 1926, 157, 1–21. [Google Scholar] [CrossRef]
- Nahass, P.; Pober, R.L.; Rhine, W.E.; Robbins, W.L.; Bowen, H.K. Prediction and Explanation of Aging Shrinkage in Tape-Cast Ceramic Green Sheets. J American Ceramic Society 1992, 75, 2373–2378. [Google Scholar] [CrossRef]
- Help Online - Origin Help - Integrieren. Available online: https://www.originlab.com/doc/de/Origin-Help/Math-Integrate (accessed on 17 November 2025).
- Help Online - Origin Help - Differenzieren. Available online: https://www.originlab.com/doc/de/Origin-Help/Math-Differentiate (accessed on 17 November 2025).
Figure 1.
Sample positioning for push-rod dilatometry. The sample is usually positioned horizontally between the push-rod and the sample holder.
Figure 1.
Sample positioning for push-rod dilatometry. The sample is usually positioned horizontally between the push-rod and the sample holder.
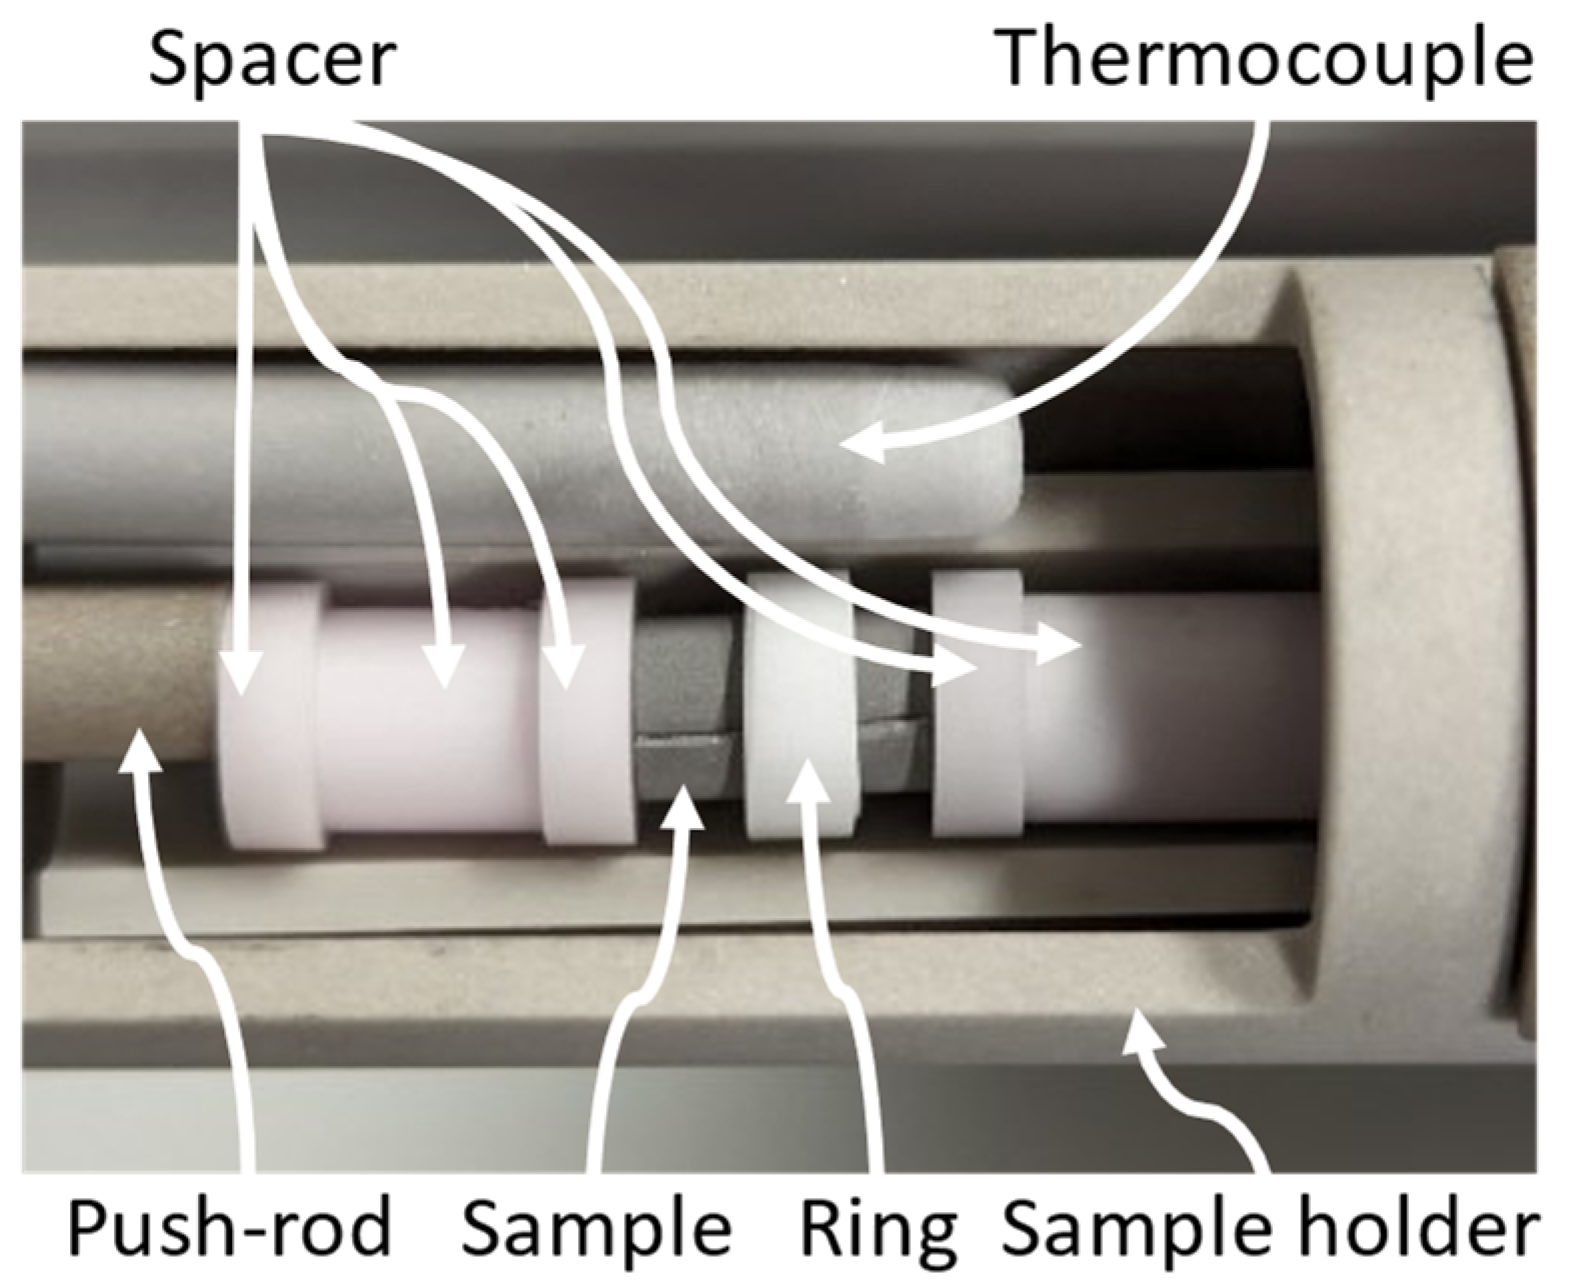
Figure 2.
Description of the tape orientation during tape casting (x-, y- and z-direction). The direction of the doctor blade movement (casting direction) is always the x-direction of the tape.
Figure 2.
Description of the tape orientation during tape casting (x-, y- and z-direction). The direction of the doctor blade movement (casting direction) is always the x-direction of the tape.
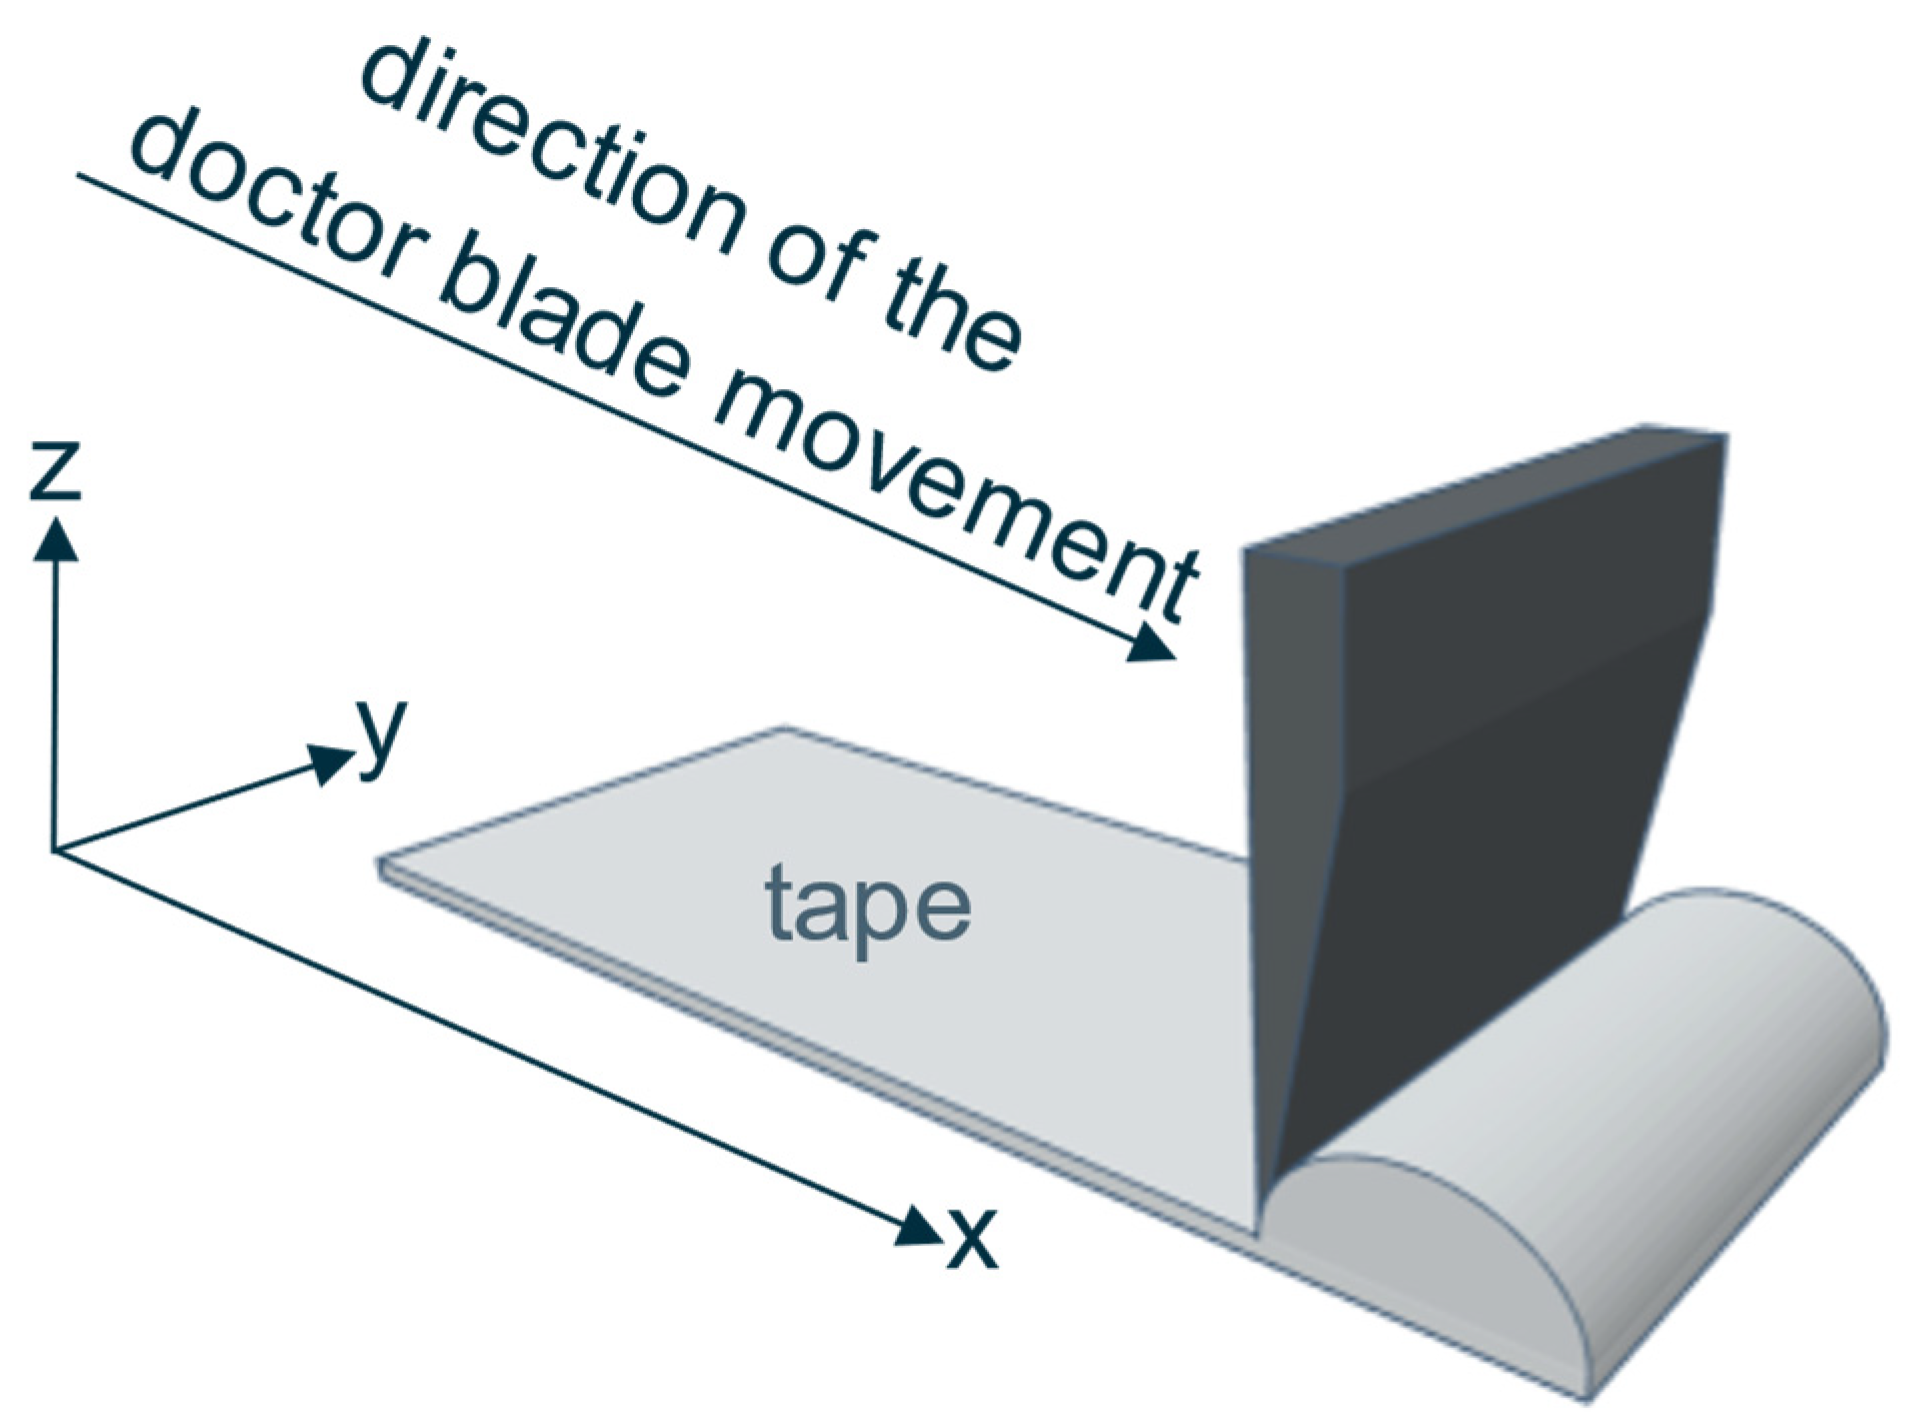
Figure 3.
Sample preparations for optical and push-rod dilatometry. In optical dilatometry, either the ring with the rolled tape is held in position by two alumina strips in front and behind it, or the tape lies flat on the alumina substrate. In a slight variation, the sample is raised in the center by a smaller aluminum oxide plate. For push-rod dilatometry, the rolled tape, held in place by the ring, is placed between two alumina spacers.
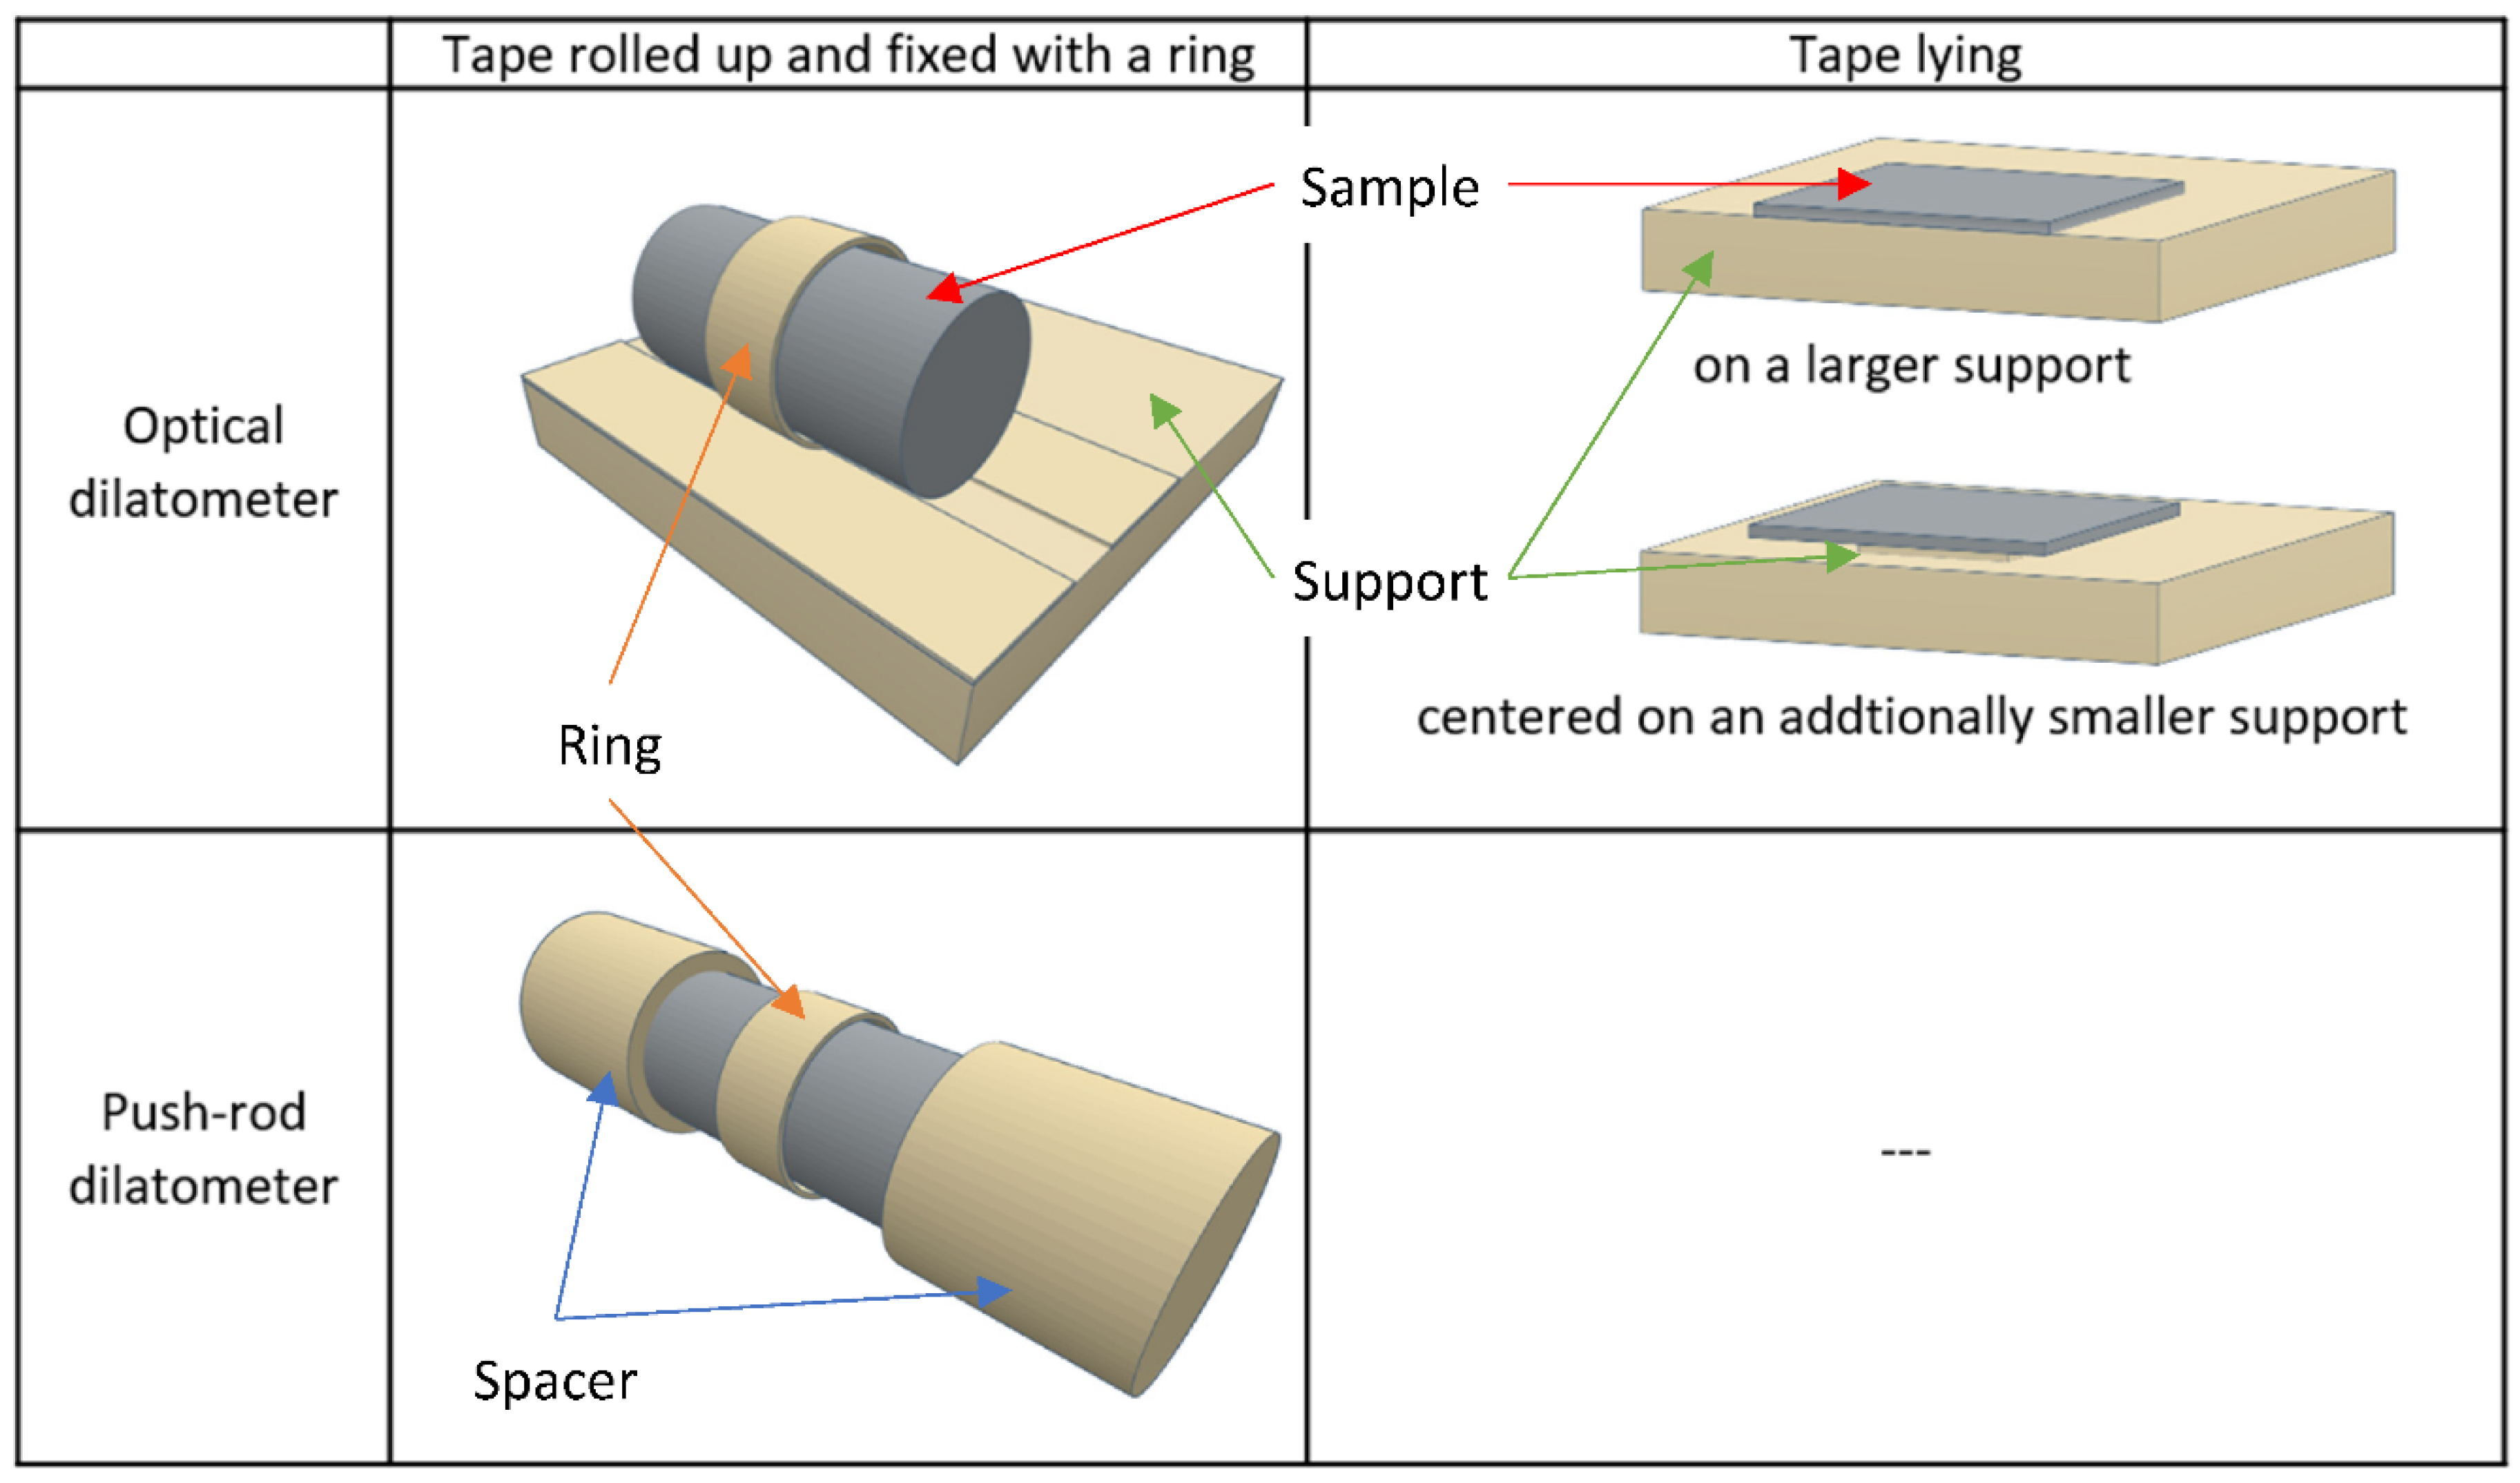
Figure 4.
17-4PH tapes after sintering with different geometry and position in the experiment. – (a) square sample placed on the dense side: strong upward warpage in casting direction and slightly transverse, the red line marks the neutral axis (representing the edge of the neutral layer) along the warpage; (b) square sample placed on the less dense side: strong downward warping in casting direction; (c) round sample: strong warping to the less dense side in the casting direction; (d) tape stripe on a two-point beam support positioned on the less dense side: warps against gravity upward.
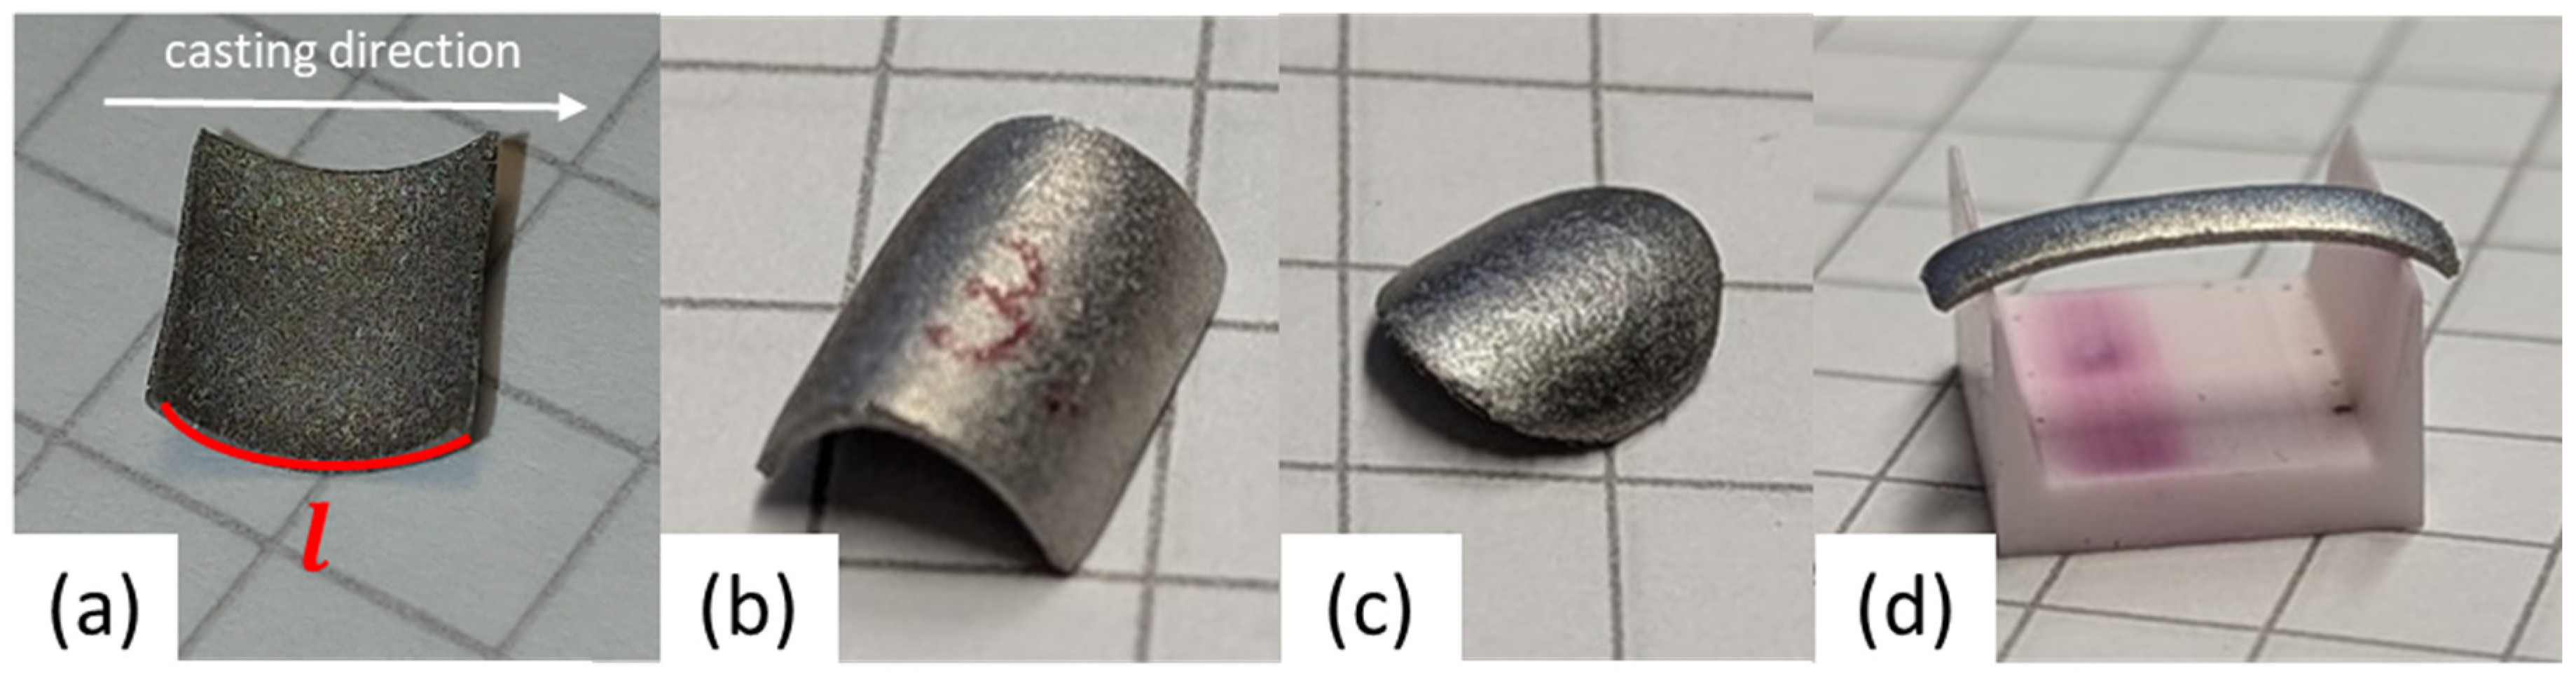
Figure 5.
Silhouettes from the optical dilatometry of lying 17-4PH tapes. – (a) Upper series of images, the length is measured in y-direction of the steel tape and (b) lower series of images, the length is measured in x-direction. – From left to right with the corresponding temperature: (i) initial state; (ii) a slight warping occurs during the debinding process; (iii) at maximum sintering temperature, strong warping upwards; (iv) end of dwell time; (v) final state, the deformation remains.
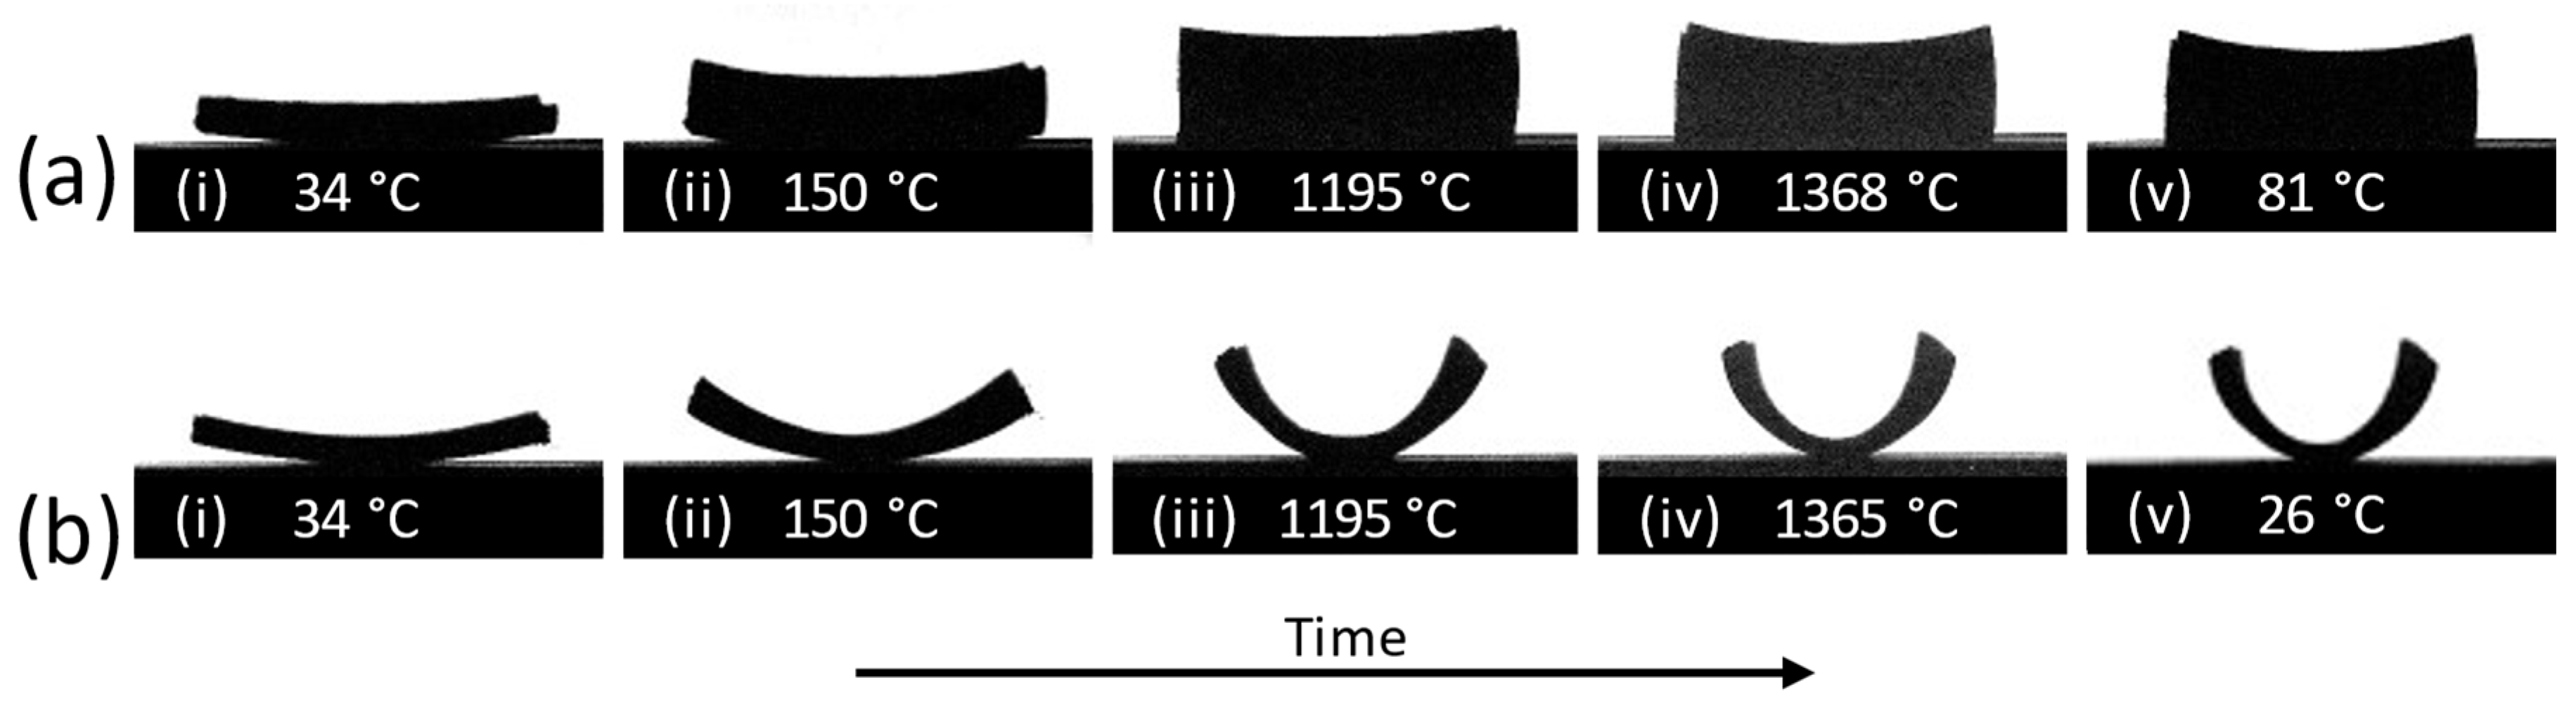
Figure 6.
Relative length (solid lines) and relative length change rate (dashed lines) from optical dilatometry measurements of flat lying 17-4PH tapes between room temperature and 1370 °C. The black and red curves were determined by measuring the sample length in the x- and y-directions.
Figure 6.
Relative length (solid lines) and relative length change rate (dashed lines) from optical dilatometry measurements of flat lying 17-4PH tapes between room temperature and 1370 °C. The black and red curves were determined by measuring the sample length in the x- and y-directions.
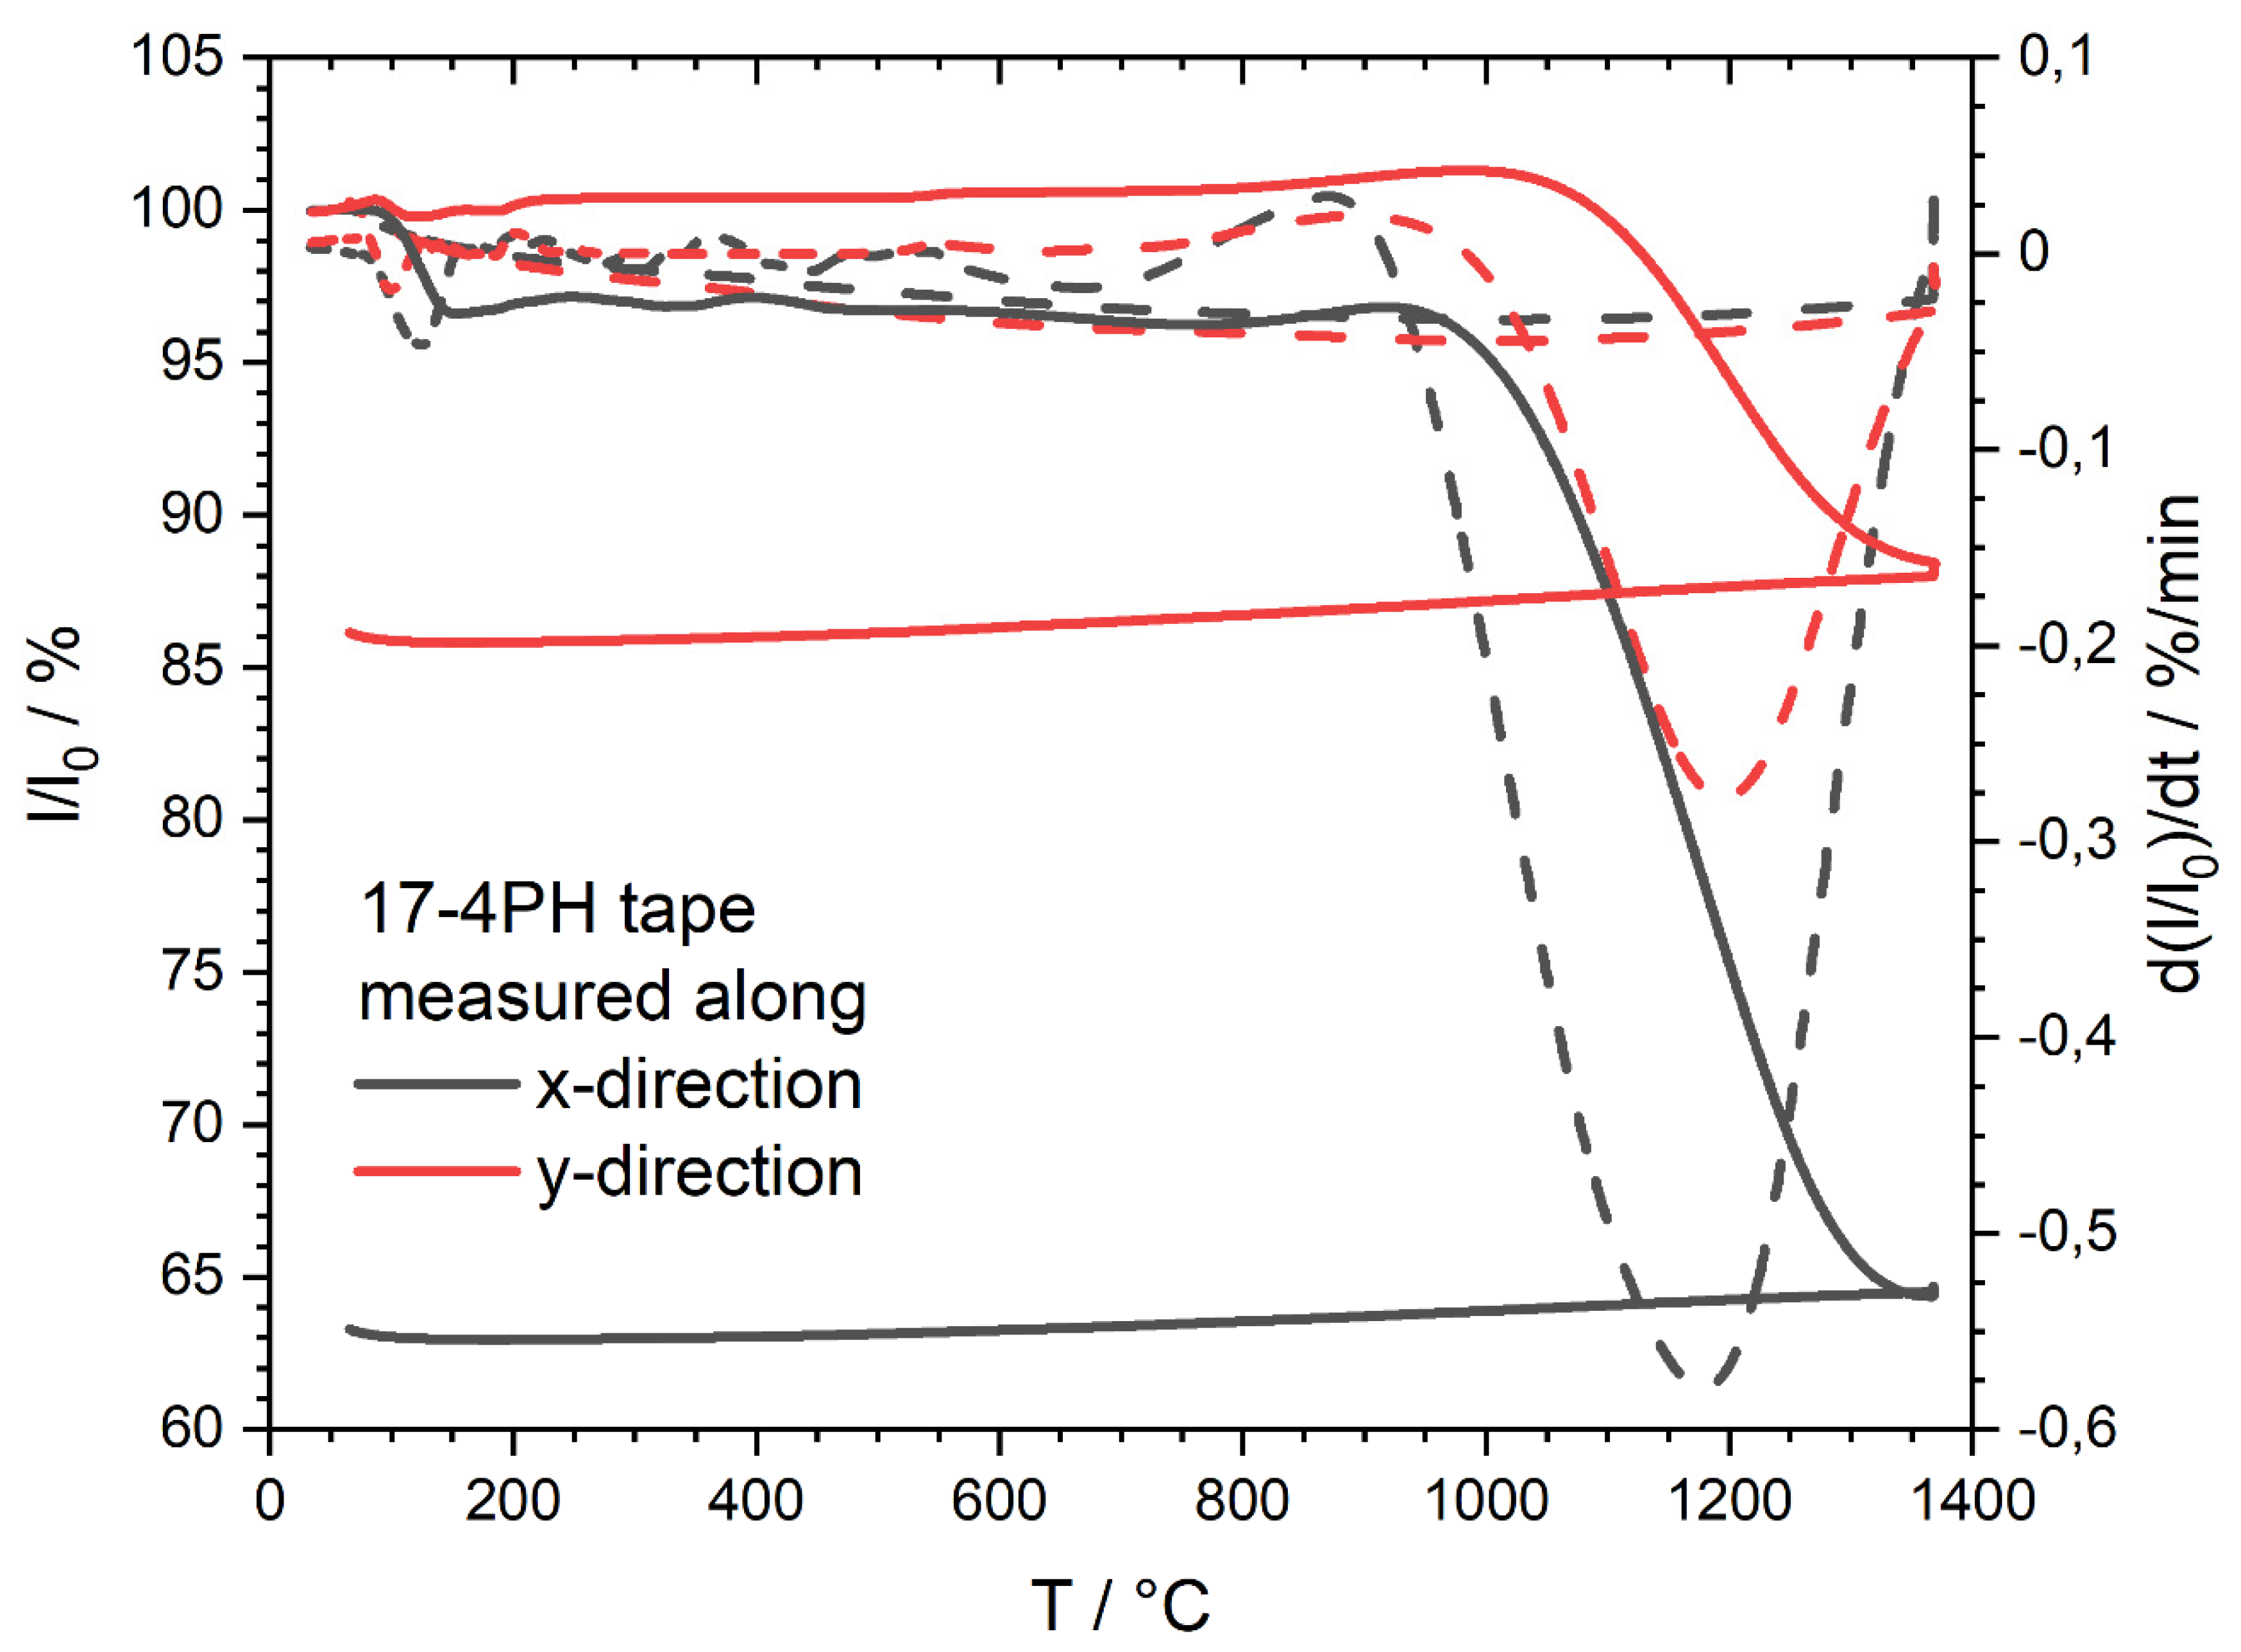
Figure 7.
Optical micrograph of a polished cross section of a 17-4PH tape debinded and pre-sintered at 1000 °C with no dwell time or loading. The black region around the sample is epoxy filler. – (a) Clearly visible are the smooth bottom side and the rough top side of the tape as well as (b) the slight warpage that remains after cooling, which already occurs during the debinding and pre-sintering process.
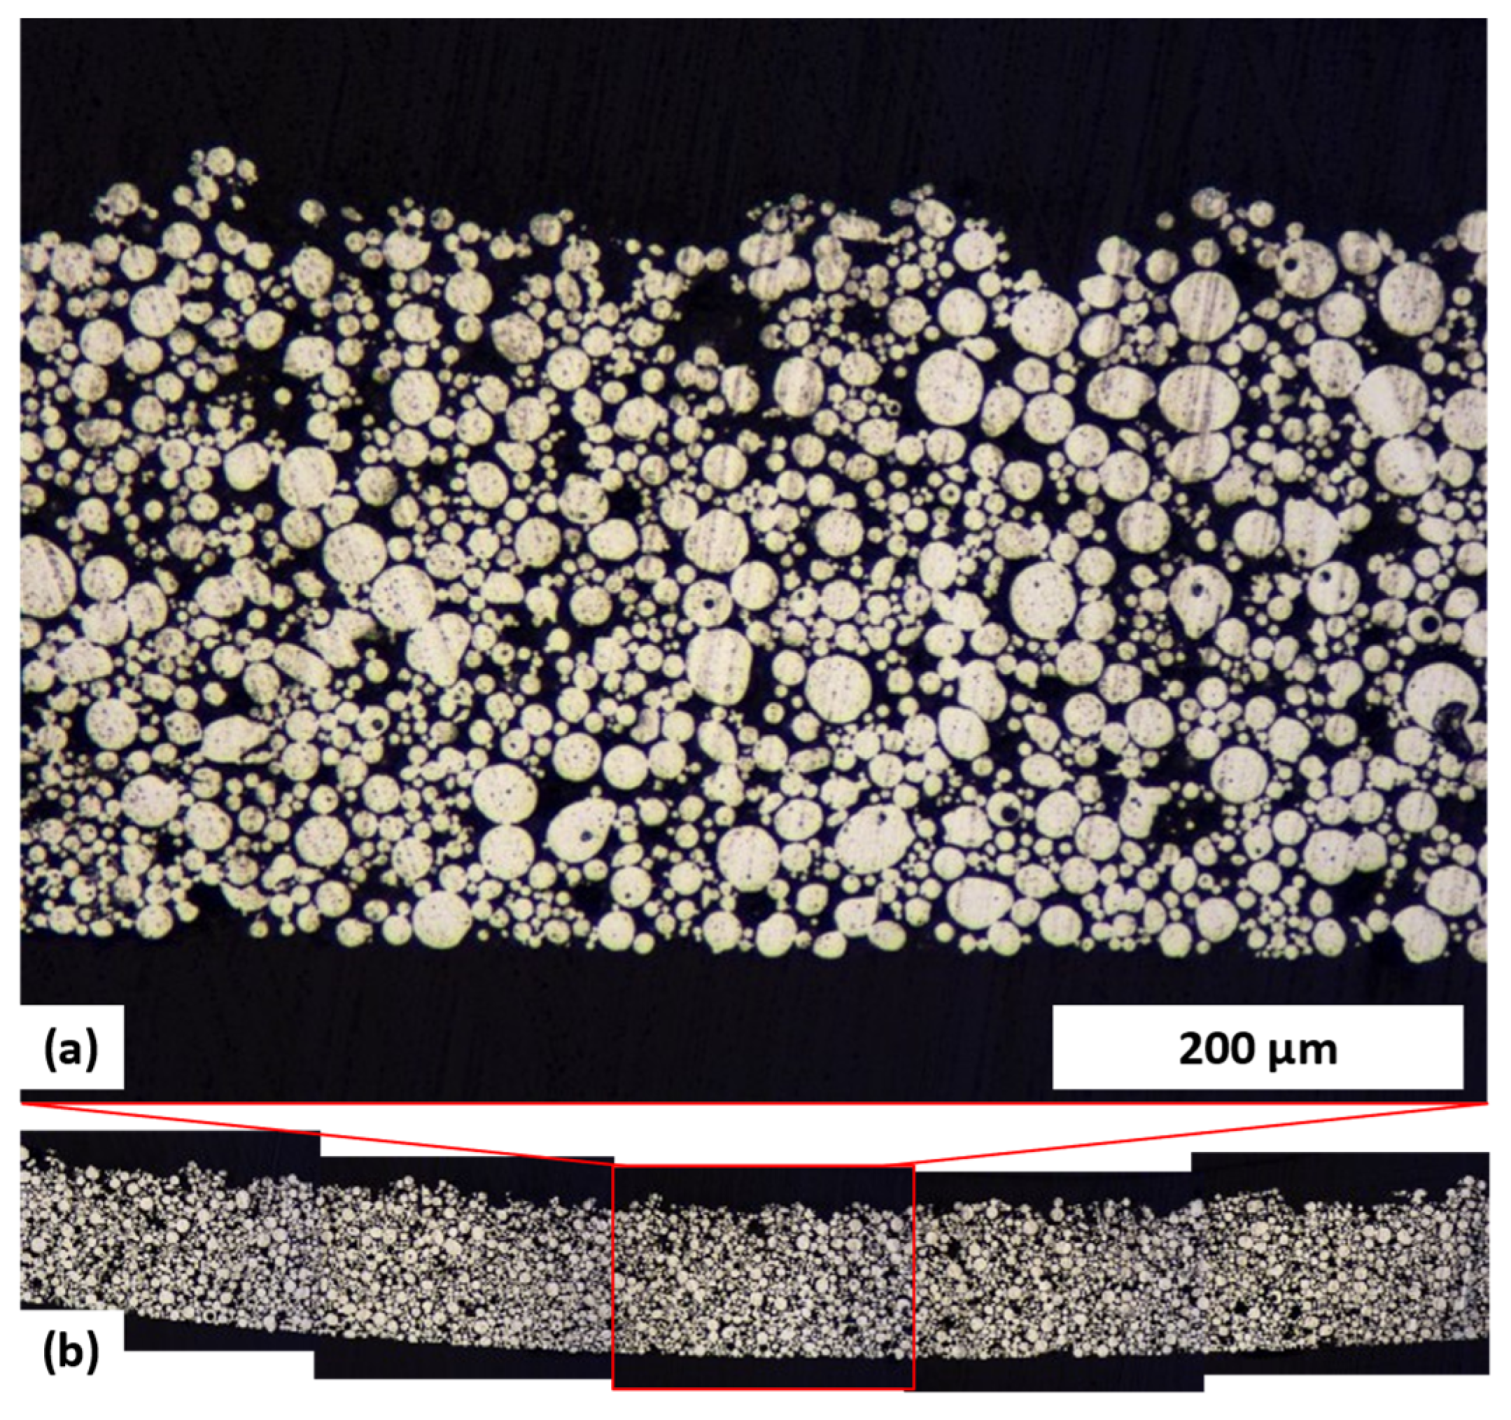
Figure 8.
Silhouettes from the optical dilatometry. Visible are images of a rolled 17-4PH tape in the vertical standing ring fixing the rolled tape in the middle. (a) Upper series of images, the length is measured in y-direction of the steel tape and (b) lower series of images, the length is measured in x-direction. – From left to right with the corresponding temperature: (i) initial state; (ii) around onset temperature of shrinkage; (iii) at maximum sintering temperature; (iv) end of dwell time; (v) final state.
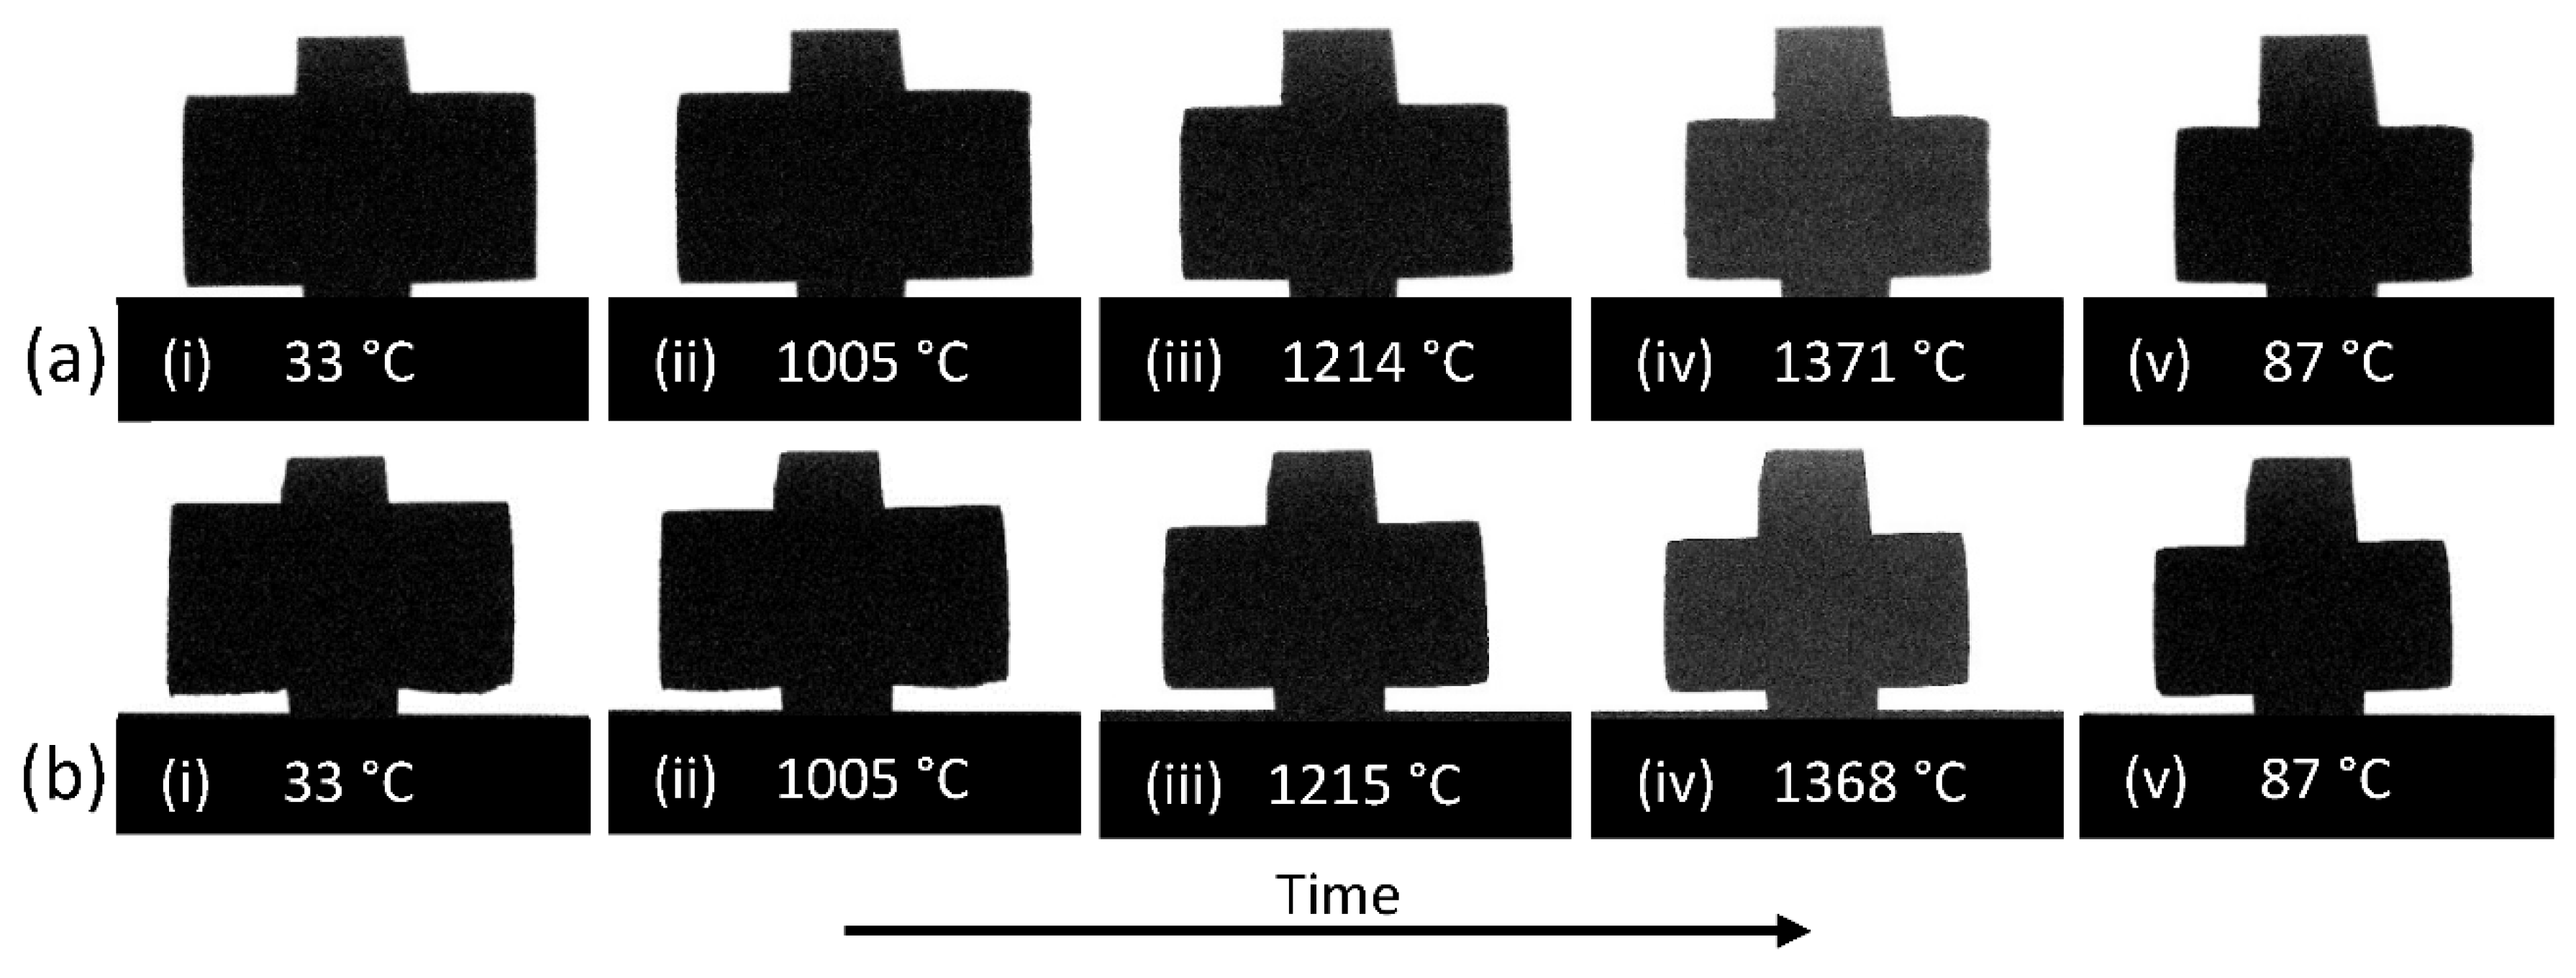
Figure 9.
Relative length (solid lines) and relative length change rate (dashed lines) from two optical dilatometry measurements of rolled 17-4PH tapes between room temperature and 1370 °C. The black and red curves were determined by measuring the sample length in the x- and y-directions.
Figure 9.
Relative length (solid lines) and relative length change rate (dashed lines) from two optical dilatometry measurements of rolled 17-4PH tapes between room temperature and 1370 °C. The black and red curves were determined by measuring the sample length in the x- and y-directions.
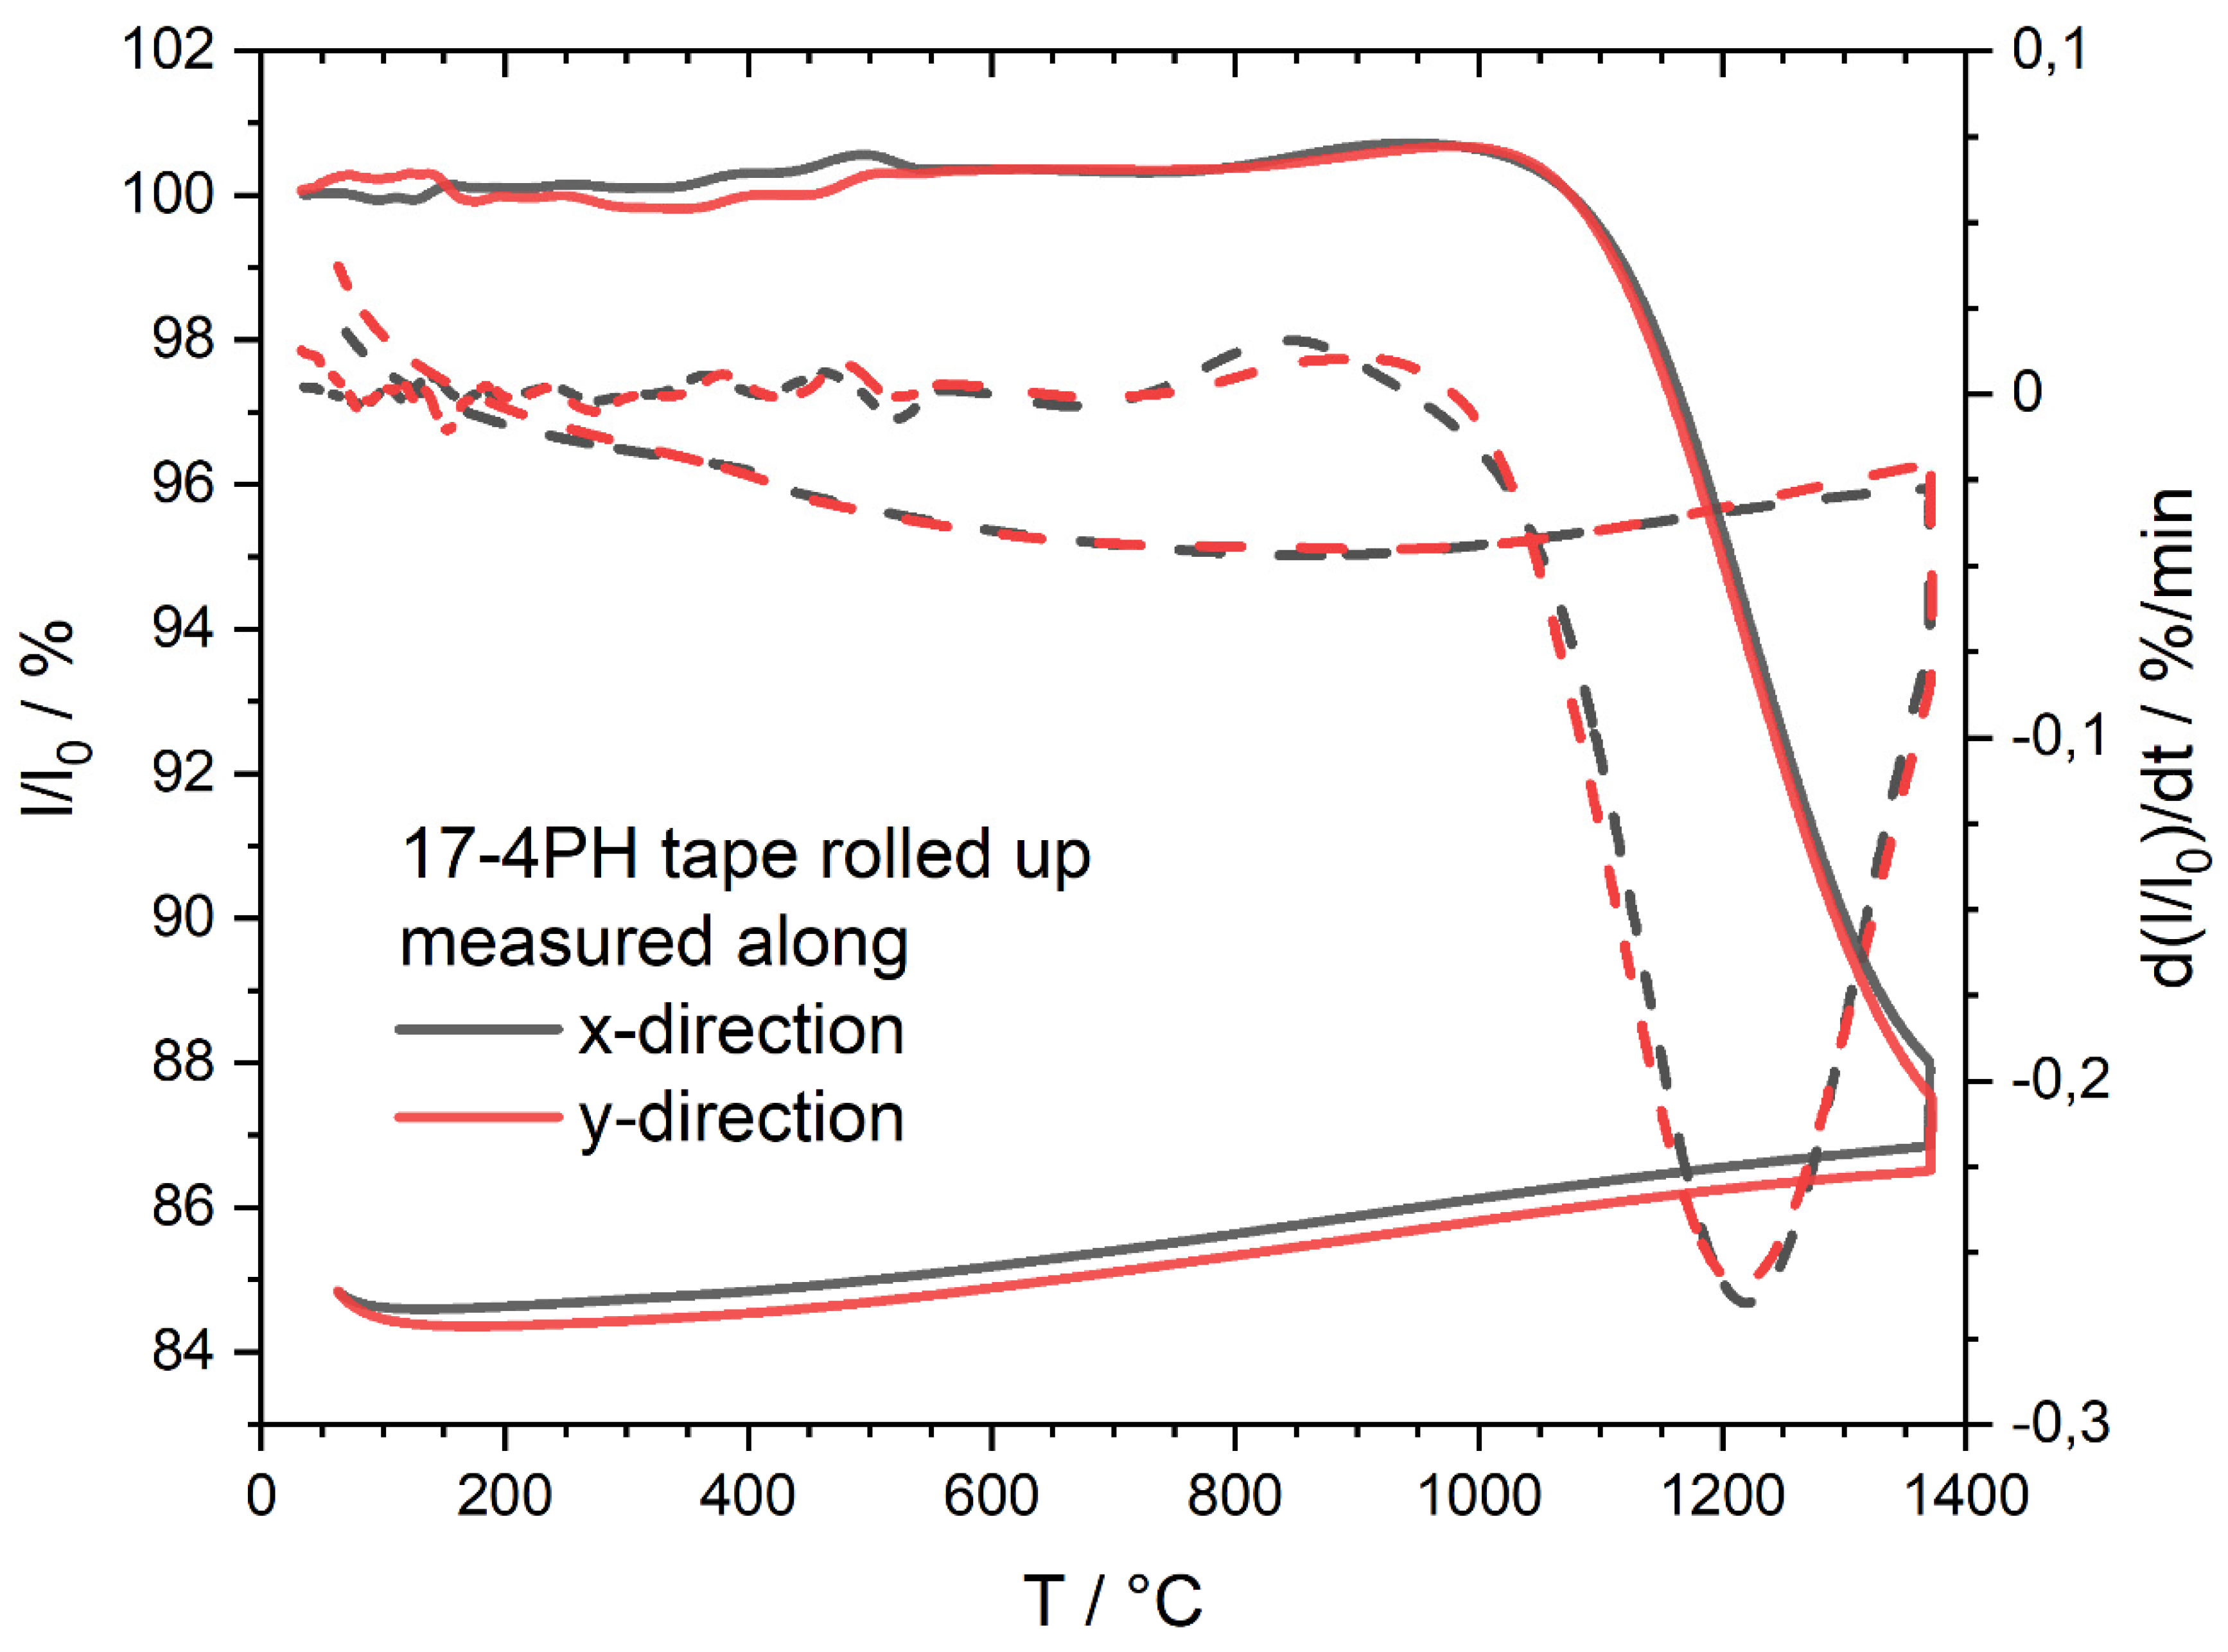
Figure 10.
Relative length measured (solid lines) and calculated (from the experimental data for the x-direction of a lying tape; line with dots) between 800 °C and 1370 °C. Measurement data were obtained using an optical dilatometer on rolled 17-4PH tapes in the x- and y-directions.
Figure 10.
Relative length measured (solid lines) and calculated (from the experimental data for the x-direction of a lying tape; line with dots) between 800 °C and 1370 °C. Measurement data were obtained using an optical dilatometer on rolled 17-4PH tapes in the x- and y-directions.
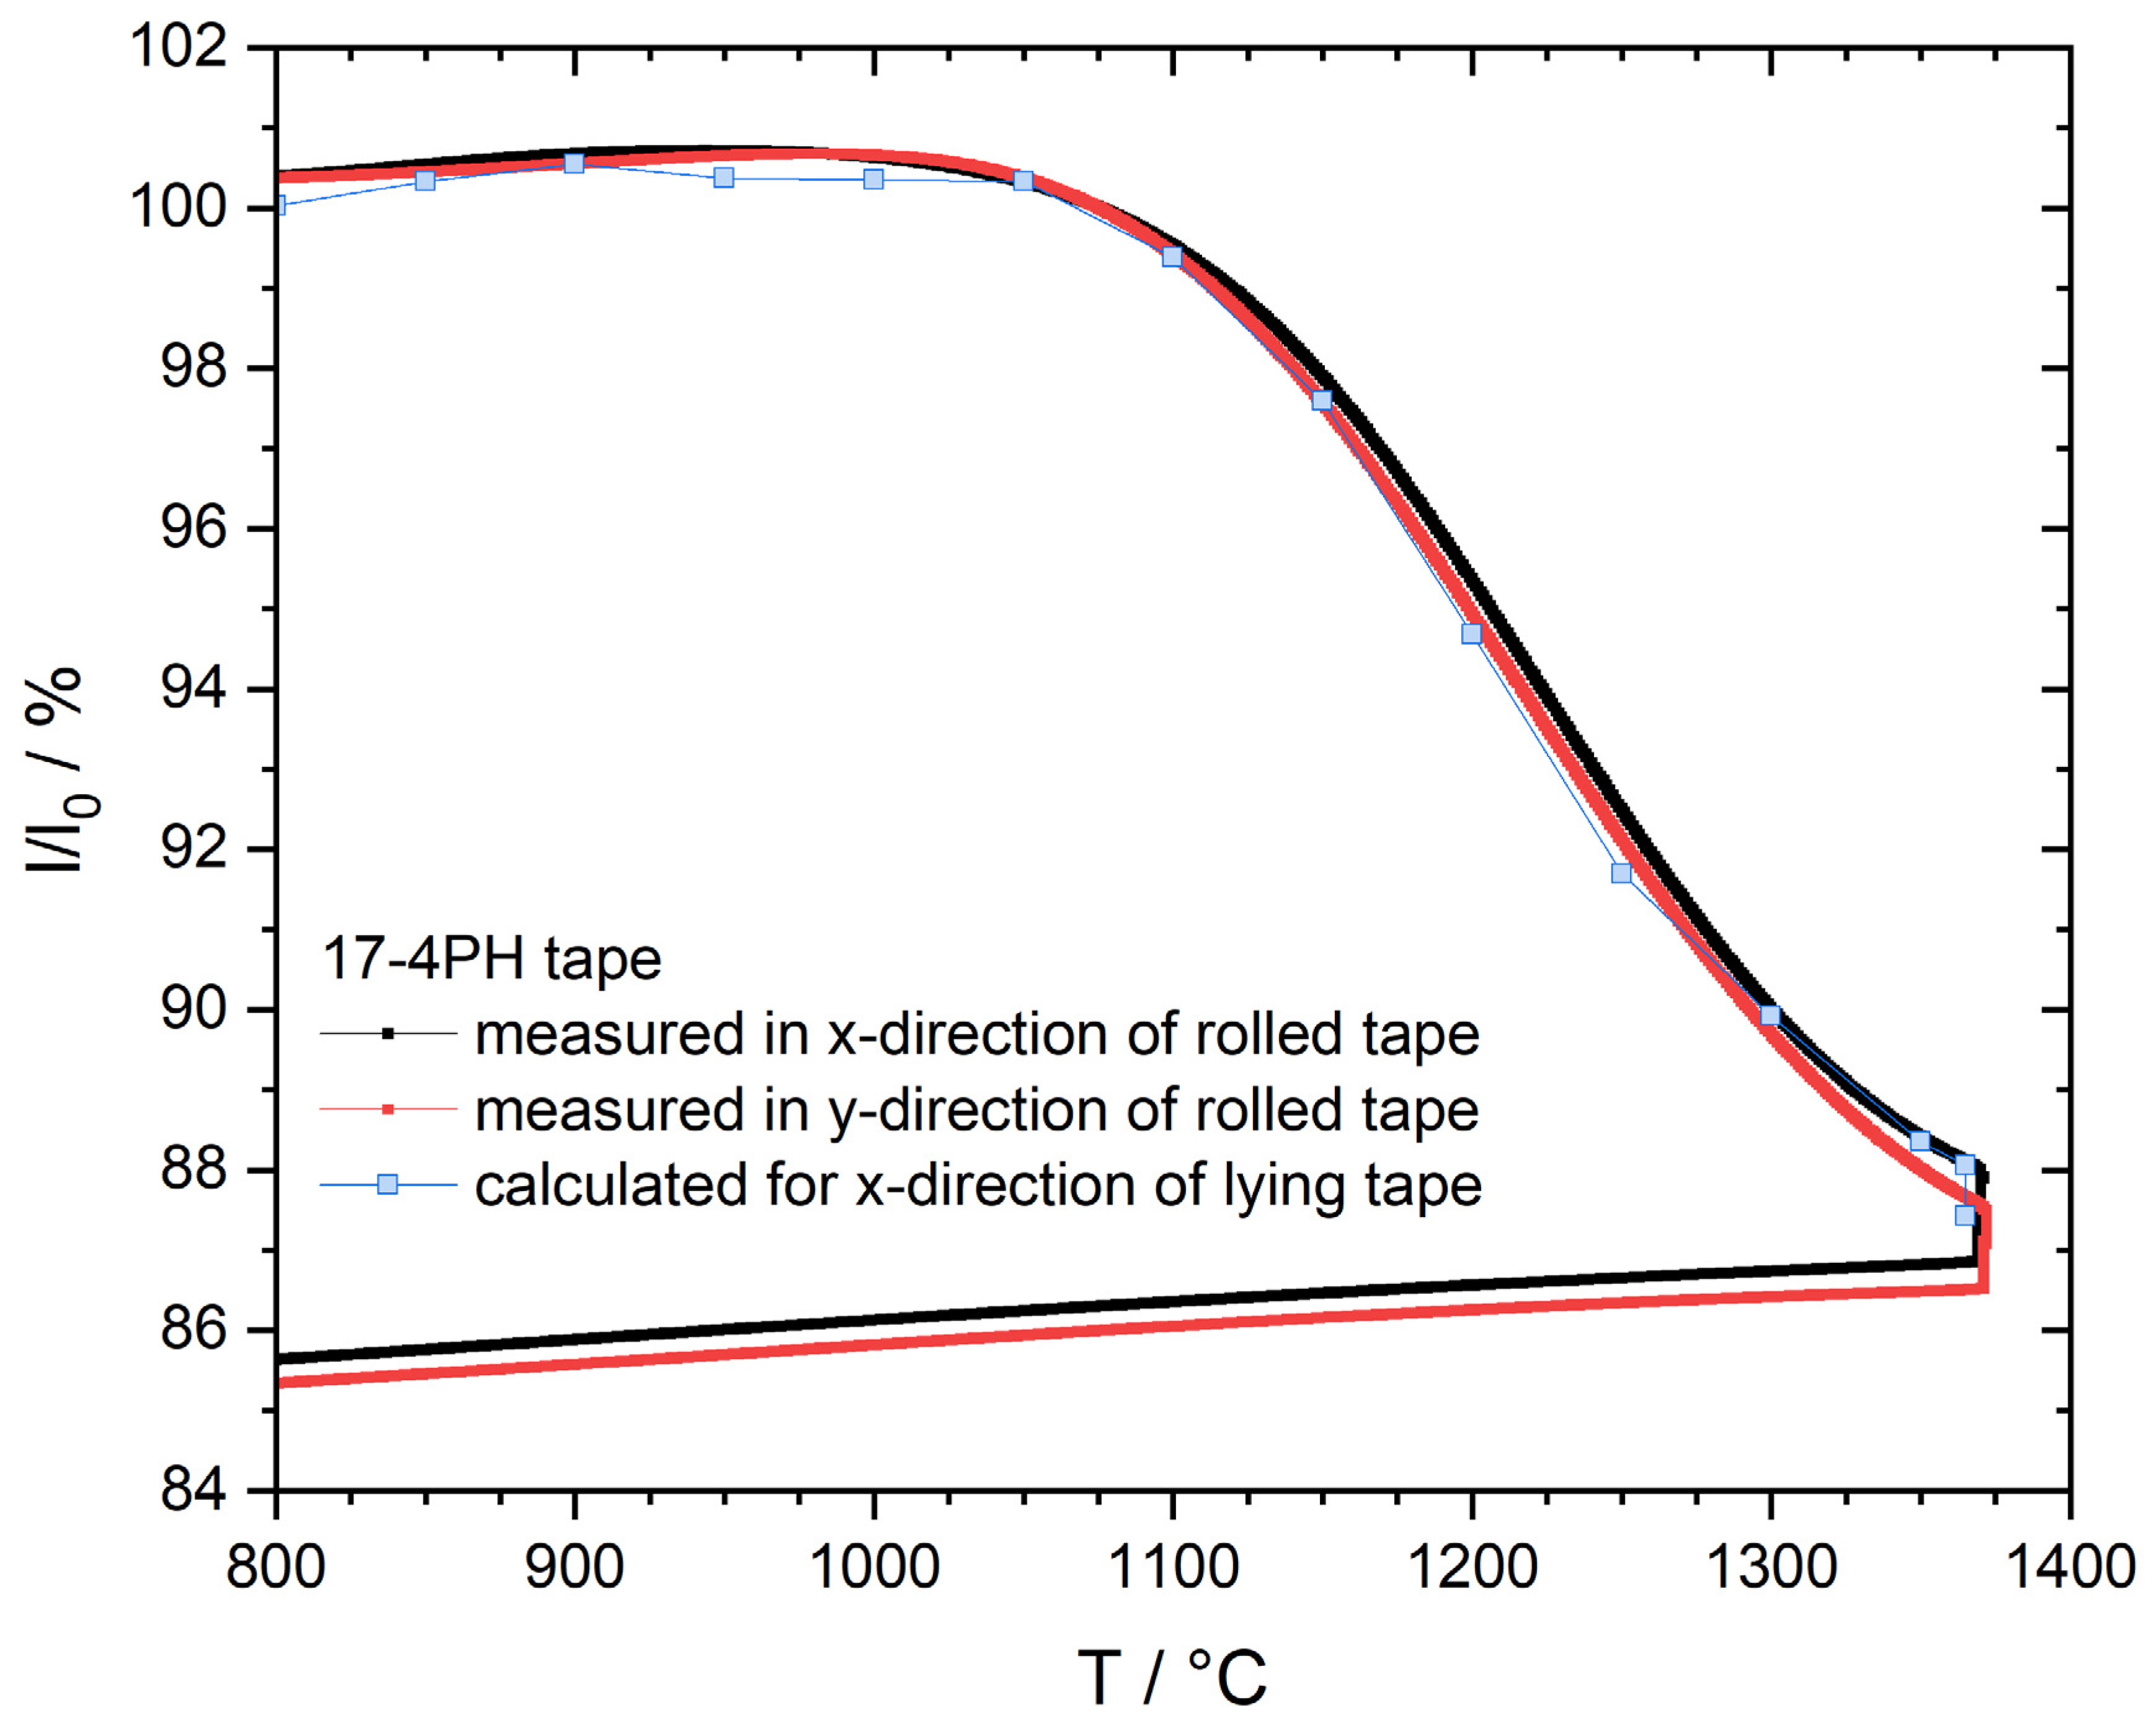
Figure 11.
Relative length (solid lines) and relative length change rate (dashed lines) of rolled 17-4PH tapes measured in the push-rod dilatometer between room temperature and 1370 °C. The black and red curves were determined by measuring the sample length in the x- and y-directions.
Figure 11.
Relative length (solid lines) and relative length change rate (dashed lines) of rolled 17-4PH tapes measured in the push-rod dilatometer between room temperature and 1370 °C. The black and red curves were determined by measuring the sample length in the x- and y-directions.
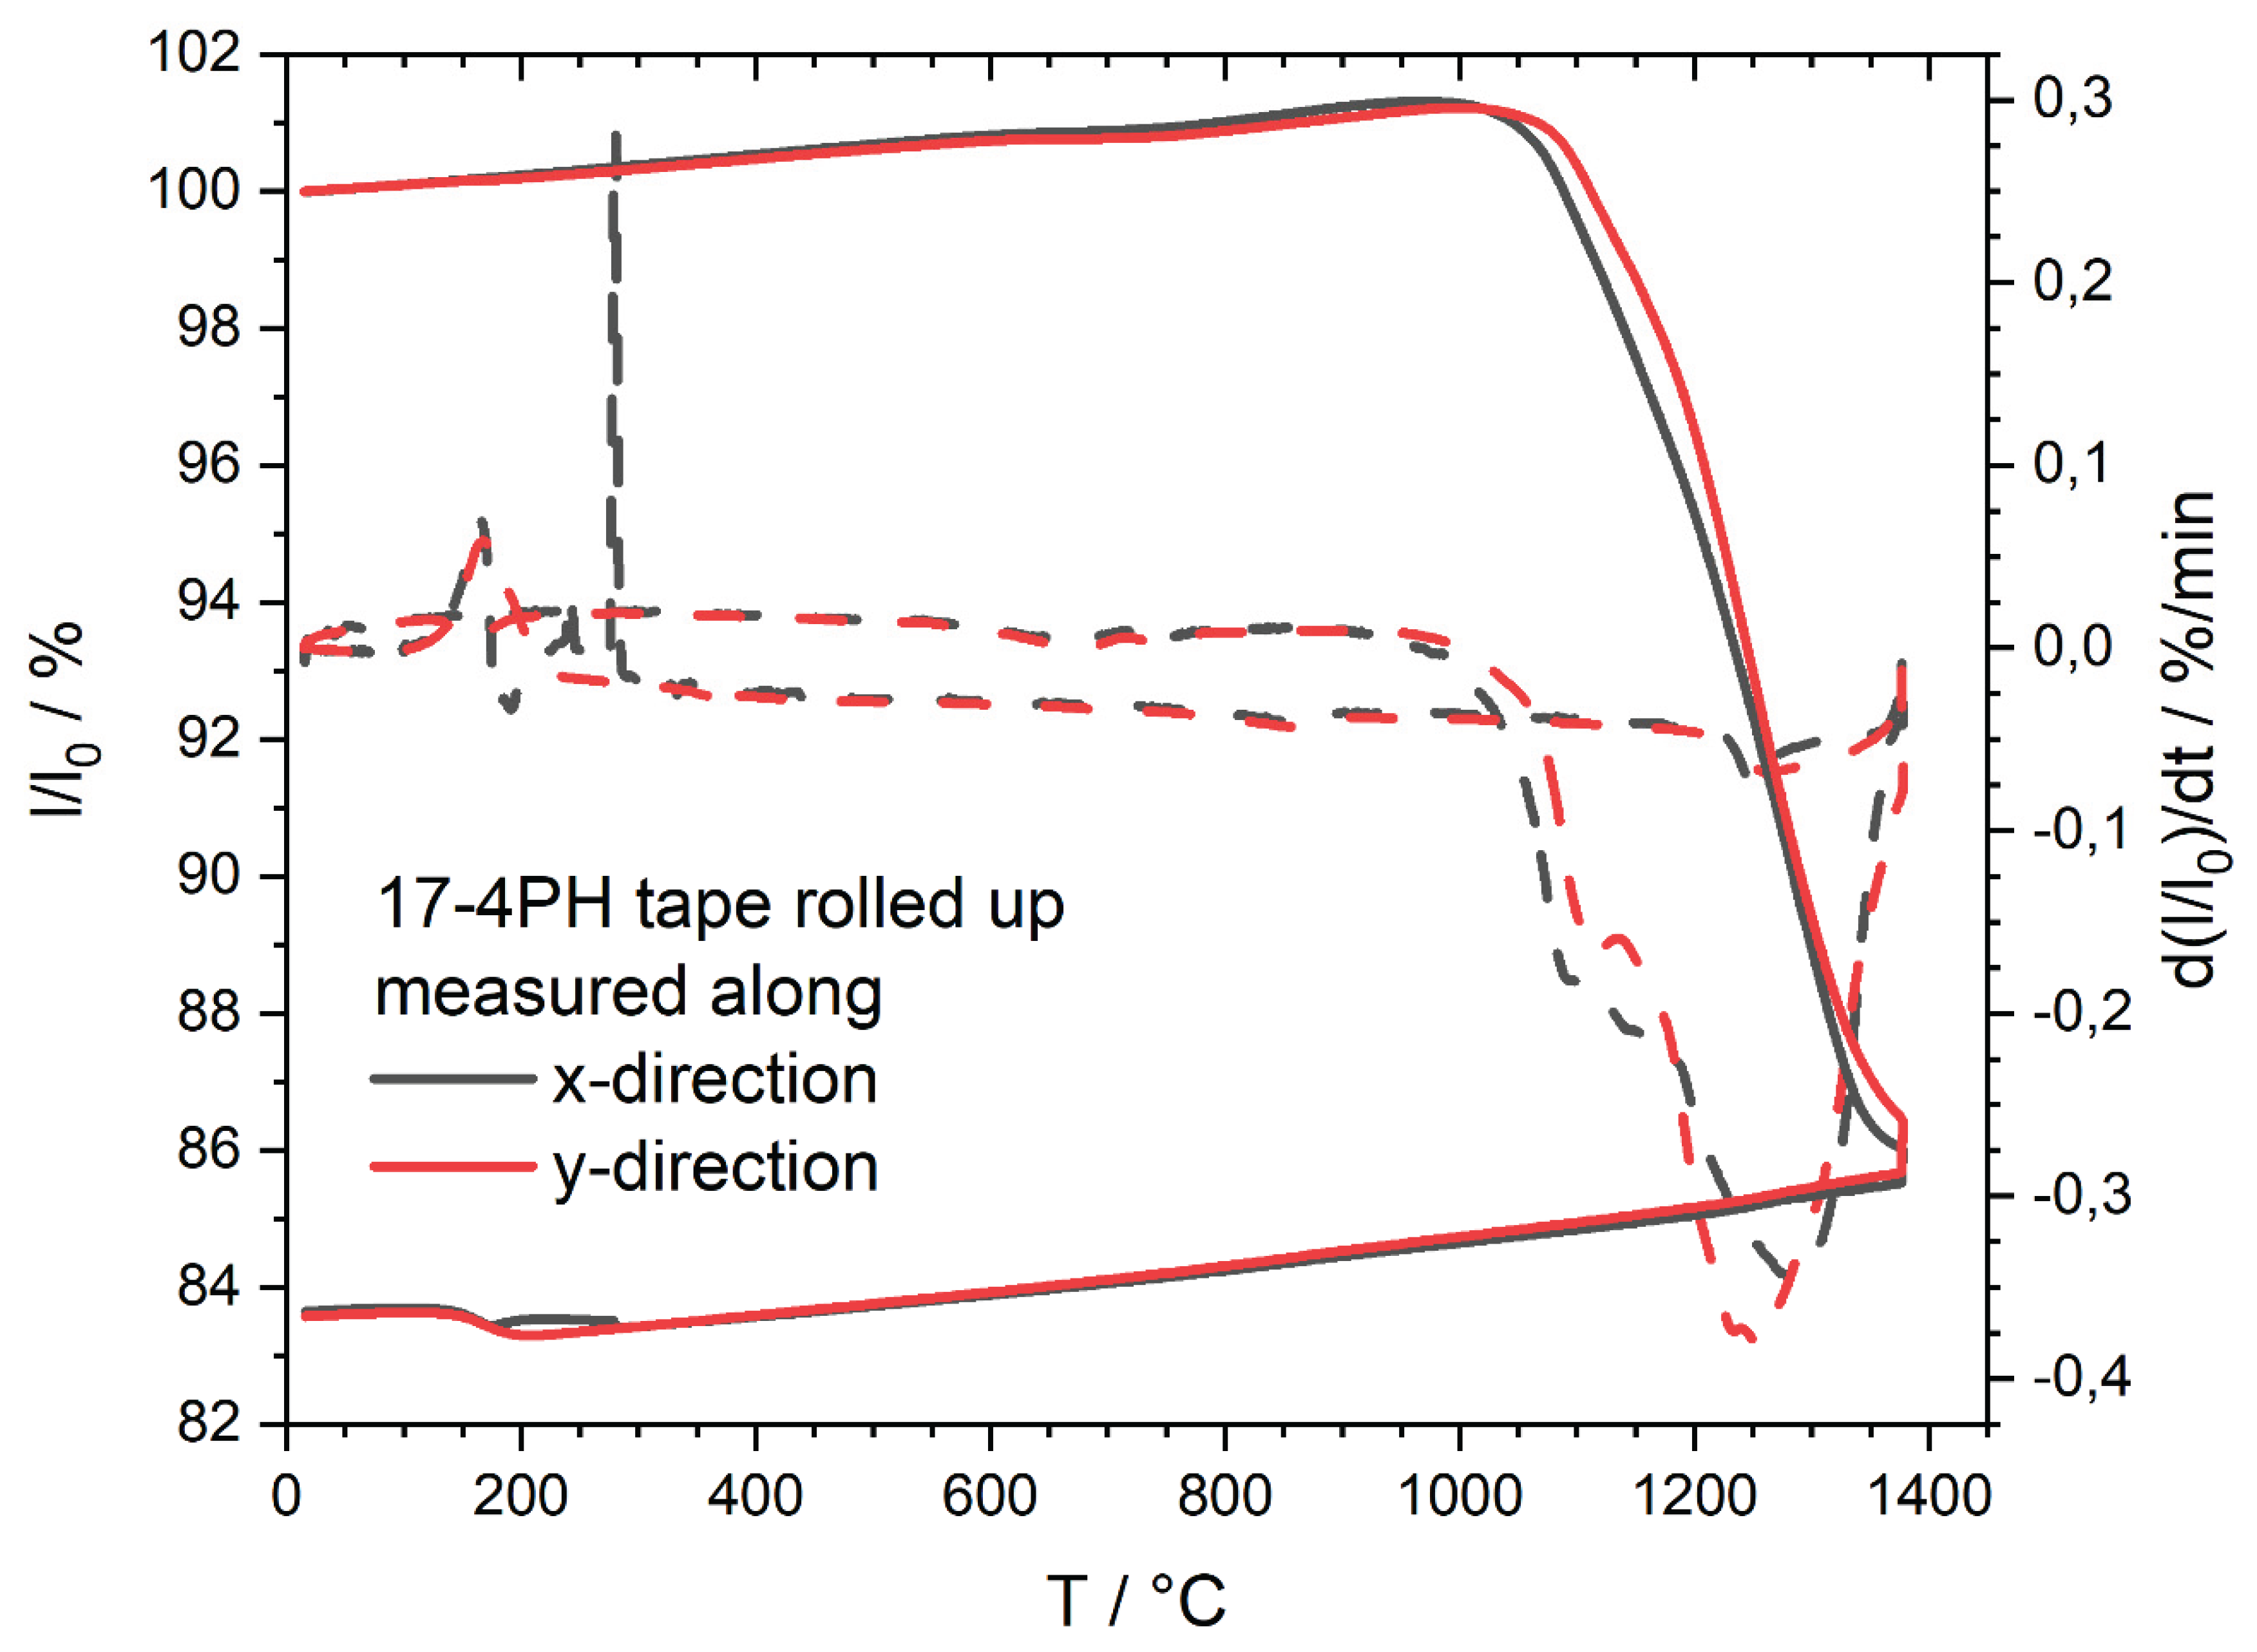
Figure 12.
Relative length normalized to 900 °C (solid lines) and relative length change rate (dashed lines) of rolled 17-4PH tapes measured in an optical dilatometer (blue) and a push-rod dilatometer (green) between 900 °C and 1370 °C. Both curves were obtained by measuring the change in length corresponding to the y-direction of the tapes.
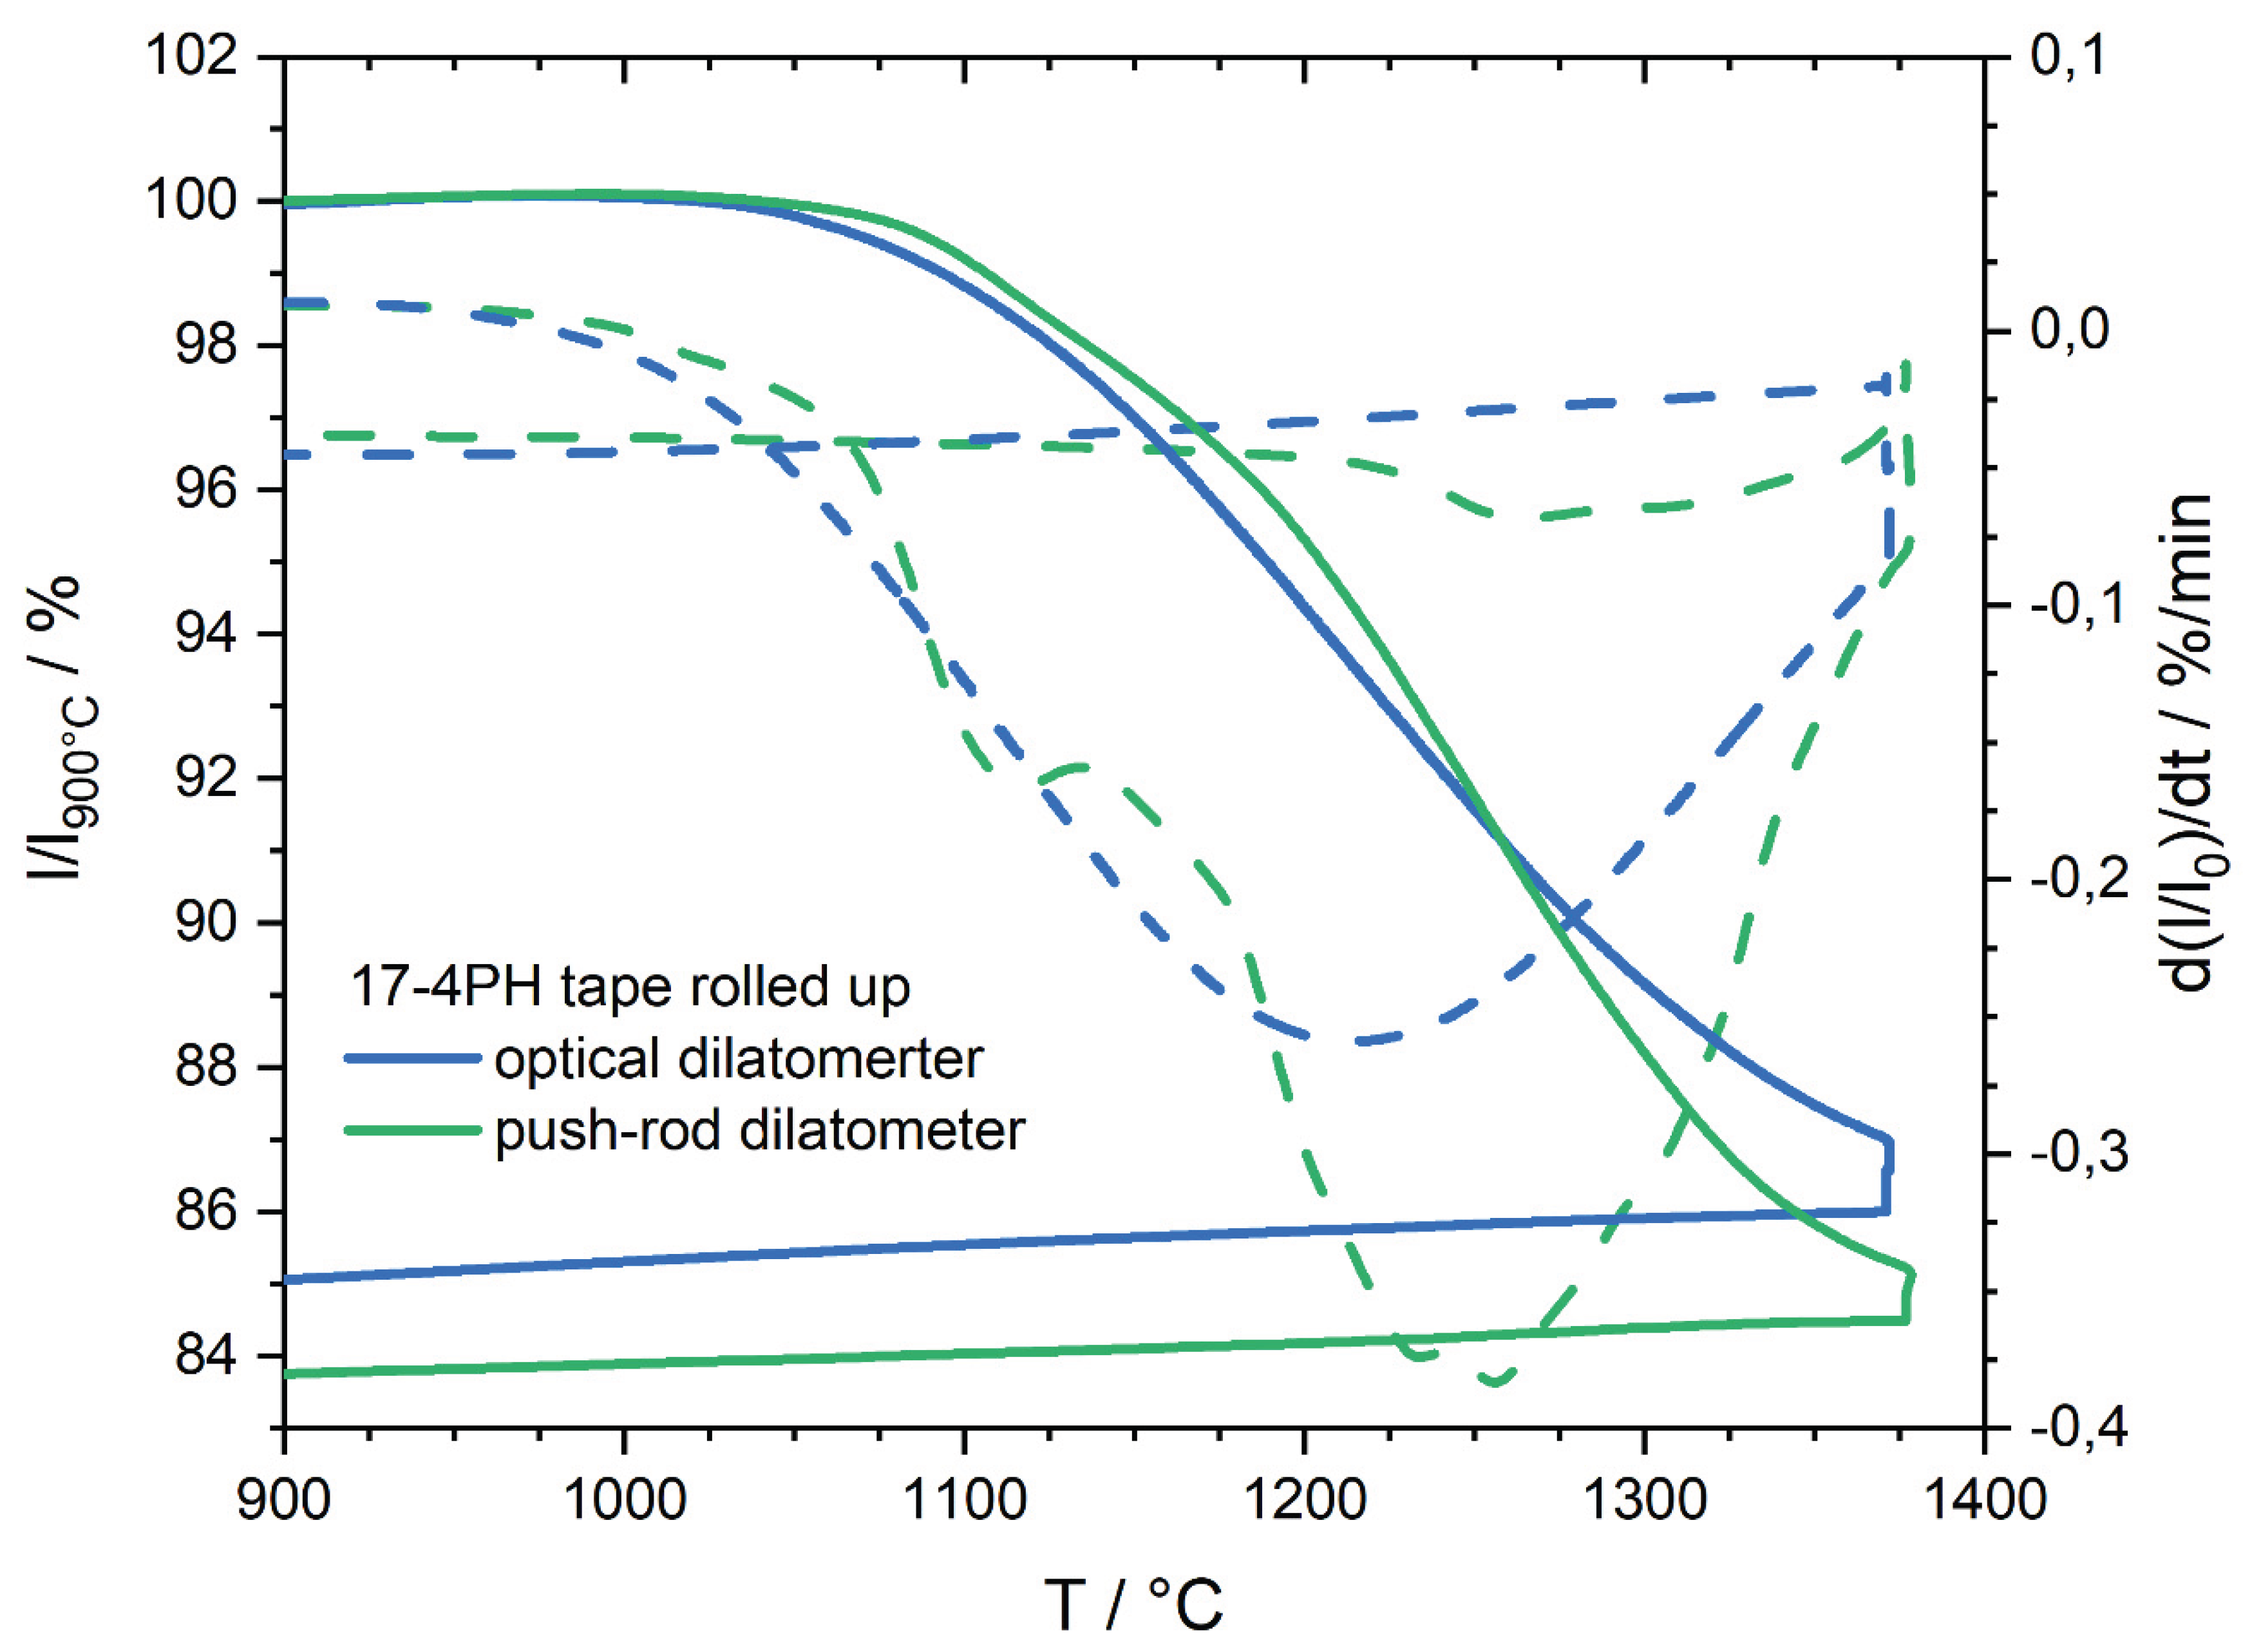
Figure 13.
Silhouettes from the optical dilatometry for lying TZ-3YS-E tapes centered on a smaller alumina support. – (a) Upper series of images, the length is measured in y-direction of the steel tape and (b) lower series of images, the length is measured in x-direction. – From left to right with the corresponding temperature: (i) initial state, sample at room temperature; (ii) no warping after debinding; (iii) during sintering; (iv) at maximum temperature and end of dwell time; (v) final state.
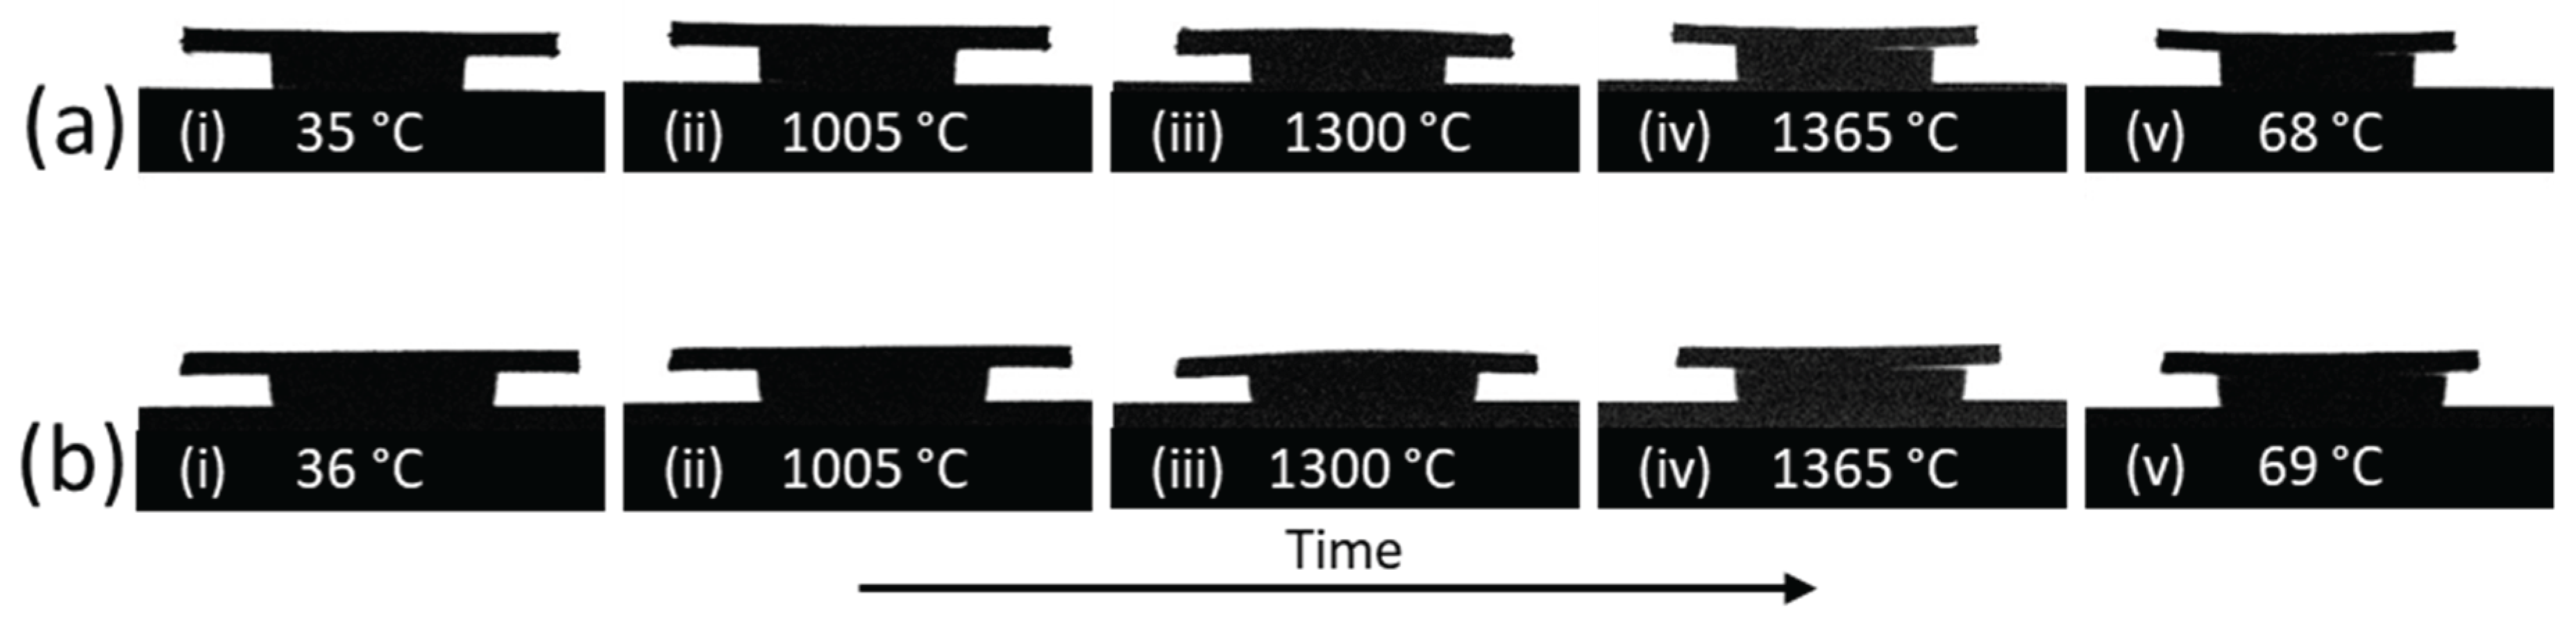
Figure 14.
FESEM images of the cross section of a pre-sintered TZ-3YS-E tape at 1000 °C with different magnifications in (a) and (b).
Figure 14.
FESEM images of the cross section of a pre-sintered TZ-3YS-E tape at 1000 °C with different magnifications in (a) and (b).
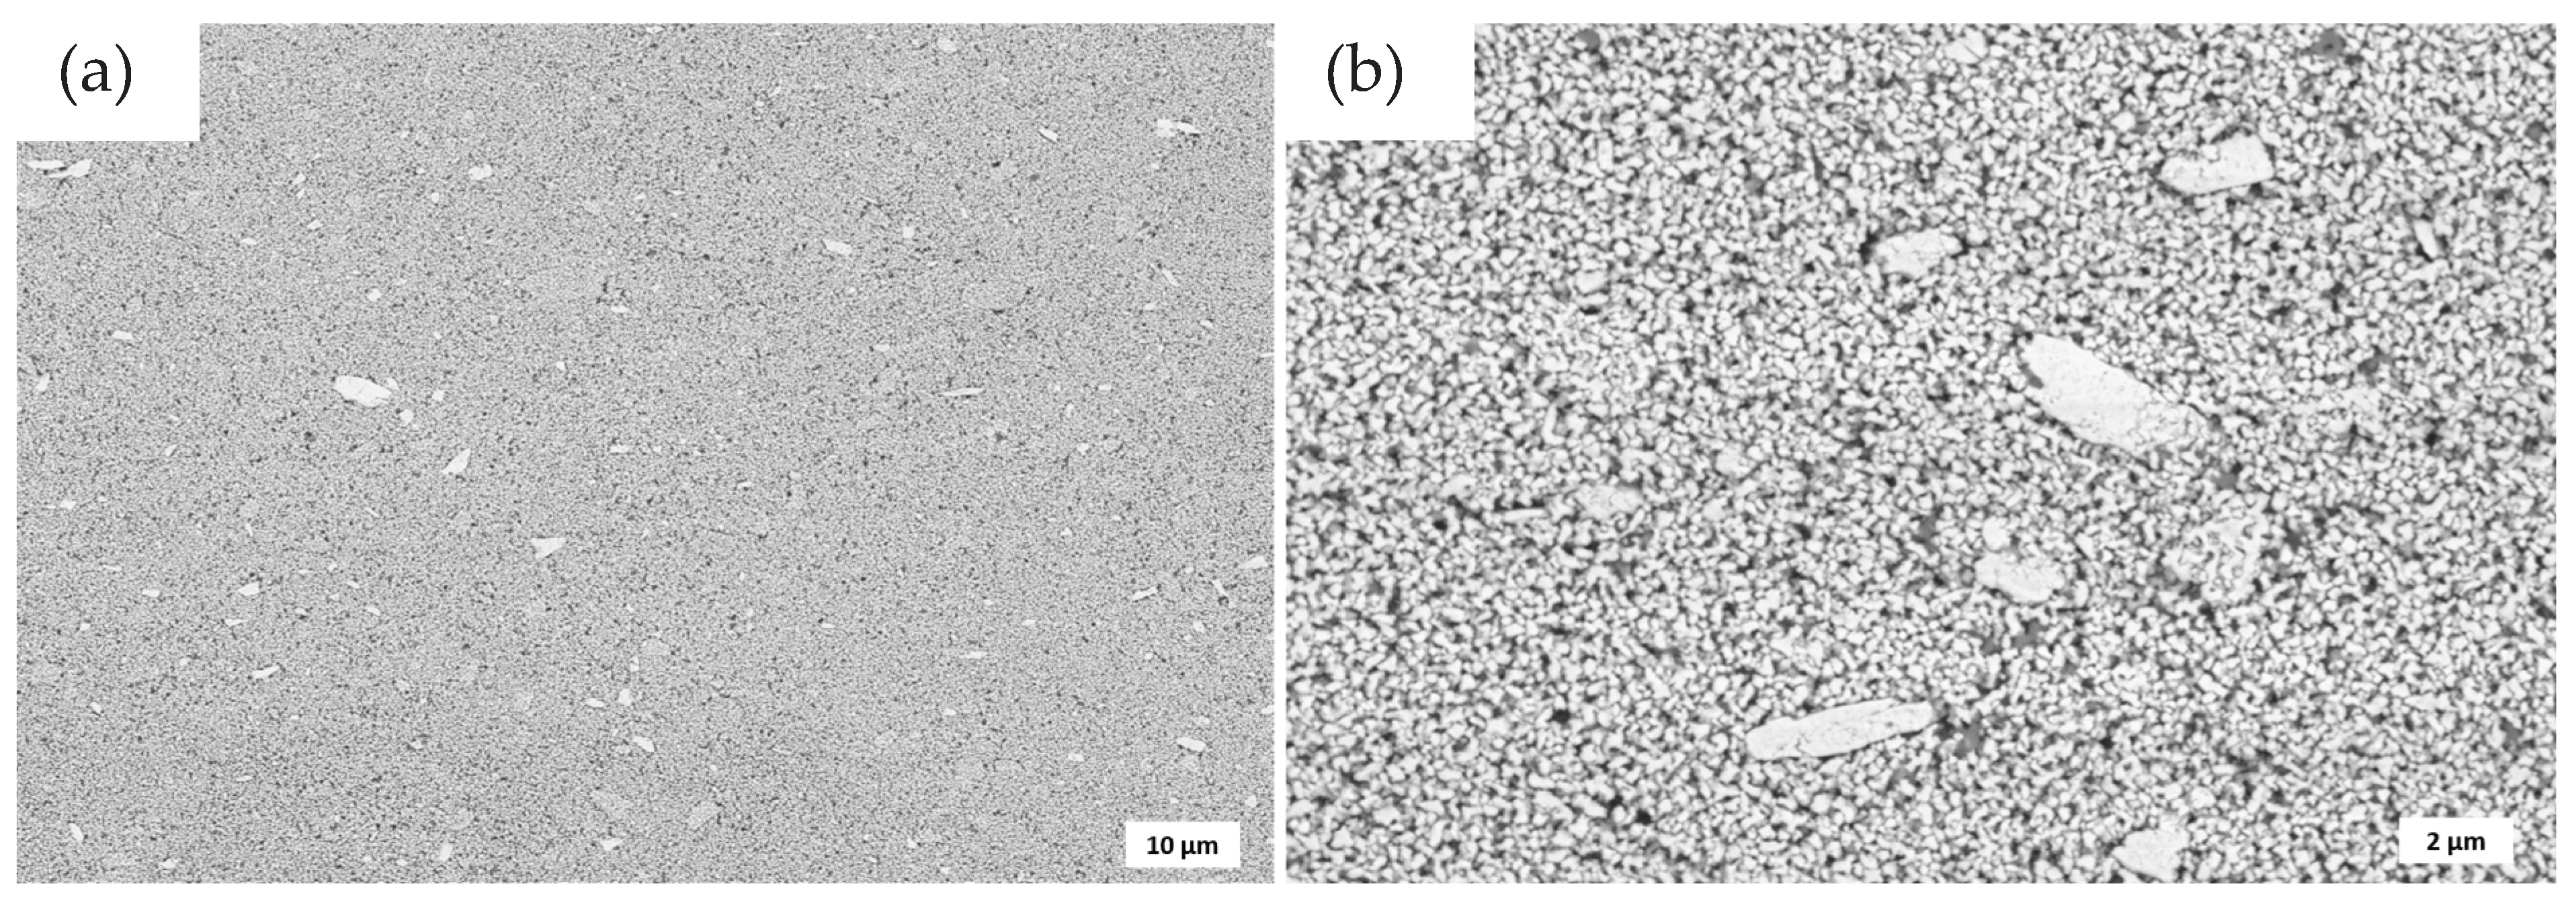
Figure 15.
Relative length (solid lines) and relative length change rate (dashed lines) for TZ-3YS-E tapes between room temperature and 1370 °C measured via optical dilatometry. The black and red curves were determined by measuring the sample length in the x- and y-directions.
Figure 15.
Relative length (solid lines) and relative length change rate (dashed lines) for TZ-3YS-E tapes between room temperature and 1370 °C measured via optical dilatometry. The black and red curves were determined by measuring the sample length in the x- and y-directions.
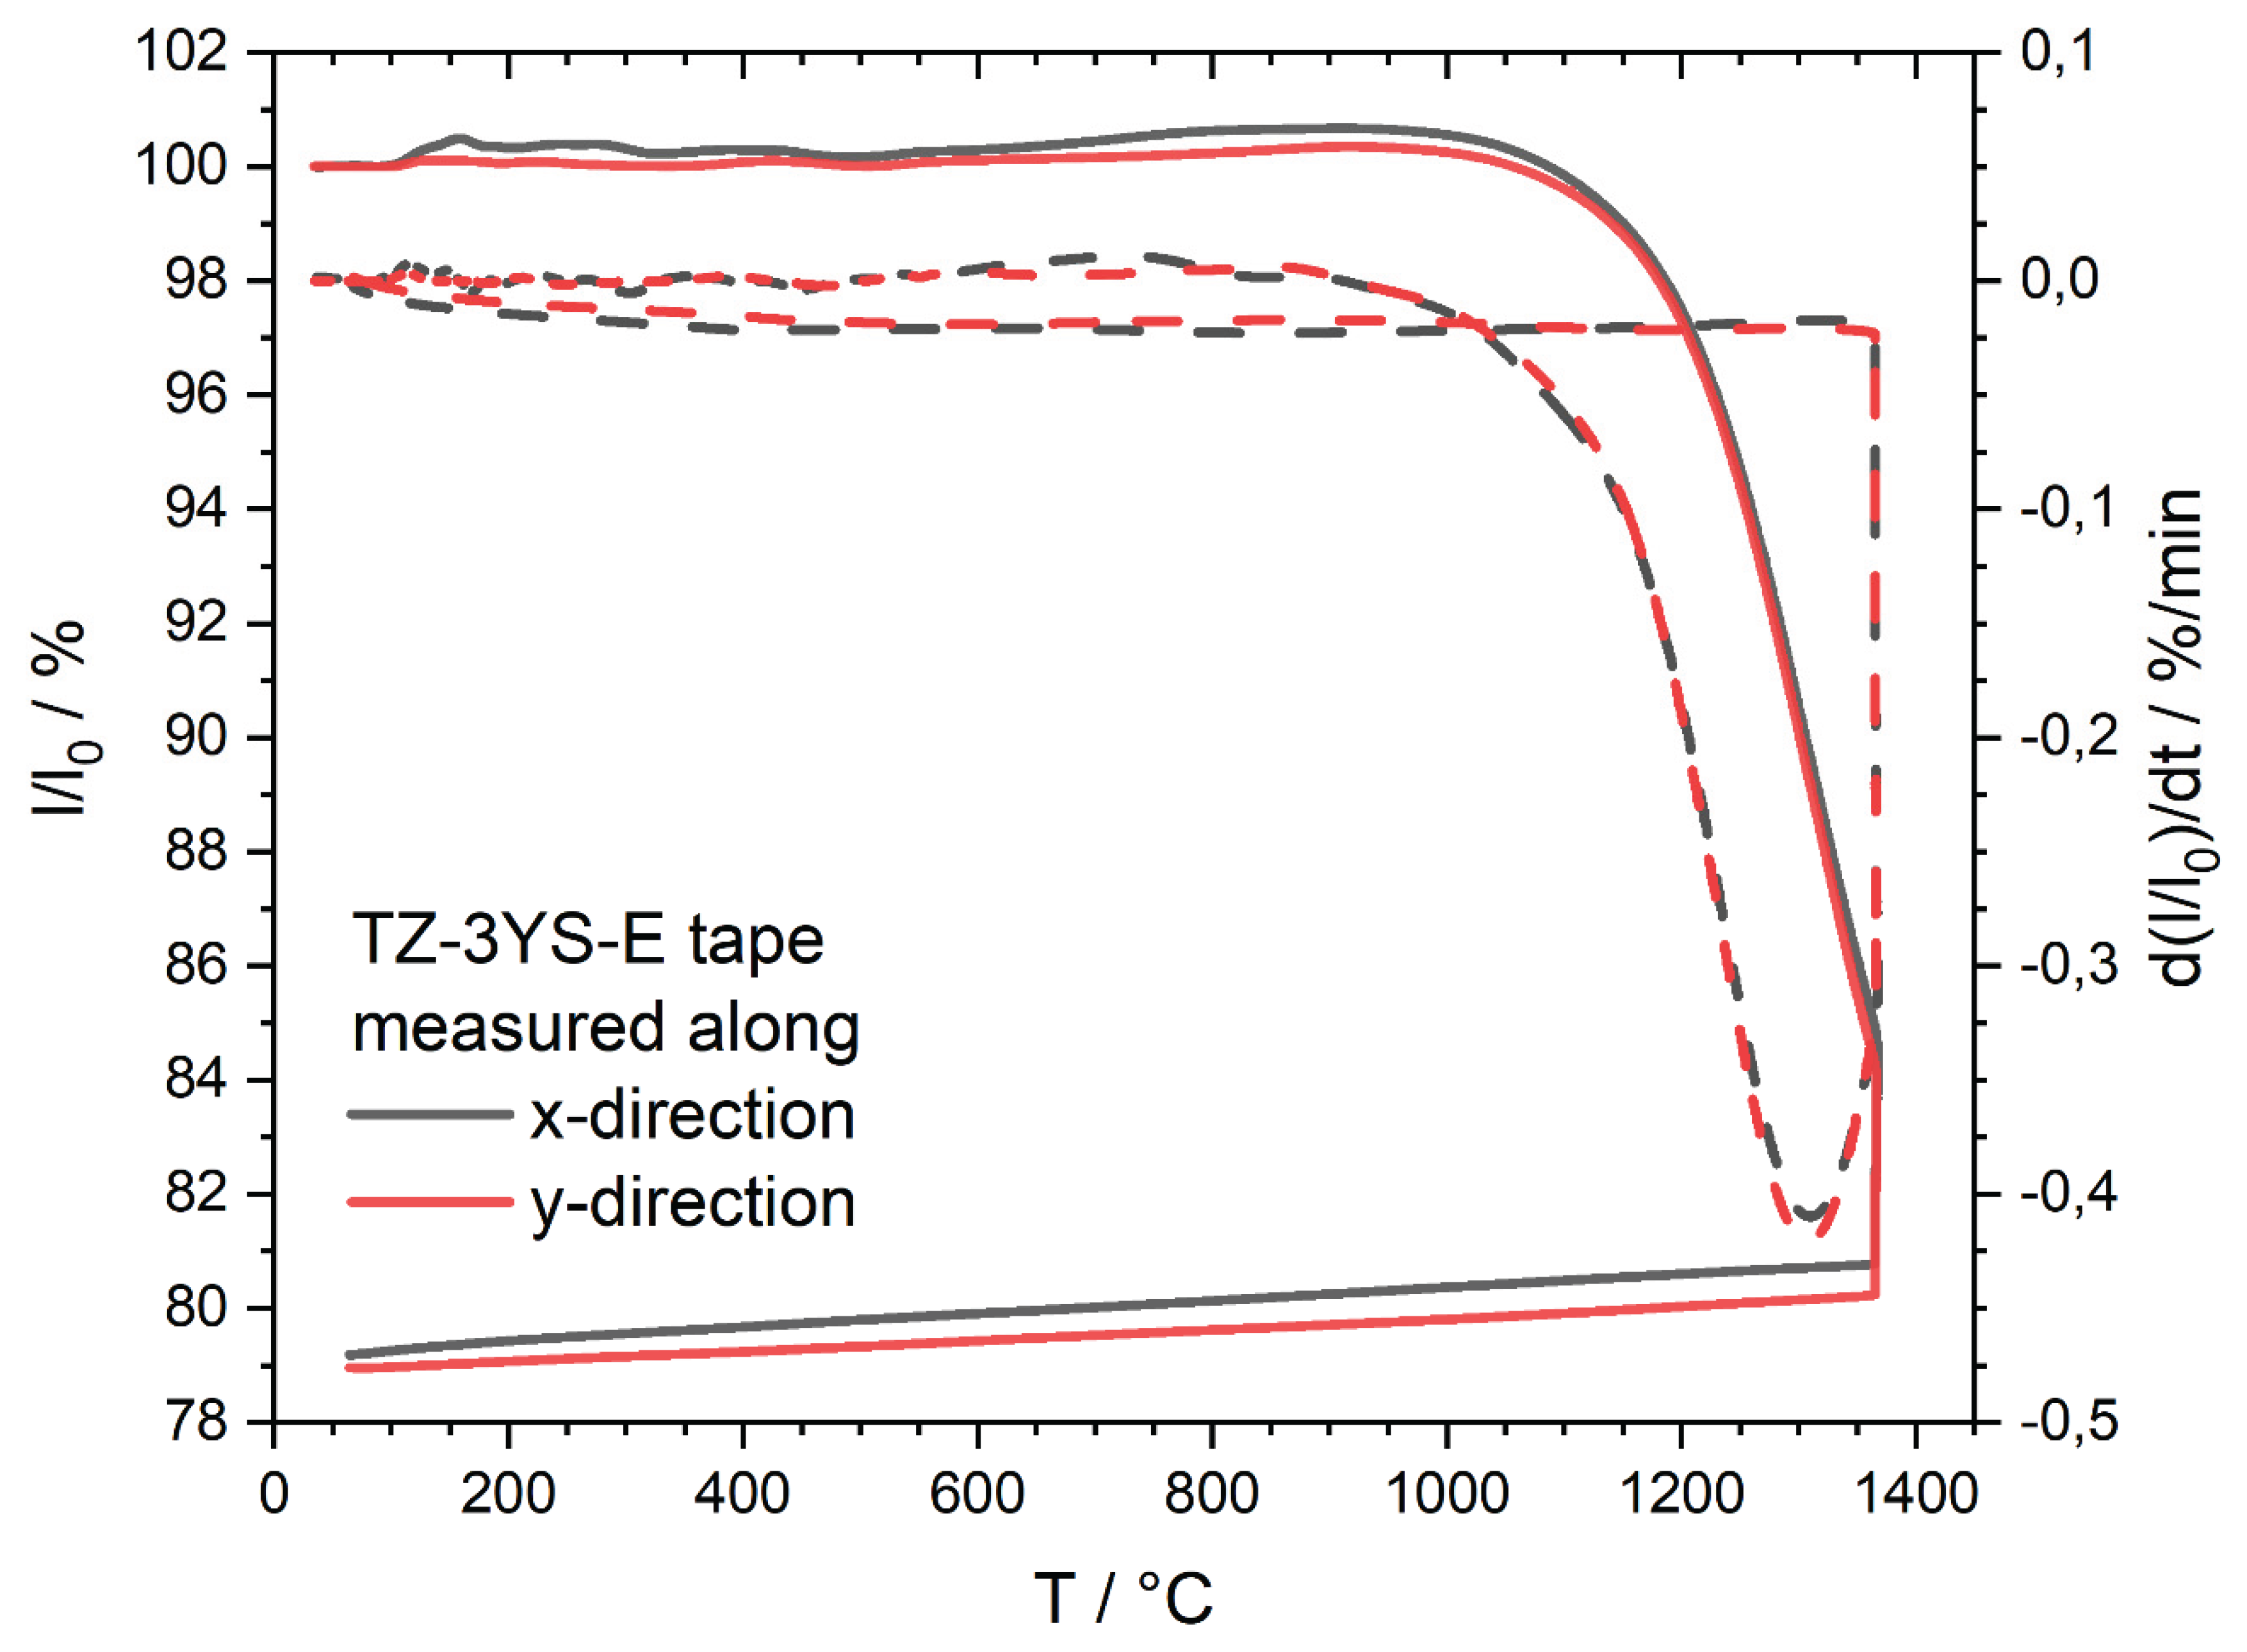
Figure 16.
Silhouettes from the optical dilatometry. Visible are images of a rolled TZ-3YS-E tape in the vertical standing ring fixing the rolled tape in the middle. The lower edge of the tape roll is covered by an aluminum oxide strip. (a) Upper series of images, the length is measured in y-direction of the ceramic tape and (b) lower series of images, the length is measured in x-direction. – From left to right with the corresponding temperature: (i) initial state; (ii) around onset temperature of shrinkage; (iii) at maximum sintering temperature; (iv) end of dwell time; (v) final state.
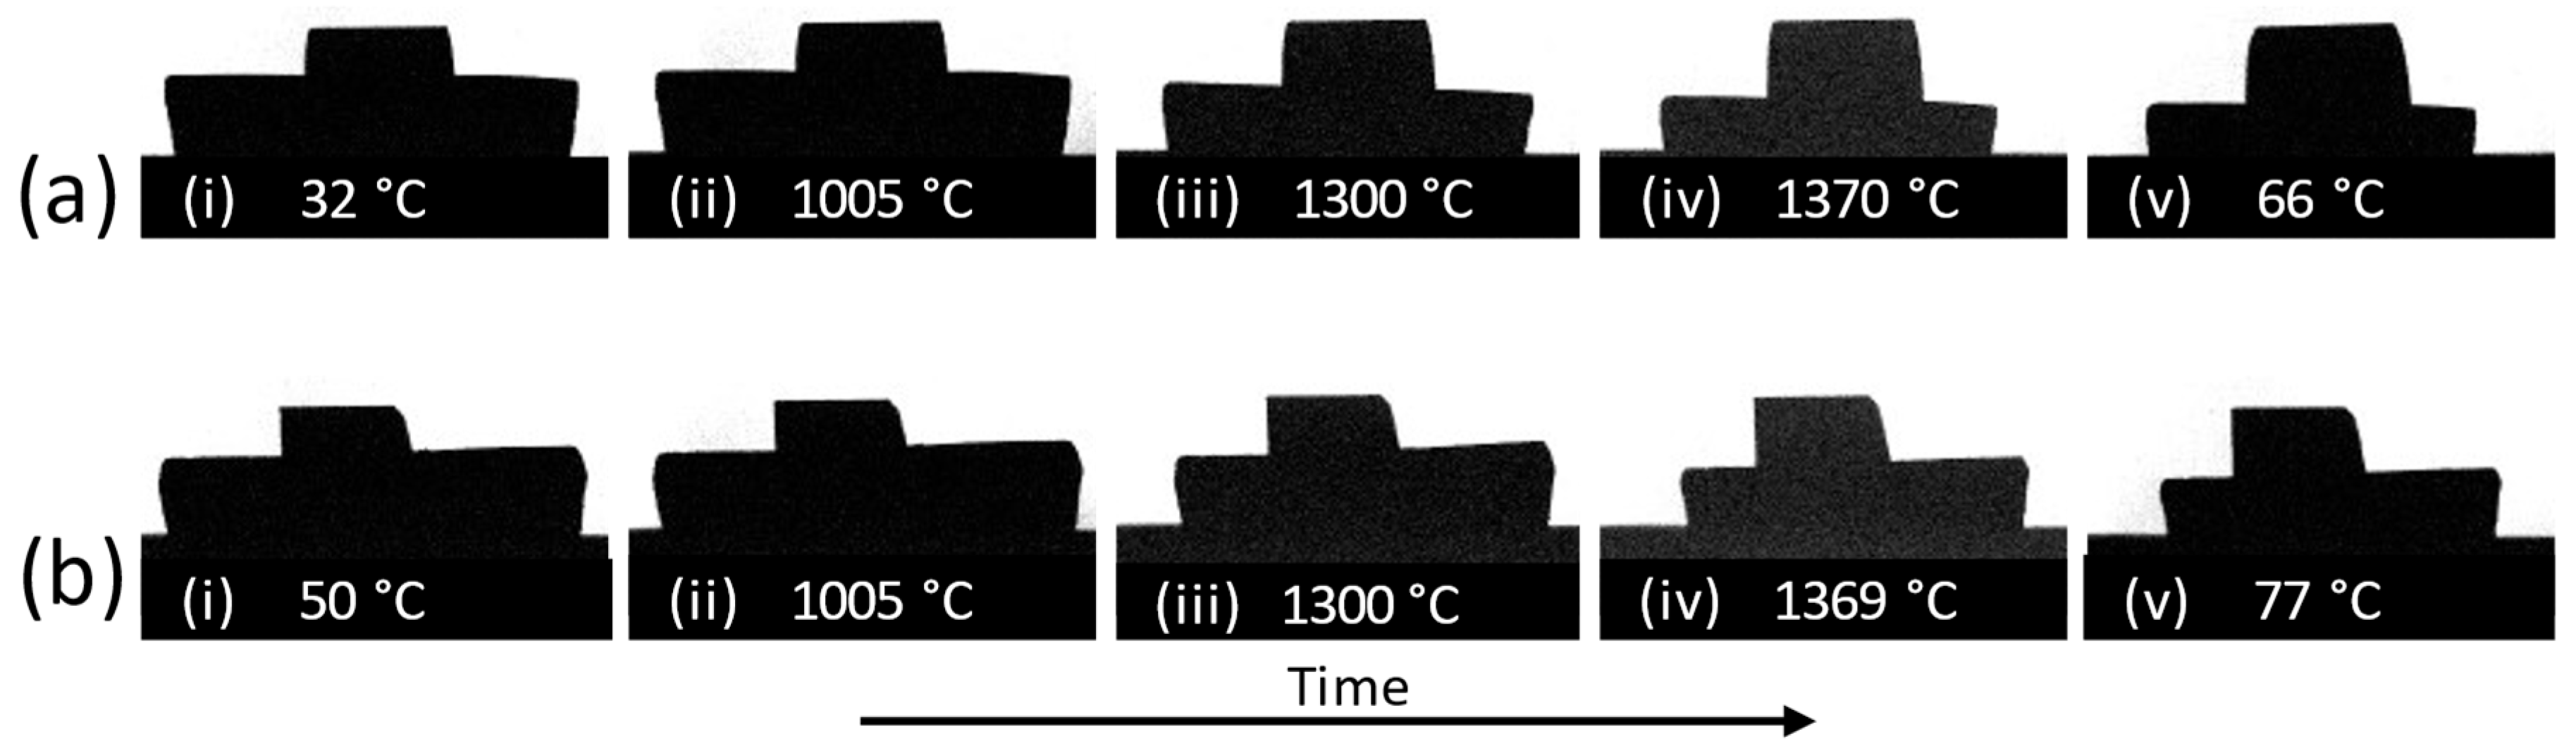
Figure 17.
Relative length (solid lines) and relative length change rate (dashed lines) of rolled TZ-3YS-E tapes between room temperature and 1370 °C measured via optical dilatometry. The black and red curves were determined by measuring the sample length in the x- and y-directions.
Figure 17.
Relative length (solid lines) and relative length change rate (dashed lines) of rolled TZ-3YS-E tapes between room temperature and 1370 °C measured via optical dilatometry. The black and red curves were determined by measuring the sample length in the x- and y-directions.
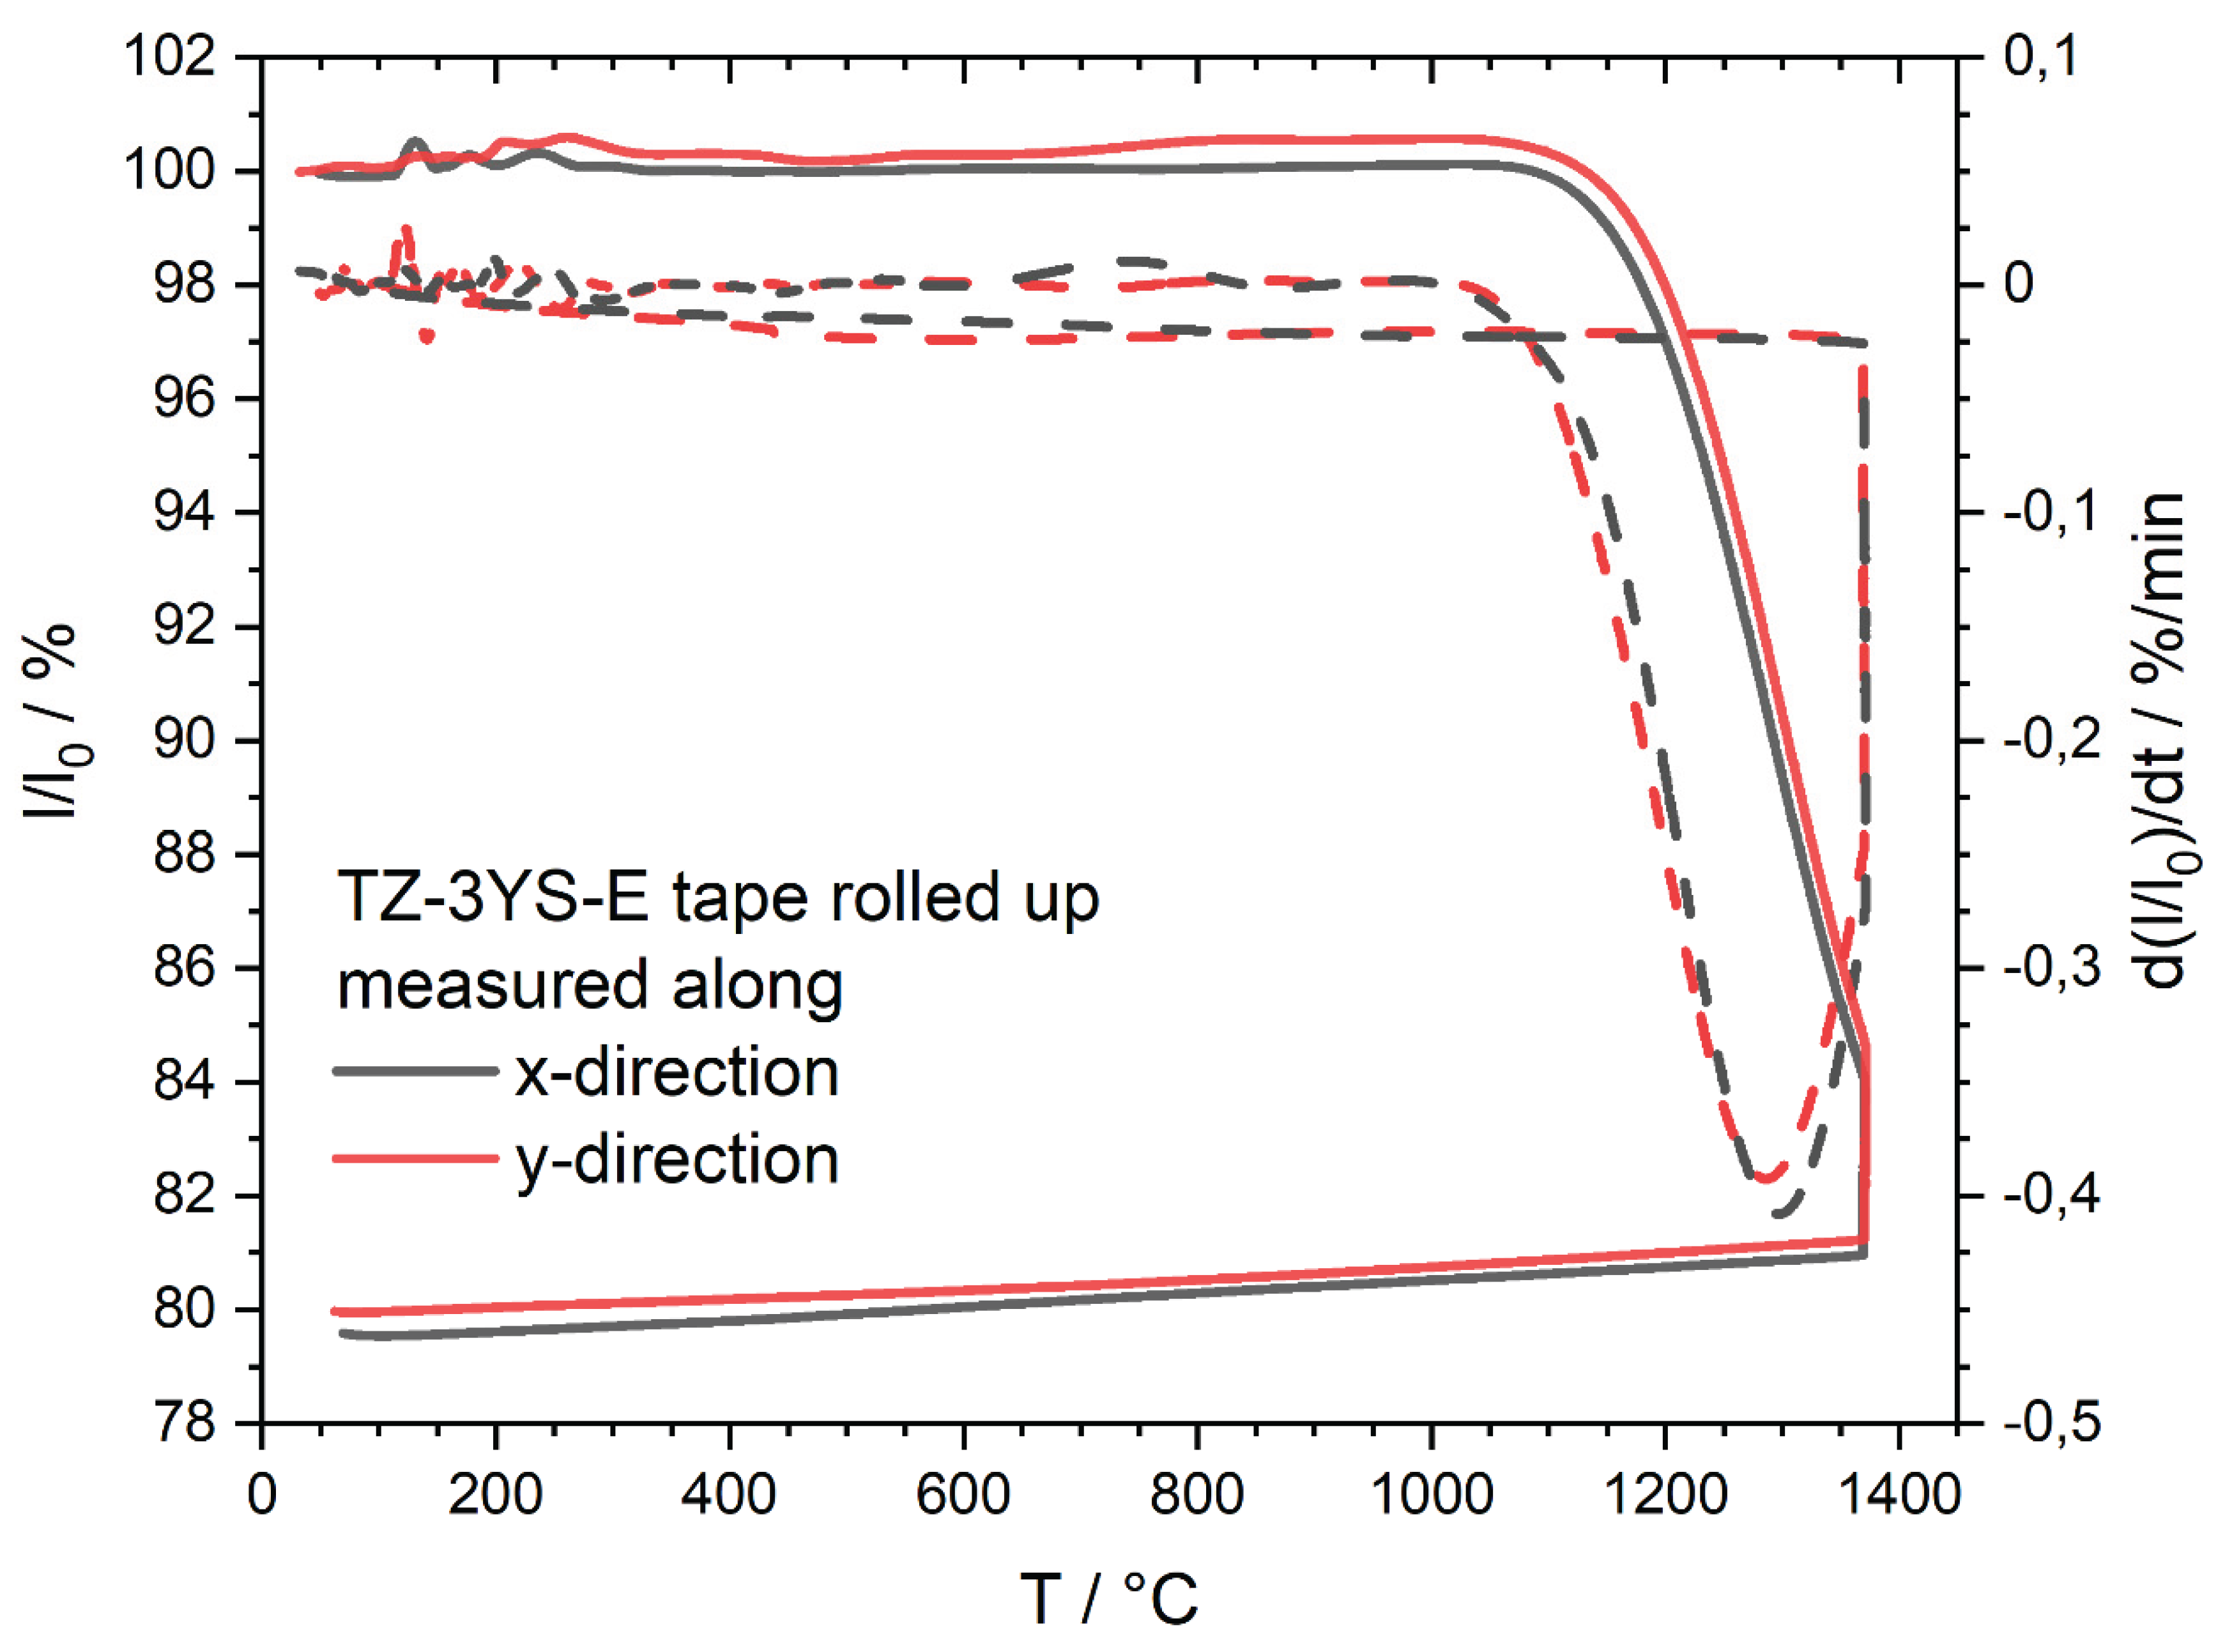
Figure 18.
Relative length (solid lines) and relative length change rate (dashed lines) of rolled TZ-3YS-E tapes measured in the push-rod dilatometer between room temperature and 1370 °C. The black and red curves were determined by measuring the sample length in the x- and y-directions.
Figure 18.
Relative length (solid lines) and relative length change rate (dashed lines) of rolled TZ-3YS-E tapes measured in the push-rod dilatometer between room temperature and 1370 °C. The black and red curves were determined by measuring the sample length in the x- and y-directions.
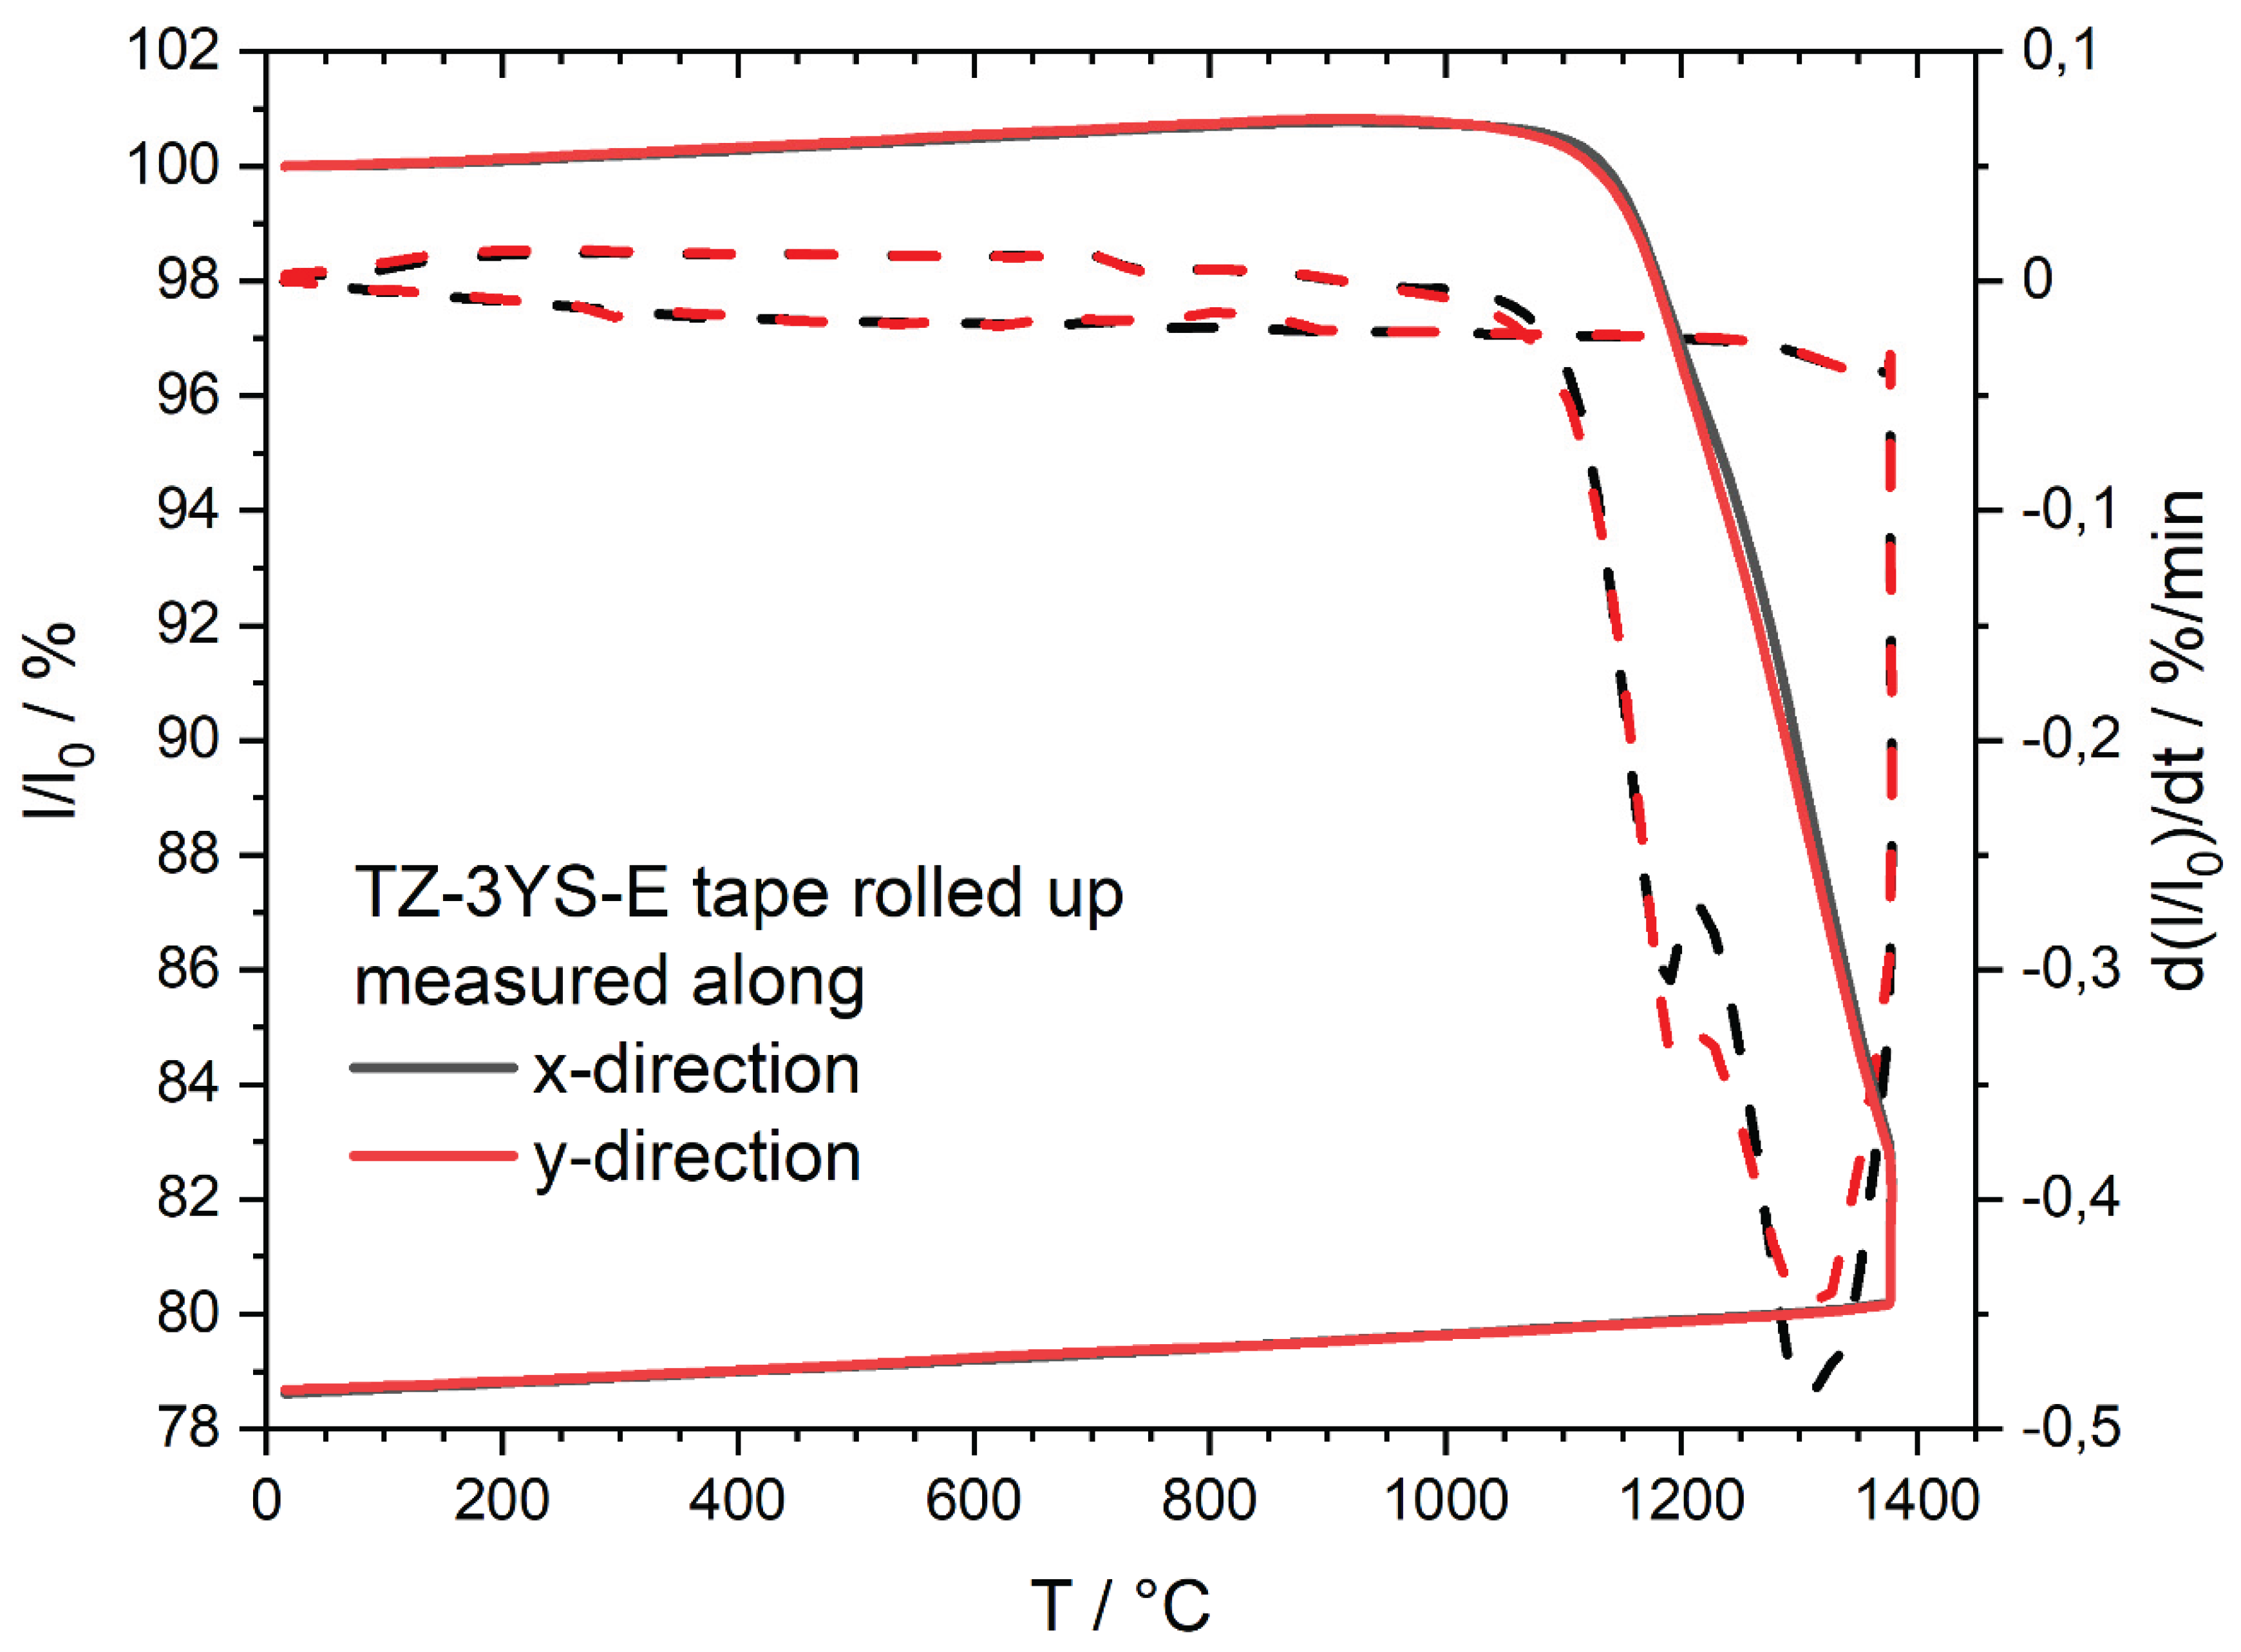
Figure 19.
Relative length normalized to 900 °C (solid lines) and relative length change rate (dashed lines) of rolled TZ-3YS-E tapes measured in an optical dilatometer (blue) and a push-rod dilatometer (green) between 900 °C and 1370 °C. Both curves were obtained by measuring the change in length corresponding to the y-direction of the tapes.
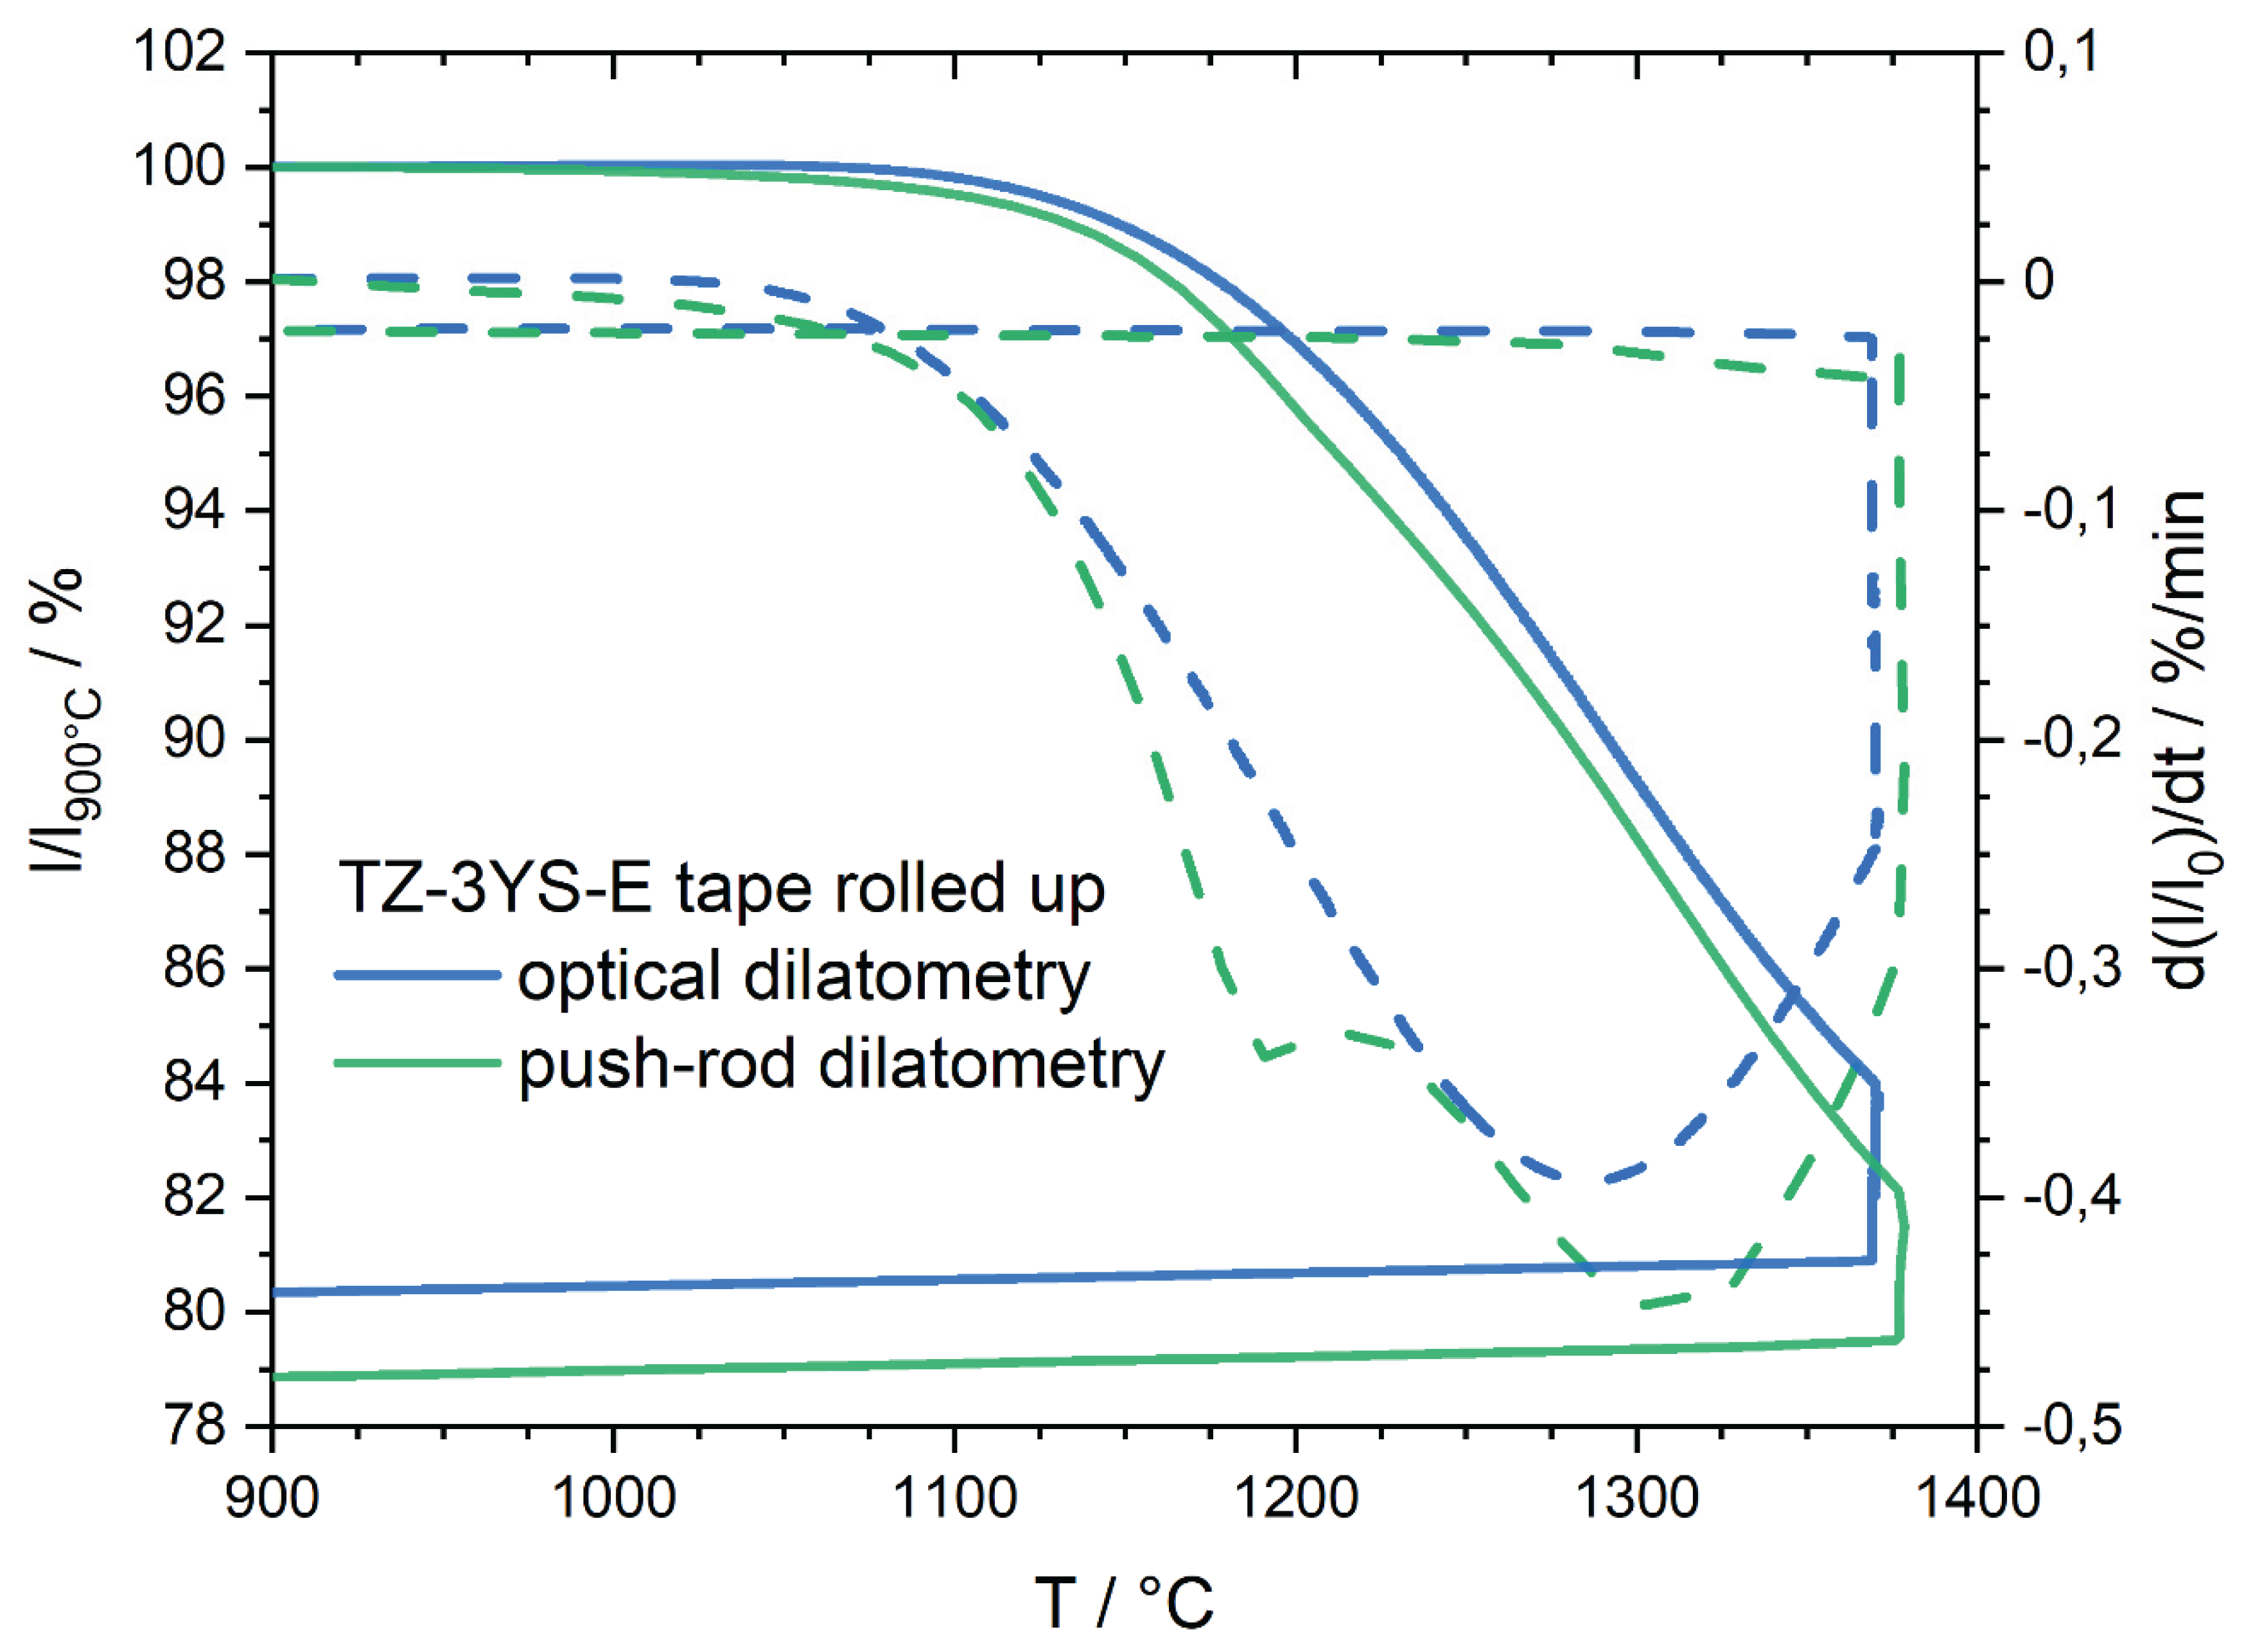
Table 1.
Approximate compositions for the steel and zirconia suspensions. The mass fractions of the powders and additives are given in percent.
Table 1.
Approximate compositions for the steel and zirconia suspensions. The mass fractions of the powders and additives are given in percent.
| Suspension content | Unit | 17-4PH | TZ-3YS-E |
| Powder | wt% | 69.17 | 61.47 |
| Deionized water | wt% | 25.33 | 31.30 |
| Binder | wt% | 2.34 | 2.80 |
| Plasticizing agent | wt% | 2.77 | 4.00 |
| Defoaming agent | wt% | 0.10 | 0.14 |
| Dispersing agent | wt% | 0.29 | 0.25 |
| Wetting agent | wt% | - | 0.04 |
Table 2.
Properties of the green steel and zirconia tapes.
| Tape property | Unit | 17-4PH | TZ-3YS-E |
| Density | g/cm³ | 4.61 | 2.72 |
| Relative density | % | 59.1 | 45.0 |
| Thickness of tape | mm | 0.32 | 0.41 |
| Top surface roughness | µm | 6.73 | 0.26 |
| Bottom surface roughness | µm | 0.86 | 0.18 |
Table 3.
Shrinkage in percent for 17-4PH and TZ-3YS-E listed by measurement method, measured tape direction and sample preparation.
Table 3.
Shrinkage in percent for 17-4PH and TZ-3YS-E listed by measurement method, measured tape direction and sample preparation.
| Method | Optical dilatometer* |
Caliper** | Push-rod dilatometer*** |
Caliper** | |||||
| Tape direction | x | y | x | y | x | y | x | y | |
| Material | Sample preparation | ||||||||
| 17-4PH | lying tape | 13.3# | - | - | - | - | - | - | - |
| - | 13.9 | - | - | - | - | - | - | ||
| tape rolled up | 15.2 | - | 15.1 | - | 16.4 | - | 16.7 | - | |
| - | 15.2 | - | 15.8 | - | 16.4 | - | 16.4 | ||
| TZ-3YS-E | lying tape | 20.8 | - | 20.4 | 19.9 | - | - | - | - |
| - | 21.0 | 20.1 | 20.4 | - | - | - | - | ||
| tape rolled up | 20.4 | - | 20.3 | - | 21.4 | - | 22.1 | - | |
| - | 20.0 | - | 20.3 | - | 21.3 | - | 21.7 | ||
Measurement uncertainty: * u(Δl) < 25 µm, ** u(Δl) < 30 µm, *** u(Δl) < 2.5 µm. # This value is calculated by the method described in section 2.5.
Table 4.
Characteristic temperatures for the sintering process of the tapes sorted by method (ODIL: optical dilatometer and DIL: push-rod dilatometer), x- and y-direction, material of the tape and type of sample preparation. For the definition of the points, see the supplementary material in Appendix D in Figure D1.
| Start of accelerated sintering in °C |
Maximum of relative length change rate in °C |
||||||||
| Method | ODIL* | DIL* | ODIL* | DIL* | |||||
| Tape direction | x | y | x | y | x | y | x | y | |
| Material | Sample preparation | ||||||||
| 17-4PH | lying tape |
1020 | 1080 | - | - | 1180 | 1200 | - | - |
| tape rolled up | 1090 | 1090 | 1050 | 1070 | 1220 | 1220 | 1280 | 1260 | |
| TZ-3YS-E | lying tape | 1160 | 1170 | - | - | 1300 | 1300 | - | - |
| tape rolled up | 1170 | 1180 | 1130 | 1130 | 1270 | 1290 | 1300 | 1300 | |
Temperature measurement uncertainty: * u(ΔT) < 1 K; u(T) < 5 K.
Disclaimer/Publisher’s Note: The statements, opinions and data contained in all publications are solely those of the individual author(s) and contributor(s) and not of MDPI and/or the editor(s). MDPI and/or the editor(s) disclaim responsibility for any injury to people or property resulting from any ideas, methods, instructions or products referred to in the content. |
© 2025 by the authors. Licensee MDPI, Basel, Switzerland. This article is an open access article distributed under the terms and conditions of the Creative Commons Attribution (CC BY) license (http://creativecommons.org/licenses/by/4.0/).
Copyright: This open access article is published under a Creative Commons CC BY 4.0 license, which permit the free download, distribution, and reuse, provided that the author and preprint are cited in any reuse.


