Submitted:
26 November 2025
Posted:
27 November 2025
You are already at the latest version
Abstract
For the first time, a comparative experimental analysis of the biophysical response in the form of a change in aquatic resistance was conducted for entamoeba gingivalis populations with an individual concentration of 1000 pcs/litre and 4000 pcs/litre under the influence of an electromagnetic field of the centimeter (2.1 GHz) and millimeter (42.25 GHz) wavelength ranges. It was shown that the studied populations demonstrate qualitatively comparable biophysical responses to external electromagnetic exposure in the centimeter and millimeter ranges in the form of a change in aquatic resistance. It was established that the biophysical response is characterized by four temporal phases: 1) the information exchange phase, 2) the phase of decreasing aquatic resistance, 3) the phase of a stable state of reduced resistance, 4) the phase of increasing resistance. The nature of the biophysical responses indicates a group reaction of individuals in the populations. The duration of the biophysical response phases depends on the frequency of the acting field and the pH value of the aquatic environment. It was established that the demonstrated functional states of the "water - entamoeba gingivalis population" system are more stable when exposed to a millimeter-wave electromagnetic field.
Keywords:
electromagnetic field
; entamoeba gingivalis population
; aquatic resistance
; centimeter- and millimeter-wave electromagnetic fields
Introduction
The effects of electromagnetic fields (EMF) on biological organisms have occupied the minds of both scientists and developers of electronic communications and countermeasure equipment for over sixty years. The most significant advances in this field have been achieved in the extremely high frequency (UHF) range, where methods and devices have been developed for both determining the functional state of the human body by processing its radiothermal signal and for correcting the internal organs of the entire organism by stimulating biologically active points of the organism under study [1,2,3]. Furthermore, the significant restorative effects of ultra-wideband electromagnetic signals of non-thermal power in the millimeter (MM) wavelength range have been demonstrated, not only as an activating element but also as an auxiliary tool in functional diagnostics using active near-field radiothermometry. However, uncontrolled exposure of the human body to centimeter (CM) and MM electromagnetic fields with a power even below the non-thermal intensity threshold can significantly impact the functional state of the biological object under study.
Thus, in [7], the manifestation of biological effects caused by electromagnetic fields in humans is examined. The main result of the work was the assertion that electromagnetic fields can cause health problems, including electromagnetic hypersensitivity, a phenomenon characterized by the appearance of symptoms after human exposure to electromagnetic fields. In [8], it installed that new wireless technologies and applications are being introduced without any certainty about their impact on health, which poses new challenges for medicine and society. Moreover, the key to diagnosing a patient currently lies in a detailed anamnesis, which should include all symptoms and their manifestations in a spatial and temporal context, as well as in the context of EMF exposure. A review of current knowledge is provided on the health risks associated with EMFs of various power levels in the frequency ranges used, including the 4G standard.
In [9,10], an important area of research is the identification of the role of weak and pulsed electromagnetic fields, which have been used for therapeutic purposes in recent decades, becoming one of the main areas of activity in the field of bioelectromagnetic technologies. It is argued that low-level non-thermal electromagnetic fields can have a sufficient influence on chemical processes to induce biological effects in living organisms. It is shown that within the ranges used, depending on the specific orientation of the test signal relative to the background static magnetic field, its waveform, and amplitude values, significantly different chemical results can be obtained for the chemical reactions of radical pairs. This provides the basis for explaining the special biological significance of pulsed electromagnetic fields, such as signals from cell phones.
Mobile EMF sources are the most active radiation generators at the current stage of social development. The EMFs emitted by such devices are, on the one hand, powerful pulsed signals, but on the other, they can create a virtually continuous overall electromagnetic background. The effect of this constantly changing electromagnetic background of high peak power on living organisms is significant, which has recently become a priority topic in the scientific literature, for example, [12,13,14,15]. The main topic here is the transition of cellular communications to the high-frequency zone of the 5G range, which is located in the millimeter-wave portion of the EMF. The authors of this study concluded that cellular devices in the millimeter-wave range may be less dangerous to human health, since UHF therapy, which has been in existence for over half a century, has already proven its validity in the field of restorative medicine. However, to ensure the rigor of such evidence, it is crucial to conduct methodical model experiments to comparatively analyze the effects of microwave and millimeter-wave EMFs on the human body.
An important area of the study in the impact of electromagnetic fields on the human body is the implementation of model experiments to examine changes in the functional state (FS) of humans under the influence of fields of varying intensity and duration of exposure. Assessing the resilience and determining the functional states of biological object is a pressing task in engineering psychology, serving as the basis for research evaluating the effectiveness of the human body [16]. The implementation of model experiments involving the impact of electromagnetic fields on a combined population of protozoa helps to identify the main qualitative trends and quantitative values of changes in the FS of the biological object under the influence of electromagnetic fields of varying frequency, power, and structure.
The first model experiment on the effects of SM EMF known to the authors was conducted at the V.A. Kotelnikov Institute of Radioelectronics, Russian Academy of Sciences, in 2003 [17]. A population of the entamoeba gingivalis was used in the experiment. When setting up model experiments, a population of this amoeba species is characterized by its resistance to changes in external conditions over a wide temperature range, and its simplicity in development and existence, including strong deviations from normal conditions. The population remains viable at water pH parameters from 4.2 to 7.8. As shown in [18], studying EMF on a population of the entamoeba gingivalis can serve as a good model experiment for investigating the response of biological organisms to EMFs of various structures. The dependence of the biophysical radio response of a population of the entamoeba gingivalis on the pH value of the aquatic environment has not been previously studied.
The objective of this study was to conduct comparative model experiments to determine the biophysical response of a water-population system containing the entamoeba gingivalis exposed to centimeter-wave (2.1 GHz) and millimeter-wave (42.25 GHz) electromagnetic radiation at pH values of 5.8 and 7.1.
The results of this study will be the identification of characteristic changes in the aquatic environment of protozoan populations for recording during model experiments to study the effects of electromagnetic fields on biological objects.
Materials and Methods
This study examined the biophysical response of populations of the protozoan entamoeba gingivalis at pH values of 5.8 and 7.1 in the aquatic environment.
As demonstrated in [4,5,6,17,18], the biophysical response of an amoeba population to an external electromagnetic field (EMF) can be recorded as a change in the aquatic resistance, with the entire biophysical response lasting approximately 1 hour. Thus, the biophysical response of an entamoeba gingivalis population exposed to an EMF is a time-dependent process consisting of a constant value, a decrease in the constant value, and a smaller increase in the aquatic resistance. It will be interesting to determine how changes in the aquatic pH influence the biophysical radioresponse parameters of entamoeba gingivalis, which will allow us to generalize the obtained results. The experiments used populations of entamoeba gingivalis with concentrations of 1000 pcs/liter and 4000 pcs/liter during the population growth slowdown phase. The concentration of protozoan individuals was recorded before and after each experiment by measuring it with a guaranteed accuracy of 5% in a Goryaev chamber and, as measurements showed, remained virtually constant throughout the entire controlled period of the experiment.
The entamoeba gingivalis population is the only known model organism for studying the biophysical response of living organisms to external electromagnetic fields (EMFs) in the form of real-time changes in aquatic resistance. The advantage of the entamoeba gingivalis population in model experiments lies in the wide range of conditions under which it develops and thrives, including normal conditions. The entamoeba gingivalis population is characterized by rapid growth and metabolism, a distinct advantage over other simple microorganisms. Furthermore, an important indicator is the population’s resilience to environmental changes and the possible presence of other protozoans, which increases the reliability of the experiments. Another important characteristic is the similarity of metabolic processes in the entamoeba gingivalis population to those of higher organisms.
The temperature of the aquatic environment of the entamoeba gingivalis population was 22 °C in all experiments and was determined by the air temperature in the laboratory, which was automatically maintained using an air conditioner. Atmospheric pressure was 734 mmHg. During all experiments, deviations from the specified values did not exceed 1%.
The experimental setup diagram is shown in Figure 1 and corresponds to the setup described in [17,18]. Water cuvette 1 is used as a leg of the Wien-Robinson bridge circuit. The constant resistance values were 10 kOhm, while the variable resistance value was 15 kOhm. A change in the resistance of the aqueous medium in the cuvette resulted in an imbalance voltage in the bridge circuit, which was converted by amplifier 2 and recorded as a time diagram on graph plotter 3, which graphically recorded the voltage change during a single plotter sweep duration of 70 minutes. The time constant of the measuring circuit was 5 seconds, which, with a setup sensitivity of 5 10-2%/cm, only allowed for the recording of processes of a fairly long duration. Voltage U0 = 20 V.
The cuvette was irradiated with centimeter-wave (2.1 GHz) and millimeter-wave (42.25 GHz) non-thermal electromagnetic fields with an EMF power flux of 5 mW/cm2. The following radiation sources were used:
in the millimeter-wave range, a G4-80 generator (https://www.meratest.ru/produktsiya/radioizmeritelnie_pribori/generatory_signalov/vch/product/g4-81/)
in the millimeter-wave range, a Resla KVCh-ND ultra-high-frequency therapy device with a 42.25 GHz radiation head (https://www.medcomp.ru/catalog/product/apparat-kvch-terapii-resla-kvch-nd/?ysclid=m9tq4k05ew108368341).
The experiments were accompanied by precise measurement of the water temperature in the cuvette with an accuracy of 0.01 °C, which revealed that in all cases, the change in the aqueous medium’s temperature in the cuvette did not exceed 0.02 °C during the entire plotter sweep time.
Studies conducted with water at pH values of 5.8 and 7.1 did not reveal any long-term effects from exposure to EMF. Preliminary experiments showed that at protozoan concentrations of up to 100 pcs/liter, no biophysical effects in the form of significant changes in the aqueous medium’s resistance were observed [4,5,6,17,18].
Biophysical response of the entamoeba gingivalis population to external electromagnetic fields in aquatic environments at different pH values
The developed experimental methodology was hypothetically based on the possibility of recording the response of the “water—protozoan population” system in the form of changes in the parameters of the aquatic environment under external influence of EMF [4,5,6,17,18]. Indeed, according to the concept of population homeostasis [19], intrapopulation relationships of protozoans must ensure population unity through the population’s action on water as its habitat. Then, the effect of EMF on a protozoan population should lead to changes in the parameters of the aquatic environment due to the mutual influence of system “water—protozoan population”.
In this part, experimental studies are conducted on the biophysical response of a population of the entamoeba gingivalis under external influence of centimeter (2.1 GHz) and millimeter (42.25 GHz) non-thermal electromagnetic radiation with an EMF power flux of 5 mW/cm2. The exposure duration in all experiments was 90 seconds. The pH valuesof the aquatic habitat of entamoeba gingivalis populations were 5.8 and 7.1.
For each experiment, a series of four measurements was conducted. Average aquatic resistance values and their standard deviations were calculated using direct measurement data. Excel 2024 built-in capabilities were used to calculate average resistance curves.
Figure 2 shows the average biophysical response curves for a population of the entamoeba gingivalis exposed to 2,1 GHz electromagnetic radiation at a concentration of 1000 pcs/liter. The EMF exposure occurred between points A and B. The exposure time in all experiments was 90 seconds. The biophysical response curves were obtained for pH values of 5.8 and 7.1 in the aquatic environment of the entamoeba gingivalis population. Curve 1 corresponds to a pH of 5.8, and curve 2 to a pH of 7.1. For simplicity, the characteristic biophysical response times T1–T2 of the “water—entamoeba gingivalis population” system are shown for curve 1. The figure shows that the pH of the aquatic environment significantly influences the dynamics of processes occurring in the studied “water–entamoeba gingivalis population” system. An increase in pH leads to changes in both the characteristic biophysical response times of the population and the maximum changes in aquatic resistance.
Let’s consider Figure 2, which demonstrates changes in aquatic resistance of a population exposed to EMF, in more detail. The course of the curves indicates the biophysical nature of the response of the entamoeba gingivalis population. Let’s look at curve 1. Initially, the studied system “water—entamoeba gingivalis population” is characterized by a stable FS1 with unchanged resistance for a time of T1 = 12 minutes. After this, the aquatic resistance begins to decrease to the next stable FS2. The time of decreasing aquatic resistance is T2 = 6 minutes. The system remains in the second stable FS2 of minimum aquatic resistance for T3 = 28 minutes. Then, over a time of T4 = 4 minutes, the aquatic resistance increases almost to the initial value, and the system transitions to the initial stable FS1. It is worth noting that the stable FS2 of the “water—entamoeba gingivalis population” system with reduced aquatic resistance has a two-level nature. At a time of 33 minutes, as shown in Figure 2, the value of the change in the resistance of the aquatic environment changes by 0.03%, which may indicate the characteristics of the group behavior of individuals of the entamoeba gingivalis population at a minimum value of water resistance. The time from the beginning of phase T3 to the point of transition to the second stable level of PS2 is approximately equal to the time T1, which indicates that the value of these times is determined by the duration of the exchange of information between individuals of the population, which is confirmed by the concept of population homeostasis of a protozoan population based on the integrity and stability of the population in the external environment [18].
Let’s consider curve 2 in Figure 2. Variations in the pH of the aquatic environment of an entamoeba gingivalis population at a concentration of 1000 pcs/liter lead to a significant change in the qualitative picture of the biophysical response to EMF exposure with a frequency of 2.1 GHz. The experiments demonstrate four distinct phases of the biophysical response:
T1 is the phase of constant aquatic resistance;
T2 is the phase of decreasing aquatic resistance;
T3 is the phase of steadily reduced aquatic resistance;
T4 is the phase of increasing aquatic resistance to the initial level.
The duration of the biophysical response phases in each case ranges from a few minutes to tens of minutes. Interfunctional transitions in the “water—entamoeba gingivalis population” system (PS1–PS2–PS1) necessarily indicate the biological nature of the processes occurring in the studied system, as the duration of the processes recorded in the system exceeds the period of the external signal by ten orders of magnitude.
Let us refer to Figure 3, reflecting the dynamics of the resistance of the aquatic environment of the entamoeba gingivalis population with a concentration of 4000 pcs/liter under the influence of an EMF with a frequency of 2.1 GHz. The EMF exposure also occurred between points A and B and lasted 90 seconds. The biophysical response curves were also obtained for two pH values of the aquatic environment of the entamoeba gingivalis population. Curve 1 corresponds to a pH of 5.8, curve 2 was obtained at a pH of 7.1. The temporal dynamics of changes in the resistance of the aquatic environment demonstrates clearly defined four phases of the biophysical response of the entamoeba gingivalis population: T1, T2, T3, T4, which indicates the population transition PS1–PS2–PS1. The nature of the processes in the “water—entamoeba gingivalis population” system at a concentration of individuals of the population of 4000 pcs/liter. The results of exposure to 2.1 GHz EMF are qualitatively similar to those presented in Figure 2 for external exposure to 2.1 GHz EMF on a population of entamoeba gingivalis at a concentration of 1000 pcs/liter. Changes in the duration of the biophysical response phases affect both the overall duration of the radiobiological response of entamoeba gingivalis and the duration of the determining time intervals of the process. The maximum value of the decrease in aquatic resistance also changed. In general, the biological response of the “water—entamoeba gingivalis population” system at a population concentration of 4000 pcs/liter when exposed to 2.1 GHz EMF is, on average, more intense than at a population concentration of 1000 pcs/liter. The experiments also recorded a two-level nature of the stable FS2 population of entamoeba gingivalis with a minimum value of aquatic resistance replacing each other over a time interval of 32–33 minutes of the experimental time scale.
Let us consider Figure 4. The figure shows the curves of the time dynamics of changes in the resistance of the aquatic environment in the “water—entamoeba gingivalis population” system at a concentration of 1000 pcs/ liter under the influence of an EMF with a frequency of 42.25 GHz at two pH values of the aquatic environment. Curve 1 was obtained at pH = 5.8, curve 2 at pH = 7.1. The dynamics of the biophysical response process reveals 4 main phases: T1, T2, T3, T4, which qualitatively determine the time intervals of processes similar to those considered in Figure 2 and Figure 3. Such dynamics of processes indicates the transition FS1–FS2–FS1, which is qualitatively similar to the processes recorded in experiments under the influence of EMF in the SM range. Of the main features of the identified biophysical response, the most interesting is the fact of a shorter time interval of stable FS2 of the “water—population of entamoeba gingivalis” system at the minimum value of the resistance of the aquatic environment and a more significant difference in the magnitude of stable levels in this state than in Figure 2. It is also worth noting that an increase in the frequency of the external EMF significantly increases the first time interval T1 of FS2, indicating the time of information exchange between individuals of the population under MM external influence.
Let us turn to Figure 5, which demonstrates the temporal dynamics of the biophysical response in the “water—entamoeba gingivalis population” system at a population concentration of 4000 pcs/liter. The impact in this case is produced by an external EMF with a frequency of 42.25 GHz. The experiment was conducted for two pH values Δ(%) of the aquatic environment. Curve 1 was obtained at pH = 5.8, curve 2 at pH = 7.1. Although the system dynamics demonstrate the transition FS1–FS2–FS1, the time interval of the change in the aquatic environment T2 in this case is distinguished by its smallest value with practically the most significant information exchange time T1. Moreover, the difference in the resistance of the aquatic environment FS1 and FS2 is not as significant as at a population concentration of 1000 pcs/liter.
Discussion of Results
The experiments to study the response of the entamoeba gingivalis population to an EMF, which is defined as a temporary change in water resistance, indicate a group response of individuals of the population to an external influence, as evidenced by the transitions FS1–FS2–FS1 recorded in all experiments. A comparison of the values of characteristic times in the experiment and the calculated information-exchange time of the population indicate that the effect of the EMF directly affects the cell, as already noted in [4,5,6,17,18]. The entamoeba gingivalis population behaves as a single organism. This confirms the fact that the exchange process of information about the external influence is based not only on biochemical reactions at the level of metabolites [19], but also on the process of biological structuring of water changing its resistance. The present studies allow us to conclude that the time of the transient process T2 of the dependence of the biophysical effect on power is the time of information exchange between individuals of the population. The biological effect of reduced aquatic resistance in a protozoan population is subject to population homeostasis and is associated with the transition of the water-population system from PS1 to a new stable state, PS2. The dynamics of the water-population system of entamoeba gingivalis observed in laboratory studies indicate the biological nature of the processes occurring.
Table 1 summarizes the values of the time intervals T1–T4 of the presented biophysical responses obtained in the experiments at different values Δ(%) of concentrations of individuals of the entamoeba gingivalis population under the influence of external EMFs with frequencies of 2.1 and 42.25 GHz for pH values Δ(%) of the aquatic environment of 5.8 and 7.1 and the maximum values of changes in the resistance of the aquatic environment during FS2 and the total time of the biophysical response for each experiment, which is calculated as T1 + T2 + T3 + T4 in accordance with the processes demonstrated in Figure 2, Figure 3, Figure 4 and Figure 5. The last row of the table indicates the maximum value Δ(%) of the change in the resistance of the aquatic FS2 environment for each curve (1 and 2) of Figure 2, Figure 3, Figure 4 and Figure 5.
The values Δ(%) of the determining parameters presented in the table indicate a significant difference in the dynamics of changes in aquatic resistance with changes in both the concentration of individuals in the population and the wavelength of the influencing signal, all other things being equal. Aquatic parameters, in this case the pH value, also significantly influence the course of changes in water resistance. Let us consider changes in the dynamics of the aquatic environment of the entamoeba gingivalis population with changes in the influencing signals in more detail.
The table shows that, at a population concentration of 1000pcs/liter entamoeba gingivalis, the transition of the influencing signal to the millimeter range of the spectrum leads to a decrease in the total biophysical response time (T1 + T2 + T3 + T4) by 10% at pH = 5.8 and by 8.5% at pH = 7.1. However, for the constituent time intervals, the total biophysical response time of the process phases changes individually. Thus, for T1, the phase of information exchange about the nature of the external stimulus, the changes are 25% and 49%; for T2, the phase of decreasing resistance of the aquatic environment, -50% and 50%; for T3, the phase of FS2 of reduced resistance of the aquatic environment, -10% and -13%; for T4, the phase of recovery of the resistance value to the initial level of FS1, -50% and -20% for pH = 5.8 and pH = 7.1, respectively. The conducted analysis shows that MM EMF act on biological objects differently than SM EMF. After exposure to MM EMF, a biological organism returns to its initial state more quickly, that is, FS2 is shorter. At the same time, the time of transition to another stable state caused by external EMF, that is, the FS1–FS2 process, increases significantly, as indicated by the increase in the T1 phase. On the other hand, the decrease in T3 FS2 and T4, which determines the transition of FS2–FS1, indicates the possibility of a faster return of the biological organism to the original FS1 after external exposure to MM EMF compared to SM EMF. This is observed for pH values Δ(%) of both 5.8 and 7.1 in the aquatic environment, which makes the obtained results more generalizable.
Let us consider the dynamics of the aquatic environment of the population with a concentration of 4000 pcs/liter. The values Δ(%) of the fundamental parameters given in Table 1 indicate that the transition of the influencing signal to the MM part of the EMF spectrum leads to a significant reduction in the biophysical radio response time, by 9.5% at pH = 5.8 and by 10% at pH = 7.1 compared to the impact of the SM EMF. At the same time, the time T1, the phase of information exchange about the external impact, increases significantly, the changes are 40% and 63% for pH = 5.8 and pH = 7.1. The change for T2, the phase of decreasing resistance of the aquatic environment, is 20% and 0%; for T3, FS2 of reduced resistance of the aquatic environment, -32% and -38%; For T4, the phase of resistance recovery to the initial level, the values Δ(%) were -40% and -28% for pH = 5.8 and pH = 7.1, respectively. The results of the experiments indicate that the FS1–FS2–FS1 process is generally shorter under the external influence of millimeter-wave electromagnetic fields (MM EMF) compared to the SM EMF, all other things being equal. Moreover, the values Δ(%) of the T1 and T2 times under the influence of millimeter-wave electromagnetic fields indicate a greater resistance of the initial FS1 of biological objects to millimeter-wave electromagnetic fields compared to the SM EMF.
Let us turn to the parameter Δ(%)max, which determines the maximum value of the change in the resistance of the aquatic environment of the entamoeba gingivalis population during FS2. The values Δ(%) of max indicate that at a population concentration of 1000 pcs/liter. Exposure to MM EMF causes a more significant decrease in the resistance of the aquatic environment, while the difference between the maximum value of the biophysical effect under exposure to MM and SM EMF is +14% for pH = 5.8 and + 7% for pH = 7.1. In the case of a higher value of the entamoeba gingivalis population concentration, equal to 4000 pcs/liter, the values Δ(%) of the parameters in the table indicate a different picture of changes during the transition of the external influencing signal from the SM to the MM part of the EMF. Here, the difference between the maximum value of the biophysical effect under exposure to MM and SM EMF is -13% for pH = 5.8 and -7% for pH = 7.1. This indicates a higher adaptive capacity of the entamoeba gingivalis population with increasing concentrations of individuals. That is, the “water-entamoeba gingivalis population” system under consideration is functionally more stable at a concentration of 4000 pieces per liter than at 1000 pieces per liter.
Thus, the conducted experiments showed that in all the cases considered, the “water-entamoeba gingivalis population” system exhibits two stable functional states, FS1 and FS2, when exposed to EMF in the SM and MM wavelength ranges. The first is the basic FS1, in which the studied system exists prior to exposure to the EMF. The second FS2 is the state into which the system enters after a time of T1 + T2 after exposure to the EMF. The system remains in the second stable FS2 for a time of T3, equal in order of magnitude to 10 minutes. This suggests that a relatively stable set of processes is observed in the system, which predetermines the specific existence of the system in FS2, which is qualitatively different from the basic stable FS1. After the end of the T3 FS2 time, processes begin in the system that, after a time of T4, transfer it to the basic FS1, which is the most natural and, therefore, a more stable state of the system realized during the background activity of the entamoeba gingivalis population.
An important experimental result is the fact that in the “water—population of entamoeba gingivalis” system, at a concentration of 4000 pcs/litre, the relative changes in the resistance of the aquatic environment of PS2 under the influence of MM EMF are lower than under SM EMF. This indicates that the studied system at a concentration of 4000 pcs/liter has more developed adaptive capabilities than at 1000 pcs/liter. The total biophysical response time of the system T1 + T2 + T3 + T4 is also correspondingly shorter, with an increase in the information exchange time T1 and the transition time to the second stable state T2. The value of these parameters further indicates the fact that the system, with increased adaptation conditions, is more resistant to exposure to MM than to SM EMF.
Conclusions
The dynamics of the biophysical response of the protozoan population recorded in all experiments, in the form of FS1–FS2–FS1, with their time intervals and aquatic resistance values, demonstrate the true significance of the impact of the EMFs considered on the “water—protozoan population” system. The obtained biophysical responses confirm the biological nature of the observed phenomena.
A comparative analysis of the temporal dynamics of changes in the resistance of the aquatic environment of the “water—population of entamoeba gingivalis” system shows that the population with a concentration of 4000 pcs/liter is more resistant to the effects of MM than to SM EMF, as evidenced by the duration of the temporal characteristics of the biophysical processes recorded in the experiments when changing the resistance of the aquatic environment.
Based on the results of the work, it can be concluded that the functional state of a biological system with increased adaptive capabilities may be less susceptible to change when exposed to MM EMF compared to SM EMF, that is, they may have more stable physiological activity in which the normal FS of their existence is realized.
The results of this work, being a model study of EMF on biological objects, may indicate a more significant impact of SM EMF from cell phones on the human body compared to MM radiation of the 5G range.
Funding
The work was carried out within the framework of the state task.
Conflicts of Interest
The authors have no conflict of interest.
References
- N.D. Devyatkov, Uspekhi Fizicheskikh Nauk 110 (3), 453 (1973).
- Betskii, V.V. Kislov, N.N. Lebedeva, Millimeter Waves and Living Systems (SAIN-PRESS. 2004. [Google Scholar]
- T.A. Ordynskaya, P.V. T.A. Ordynskaya, P.V. Poruchikov, V.F. Ordynskaya, Wave Therapy (Eksmo. Moscow, 2008).
- Betskii, L.A. Morozova, et al. Biomedical Radioelectronics (11), 30 (2017).
- Betskii, L.A. Morozova, S.V. Savel’ev, Biomedical Radioelectronics 23 (5), 60 (2020). [CrossRef]
- Safonova, L.; Dmitriev, A.; Shiryaeva, V.; Kuleshov, D. Control of cognitive functions using spectrophotometry and evoked potentials. Biomed. Radioelectron. 2022. [Google Scholar] [CrossRef]
- J. Kaszuba-Zwoińska, J. J. Kaszuba-Zwoińska, J. Gremba et. al. Przeglad Lekarski 72 (11), 636 (2015).
- Belyaev, I.; Dean, A.; Eger, H.; Hubmann, G.; Jandrisovits, R.; Kern, M.; Kundi, M.; Moshammer, H.; Lercher, P.; Müller, K.; et al. EUROPAEM EMF Guideline 2016 for the prevention, diagnosis and treatment of EMF-related health problems and illnesses. Rev. Environ. Heal. 2016, 31, 363–397. [Google Scholar] [CrossRef] [PubMed]
- Castello, P.; Jimenez, P.; Martino, C.F. The Role of Pulsed Electromagnetic Fields on the Radical Pair Mechanism. Bioelectromagnetics 2021, 42, 491–500. [Google Scholar] [CrossRef] [PubMed]
- I.A. Shaev, V.V. I.A. Shaev, V.V. Novikov, et al. Biophysics 67 (2), 319 (2022).
- A. Z. Nieden, C. Dietz, et. al., International journal of hygiene environmental health 212 (6), 576 (2009). [CrossRef]
- Pesnya D.S., Romanovsky A.V., Prokhorova I.M., Yaroslavl pedagogical bulletin. 3 (3) 80 (2010).
- Apollonsky S.M., Korovchenko P.V., Life safety (1), 15 (2011).
- A. A. Warille, M. E. Onger, et. al., Histology Histopathology 31 (5), 461 (2016). [CrossRef]
- A.M. Shamigulova, Z.M. Bilyalova, et al., Bulletin of the National Center for Biological Safety 2 (32), 110 (2017).
- S. E. Murik, Assessment of the Functional State of the Human Body (Irkutsk State University Publishing House, Irkutsk, 2013).
- S. V. Savel’ev, Millimeter Waves in Biology and Medicine (4), 20 (2003).
- L. A. Morozova, S. V. Savel’ev, Biophysics 69 (5), 1097 (2024). [CrossRef]
- A. I. Shilov, Ecological and Physiological Foundations of Population Relations in Animals (Moscow State University, Moscow, 1997).
Figure 1.
Schematic diagram of the water conductivity measurement setup: 1—cuvette with water and a protozoan population, 2—amplifier-converter, 3—plotter.
Figure 1.
Schematic diagram of the water conductivity measurement setup: 1—cuvette with water and a protozoan population, 2—amplifier-converter, 3—plotter.
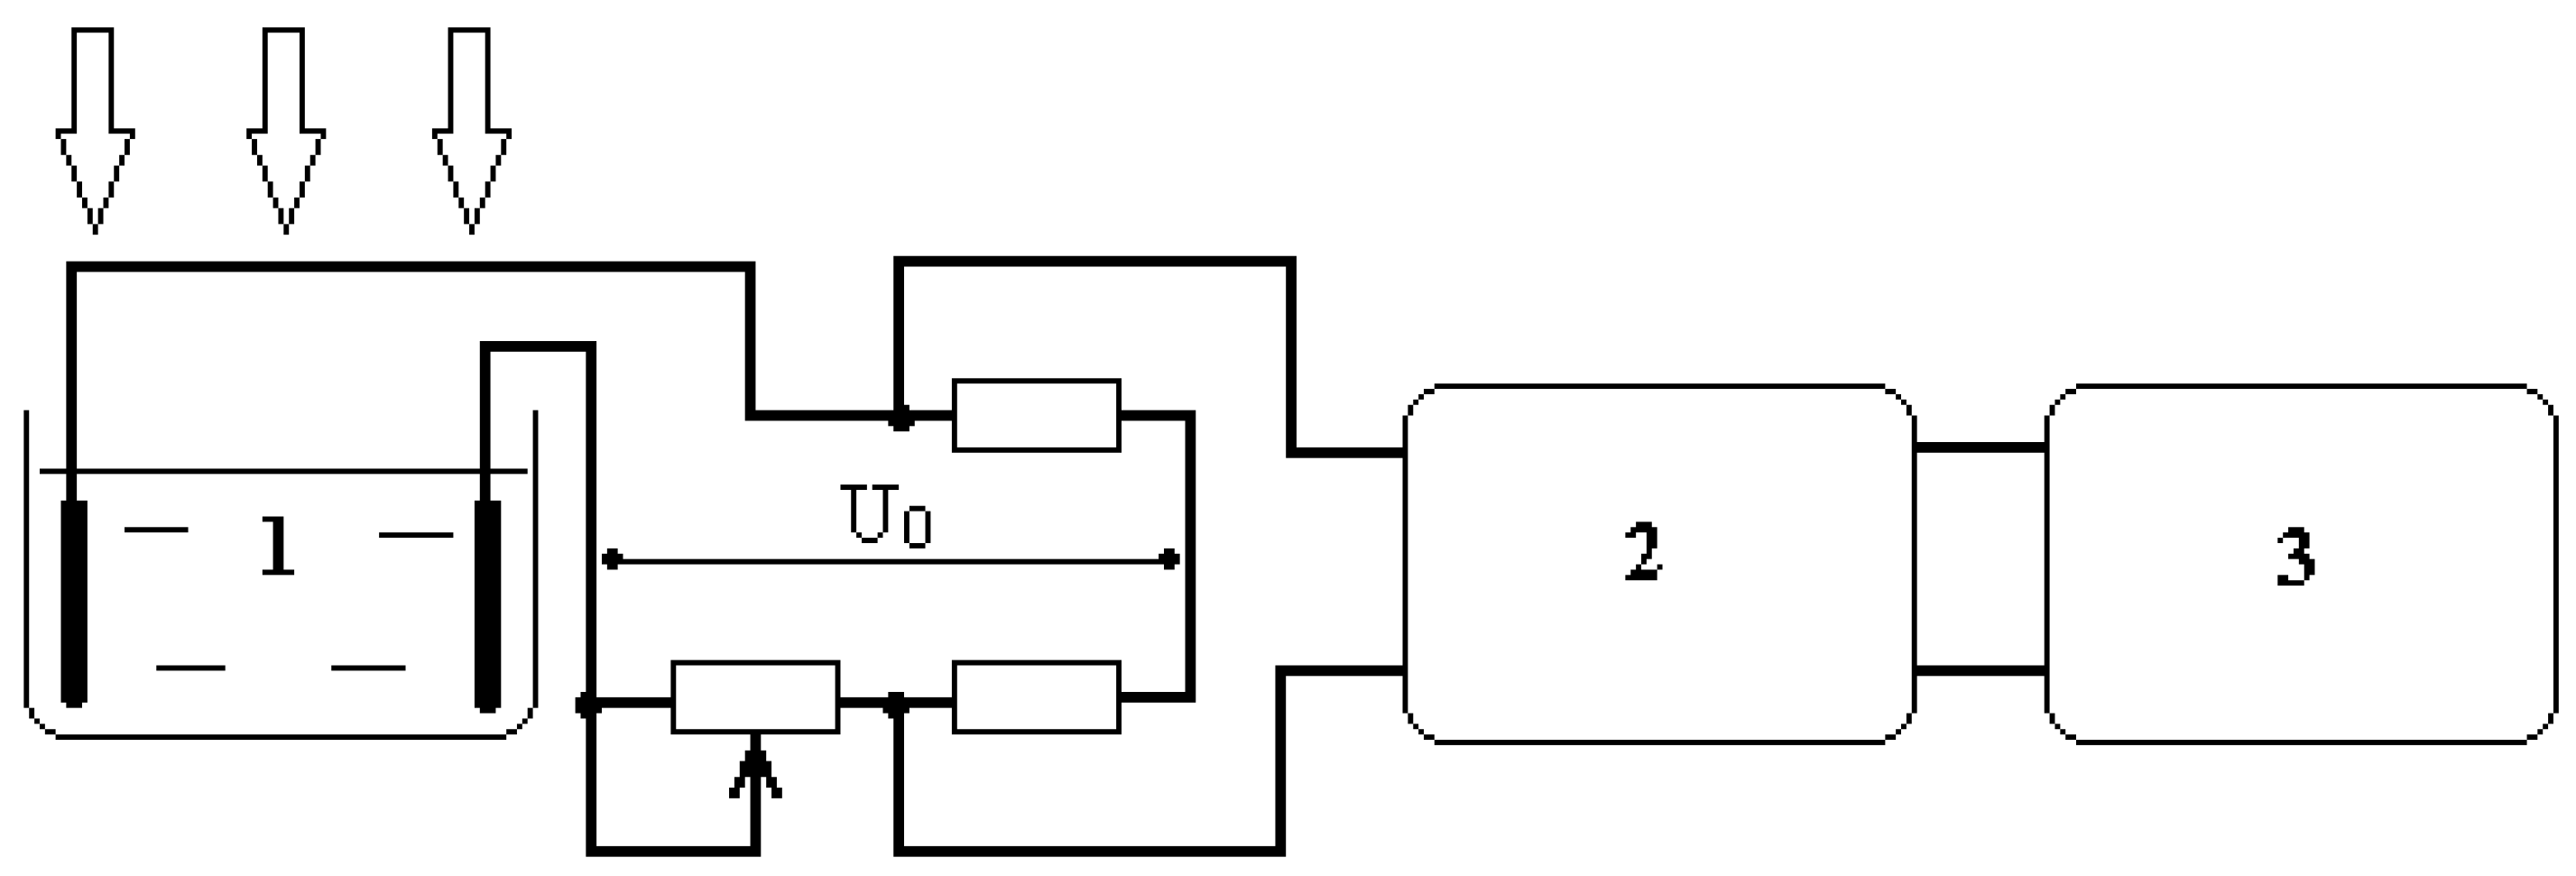
Figure 2.
Dependence of the aquatic resistance of a protozoan population on time with a concentration of 1000 pcs/liter under the influence of an EMF at a frequency of 2.1 GHz. Curve 1 pH = 5.8, curve 2 pH = 7.1.
Figure 2.
Dependence of the aquatic resistance of a protozoan population on time with a concentration of 1000 pcs/liter under the influence of an EMF at a frequency of 2.1 GHz. Curve 1 pH = 5.8, curve 2 pH = 7.1.
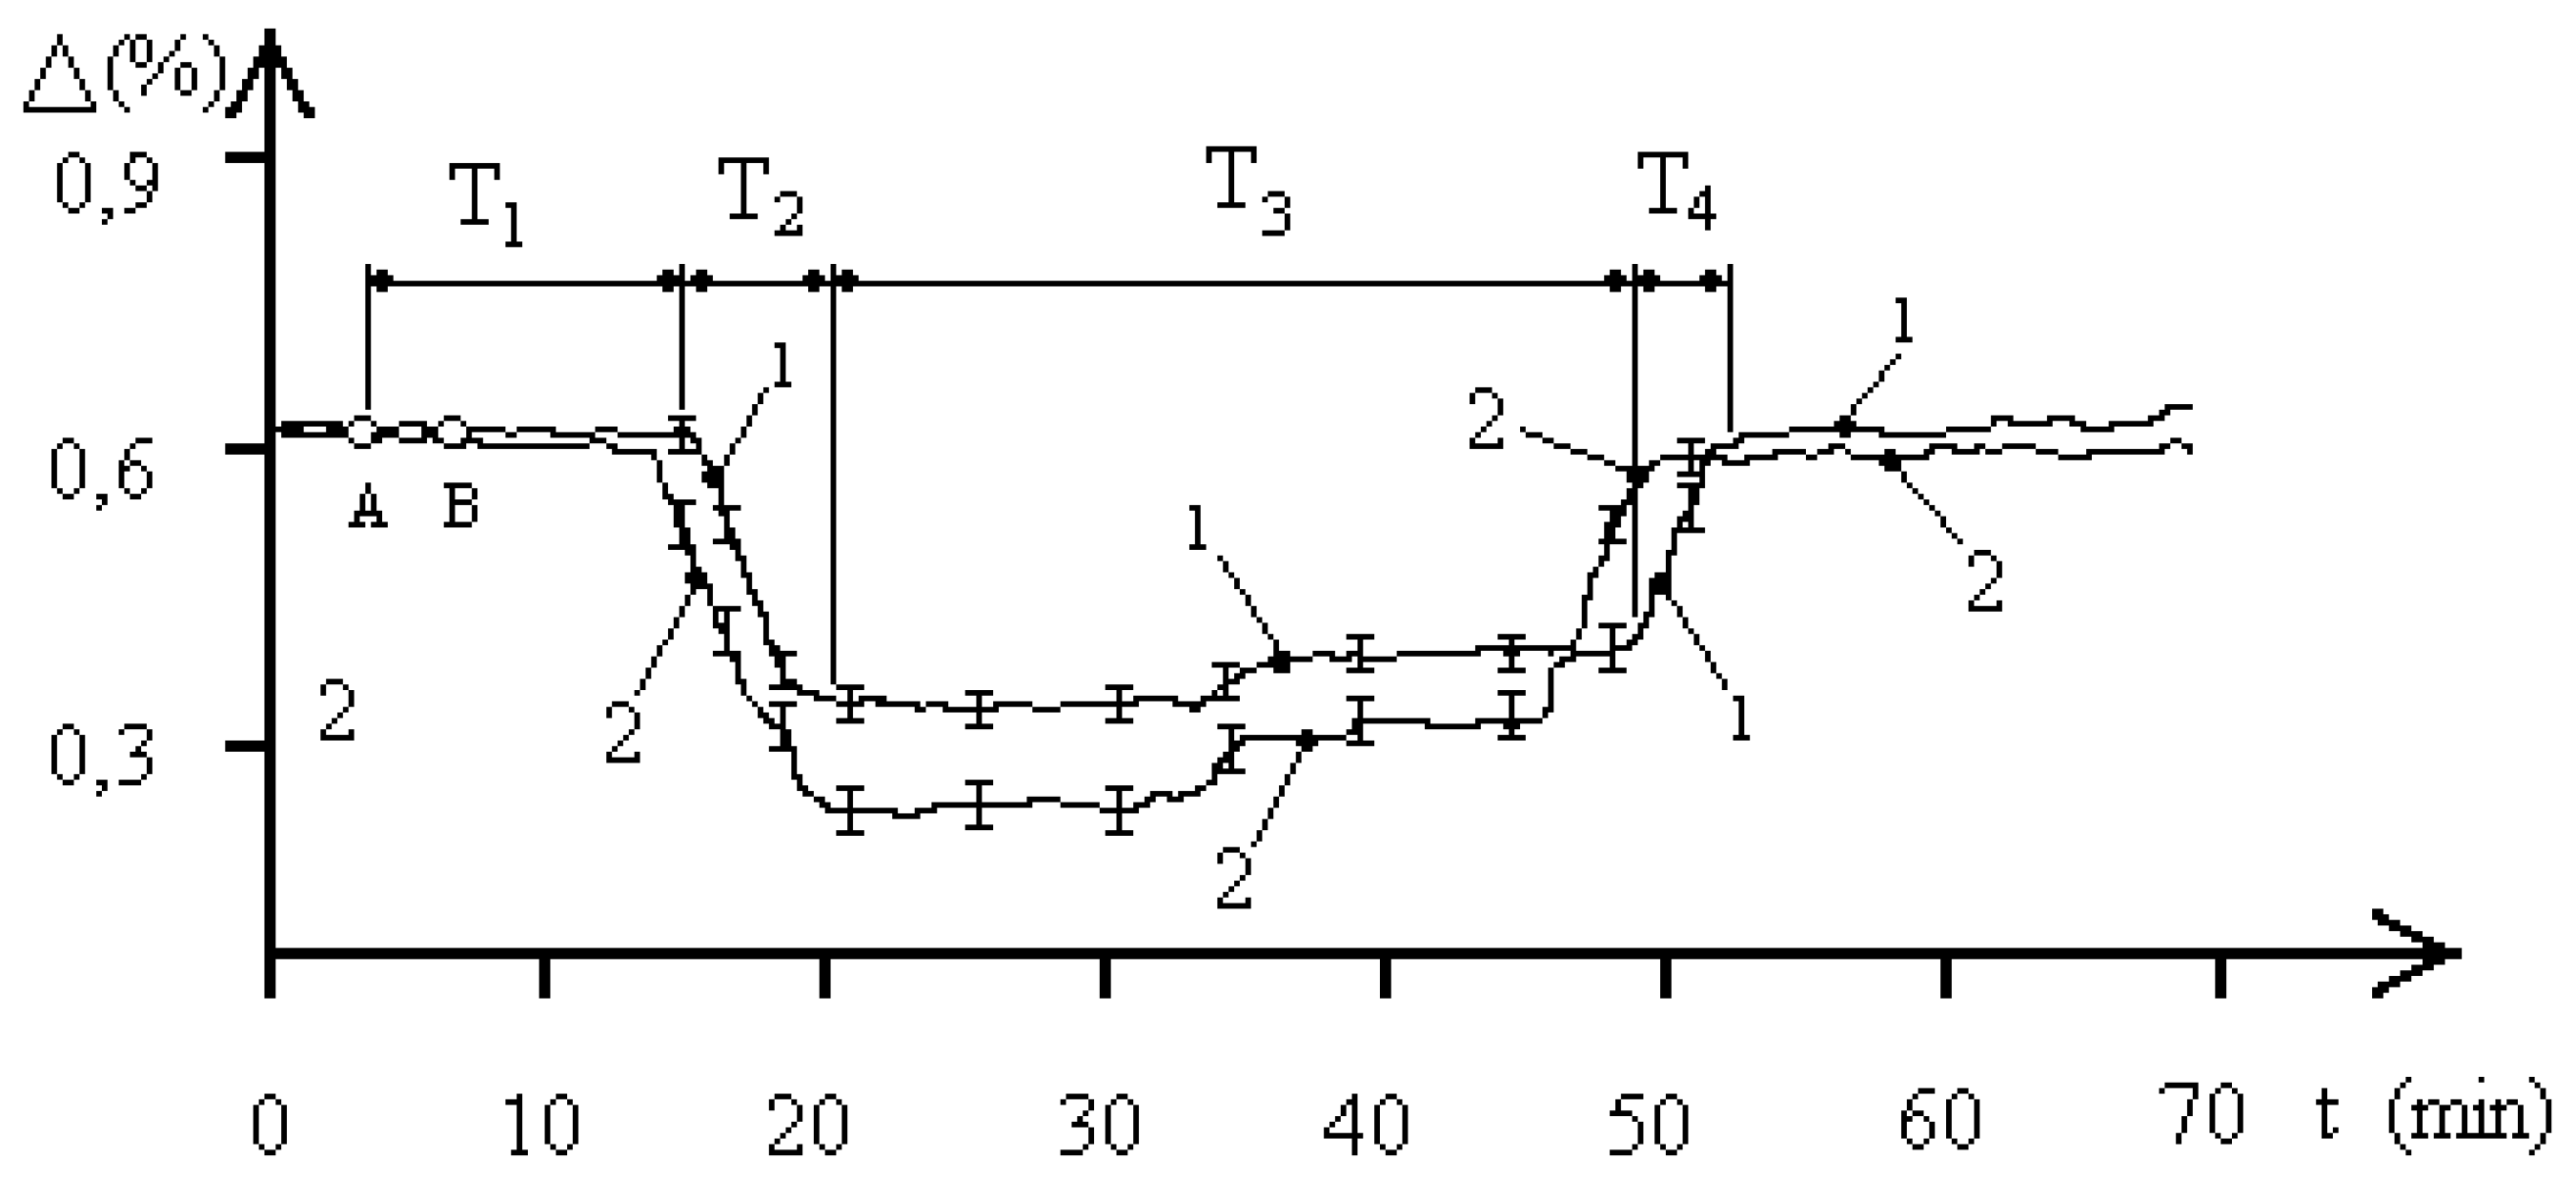
Figure 3.
Dependence of the aquatic resistance of a protozoan population on time with a concentration of 4000 pcs/liter under the influence of an EMF at a frequency of 2.1 GHz. Curve 1 pH = 5.8, curve 2 pH = 7.1.
Figure 3.
Dependence of the aquatic resistance of a protozoan population on time with a concentration of 4000 pcs/liter under the influence of an EMF at a frequency of 2.1 GHz. Curve 1 pH = 5.8, curve 2 pH = 7.1.
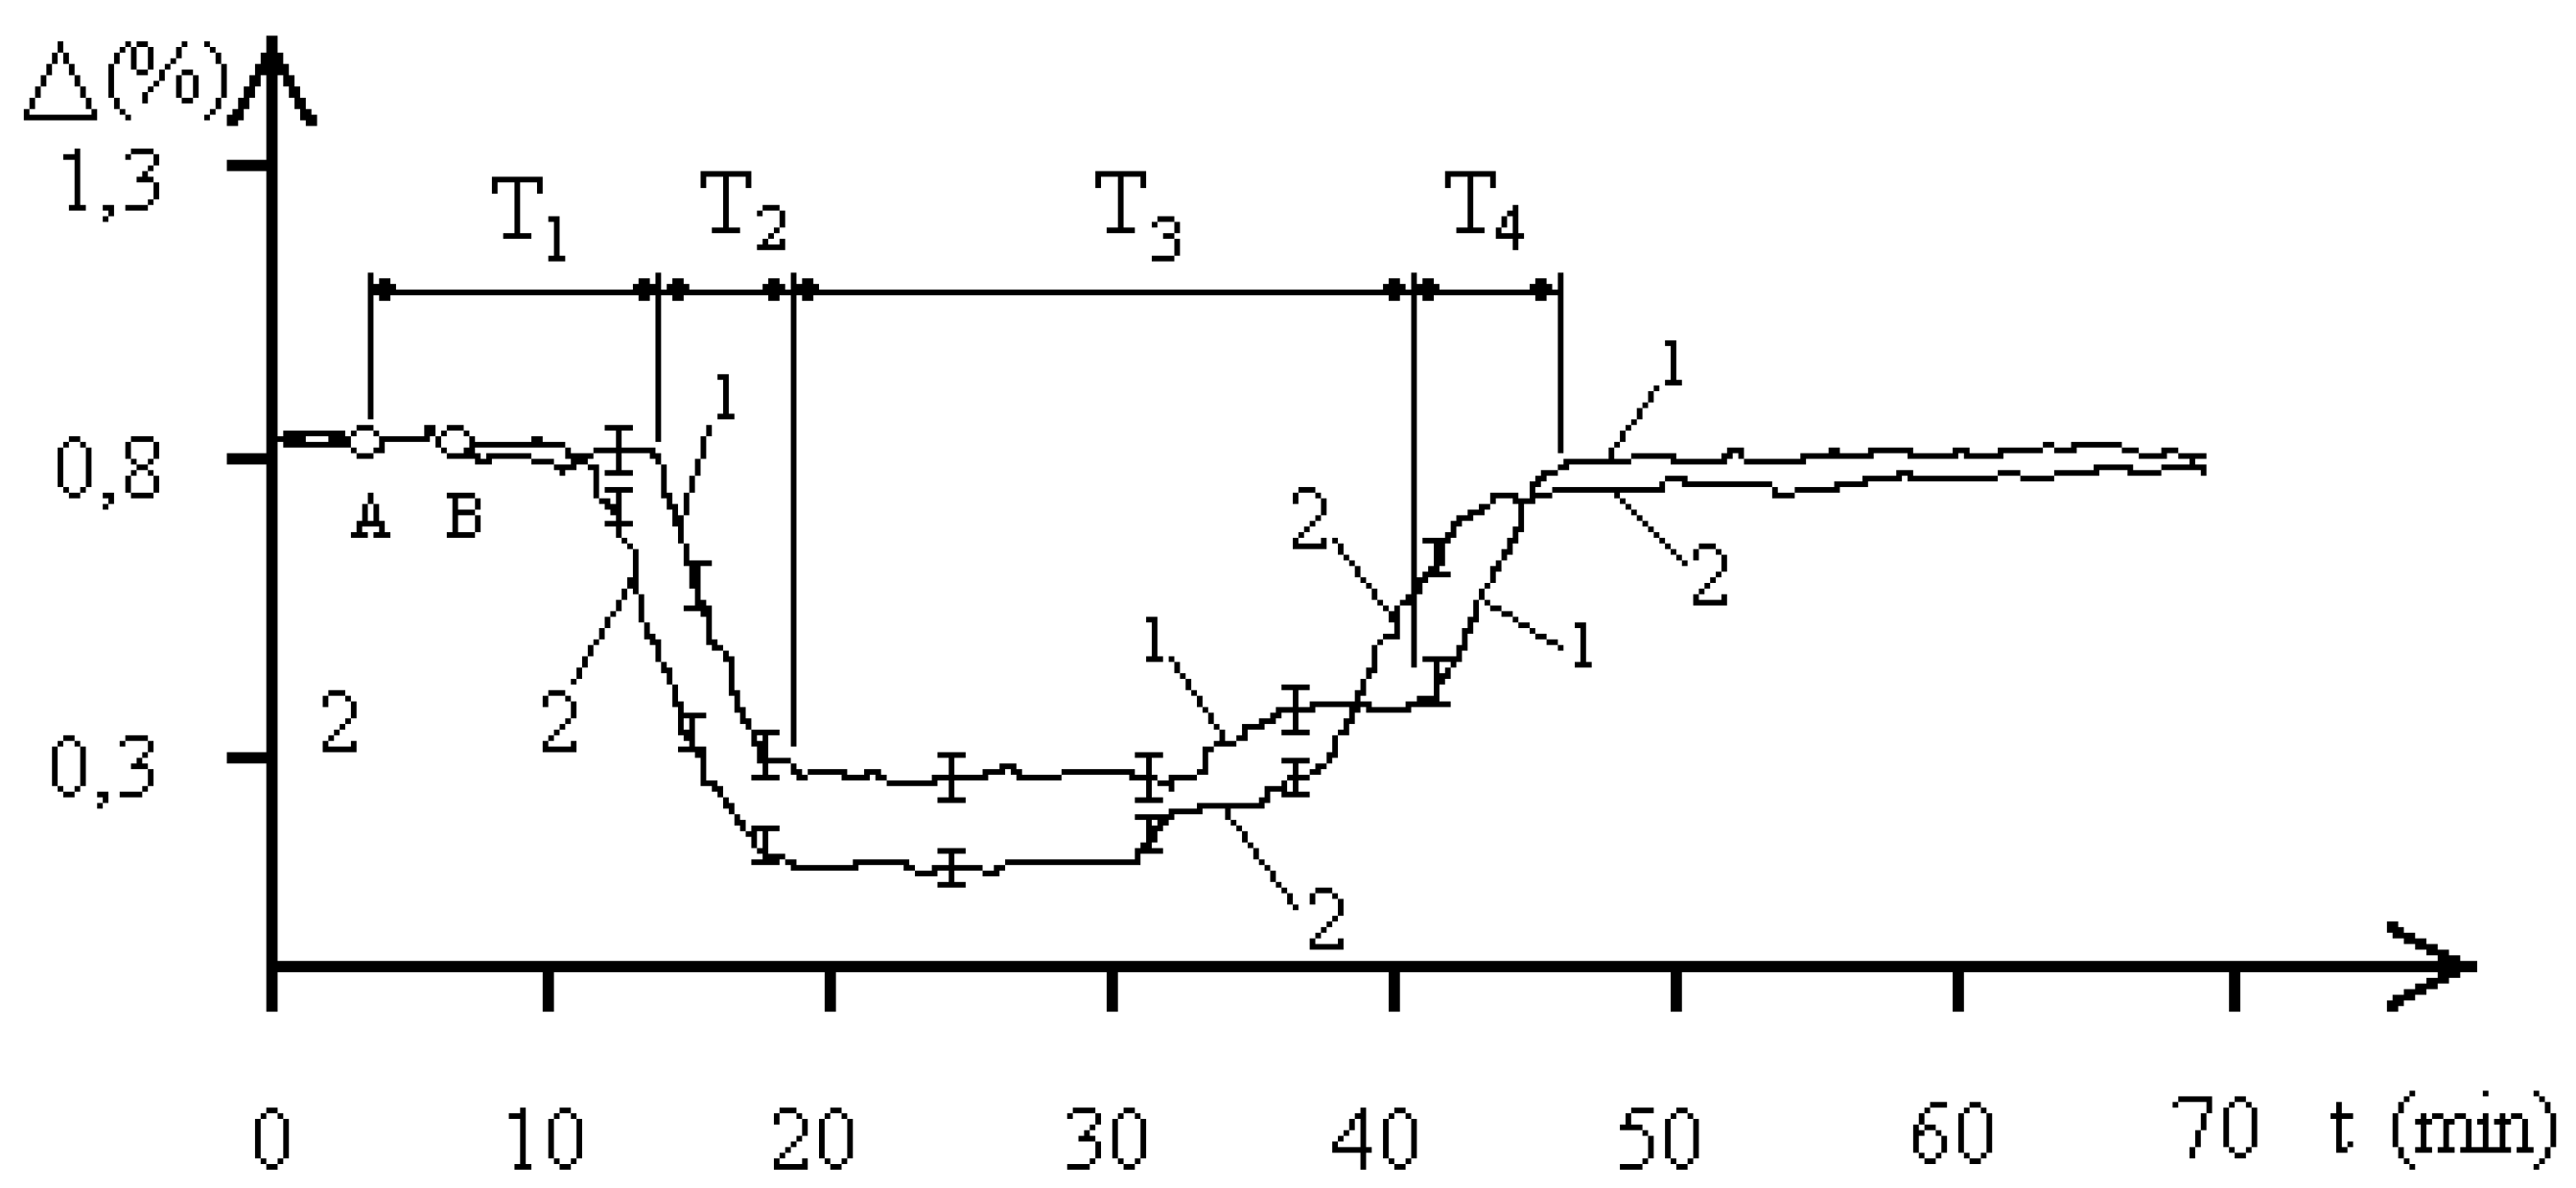
Figure 4.
Dependence of the resistance of the aquatic environment of a protozoan population on time with a concentration of 1000 pcs/liter under the influence of an EMF at a frequency of 42.25 GHz. Curve 1 pH = 5.8, curve 2 pH = 7.1.
Figure 4.
Dependence of the resistance of the aquatic environment of a protozoan population on time with a concentration of 1000 pcs/liter under the influence of an EMF at a frequency of 42.25 GHz. Curve 1 pH = 5.8, curve 2 pH = 7.1.
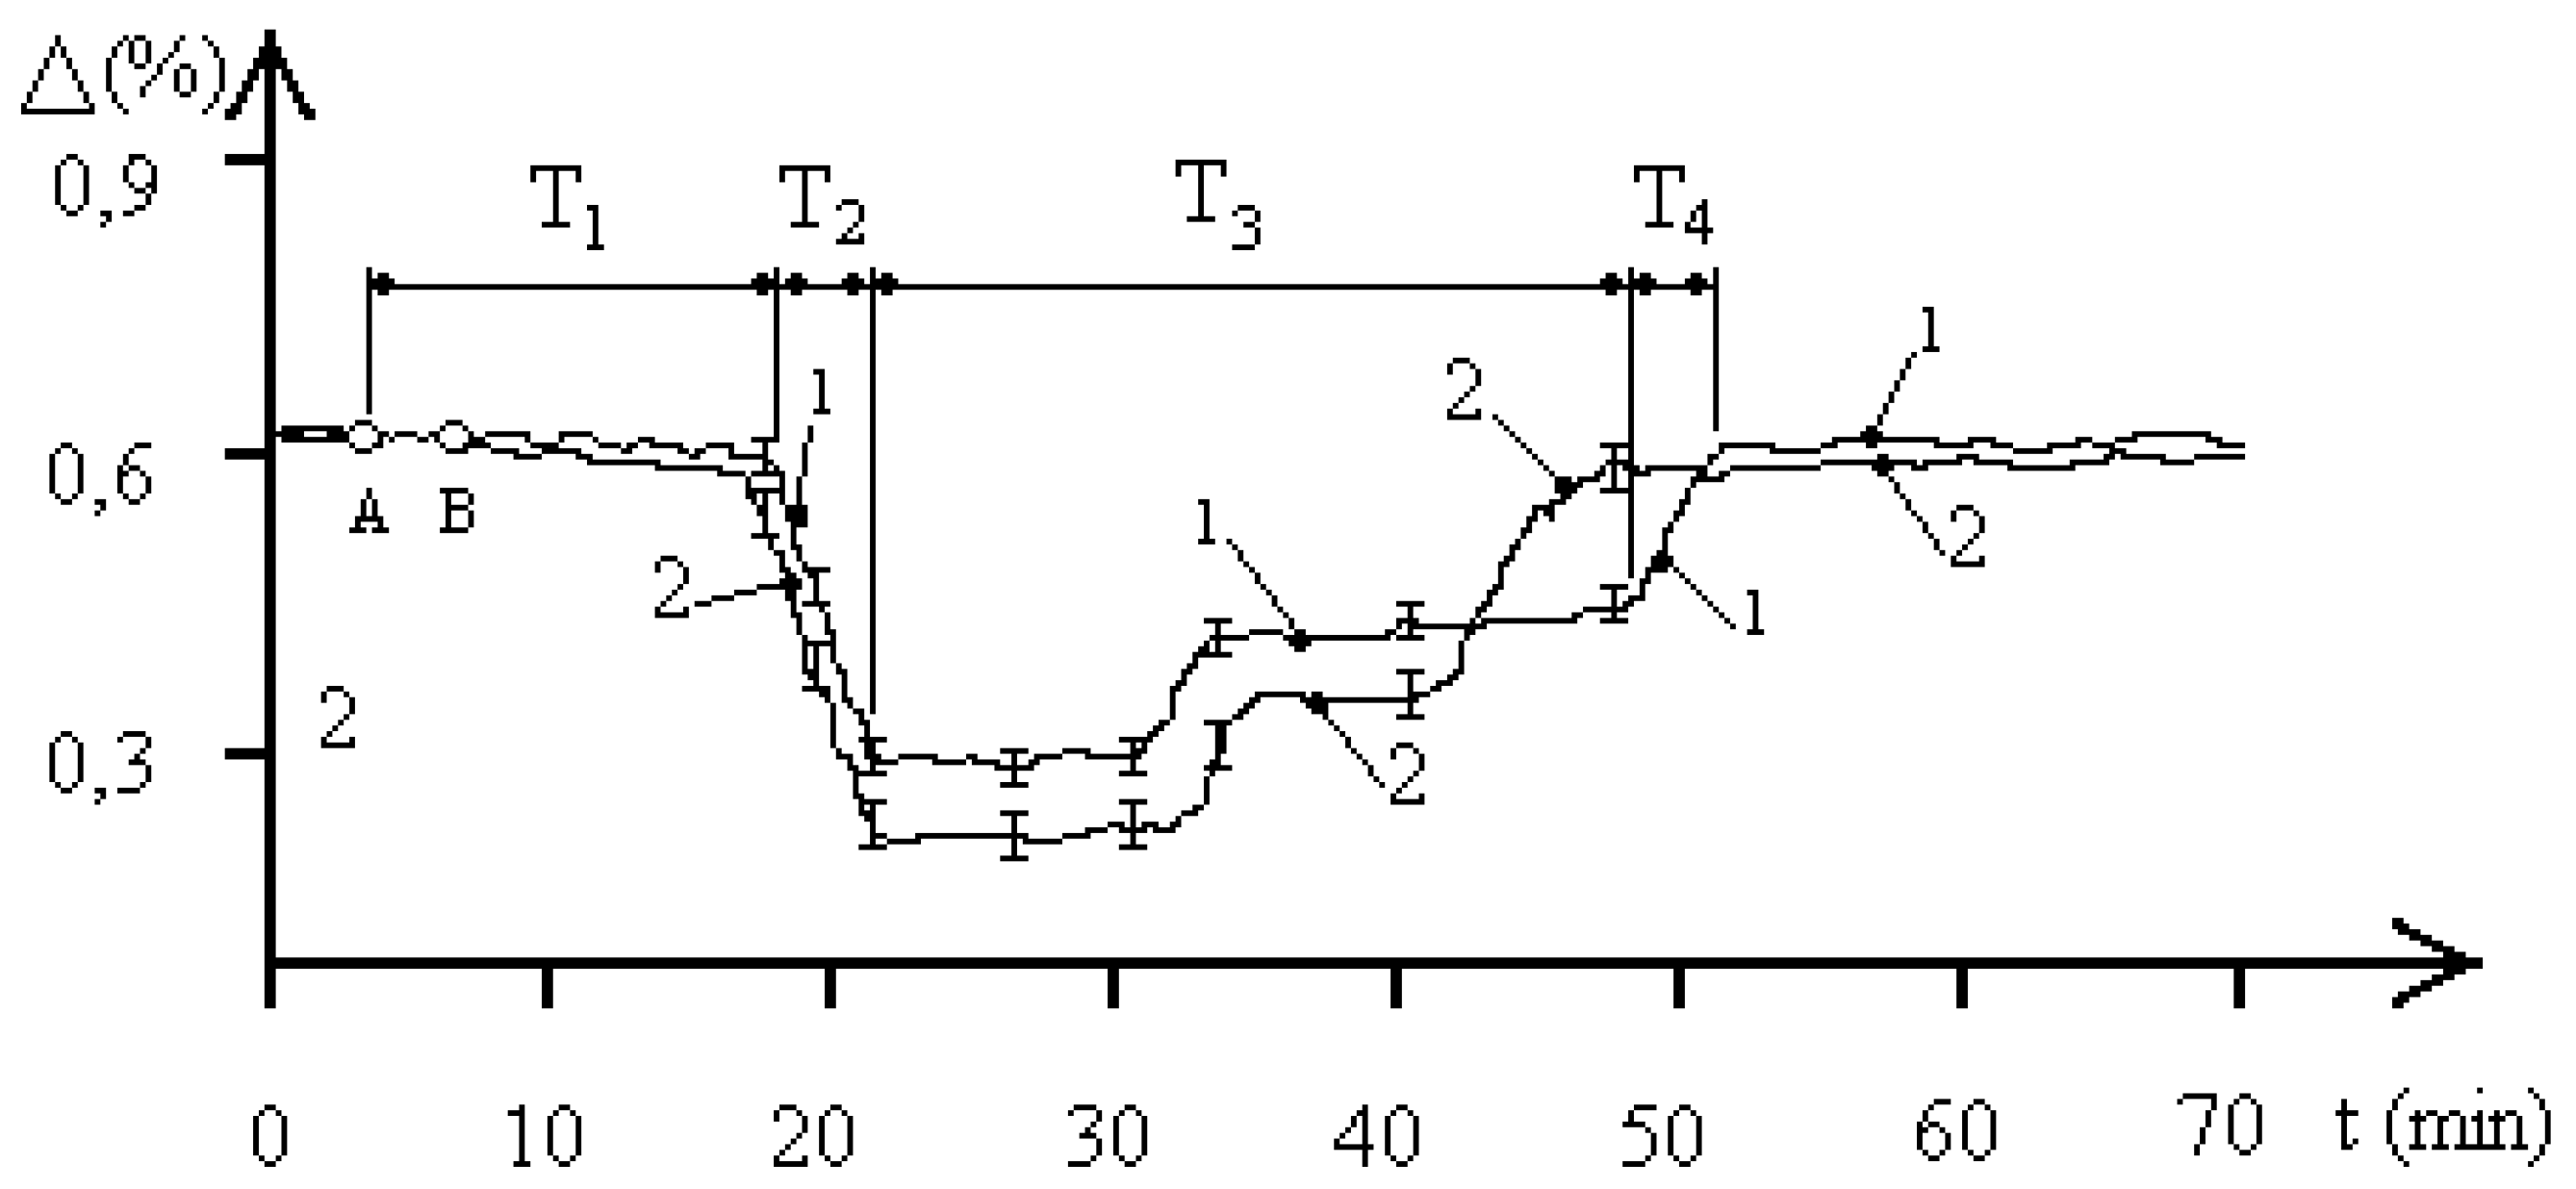
Figure 5.
Dependence of the resistance of the aquatic environment of a protozoan population on time with a concentration of 4000 pcs/liter under the influence of an EMF at a frequency of 42.25 GHz. Curve 1 pH = 5.8, curve 2 pH = 7.1.
Figure 5.
Dependence of the resistance of the aquatic environment of a protozoan population on time with a concentration of 4000 pcs/liter under the influence of an EMF at a frequency of 42.25 GHz. Curve 1 pH = 5.8, curve 2 pH = 7.1.
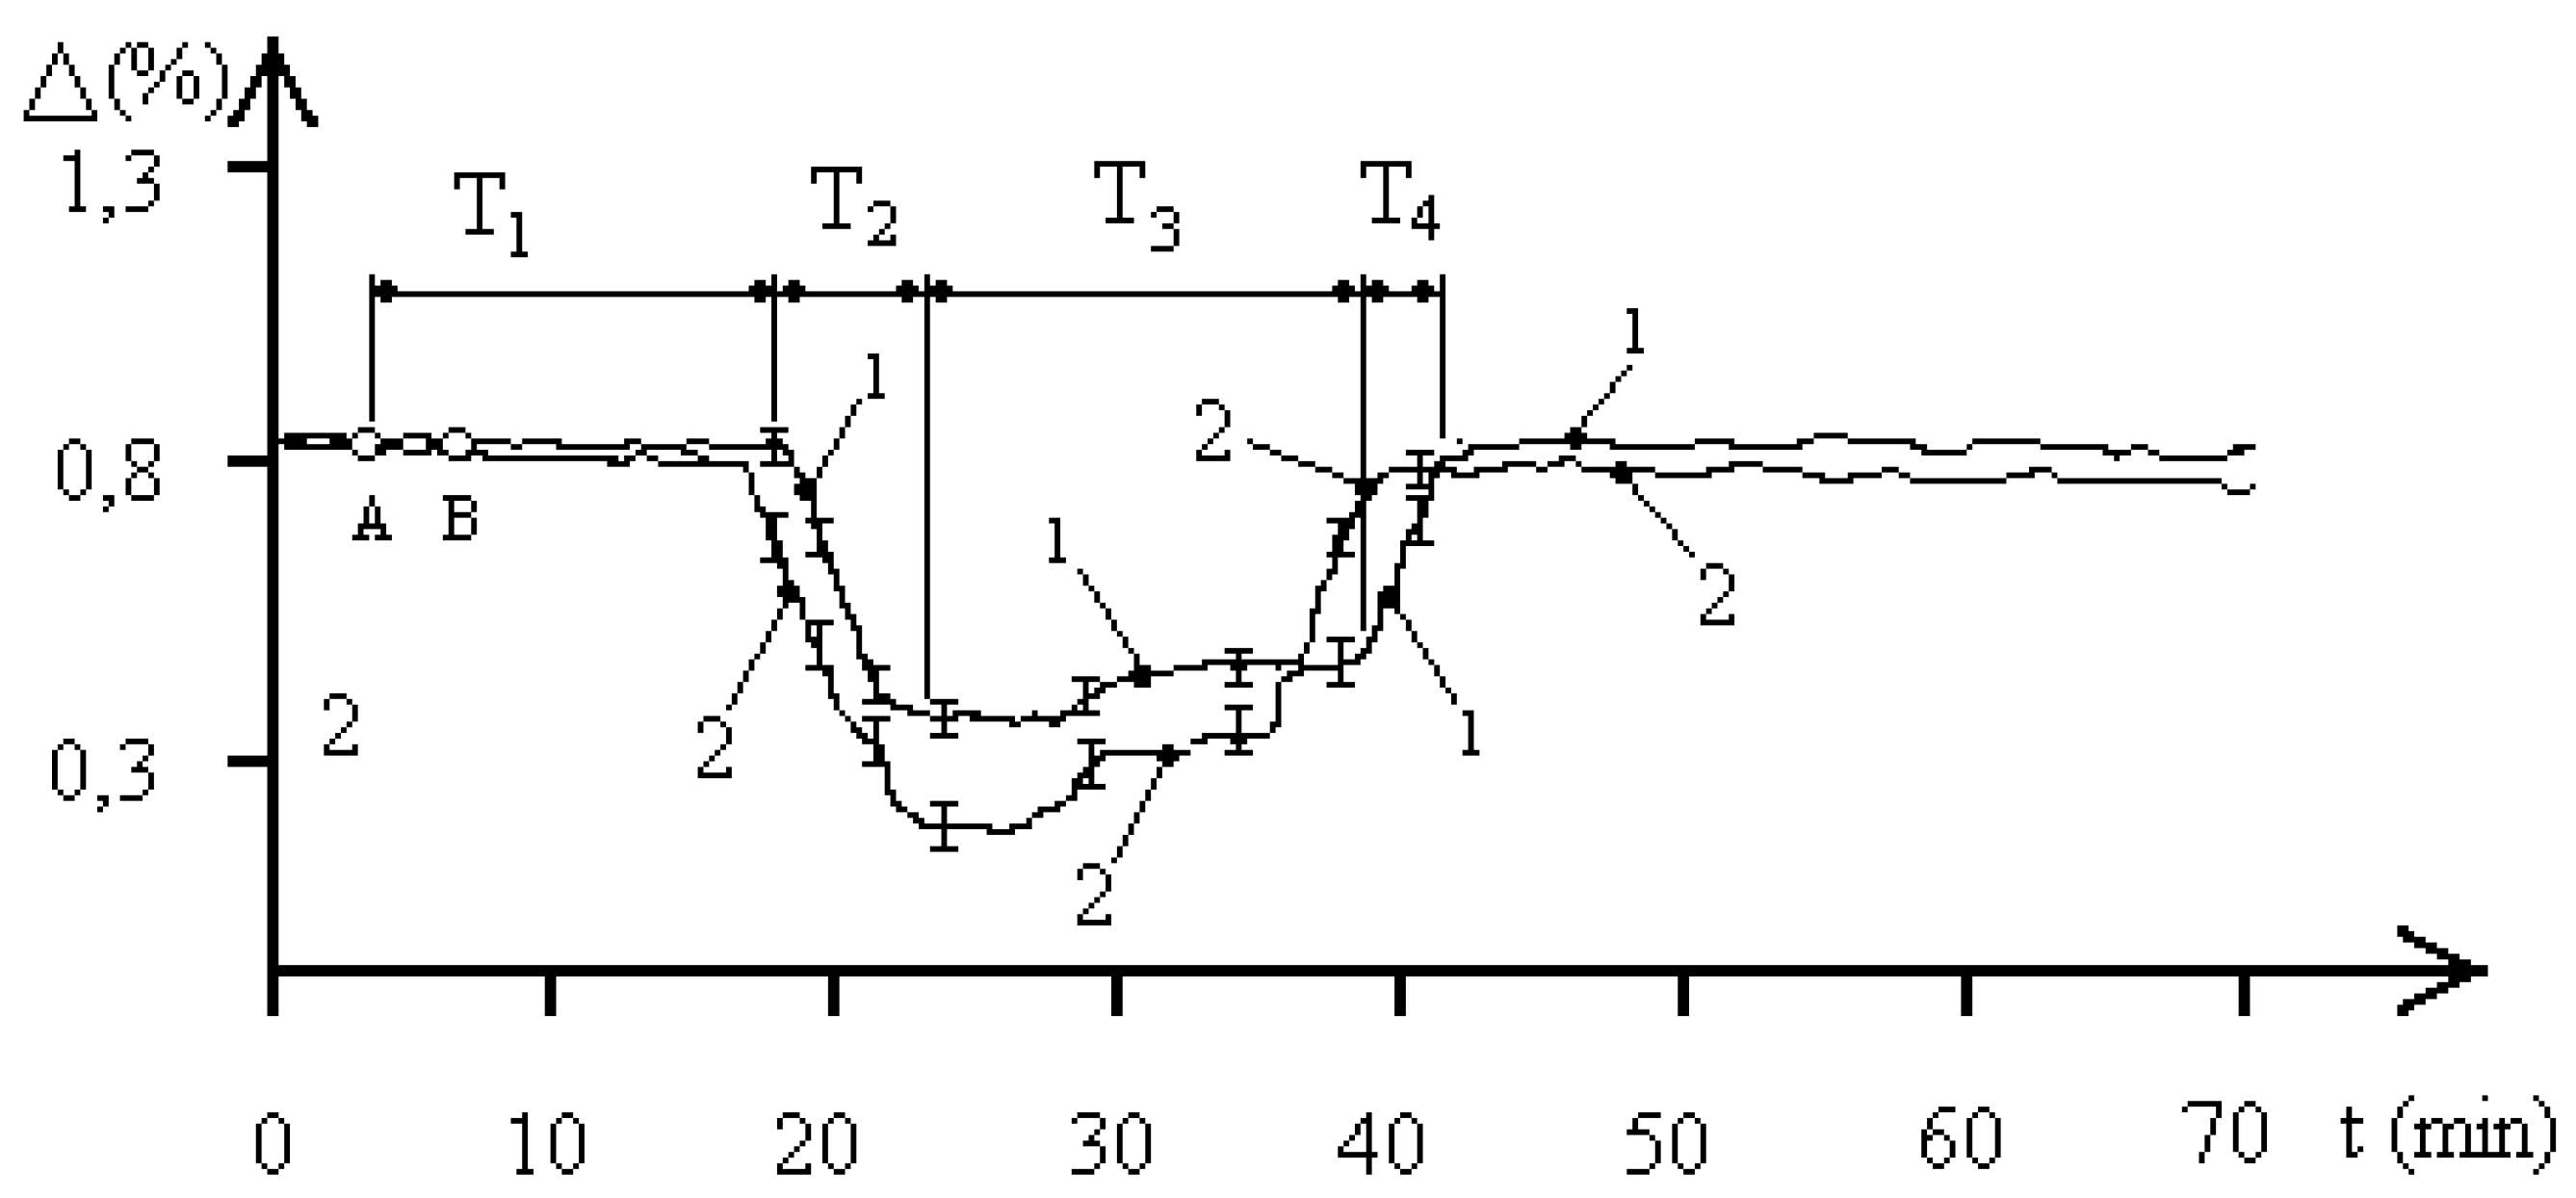

Table 1.
.
| Time (min.) |
pH of the water |
Figure 2 2,1 GHz 1000pcs/l. |
Figure 3 2,1 GHz 4000pcs/l. |
Figure 4 42,25 GHz 1000pcs/l. |
Figure 5 42,25 GHz 4000pcs/l. |
|||||
|---|---|---|---|---|---|---|---|---|---|---|
| Т1+ Т2+ Т3+ Т4 | 5,8 | 50 | 42 | 45 | 38 | |||||
| 7,1 | 46 | 40 | 42 | 36 | ||||||
| Т1 | 5,8 | 12 | 10 | 15 | 14 | |||||
| 7,1 | 10 | 8 | 14 | 13 | ||||||
| Т2 | 5,8 | 6 | 5 | 3 | 6 | |||||
| 7,1 | 8 | 7 | 4 | 7 | ||||||
| Т3 | 5,8 | 28 | 22 | 25 | 15 | |||||
| 7,1 | 23 | 18 | 20 | 11 | ||||||
| Т4 | 5,8 | 4 | 5 | 2 | 3 | |||||
| 7,1 | 5 | 7 | 4 | 5 | ||||||
| Δ(%) max. | pH= 5,8 |
pH= 7,1 |
0,28 | 0,42 | 0,52 | 0,7 | 0,32 | 0,45 | 0,45 | 0,65 |
Disclaimer/Publisher’s Note: The statements, opinions and data contained in all publications are solely those of the individual author(s) and contributor(s) and not of MDPI and/or the editor(s). MDPI and/or the editor(s) disclaim responsibility for any injury to people or property resulting from any ideas, methods, instructions or products referred to in the content. |
© 2025 by the authors. Licensee MDPI, Basel, Switzerland. This article is an open access article distributed under the terms and conditions of the Creative Commons Attribution (CC BY) license (http://creativecommons.org/licenses/by/4.0/).
Copyright: This open access article is published under a Creative Commons CC BY 4.0 license, which permit the free download, distribution, and reuse, provided that the author and preprint are cited in any reuse.


