Submitted:
26 November 2025
Posted:
26 November 2025
You are already at the latest version
Abstract
Visual inspection is a crucial quality assurance process across many manufacturing industries. While many companies now employ AI-based systems, they face a significant challenge, particularly in safety-critical domains. The outcomes of these systems are often complex and difficult to comprehend, making them less reliable and trustworthy.
To address this challenge, we propose a human-in-the-loop framework that enables the safe and efficient implementation of machine learning in visual inspection tasks, even when starting from scratch. Our framework leverages three complementary safety mechanisms—uncertainty detection, explainability, and model diversity—to enhance both accuracy and system safety while minimizing manual effort. Using the example of steel surface inspection, we demonstrate how a self-accelerating process of data collection can arise, where model performance improves while manual effort decreases progressively. Based on that, we create a system with various safety mechanisms where every wrong prediction is identified automatically.
We provide concrete recommendations and an open-source code base to facilitate reproducibility and adaptation to diverse industrial contexts.
Keywords:
machine learning
; artificial intelligence
; human in the loop
; safety
; visual inspection
; machine vision
1. Introduction
Machine Learning (ML) is becoming increasingly relevant in many areas of our lives currently. One application of ML is image recognition tasks such as visual inspection [1], medical diagnosis [2,3,4] or structural health monitoring (SHM) [5]. ML based visual inspection systems often surpass human operators or classical machine vision system and offer superior flexibility [6].
However, a major challenge when integrating ML in visual inspection systems is the black box nature of ML models, making it difficult for humans to understand their decision-making process [7]. Consequently, it is not possible to determine how a model decides in each case and malfunctions cannot be easily detected or ruled out. As a consequence, the models often lack user trust [8].
For most vision systems, this is not a problem. However, there are systems where high accuracy and deterministic behavior are mandatory. For example, in inspection of train wheel bearings, false negatives, i.e. a undetected defect, may lead to train derail and, in the worst case, cost many lives. False negatives therefore should not occur in such systems. There are several other systems where wrong decisions (either false positives, false negatives or both) may have an unacceptable impact. Due to the unacceptable consequences of wrong decisions, these systems are referred to as critical decision systems in [9]. Other common critical decision systems the authors identify are self-driving cars, medical diagnosis systems or intrusion detection systems. Many of these systems are also considered high risk applications by the EU AI Act. Such high risk applications have to be assessed before operation and also during their life cycle [10].
A method to make black-box models explainable and interpretable to humans is explainable artificial intelligence (XAI). XAI is nowadays extensively used to increase trust [11,12], improve ML models [13] and gain knowledge [14]. Beyond, that, some authors also point out how to leverage XAI to actively enhance safety of ML applications by reducing bias [15,16,17], enhancing overall predictive performance [2,18] or increase robustness [2,19]. Recently, a framework for creating safe and trustworthy ML models by integration of XAI throughout the entire life cycle of the model - the so called R4VR-framework - was introduced [9].
The R4VR-framework suggests to keep a human in the loop throughout the entire life cycle of the model and consists of two phases: the development phase of the model where the developer undergoes the layers Reliability, Validation and Verification and the application phase in which the end user undergoes the layers Verification, Validation and Reliability. The framework employs XAI and uncertainty quantification (UQ) through the entire cycle and thereby helps the end user to make highly reliable decisions based on the model. It thereby fosters transparency and addresses key requirements of the EU AI Act. More details on the R4VR-framework itself as well as the question how it addresses the EU AI Act are described in Sec. 2.
Although the framework covers the life cycle of the ML model itself perfectly, it does not cover mechanisms for reliable data collection. Also, clear recommendations how to apply the framework in practice are missing. We therefore extend the framework by the step of reliable data collection, translate it into practical recommendations for different use cases and show - using the example of steel-surface inspection - how the framework can be implemented in real-life applications.
We thereby aim to provide a practical guideline for researchers and practitioners seeking to mitigate risks associated with ML deployment in critical decision systems. In particular, the paper’s contributions are:
- Extension of the R4VR-framework by definition of a reliable data collection process
- Translation of the R4VR-framework to practical recommendations allowing practitioners from different domains to adopt the framework
- Demonstration of the framework using a use case which is relevant for many industries
- Creation of a code base allowing adaptation to diverse contexts
The remainder of the paper is structured as follows: Sec. 2 provides an overview of XAI techniques and the R4VR-framework. Afterwards, we point out how the R4VR-framework can be applied in different use cases practically in Sec. 3. Sec. 4 points out how we implemented the workflow of the R4VR-framework using the example of metal-surface inspection. We discuss our results in Sec. 5 and provide a conclusion in Sec. 6.
2. The R4VR-Framework and Its Relation to the EU AI Act
In this section, we give a detailed overview of the R4VR-framework, provide a short introduction to different techniques of XAI and give a gentle introduction to the EU AI Act.
The R4VR-framework was introduced in [9]. The authors examined how XAI can be applied to enhance safety of ML models in critical decision systems and point out that there are basically three mechanisms by which XAI can contribute to safer ML models:
- 1.
- Reliability: First of all, XAI can help to increase reliability of decisions made by ML models or with the help of ML models. On the one hand, XAI can contribute to creation of more reliable models and on the other hand, XAI can provide human decision makers with additional information for assessing a model prediction and making a decision based on the prediction.
- 2.
- Validation: XAI techniques can help to validate a model’s prediction as they allow to check if the explanation is stringent, meaning that the features that are highlighted as relevant in the explanation really affect the model prediction if changed.
- 3.
- Verification: Finally, XAI techniques can serve to verify a model’s functioning in certain ranges. Although, it is not possible to verify that a model predicts correctly for all conceivable data points, XAI techniques can help to assess how a model behaves in certain ranges and decrease probability of wrong predictions for these ranges.
Based on these three mechanisms, the authors of [9] propose the R4VR-framework - a two-layered framework including the developer as well as the end user of a model. The first layer of the framework addresses the development phase. Here, the authors suggest that the developer of a model should first of all increase reliability of a model using XAI. In particular, the authors suggest that the developer should harness XAI to reduce bias and increase robustness of the model. In the next step, the model is validated using a human in the loop approach. To that end, the model is applied in real world scenarios with a human expert in the loop. During application, XAI as well as UQ are used in order to allow the human expert for better assessment of the model. That way, weaknesses of the model shall be identified which are then addressed by the developer. Finally, the developer verifies the model, meaning he examines the model behavior for certain input ranges. Based on the examination and the data the model was trained on, he specifies a range in which the model can be applied.
Once the model is verified by the developer, it is handed over to the end user who applies the model as decision support. Given a decision situation, he first of all verifies if the model is approved for the situation. Afterwards, he applies the model along with XAI techniques and then validates the model prediction by looking at the model explanation and uncertainty. Finally, he compares the prediction with his expectation to ensure it is reliable. A graphical outline of the R4VR-framework is also shown in Figure 1
2.1. Explainable Artificial Intelligence as the First Pillar of the R4VR-Framework
The entire R4VR-framework is based on application of XAI techniques. The main aim of XAI as a field of research is making AI systems explainable. Explainability enables humans to understand the reasons behind a prediction [20].
Within XAI, there are different ways to categorize methods. On the one hand, a distinction is made between intrinsic explainability and post-hoc explanations. Intrinsic explainability refers to the property of a ML model of being explainable. Examples of intrinsically explainable models are linear regression, logistic regression or decision trees. In contrast, post-hoc methods uncover the relationship between feature values and predictions [21].
These post-hoc methods can be divided in model-specific and model-agnostic methods. Model-specific methods are only applicable to a specific type of model. In contrast, model-agnostic methods can be applied to any model [21]. Furthermore, local and global explanations can be distinguished. While local explanations only explain a certain prediction, global explanations explain the overall model behavior [21]. More detailed information on single XAI techniques can be found in [21].
One common XAI technique in image recognition are saliency maps. Saliency maps are applicable to CNNs and provide local explanations. They visualize which regions in an image affect the model’s prediction most. There are different methods to get the regions that are most influential for the decision [22]. For the purpose of our examination, we will use gradient weighted class activation mapping (Grad-CAM).
Grad-CAM calculates the gradients of the output with respect to the extracted features or the input via back-propagation. Based on this, attribution scores are estimated. These attribution scores can be visualized as a heatmap overlay of the image that is examined. That way, areas in an image are visualized that are relevant for the model prediction [23]. An example for such a salienvy map is shown in Figure 2.
2.2. Uncertainty Quantification as the Second Pillar of the R4VR-Framework
Besides XAI, the R4VR-framework also incorporates UQ. UQ deals with measuring how (un-) certain a model is about a certain prediction. More and more authors recognize the importance of UQ when it comes to creating safe and reliable ML models. Mainly in safety critical applications, UQ can server as a relevant indicator and help humans to assess whether a model prediction can be trusted or validation of the case is necessary [24], [9].
There are two major categories of UQ approaches, namely Bayesian methods and ensembles. Bayesian methods assume that the true model lies within the hypothesis space and strive to select the single best model. In contrast, ensembles employ a combination of different models. They can achieve better results when the true model is not within the hypothesis class [25].
One commonly used method from the Bayesian approaches is Monte Carlo (MC) dropout. MC dropout was proposed in [26]. The authors show that application of dropout before every layer of a neural network is equivalent to the deep Gaussian process and that the Kullback-Leibler (KL) divergence is minimized by dropout.
Using these insights, they show how to derive uncertainty from a model prediction. To do so, they make n predictions with a NN while dropout is enabled. The final prediction is obtained by averaging the results. The uncertainty of the model can be obtained by calculating variance, standard deviation, or entropy within the single predictions.
2.3. EU AI Act for High Risk Applications
The EU AI Act categorizes AI systems into four levels: unacceptable (forbidden applications), high risk, medium risk, and low risk. We focus on high-risk applications due to their stringent requirements.
Article 9 prescribes a risk management system covering the entire life cycle of a ML-based system, allowing for iterative improvement. Measures must reduce risks to an “acceptable” level.
Article 10 defines data requirements, including the use of training, validation, and test sets. Data must be examined for origin, bias, quantity, and underlying assumptions. Processing operations must be documented.
Article 11 requires technical documentation for high-risk AI systems, and article 12 mandates logging systems to record AI system modifications and operations.
Article 13 emphasizes transparency, enabling end users to interpret system outputs and use them appropriately. Also, end users must receive instructions for system use.
Article 14 calls for measures to ensure human monitoring of the process and article 15 prescribes that high-risk AI systems must provide sufficient accuracy and robustness throughout their life cycle.
3. R4VR-Framework for Visual Inspection
Building upon the theoretical foundations provided in Sec. 2, we now define a concrete process that converts the R4VR-framework (c.f. Sec. 2) to practical guidelines for adoption of ML in highly critical decision systems. Unlike the R4VR framework, we start even before modeling and take into consideration the process of data collection which is a key requirement of the EU AI Act. Also, we provide differentiation options for adapting the workflow based on the risk level of the application. While the original R4VR-framework prescribes that the final decision for every instance is made by a human, what is unpractical in certain real world use cases where thousands of images have to be examined every day, we take a more flexible approach and show how our guidelines can be implemented in different use cases. To outline how the approach can work in real world scenarios, we also consider two particular use cases, namely medical diagnosis from images and visual inspection tasks and show how - based on our guidelines - AI based systems in these use cases can be implemented in accordance with the EU AI Act.
At this point, we want to highlight that we don’t see our work as a new framework. Instead, we want to offer practical measures for implementing the R4VR-framework and show how these can help to meet the requirements of the EU AI Act.
3.1. Practical Implications from the R4VR-Framework
To begin with, we point out particular guidelines that can be extracted from the R4VR-framework. This results in a modular process which operationalizes HiL mechanisms, XAI and UQ in accordance with the EU AI Act. The process is outlined in Table 1. It ensures technical robustness, transparency, and traceability throughout the ML life cycle and is applicable across different use cases.
As Table 1 shows, the guidelines for implementation of the R4VR-framework consists of five iterative phases aligned with the EU AI Act. During data collection a representative and verified dataset is created by human experts. This aligns with Article 10 of the EU AI Act.
In the phase of Reliability, robust models are created harnessing XAI and UQ. That way, Article 15 is addressed.
Article 15 is addressed by the next phase - Validation - as well. By collaboration of domain experts and data scientists, weaknesses of the model are identified and directly addressed by retraining the model. That way, also human oversight is ensured (Article 14).
During Verification, the last step of model development, allowed ranges for the model are identified by the developer and documented. That way, risk management (Article 9) and technical documentation (Article 11) are addressed.
Finally, during application, logging is used to comply with Article 12. XAI and UQ provide transparency (Article 13) and - together with a targeted user interface - ensure human oversight (Article 14).
Regarding model application, it has to be noted that it covers three aspects of the R4VR-framework. Verification is satisfied when the end user ensures the model is approved for the use case. Validation is achieved through the user interface coupled with XAI and UQ. Reliability is addressed by operator supervision. Our guidelines therefore match the R4VR-framework exactly.
3.2. R4VR-Framework in Medical Use Cases
Having introduced practical guidelines on how to implement the R4VR-framework, we now take a look at how the framework can be adopted in medical use cases such as cancer diagnosis based on images. Here, we also point out how the framework supports conformity with the EU AI Act. At this point, we want to highlight that beyond technical compliance, medical applications require adherence to ethical and data protection principles (e.g. the General Data Protection Regulation).
Data Collection
To begin with, data should be collected. In medical use cases, this is relatively easy since physicians regularly diagnose patients based on images. These diagnoses correspond to labels and can usually be deemed reliable.
Reliability
A challenge with medical data is the fact that it is usually unbalanced. This has to be addressed by the developer during model training. He has to make sure, he works on a balanced dataset in order to create reliable models. To do so, he can use techniques such as data augmentation. He should train at least two models which are sufficiently different. The models should be checked for bias using XAI, e.g. saliency maps, and UQ should be implemented. If he detects bias, he has to take measures to reduce it. Regarding UQ, the developer must define thresholds when a model prediction is tagged as unreliable.
Validation
In the next step, the developer and a domain expert improve the system collaboratively. The domain expert examines the system by applying it to new images from clinical settings. Here, every image is tagged automatically, where two models predict differently or a model’s uncertainty exceeds the defined thresholds. Beyond that, the domain expert examines the models’ predictions explanations and flags every image where he encounters wrong predictions or inconsistent explanations. Based on that, the developer improves the model. This is an iterative process where the model gets better and better.
Verification
Finally, the models have to be verified by the developer. To that end, he should consider the weaknesses identified during validation and carefully check if they have been addressed sufficiently. Also, he should take into account the training data used for model training and test the model for certain input ranges. Based on these considerations and tests, the developer should then specify a range for which the model is applicable. In case of medical image diagnosis, this range should include information such as:
- Type of allowed images (MRI, CT, ...)
- Shape of images
- Institution and / or device where the images were recorded
- Population for which the model makes good predictions (e.g. a model for breast cancer detection in MRI images may be only admitted for application to female persons)
He then has to document his evaluation along with guidelines for model deployment.
Model Deployment
Once the models are developed, they can be handed over to the end user, e.g. a physician. For handover, the model should be integrated into a user interface which:
- Allows the user to upload images and make a prediction
- Incorporates a visual representation of models’ uncertainty allowing the user to immediately see if one of the models is too uncertain
- Visualizes the models’ explanation
- Allows the end user to mark images where uncertainty is high, an explanation is not stringent or at least one of the models predicts a result the user does not agree with
Based on the user interface, the end user should then deploy the model during diagnosis as decision support using the steps Verification, Validation and Reliability:
- 1.
- Verification: First of all, the end user has to make sure the model is approved for the use case. For example, if a model is only approved for female persons, he should not apply it for diagnosing males.
- 2.
-
Validation: In the next step, the end user should apply the model to images (e.g. MRI images from his female patient) and validate the model prediction by:
- (a)
- Making sure all models predict identically
- (b)
- No model exceeds predefined uncertainty thresholds
- (c)
- The models’ explanations are stringent meaning they do not rely on irrelevant features from the image such as the background
- 3.
- Reliability: Finally, the physician should compare the model’s prediction to his experience. To that end, he should regard the image himself and check if he agrees with the system’s prediction. In this step, the models’ predictions - in particular the explanation - can already be used to find important features in the image more efficiently and make a better decision based on that.
By using the ML models and following the steps of Verification, Validation and Reliability, physicians can come to a decision regarding diagnosis more efficiently and more safely. In the case of cancer diagnosis, the model and the physician complement each other. The model helps the physician to detect relevant features in an image more efficiently but the physician always remains in the decision-making role. A flowchart showing the exact workflow of model development and model deployment is also visualized in Figure 3.
3.3. R4VR-Framework in Industrial Image Recognition
For industrial settings such as visual inspection, adoption of the R4VR-framework can be relevant as well. While there are many industrial use cases that do not fall into the category of high risk applications according to the EU AI Act, some use cases fall within this category. For example inspection of safety components used in critical infrastructure has to be considered a high risk application. However, adoption of the R4VR-framework works slightly different for such use cases. In particular Data Collection, Validation and Deployment distinguish from medical settings.
Data Collection
A common issue - mainly in industrial settings - is a lack of data for model training. In most use cases, labeled data is necessary. Creating these labels is usually costly. However, when implementing ML models according to the R4VR-framework, data collection can easily be included as a prior step.
A user interface which allows relabeling of wrongly classified images is essential for deployment phase of the R4VR-framework. The user interface can be implemented beforehand without additional effort and be used to generate a first baseline dataset. To do so, the user interface should be deployed in the process where the readily developed system will be used as well. Images are then recorded. By default, every image is assigned the majority category of the process (e.g. "ok" in case of visual inspection or "healthy" in case of medical diagnosis). Every time, the person who is currently making the decision encounters an image that does not correspond to the majority class, he can directly assign the correct label to the image in the user interface. Once a sufficient amount of images is available - often 5 - 10 images per defect type can be enough -, a first support model can be trained and integrated into the image labeling process. The model checks every image. If the model predicts the majority class and the domain expert did not see a anything different, the label can be used immediately. If the model predicts a minority class, the domain expert is informed. He than has the opportunity to adapt the label. If he does not take any action, the label is used immediately as well. When the domain expert encounters a defect and is not informed by the system, he has to correct the label in the user interface. The model can be retrained regularly in order to increase its accuracy. That way, a self accelerating process emerges in which the model gets better progressively what leads to reduced relabeling effort for the human domain expert. A graphical outline of the process is also shown in Figure 4.
In the described process, there are two variables that determine the efficiency. First of all, there is the number of images used for training the initial models. The more images used, the better the initially trained model. However, a larger number of images used for training the initial models also corresponds to higher manual effort. The second parameter is the retraining frequency. Retraining should be conducted every time, a certain number of new images is available. The number of images labeled manually to get to the retraining step depends on the quality of the previously trained model. Therefore, frequent retraining may reduce the number of images to be labeled manually. On the contrary, frequent retraining leads to increased computational costs. The exact setting of the parameters has to be determined depending on the exact use case and the available computing resources.
In order to comply with the EU AI Act, data collection should be conducted over a sufficiently long time period to make sure, every possible situation of the production environment is represented in the training data sufficiently. Also, the process should be well documented.
Reliability
This phase can be conducted exactly as described in Sec. 3.2.
Validation
If a domain expert is available and the severity of risks justifies the costs of including a domain expert into the phase, it should be conducted as described in 3.2. Otherwise, it should be conducted very similarly with the difference that the developer himself examines the model predictions and - as he will often not be able to identify wrongly classified images - in particular the explanations.
Verification
This phase can be conducted exactly as described in Sec. 3.2.
Deployment & Monitoring
As in medical use cases, the readily developed model is handed over to the end user. As for medical diagnosis, the model should come with a user interface. However, the user interface should work slightly different. We recommend a user interface that:
- Automatically predicts for each new image recorded at the inspection system
- Incorporates a visual representation of models’ uncertainty allowing the user to immediately see if one of the models is too uncertain
- Visualizes the models’ explanations
- Allows the end user to mark and annotate images with bounding boxes and real class when uncertainty is high, an explanation is not stringent or at least one of the models predicts a result the user does not agree with
-
Warns the operator when:
- –
- Model uncertainty exceeds a predefined threshold
- –
- Two models predict differently
Based on the model and the user interface, the end user can deploy the model using the steps Verification, Validation and Reliability:
- 1.
- Verification: Whenever settings at the inspection system are changed or a new project is manufactured, the end user has to verify the model is approved for the situation.
- 2.
-
Validation: Validation is required when:
- Model uncertainty is high
- Models predict differently
The end user is automatically warned when validation is required. In that case, he should manually decide which class the image belongs to. Beyond that, he could relabel the image in the user interface and create a new training example that way. - 3.
- Reliability: In order to detect performance degradation (e.g. due to data shift), the end user should regularly check a certain amount of images manually and make sure the system still classifies reliably.
Using the described process, an automated inspection process emerges where manual input is only required occasionally for checking the system’s reliability or examining selected images where uncertainty is high or models disagree. The process is also outlined visually in Figure 5.
4. Implementation of R4VR-Framework for Visual Steel Surface Inspection
Having introduced practical implementation guidelines for the R4VR-framework, we now demonstrate how the framework can actually be used to train highly reliable ML models. To do so, we use the metal surface defects dataset [27] which is available on kaggle.
The dataset consists of 1800 gray scale images of surfaces of hot-rolled steel strips. The images represent common defects from 6 different classes, namely "Crazing", "Inclusion", "Pitted", "Patches" and "Rolled". Each image is 200 x 200 pixel.
For the elaboration, we assume that the inspection of steel surfaces is not related to risks that justify inclusion of an expert during Validation. As we currently don’t have a real world use case where we can actually deploy the readily developed model, we only exemplary demonstrate how the model could be deployed in real world scenarios. All experiments described below are available in our GitHub repository.
4.1. Data Collection
Although we use a labeled dataset, we imitate the process of data collection as outlined in Sec. 3.3. In particular, we train a VGG16 model as support model using an initial dataset and retrain the model regularly. As explained, the initial dataset size and the retraining frequency are important parameters that determine the efficiency of the process.
To provide insights in the efficiency of different parameter settings, we conduct the training of a support model with different settings for "number of initial images" and "retraining frequency". To do so, we vary the parameters "number of initial images" and "retraining frequency" and examine how many images have to be labeled manually and how many computing resources are required until every image from the training dataset is assigned the correct label. We conduct the test using a GPU of type NVIDIA GeForce RTX 4090.
We test initial number of images between 30 and 120 (5 - 20 images per class) and retraining frequencies between 12 and 60 (2 - 10 images per class). For the elaboration, we always use balanced datasets meaning that all image classes are represented equally. Regarding the initial dataset - as there is no majority class in the dataset - we assume that 5/6 of the images have to be labeled, i.e. images of one class obtain the correct label automatically. The results of our test on parameter setting are visualized in Figure 6.
The continuous lines in Figure 6 show the total number of images to be labeled manually depending on the initial size of the train set (decoded by color) and the retraining frequency (x-axis). The number of images to be labeled manually increases as the number of images for the initial training dataset increases. Also, reduced retraining frequency leads to higher manual labeling effort. In contrast, reduced retraining frequency lowers computing effort as is visualized by the dashed lines. Computing effort, is almost unaffected by number of initial samples. When using 30 images for initial model training and retraining every time, 12 new images are available, only 75 images have to be labeled manually. However, this leads to computing time of ∼ 2800 seconds (46 minutes). When reducing the retraining frequency to 48 images, 98 images have to be labeled manually but computing time decreases to ∼ 600 seconds (10 minutes). When using 120 images in the initial dataset, 158 images have to be labeled manually when using retraining frequency of 12 images. When decreasing the retraining frequency to 48 images, 170 images have to be labeled manually. Computing times are almost identical to the ones required when using 30 images for training the initial model.
Hence, it can be said that reduced number of initial training samples is better with regard to manual labeling effort but does not significantly improve computing costs. From Figure 6, it can be seen that using 30 images in the initial dataset (5 images per class) and retraining every time when 36 new images (6 images per class) are available is a good trade off between computing costs and manual labeling effort. That way, computation takes ∼ 900 seconds (15 minutes) and 85 images have to be labeled manually. The performance development in the first 10 retraining cycles for a support model trained that way is visualized in Figure 7.
It can be seen from Figure 7 that loss decreases from ∼ 2.0 for the first retraining stage to ∼ 0.0 - 0.5 in all other retraining stages and accuracy increases from ∼ 0.91 to ∼ 1.0. After 4 iterations of retraining, between 0 and 1 images have to be labeled manually to get to the next retraining stage.
4.2. Reliability - Creating Strong Baselines
Having collected a sufficient amount of data using the human in the loop approach, we no move on to implementation of the actual R4VR-framework. To begin with, we conduct the step of Reliability and train baseline models. We use all images available in the training dataset. This is a total of 276 images per class. In order to create sufficiently different models, we train each model only on half of the images.
Models are validated on the validation set and finally tested on the test set as well as all images from the original train set that were not used for training the appropriate model. That way, we obtain a VGG16 model with an accuracy of ∼ 0.9516 and a ResNet model with an accuracy of ∼ 0.9907.
Based on the models trained, we implement XAI and UQ to enhance reliability of the baseline models. In particular, we use MC dropout for purpose of UQ and Grad-CAM as XAI technique.
We then use saliency maps in order to find out if a model relies on certain pixels too strongly. In particular, we calculate the gradients for each image and then make predictions on these images using just a certain share of most relevant pixels. The share of pixels is increased gradually and the model uncertainty is calculated. The results are visualized in Figure 8.
It can be seen from Fig.Figure 8 that the uncertainty increases from ∼ 0.170 to ∼ 0.174 when increasing the share of pixels from 5 % to 65 %. Afterwards, it decreases to the level of ∼ 0.170 again. This behavior is exactly what can be expected by a reliable model. When the model sees only few pixels, it cannot identify the images and is certain of that. When the number of pixels increases, the model can slowly recognize the image but is still uncertain. When the number of pixels increases further, the model gets more certain of the image class.
In the next step, we examine how the model uncertainties are distributed within the training samples and define thresholds based on that. The distribution of model uncertainties on wrong and correct predictions for VGG16 model and ResNet18 model are visualized in Figure 9.
It can be seen from Figure 9 that the uncertainty for both models on correct predictions is close to zero in most cases. In contrast uncertainty on wrong predictions is mostly higher. Especially in case of ResNet18 model, correct and wrong predictions can be separated well by using uncertainty. In case of VGG16, this is not as easy as the 25%-percentile on wrong predictions is close to zero.
Based on the distributions of uncertainty, we set the threshold for uncertainty of ResNet18 model to 0.0098 which corresponds to the upper fence in the box-plot for correct predictions of the ResNet18 model. In case of VGG16 model, we use the upper fence in the box-plot for correct predictions as well although this may lead to some images for which the model predicts wrongly being overseen by the score. In other use cases, the score should be adapted depending on the risks at stake.
4.3. Validation - Iteratively Improving the Baseline
Using the baseline models as well as the XAI and UQ implementation, we proceed with the validation phase of the R4VR-framework.
To do so, we use 144 images that were not used during training. To each of these images, we apply the models, generate the explanation and compute uncertainty. All images for which either the models predict differently or uncertainty of at least one model exceeds the predefined threshold, are filtered automatically. These mechanisms are triggered 32 times. That way, 22 unique images are identified. The exact number of images per class identified by each mechanism is documented in Table 2.
Taking a closer look at these images reveals that both models show high uncertainty with regard to images of class "Scratches". Beyond that, the VGG model shows high uncertainty with regard to the class "Rolled". These insights can already be important insights for training as they show which images should be included into training more.
To get deeper insights into the reasons for the high uncertainty with regard to these images, we visualize the explanations for these images. An explanation for an image where no warning was triggered (upper visualization) and an image where both models were uncertain but predicted identically (lower visualization) is shown in Figure 10.
The image where both models were certain shows that the models highlight the region in the image as relevant where the defect is located. For the image where both models were uncertain, this is not the case. Here, the models highlight all regions in the image equally.
The insight about the models’ focus is particularly relevant for examination of all images that were not marked by the automatic warning mechanisms. We examine these images and filter all images where the explanations of the models do not focus on the region in the image that shows the defect. That way, we identify 13 more images.
We examine the images identified by the warning mechanisms as well as the images identified manually in more detail and look for common patterns in the images. Most of the images appear to have been taken in poor lighting conditions. In particular, the gradient of exposure is high in these images. An example is shown in Figure 11
To overcome the issue, we implement augmentation of the images for training. We retrain the models using the common images but as well images with an artificial gradient in brightness. That way, we improve accuracy of VGG16 model to 0.9877 (+ 0.0361). The ResNet model can not be improved by the approach.
At this point, we want to highlight the fact that the iteration of model improvement and manual validation may be conducted several times. Depending on the risks at stake and the model performance, more than one step of model improvement may be necessary.
4.4. Verification - What Is the Model Capable of?
For the readily developed model, we conduct Verification, the final step of development phase. To do so, we first of all regard the characteristics of the data used for training. Obviously, the model is only applicable to images which show defect types that were already seen in training. Also, the model has to be applied to grayscale images of shape 200 x 200 and the pre processing of images has to be conducted as we did in training.
Based on the insights from Validation phase, we take a closer look at the brightness of images. We divide the test images into different sets based on brightness and calculate accuracy and confusion matrices for these specific sets. That way, targeted upper and lower brightnesses are defined for each class. These values refer to the predicted class of the model. Once a model predicts a certain class and the class specific limits are exceeded, the model prediction has to be checked manually.
Using the defined thresholds, we test the model on all test images from the dataset. We obtain an combined accuracy of 0.9865. Any of the wrongly classified images was identified by our warning mechanisms meaning that no defect part had passed quality control.
4.5. Guidelines for Model Deployment & Monitoring
As we don’t have a real production environment where the model can be deployed, we provide some guidelines for deployment based on the insights from Sec. 4.2 -Section 4.4.
Verification
As a first step when applying the model, it has to be verified if the model may be applied at all. In case of our model for steel surface inspection, this means that the shape of the images has to be checked. Also, it has to be ensured that a grayscale image is used and the brightness of the images has to be checked against the thresholds. All these steps can be conducted automatically. If a criterion is not met, a human expert has to be informed.
Validation
If the requirements from Verification are met, the models can be applied to the image. The predictions are then compared against each other and the uncertainties are calculated. If at least one model uncertainty is too high or the models predict differently, operator intervention is required.
Reliability
In case of our inspection setting, random model predictions and explanations should be checked regularly (e.g. once per shift) by an human expert. As soon as he notices any inconsistencies, the system has to enter development phase for improvement again.
Differentiation Based on Risk
Finally, we want to provide a brief guide on how to differentiate in model application based on the risks at stake. First of all, it is possible to adapt the uncertainty thresholds for warnings. Also, the thresholds for allowed ranges for deploying the model can be adjusted. Beyond that, it is conceivable to adapt the frequency of operator intervention. For highly critical applications, the operator could be acquired to review a certain amount of model predictions every hour.
5. Discussion
We’ve developed practical guidelines for adopting the R4VR-framework in real world use cases and defined a process for reliable and efficient data collection that is compatible with our guidelines. We showed how these guidelines help to comply with the EU AI Act and demonstrated their applicability using a real-world scenario. Now, we critically discuss the guidelines and the outcomes of the case study.
5.1. Discussion of Methodological Approach
To begin with, we critically examine the methodological approach. In Sec. 3, we proposed precise guidelines for adopting the R4VR-framework in medical diagnosis and quality control and defined a process for reliable and efficient data collection that is compatible with our guidelines. Our guidelines should be implemented by an interdisciplinary team. If followed, they can lead to highly reliable ML systems.
Our guidelines satisfy key obligations under the EU AI Act: risk management (Article 9), data governance (Article 10), technical documentation (Article 11), record-keeping (Article 12), transparency and provision of information to deployers (Article 13), human oversight (Article 14) and accuracy & robustness (Article 15). However, requirements for post-market monitoring (Art. 16) and incident reporting (Art. 62) are only covered indirectly and remain open for implementation in future iterations.
For data collection, we proposed an iterative human-in-the-loop approach. The workflow ensures the generation of high-quality datasets that incorporate the knowledge of human domain experts to the greatest extent possible. Due to the iterative retraining of models, it is a self accelerating process where the need for human intervention decreases progressively. However, the method assumes availability of domain experts for initial labeling, which may not scale in all industries.
Our guidelines for adoption of the R4VR-framework emphasize human intervention as well. Full automation isn’t the aim. However, our guidelines couple explainability with uncertainty-driven decision thresholds, enabling selective human review rather than full manual inspection. Also, by coupling Grad-CAM explanations with MC dropout uncertainty estimates, we ensured interpretability and reliability at both the pixel and prediction level.
A limitation of the approach is the fact that it currently does not address long term data drifts. Data drifts can only be detected indirectly by high model uncertainty or during human supervision phases.
Regarding the workflow proposed in medical use cases, every image must be reviewed by a human expert. That may seem laborious. However, the integration of a targeted user interface along with XAI and UQ mechanisms allows physicians to assess images more efficiently and reduces the end user’s workload while ensuring high reliability.
For visual inspection tasks, human review is only required at regular intervals. The integration of XAI and UQ mechanisms increases system transparency and allows human operators to detect model malfunctions early. It is important to note that the workflow cannot guarantee 100% accuracy. However, we provide opportunities for differentiation based on the risks involved. For more critical use cases, it is possible to increase the operator’s interaction effort to maximize reliability. This approach offers a scalable solution for deploying ML in high stake visual inspection tasks, where the level of autonomy can be adjusted according to the severity of the risks. Nonetheless, safety assurance in real-world deployment requires governance measures such as audit trails, access control, and versioning of retrained models. Future iterations could integrate automated anomaly monitoring and explainability audits to maintain operational safety over time.
5.2. Discussion of Results
To demonstrate how the guidelines can be implemented in practice, we considered a use case from visual inspection, namely steel surface inspection. Regarding data collection, we demonstrated that a self accelerating process emerges where the model accuracy increases progressively while the manual effort decreases. Beyond that, we showed how to harness XAI in every phase of the ML system’s live cycle. That way, we established a system that allows for precise inspection of steel surfaces where every wrong model prediction is detected by warning mechanisms. Also, the system can be adapted flexibly to the severity of risks at stake by increasing or decreasing the intervention effort for human experts.
In terms of data collection, we pointed out the trade off between manual effort and computing costs. While more frequent retraining reduces manual labeling effort, it leads to higher computing costs. This trade off may be addressed by an adaptive approach where the retraining frequency decreases as the model performance increases in future work.
Currently, the experimental validation is limited to a single open dataset, which may not reflect real production variability Also, we did not apply the model in a real production scenario but only provided a theoretical description of how deployment in production scenarios could be implemented. Latency, throughput, and operator acceptance therefore remain open research questions. Future work should address these questions by tests in real production scenarios. That way, extended insights into the practical applicability and limitations can be gained.
5.3. Implications for Practice
Overall, we showed how to create a highly reliable, production ready system for visual inspection. The framework can offer support for compliance with the EU AI Act. Also, it can guide practitioners in industries like automotive, steel, and semiconductor manufacturing to integrate ML based inspection systems safely. Its various mechanisms for ensuring safety, trustworthiness and transparency of the final decisions can contribute to compliance with the EU AI Act and reliable systems. Also, it can contribute to adoption of ML based systems for medical diagnosis. The modular structure allows gradual automation: starting with full human verification and moving toward confidence-based autonomy. The open-source code base facilitates custom adaptation of explainability and uncertainty modules across domains. That way, we provide a practical resource supporting to comply with the EU AI Act.
6. Conclusions
We proposed practical guidelines for implementing highly reliable ML systems using the R4VR-framework. Beyond that, we defined a compatible process for reliable and efficient data collection. The guidelines provide precise instructions on building a model in the steps of Reliability, Validation, and Verification and deploying the model with reverse steps.
These guidelines address the need for reliable ML systems in high-stake decision systems where ML is often not applicable due to its black box nature. By operationalizing human oversight, data governance, and risk management in alignment with the EU AI Act, our work bridges the gap between trustworthy AI principles and practical industrial adoption.
We demonstrated the practical applicability of these guidelines using a dataset of steel surfaces, creating a highly reliable inspection system with warning mechanisms for capturing wrong predictions. We showed that a self accelerating process emerges during data collection where the manual effort decreases gradually. Based on the dataset curated that way, we created a system that achieves high accuracy. The system’s warning mechanisms captured every wrong prediction. The system can be flexibly adapted to the risks at stake. Future work will include deployment in real inspection lines and comparison against fully automated approaches.
In summary, we provide guidelines for creating highly reliable ML systems that can be deployed in high-stake decision scenarios such as medical diagnosis or inspection of components vital for the functioning of safety-critical devices.
References
- Madan, M.; Reich, C. Strengthening Small Object Detection in Adapted RT-DETR Through Robust Enhancements. Electronics 2025, 14. [CrossRef]
- Jia, Y.; McDermid, J.; Lawton, T.; Habli, I. The Role of Explainability in Assuring Safety of Machine Learning in Healthcare. IEEE Trans. Emerg. Top. Comput. 2022, 10, 1746–1760. [CrossRef]
- Amirian, S.; Carlson, L.A.; Gong, M.F.; Lohse, I.; Weiss, K.R.; Plate, J.F.; Tafti, A.P. Explainable AI in Orthopedics: Challenges, Opportunities, and Prospects. In Proceedings of the 2023 Congress in Computer Science, Computer Engineering, & Applied Computing (CSCE), 2023, pp. 1374–1380. [CrossRef]
- Renjith, V.; Judith, J. A Review on Explainable Artificial Intelligence for Gastrointestinal Cancer using Deep Learning. In Proceedings of the 2023 Annual International Conference on Emerging Research Areas: International Conference on Intelligent Systems (AICERA/ICIS), Kerala, India, 11 2023; pp. 1–6. [CrossRef]
- Plevris, V. Assessing uncertainty in image-based monitoring: addressing false positives, false negatives, and base rate bias in structural health evaluation. Stochastic Environmental Research and Risk Assessment 2025, 39, 959 – 972. [CrossRef]
- R, V.C.; Asha, V.; Saju, B.; N, S.; Mrudhula Reddy, T.R.; M, S.K. Face Recognition and Identification Using Deep Learning. In Proceedings of the 2023 Third International Conference on Advances in Electrical, Computing, Communication and Sustainable Technologies (ICAECT), 2023, pp. 1–5. [CrossRef]
- Adadi, A.; Berrada Khan, M. Peeking inside the black-box: A survey on explainable artificial intelligence (XAI). IEEE Access 2018, 6, 52138–52160. [CrossRef]
- Kaur, D.; Uslu, S.; Rittichier, K.J.; Durresi, A. Trustworthy Artificial Intelligence: A Review. ACM Comput. Surv. 2022, 55. [CrossRef]
- Wiggerthale, J.; Reich, C. Explainable Machine Learning in Critical Decision Systems: Ensuring Safe Application and Correctness. AI 2024, 5, 2864–2896. [CrossRef]
- European Parliament. EU AI Act: First Regulation on Artificial Intelligence. Available online: https://www.europarl.europa.eu/topics/en/article/20230601STO93804/eu-ai-act-first-regulation-on-artificial-intelligence, 2023. accesed on 28 Sep 2024.
- Mahajan, P.; Aujla, G.S.; Krishna, C.R. Explainable Edge Computing in a Distributed AI - Powered Autonomous Vehicular Networks. In Proceedings of the 2024 IEEE International Conference on Communications Workshops (ICC Workshops), Denver, USA, 03 2024; pp. 1195–1200. [CrossRef]
- Paul, S.; Vijayshankar, S.; Macwan, R. Demystifying Cyberattacks: Potential for Securing Energy Systems With Explainable AI. In Proceedings of the 2024 International Conference on Computing, Networking and Communications (ICNC), Hawaii, USA, 02 2024; pp. 430–434. [CrossRef]
- Afzal-Houshmand, S.; Papamartzivanos, D.; Homayoun, S.; Veliou, E.; Jensen, C.D.; Voulodimos, A.; Giannetsos, T. Explainable Artificial Intelligence to Enhance Data Trustworthiness in Crowd-Sensing Systems. In Proceedings of the 2023 19th International Conference on Distributed Computing in Smart Systems and the Internet of Things (DCOSS-IoT), Pafos, Cyprus, 06 2023; pp. 568–576. [CrossRef]
- Moghadasi, N.; Piran, M.; Valdez, R.S.; Baek, S.; Moghaddasi, N.; Polmateer, T.L.; Lambert, J.H. Process Quality Assurance of Artificial Intelligence in Medical Diagnosis. In Proceedings of the 2024 International Conference on Intelligent Systems and Computer Vision (ISCV), Fez, Morocco, 05 2024; pp. 1–8. [CrossRef]
- Rožman, J.; Hagras, H.; Andreu-Perez, J.; Clarke, D.; Müeller, B.; Fitz, S. A Type-2 Fuzzy Logic Based Explainable AI Approach for the Easy Calibration of AI models in IoT Environments. In Proceedings of the 2021 IEEE International Conference on Fuzzy Systems (FUZZ-IEEE), Luxembourg, 07 2021; pp. 1–8. [CrossRef]
- Shtayat, M.M.; Hasan, M.K.; Sulaiman, R.; Islam, S.; Khan, A.U.R. An Explainable Ensemble Deep Learning Approach for Intrusion Detection in Industrial Internet of Things. IEEE Access 2023, 11, 115047–115061. [CrossRef]
- Sherry, L.; Baldo, J.; Berlin, B. Design of Flight Guidance and Control Systems Using Explainable AI. In Proceedings of the 2021 Integrated Communications Navigation and Surveillance Conference (ICNS), Virtual Event, 04 2021; pp. 1–10. [CrossRef]
- Wang, K.; Yin, S.; Wang, Y.; Li, S. Explainable Deep Learning for Medical Image Segmentation With Learnable Class Activation Mapping. In Proceedings of the 2023 2nd Asia Conference on Algorithms, Computing and Machine Learning, Shanghai, China, 05 2023; p. 210–215. [CrossRef]
- Ahmad Khan, M.; Khan, M.; Dawood, H.; Dawood, H.; Daud, A. in Heavy Transport. IEEE Access 2024, 12, 114940–114950. [CrossRef]
- Masud, M.T.; Keshk, M.; Moustafa, N.; Linkov, I.; Emge, D.K. Explainable Artificial Intelligence for Resilient Security Applications in the Internet of Things. IEEE open J. Commun. Soc. 2024, pp. 1–1. [CrossRef]
- Molnar, C. Interpretable Machine Learning, 2 ed.; Independently published, 2022.
- Kares, F.; Speith, T.; Zhang, H.; Langer, M. What Makes for a Good Saliency Map? Comparing Strategies for Evaluating Saliency Maps in Explainable AI (XAI), 2025, [arXiv:cs.HC/2504.17023].
- Gizzini, A.K.; Medjahdi, Y.; Ghandour, A.J.; Clavier, L. Towards Explainable AI for Channel Estimation in Wireless Communications. IEEE Transactions on Vehicular Technology 2024, 73, 7389–7394. [CrossRef]
- Salvi, M.; Seoni, S.; Campagner, A.; Gertych, A.; Acharya, U.; Molinari, F.; Cabitza, F. Explainability and uncertainty: Two sides of the same coin for enhancing the interpretability of deep learning models in healthcare. International Journal of Medical Informatics 2025, 197, 105846. [CrossRef]
- Abdar, M.; Pourpanah, F.; Hussain, S.; Rezazadegan, D.; Liu, L.; Ghavamzadeh, M.; Fieguth, P.; Cao, X.; Khosravi, A.; Acharya, U.R.; et al. A review of uncertainty quantification in deep learning: Techniques, applications and challenges. J. Inf. Fusion 2021, 76, 243–297. [CrossRef]
- Gal, Y.; Ghahramani, Z. Dropout as a Bayesian Approximation: Representing Model Uncertainty in Deep Learning. arXiv 2016, [arXiv:stat.ML/1506.02142].
- Islam, F.; Rahman, M. Metal Surface Defect Inspection through Deep Neural Network. In Proceedings of the Proceedings of the International Conference on Mechanical, Industrial and Energy Engineering 2018, 2018.
Figure 1.
General structure of the R4VR-framework; developer undergoes Reliability, Validation and Verification, end user undergoes theses steps in reverse order
Figure 1.
General structure of the R4VR-framework; developer undergoes Reliability, Validation and Verification, end user undergoes theses steps in reverse order
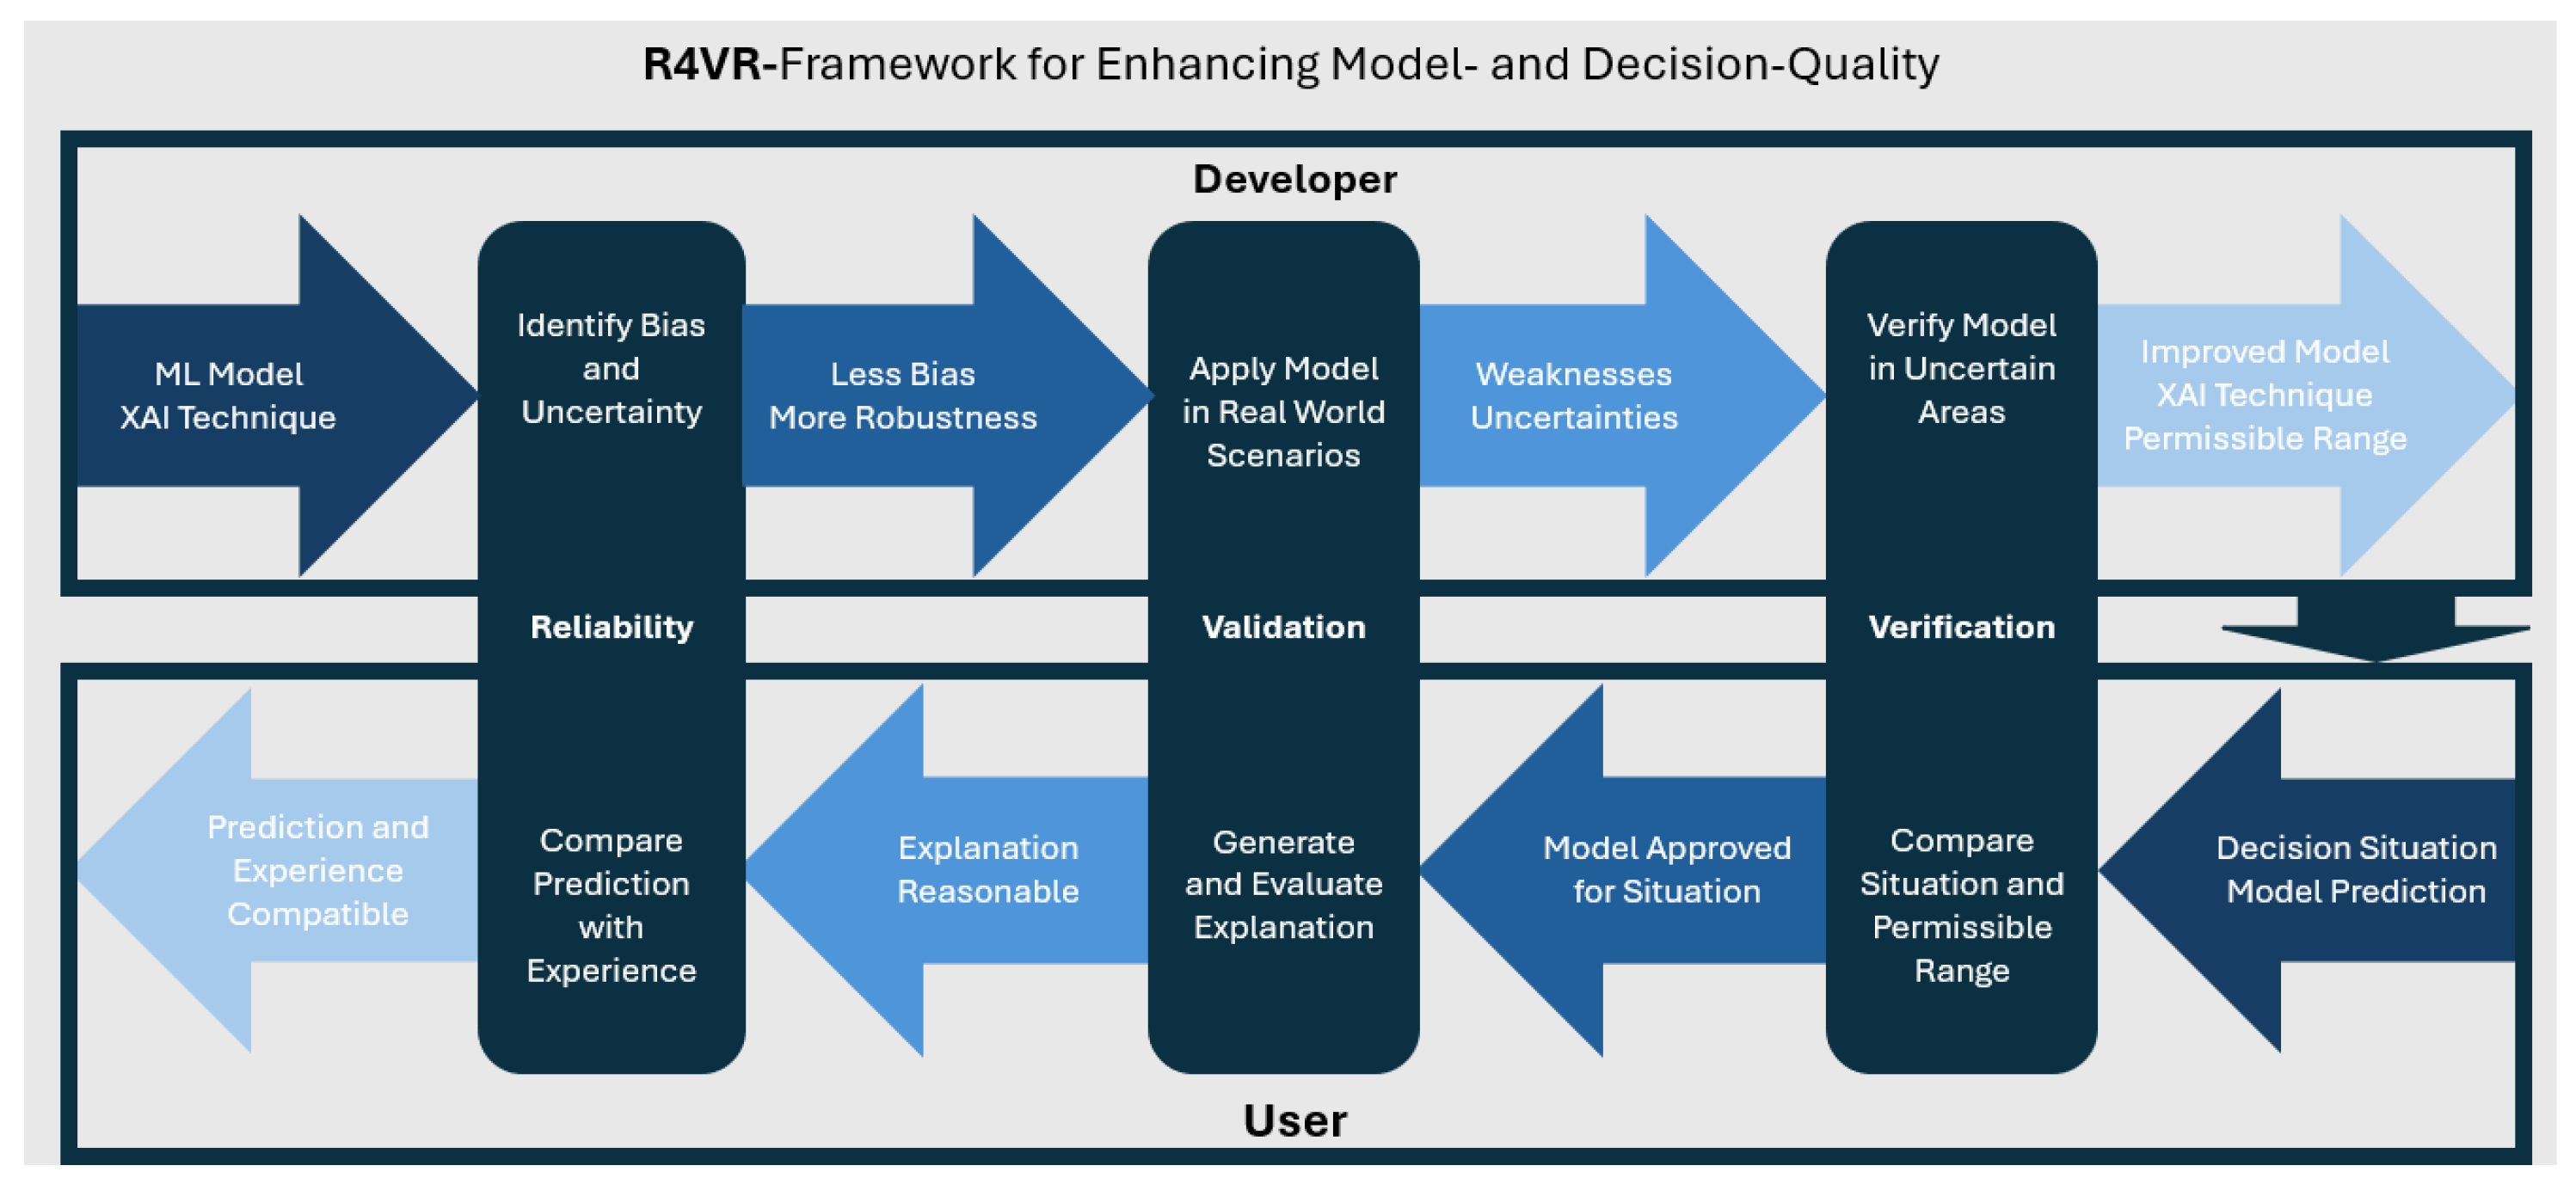
Figure 2.
Example of saliency map (left) and corresponding image (right); most important regions used for classification are marked in lighter red; important regions correspond to the areas in the image, where inclusion is located
Figure 2.
Example of saliency map (left) and corresponding image (right); most important regions used for classification are marked in lighter red; important regions correspond to the areas in the image, where inclusion is located
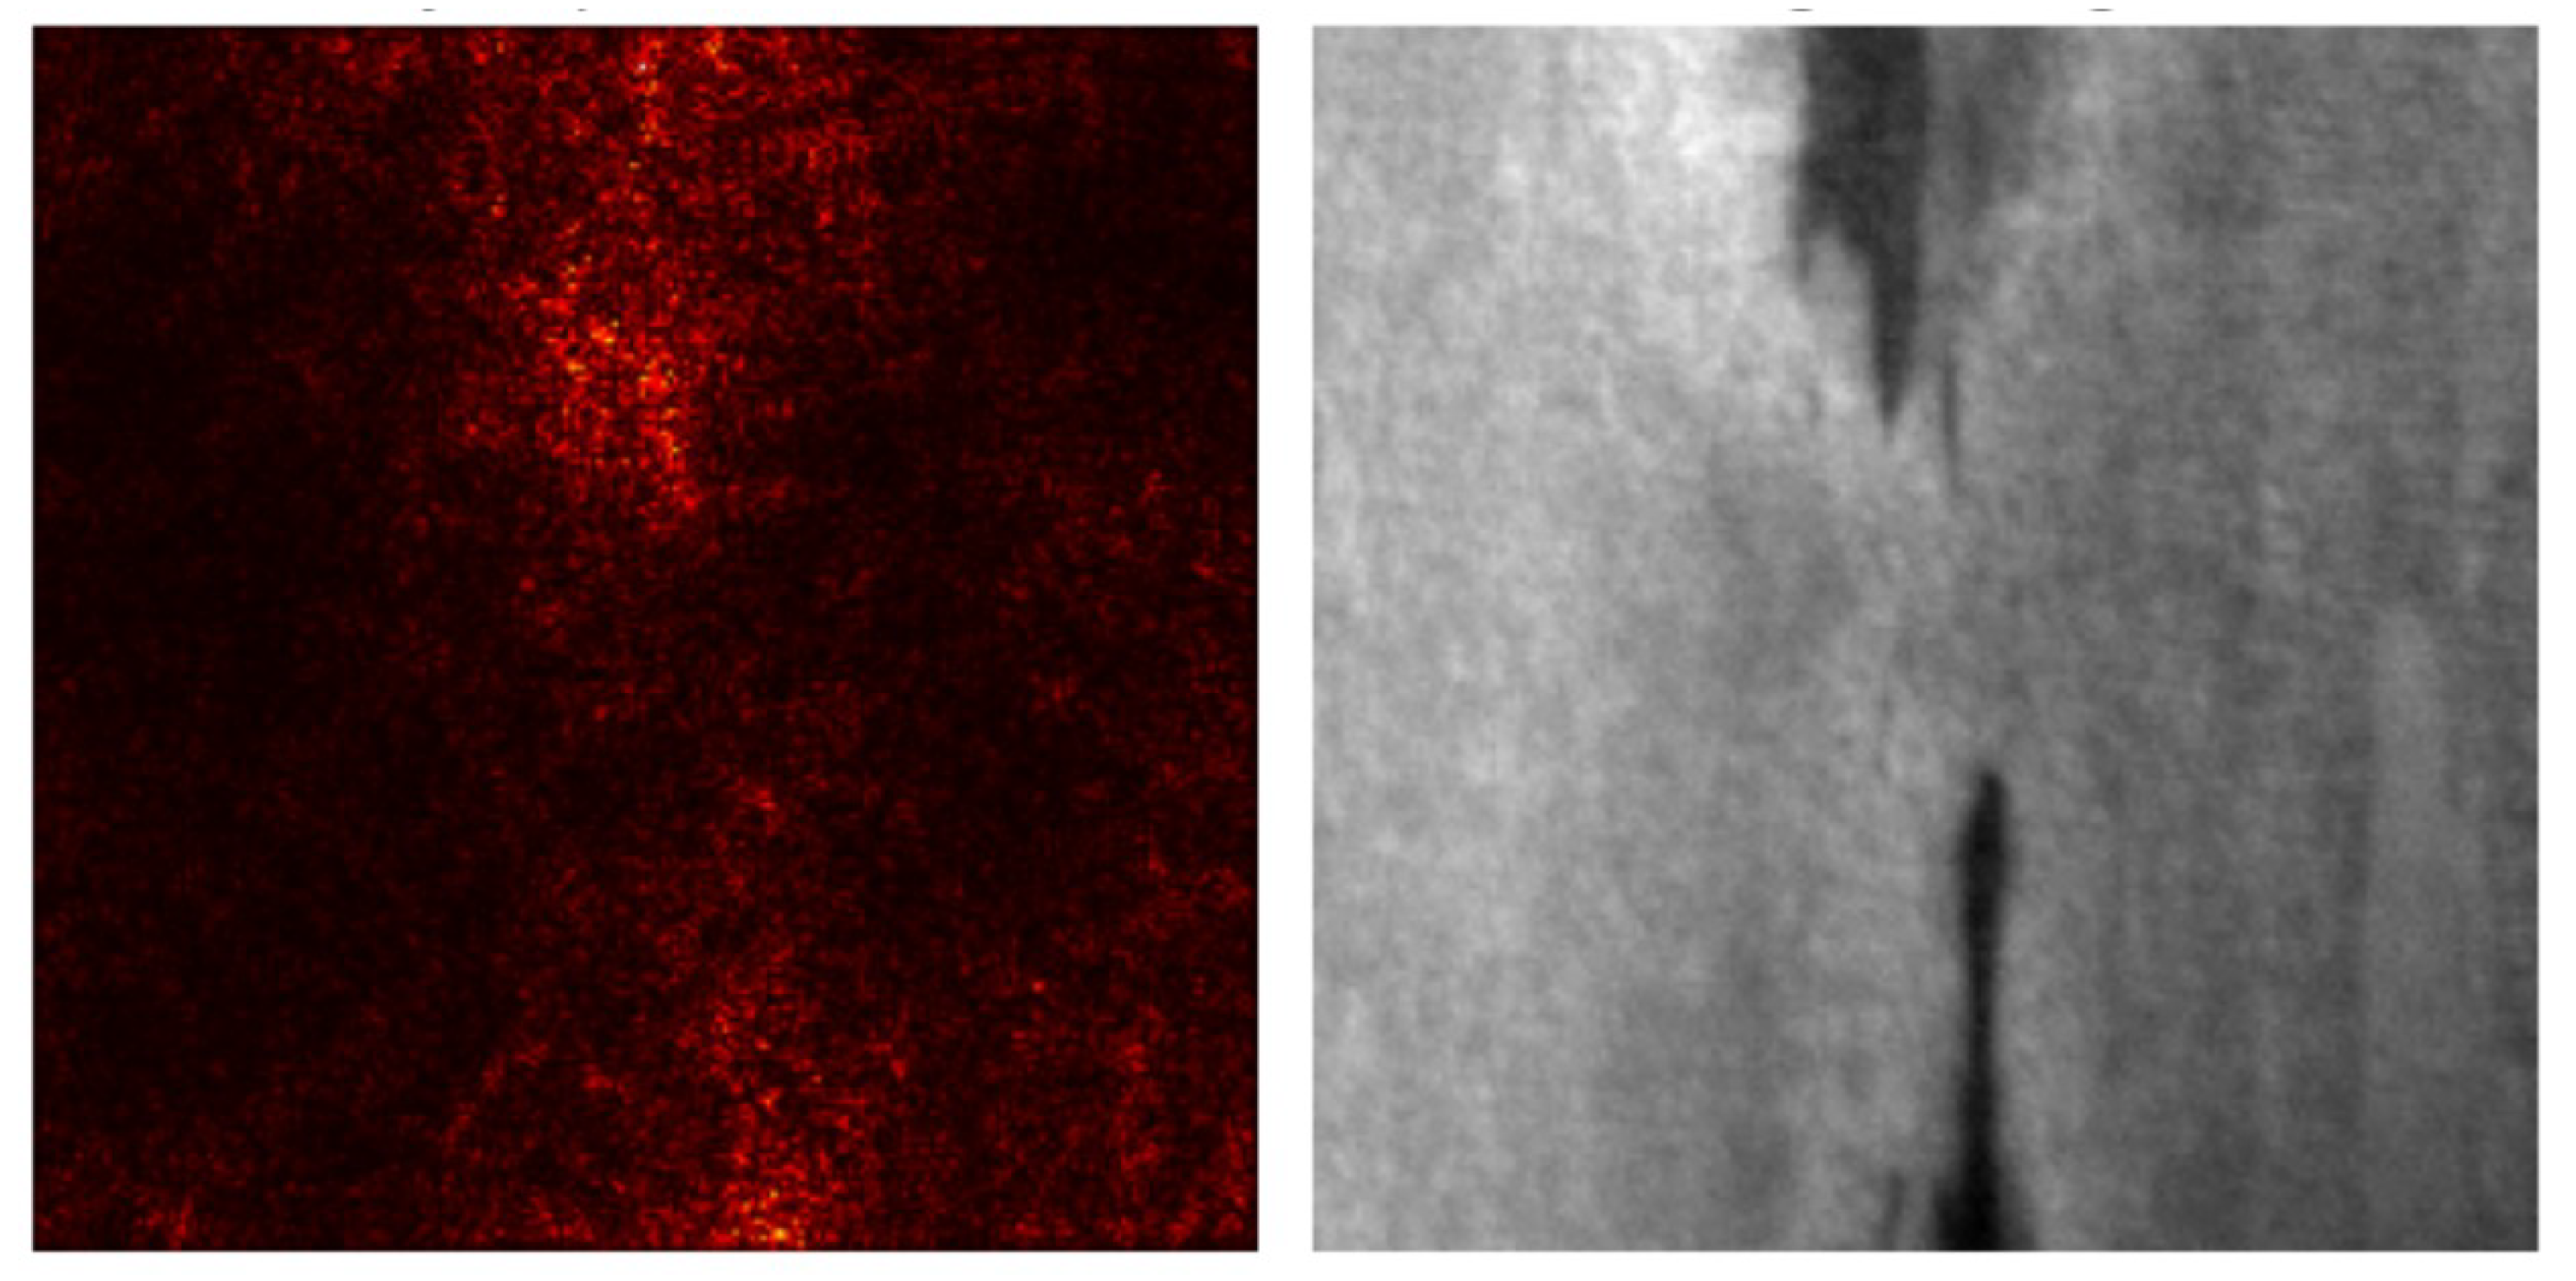
Figure 3.
Flowchart showing how the R4VR-framework can be adopted in medical use cases
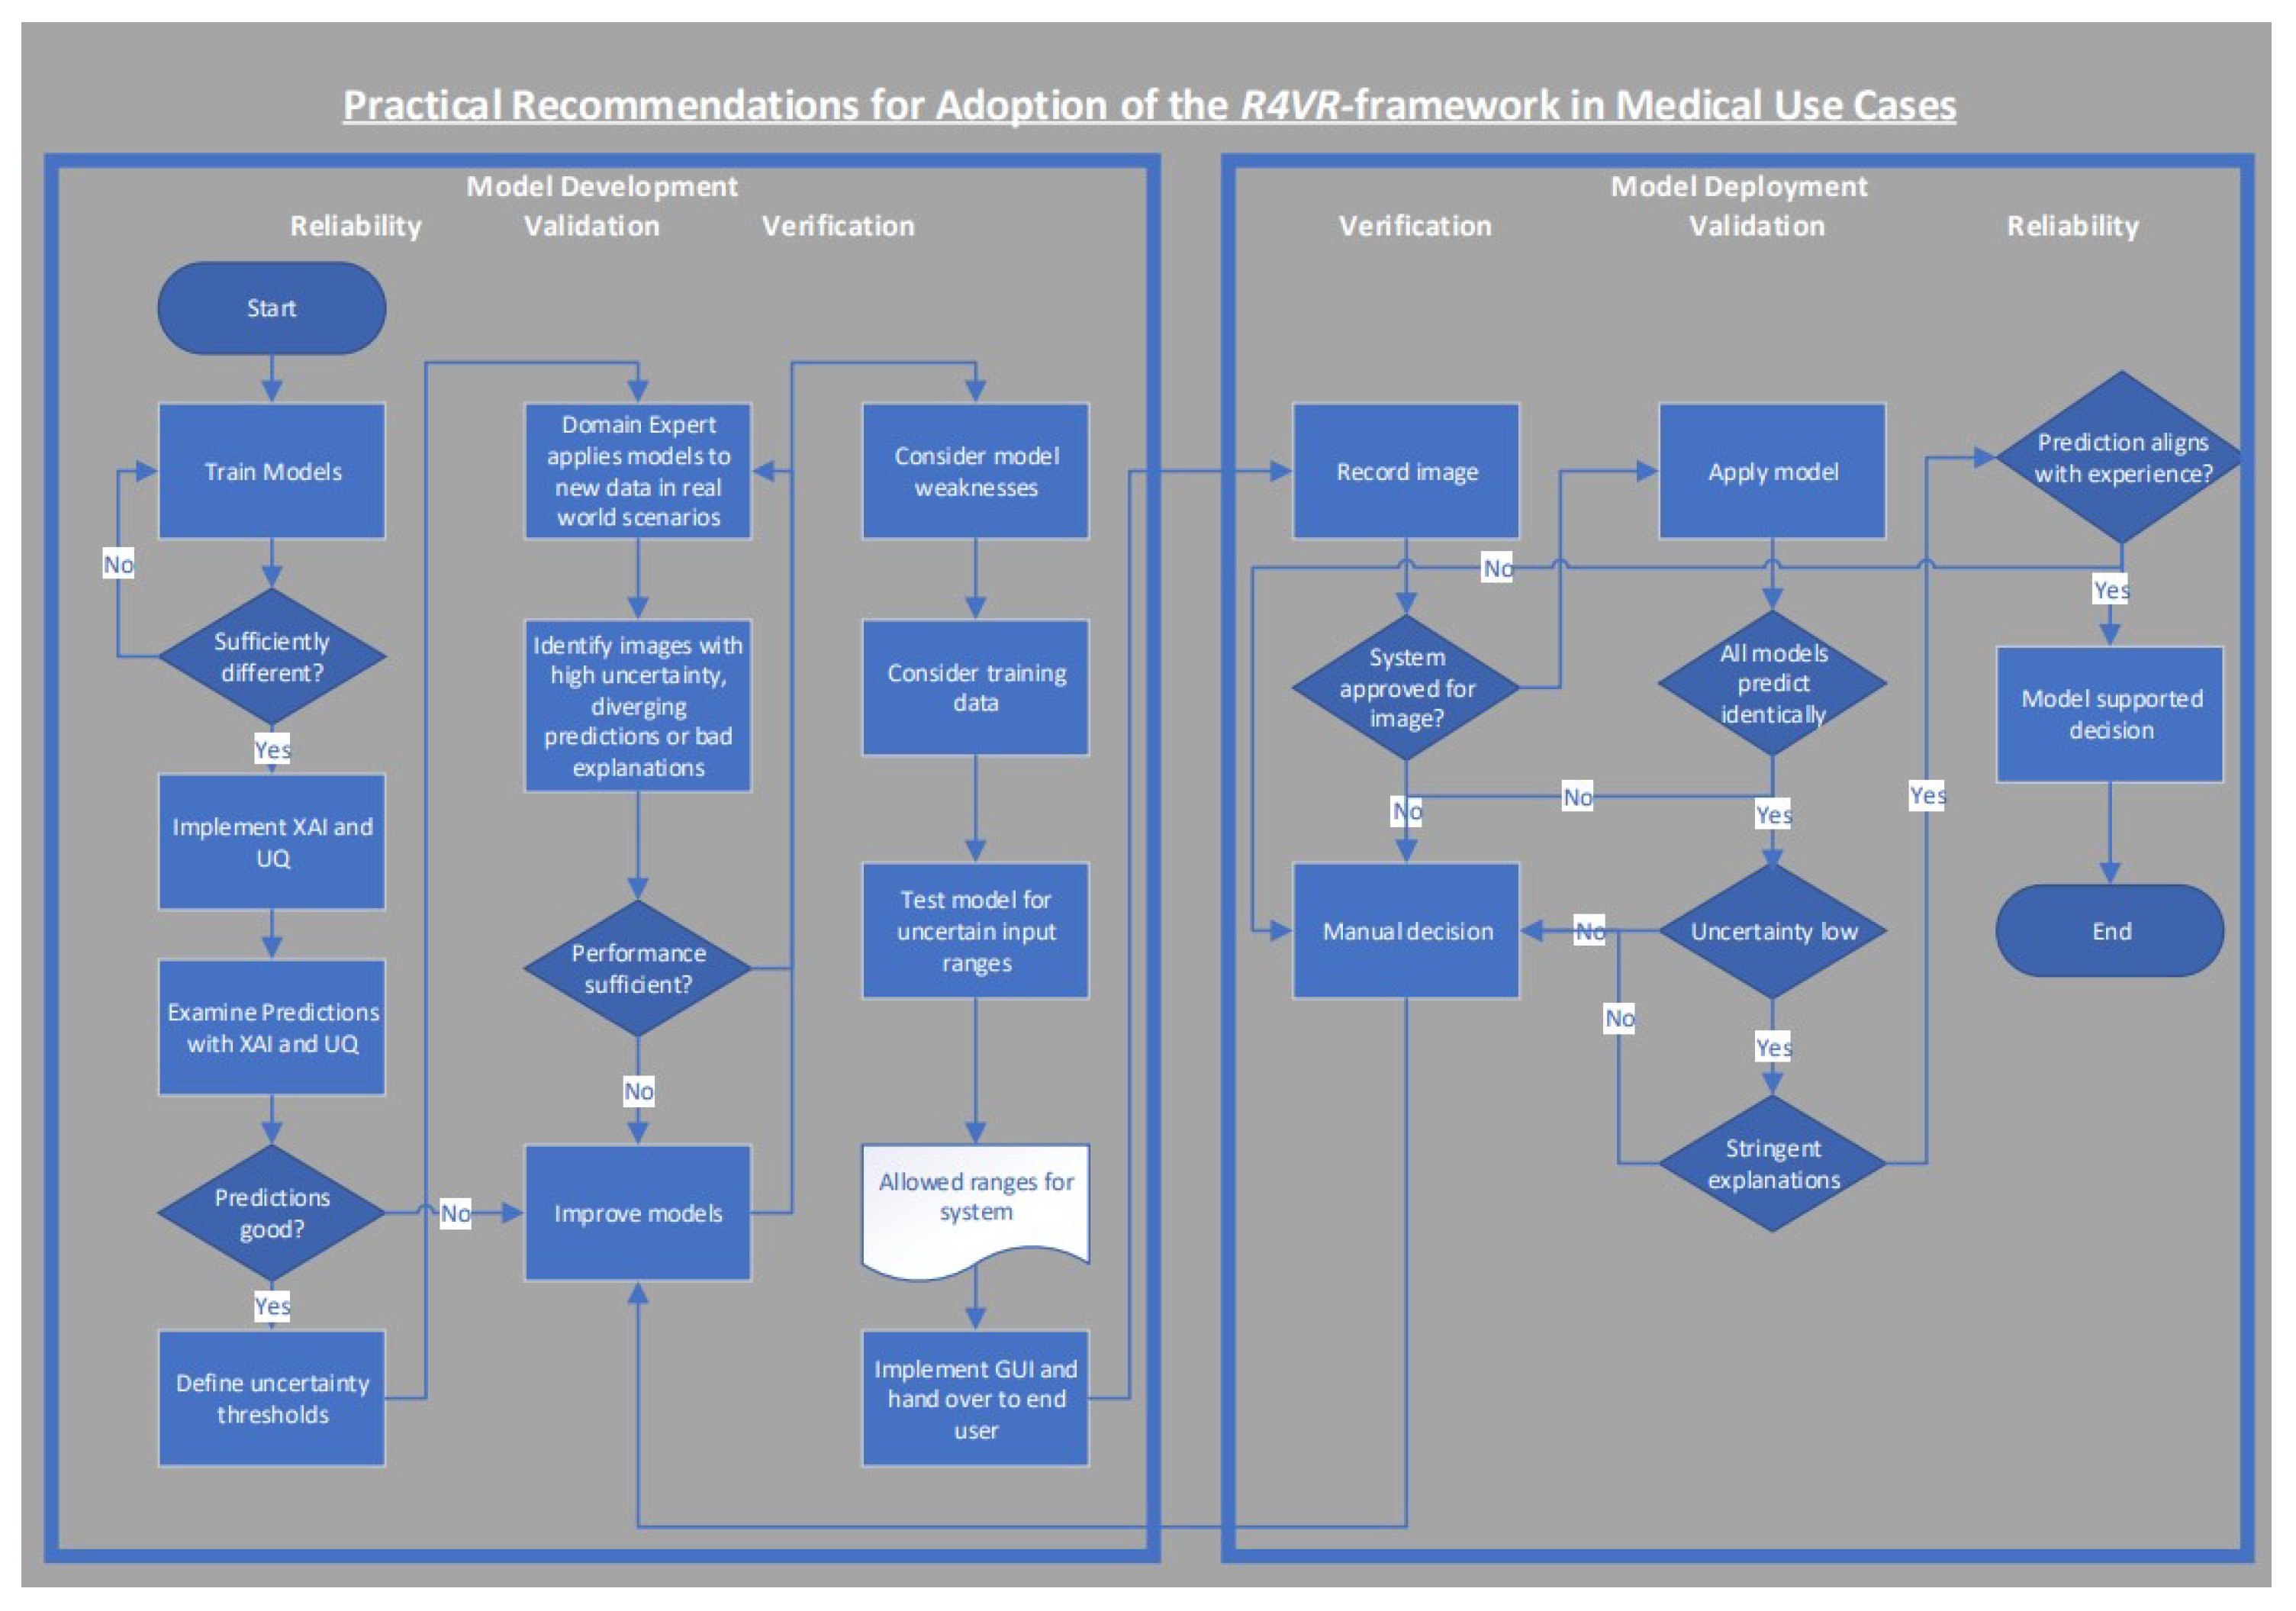
Figure 4.
Graphical outline of data generation process: images are recorded in the process; human expert creates initial labels for training a support model; support model assists human expert in data collection and is retrained regularly
Figure 4.
Graphical outline of data generation process: images are recorded in the process; human expert creates initial labels for training a support model; support model assists human expert in data collection and is retrained regularly
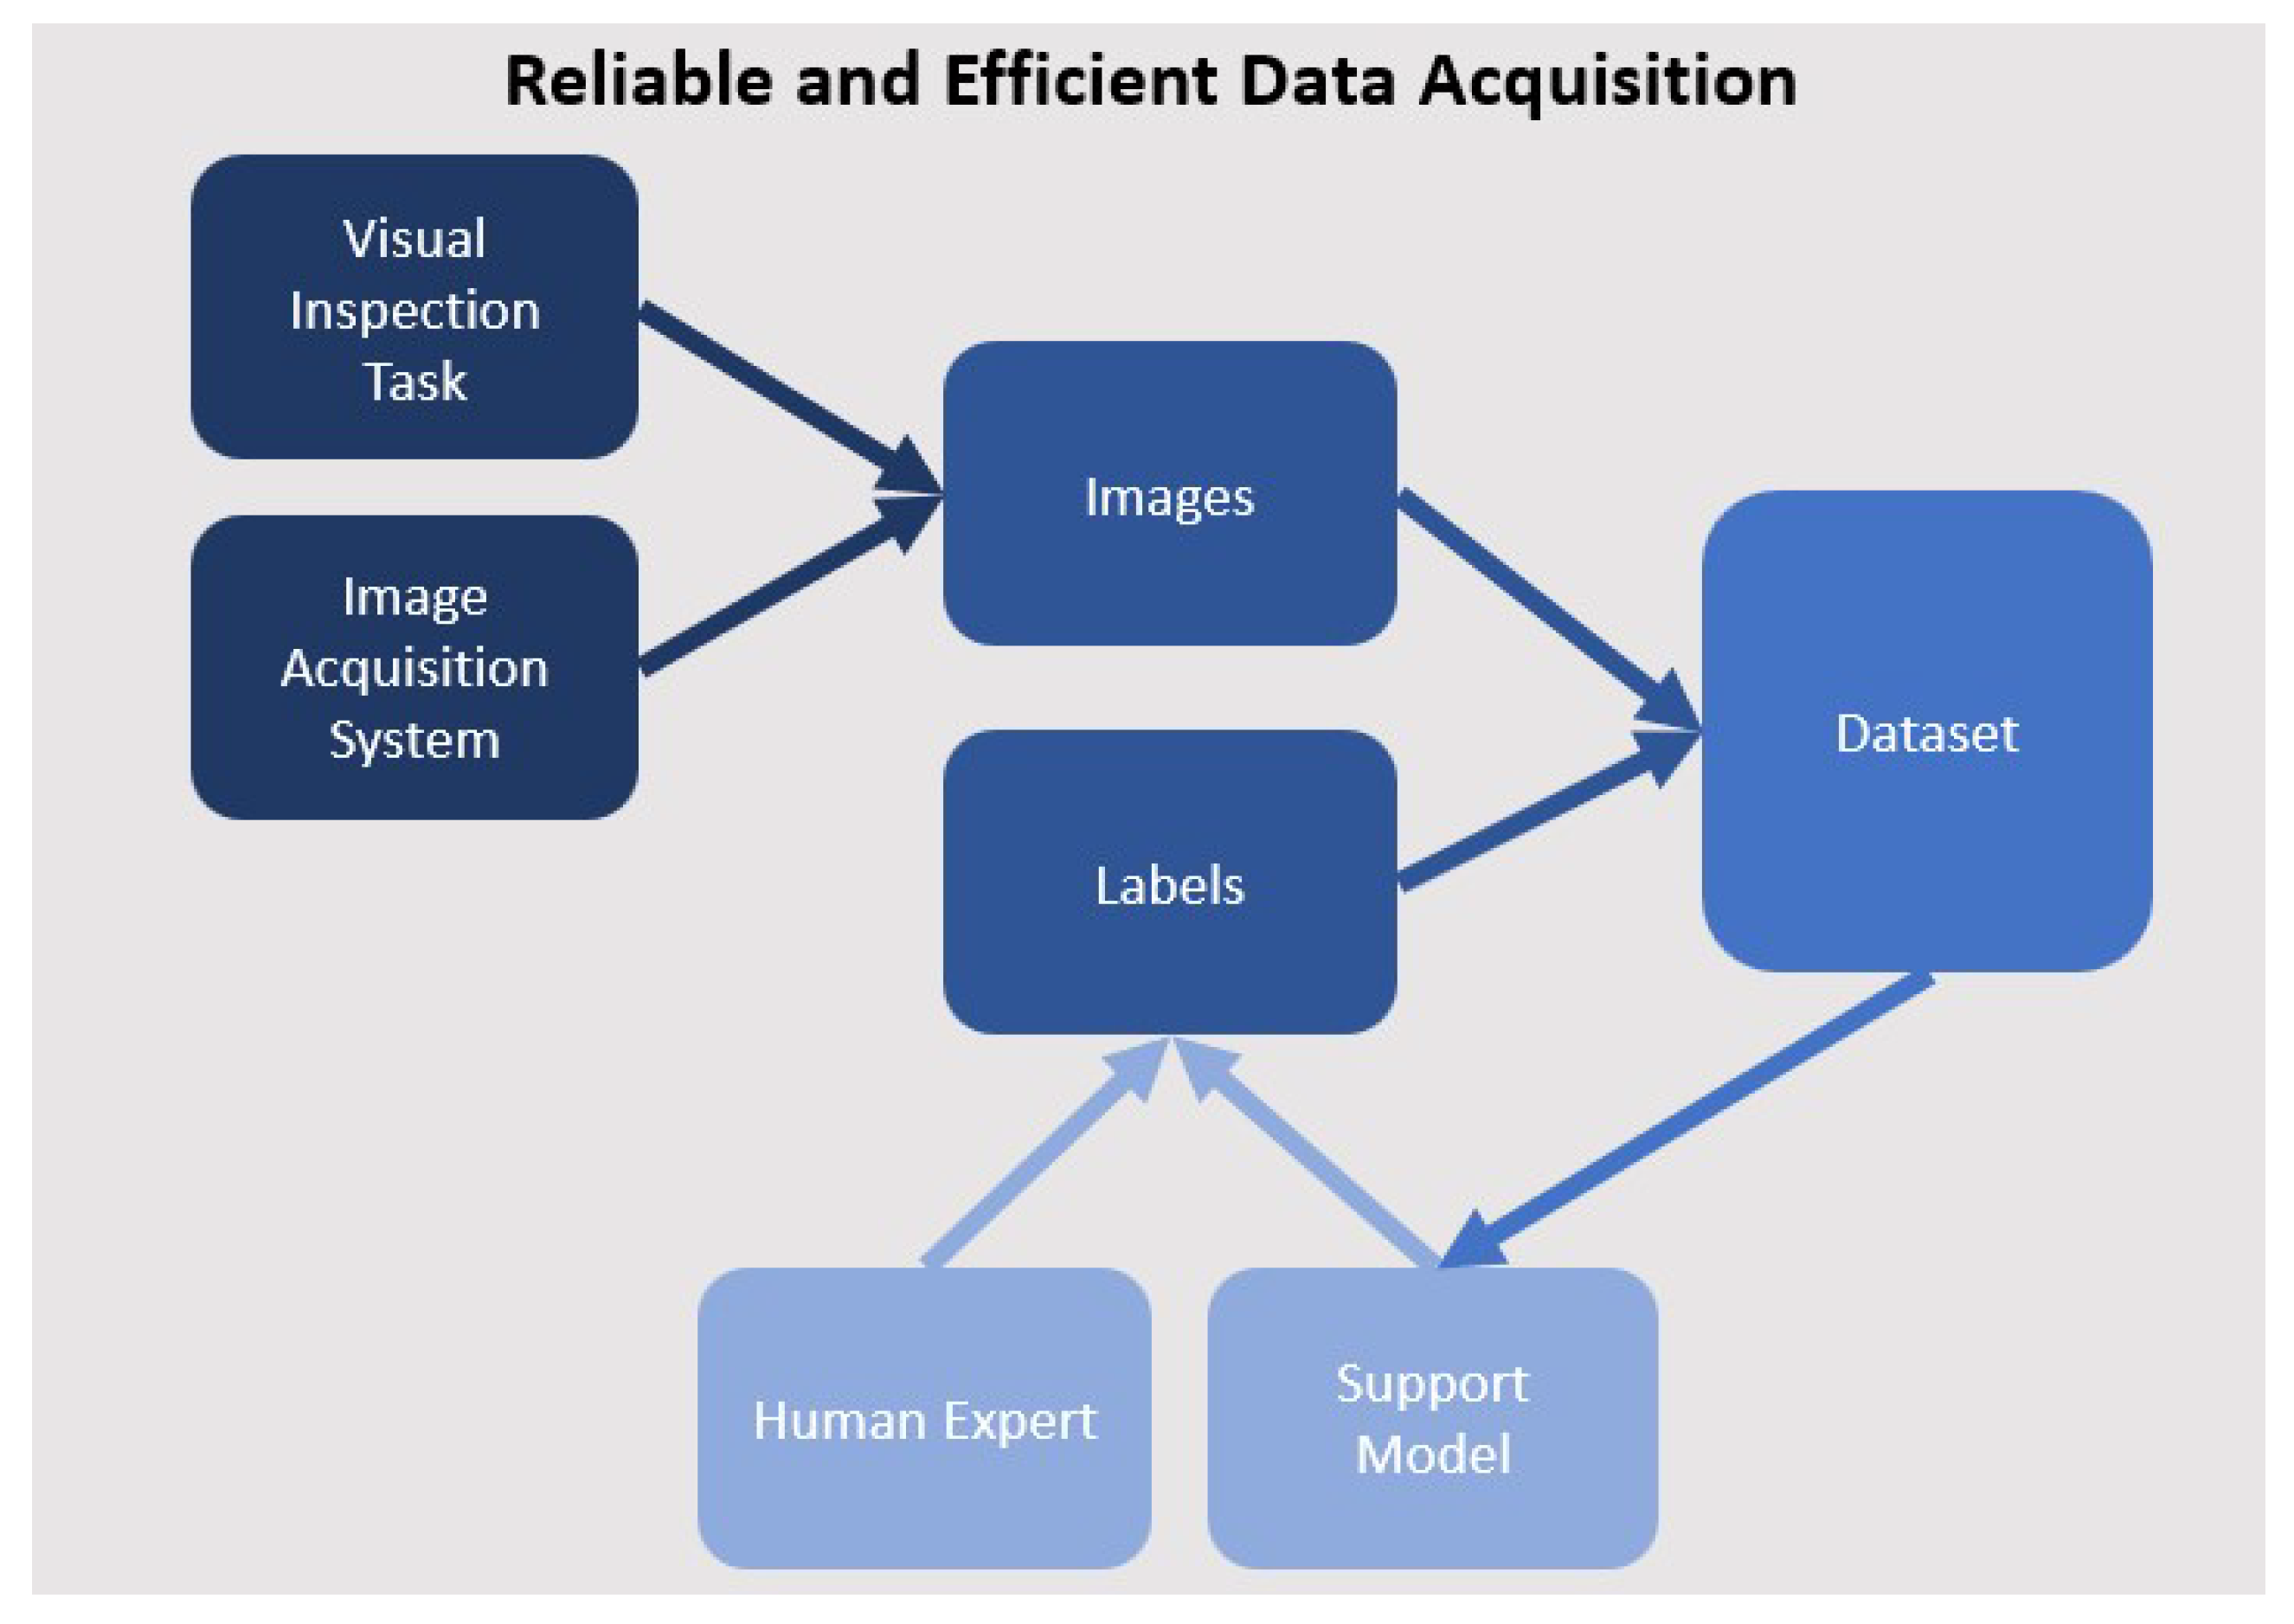
Figure 5.
Flowchart showing how the R4VR-framework can be adopted in industrial inspection tasks; key differences compared to recommendations on adaption of the R4VR-framework in medical use cases are highlighted in orange; main difference is that model predictions can be used automatically after Validation; Reliability during model application is realized by occasional checks instead of model supported decision
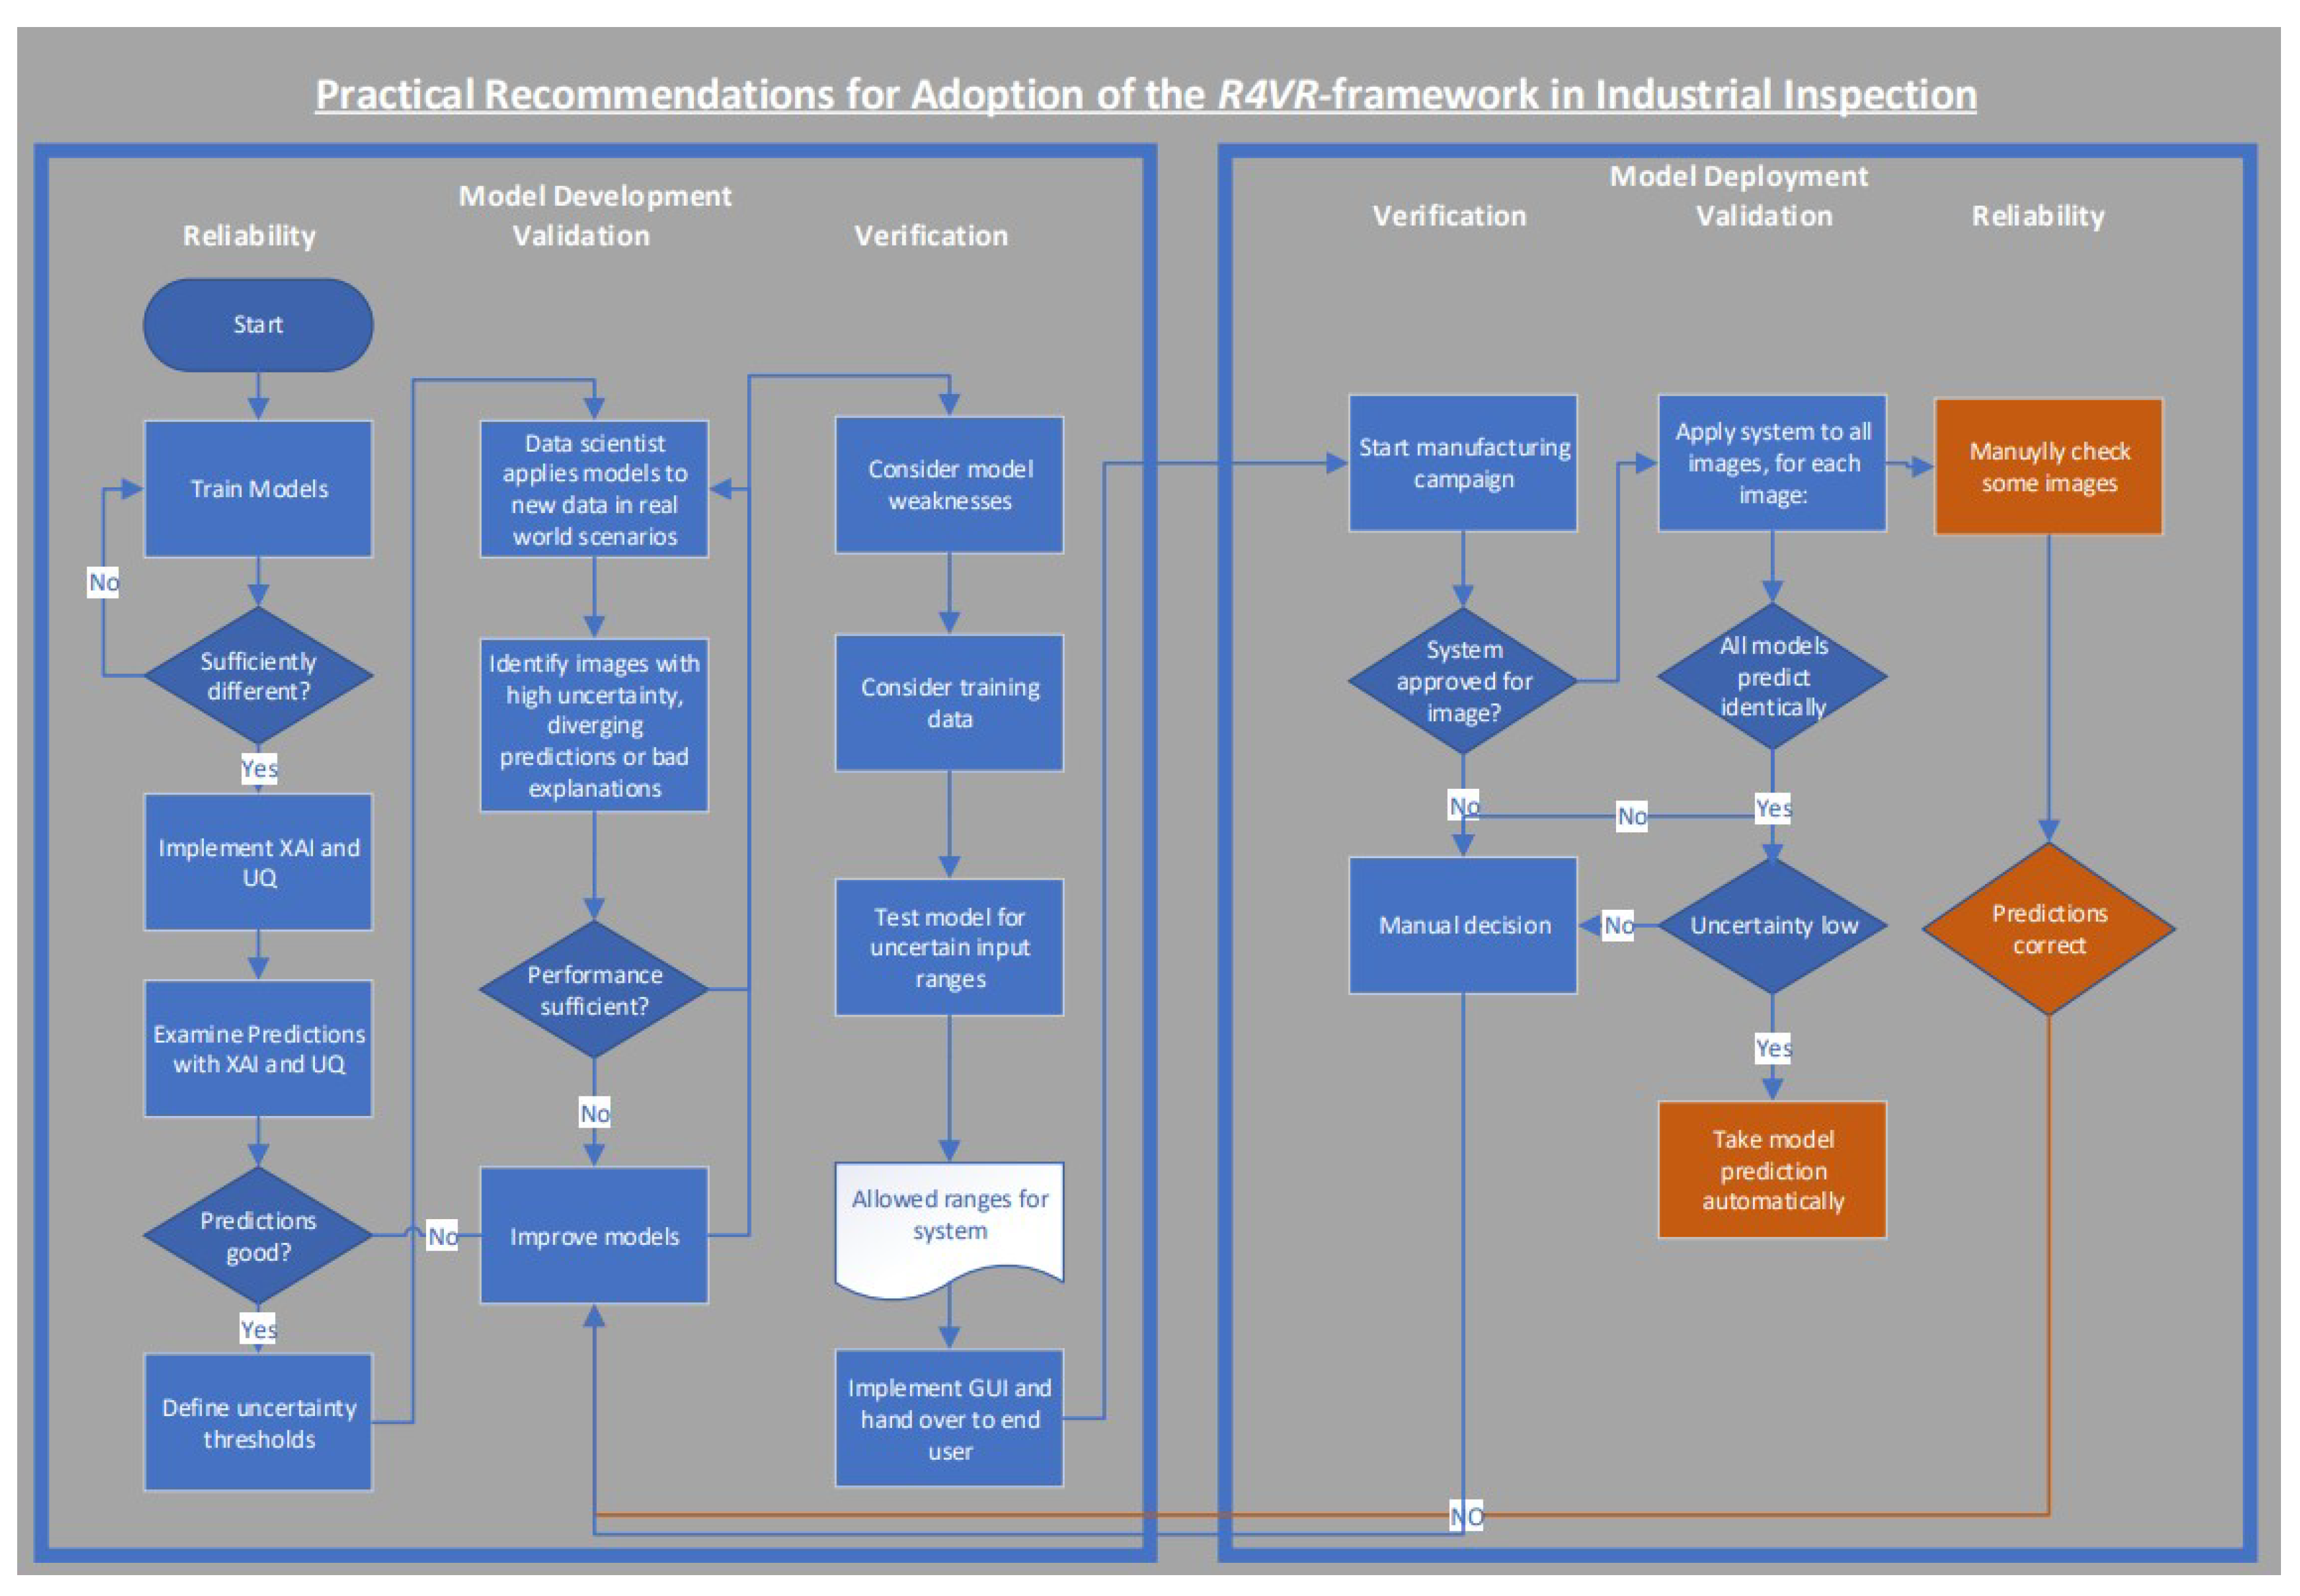
Figure 6.
Impact of number of images used for initial training and retraining frequency on number of images to be labeled manually and computing time; more images have to be labeled manually when number of images used for initial model training or step size increase; computing time reduces when reducing retraining frequency but is almost unaffected of number of initial images
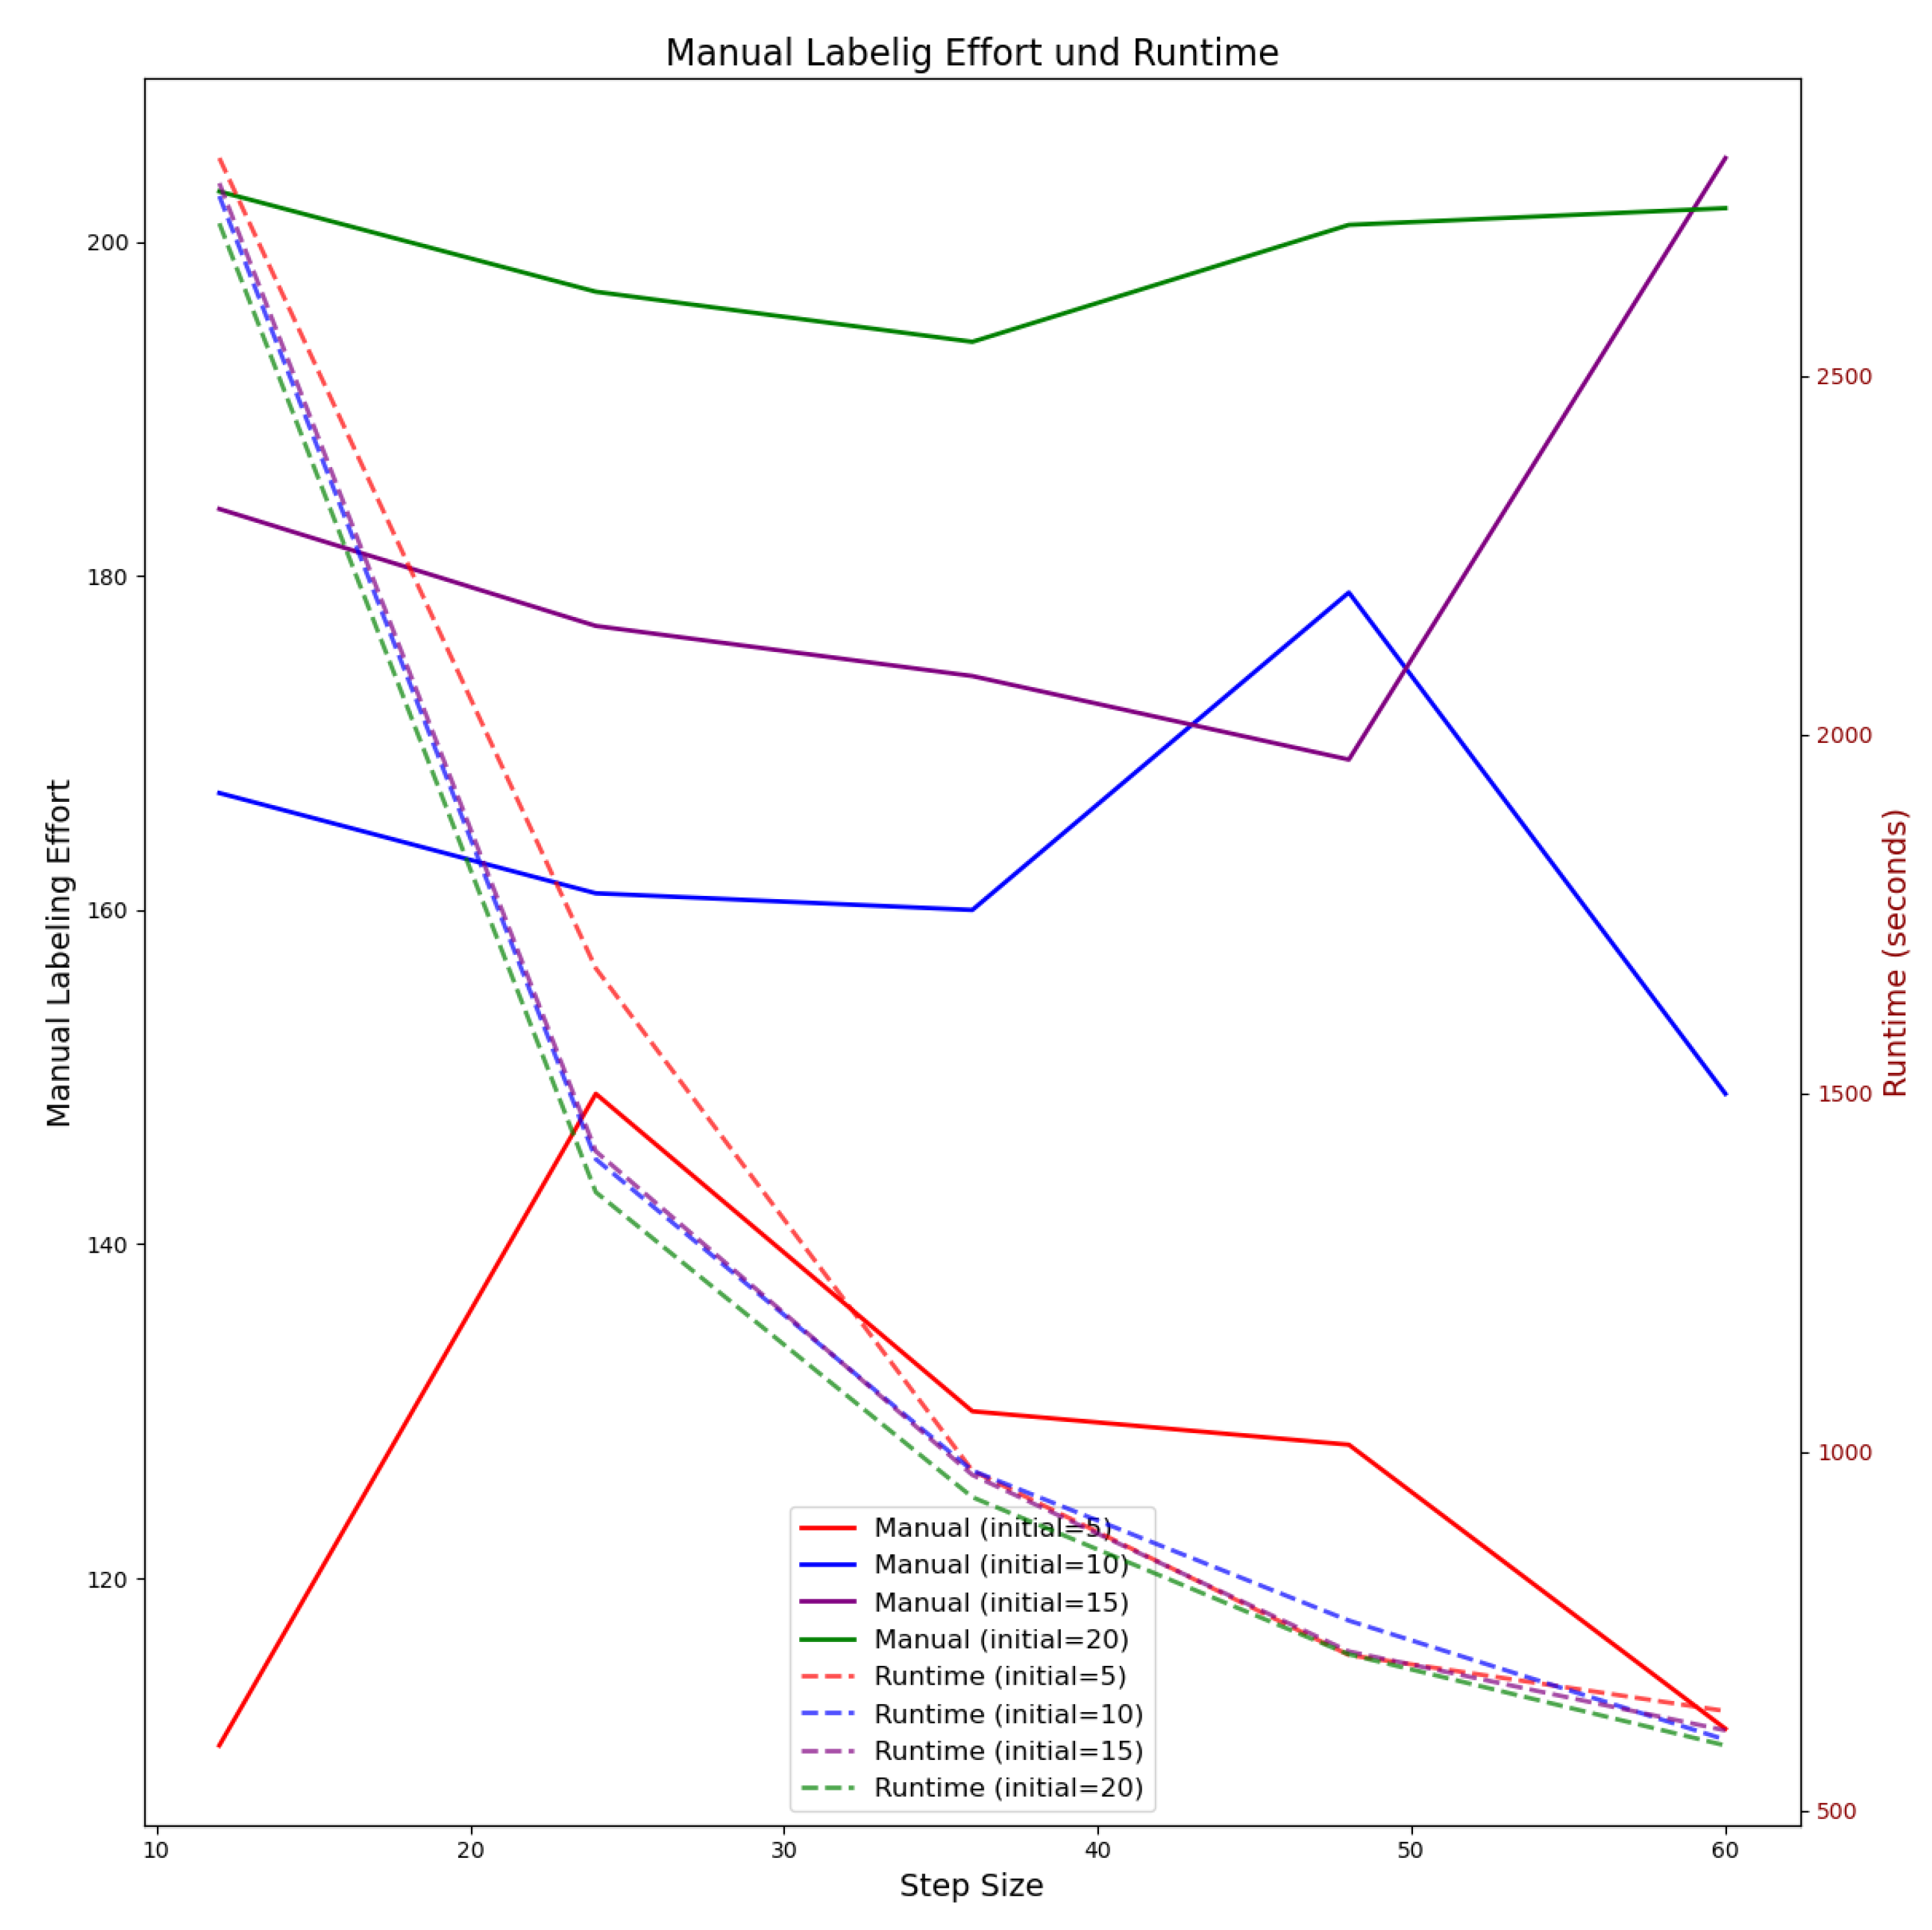
Figure 7.
Performance development of support model over the first 10 retraining cycles; loss decreases from ∼ 2.0 to ∼0.0 - 0.5; accuracy increases from ∼ 0.91 to ∼ 1.0; 5 images have to be labeled manually for first retraining cycle; after 4 retraining cycles, 0 - 1 images have to be labeled manually
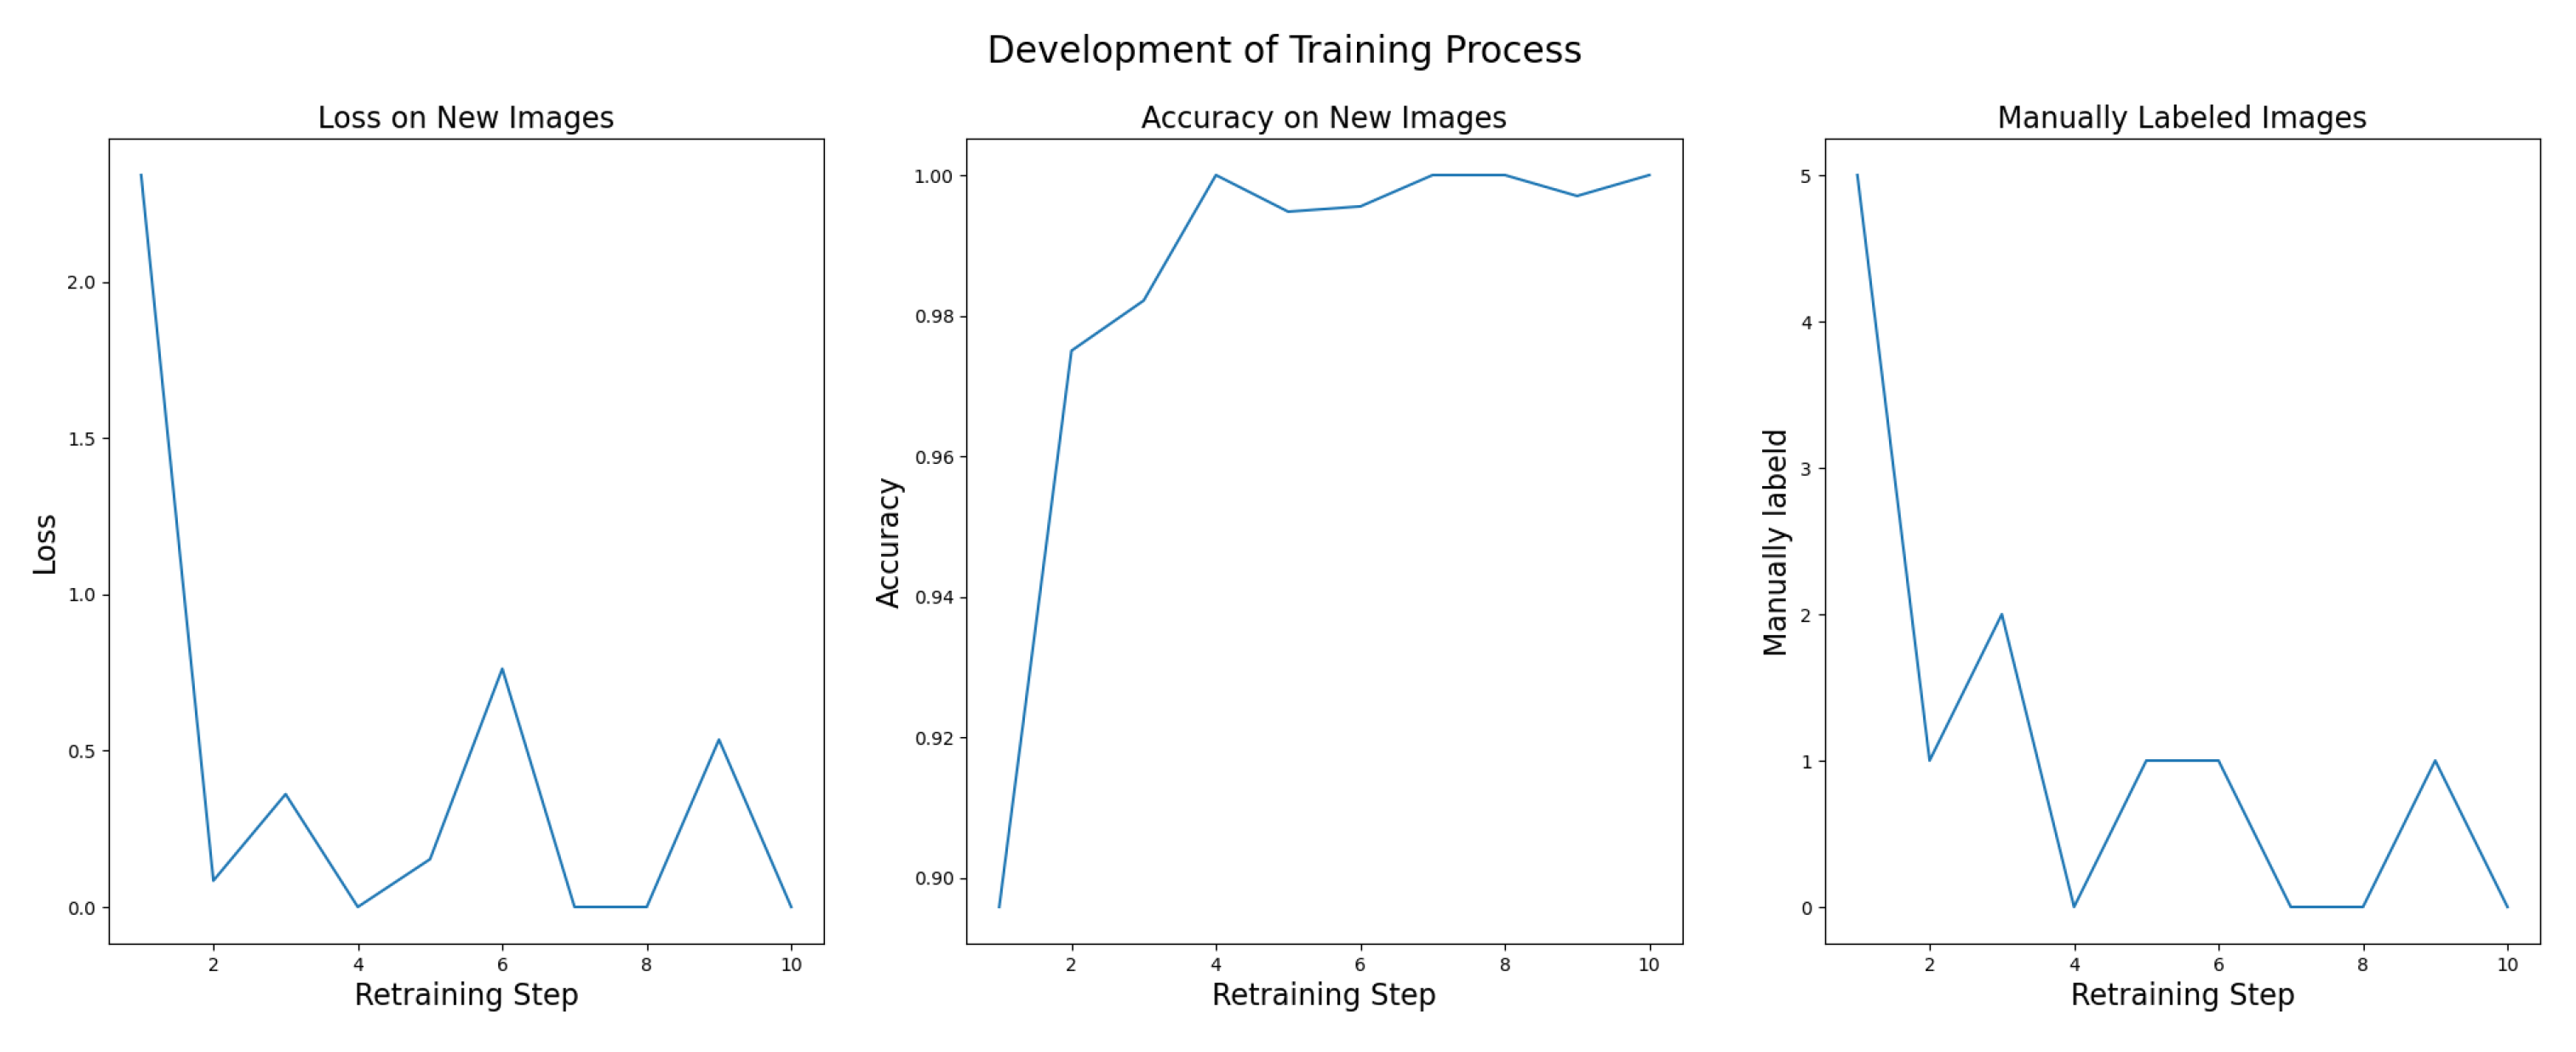
Figure 8.
Development of model uncertainty as the share of pixels available for classification increases; uncertainty has the shape of a reversed parable; maximum uncertainty is ∼ 0.174 when using 65 % of pixels for classification
Figure 8.
Development of model uncertainty as the share of pixels available for classification increases; uncertainty has the shape of a reversed parable; maximum uncertainty is ∼ 0.174 when using 65 % of pixels for classification
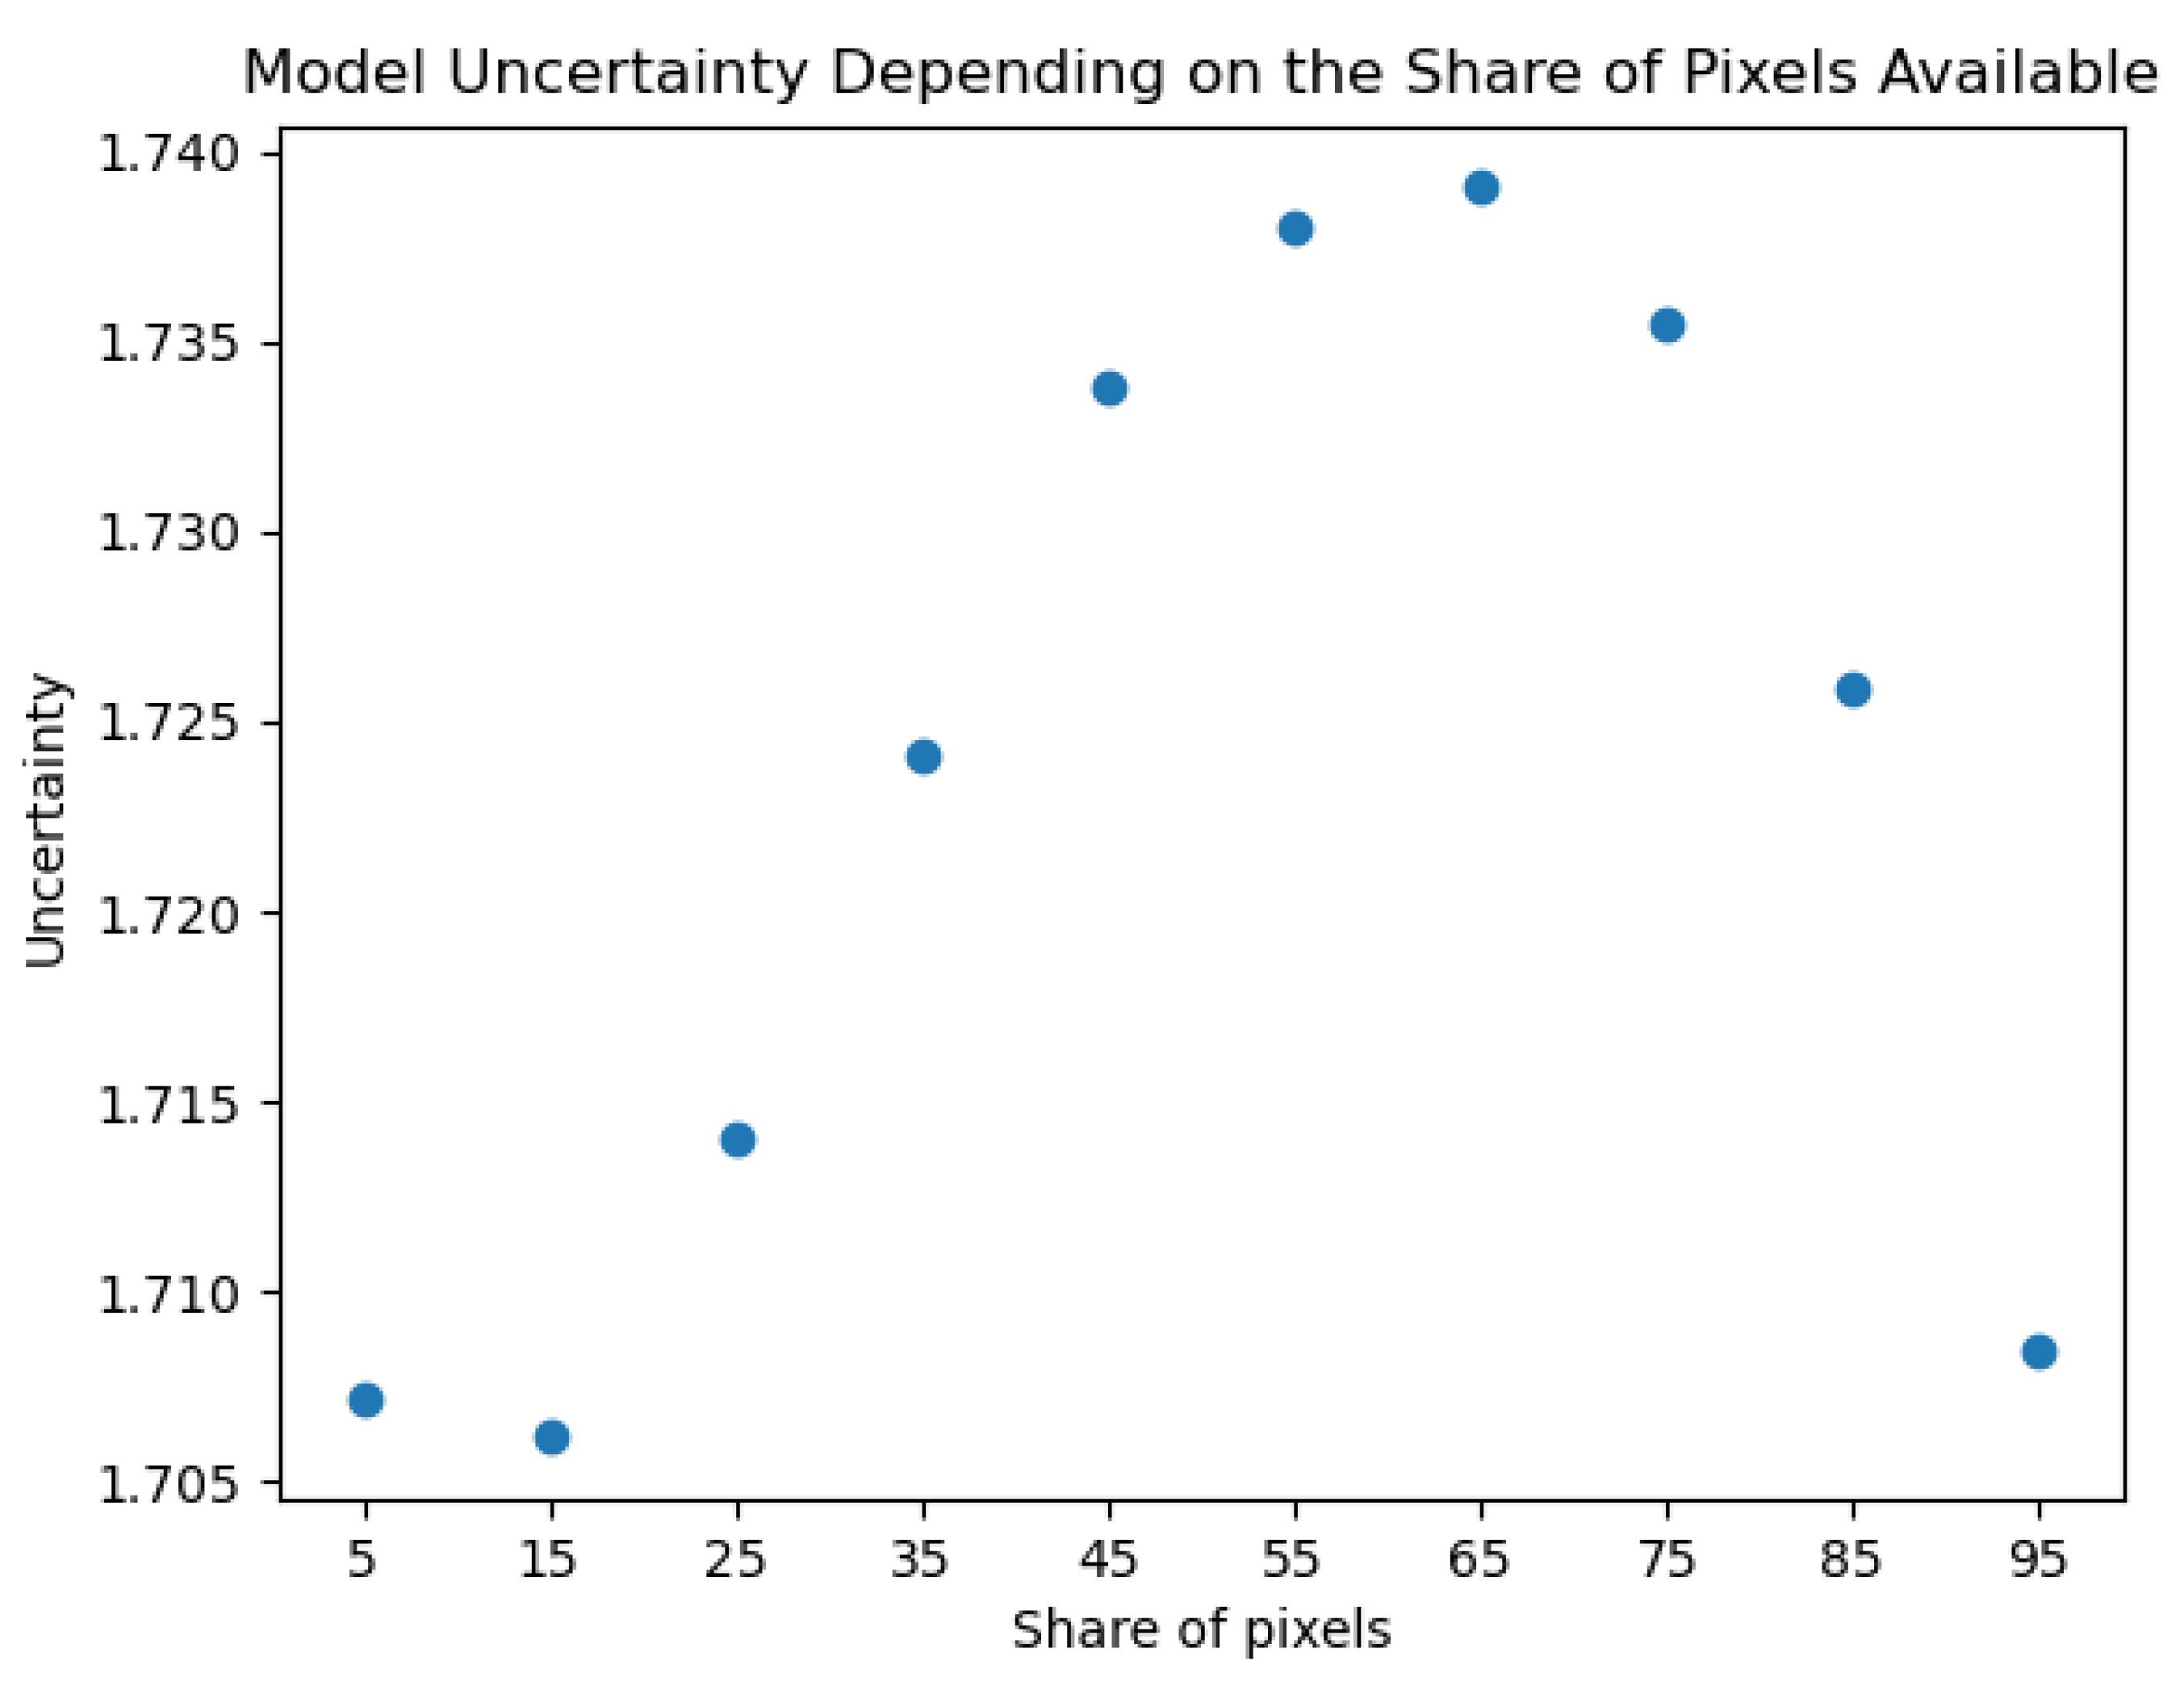
Figure 9.
Distribution of uncertainties on correct and wrong predictions for VGG16 model (left) and ResNet18 model (right); Clear separation between correct and wrong predictions for both models
Figure 9.
Distribution of uncertainties on correct and wrong predictions for VGG16 model (left) and ResNet18 model (right); Clear separation between correct and wrong predictions for both models
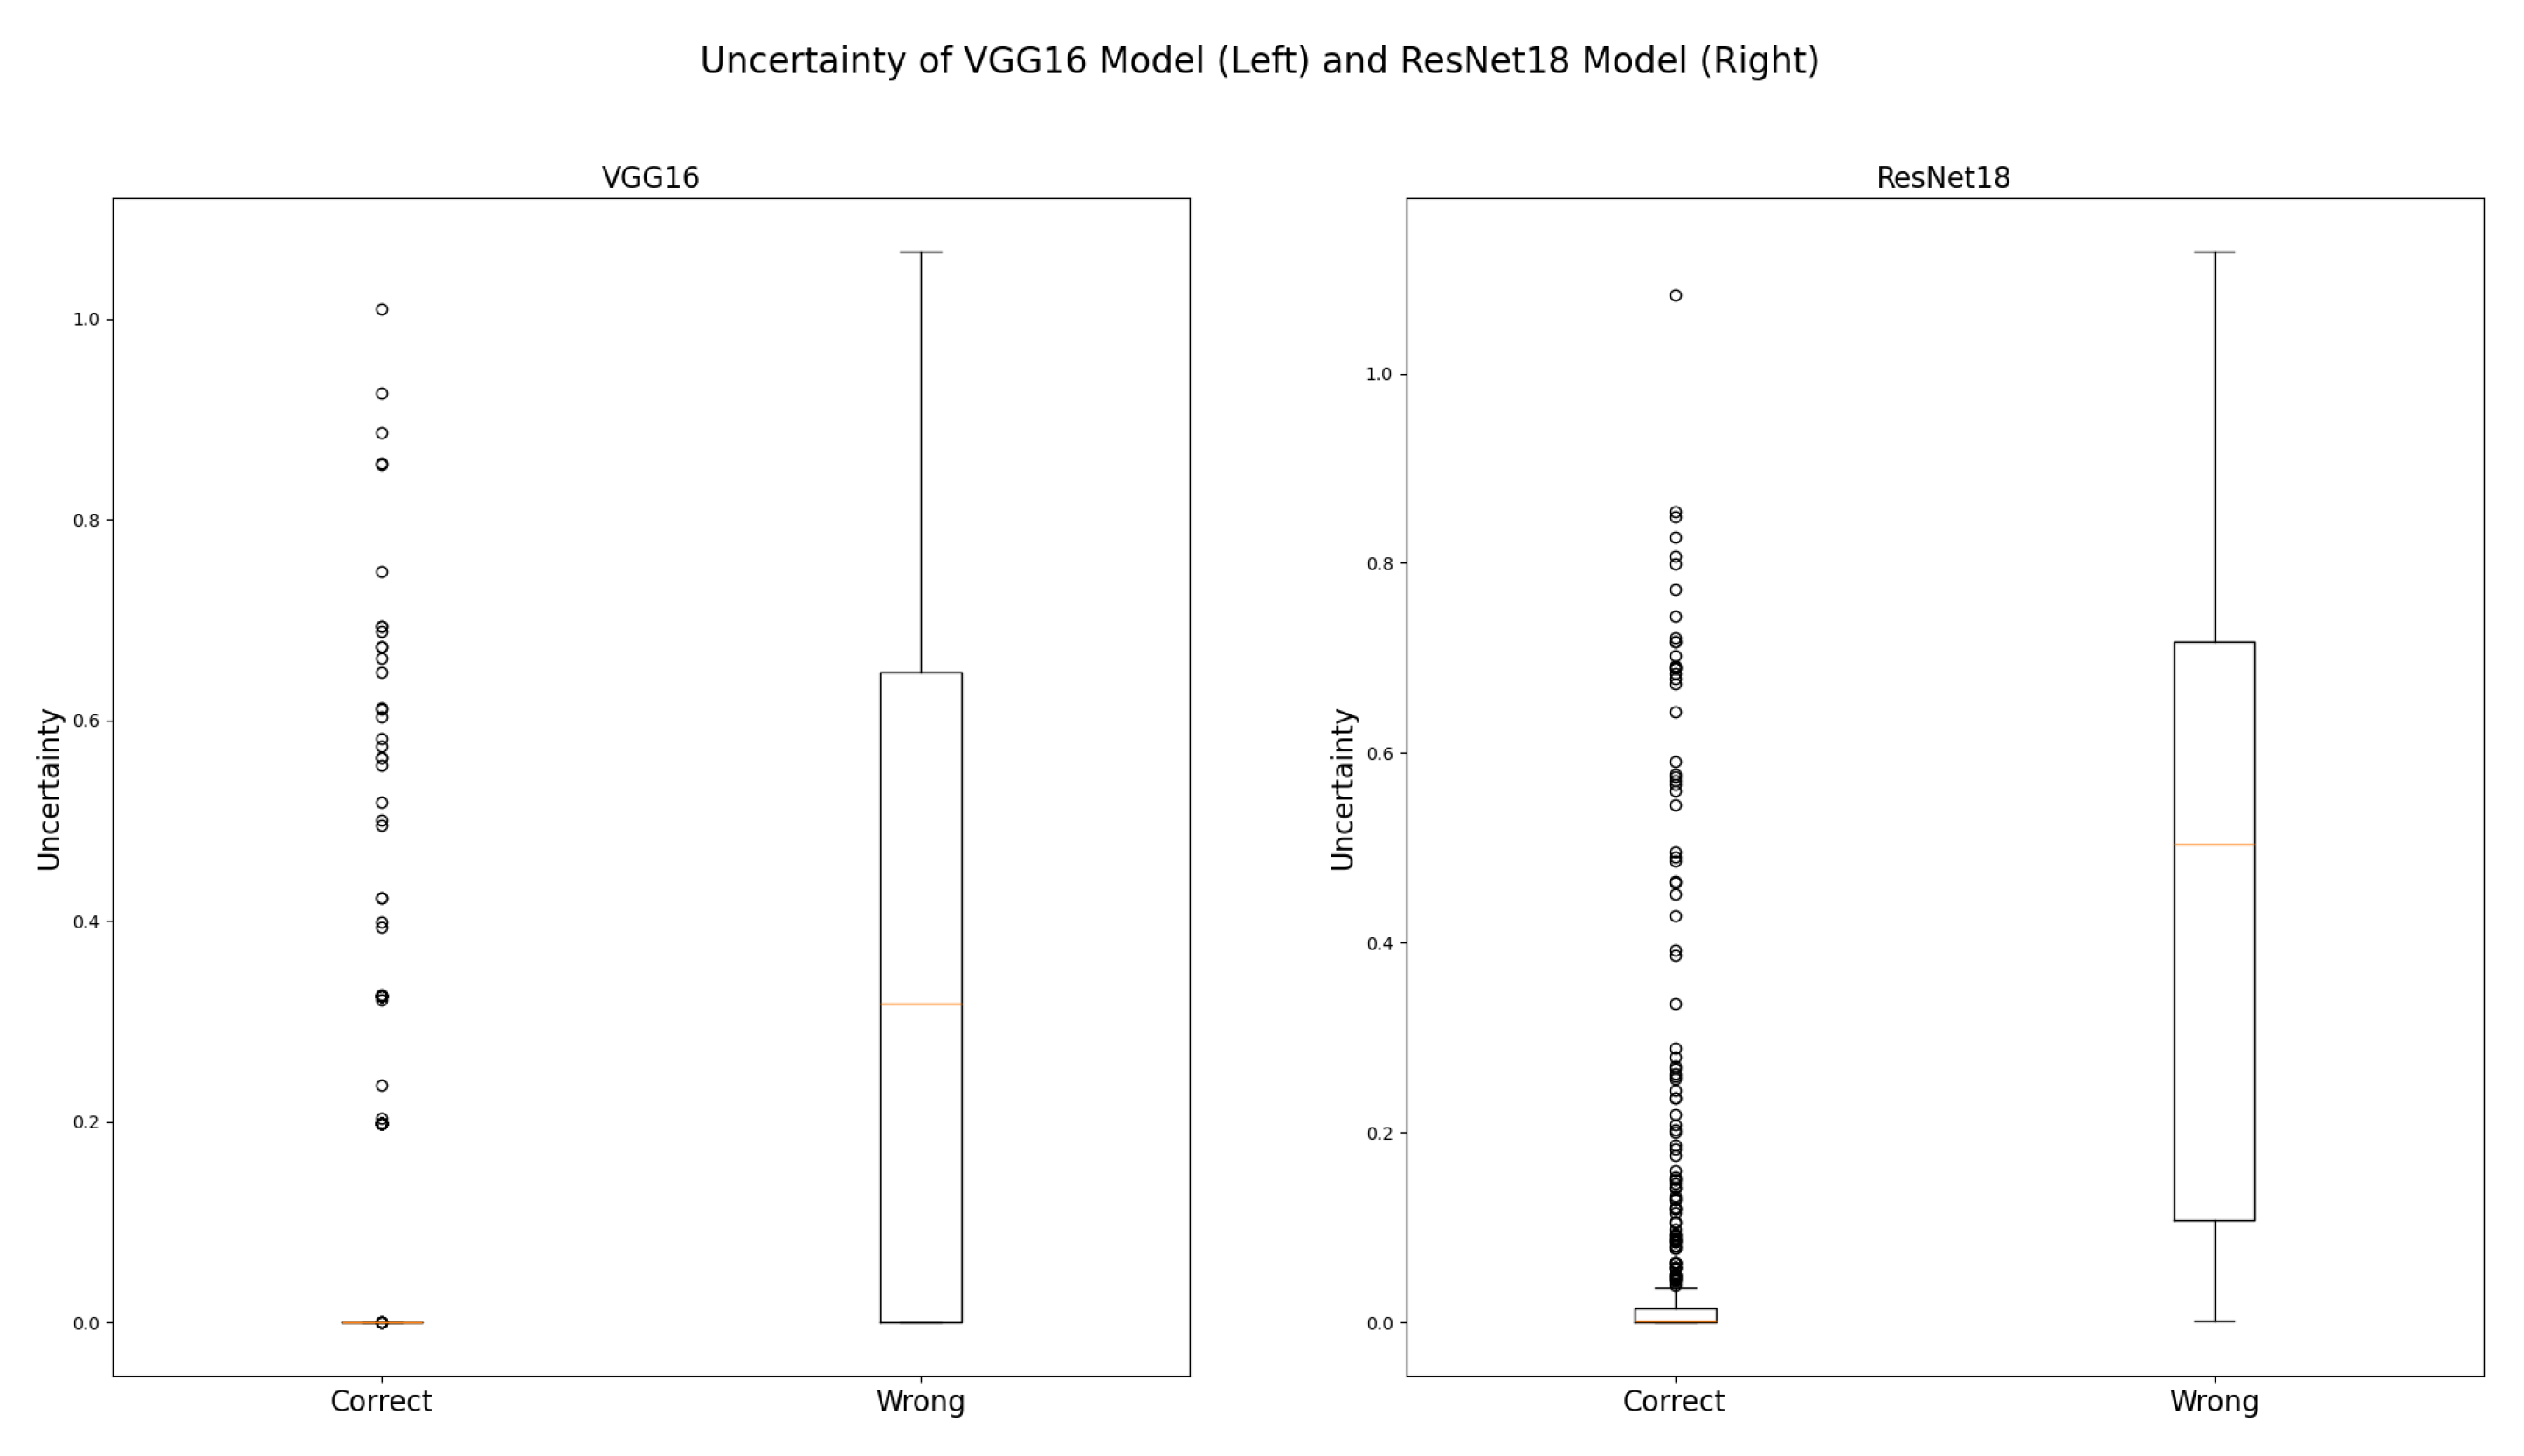
Figure 10.
Saliency map for an image of "Scratches" where no warnings were triggered (upper visualization) and an image of "Scratches" where both models were uncertain (lower visualization)
For image where no warning was triggered, both models highlight exactly the region in the image where the defect is located
For image where both models were uncertain, no specific regions in the image are highlighted by the models
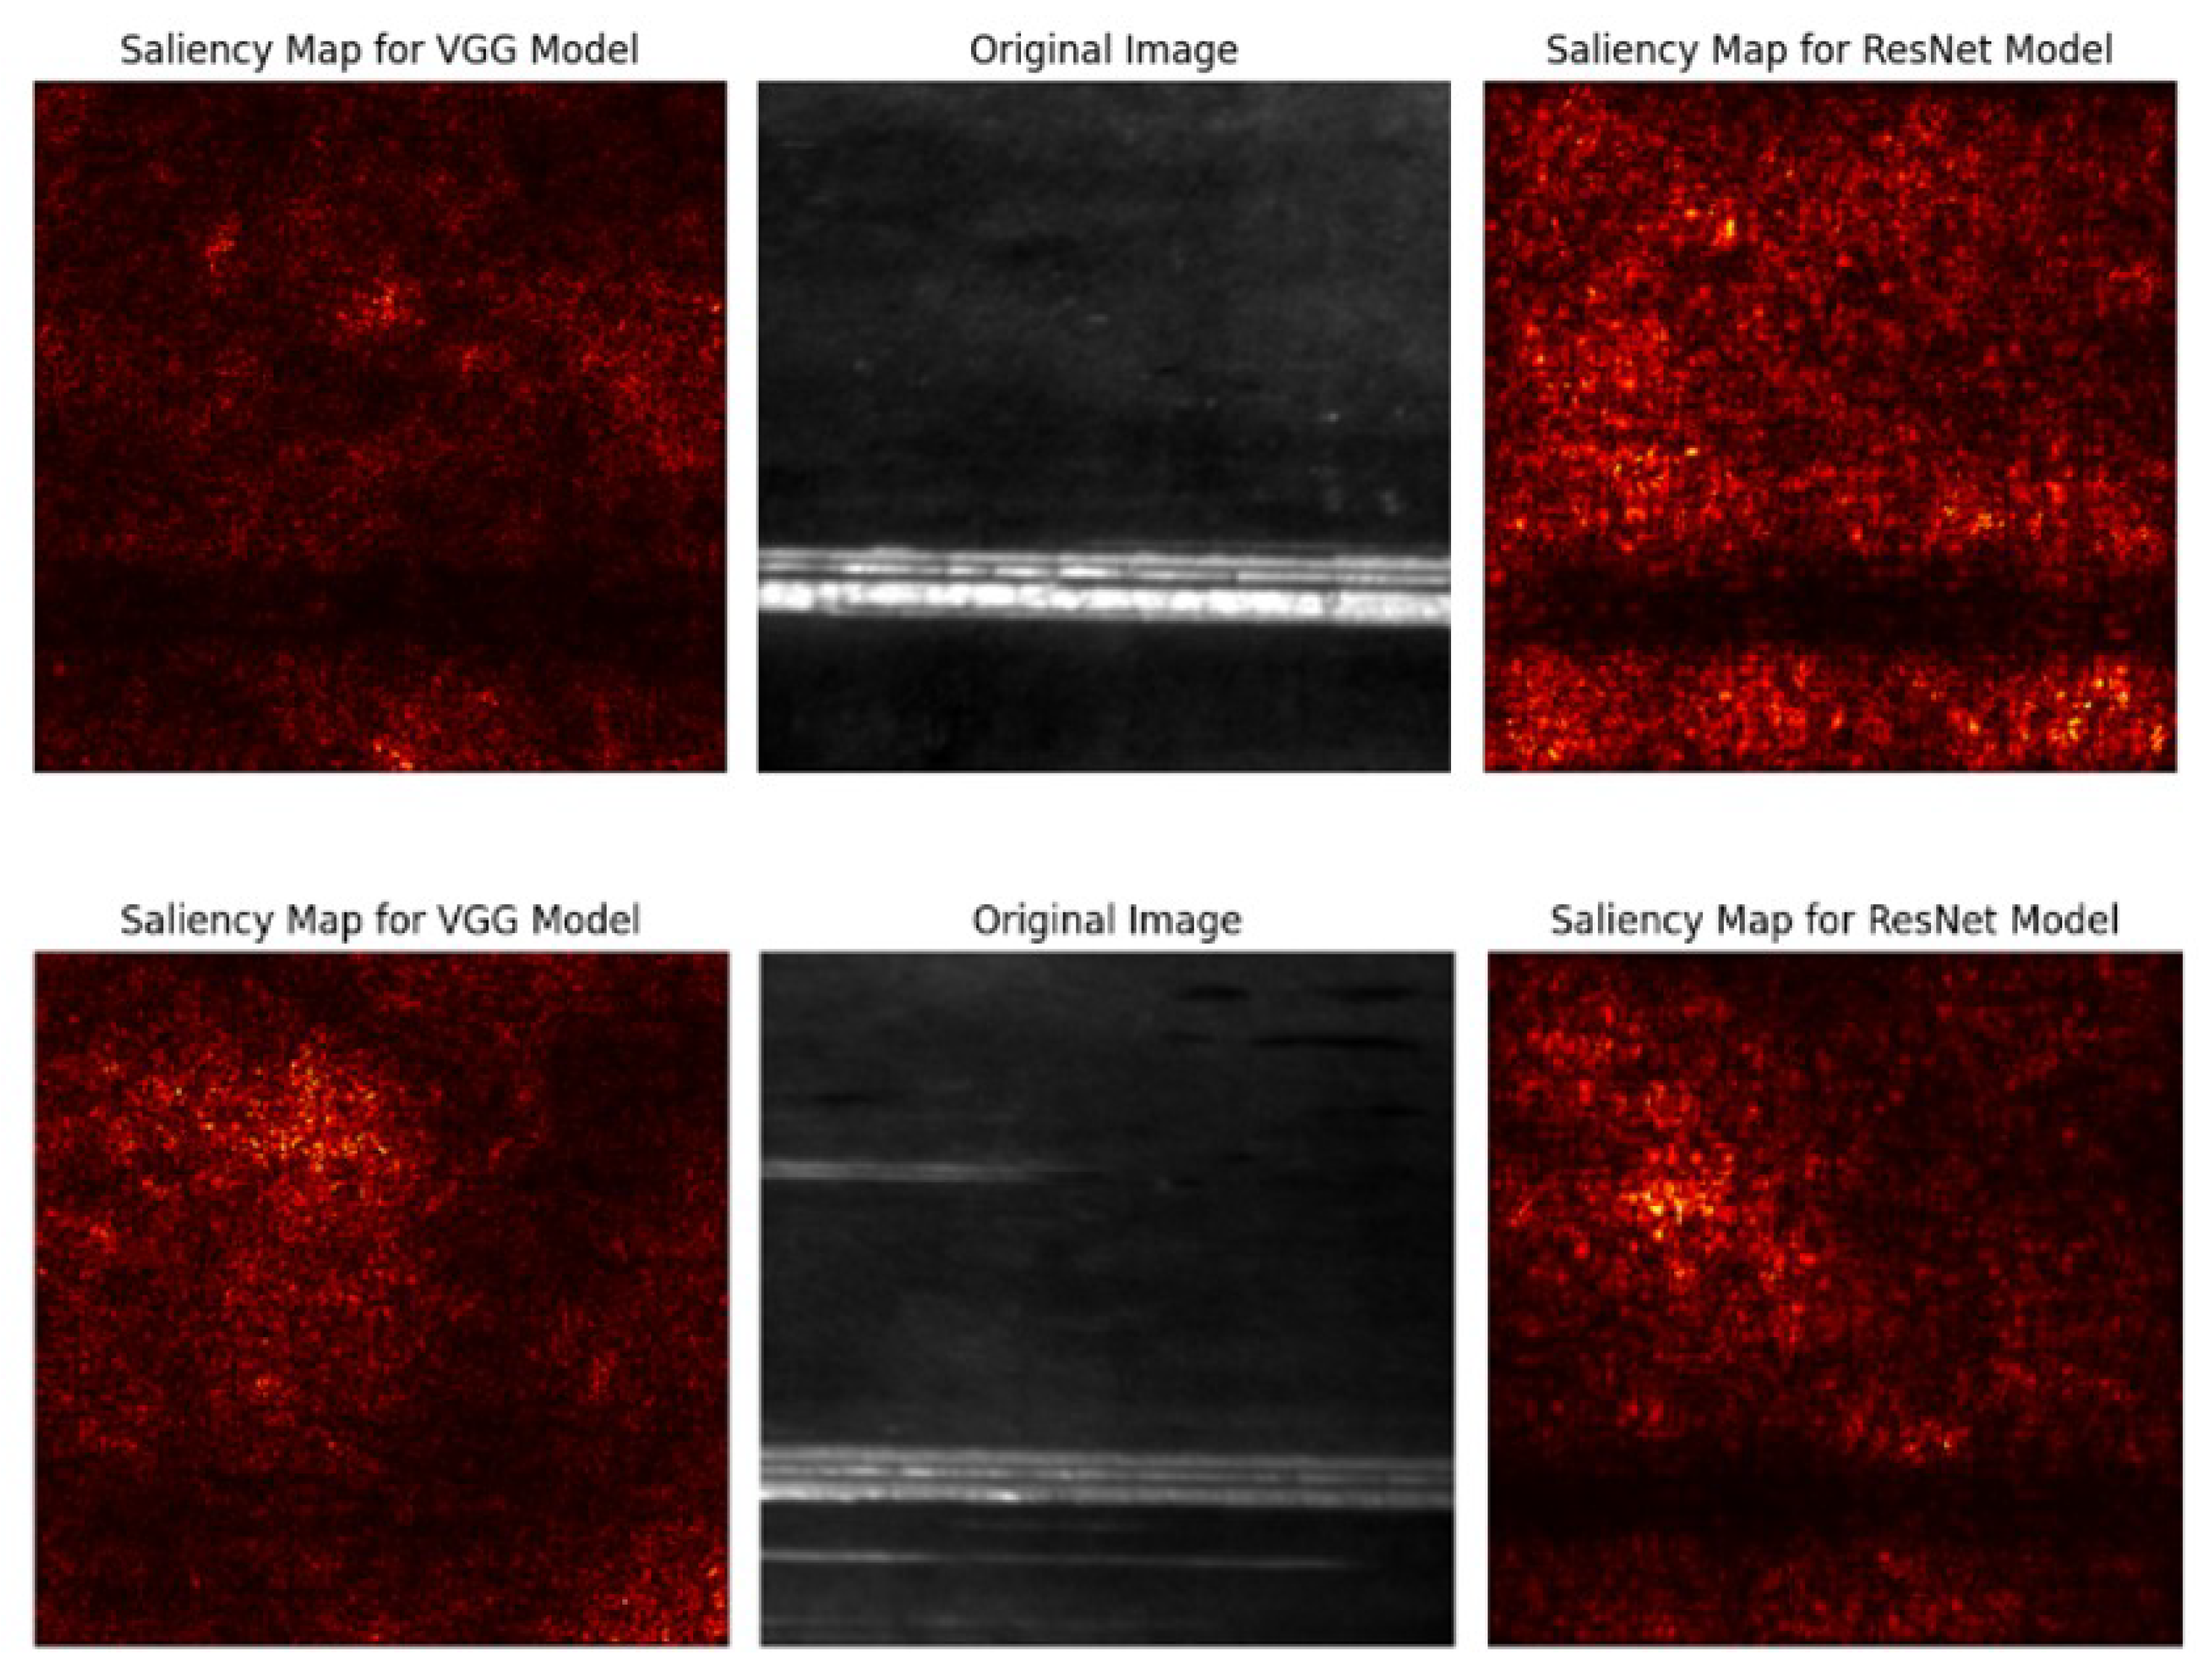
Figure 11.
Image for which models are uncertain; high gradient of exposure


Table 1.
Practical recommendations for adoption of the R4VR-framework and preceding data collection to comply with the EU AI Act
Table 1.
Practical recommendations for adoption of the R4VR-framework and preceding data collection to comply with the EU AI Act
| Phase | Objective | Core Activities | Roles | Regulatory Alignment |
|---|---|---|---|---|
| Data Collection | Generate traceable and representative data | Implement labeling interface | Domain expert labels and corrects uncertain cases | Article 10 |
| Log all annotations | ||||
| Include uncertainty and data source metadata | ||||
| Reliability | Build robust models with intrinsic safety | Train diverse models | Developer examines explanations to identify bias | Article 15 |
| Integrate XAI (e.g., Grad-CAM) and UQ (e.g., MC Dropout) | Developer defines uncertainty thresholds for validation phase | Article 13 | ||
| Detect bias and overfitting | ||||
| Validation | Iteratively improve models via expert feedback | Identify samples with high uncertainty / conflicting predictions | Domain expert reviews flagged samples and refines labels | Article 14 |
| Retrain using expert-verified data | Article 15 | |||
| Verification | Define and verify model application scope | Determine operational ranges (image type, brightness, device) | Developer validates model under defined operating conditions | Art. 9 |
| Define confidence thresholds | Article 11 | |||
| Provide instructions for application | ||||
| Deployment & Monitoring | Continuous assurance and improvement | Deploy model with uncertainty-based alerts | Operator supervises automated decisions | Article 12 |
| Regular operator audits | Article 13 | |||
| Log all interactions | Article 14 |
Table 2.
Number of images per class that triggered a certain warning; higher model uncertainty for images of class "Scratches"; VGG16 model is also uncertain with regard to images of class "Rolled"
Table 2.
Number of images per class that triggered a certain warning; higher model uncertainty for images of class "Scratches"; VGG16 model is also uncertain with regard to images of class "Rolled"
| Defect Class | Scratches | Rolled | Pitted | Patches | Inclusion | Crazing | Total |
|---|---|---|---|---|---|---|---|
| VGG uncertain | 8 | 5 | 1 | 0 | 0 | 0 | 14 |
| ResNet uncertain | 6 | 0 | 3 | 2 | 0 | 1 | 12 |
| Deviation | 4 | 0 | 2 | 0 | 0 | 0 | 6 |
| Total | 9 | 5 | 5 | 2 | 0 | 1 | 22 |
Disclaimer/Publisher’s Note: The statements, opinions and data contained in all publications are solely those of the individual author(s) and contributor(s) and not of MDPI and/or the editor(s). MDPI and/or the editor(s) disclaim responsibility for any injury to people or property resulting from any ideas, methods, instructions or products referred to in the content. |
© 2025 by the authors. Licensee MDPI, Basel, Switzerland. This article is an open access article distributed under the terms and conditions of the Creative Commons Attribution (CC BY) license (http://creativecommons.org/licenses/by/4.0/).
Copyright: This open access article is published under a Creative Commons CC BY 4.0 license, which permit the free download, distribution, and reuse, provided that the author and preprint are cited in any reuse.


