
Submitted:
26 November 2025
Posted:
27 November 2025
You are already at the latest version
Abstract
Plasmonic nanostructures support localized surface plasmon resonances (LSPRs) which exhibit intense light–matter interactions, producing unique optical features such as high near-field enhancements and sharp spectral signatures. Among these, plasmon hybridization (PH) and Fano resonance are two key phenomena that enable tunable spectral responses. In this study, we systematically investigate four representative nanostructures: a simple nanogap dimer (i-type structure), a dolmen structure, a heptamer nanodisk cluster, and a nanoshell particle. We utilize the discrete dipole approximation (DDA) to analyze these structures. The scattering, absorption, and extinction spectra, are calculated, and the near-field electric field vector distributions are visualized to distinguish between hybridized plasmon modes and Fano-type interference. These simulated results reveal that the observation of PH-like characteristics in a dolmen structure exhibiting typical Fano resonance under specific conditions, and conversely, the observation of Fano resonance-like characteristics in the well-known i-structure exhibiting PH, can be comprehended by considering the scattering spectrum and absorption spectrum separately, rather than the extinction spectrum, and by considering the electric field vector rather than the electric field intensity. Finally, the sensitivity of these nanostructures against the ambient medium was evaluated.
Keywords:
plasmon hybridization
; Fano resonance
; discrete dipole approximation
1. Introduction
Localized surface plasmon resonance (LSPR) is a phenomenon arising from the collective oscillation of free electrons in metal and semiconductor nanostructures. It exhibits strong light scattering and absorption properties in the ultraviolet, visible, and near-infrared regions [1,2,3]. Furthermore, in nanostructures with multiple plasmon modes in close proximity, such as nano-multimers or asymmetric hybrid nanostructures, unique resonance characteristics emerge due to coupling between different LPR modes (plasmon hybridization; PH) and mode interference [4,5,6,7,8,9].
In plasmonics, a prime example of interference is Fano resonance [6,10,11,12], where interference between broad-band bright modes (radiative, dipole-type) and narrow-band dark modes (non-radiative, quadrupole-type or higher multipole-type) results in an asymmetric scattering spectrum. This phenomenon facilitates the design of high-Q optical responses, which are imperative for the development of high-performance sensors [13,14,15] and optical filters [6,15]. The attractive optical properties arising from these mode couplings and mode interferences increase design freedom for high-sensitivity sensors. They can also be applied to improve the quantum efficiency of light-emitting devices [12,16,17].
The interpretation of whether optical properties stem from PH or Fano resonance is of paramount importance in device design. For example, the optical properties of i-type structures have been reported to originate from both PH and Fano resonance, which complicates interpretation [18,19]. Furthermore, while dolmen-type systems are generally designated as Fano resonators [20,21,22], Misawa et al. concluded from photoemission electron microscopy observations and FDTD calculations that their optical properties are more likely to be attributed to PH than to Fano resonance [23].
In the field of plasmonics, structural motifs are frequently associated with particular resonance mechanisms. While such classifications are undoubtedly convenient, there is a risk of oversimplifying the fundamental optical response.
This study examined representative plasmonic nanostructures, including i-type, dolmen, and heptamer configurations, as well as nanoshells. The absorption and scattering spectra, together with the electric field vector distributions, were analyzed in detail using the discrete dipole approximation (DDA) method. This approach enabled the systematic classification of PH and Fano resonance modes in terms of their absorption–scattering behavior, thereby elucidating their correlation with the localized electric field. Furthermore, by considering refractive index sensing as an example application, the relationship between structural configuration and sensitivity was investigated and is reported herein.
2. Method and Conditions of the DDA Simulation
Numerical electromagnetic simulations were performed using the DDA method, employing the DDSCAT 7.3 [24,25,26] software to investigate the absorption spectra, scattering spectra, the extinction spectra, which is the sum of these, and the vector of electric field, in target structures. The i-type dimer, dolmen, and heptamer structures, which were composed of gold, and a nanoshell structure, which is composed of gold and silica, were targeted in this study. In all cases, linearly polarized light was incident. The dipole element spacing of each simulated model was fixed to 2 nm. The surrounding medium is vacuum or a dielectric material with refractive index n < 2.0 without attenuation, ignoring dispersion, and the value of the dielectric function of gold is taken from the study by Johnson and Christy [27], neglecting size dependence. The refractive index of the silica core is fixed at 1.45 without attenuation, ignoring dispersion.
In all subsequent two-dimensional electric field distribution maps and electric field vector maps, the observed planes were the cross-section to the EB direction through the center of each structure. The magnitude of the electric field vector is expressed as the sum of its real and imaginary parts, and is displayed on a logarithmic scale.
3. Results and Discussions
3.1. i-Type Dimer
As illustrated in Figure 1a, the geometry of the i-type structure used in the numerical simulation is shown. The effective radius and uniform thickness are set to 50.0 nm and 45.0 nm, respectively. The remaining structural parameters are provided in the figure caption. Figure 1b shows the absorption (dark gray line), scattering (light gray line), and extinction (black line) spectra, and Figure 1c presents the electric vector distributions at two peak wavelengths and one dip wavelength. As shown in Figure 1b, the spectra of the i-type dimer exhibit two resonances corresponding to the bonding (red-shifted) dipolar mode and antibonding (blue-shifted) multipolar mode. The bonding mode is diminished by scattering, reflecting its bright character, whereas the antibonding mode is dominated by absorption, consistent with its subradiant nature. The electric field vector distributions in Figure 1c further support this interpretation: the bonding mode displays an extended dipolar field across the dimer. In contrast, the antibonding mode generates a strong hotspot confined within the nanogap. In general, metal nano-dimers are known to exhibit typical PH behavior [18]. However, when the complete spectral response is considered, pronounced asymmetries in scattering and absorption appear, indicating that the optical properties are strongly influenced by the Fano resonance. This observation is consistent with the findings of Yang et al. [19]. Analysis of near-field vector distributions shows that, at the wavelength of the red-shifted side, the charge configuration is inferred from the appearance of a hexapole-like structure. Nevertheless, analysis of the vector directions and magnitudes reveals that the dipole mode between the gaps is predominant, while the other components exhibit only minor amplitudes. It is therefore reasonable to infer that the dipole mode dominates, a conclusion supported by both the spectral features and the electric field distributions (shown in Figure S1a). The overall optical response can be described as a hybrid type arising from both Fano resonance and PH, though it is concluded that the contribution from Fano resonance is dominant.
3.2. Dolmen Structure
Dolmen structures are often reported to exhibit optical properties derived from Fano resonance and are considered typical examples of such behavior [20,21,22]. Figure 2 and Figure 3 show the following: (a) the calculation models for dolmen structure with different structural parameters, (b) their optical spectra, and (c) their electric-field vector diagrams. The effective radii of the dolmen structures shown in Figure 2 and Figure 3 are set to 39.0 nm and 85.6 nm, respectively. The remaining structural parameters are provided in the figure captions.
In Figure 2b, the peak on the short-wavelength side (shown in blue) is dominated primarily by scattering. In contrast, the peak on the long-wavelength side (shown in red) is affected by both scattering and absorption to similar degrees. This asymmetry in the scattering spectrum indicates that the observed behavior originated from Fano resonance. On the other hand, the spectrum in Figure 3b shows that absorption and scattering are comparable for both the short- and long-wavelength peaks, with absorption being slightly larger in each case. Furthermore, no asymmetry is observed in the scattering spectrum. Therefore, the optical properties in Figure 3 cannot be attributed to Fano resonance, but rather to PH mode coupling among multipoles.
When the electric-field vector diagrams in Figure 2c and c are compared with the expected charge distributions, the short-wavelength peak in Figure 2 appears to exhibit an octupole-like excitation. However, considering the field intensity, the dominant contribution is attributed to the dipole-type (bright-mode) excitation, while the contribution from the two parallel blocks is minor. The resonant mode corresponding to the long-wavelength peak also appears, at first glance, to show an octupole-like pattern. However, unlike the short-wavelength case, the quadrupole-type (dark-mode) excitation formed by the two parallel blocks becomes dominant. In Figure 3c, the electric-field intensities at each pole are comparable for both peaks, indicating that hexapole or octupole modes are excited. Consequently, the observed optical characteristics are likely due to PH. These results support the interpretation proposed by Misawa et al.
It indicates that the origin of the optical properties cannot be uniquely determined based solely on the structural scheme of the Dolmen configuration. Instead, a comprehensive examination of various factors, including the ratio between scattering and absorption spectra, the asymmetry of the spectral shape, the intensity of the electric-field vector, and the charge distribution inferred from it, allows for a clearer understanding of the observed optical characteristics. Therefore, detailed spectral analysis and investigation of the electric-field vectors are shown to be highly effective. The electric-field distribution presented in Figure S1 supports the conclusions described above.
3.3. Heptermer Structure
Figure 4 illustrates the computational model of the heptamer structure, along with the optical spectra, electric-field vector maps, and predicted charge distributions obtained from the DDA simulations. The structural parameters, such as disk sizes, gaps, and film thickness, are provided in the figure caption. This structure is known to exhibit a typical Fano resonance [28,29], as shown in Figure 4a.
In Figure 4b, a pronounced asymmetry in the scattering spectrum is revealed. Notably, on the short-wavelength side, both the scattering and absorption peaks have comparable magnitudes, whereas on the long-wavelength side, the scattering peak dominates while absorption is negligible. In the absorption–scattering separation, the characteristic behavior was confirmed in which scattering is significantly suppressed near the Fano dip, while absorption remains. Specifically, although the intensities of the scattering and absorption peaks are comparable on the short-wavelength side, the scattering peak dominates on the long-wavelength side, with absorption being negligible.
The resonant modes indicated by the electric-field vectors in Figure 4c are complex. However, based on the vector intensity, the short-wavelength resonance arises primarily from interactions between the adjacent small disks aligned parallel to the incident electric field, resulting in an overall quadrupole-type mode for the entire system. In contrast, the long-wavelength resonance is dominated by the central large disk, corresponding to a dipole-type mode. The electric-field distributions shown in Figure S1d also confirm that the short-wavelength resonance correspond to a multipole-type mode, whereas the long-wavelength resonance correspond to a dipole-type mode, consistent with the asymmetry in the spectra and the predicted charge distributions.
For the heptamer structure, it is imperative to consider both the scattering and the absorption spectra. For example, the origin of the optical properties cannot be determined from only the two peaks that appear in the extinction spectrum. In this case, a more accurate analysis can be achieved by focusing on the scattering and absorption spectra as the central axis and using the charge distribution map as supplementary information.
3.4. Nanoshel Structure
Figure 5 illustrates the calculation model of the nanoshell structure, along with the corresponding spectra, electric-field vectors, and predicted charge distributions. The diameter of the inner silica core and the thickness of outer gold shell are provided in the figure caption. Nanoshell structures are known to exhibit optical properties originating from typical PH mechanism [30,31].
For the present nanoshell structure, the electric-field intensity distribution shown in Figure S1e is localized at the edge of the shell, and both the short-wavelength and the long-wavelength peaks appear to exhibit dipole-type resonant modes. However, the optical spectra in Figure 5b shows that both peaks are dominated by absorption, suggesting that they correspond to multipole-type modes. The charge distribution estimated from the near-field vectors in Figure 5c further indicates that the two peaks arise octupole-type and quadrupole-type modes, respectively.
Numerous previous reports have indicated that the optical properties of nanoshell structures originates from PH, and our results are consistent with these. Nevertheless, the origin of the optical properties can only be logically identified by comprehensively considering the scattering and absorption spectra and the electric field vector. Considerations based solely on extinction spectra and electric field distribution maps, as in many previous reports, are insufficient.
3.5. Sensing Potential to Refractive Index of Ambient
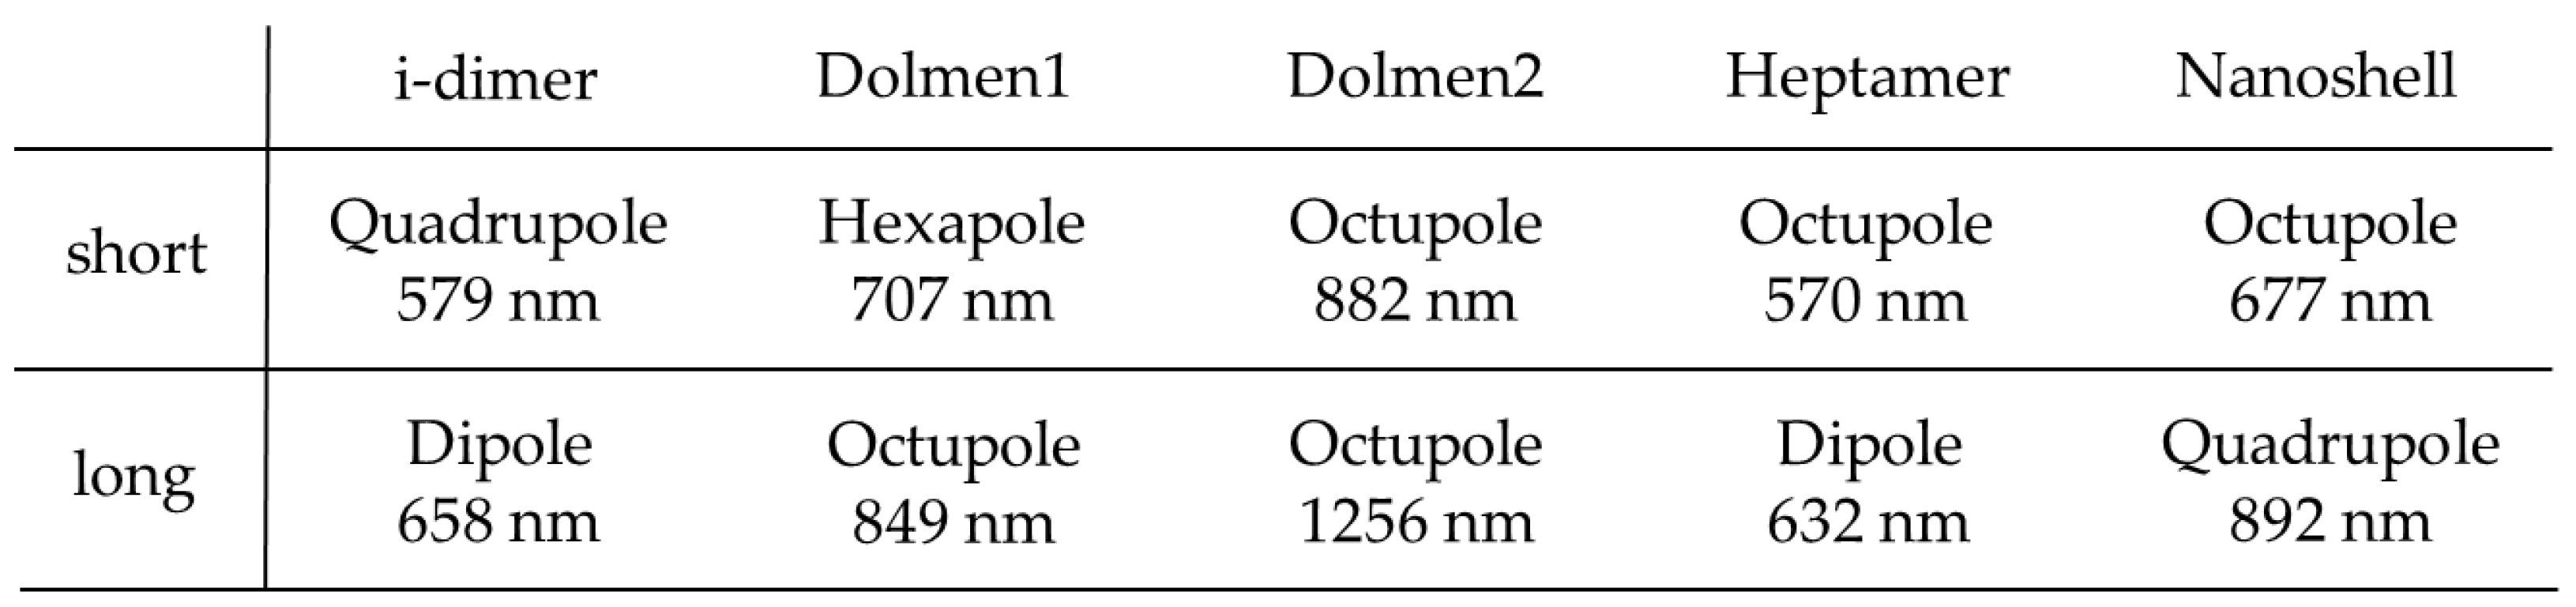
Figure 6 shows the shifts of the short- and long-wavelength peaks relative to the refractive index of the surrounding medium for the i-structure, two dolmen structures, and the heptamer structure. Table 1 shows the resonant mode order estimated from the peak wavelength and electric field vector for each structure when the surrounding medium is a vacuum (refractive index n = 1.0).
The peak with the highest sensor sensitivity was the long-wavelength peak of dolmen structure 2 (shown in Figure 2a). In contrast, the peak with the smallest peak shift relative to the refractive index change was the short-wavelength peak of the heptamer structure. For all structures, the peak shift tended to be larger on the long-wavelength side. Furthermore, the refractive index sensitivity of the long-wavelength peak (dipole mode) of the i-type structure (Figure 1a) and the short-wavelength peak (hexapole mode) of dolmen structure 1 (Figure 3a) was very similar.
The comparison revealed that the dolmen structure exhibited high sensor sensitivity, which could be further enhanced by adjusting its structural parameters. Furthermore, it was found that the longer peak wavelengths, the larger the wavelength shift in response to changes in refractive index, resulting in higher sensitivity. On the other hand, it was also revealed that the order of the resonant mode and whether it is a Fano resonance or PH have no significant effect on sensor sensitivity.
5. Conclusions
In this study, we investigated the origin of the optical properties of metallic nanoclusters and nanoshell structures, which have been reported to exhibit Fano resonances and plasmon hybridization (PH), by analyzing the scattering and absorption spectra as well as electric-field vector obtained from DDA simulations. As a result, it was demonstrated that a more accurate evaluation of the origin of optical properties can be achieved by combining the scattering-to-absorption ratio at the peak wavelength, the spectral asymmetry, and the predicted charge distributions. Furthermore, the results suggest that the classification of Fano resonance and PH cannot be uniquely determined by structural geometry alone. These findings indicate that plasmonic modes exist on a continuous spectral landscape shaped by the interplay of multiple factors, including geometric parameters (interparticle distance, asymmetry), material properties, and local symmetry. This approach transcends the traditional dichotomy between Fano resonance and PH and provides a continuous and unified framework for understanding plasmonic optical responses.
In addition, a comparison of the peak wavelength shift as a function of the refractive index of the surrounding medium for each structure suggested that the dolmen structure had the highest sensor sensitivity, and further suggested that the longer the peak wavelength of the nanostructure in vacuum, the higher its sensitivity. These results will contribute to improving design guidelines for the optical properties of plasmonic nanostructures and are expected to be applicable to sensing and metasurface engineering.
Supplementary Materials
The following supporting information can be downloaded at the website of this paper posted on Preprints.org, Figure S1: Distributions of the electric field intensity of (a) i-type dimer, (b), (c) dolmen structures, (d) heptamer structure, and (e) nanoshell structure at the wavelengths corresponding to the two peaks and one dip in the optical spectra.
Author Contributions
D. T planned and designed the study. D. T., Y. K., and A. I. obtained the simulated data. D. T., Y. K., and T. T. F. performed data analysis. D. T. and T. T. F. wrote the manuscript.
Funding
This work was partially supported by JSPS KAKENHI Scientific research (C) 22K04975, JSPS Core-to-Core Program (grant number JPJSCCB20220006), and Iketani Science and Technology Foundation.
Conflicts of Interest
The authors declare no conflict of interest.
References
- Genzel L.; Martin T. P.; Kreibig U.; Dielectric function and plasma resonances of small metal particles. Zeitschrift für Physik B Condensed Matter 1975, 21, 339-346.
- Willets K. A.; Duyne R. P.; Localized Surface Plasmon Resonance Spectroscopy and Sensing. Annual Review of Physical Chemistry 2007, 58, 267-297.
- Agrawal A.; Cho S. H.; Zandi O.; Ghosh S.; Johns R. W.; Milliron D. J.; Localized Surface Plasmon Resonance in Semiconductor Nanocrystals. Chemical Reviews 2018, 118, 3121-3207.
- Prodan E.; Radloff C.; Halas N. J.; Nordlander P.; A hybridization model for the plasmon response of complex nanostructures. Science 2003, 302, 419-422.
- Luk’yanchuk B.; Zheludev N. I.; Maier S. A.; Halas N. J.; Nordlander P.; Giessen H.; Chong C. T.; The Fano resonance in plasmonic nanostructures and metamaterials. Nature Materials 2010, 9, 707-715.
- Miroshnichenko A. E.; Flach S.; Kivshar Y.; Fano resonances in nanoscale structures. Reviews of Modern Physics 2010, 82, 2257-2298.
- Fang Z.; Cai J.; Yan Z.; Nordlander P.; Halas N. J.; Zhu X.; Removing a Wedge from a Metallic Nanodisk Reveals a Fano Resonance. Nano Letters 2011, 11, 4475-4479.
- Nordlander P.; Oubre C.; Li K.; Stockman M. I.; Plasmon Hybridization in Nanoparticle dimers. Nano Letters 2004, 4, 899-903.
- Funston A. M.; Novo C.; Davis T. J.; Mulvaney P.; Plasmon Coupling of Gold Nanorods at Short Distances and in Different Geometries. Nano Letters 2009, 9, 1651-1658.
- Fano U.; Effects of configuration interaction on intensities and phase shifts. Physical Review 1961, 124, 1866-1878.
- Limonov M. F.; Rybin M. V.; Poddubny A. N.; Kivshar Y. S.; Fano resonances in photonics. Nature Photonics 2017, 11, 543-554.
- Limonov M. F.; Fano resonance for applications. Advances in Optics and Photonics 2021, 13, 703-771.
- Chen J.; Gan F.; Wang Y.; Li G.; Plasmonic Sensing and Modulation Based on Fano Resonances. Advanced Optical Materials 2018, 6, 1701152.
- Huang T.; Zeng S.; Zhao X.; Cheng Z.; Shum P. P.; Fano resonance enhanced surface plasmon resonance sensors operating in near-infrared. Photonics 2018, 5, 23.
- Wang B.; Yu P.; Wang W.; Zhang X.; Kuo H. -C.; Xu H.; High-Q Plasmonic Resonances: Fundamentals and Applications. Advancde Optical Materials 2021, 9, 2001520.
- Vardi Y.; Cohen-Hoshen E.; Shalem G.; Bar-Joseph I.; Fano resonance in an electrically driven plasmonic device. Nano Letters 2016, 16, 748–752.
- Moritake Y.; Kanamori Y.; Hane K.; Emission wavelength tuning of fluorescence by fine structural control of optical metamaterials with Fano resonance. Scientific Reports 2016, 6, 33208.
- Basyooni M. A.; Ahmed A. M.; Shaban M.; Plasmonic hybridization between two metallic nanorods. Optik 2018, 172, 1069-1078.
- Yang Z. -J.; Zhang Z. -S.; Zhang L.-H.; Li Q. -Q.; Hao Z. -H.; Wang Q. -Q.; Fano resonances in dipole-quadrupole plasmon coupling nanorod dimers. Optics Letters 2011, 36, 1542-1544.
- Verellen N.; Sonnefraud Y.; Sobhani H.; Hao F.; Moshchalkov V. V.; Van Dorpe P.; Nordlander P.; Maier S. A.; Fano resonances in individual coherent plasmonic nanocavities. Nano Letters 2009, 9, 1663-1667.
- Zhang S.; Genov D. A.; Wang Y.; Liu M.; Zhang X.; Plasmon-Induced Transparency in Metamaterials. Physical Review Letters 2008, 101, 047401.
- Sugita A.; Muroi K.; Nakatsuka Y.; Tamotsu S.; Surface plasmon enhanced second harmonic behavior of a noncentrosymmetric dolmen-type Au nanostructure. Physical Review B 2023, 108, 125112.
- Yu H.; Sun Q.; Ueno K.; Oshikiri T.; Kubo A.; Matsuo Y.; Misawa H.; Exploring Coupled Plasmonic Nanostructures in the Near Field by Photoemission Electron Microscopy. ACS nano 2016, 10, 10373-10381.
- Draine, B. T.; Flatau, P. J.; Discrete-Dipole Approximation for scattering calculations. Journal of the Optical Society of America A 1994, 11, 1491-1499.
- Draine, B. T.; Flatau, P. J.; Discrete-dipole approximation for periodic targets: theory and tests. Journal of the Optical Society of America A 2008, 25, 2693-2703.
- Flatau, P. J.; Draine, B. T.; Fast near field calculations in the discrete dipole approximation for regular rectilinear grids. Optics Express 2012, 20, 1247-1252.
- Johnson, P. B.; Christy, R. W.; Optical Constants of the Noble Metals. Physical Review B 1972, 6, 4370-4379.
- Fan J. A.; Wu C.; Bao K.; Bao J.; Bardhan R.; Halas N. J.; Manoharan V. N.; Nordlander P.; Shvets G.; Capasso F.; Self-assembled plasmonic nanoparticle clusters. Science 2010, 328, 1135-1138.
- Hentschel M.; Saliba M.; Vogelgesang R.; Giessen H.; Alivisatos A. P.; Liu N.; Transition from Isolated to Collective Modes in Plasmonic Oligomers. Nano Letters 2010, 10, 2721-2726.
- Wu Y.; Nordlander P.; Plasmon hybridization in nanoshells with a nonconcentric core. Applied Physics Letters 2006, 125, 124708.
- Pham, T. T.; Pham, D. D.; Nguyen, T. A. H.; Vu M. T.; Nghiem, L. H. T.; Nguyen, T. V.; Tanaka, D.; Nguyen, D. C.; Synthesis and optical characterization of asymmetric multilayer metal-insulator nanocrescent in aqueous solutions. Applied Physics Express 2020, 13, 122004.
Figure 1.
(a) Geometry of the calculation model of the i-type dimer. Linearly polarized light is incident on each structure in the direction shown. The uniform thickness is set to 45 nm. The lengths of the short side L and the long sides W1 and W2 are set to 45 nm, 250 nm, and 100 nm, respectively. The gap distance G is set to 10 nm. (b) Scattering, absorption, and extinction spectra. (c) Electric vector distribution map of two peaks and one dip wavelengths of the optical spectra.
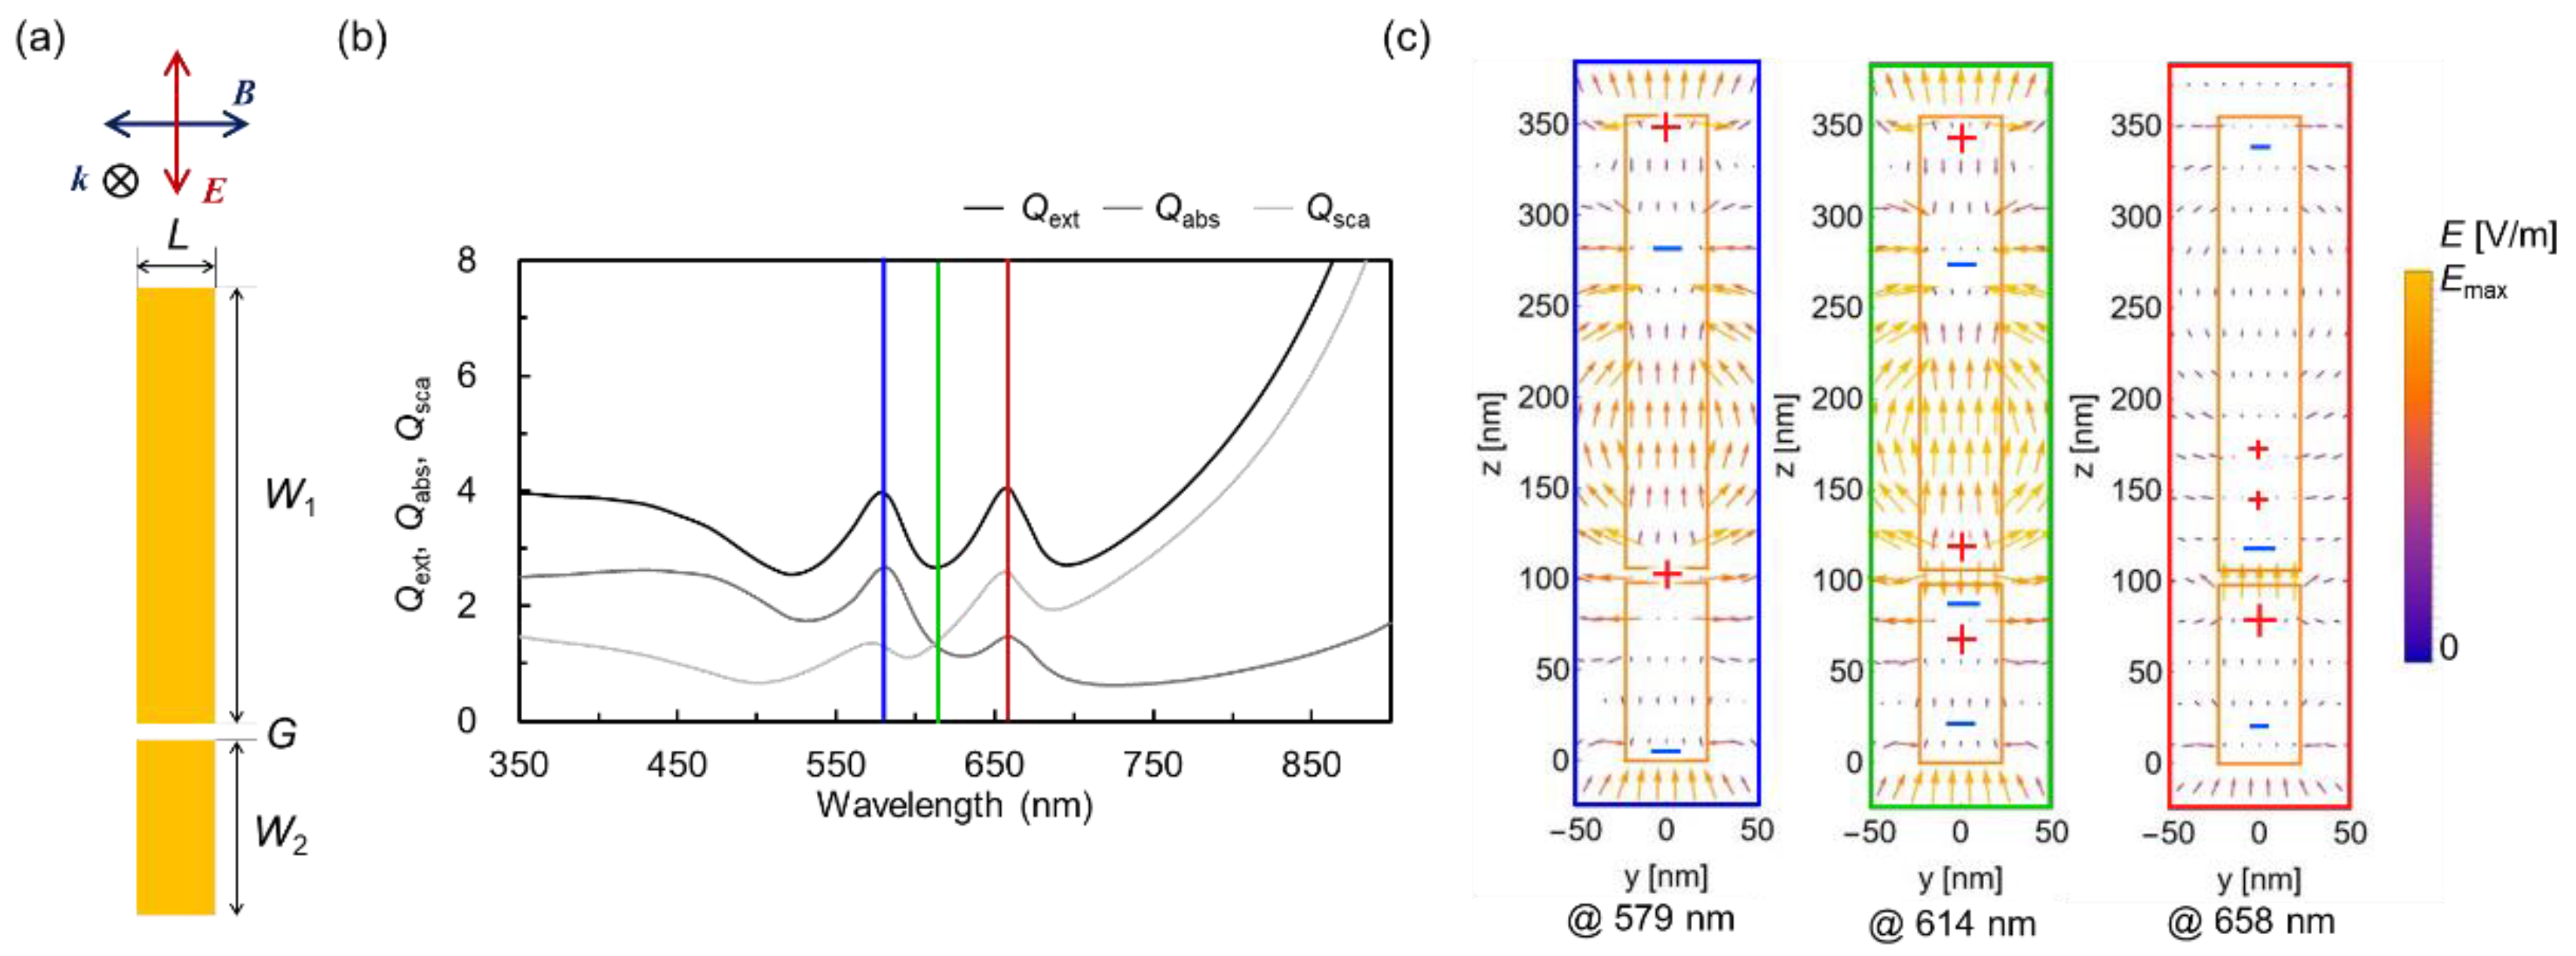
Figure 2.
(a) Geometry of the dolmen structure. The geometric parameters L1, L2, W1, and W2, are set to 240 nm, 40 nm, 40 nm, and 290 nm, respectively. The two gaps G1 and G2 are set to 50 nm and 160 nm, respectively. The uniform thickness is fixed at 80 nm. (b) Scattering, absorption, and extinction spectra. (c) Electric-field vector distributions at the wavelengths corresponding to the two peaks and one dip in the optical spectra.
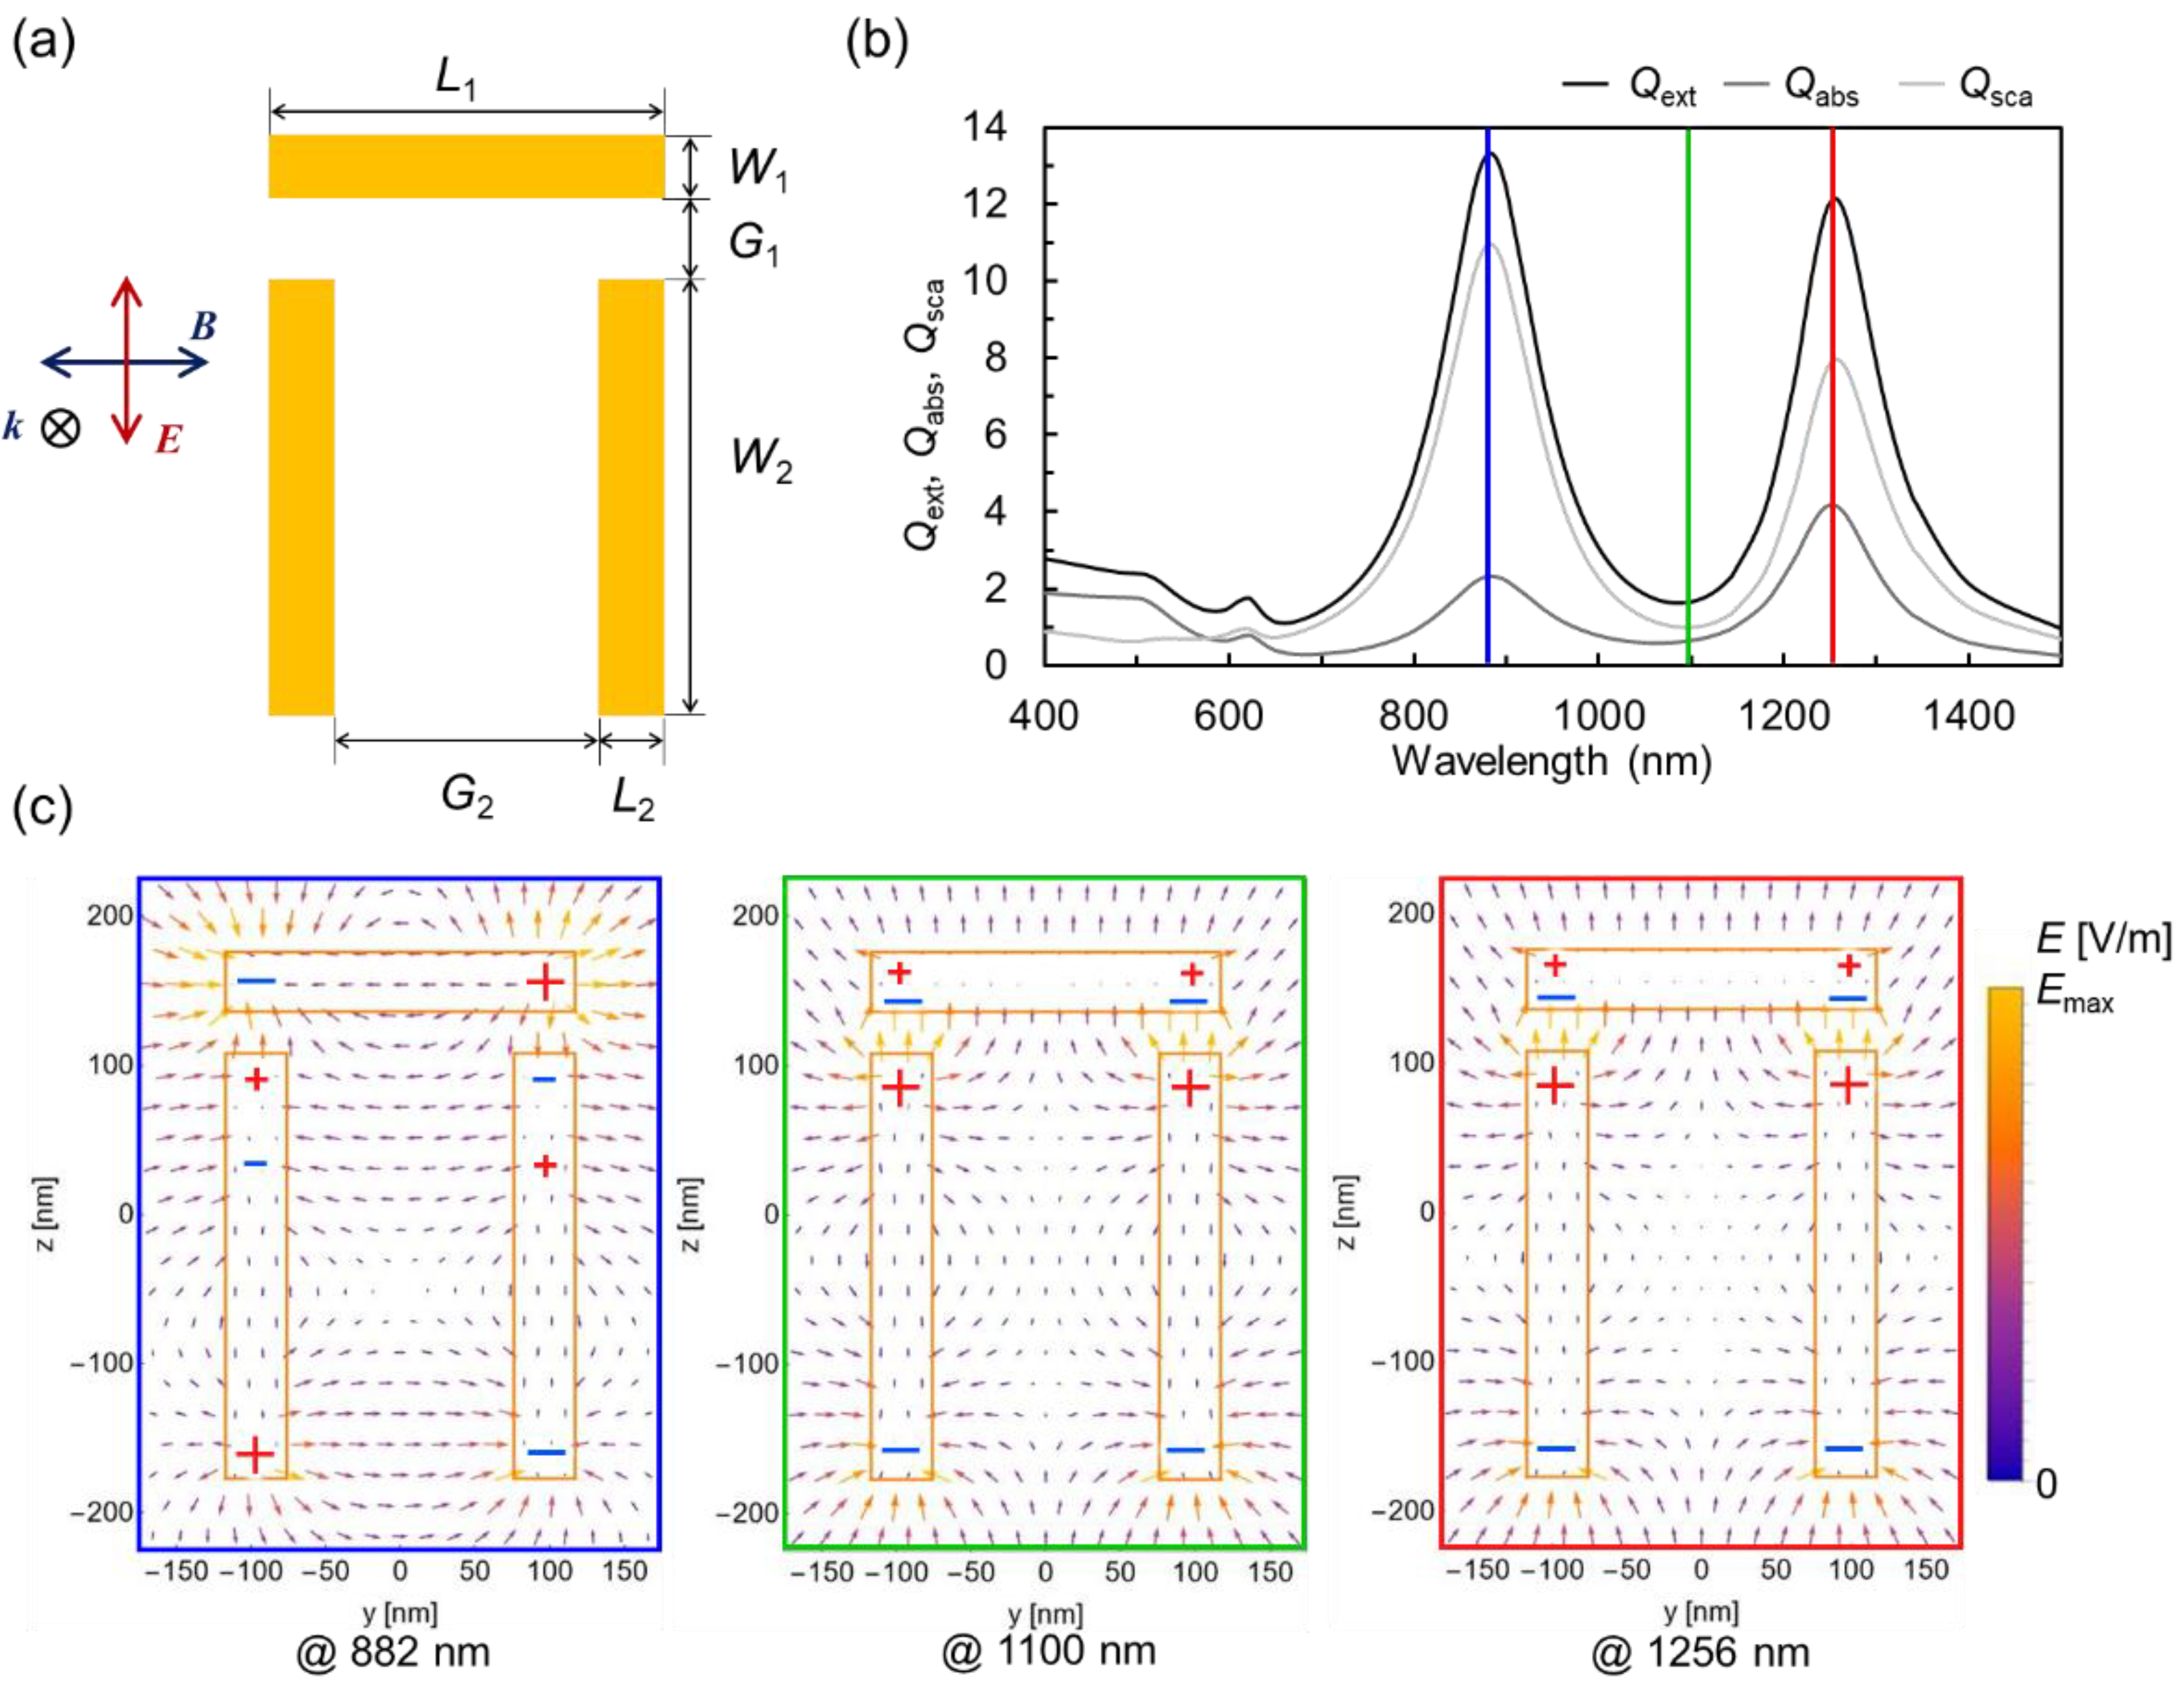
Figure 3.
(a) Geometry of the other dolmen structure. The geometric parameters L1, L2, W1, and W2 are set to 128 nm, 30 nm, 50 nm, and 100 nm, respectively. The two gaps, respectively. The uniform thickness is fixed at 20 nm. (b) Scattering, absorption, and extinction spectra. (c) Electric-field vector distributions at the wavelengths corresponding to the two peaks and one dip in the optical spectra.
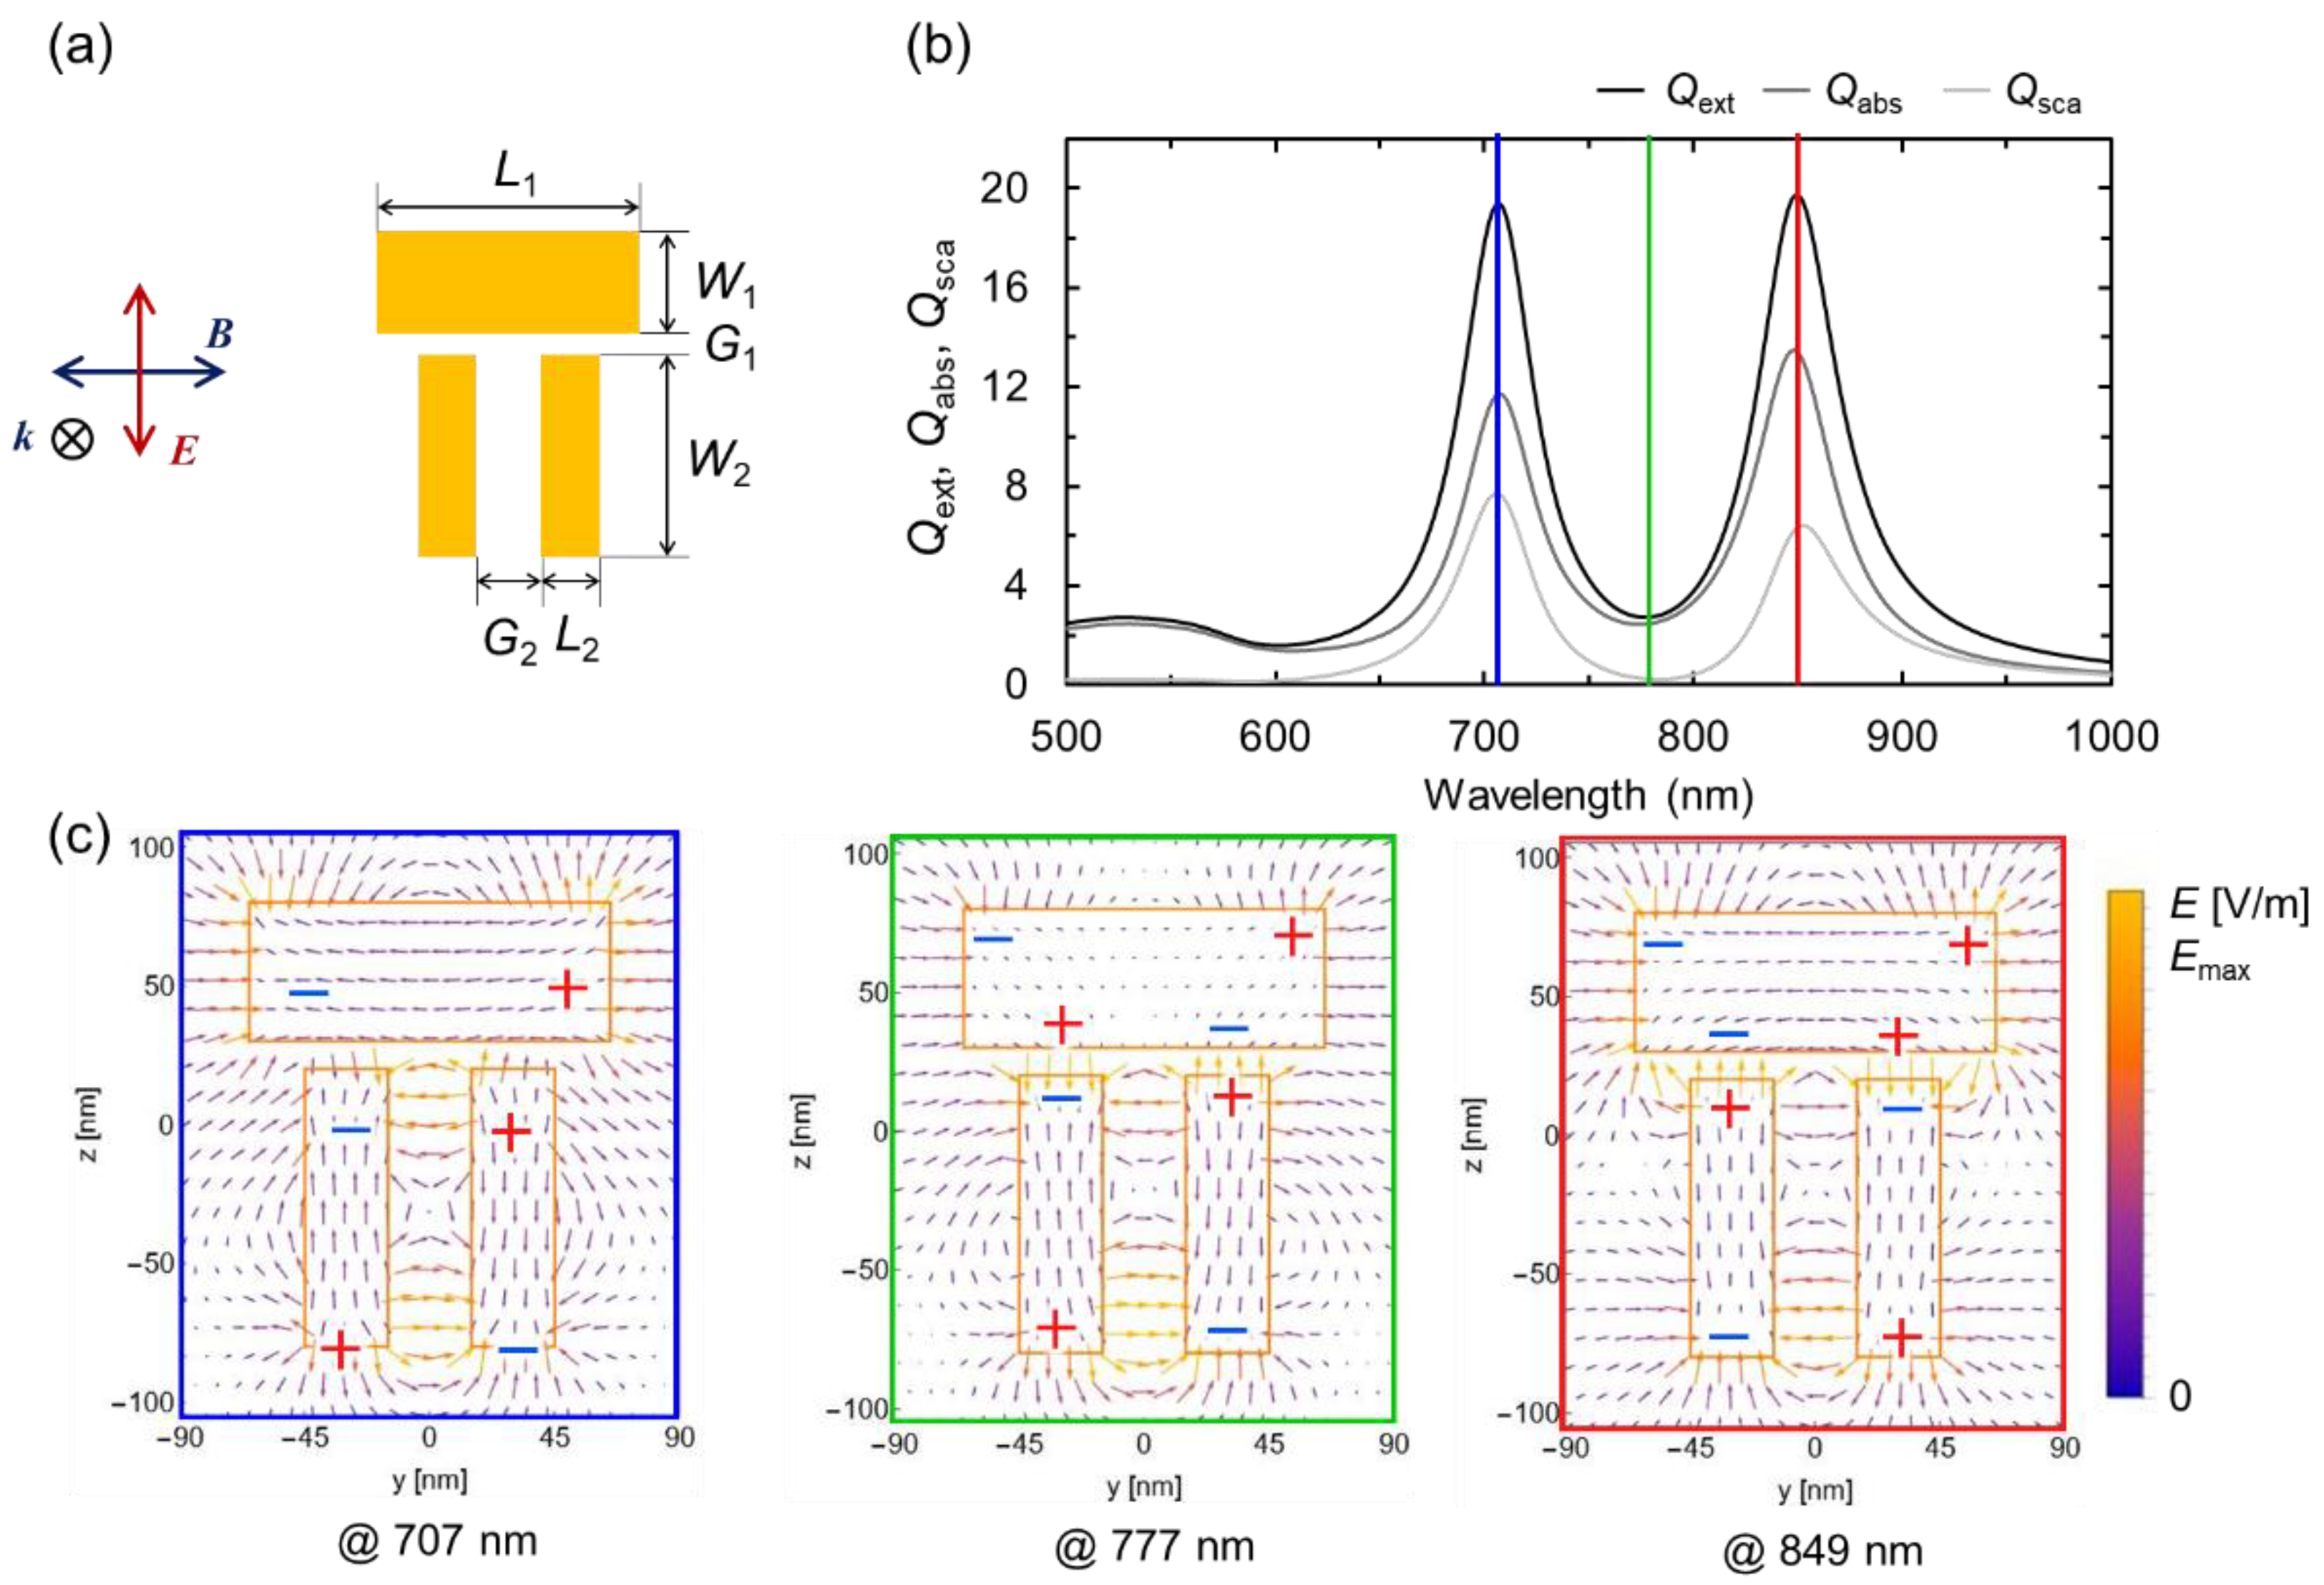
Figure 4.
(a) Geometry of the heptamer structure. The diameters of the central circular disk D1 and the surrounding circular disks D2 are set to 90 nm and 80 nm, respectively. The two gaps G1 and G2 are set to 15 nm and 20 nm, respectively. The uniform thickness is fixed at 30 nm. (b) Scattering, absorption, and extinction spectra. (c) Electric-field vector distribution map at the wavelengths corresponding to the two peaks and one dip in the optical spectra.
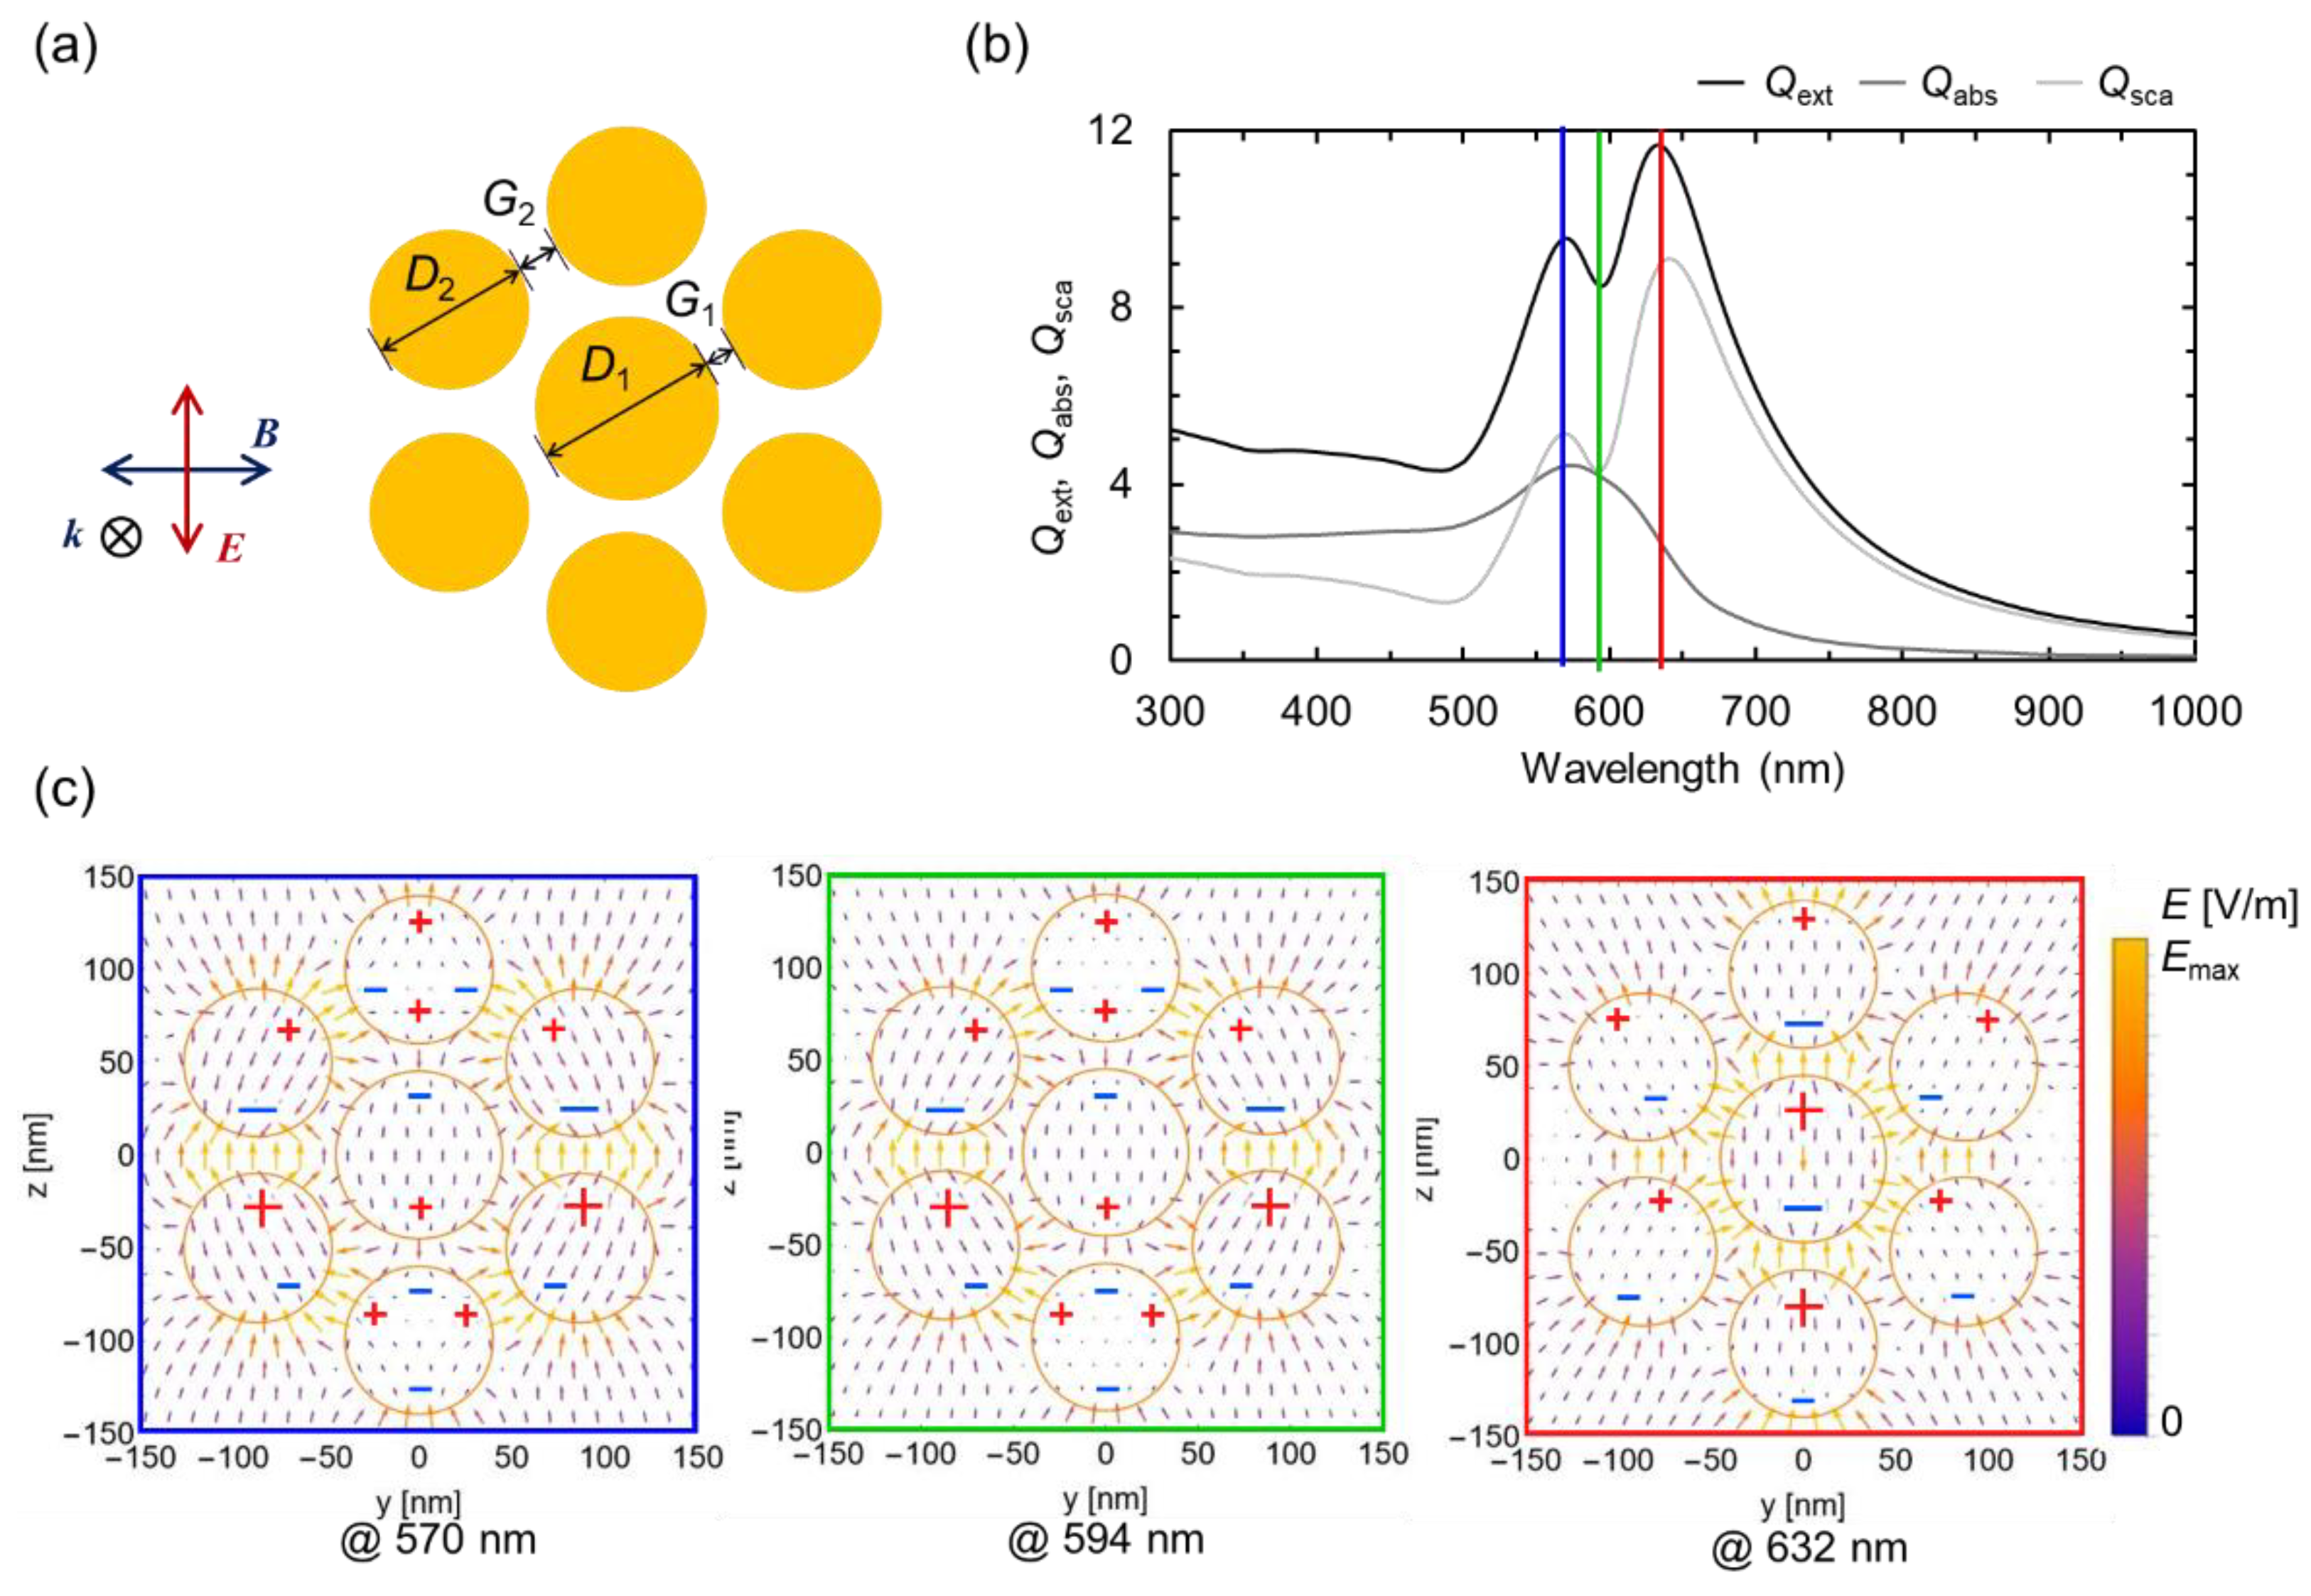
Figure 5.
(a) Geometry of the nanoshell. The diameter of the inner silica core D and the maximum film thickness of the outer gold shell T are set to 100 nm and 10 nm, respectively. (b) Scattering, absorption, and extinction spectra. (c) Electric-field vector distribution map at the wavelengths corresponding to the two peaks and one dip in the optical spectra.
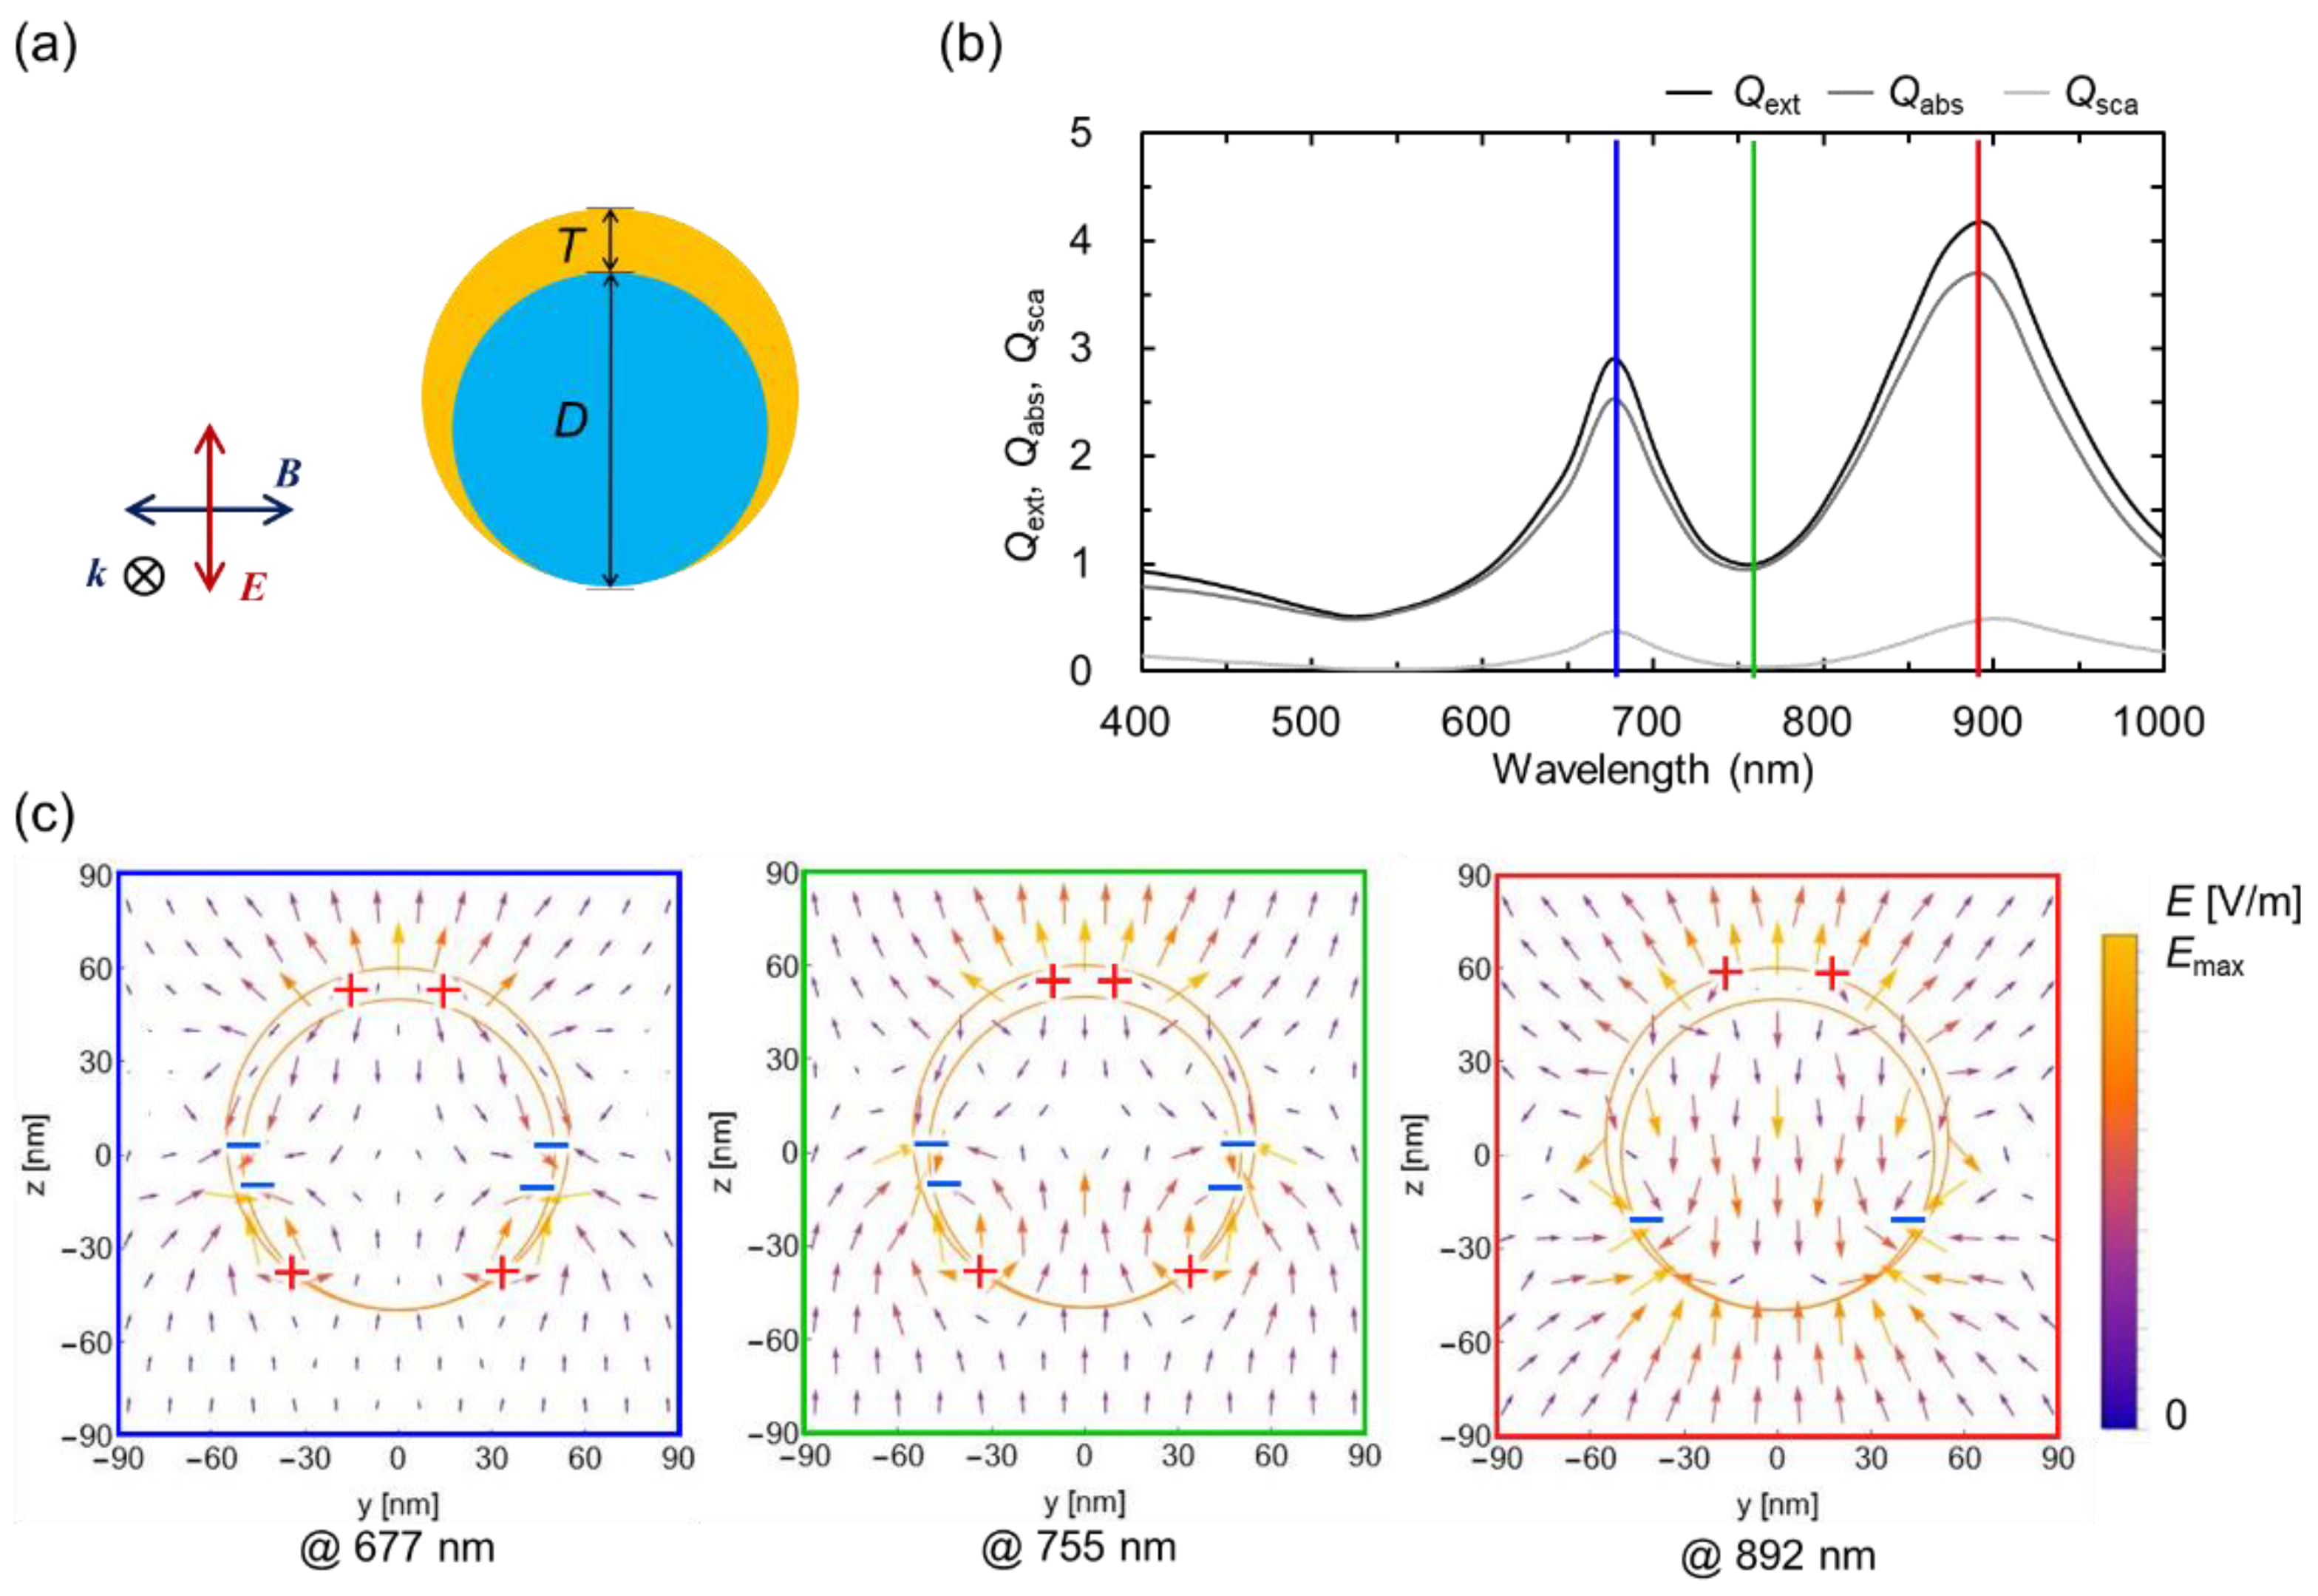
Figure 6.
Peak wavelength shift on the short-wavelength side and long-wavelength side of i-type dimer (i-), dolmen structures shown in Fig.3(a) (d1-), Figure 2(a) (d2-), and heptamer structure (h-) relative to the refractive index of the ambient medium.
Figure 6.
Peak wavelength shift on the short-wavelength side and long-wavelength side of i-type dimer (i-), dolmen structures shown in Fig.3(a) (d1-), Figure 2(a) (d2-), and heptamer structure (h-) relative to the refractive index of the ambient medium.
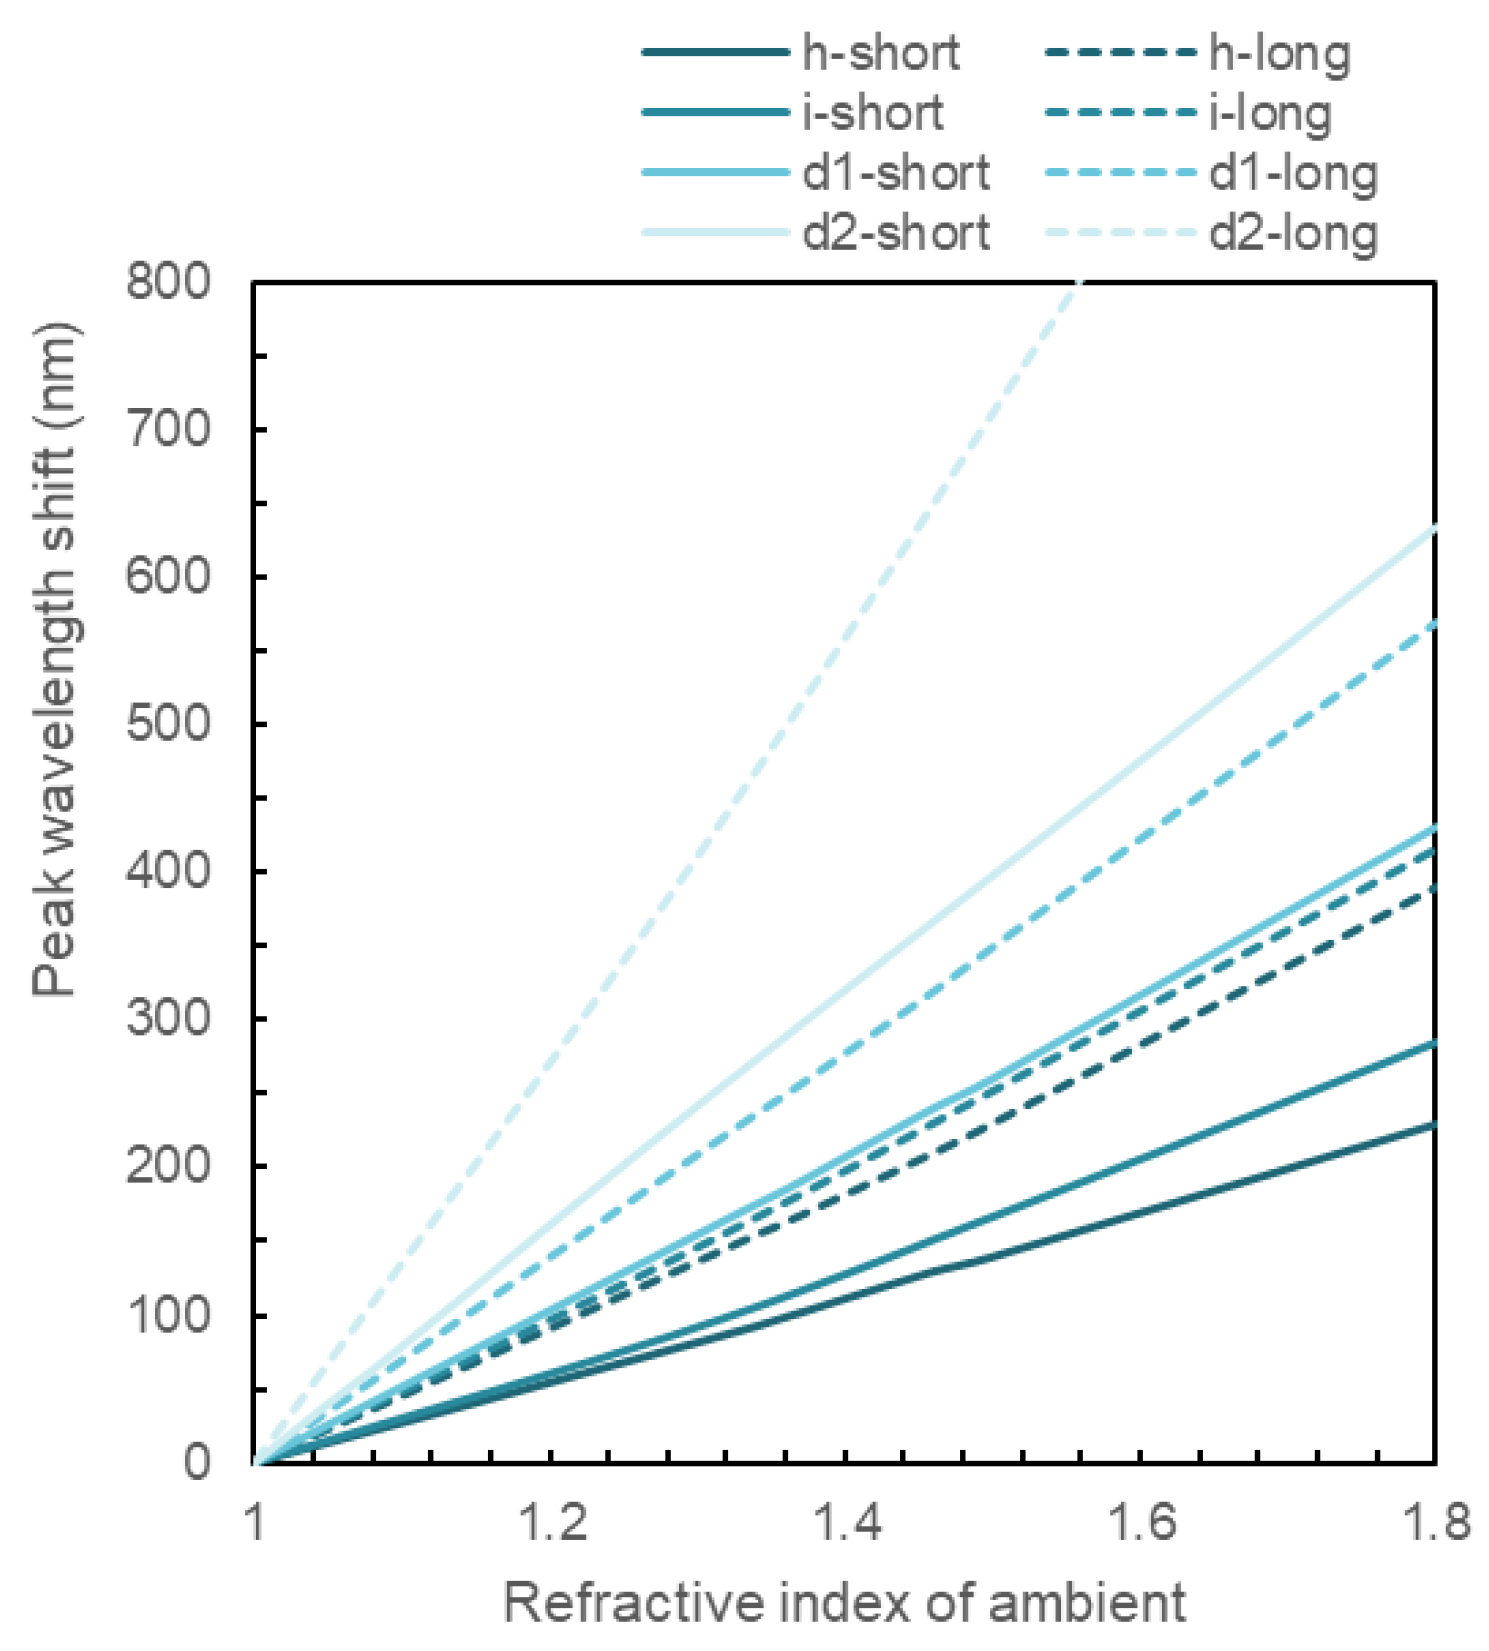

Table 1.
Short- and long-range peak wavelengths, and the order of resonance mode at each structure.
Disclaimer/Publisher’s Note: The statements, opinions and data contained in all publications are solely those of the individual author(s) and contributor(s) and not of MDPI and/or the editor(s). MDPI and/or the editor(s) disclaim responsibility for any injury to people or property resulting from any ideas, methods, instructions or products referred to in the content. |
© 2025 by the authors. Licensee MDPI, Basel, Switzerland. This article is an open access article distributed under the terms and conditions of the Creative Commons Attribution (CC BY) license (http://creativecommons.org/licenses/by/4.0/).
Copyright: This open access article is published under a Creative Commons CC BY 4.0 license, which permit the free download, distribution, and reuse, provided that the author and preprint are cited in any reuse.


