
Submitted:
25 November 2025
Posted:
26 November 2025
You are already at the latest version
Abstract
Integral membrane proteins (IMPs), which constitute 50–60% of drug targets, play es-sential roles in numerous biological processes but remain underrepresented in conven-tional bottom-up and in structural proteomics owing to their hydrophobicity and re-sistance to proteolysis. Although advances in IMPs proteomics have improved global IMPs detection, most efforts focus on proteome-scale protein identification rather than targeted structural analysis. Protein footprinting and cross-linking, two approaches in structural proteomics, require high sequence coverage and protein digestion to pep-tides of suitable length for structural elucidation, necessitating optimized digestion condition for individual IMPs. Here, we describe a digestion protocol tailored for structural mass spectrometry, applying it to an amphipathic IMP with distinct ex-tramembrane and transmembrane domains, as a model system. We evaluated the use of various protease–additive combinations and applied filter-aided sample prepara-tion (FASP) to remove detergents and surfactants efficiently prior to MS analysis. The optimized conditions consistently yielded >90% sequence coverage. Guided by MS re-tention time calibration and hydrophobic factor simulations, we identified a “sweet spot” for transmembrane peptide detection. Notably, although cleavable surfactants can enhance proteome-wide coverage, our results show that they are not essential for single protein studies as in structural proteomics. Instead, detergent removal, protease selection, and generation of suitably sized peptides are critical for enabling reliable bottom-up structural analysis of IMPs. The protocol developed here was successfully applied across several footprinting methods for structural studies of IMPs.
Keywords:
membrane protein
; vitamin K epoxide reductase (VKOR)
; mass spectrometry
; protein footprinting
; filter-aided sample preparation (FASP)
; membrane protein digestion
; structural proteomics
1. Introduction
Integral membrane proteins (IMPs) are involved in numerous biological and pharmacological functions, including intercellular communication, cellular development, signal transduction, cell migration, and drug resistance. Whereas IMPs make up ~30% of the human proteome, IMPs constitute nearly 60% of current drug targets. [1] Owing to their hydrophobic and dynamic properties, determining the structure of IMPs, especially those of eukaryotic origin, remains a challenge when using conventional methods. [2] Thus, advances in analytical technologies to characterize better and to understand IMPs are highly desired.
Structural mass spectrometry (MS) (also known as structural proteomics) is an emerging tool to characterize high-order structure of proteins as well as their primary structure. [3,4,5,6,7,8,9,10] MS analysis for IMPs, however, poses a challenge due to their highly hydrophobic nature, resulting in poor solubility in aqueous buffer, low ionization efficiency in MS, lack of tryptic residues upon digestion, and poor sample recovery owing to precipitation and aggregation. [11,12]
To overcome these challenges, various methods have been developed to improve the efficacy of IMPs bottom-up analysis. The methods include new approaches in sample preparation (e.g., protein solubilization, separation, and digestion) as well as refinement of the MS analysis. [13,14] Specifically, chemical additives such as chaotropic reagents [15], surfactants [15,16,17,18,19], organic solvents [20], and organic acids [21] have been used to solubilize IMPs. Li and coworkers [22] described a microwave-assisted strategy to enhance physically IMPs solubilization. For IMP separation and enrichment, density-gradient centrifugation [23], detergent-based extraction following centrifugation [24], glycan moiety-directed enrichment [25], and protein surface chemical labeling [26,27], were employed for enrichment of IMPs, overcoming some of the challenges of detecting low abundance IMPs. To improve proteolytic efficiency, Hettich and coworkers [28] developed a multienzyme digestion strategy that uses sample filtration to recover undigested proteins for additional proteolytic digestion. These methods have greatly improved the coverage of IMPs.
Despite these effects and significant improvements in membrane proteomics, most proteomic studies aim to improve IMPs detections on a proteome scale; that is, to increase the percentage or number of detected proteins and to improve the confidence of identification. There is, however, a notable absence of systematic studies of individual membrane proteins under several proteolytic conditions. Protein footprinting [29,30,31,32,33,34,35,36,37,38], hydrogen deuterium exchange (HDX) [39], and cross-linking typically focus on specific proteins or protein complexes, necessitating high sequence coverage to map the protein surface thoroughly and to acquire comprehensive structural information. Achieving a high level of coverage necessitates the optimization of enzymatic digestion that generates peptides with suitable length and sufficient abundance for MS analysis. Further, sample preparation conditions should be carefully optimized to maximize digestion efficiency without adversely affecting the protease activity or interfering with downstream MS analysis. For example, HDX-MS workflows require meticulous phospholipid removal to prevent LC/MS system contamination. That removal involves extensively screening of digestion conditions to attain sufficient sequence coverage [40,41,42,43]. Stable covalent labeling-based IMPs footprinting offers more resilience in downstream handling without sacrificing structural information. Progress includes the work of Li and coworkers [44], who developed a protocol to footprint IMPs in live cells, followed by in-gel protein purification and digestion. Wang and colleagues [45] employed multiple enzymes to improve sequence coverage for probing lysine microenvironments in IMPs complex.
Building upon our earlier efforts in characterizing IMPs structure through mass spectrometry, we address here current gaps by developing a user-friendly method for IMP digestion, specifically tuned for IMP footprinting studies. This method involves filter-aided sample preparation (FASP), a method designed to effectively remove detergents and chaotropes that are not compatible with mass spectrometry or IMPs digestion. [46] Extensive screening of conditions, including choice of surfactants, chaotropic reagents, and enzymes, was conducted to evaluate the IMPs digestion performance. We chose VKOR as a model because it contains a hydrophilic outer membrane domain and a hydrophobic TM. These features enabled a direct comparison of peptide abundances between these domains, revealing any unique properties. These findings have promising implications for future analysis of IMPs when maximal sequence coverage for structural investigations is needed.
This protocol was initially developed to study transmembrane domains of VKOR membrane protein, [47] and it has been successfully adopted for other membrane protein structure studies with different footprinting techniques [47,48,49,50]. The details for developing this protocol, however, have not been reported. Our aim is to provide a comprehensive protocol, offering details in methodology development that have undergone systematic evaluation for IMPs digestion. Satisfying our aim will include elucidating critical steps, solving troubleshooting problems, and acknowledging any limitations associated with the protocol. Nevertheless, this approach was successfully employed for different footprinting approaches, suggesting its potential for broad application in structural mass spectrometry (structural proteomics).
2. Materials and Methods
2.1. Reagents and Materials
Unless otherwise noted, all materials were used as received from commercial sources without further purification. Tris base > 99.9% purity), urea, water, acetonitrile, and formic acid were obtained from Sigma-Aldrich Chemical Company (St. Louis, MO, USA). n-Dodecyl-β-D-Maltopyranoside (DDM) was obtained from Anatrace. VKOR protein was provided by Weikai Li’s lab. Chymotrypsin and TCEP-HCl were purchased from Thermo Fisher Scientific. Thermolysin, trypsin, pepsin, ProteaseMAX™ surfactant were from Promega. RapiGest surfactant was from Waters (Milford, MA). Microcon-30 kDa Centrifugal Filter Unit was from Millipore Sigma (St. Louis, MO). The concentrations of all the protein stock solutions were determined by UV absorption by using a Thermo Scientific™ NanoDrop™.
2.2. Filter-Aided Sample Preparation for IMPs Digestion
The FASP protocol was modified on the basis of previous literature [51] (the workflow for FASP is described in Figure 1 in the main text). Specifically, ultrafiltration units containing 50 µL VKOR (10 µM) were added to 200 μL of denatured solution containing 8 M urea in 0.1 M ammonium bicarbonate (pH 8.0) in the ultrafiltration units. The units were centrifuged at 10,000g for ~ 20 min until less than 10 μL of sample remains above the filter. Then, 200 μL of denatured solution was added to the ultrafiltration units, and this wash step was repeated twice. The flow-through from the collection tube was discarded, and 100 μL 50 mM TCEP in 0.1 M ammonium bicarbonate was added to the filter and incubated at 37 °C for 30 min. Iodoacetamide (IAA, 100 μL, 100 mM) in 0.1 M ammonium bicarbonate was added, and the resulting solution was placed in the dark for 30 min. The ultrafiltration units were centrifuged at 10,000 g for ~ 20 min, and 150 μL of digestion buffer (DB, 0.1 M ammonium bicarbonate) was added to the filtration units, followed by centrifugation at 10,000 g for 10 min. This step was repeated twice. At this stage, urea and excess IAA and TCEP were removed by DB wash, and 60 μL of DB and protease (enzyme to protein ratio 1:20) was added. The units were placed in a water bath at 37 °C overnight. (Note: The incubation of ultrafiltration units in a thermomixer will result in evaporation of DB overnight.) After digestion, the ultrafiltration units were transferred to new collection tubes and centrifuged at 10,000 g until the solution completely passed the filter membrane. DB (100 μL) was added, and the units were centrifuged at 10,000 g until the solution completely passed the filter membrane. This step was repeated. The flow-through was collected, and 1 μL formic acid was added to acidify the solution. The flow-through containing proteolytic peptides wasused for subsequent MS analysis. The concentration of the peptides was determined by using a Thermo Scientific™ NanoDrop™.
2.3. LC-MS/MS Mass Analysis
After the digestion, a sample aliquot (20 μL) was diluted to 40 μL in 0.1% FA. Sample (5 μL) was loaded onto a custom-built silica capillary column packed with C18 reversed-phase material (Waters Symmetry, 5 μm, 100 Å, 75 μm×30 cm;). The HPLC gradient was from 2.5% Solvent B (80% acetonitrile, 0.1% formic acid) to 65% Solvent B over 90 min, then jumped to 98% Solvent B over 5 min at a flow rate of 0.5 μL/min, followed by a 10 min wash at 98% Solvent B gradient. The HPLC column was then re-equilibrated with 2.5% Solvent B for 15 mins. A Q Exactive Plus hybrid quadrupole orbitrap mass spectrometer coupled with a Nanospray Flex ion source (Thermo Scientific, Santa Clara, CA) was utilized for MS analyses. The spray voltage was 3.0 kV and the capillary temperature 250 °C. The Q Exactive Plus was operated in the data-dependent mode. Mass spectra were acquired in the orbitrap (m/z 300−2000) with a mass resolving power of 70 000 at m/z 400 for MS1 and 17,500 at m/z 17 500 for MS/MS. The fifteen most abundant ions were selected for HCD fragmentation at an automatic gain control (AGC) target of 200,000. Previously selected ions were dynamically excluded for 5 s.
2.3. Data Analysis
LC-MS/MS raw files were imported into the Byonic™ Software (Protein Metrics, San Carlos, CA, USA) for peptide mapping. Byonic™ processing of the LC-MS/MS data directly provided sequence coverage, number of unique peptides under different proteolytic conditions. Chosen were 20 ppm precursor mass tolerance, 60 ppm fragment mass tolerance, and CID/HCD fragmentation. Peptide identifications were conducted by searching the raw data against the VKOR sequence. The search parameters were for trypsin, the digest mode was semispecific on K and R, and the “max missed” cleavages were four. When nonspecific proteases (i.e., chymotrypsin, thermolysin, pepsin) were used, the digest mode was set as nonspecific. Carbamidomethylation (+57.0215) of Cys, oxidation (+15.9945 Da) of Met, Tyr, Phe, Trp, and carbamylation (+ 43.0058 Da) of Thr, Ser and Lys were variable modifications.
3. Results and Discussion
3.1. FASP for VKOR Membrane Protein Digestion
Peptide IMPs naturally embedded within lipid bilayers rely on their environment for proper folding and functionality. Preserving their structure is vital for downstream analysis like MS, X-ray crystallography, and functional assays. Investigators commonly employ detergents or lipid environments to mimic native conditions and stabilize protein structures. This pursuit, however, adds complexities to sample preparation, mandating purification before digestion and subsequent MS analysis.
Previously, we developed an in-cell footprinting method to probe membrane protein−drug interactions in live cells [44]. The conventional urea-trypsin in-solution digestion that is used for soluble proteins typically takes one day, but it proved inadequate for digestion of IMPs. To address this challenge, we devised an in-gel digestion protocol, enabling the separation of IMPs visualized as individual bands or spots. This separation is particularly advantageous for complex protein mixtures. Moreover, in-gel digestion not only enriches IMPs, but also reduces contamination, giving a clean peptide sample suitable for analysis. In-gel digestion, however, does have limitations, including the potential loss of low-abundance hydrophobic peptides and the difficulties of gel handling. Additionally, the time required for the protocol, usually several days, restricts experimental throughput (Figure 1A).
We hypothesized that FASP could serve as a viable approach to eliminate detergents or surfactants, thereby facilitating MS analysis of IMPs [52,53]. As depicted in Figure 1B, the FASP method comprises four crucial steps. First, undesirable low-molecular-weight contaminants (e.g., lipids, fatty acids, detergents) can be removed by washing with a urea-containing buffer. This clean-up step not only serves to eliminate detergents and lipids but also to unfold IMPs for denaturation and increase their surface area for chemical modification and enzymatic digestion. Subsequently, denatured IMPs undergo reduction, and their free cysteine residues are capped through alkylation. Following buffer exchange to ensure compatibility with proteases, the IMPs are digested by a protease, and the resulting peptides are collected for LC/MS analysis. Initially, we employed this methodology to digest the VKOR membrane protein, which yielded almost complete (99.6%) sequence coverage by using tryptic digestion (Figure S1). This approach shortens the time for sample preparation to one day and achieves VKOR sequence coverage comparable to that of in-gel digestion methodologies.
3.2. Evaluation of Protease and Additives for IMPs Digestion
Although trypsin remains a gold-standard enzyme owing to its specific cleavage properties, minimal self-digestion, and generation of charged residues (Lys and Arg) at peptide C-termini—ideal for charge location, MS ionization, and fragmentation by MS/MS—it’s important to note that conventional trypsin-centered strategies are less efficient for IMP digestion. This inefficiency arises because (i) TMs typically lack the charged Lys and Arg necessary for efficient trypsin cleavage (Figure 2) and (ii) tryptic transmembrane peptides tend to be both large and hydrophobic. These peptides adhere to plastic and glass surfaces and often escape detection by mass spectrometers. Even when detected, they are frequently retained on reversed-phase columns, resulting in broad peaks that compromise quantification accuracy, as chromatographic peak area is typically used for quantification. Further, their size length hinders efficient fragmentation, yielding insufficient product ions to locate modification sites accurately and to achieve residue-level structural resolution. (Figure S2). Even though we achieved 99.6% sequence coverage with tryptic digestion, the challenge remains to avoid lengthy hydrophobic peptides from trypsin’s low cleavage sites in the membrane.
Next, we explored alternative proteases, including semi-specific or nonspecific proteases, to see if we can obtain smaller, more informative peptides (we screened proteases whose properties are summarized in Table S1). Chymotrypsin is a good choice because it preferentially cleaves at C-terminal of aromatic amino acids Tyr, Phe and Trp at high rate, and at Leu and Met at lower rate. Thermolysin cleaves at the N-terminus of Leu, Phe, Val, Ile, Ala, Met. Both enzymes maintain their enzymatic activity at pH 8.0, which is the standard pH for most proteomic studies. Pepsin has its highest activity between pH 2–4, and cleaves with limited specificity at the C-terminus of aromatic and hydrophobic residues Y, F, W and L, or even after A or G, its specificity being pH dependent. [54,55] To date, pepsin is the most commonly used protease for HDX of membrane proteins [42] owing to need to maintain enzymatic activity at pH = 2.5 [56], a pH where the protein has minimal back-exchange of D to H.
We evaluated the number of unique peptides and sequence coverage for a set of enzymatic conditions (Figure 3). Notably, trypsin exhibited the highest coverage (99.6%) but yielded the lowest count of unique peptides (107 unique peptides). This outcome can be attributed to trypsin’s specificity for Lys or Arg residues. On the contrary, pepsin generates a high number of unique peptides (240 peptides) but with moderate coverage (74.7%). Because pepsin is a highly nonspecific protease, it could potentially cleave proteins into small pieces, explaining our observation of a high number of unique peptides. Some peptides, however, are so small that they are even beyond the detection capacity for LC-MS systems owing to their high hydrophilicity or having an m/z too low to be included in the data dependent acquisition (DDA) range setting.
Notably, chymotrypsin and thermolysin give equal coverage (94.4%) but generate different peptides (Figure S3. and Table S1). Chymotrypsin cleaves on the C-terminal side of amino acids whereas thermolysin cleaves at the N-terminal side. The complementary nature of these two enzymes is a promising feature for IMPs bottom-up analysis if one wishes to generate overlapping peptides for high confidence and good spatial resolution. Indeed, we observe 99.6% sequence coverage with a combination of these two proteases, with only the methionine at the N-terminus not detected (Figure S3).
Chemical additives provide effective means for IMPs denaturation and solubilization. These agents have been widely employed in primary-structure proteomics to enhance IMPs enrichment and digestion. For example, Veenstra and colleagues [57] utilized methanol, assisted by sonication, to identify over 700 IMPs, including peptides from transmembrane segments. In a separate study, Choolani and cowokers [20] found that trifluoroethanol (TFE) has a marked preference to release peptides with high hydrophobicity. Acid-labile detergents (e.g., rapigest [58,59]) were developed as a substitute for organic solvents or surfactants. These agents serve to solubilize proteins and facilitate detergent removal before LC-MS analysis. Interestingly, our incorporation of these additives yielded comparable coverages as obtained in their absence, contrasting with other studies that suggest additives improve digestion efficiency (Figure 3). Because we were applying FASP, we reasoned that the VKOR was denatured during the step employing 8 M urea to release IMPs from the vesicle. Further, the VKOR membrane protein underwent irreversible denaturation because the VKOR disulfide bonds were reduced with TCEP followed by alkylation.
We found that the use of urea is not very effective for IMPs digestion. Even with 2 M urea, we observed decreased coverage (79.3%) compared to other conditions (Figure 3). Commonly used chaotropic reagents, such as 1 M guanidine and 2 M urea, are compatible with most proteases. Our results, suggest that 2 M urea may reduce enzymatic ability and hinder achieving full coverage. Our result is consistent with that of the Heck [14], who found no benefits of 2 M urea for trypsin digestion efficiency in terms of the identified IMPs. In short, chymotrypsin digestion without any additives is the most favored proteolytic condition.
3.3. The “Split Personality” of IMPs for Routine LCMS Analysis
IMPs are amphipathic – often composed of hydrophilic extramembrane segments and hydrophobic transmembrane segments that occupy the phospholipid bilayer. Recognizing this “split personality”, we next tested how these two-segment peptides respond in MS detection.
The bacterial form of VKOR, which is naturally fused to a Trx-like domain, contains 285 amino acids. Its crystal structure [60] shows five membrane-embedded α-helices followed by a linker segment to the extracellular Trx-like domain. Theoretically, the peptides from a digestion should appear with equal relative molar ratios if there is no miscleavage. This is because each VKOR protein can generate only one copy of a peptide from a specific region, regardless of whether the peptides are derived from the outer membrane region or the TMs. We examined the extracted ion chromatograms (EIC) for 20 signature peptides, including the 10 most abundant and the 10 least abundant. The comparison reveals an unrecognized trend in membrane proteomics. The top 10 most abundant peptides all originate from the extramembrane region or the interface between the outer membrane and transmembrane. Conversely, among the 10 least abundant peptides, nine come from the transmembrane region. The EIC comparison between the most and least abundant peptides spans over three orders of magnitude. This finding provides direct evidence for the “split personality” for IMPs.
Figure 4.
The abundances of selected peptides: (A) The peak area for the 10 most abundant chymotryptic peptides. (B) EIC for 10 lowest abundant chymotryptic peptides. Nine of 10 lowest abundant peptides come from hydrophobic TMs, whereas the 10 most abundant peptides all come from outer membrane or membrane interface. The selected peptides are mapped onto the VKOR crystal structure (PDB 3KP9).
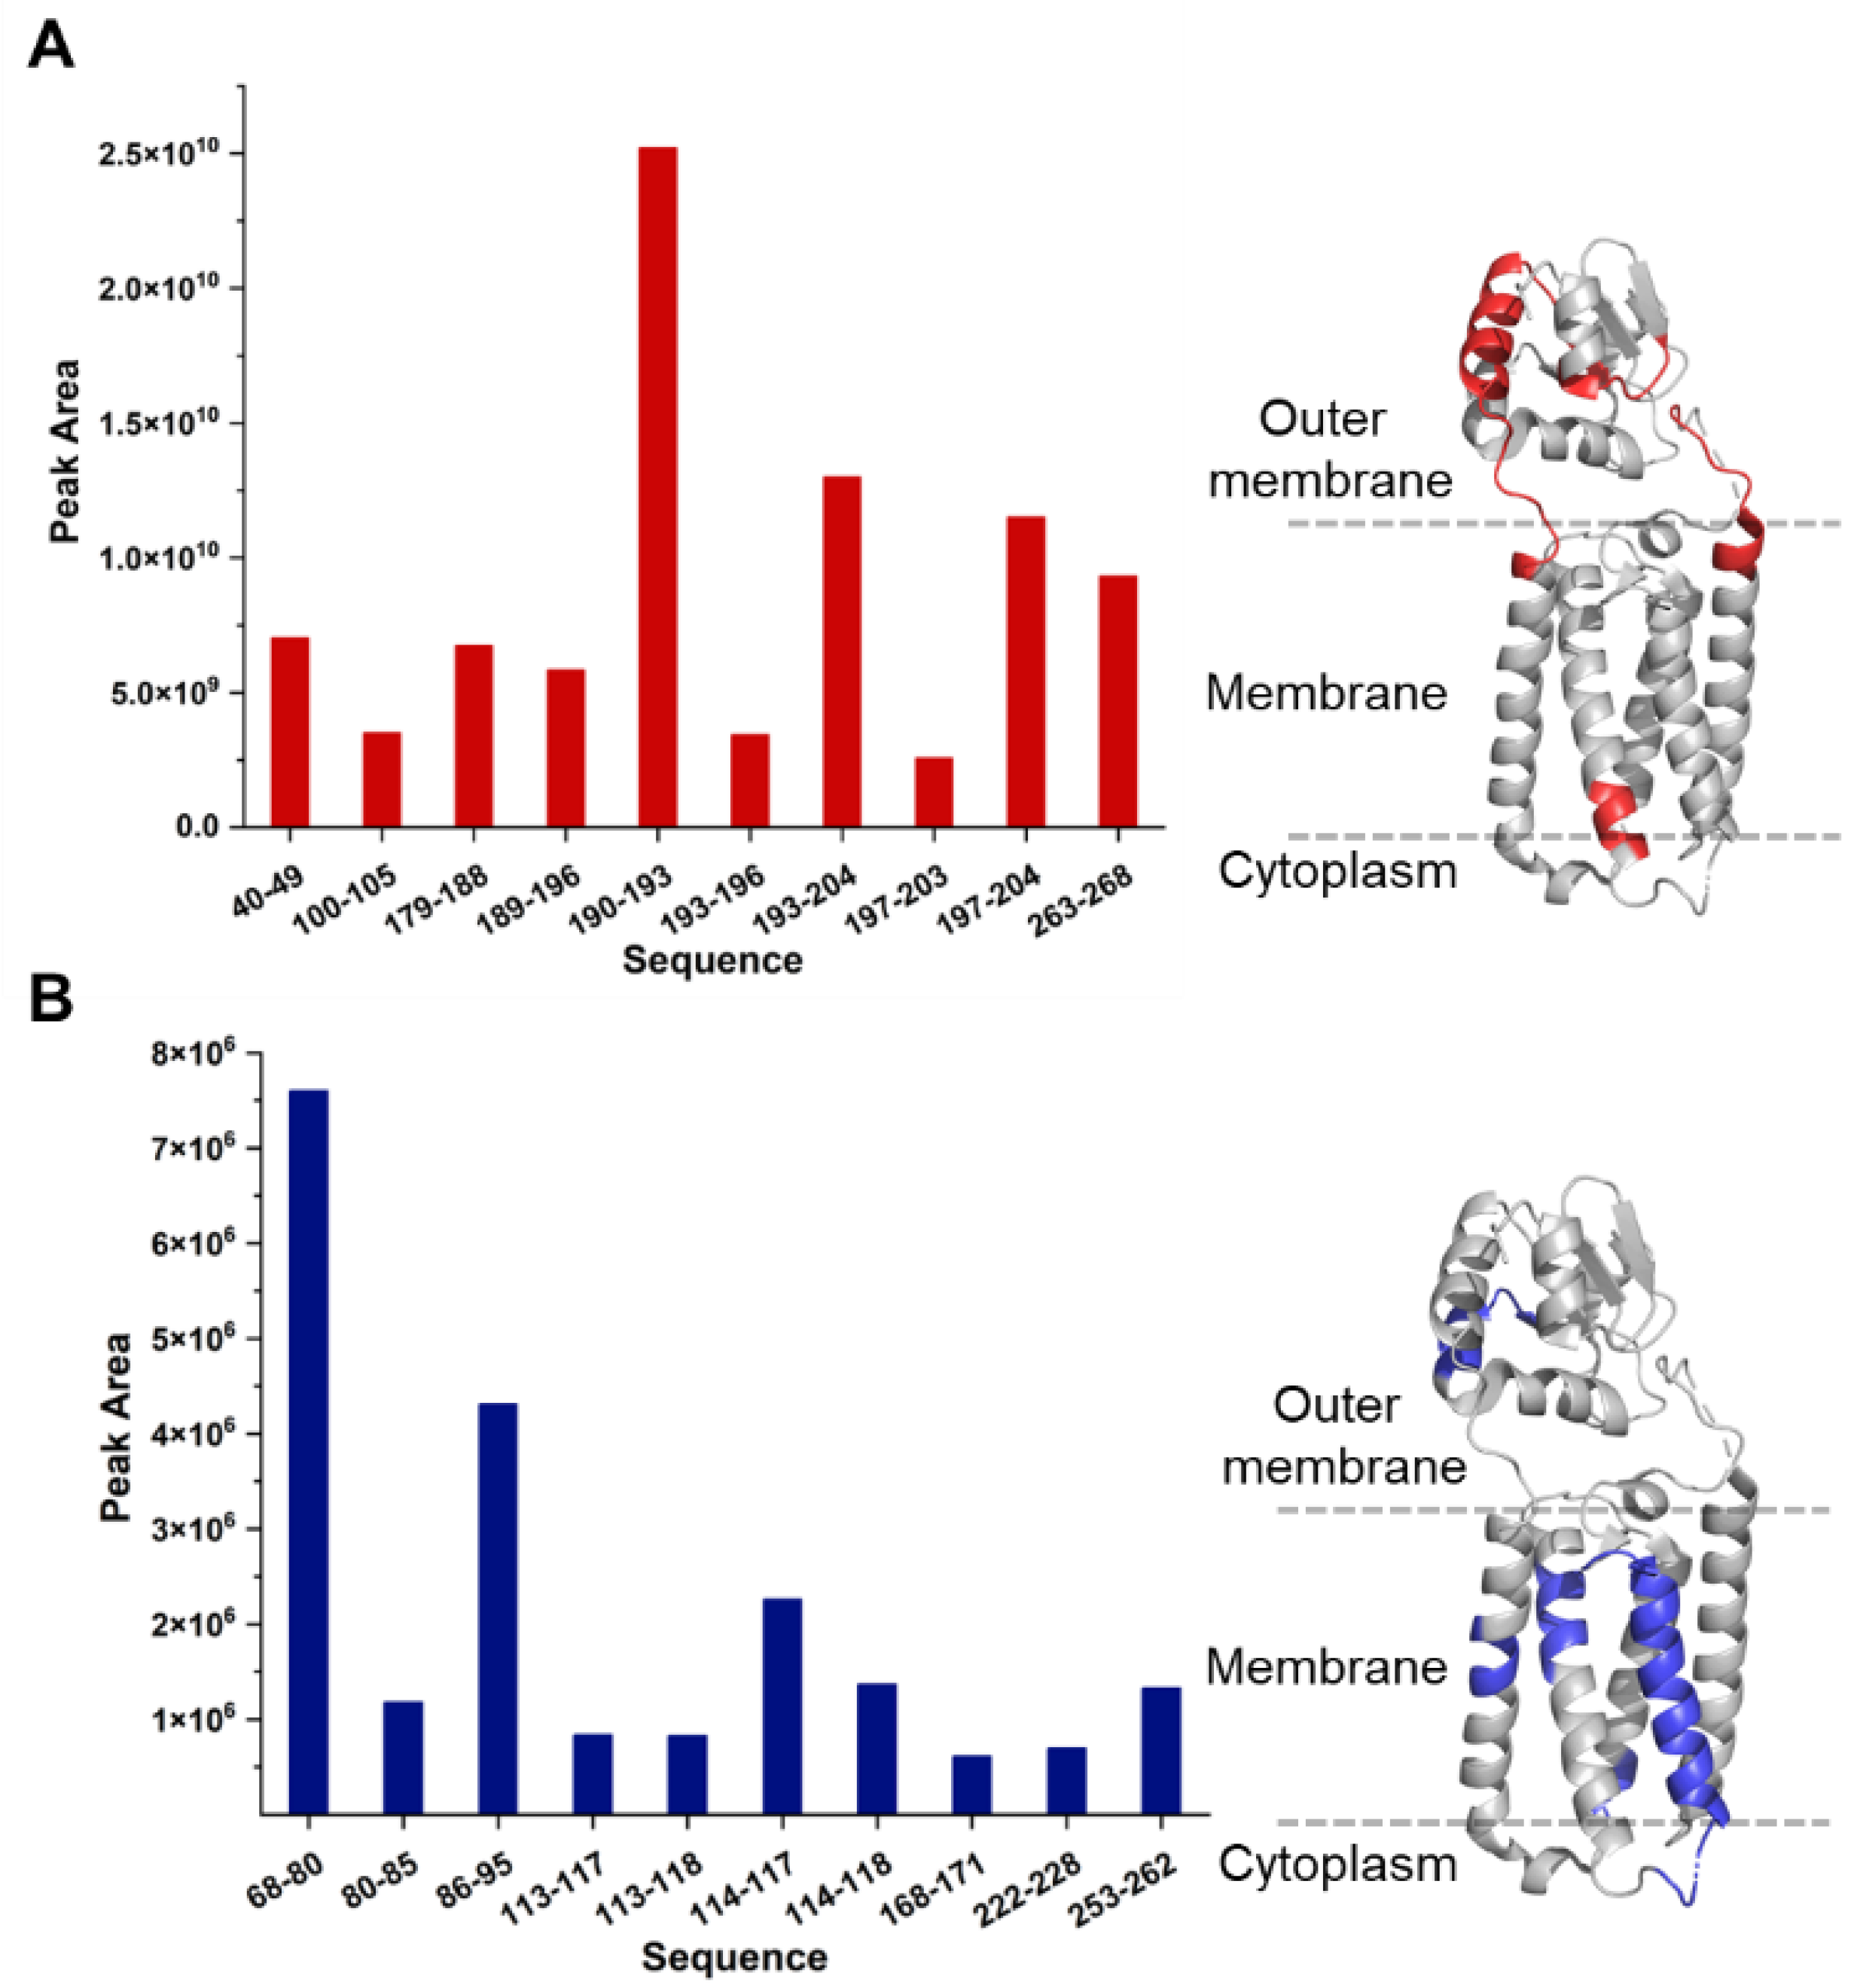
As expected, the eight most abundant peptides contain positively charged residues that enhance solubility and ionization efficiency. In contrast, the 10 least abundant peptides lack these positively charged residues. The scarcity of positively charged residues in transmembrane regions contributes to their underrepresentation even within the same individual IMP. Current LC-MS systems are programmed to favor peptides containing positively charged amino acids in the data-dependent mode. Chymotryptic peptides from the TMs are intrinsically hydrophobic because they are devoid of charged residues, resulting in poor ionization efficiency and increased surface adsorption, and, thus, they are not abundant.
3.4. Identification of “Sweet Spot” for Transmembrane Peptides Detection
Our next goal was to determine the compatibility of peptides for MS detections. Reversed-phase chromatographic approaches are suited for peptides falling within a certain window of hydrophobicity. We hypothesize that peptide standards with a broad range of hydrophobicity would allow us to evaluate the instrument’s capability to detect peptides spanning various hydrophobicity levels in IMPs. We utilize Pierce’s peptide retention time calibration (PRTC) mixture that comprises 15 heavy peptides with a broad hydrophobicity. Using an online tool, we calculated the hydrophobicity factor (HF) for both the most hydrophobic and most hydrophilic peptides among the 15 heavy peptides, as well as for all the detected chymotryptic peptides from VKOR’s TM (Table S4). The calculated values define a “sweet spot” between the most hydrophobic peptide and most hydrophilic peptide (see region between blue line and red line in Figure 5). Notably, most detected peptides from the transmembrane region fall within this “sweet spot.” Further, over half of the identified transmembrane peptides exhibit an HF exceeding 20. This “sweet spot” offers guidance to choose an appropriate protease that cleaves IMPs into peptides falling in the “sweet spot” region. As an illustrative strategy, an investigator can conduct an in-silico digestion and then predict the HF of the peptide generated. The prevalence of peptides within the “sweet spot” is a measure of the probability for peptide detection.
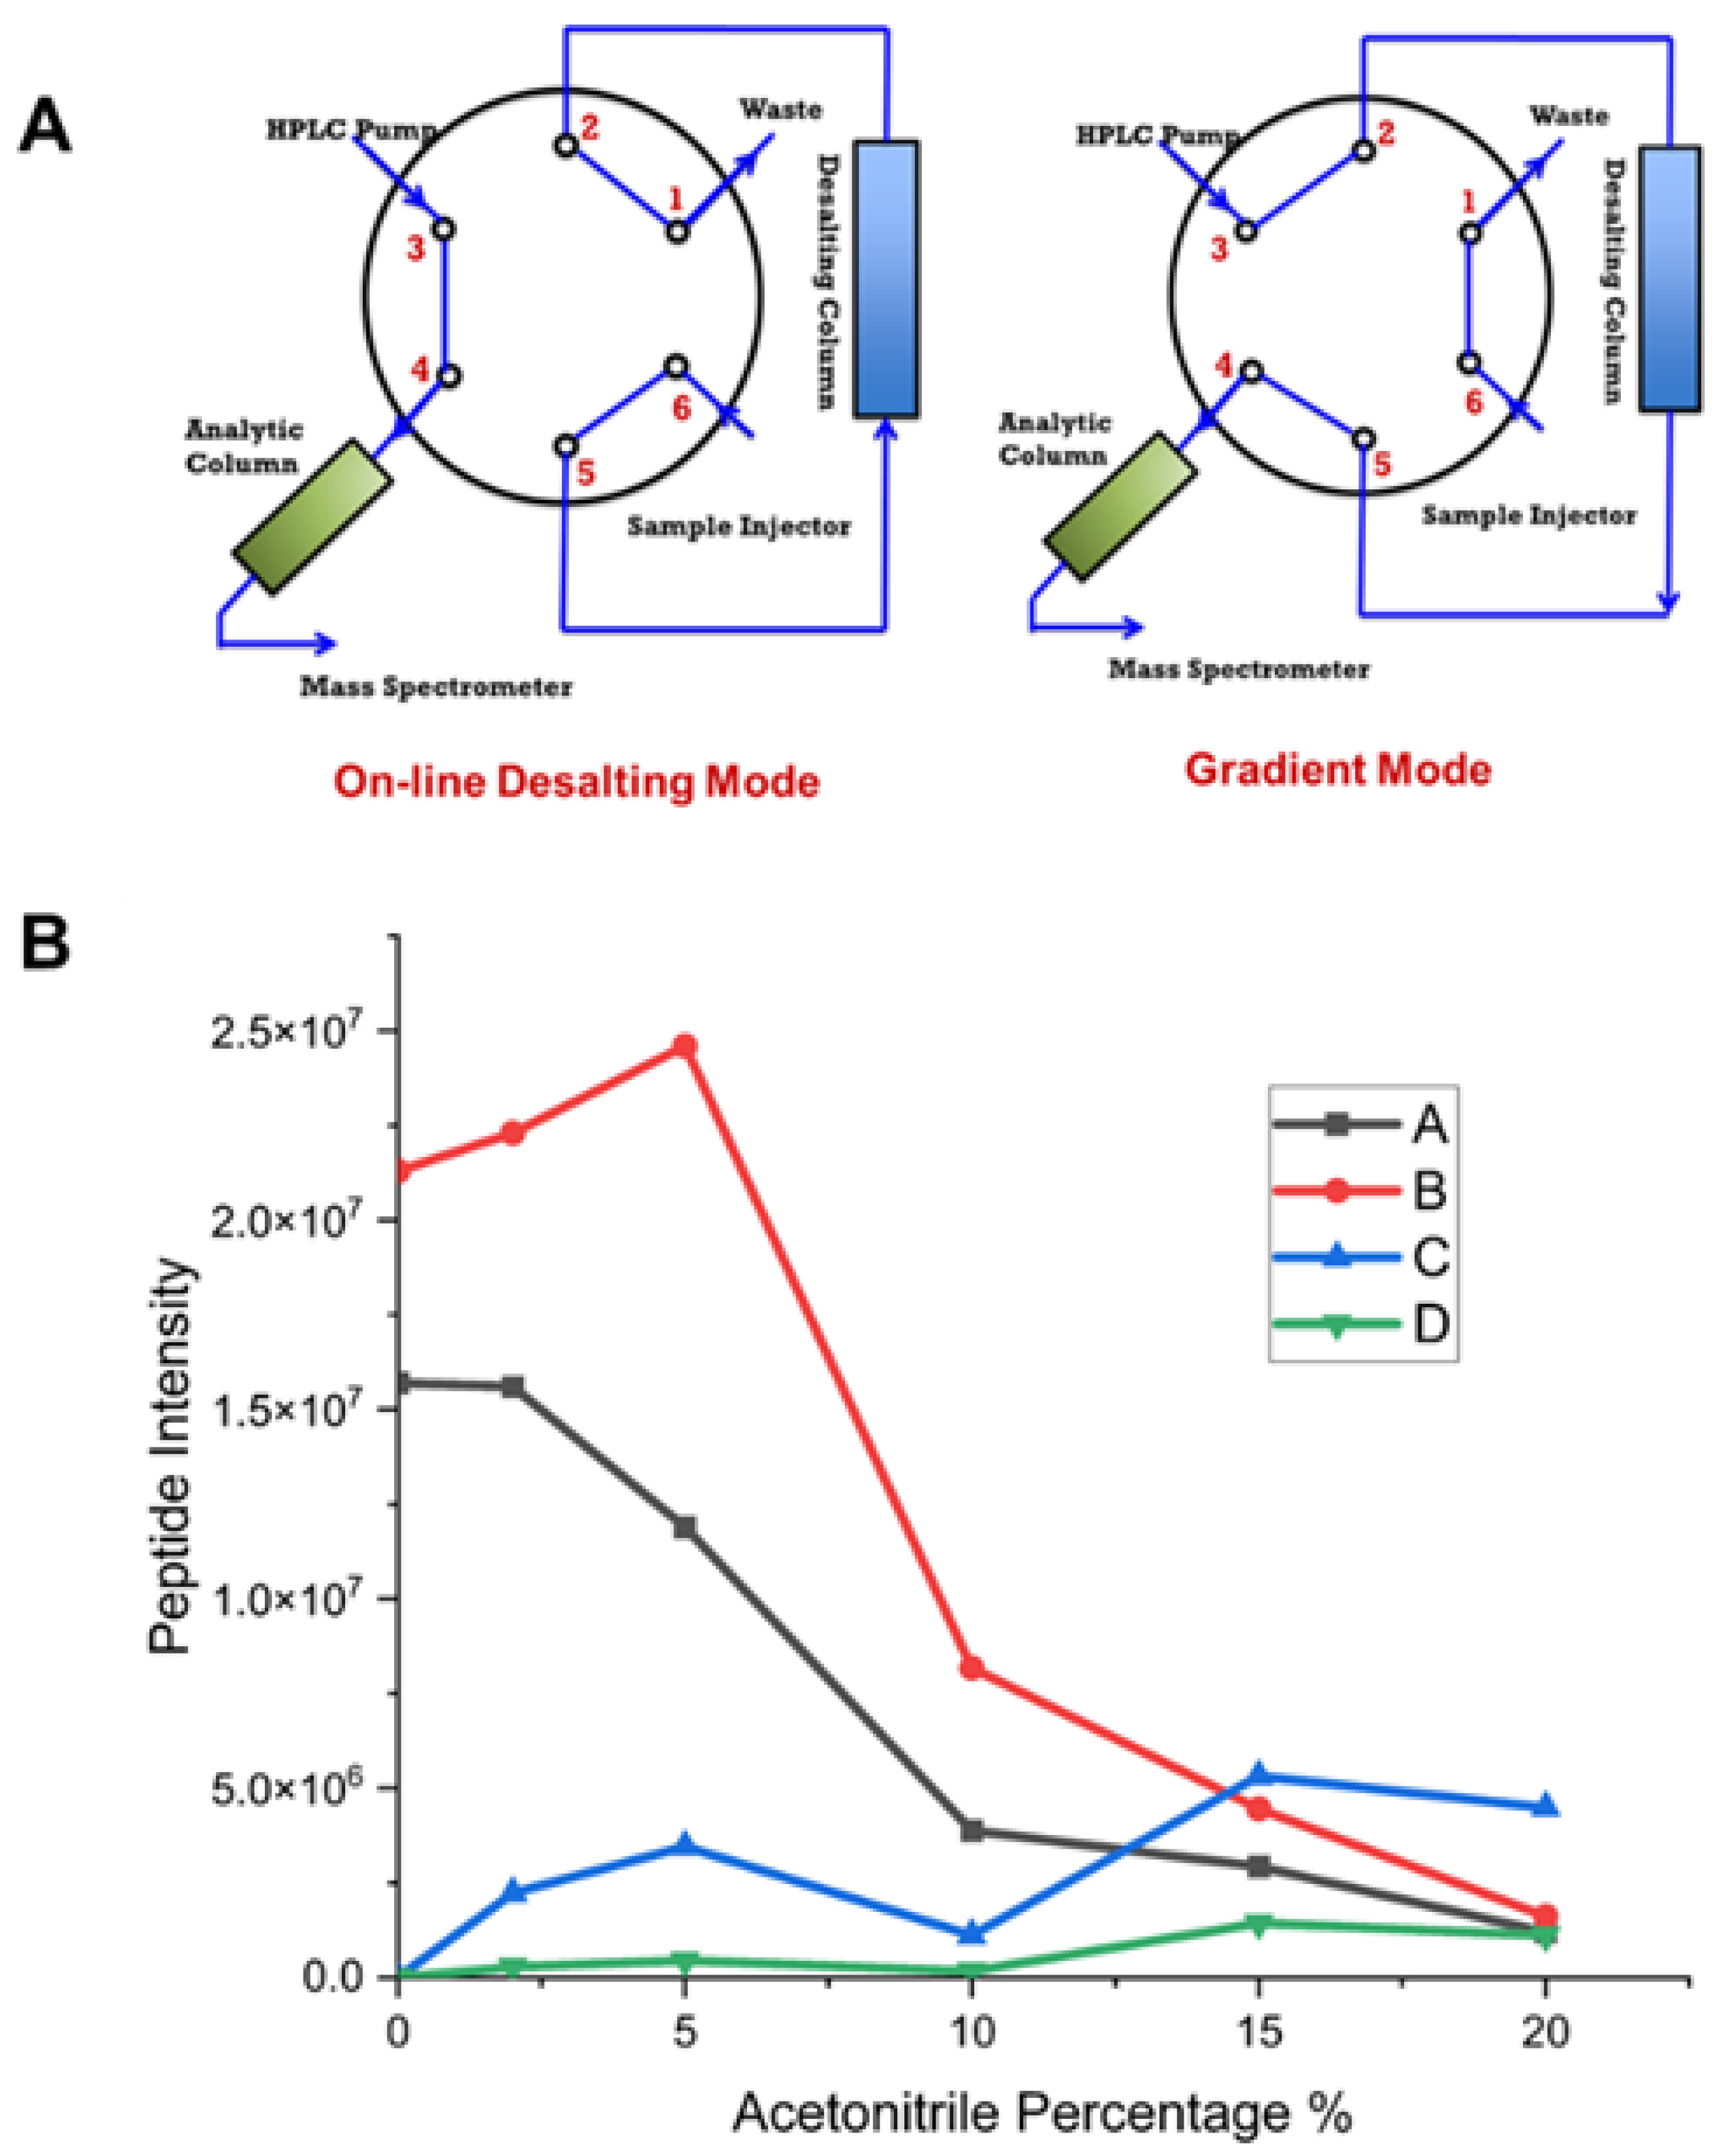
The detection of transmembrane peptides within the “sweet spot” is partly attributed to our two-mode, sample-loading valve system (Figure 6A). The proteolytic peptides in the buffer solution possess several salts, detergents, and other adduct forming ions. These can interfere with MS characterization by decreasing sensitivity and can result in instrument fouling, ultimately leading to downtime. To improve the MS sensitivity, on-line desalting valves were applied in our LC-MS system to remove salts and other buffer components prior to MS detection. Ideally, the peptide sample was loaded into the desalting column to remove hydrophilic matrix components (send to waste) while trapping peptides of interest. To ensure sufficient sample loading and desalting, we employ a 10 min elution with aqueous phase.
We assessed the capabilities of the LC-MS/MS system by using PRTC as our benchmark. PRTC was prepared in varying acetonitrile concentrations. Representative peptides A, B, C, and D were monitored for their mass response relative to acetonitrile concentration. We observed a binary mass response corresponding to organic solvent. First, the signal intensities corresponding to the most hydrophobic peptides C and D generally increased when we increased the concentration of acetonitrile (see blue and green curve). This observation is consistent with the principle that organic solvents facilitate hydrophobic peptide solubilization and with the results by Mitra et al. [61] who observed a higher percentage of membrane vs. non-membrane proteins when utilizing methanol solubilization. The curve does not show, however, a strictly positive correlation with the acetonitrile percentage. Notably, the intensity of peptide C decreases at 10% acetonitrile but increases again at 15% acetonitrile. On the other hand, an opposite trend occurred for the most hydrophilic peptides A and B whose signal intensities declined with an increasing concentration of acetonitrile. These two hydrophilic peptides decreased in signal intensity with increasing acetonitrile likely owing to poor retention on the desalting column and leading to partial elution to waste. This loss may shed light on the diminishing sequence coverage seen with an increasing number of unique peptides in pepsin digestion (Figure 3A). Pepsin’s broad specificity may lead to digestion of VKOR into smaller peptides or even amino acids that cannot be captured by the desalting column, ultimately leading to a decrease in sequence coverage. These results also underscore the significance of finely tuning the LC-MS system. For instance, by introducing organic solvents to dissolve the digested peptide, one can tailor the “sweet spot” to prefer either hydrophilic (extramembrane) or hydrophobic (transmembrane) segments.
3.5. Application to Footprinting to IMPs Structure Analysis
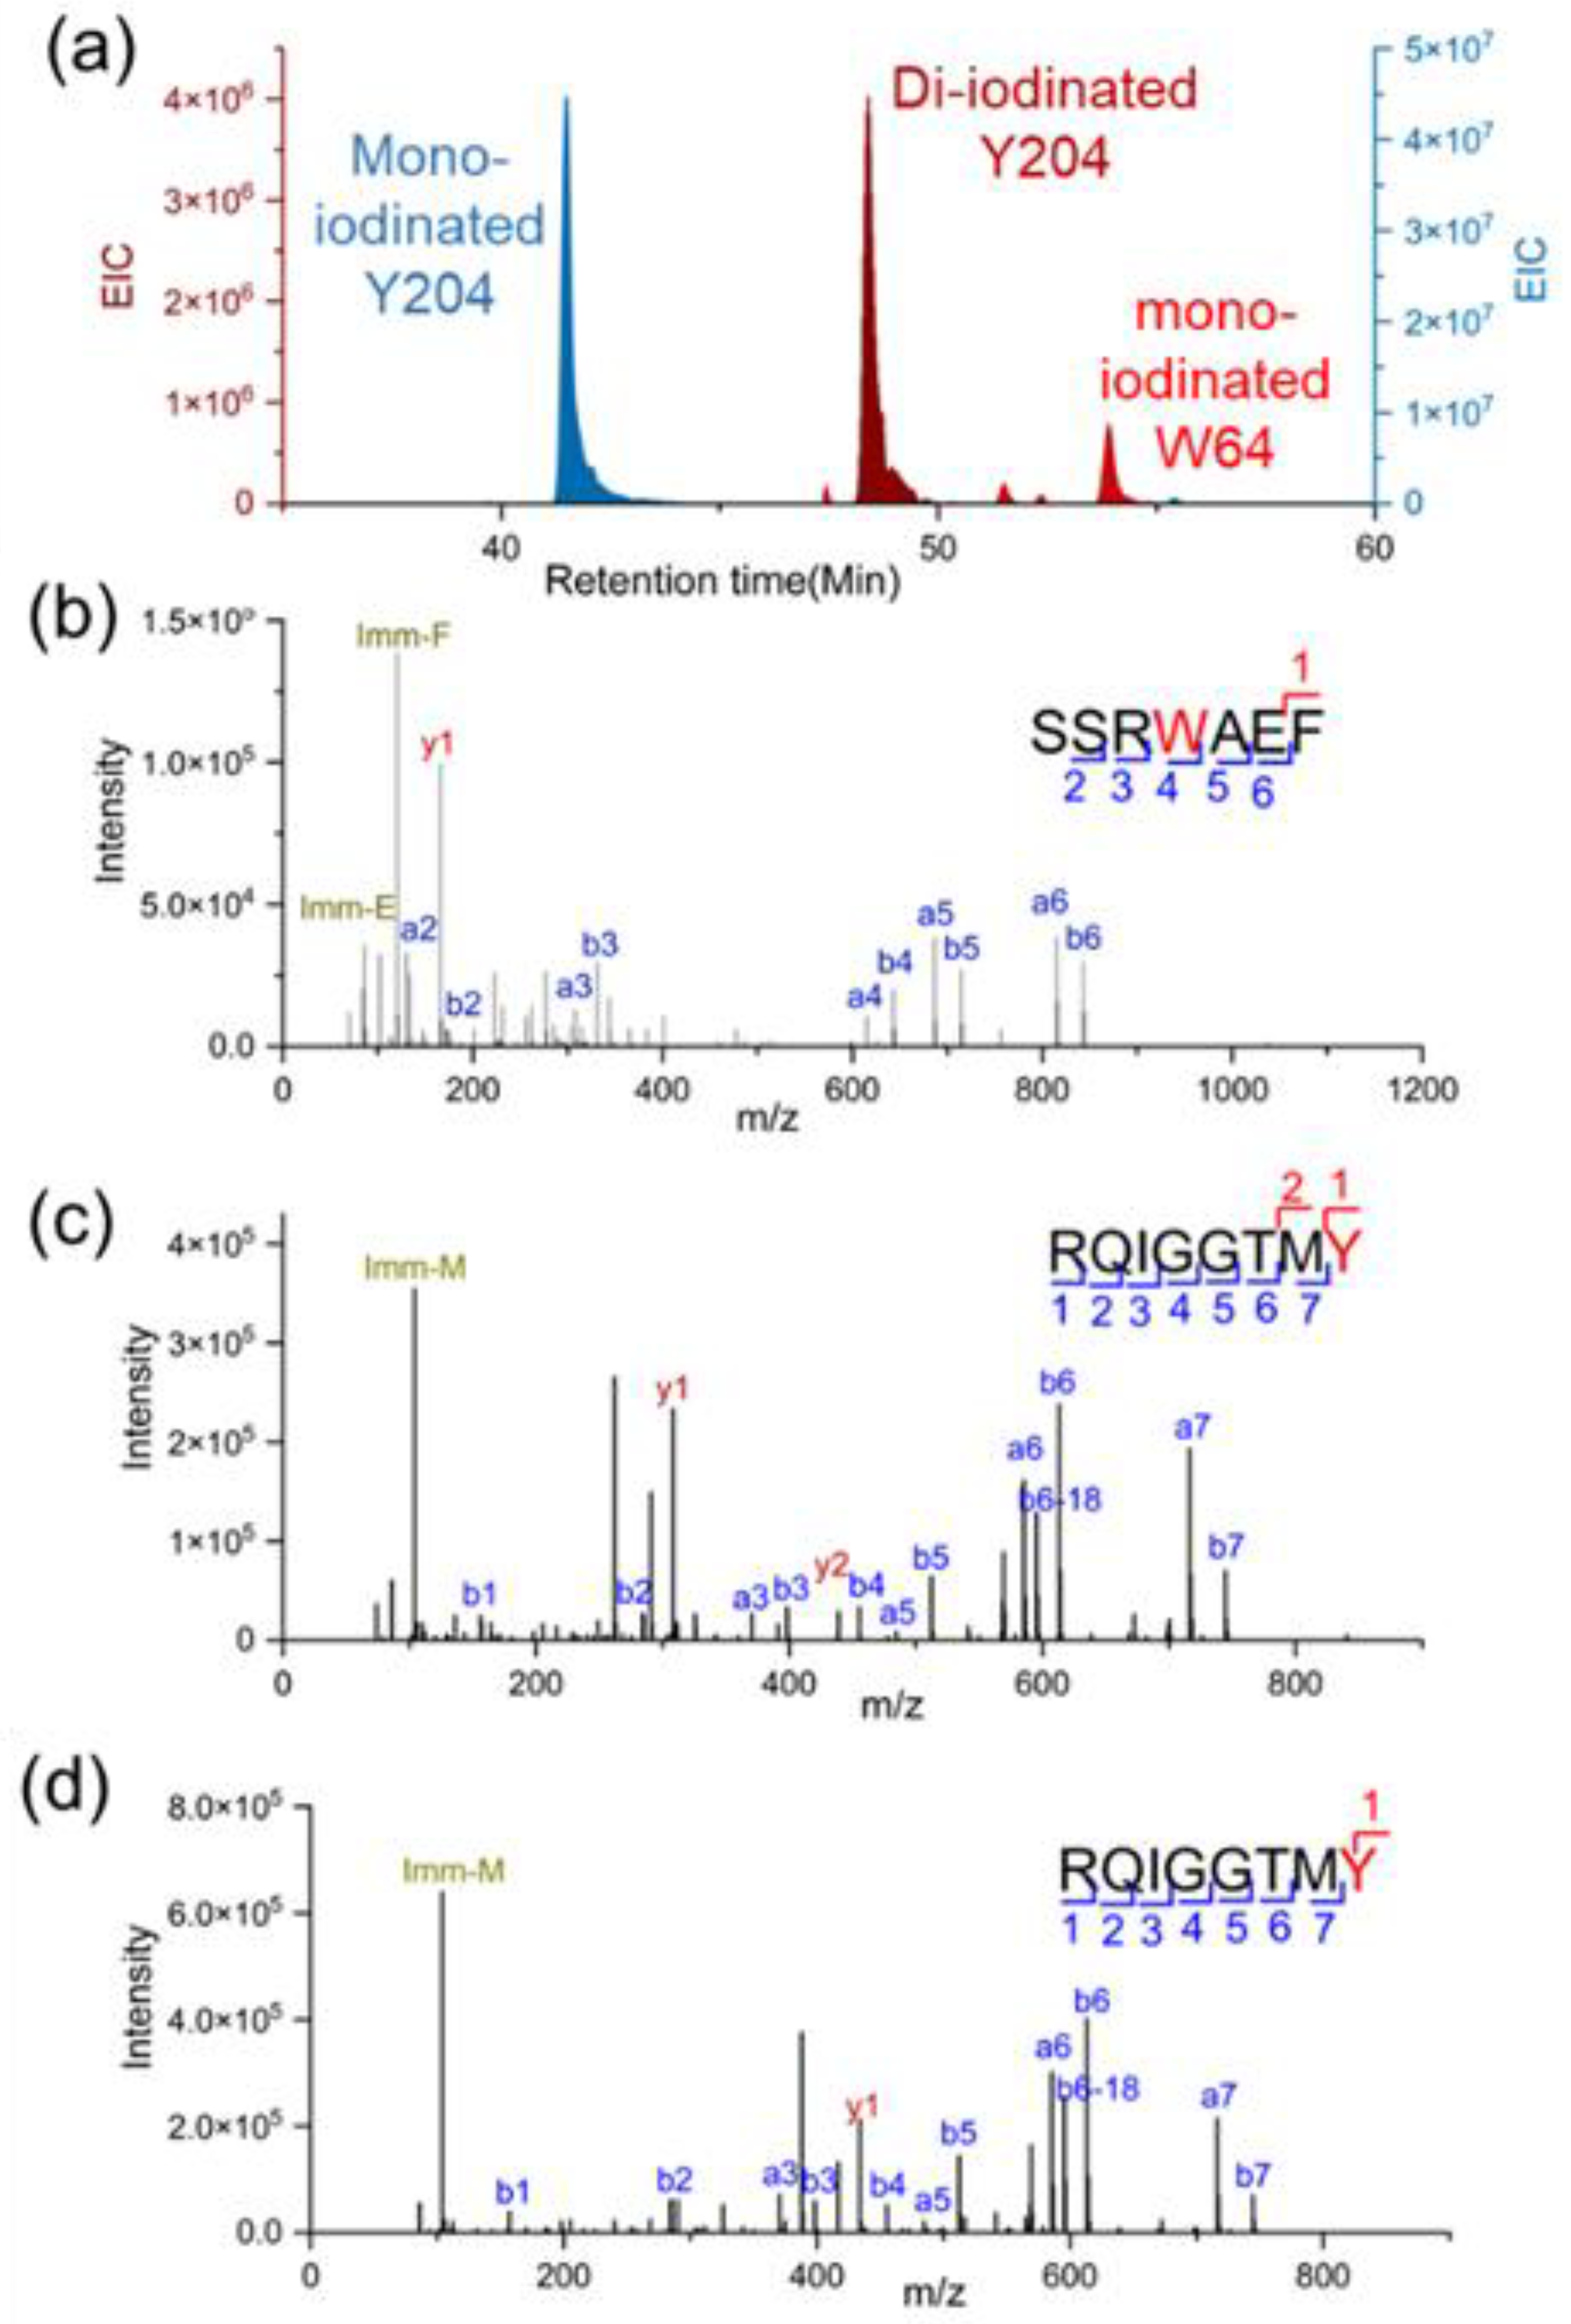
Protein footprinting can provide residue-level structural information. Achieving this resolution, however, relies on the ability to identify and quantify unambiguously the peptides derived from protein digestion and to annotate modifications that are induced by footprinting. For structural analysis, two critical questions come into play: (i) are there adequate fragment ions to pinpoint the modification site? and (ii) are the chromatographic peak shape sufficiently well-formed and separated to quantify the modification ratio by integrating extracted ion chromatograms (EIC) of precursor ions. Given the nature of IMPs, answering these questions is a significant challenge through conventional sample handling. In Figure 6, a chymotryptic peptide is sufficiently fragmented to identify the iodination on Y204 and W64 confidently. With tryptic digestion, however, a long transmembrane peptide is liberated, leading to poor resolution in both peptide sequencing and chromatographic lipid chromatogram separation. This degradation in resolution adversely affects obtaining structural information and undermines the accuracy of quantification (Figure S2). We tested the current approach to analyze the protein after footprinting by different reagents. Coupled with novel footprinting, the approach was successfully applied to study two IMPs including human VKOR and GLUT1 proteins. Importantly, this approach is applicable to several footprinting methods, including iodination [47], DEPC [50], and photo oxidation [49] and consistently yields sequencing coverage exceeding 90%.
Figure 7.
Representative product-ion (MS/MS) spectra for chymotryptic peptides. (a) Extracted ion chromatograms for modified peptides. (b) Product-ion (MS/MS) spectra of mono-iodinated W64, and (c) mono-iodinated Y204, and (d) di-iodinated Y204. Chymotrypsin displays a preference for cleaving at the C-terminal side of aromatic amino acid residues (e.g., W and Y), generating peptide amenable for peptide sequencing). Panels C and D include MS/MS spectra of the same peptide previously reported in our published work. [47] They are shown here to illustrate how these iodinated peptides, including the iodinated Tyr and Trp-containing peptide, are resolved by LC.
4. Conclusion
We have developed an optimized approach for digesting integral membrane proteins (IMPs) that is compatible with structural-analysis workflows—such as protein footprinting—and delivers nearly complete sequence coverage by MS. Our method uses commercially available microcentrifuge filter devices (“spin filters”) to remove interfering species before LC-MS, thereby reducing sample-prep time, minimizing instrument contamination, and improving peptide recovery.
In our protocol, proteins are retained on the filter as small contaminants are washed away, then subjected to on-filter digestion. We systematically evaluated four proteases (trypsin, chymotrypsin, thermolysin, and pepsin) and five types of additives (including organic solvents, chaotropes, and acid-labile surfactants). Surprisingly, we found that no additive was required when using a filter-aided sample preparation (FASP) format: the FASP method alone delivered high digestion efficiency and broad sequence coverage.
By integrating a retention time calibration mixture with hydrophobicity (HF) simulation, we identified an LC-MS “sweet spot” in the gradient that maximized our system’s ability to analyze the full diversity of hydrophobic and hydrophilic peptides derived from IMPs. This optimized strategy provides practical guidance for selecting the most effective protease and conditions for structural proteomics of membrane proteins.
There are still challenges and limitations of our developed protocol. First, chymotrypsin is a nonspecific protease. This introduces complexity to the peptide mixture and can complicate accurate determination of modification ratios. This downside, however, can be mitigated in two ways. (i) Despite its propensity to cleave at various sites, chymotrypsin displays a preference for specific residues (such as Trp, Tyr, Phe, and to a lesser extent Leu, Met, and His). This allows us to choose the most abundant peptide as representative to quantify the modification ratio. Furthermore, in structural analysis, the need for absolute peptide quantification is often unnecessary when the goal is to compare the same peptide from a protein in two different states. The systematic error resulting from non-specific digestion may cancel, provided that the modification doesn’t alter the digestion pattern. (ii) Most footprinting experiments are performed for an individual protein or protein complex. The identification of non-specifically cleaved peptides is readily manageable with modern software and instrumentation. Additionally, the fast speed of modern MS and high-resolution chromatography enable sufficient scanning space for confident peptide identification.
Another limitation pertains to the FASP approach. Although FASP has been described as a universal method enhancing membrane protein identification in proteomics, issues concerning peptide/protein loss were reported [52,53,62]. Furthermore, low MWCO filters may be clogged by protein aggregation or cell debris, and that will compromise the throughput of the method.
Currently, we have successively applied the approach to two IMPs systems with three different footprinting methods. Although the number of applications tried thus far is small, we anticipate that the protocol will be useful for other structural proteomic applications including other footprinting methods and cross-linking.
Supplementary Materials
The following supporting information can be downloaded at the website of this paper posted on Preprints., Figure S1: title; Table S1: title; Video S1: title.
Author Contributions
Conceptualization, M. Cheng. and M. L. Gross.; methodology, M. Cheng, W Li, and M. L. Gross; writing—original draft preparation, M. Cheng.; writing—review and editing, M. Cheng. W. Li. and M. L. Gross.; supervision, M. L. Gross.; funding acquisition, M. L. Gross and W. Li. All authors have read and agreed to the published version of the manuscript.
Acknowledgments
We thank Protein Metrics (PMI) [63] for the data processing software. This research was supported by the US NIH (5R01GM13100802 to W.L. and M.L.G.).
Conflicts of Interest
The authors declare no conflict of interest.
References
- Yin, H.; Flynn, A.D. Drugging Membrane Protein Interactions. Annu. Rev. Biomed. Eng. 2016, 18, 51–76. [Google Scholar] [CrossRef]
- Zhao, Q.; Wu, B.-l. Ice breaking in GPCR structural biology. Acta Pharmacol. Sin. 2012, 33, 324–334. [Google Scholar] [CrossRef]
- Keener, J.E.; Zhang, G.; Marty, M.T. Native Mass Spectrometry of Membrane Proteins. Anal. Chem. 2021, 93, 583. [Google Scholar] [CrossRef] [PubMed]
- Yang, H.-C.; Li, W.; Sun, J.; Gross, M.L. Advances in Mass Spectrometry on Membrane Proteins. Membranes 2023, 13, 457. [Google Scholar] [CrossRef] [PubMed]
- Sun, J.; Li, W.; Gross, M.L. Advances in mass spectrometry-based footprinting of membrane proteins. PROTEOMICS 2022, 22, 2100222. [Google Scholar] [CrossRef]
- Laganowsky, A.; Reading, E.; Hopper, J.T.S.; Robinson, C.V. Mass spectrometry of intact membrane protein complexes. Nat. Protocol 2013, 8, 639–651. [Google Scholar]
- Piersimoni, L.; Kastritis, P.L.; Arlt, C.; Sinz, A. Cross-Linking Mass Spectrometry for Investigating Protein Conformations and Protein–Protein Interactions─A Method for All Seasons. Chem. Rev. 2022, 122, 7500–7531. [Google Scholar]
- Liu, X.R.; Zhang, M.M.; Gross, M.L. Mass Spectrometry-Based Protein Footprinting for Higher-Order Structure Analysis: Fundamentals and Applications. Chem. Rev. 2020, 120, 4355. [Google Scholar] [CrossRef]
- Calabrese, A.N.; Radford, S.E. Mass spectrometry-enabled structural biology of membrane proteins. Methods 2018, 147, 187. [Google Scholar] [CrossRef]
- McKenzie-Coe, A.; Montes, N.S.; Jones, L.M. Hydroxyl Radical Protein Footprinting: A Mass Spectrometry-Based Structural Method for Studying the Higher Order Structure of Proteins. Chem. Rev. 2022, 122, 7532. [Google Scholar] [CrossRef]
- Whitelegge, J.P. Integral Membrane Proteins and Bilayer Proteomics. Anal. Chem. 2013, 85, 2558–2568. [Google Scholar] [CrossRef]
- Rabilloud, T. Membrane proteins and proteomics: Love is possible, but so difficult. ELECTROPHORESIS 2009, 30, S174–S180. [Google Scholar]
- Vit, O.; Petrak, J. Integral membrane proteins in proteomics. How to break open the black box? J. Proteomics. 2017, 153, 8–20. [Google Scholar] [PubMed]
- Dormeyer, W.; van Hoof, D.; Mummery, C.L.; Krijgsveld, J.; Heck, A.J.R. A practical guide for the identification of membrane and plasma membrane proteins in human embryonic stem cells and human embryonal carcinoma cells. PROTEOMICS 2008, 8, 4036. [Google Scholar] [PubMed]
- Waas, M.; Bhattacharya, S.; Chuppa, S.; Wu, X.; Jensen, D.R.; Omasits, U.; Wollscheid, B.; Volkman, B.F.; Noon, K.R.; Gundry, R.L. Combine and conquer: Surfactants, solvents, and chaotropes for robust mass spectrometry based analyses of membrane proteins. Anal. Chem. 2014, 86, 1551–1559. [Google Scholar] [CrossRef] [PubMed]
- Zhao, Q.; Fang, F.; Shan, Y.; Sui, Z.; Zhao, B.; Liang, Z.; Zhang, L.; Zhang, Y. In-Depth Proteome Coverage by Improving Efficiency for Membrane Proteome Analysis. Anal. Chem. 2017, 89, 5179–5185. [Google Scholar] [CrossRef]
- Zhao, Q.; Fang, F.; Liang, Y.; Yuan, H.; Yang, K.; Wu, Q.; Liang, Z.; Zhang, L.; Zhang, Y. 1-Dodecyl-3-methylimidazolium chloride-assisted sample preparation method for efficient integral membrane proteome analysis. Anal. Chem. 2014, 86, 7544–7550. [Google Scholar]
- Yu, Y.Q.; Gilar, M.; Lee, P.J.; Bouvier, E.S.; Gebler, J.C. Enzyme-friendly, mass spectrometry-compatible surfactant for in-solution enzymatic digestion of proteins. Anal. Chem. 2003, 75, 6023. [Google Scholar]
- Norris, J.L.; Porter, N.A.; Caprioli, R.M. Mass Spectrometry of Intracellular and Membrane Proteins Using Cleavable Detergents. Anal. Chem. 2003, 75, 6642. [Google Scholar] [CrossRef]
- Zhang, H.; Lin, Q.; Ponnusamy, S.; Kothandaraman, N.; Lim, T.K.; Zhao, C.; Kit, H.S.; Arijit, B.; Rauff, M.; Hew, C.-L.; et al. Differential recovery of membrane proteins after extraction by aqueous methanol and trifluoroethanol. PROTEOMICS 2007, 7, 1654–1663. [Google Scholar]
- Zhao, Q.; Liang, Y.; Yuan, H.; Sui, Z.; Wu, Q.; Liang, Z.; Zhang, L.; Zhang, Y. Biphasic microreactor for efficient membrane protein pretreatment with a combination of formic acid assisted solubilization, on-column pH adjustment, reduction, alkylation, and tryptic digestion. Anal. Chem. 2013, 85, 8507. [Google Scholar] [CrossRef]
- Ye, X.; Li, L. Microwave-assisted protein solubilization for mass spectrometry-based shotgun proteome analysis. Anal. Chem. 2012, 84, 6181–6191. [Google Scholar] [CrossRef]
- Lee, Y.H.; Tan, H.T.; Chung, M.C.M. Subcellular fractionation methods and strategies for proteomics. Proteomics 2010, 10, 3935–3956. [Google Scholar] [CrossRef] [PubMed]
- Zhou, Y.; Gao, J.; Zhu, H.; Xu, J.; He, H.; Gu, L.; Wang, H.; Chen, J.; Ma, D.; Zhou, H.; et al. Enhancing Membrane Protein Identification Using a Simplified Centrifugation and Detergent-Based Membrane Extraction Approach. Anal. Chem. 2018, 90, 2434–2439. [Google Scholar] [CrossRef] [PubMed]
- Fang, F.; Zhao, Q.; Sui, Z.; Liang, Y.; Jiang, H.; Yang, K.; Liang, Z.; Zhang, L.; Zhang, Y. Glycan Moieties as Bait to Fish Plasma Membrane Proteins. Anal. Chem. 2016, 88, 5065–5071. [Google Scholar] [CrossRef] [PubMed]
- Wollscheid, B.; Bausch-Fluck, D.; Henderson, C.; O’Brien, R.; Bibel, M.; Schiess, R.; Aebersold, R.; Watts, J.D. Mass-spectrometric identification and relative quantification of N-linked cell surface glycoproteins. Nat. Biotechnol. 2009, 27, 378–386. [Google Scholar]
- Zhao, Y.; Zhang, W.; Kho, Y.; Zhao, Y. Proteomic Analysis of Integral Plasma Membrane Proteins. Anal. Chem. 2004, 76, 1817. [Google Scholar] [CrossRef]
- Giannone, R.J.; Wurch, L.L.; Podar, M.; Hettich, R.L. Rescuing Those Left Behind: Recovering and Characterizing Underdigested Membrane and Hydrophobic Proteins To Enhance Proteome Measurement Depth. Anal. Chem. 2015, 87, 7720–7728. [Google Scholar] [CrossRef]
- Reid, D.J.; Dash, T.; Wang, Z.; Aspinwall, C.A.; Marty, M.T. Investigating Daptomycin–Membrane Interactions Using Native MS and Fast Photochemical Oxidation of Peptides in Nanodiscs. Anal. Chem. 2023, 95, 4984–4991. [Google Scholar] [CrossRef]
- Angel, T.E.; Gupta, S.; Jastrzebska, B.; Palczewski, K.; Chance, M.R. Structural waters define a functional channel mediating activation of the GPCR, rhodopsin. Proc. Natl. Acad. Sci. USA 2009, 106, 14367. [Google Scholar] [CrossRef]
- Pan, Y.; Ruan, X.; Valvano, M.A.; Konermann, L. Validation of membrane protein topology models by oxidative labeling and mass spectrometry. J Am Soc Mass Spectrom 2012, 23, 889. [Google Scholar] [CrossRef]
- Watkinson, T.G.; Calabrese, A.N.; Ault, J.R.; Radford, S.E.; Ashcroft, A.E. FPOP-LC-MS/MS Suggests Differences in Interaction Sites of Amphipols and Detergents with Outer Membrane Proteins. J. Am. Soc. Mass. Spectrom. 2017, 28, 50. [Google Scholar]
- Wen, J.; Zhang, H.; Gross, M.L.; Blankenship, R.E. Membrane orientation of the FMO antenna protein from Chlorobaculum tepidum as determined by mass spectrometry-based footprinting. Proc. Natl. Acad. Sci. USA 2009, 106, 6134–6139. [Google Scholar] [CrossRef]
- Manzi, L.; Barrow, A.S.; Hopper, J.T.S.; Kaminska, R.; Kleanthous, C.; Robinson, C.V.; Moses, J.E.; Oldham, N.J. Carbene Footprinting Reveals Binding Interfaces of a Multimeric Membrane-Spanning Protein. Angew. Chem. Int. Ed. Engl. 2017, 56, 14873. [Google Scholar] [CrossRef]
- Pan, X.; Vachet, R.W. MEMBRANE PROTEIN STRUCTURES AND INTERACTIONS FROM COVALENT LABELING COUPLED WITH MASS SPECTROMETRY. Mass Spectrom Rev 2022, 41, 51–69. [Google Scholar] [CrossRef] [PubMed]
- Kirsch, Z.J.; Blake, J.M.; Huynh, U.; Agrohia, D.K.; Tremblay, C.Y.; Graban, E.M.; Vaughan, R.C.; Vachet, R.W. Membrane Protein Binding Interactions Studied in Live Cells via Diethylpyrocarbonate Covalent Labeling Mass Spectrometry. Anal. Chem. 2023, 95, 7178. [Google Scholar] [CrossRef] [PubMed]
- Cheng, M.; Zhang, B.; Cui, W.; Gross, M.L. Laser-Initiated Radical Trifluoromethylation of Peptides and Proteins: Application to Mass-Spectrometry-Based Protein Footprinting. Angew. Chem. Int. Ed. 2017, 56, 14007. [Google Scholar] [CrossRef] [PubMed]
- Sun, J.; Saimi, M.; Rempel, D.; Cao, Q.; Chai, M.; Li, W.; Gross, M.L. In-Cell Fast Photochemical Oxidation Interrogates the Native Structure of Integral Membrane Proteins. Angew. Chem. Int. Ed. 2025, n/a, e202424779. [Google Scholar] [CrossRef]
- Zhang, X.; Chien, E.Y.T.; Chalmers, M.J.; Pascal, B.D.; Gatchalian, J.; Stevens, R.C.; Griffin, P.R. Dynamics of the β2-Adrenergic G-Protein Coupled Receptor Revealed by Hydrogen−Deuterium Exchange. Anal. Chem. 2010, 82, 1100–1108. [Google Scholar]
- Möller, I.R.; Slivacka, M.; Hausner, J.; Nielsen, A.K.; Pospíšilová, E.; Merkle, P.S.; Lišková, R.; Polák, M.; Loland, C.J.; Kádek, A.; et al. Improving the Sequence Coverage of Integral Membrane Proteins during Hydrogen/Deuterium Exchange Mass Spectrometry Experiments. Anal. Chem. 2019, 91, 10970–10978. [Google Scholar] [CrossRef]
- Martens, C.; Shekhar, M.; Borysik, A.J.; Lau, A.M.; Reading, E.; Tajkhorshid, E.; Booth, P.J.; Politis, A. Direct protein-lipid interactions shape the conformational landscape of secondary transporters. Nat. Commun 2018, 9, 4151. [Google Scholar] [CrossRef]
- Calvaresi, V.; Redsted, A.; Norais, N.; Rand, K.D. Hydrogen–Deuterium Exchange Mass Spectrometry with Integrated Size-Exclusion Chromatography for Analysis of Complex Protein Samples. Anal. Chem. 2021, 93, 11406–11414. [Google Scholar] [CrossRef]
- Zhou, F.; Yang, Y.; Chemuru, S.; Cui, W.; Liu, S.; Gross, M.; Li, W. Footprinting Mass Spectrometry of Membrane Proteins: Ferroportin Reconstituted in Saposin A Picodiscs. Anal. Chem. 2021, 93, 11370. [Google Scholar] [CrossRef]
- Shen, G.; Cui, W.; Zhang, H.; Zhou, F.; Huang, W.; Liu, Q.; Yang, Y.; Li, S.; Bowman, G.R.; Sadler, J.E.; et al. Warfarin traps human vitamin K epoxide reductase in an intermediate state during electron transfer. Nat. Struct. Mol. Biol. 2017, 24, 69–76. [Google Scholar] [CrossRef] [PubMed]
- Zhou, Y.; Wu, Y.; Yao, M.; Liu, Z.; Chen, J.; Chen, J.; Tian, L.; Han, G.; Shen, J.-R.; Wang, F. Probing the Lysine Proximal Microenvironments within Membrane Protein Complexes by Active Dimethyl Labeling and Mass Spectrometry. Anal. Chem. 2016, 88, 12060–12065. [Google Scholar] [CrossRef] [PubMed]
- Wiśniewski, J.R.; Zougman, A.; Nagaraj, N.; Mann, M. Universal sample preparation method for proteome analysis. Nat Methods 2009, 6, 359–362. [Google Scholar] [CrossRef] [PubMed]
- Cheng, M.; Guo, C.; Li, W.; Gross, M.L. Free-Radical Membrane Protein Footprinting by Photolysis of Perfluoroisopropyl Iodide Partitioned to Detergent Micelle by Sonication. Angew. Chem. Int. Ed. 2021, 60, 8867. [Google Scholar] [CrossRef]
- Sun, J.; Li, S.; Li, W.; Gross, M.L. Carbocation Footprinting of Soluble and Transmembrane Proteins. Anal. Chem. 2021, 93, 13101. [Google Scholar] [CrossRef]
- Sun, J.; Liu, X.R.; Li, S.; He, P.; Li, W.; Gross, M.L. Nanoparticles and photochemistry for native-like transmembrane protein footprinting. Nat. Commun. 2021, 12, 7270. [Google Scholar] [CrossRef]
- Guo, C.; Cheng, M.; Li, W.; Gross, M.L. Diethylpyrocarbonate Footprints a Membrane Protein in Micelles. J. Am. Soc. Mass Spectrom. 2021, 32, 2636. [Google Scholar] [CrossRef]
- Wiśniewski, J.R. Chapter Two - Filter-Aided Sample Preparation: The Versatile and Efficient Method for Proteomic Analysis. In Methods in Enzymology; Shukla, A.K., Ed.; Academic Press: Amsterdam, The Netherlands, 2017; Volume 585, pp. 15–27. [Google Scholar]
- Manza, L.L.; Stamer, S.L.; Ham, A.-J.L.; Codreanu, S.G.; Liebler, D.C. Sample preparation and digestion for proteomic analyses using spin filters. PROTEOMICS 2005, 5, 1742–1745. [Google Scholar] [CrossRef] [PubMed]
- Wiśniewski, J.R.; Zougman, A.; Nagaraj, N.; Mann, M. Universal sample preparation method for proteome analysis. Nat. Methods 2009, 6, 359–362. [Google Scholar] [CrossRef] [PubMed]
- Han, J.; Schey, K.L. Proteolysis and Mass Spectrometric Analysis of an Integral Membrane: Aquaporin 0. J. Proteome. Res. 2004, 3, 807. [Google Scholar] [CrossRef] [PubMed]
- López-Ferrer, D.; Petritis, K.; Robinson, E.W.; Hixson, K.K.; Tian, Z.; Lee, J.H.; Lee, S.-W.; Tolić, N.; Weitz, K.K.; Belov, M.E.; et al. Pressurized Pepsin Digestion in Proteomics. Mol. Cell. Proteomics. 2011, 10, M110.001479. [Google Scholar] [CrossRef]
- Brown, K.A.; Wilson, D.J. Bottom-up hydrogen deuterium exchange mass spectrometry: Data analysis and interpretation. Analyst 2017, 142, 2874. [Google Scholar] [CrossRef]
- Blonder, J.; Rodriguez-Galan, M.C.; Chan, K.C.; Lucas, D.A.; Yu, L.-R.; Conrads, T.P.; Issaq, H.J.; Young, H.A.; Veenstra, T.D. Analysis of Murine Natural Killer Cell Microsomal Proteins Using Two-Dimensional Liquid Chromatography Coupled to Tandem Electrospray Ionization Mass Spectrometry. J. Proteome Res. 2004, 3, 862. [Google Scholar] [CrossRef]
- Yu, Y.-Q.; Gilar, M.; Lee, P.J.; Bouvier, E.S.P.; Gebler, J.C. Enzyme-Friendly, Mass Spectrometry-Compatible Surfactant for In-Solution Enzymatic Digestion of Proteins. Anal. Chem. 2003, 75, 6023–6028. [Google Scholar] [CrossRef]
- Pop, C.; Mogosan, C.; Loghin, F. Evaluation of Rapigest Efficacy for the Digestion of Proteins from Cell Cultures and Heart Tissue. Clujul Med 2014, 87, 258–262. [Google Scholar] [CrossRef]
- Li, W.; Schulman, S.; Dutton, R.J.; Boyd, D.; Beckwith, J.; Rapoport, T.A. Structure of a bacterial homologue of vitamin K epoxide reductase. Nature 2010, 463, 507. [Google Scholar] [CrossRef]
- Mitra, S.K.; Gantt, J.A.; Ruby, J.F.; Clouse, S.D.; Goshe, M.B. Membrane Proteomic Analysis of Arabidopsis thaliana Using Alternative Solubilization Techniques. J. Proteome. Res. 2007, 6, 1933–1950. [Google Scholar] [CrossRef]
- Wiśniewski, J.R.; Zielinska, D.F.; Mann, M. Comparison of ultrafiltration units for proteomic and N-glycoproteomic analysis by the filter-aided sample preparation method. Anal. Biochem. 2011, 410, 307–309. [Google Scholar] [CrossRef]
- Bern, M.; Cai, Y.; Goldberg, D. Lookup Peaks: A Hybrid of de Novo Sequencing and Database Search for Protein Identification by Tandem Mass Spectrometry. Anal. Chem. 2007, 79, 1393–1400. [Google Scholar] [CrossRef]
Figure 1.
A. Schematic of in-gel digestion for IMPs. After affinity purification, the IMPs are enriched by using trichloroacetic acid (TCA) precipitation. Subsequent steps include electrophoresis and in-gel digestion to generate peptide fragments, followed by LCMS analysis. The entire workflow typically spans 3-4 days. B. Schematic of IMPs digestion using FASP. IMPs are washed with 8 M urea to dissociate lipids or detergents from vesicles. Alkylation of IMPs is performed in the presence of urea, followed by buffer exchange. The denatured IMPs are then digested to produce peptides suitable for LCMS analysis. The workflow can be completed within 1 day.
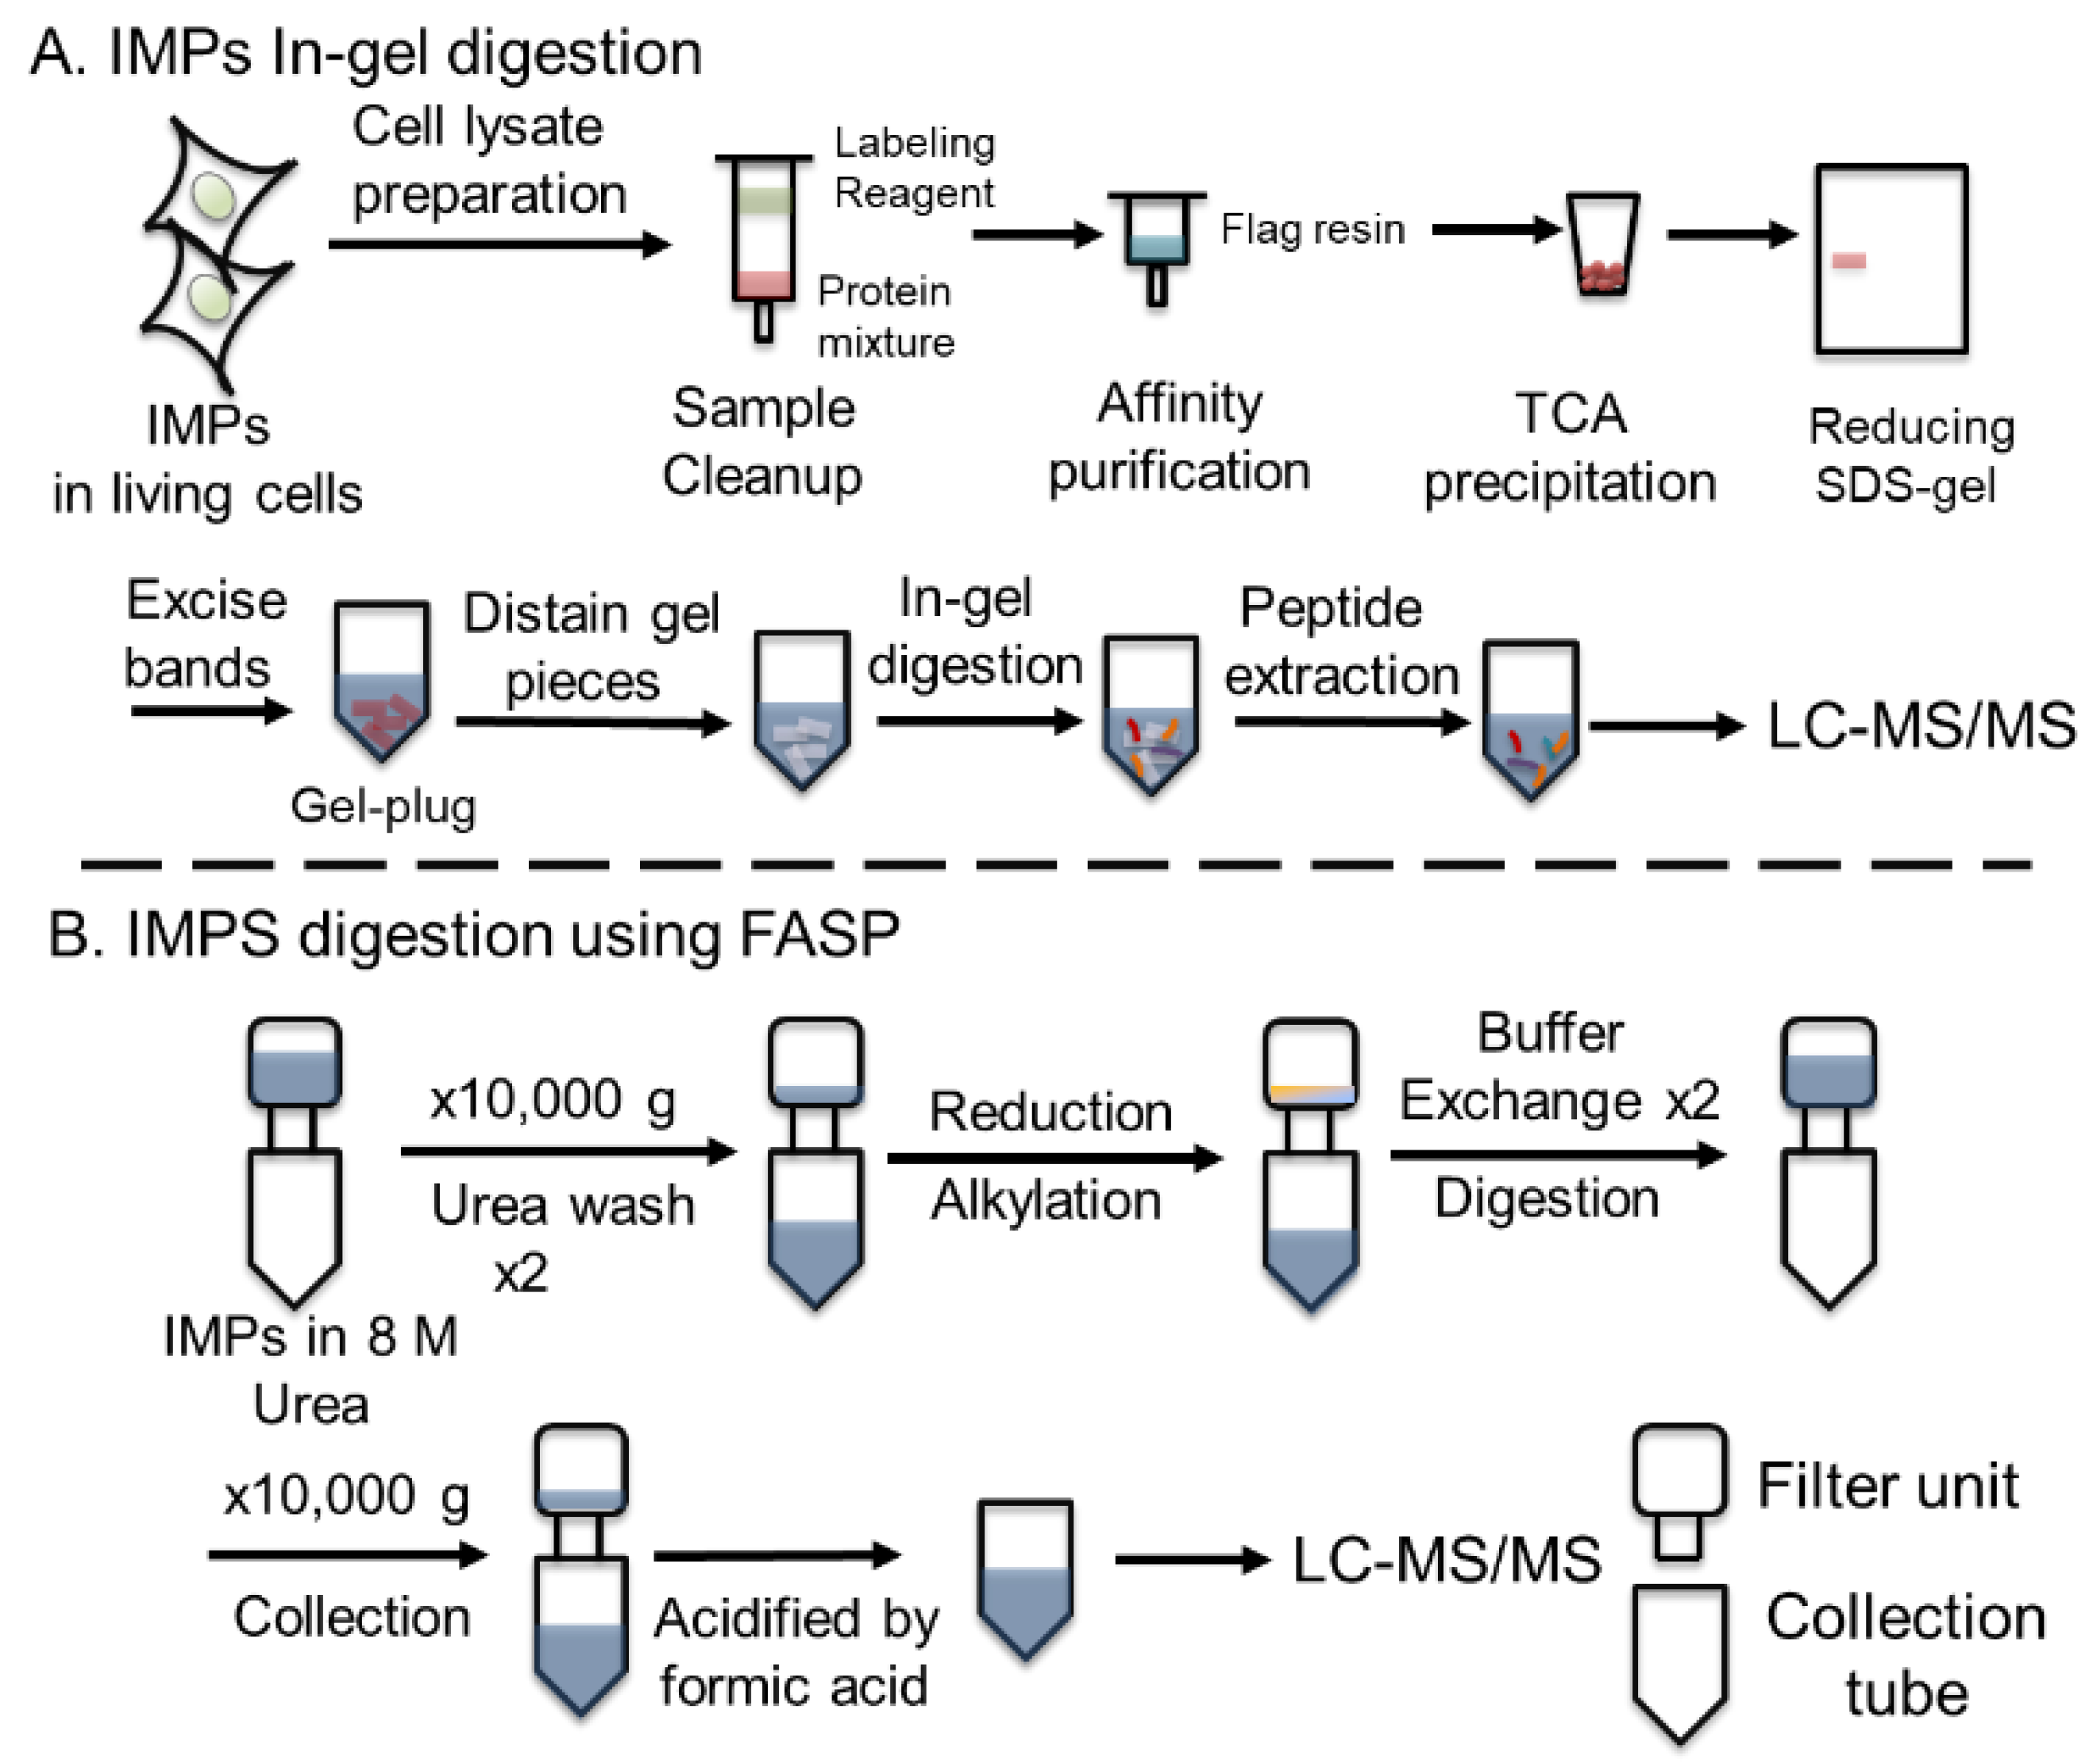
Figure 2.
Mapping of tryptic cleavage sites (Arg and Lys) on the membrane protein VKOR crystal structure (PDB 3KP9). Tryptic residues in VKOR are found predominantly on the outer membrane Trx domain, the membrane interface, and the cytoplasmic side of the membrane, whereas the long α-helices in TMs is devoid of such tryptic cleavage sites.
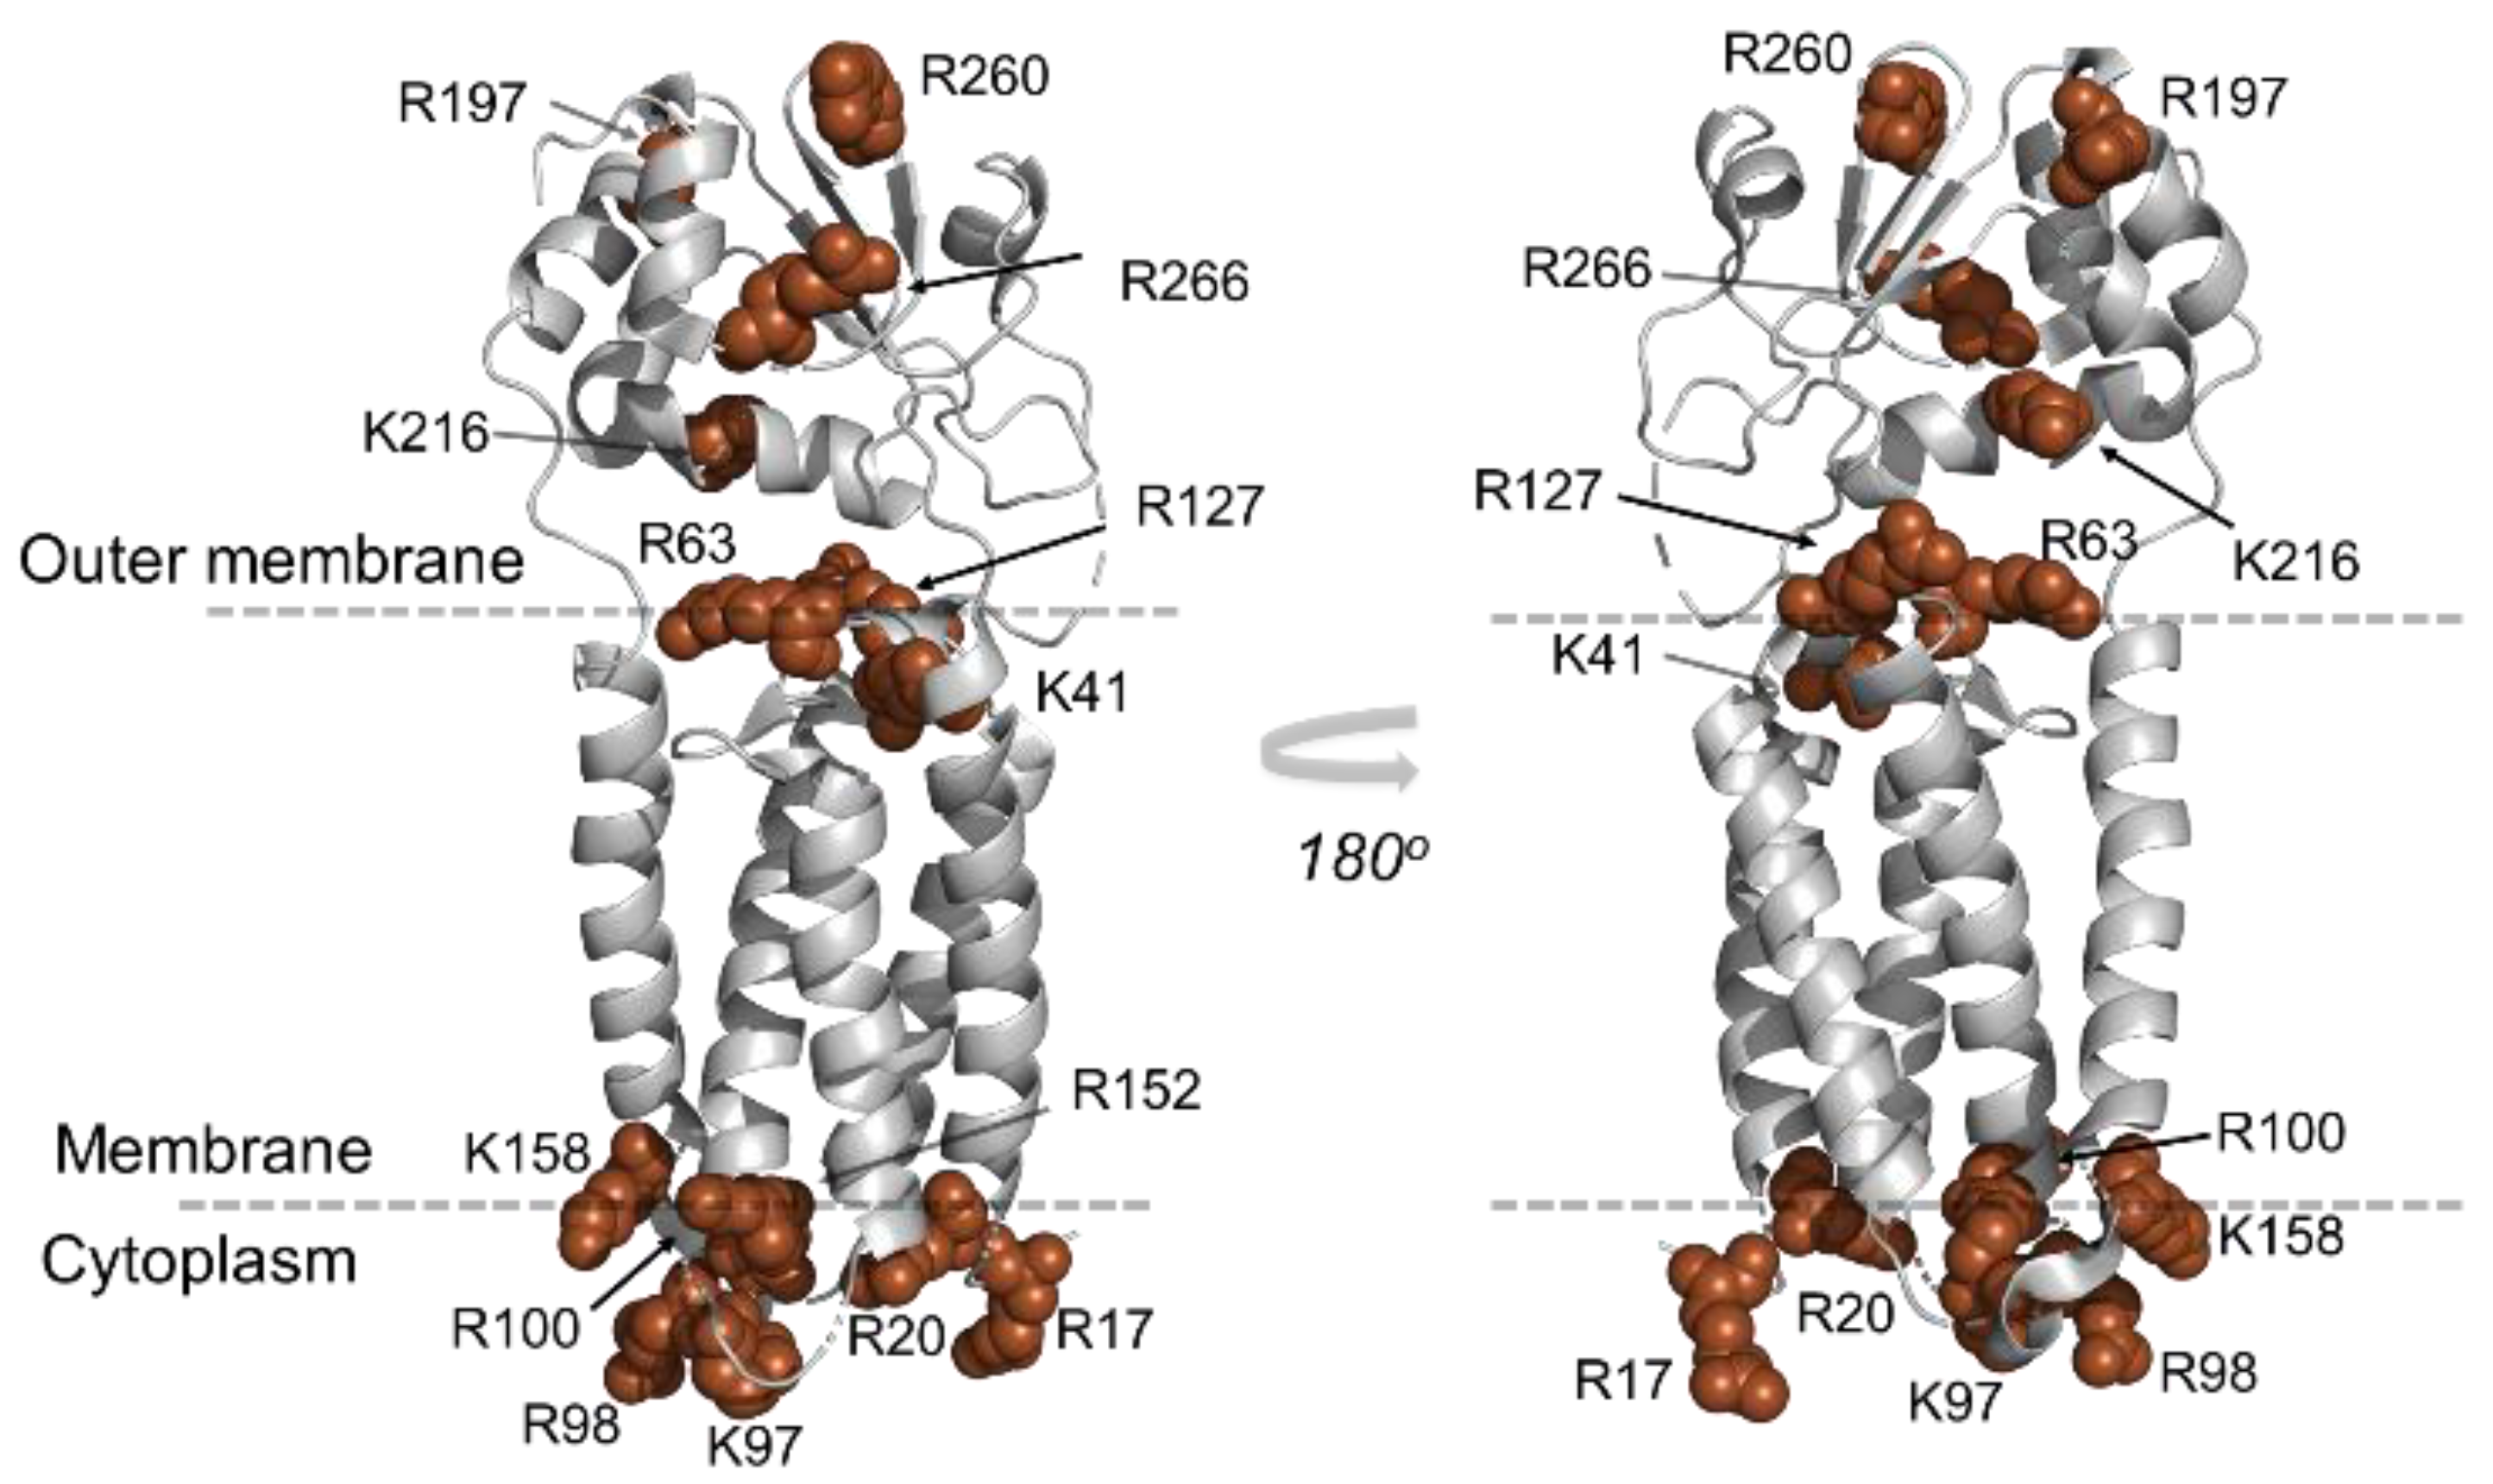
Figure 3.
Screen of proteases (top) and additives (bottom) for digestion coverage of an IMP. A specific enzyme (e.g., trypsin) generates the lowest number of unique peptides, whereas nonspecific enzymes generate the highest number (e.g., themolysin, chymotrypsin, and pepsin); The use of additives did not improve sequence coverage. Specifically, chymotryptic digestion yielded the highest coverage 94.4% with no additives, 88.3% coverage with 10% TFE, 89.4% coverage with 0.1% RapiGest, and 84.5% coverage with ProteaseMAX. The coverage decreased to 79.3% when 2 M urea was employed.
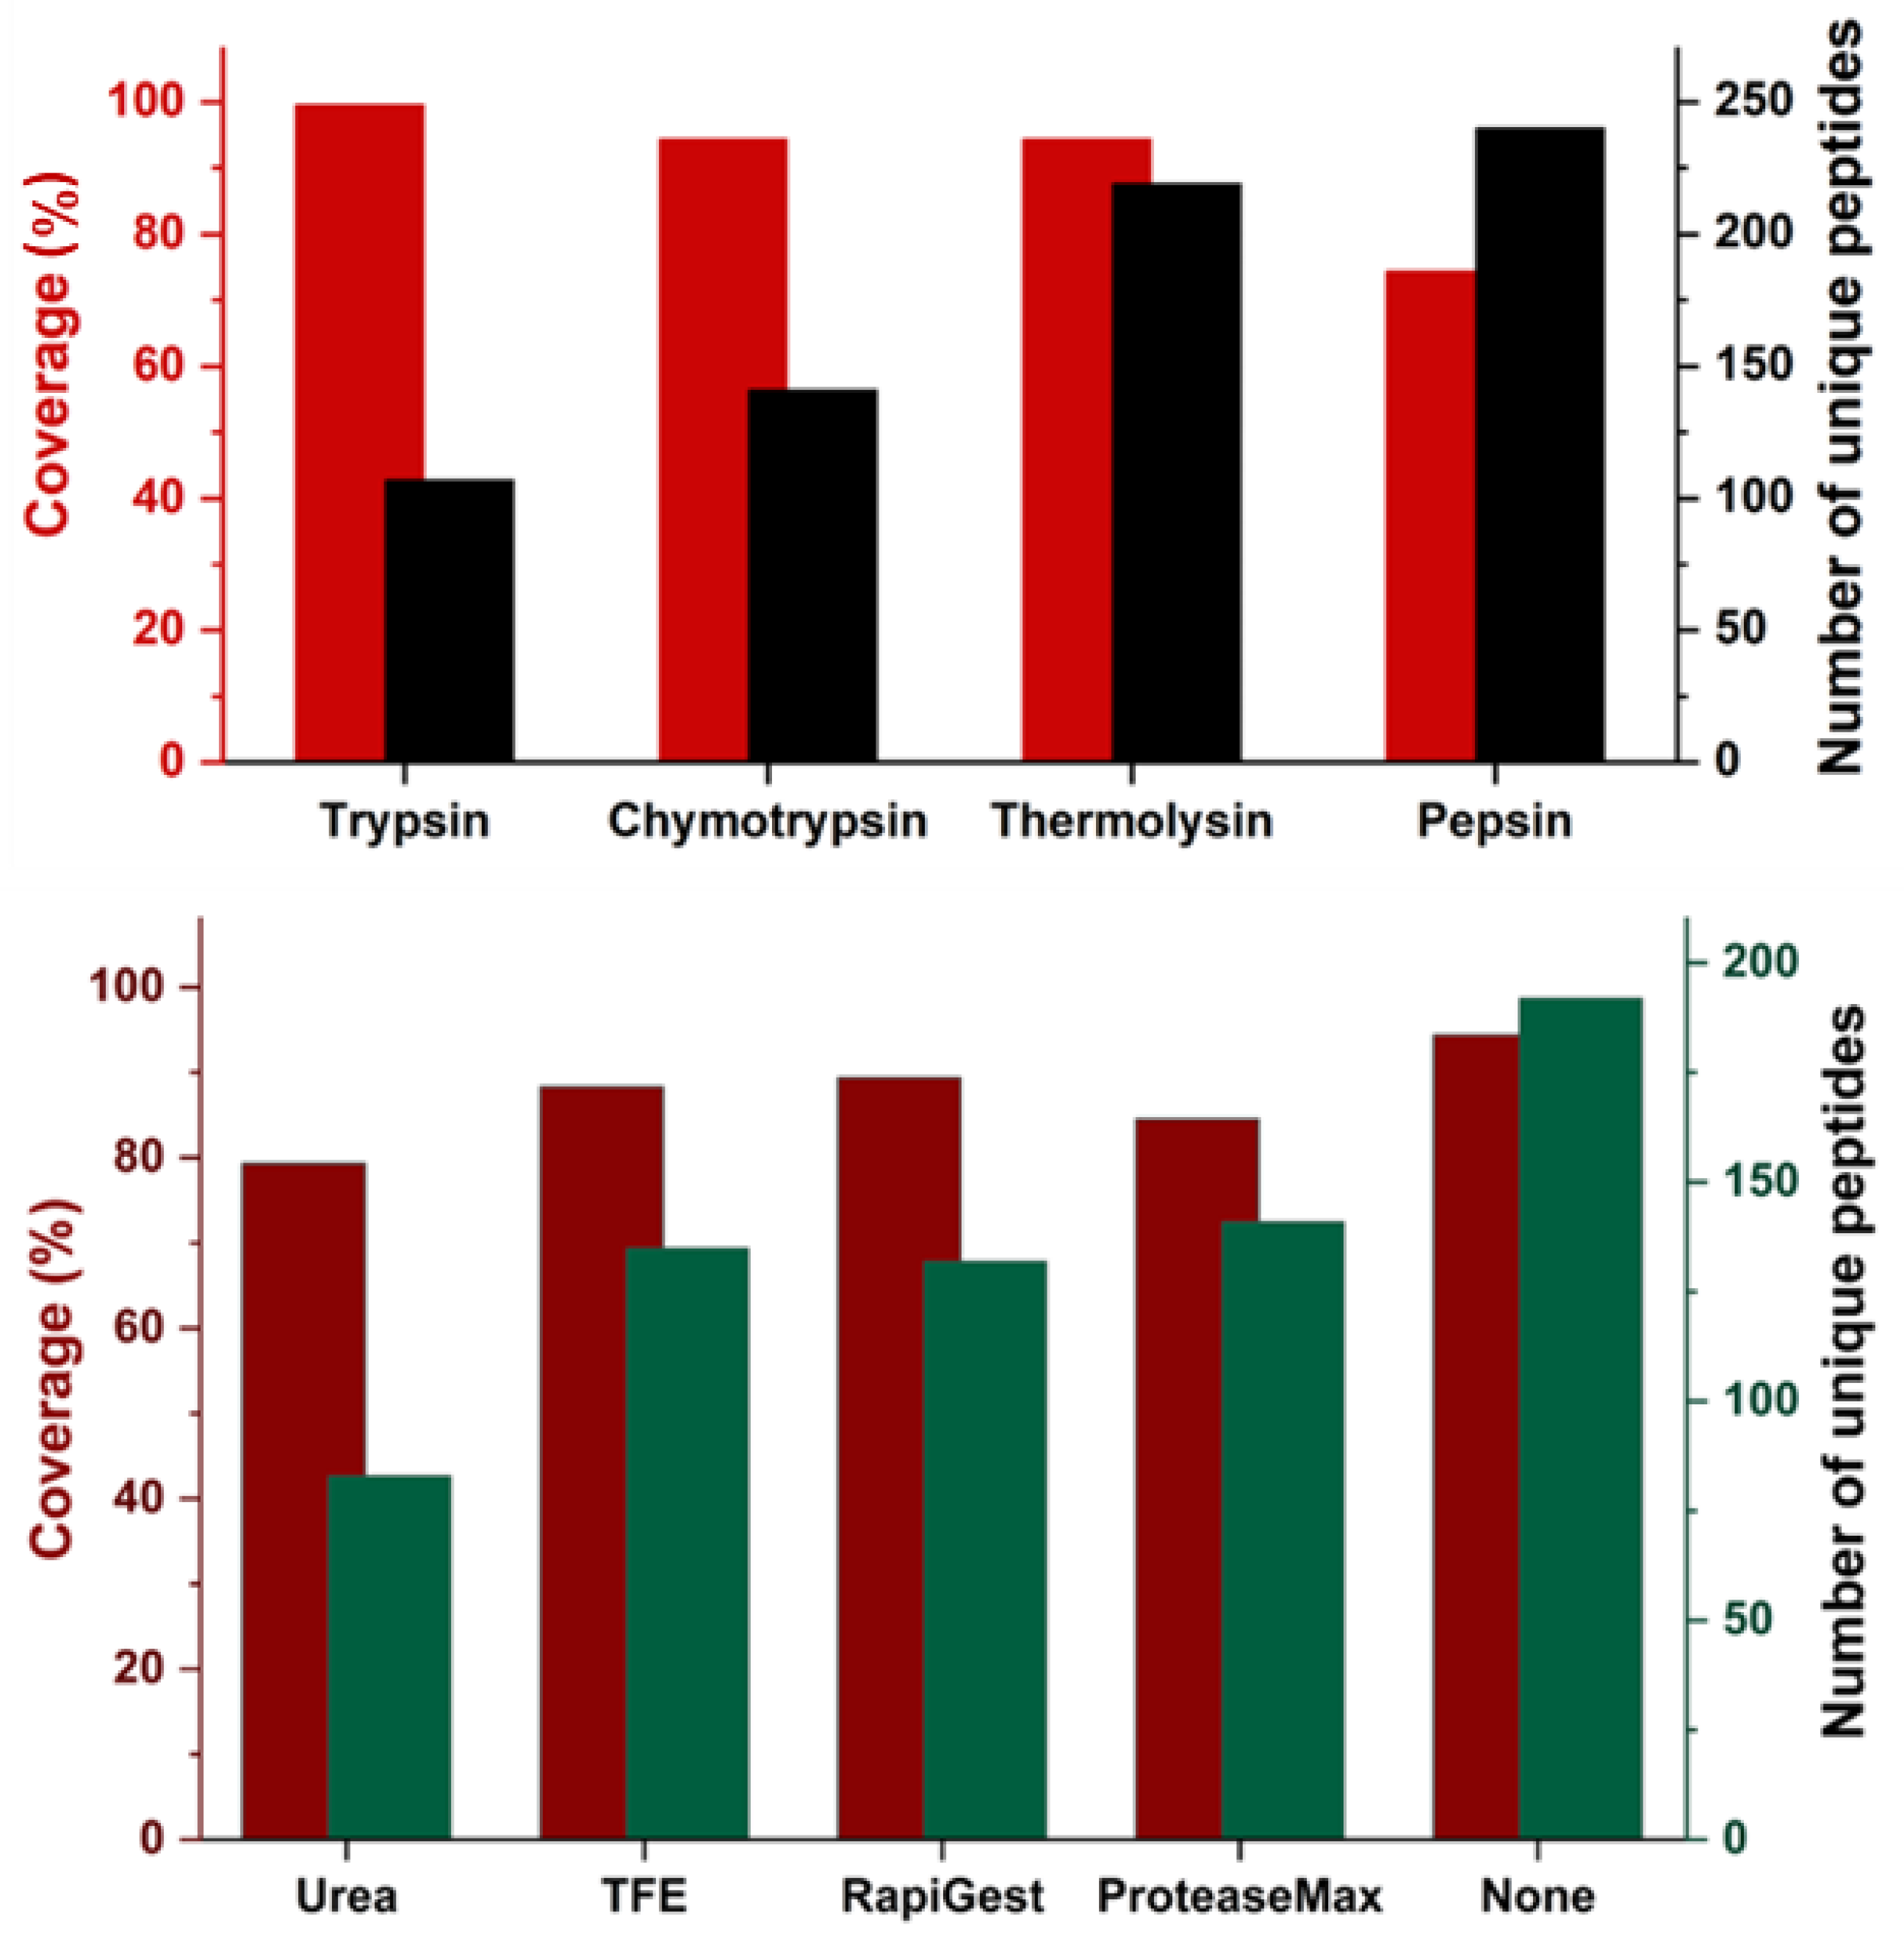
Figure 5.
Identification of the “sweet spot” for transmembrane peptide detection. Peptide A and B are the most hydrophilic and most hydrophobic peptides, respectively, from pierce peptide retention time calibration mixture. The calculation defines a “sweet spot” between the blue line (maximum hydrophobic line defined by peptide D) and red line (maximum hydrophilic line defined by peptide A). We consider the HF for most detected peptides from transmembrane as the “sweet spot”.
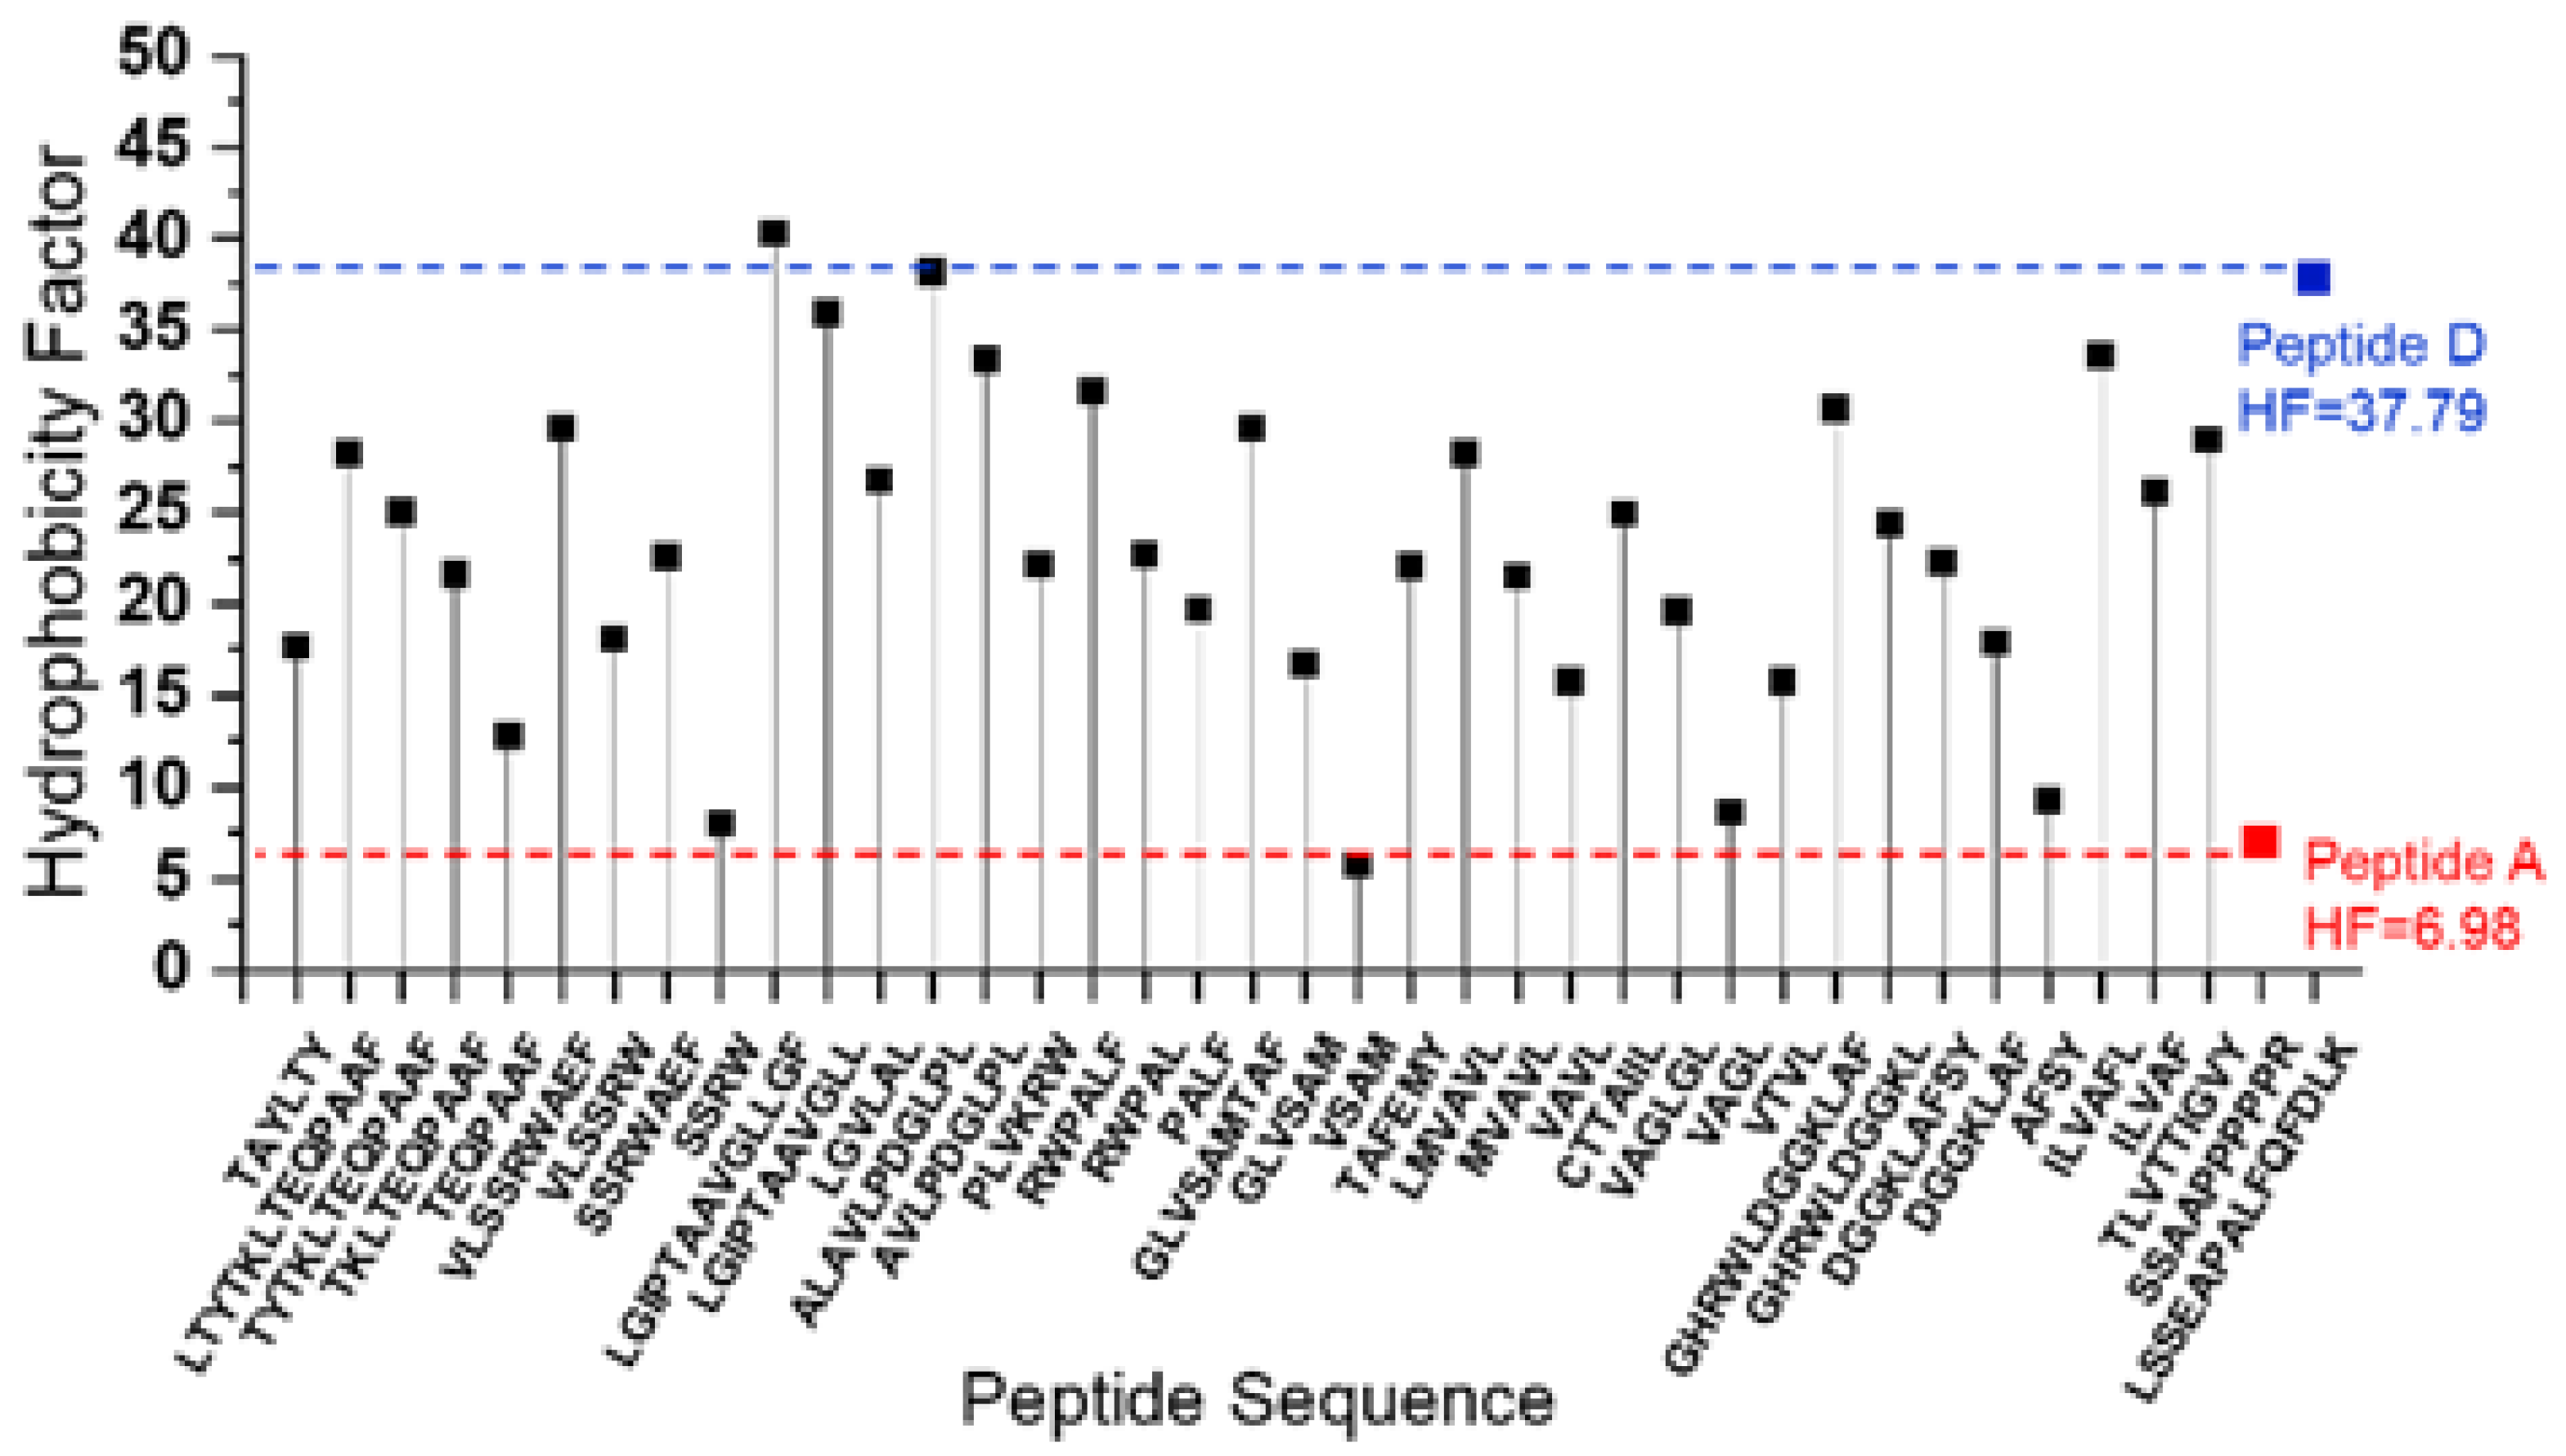
Figure 6.
A. The sample loading valve system operates in two modes. In the desalting mode, the sample is directed to a desalting column connected to waste, effectively removing salts, contaminants, and hydrophilic peptides. After desalting, the system shifts to the gradient mode where the HPLC pump moves the analyte from the desalting column to the analytical column for peptide separation and mass analysis. B. The peptide signal intensity is shown corresponding to acetonitrile percentage. A (HF = 7.0) and B(HF =11.8) represent the two most hydrophilic peptides in PRTC, while C(HF = 36.1) and D(HF = 37.8) represent the two most hydrophobic peptides in PRTC.
Disclaimer/Publisher’s Note: The statements, opinions and data contained in all publications are solely those of the individual author(s) and contributor(s) and not of MDPI and/or the editor(s). MDPI and/or the editor(s) disclaim responsibility for any injury to people or property resulting from any ideas, methods, instructions or products referred to in the content. |
© 2025 by the authors. Licensee MDPI, Basel, Switzerland. This article is an open access article distributed under the terms and conditions of the Creative Commons Attribution (CC BY) license (https://creativecommons.org/licenses/by/4.0/).
Copyright: This open access article is published under a Creative Commons CC BY 4.0 license, which permit the free download, distribution, and reuse, provided that the author and preprint are cited in any reuse.


