
Submitted:
25 November 2025
Posted:
26 November 2025
You are already at the latest version
Abstract
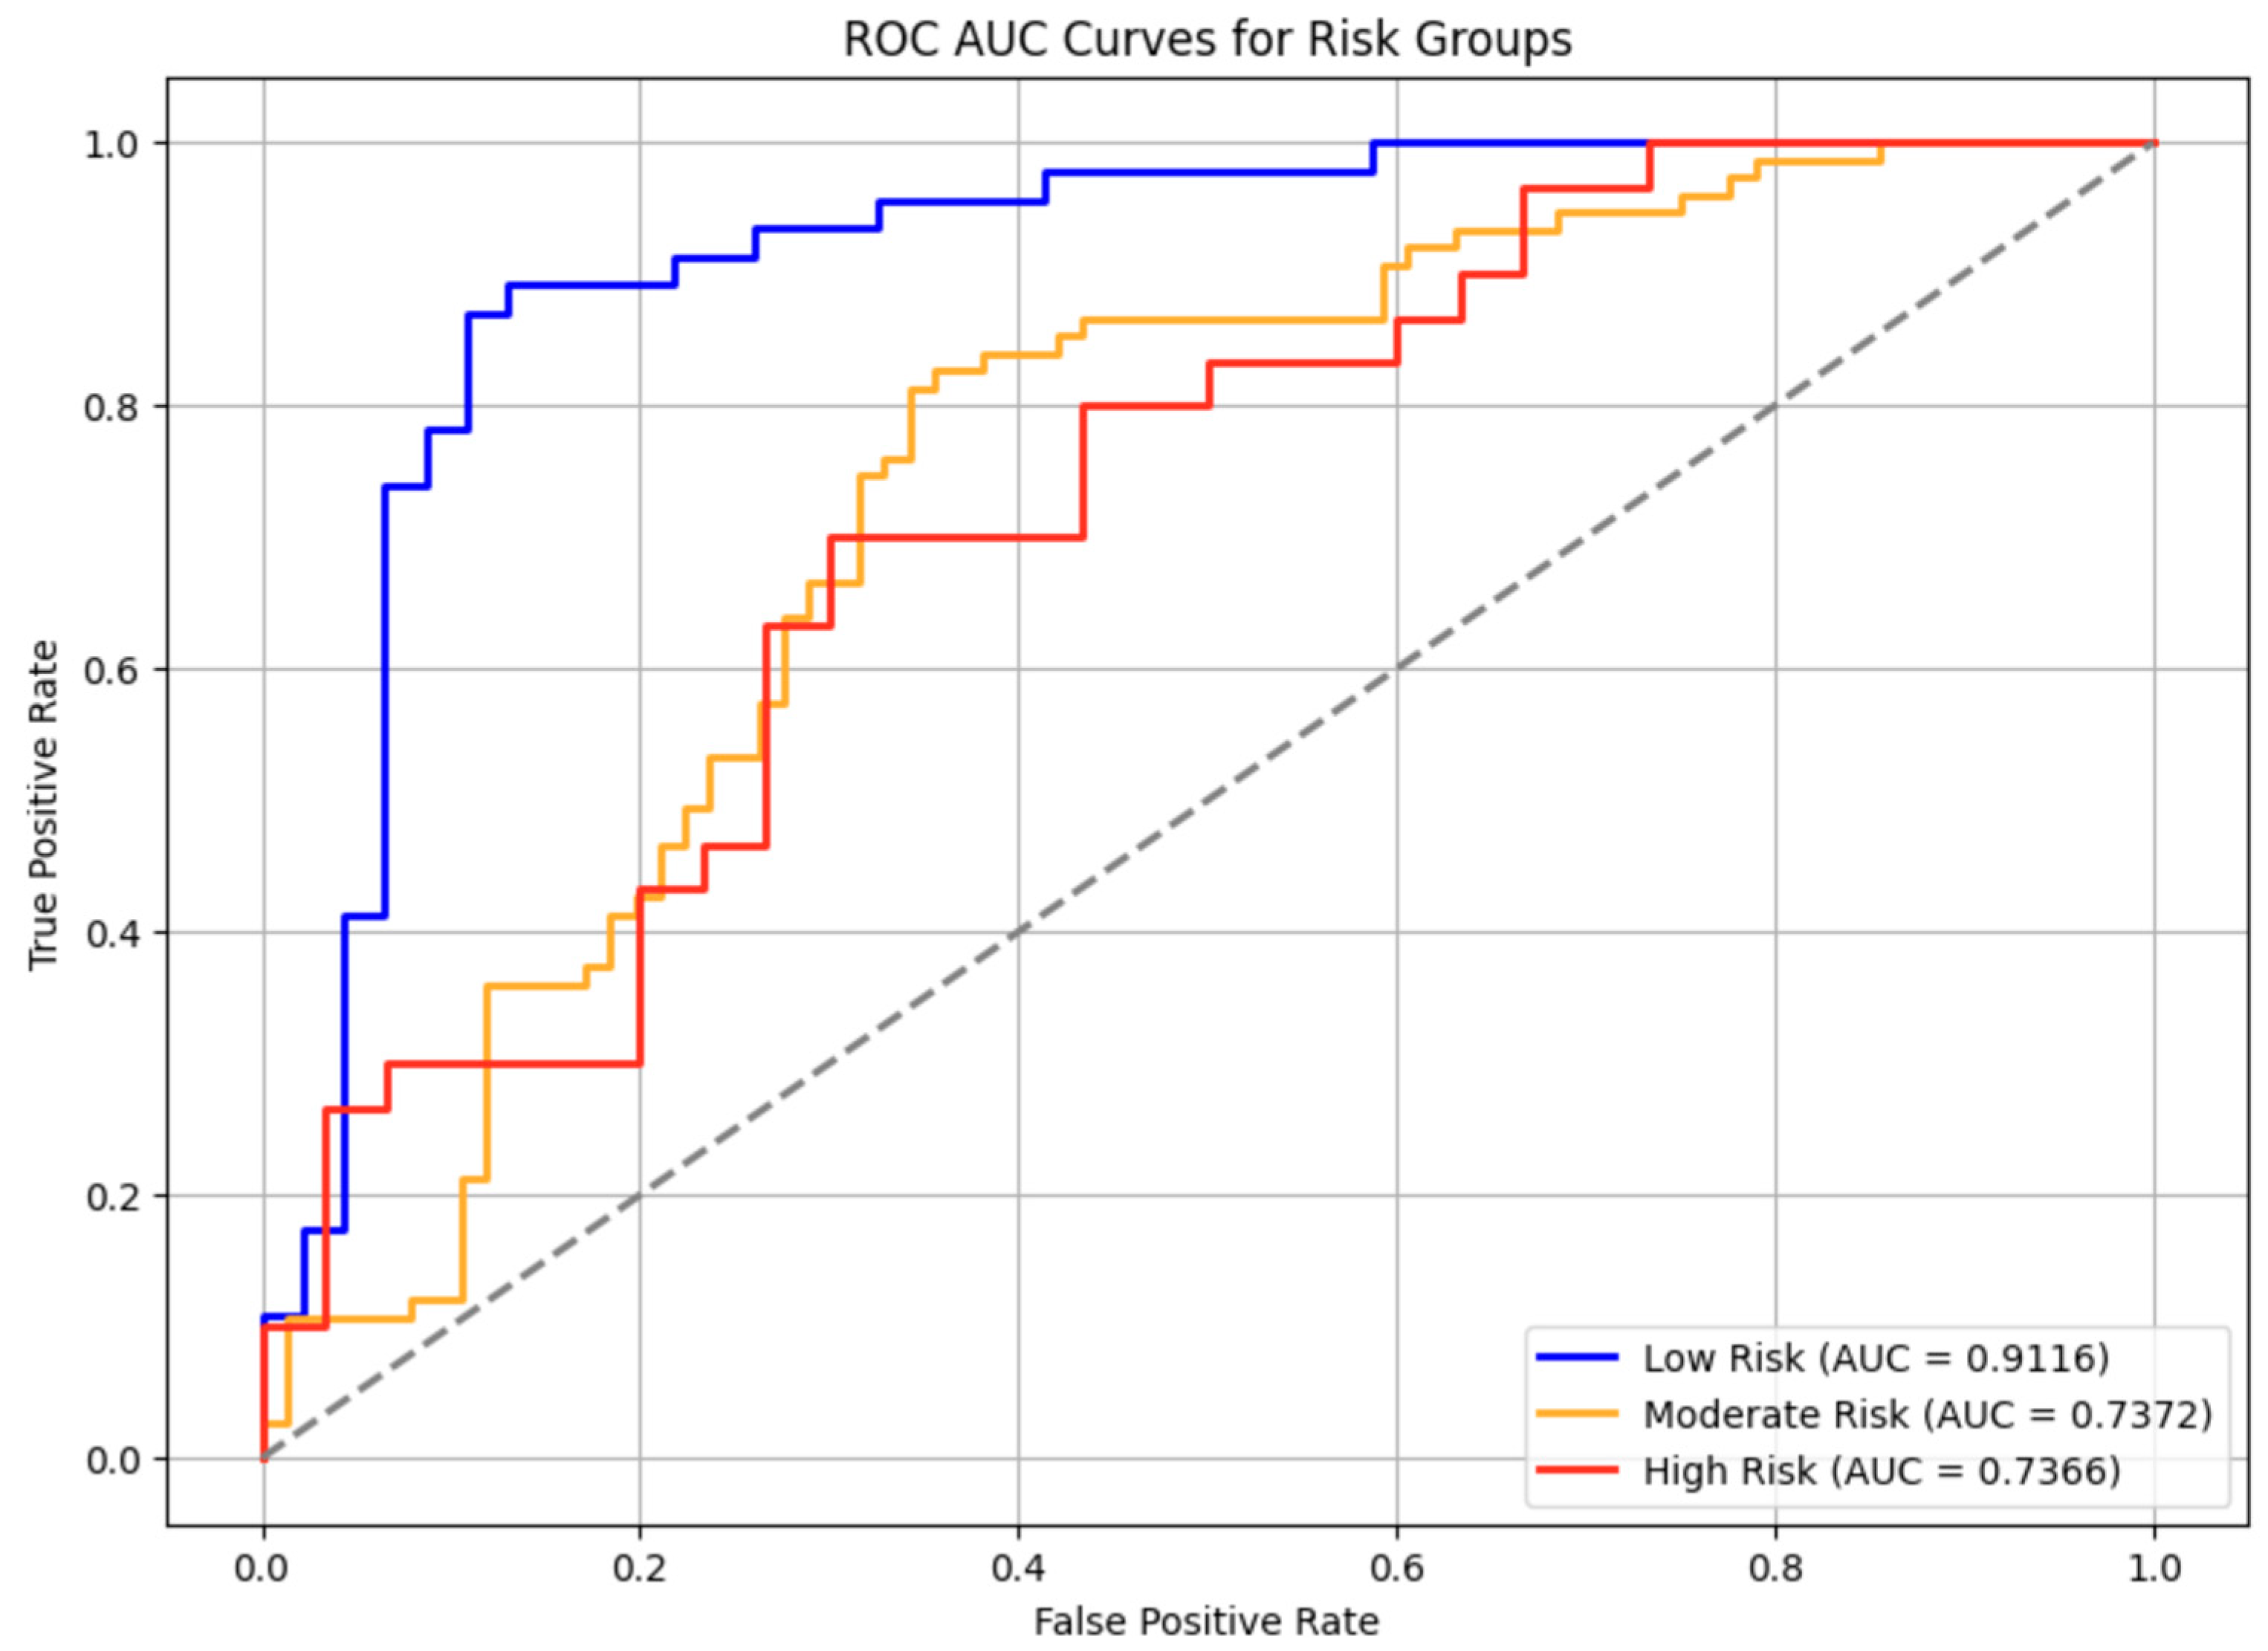
Both hereditary and clinical risk factors influence development of T2D. Currently a rich body of research exists about the effect of the clinical factors on T2D, but less is known about how genetic factors influence the development of T2D. Therefore, we used an AI trained ML algorithm to better understand how genetic variants influence the development of T2D in the presence of high, moderate, and low risk clinical factors.We collected genetic and clinical risk factor data sets from publicly available sources. We probabilistically assigned genetic variants from our genetic dataset to the individuals in the clinical dataset to form a single dataset containing both clinical and genetic risk factors. The combined data set was then trained on XGBoost XGBClassifier. SHAP Summary plots were also generated for each risk group after model training. The model’s predictive performance (AUC scores) achieved highest accuracy with the low-risk group, while the moderate and high-risk groups performed slightly lower. According to the SHAP plots, both BMI and family history are key predictors of T2D across all risk groups. However, SNP effect sizes were more influential than other clinical risk factors, indicating that genetic contributions, while secondary, were still relevant. ROC curves assess the model’s ability to predict diabetes cases across risk groups. All models performed above the 0.7 AUC threshold, with the low risk group having an AUC score of 0.9116, the medium risk group AUC score being 0.7372, and the high risk group AUC score being 0.7366. indicating they are clinically applicable and not affected by assignment of genetic variables. While genetic treatments for diabetes remain experimental, our work supports emerging advancements in pharmacogenomics and gene-based therapies by helping to identify which patients may benefit from specific drug regimens including gene-based interventions.
Keywords:
type 2 diabetes (T2D)
; machine learning
; XGBoost
; genetic risk factors
; clinical risk factors
; single nucleotide polymorphisms (SNPs)
; GWAS
; SHAP analysis
; risk stratification
; predictive modeling
; synthetic cohort construction
; ROC-AUC
; KNN imputation
; SMOTE
1. Introduction
Type 2 Diabetes (T2D) is a disease that affects around 462 million people each year [2]. Although T2D can be treated by diet changes, blood sugar modulation, and various medications, there is no definitive cure [3]. Additionally, the risk factors for T2D range from clinical components like BMI, blood pressure and skin thickness to genetics, which makes the risk of T2D unique to a person’s circumstances [3]. As a result, prediction efforts for T2D have been limited to measuring these clinical risk factors like A1C or BMI without consideration for genetic predisposition, which can be quite inaccurate as the heritability for T2D is estimated to be upwards of 70% [4].
With the recent development of artificial intelligence (AI), researchers have started to analyze single nucleotide polymorphisms (SNPs) associated with diabetes using data from genome-wide association studies (GWAS). However, the integration with clinical risk factors in these prediction models has been limited, often using only one or two environmental statistics, if any. Additionally, exploring different stratification metrics to maximize the predictive capability and accuracy of the model has been explored in previous research [5]. These metrics for stratification include age of onset and BMI.
In this study, we aim to train a more complex prediction model for type 2 diabetes by integrating data obtained from GWAS with a larger variety of clinical risk factors, including age, BMI, blood pressure, skin thickness, number of pregnancies, and the Diabetes Pedigree Function (DPF). The inclusion of the DPF addresses the contribution of inherited risk not captured by individual SNPs. Additionally, we stratified the data by risk group calculated individually based solely on the environmental risk factors using an initial XGBoost model. Thus, we were able to incorporate all of these statistics in our stratification metric instead of arbitrarily choosing one like age or BMI. Next, we used probabilistic assignment to integrate GWAS-derived allele frequencies with our clinical dataset, assigning to each individual in each risk group the most likely genetic variant profile based on calculated effect sizes. Finally, we trained the final machine learning model to incorporate all these factors and investigated its accuracy and reliability using AUC on test and training sets.
2. Materials and Methods
We employed a multi-stage computational approach to train and evaluate machine learning models to predict Type 2 Diabetes (T2D) with both clinical risk factors and synthetic genetic data [6]. This research consisted of four main stages, the first being data acquisition and synthetic cohort construction, the second being data preprocessing, the third being model training and hyperparameter tuning, and the final stage being model evaluation through a variety of metrics.
2.1. Data Acquisition and Synthetic Cohort Construction
The clinical data for this study was sourced from the Pima Indian Diabetes Dataset, which included the following features for 762 individuals: Pregnancies, Blood Pressure, Skin Thickness, BMI, and Diabetes Pedigree Function (DPF). Along with a binary ‘outcome’ column indicating the presence (1) or absence (0) of T2D for a particular individual [7].
Genetic data was then synthesized for ten carefully chosen single nucleotide polymorphisms (SNPs) which have known associations to T2D. The following ten SNPs were selected for synthetic data construction and augmentation with our clinical data: TCF7L2, KCNQ1, CDKN2A/B, CDKAL1, SLC30A8, IGF2BP2, HHEX-IDE, KCNJ11, PPARG, and FTO. These genes were selected based on their well-known association with type 2 diabetes with common SNPs and prominent occurrence [8]. TCF7L2 is the most known correlated gene with T2D, which regulates insulin secretion by coding for a necessary transcription factor in the Wnt pathway [9]. KCNQ1 encodes a protein that regulates a voltage-gated potassium channel in organs like the pancreas which is necessary for β-cells to secrete insulin [10]. A detailed description for each gene chosen as well as their odds ratios are outlined in Table 1. For each of these SNPs probabilities were derived from established Genome-Wide Association Studies (GWAS). Based on the data from publicly available GWAS, each SNP was assigned a probability of possessing the risk allele for both diabetic and non-diabetic individuals.
Based on the probabilities derived from the GWAS, ten more binary features were augmented to the clinical data, each indicating either the presence or absence of the risk allele for a particular SNP. These were synthetically assigned by iterating through each patient record and randomly assigning the presence or absence of each risk allele based on the probabilities derived from the GWAS for individuals based on whether or not they have T2D. The result of this was a unified dataset containing both the original clinical data and the synthetic genetic data.
2.2. Data Preprocessing and Feature Engineering
A basic data analysis revealed that there were imperfections in the original dataset with missing/zero values in the “Blood Pressure”, “Skin Thickness”, and “BMI” columns. These missing values were imputed with K-Nearest Neighbors imputation with k=5 [10]. Prior to imputation the columns were scaled using a MinMaxScaler to normalize the data and after the imputation the data was transformed back to its original scale.
The original data had a class imbalance, there being a much larger number of non-diabetic individuals in the dataset than diabetic individuals. To address this we utilized Synthetic Minority Over-sampling Technique (SMOTE), which balanced the dataset by generating synthetic samples for the minority class (diabetics), ensuring the model would not develop a bias towards the majority class (non-diabetics).
3. Results
The overall ROC-AUC Curve for all persons across various risk groups for T2D had an average AUC score of 0.78 which exceeds the industry standard for clinical acceptance of 0.7.[11]
Figure 1.
ROC-AUC Curve.
Additionally, the SHAP summary plots shown in Figure 2 describe the top contributors to the onset of T2D for each risk group based on the XGBoost model. A positive SHAP value is directly correlated to T2D, while a negative SHAP value is inversely correlated. Higher SHAP values indicate greater influence on the model’s output, with BMI and DPF being key predictors across all groups. The effect-size feature quantifies the genetic contribution, which varies across risk groups.
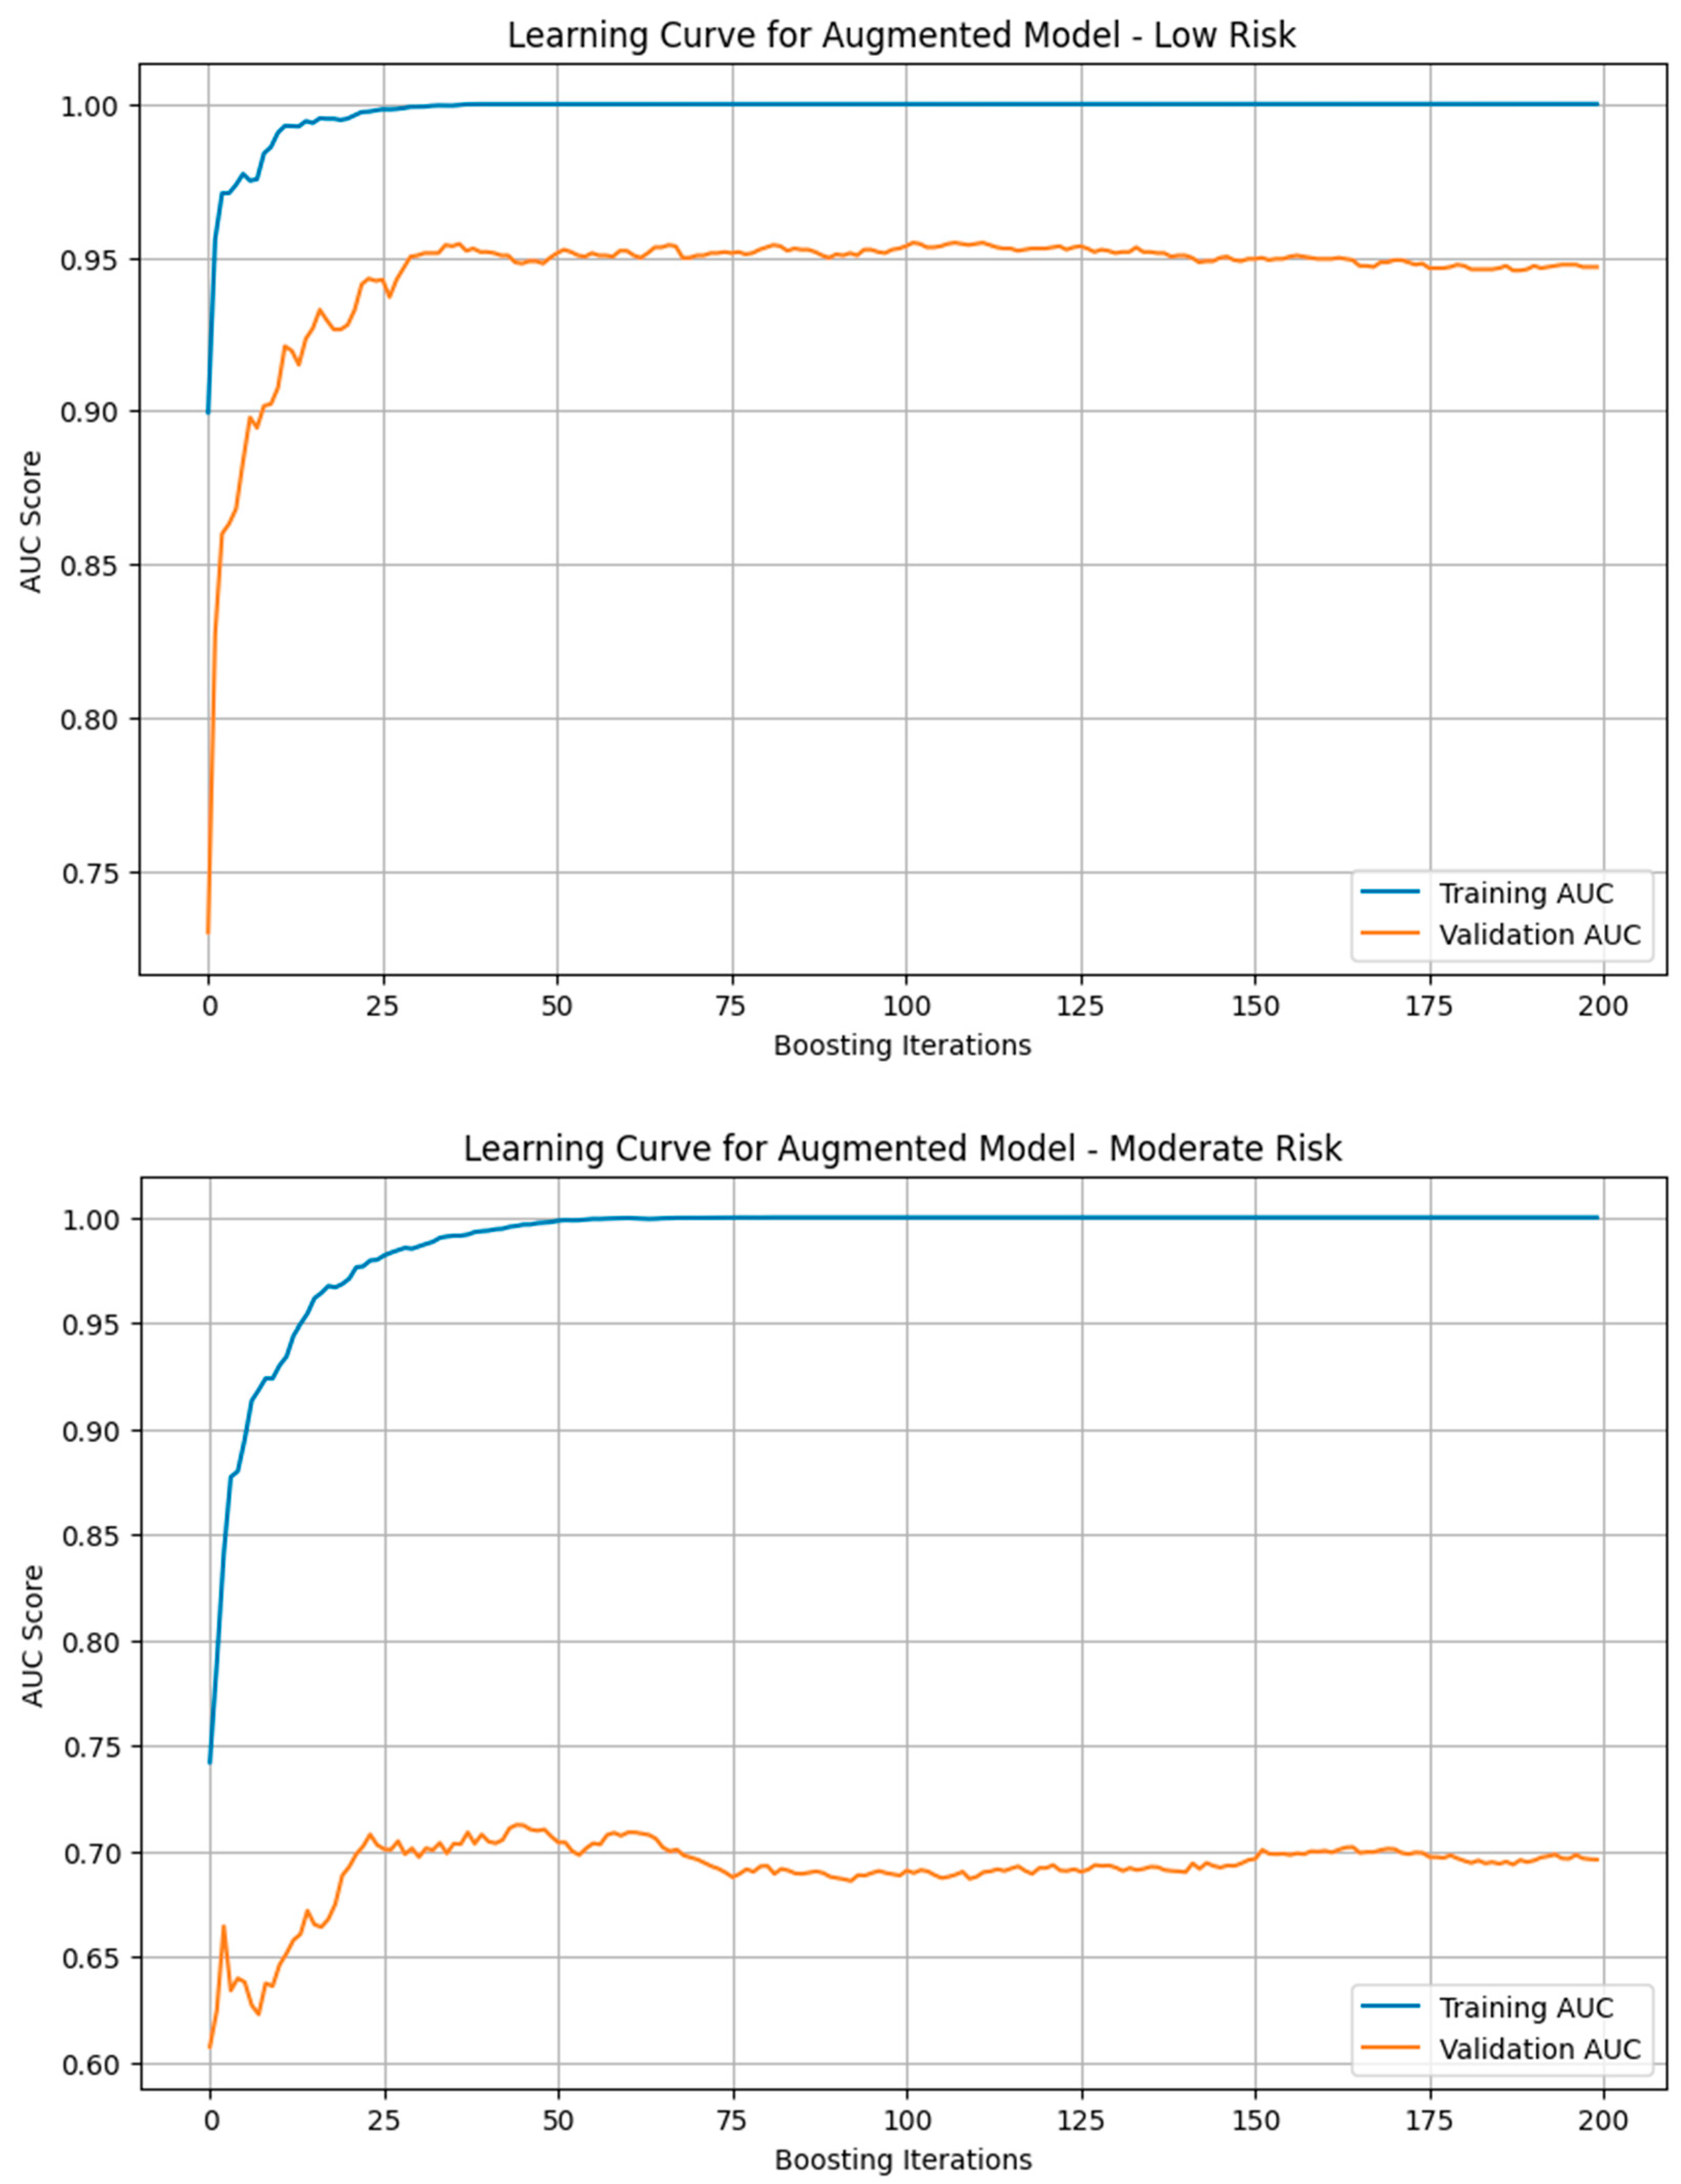
We generated the learning curve for the training and validation AUC scores for models trained on each risk group. Some overfitting occurred in all 3 models as shown by the higher AUC score in the training dataset than the validation one, but this problem was especially apparent in the moderate risk group’s model likely due to limited data and higher noise. The low risk group showed near parallel training and validation AUC curves, suggesting minimal overfitting while the high risk curve displayed a slightly higher amount of overfitting.
KNN imputation significantly improved both model performance and feature representation. For instance, the low-risk group’s AUC increased from 0.8363 to 0.89 post-imputation. Additionally, skin thickness, initially underweighted due to missing values, gained relevance in SHAP rankings after imputation, reinforcing its latent predictive value.
Across risk strata, feature importance shifted. While BMI and DPF were dominant in all groups, genetic effect sizes gained importance in high-risk individuals, suggesting stronger gene-clinical interactions under compounded risk.
4. Discussion
The model’s predictive performance was assessed using AUC scores, with the low-risk group achieving the highest accuracy, while the moderate and high-risk groups performed slightly lower.
SHAP analysis revealed that clinical factors, particularly BMI and family history, remained the strongest predictors of diabetes risk, even after integrating genetic data. However, some genes like PPARG and KCNQ1 were more influential than Skin Thickness indicating that genetic contributions, while secondary, were still relevant.
Imputation led to realistic reconstruction of missing clinical values, ultimately improving both AUC performance and SHAP feature importance rankings.[12] Prior to imputation, the AUC scores were generally hindered; for example our low risk group had an AUC score of 0.8363 without KNN Imputation. Additionally, without imputation, the columns with the most NaN values, which was the Skin Thickness was consistently ranked at the bottom in the SHAP feature importance analysis, but with imputation it was appropriately weighted, as shown in Figure 2, demonstrating that handling missing data effectively restored its predictive contribution.
Feature importance varied across risk groups, with BMI and DiabetesPedigreeFunction shifting between high and moderate-risk groups, while Blood Pressure and Pregnancies were particularly important in the low risk groups. The genetic effect seemed to be greater in higher risk group individuals as well. This suggests a potential interaction between genetic susceptibility and severe clinical risk factors.
ROC curves assess the model’s ability to predict diabetes cases across risk groups [13]. All models performed above the 0.7 AUC threshold, indicating they are clinically applicable and not affected by assignment of genetic variables to the clinical dataset. The low-risk model had the highest sensitivity, with its curve consistently above those of the moderate and high-risk models, confirming stronger predictive performance. Some overlap in the moderate and high-risk groups suggests classification challenges in these categories. Overall, discriminative power was highest in the low-risk model, followed by high and moderate-risk models, highlighting the need for further optimization in higher-risk classification.
The low risk group had minimal overfitting as the validation AUC score was almost that of the training one. The high risk group had some more overfitting as seen in Figure 3 while the moderate risk group experienced significant overfitting, indicating its weakness in generalizability. This variation in susceptibility to overfitting is due to the limited dataset which increases the likelihood that the model will be overtrained on repeated data. When looking at the end of the learning curve, we see a plateau indicating that additional training cycles were no longer effective in improving the model’s predictive ability at that point.
A true genetic-clinical dataset from the same population would require medical partnerships, ethical approvals, and access to biobank resources [14]. As we had limited resources, we used publicly available genetic and clinical datasets from different patient cohorts. To overcome this limitation, we realistically assigned genetic data to individuals which could affect the accuracy of diabetes risk predictions, though no real genetic data from the same individuals were used.. Additionally, the assignment of genetic variants may introduce unintended bias or obscure real genetic influences on diabetes development. Also, our datasets had missing values which we had to impute using KNN, though it compromised on accuracy slightly due to the approximation of these missing data points..
Funding
This research received no external funding
Informed Consent Statement
Not applicable.
Data Availability Statement
Publicly available datasets were analyzed in this study. This data can be found here: Pima Indians Diabetes Database. The genetic data synthesized for this study was derived from public Genome-Wide Association Studies (GWAS) as detailed in the methodology.
Acknowledgments
In this section you can acknowledge any support given which is not covered by the author contribution or funding sections. This may include administrative and technical support, or donations in kind (e.g., materials used for experiments).
Conflicts of Interest
The authors declare no conflict of interest.
References
- Khan, M.A.; Hashim, M.J.; King, J.; Govender, R.D.; Mustafa, H.; Al Kaabi, J. Epidemiology of Type 2 Diabetes – Global Burden of Disease and Forecasted Trends. J. Epidemiol. Glob. Health 2020, 10, 107–111. [CrossRef]
- Cleveland Clinic. Type 2 Diabetes. Cleveland Clinic, 2023. Available online: https://my.clevelandclinic.org/health/diseases/21501-type-2-diabetes.
- Laakso, M.; Silva, L.F. Genetics of Type 2 Diabetes: Past, Present, and Future. Nutrients 2022, 14, 3201. [CrossRef]
- Christiansen, C.; Arathimos, R.; Pain, O.; Molokhia, M.; Bell, J.T.; Lewis, C.M. Stratified Genome-Wide Association Analysis of Type 2 Diabetes Reveals Subgroups with Genetic and Environmental Heterogeneity. Hum. Mol. Genet. 2023, 32, 2638–2645. [CrossRef]
- National Institute of Diabetes and Digestive and Kidney Diseases / Data4Ecology. Pima Indians Diabetes Database. Available online: https://data4ecology.org/data-set/view/1577 (accessed on 24 November 2025).
- Chen, T.; Guestrin, C. XGBoost: A Scalable Tree Boosting System. In Proceedings of the 22nd ACM SIGKDD International Conference on Knowledge Discovery and Data Mining, San Francisco, CA, USA, 13–17 August 2016; ACM: New York, NY, USA, 2016; pp. 785–794. [CrossRef]
- Mahajan, A.; Taliun, D.; Thurner, M.; Robertson, N.R.; Torres, J.M.; Rayner, N.W.; Payne, A.J.; Steinthorsdottir, V.; Scott, R.A.; Grarup, N.; et al. Fine-Mapping Type 2 Diabetes Loci to Single-Variant Resolution Using High-Density Imputation and Islet-Specific Epigenome Maps. Nat. Genet. 2018, 50, 1505–1513. [CrossRef]
- NCBI. TCF7L2 Transcription Factor 7 Like 2 [Homo sapiens (Human)] - Gene. Available online: https://www.ncbi.nlm.nih.gov/gene/6934 (accessed on 24 November 2025).
- MedlinePlus Genetics. KCNQ1 Gene. Available online: https://medlineplus.gov/genetics/gene/kcnq1/ (accessed on 24 November 2025).
- Chawla, N.V.; Bowyer, K.W.; Hall, L.O.; Kegelmeyer, W.P. SMOTE: Synthetic Minority Over-sampling Technique. J. Artif. Intell. Res. 2002, 16, 321–357. [CrossRef]
- Statology. What is Considered a Good AUC Score? Available online: https://www.statology.org/what-is-a-good-auc-score/.
- Simplilearn. Introduction to Data Imputation. Available online: https://www.simplilearn.com/data-imputation-article.
- Google Developers. Classification: ROC and AUC. Available online: https://developers.google.com/machine-learning/crash-course/classification/roc-and-auc.
- Council for International Organizations of Medical Sciences (CIOMS). International Ethical Guidelines for Health--related Research Involving Humans, 4th ed.; Guideline 11: Collection, Storage and Use of Biological Materials and Related Data. Geneva: CIOMS, 2016. Available online: https://www.ncbi.nlm.nih.gov/books/NBK614422/.
Figure 2.
(a–c) SHAP Summary plots for low, medium, and high risk groups respectively.
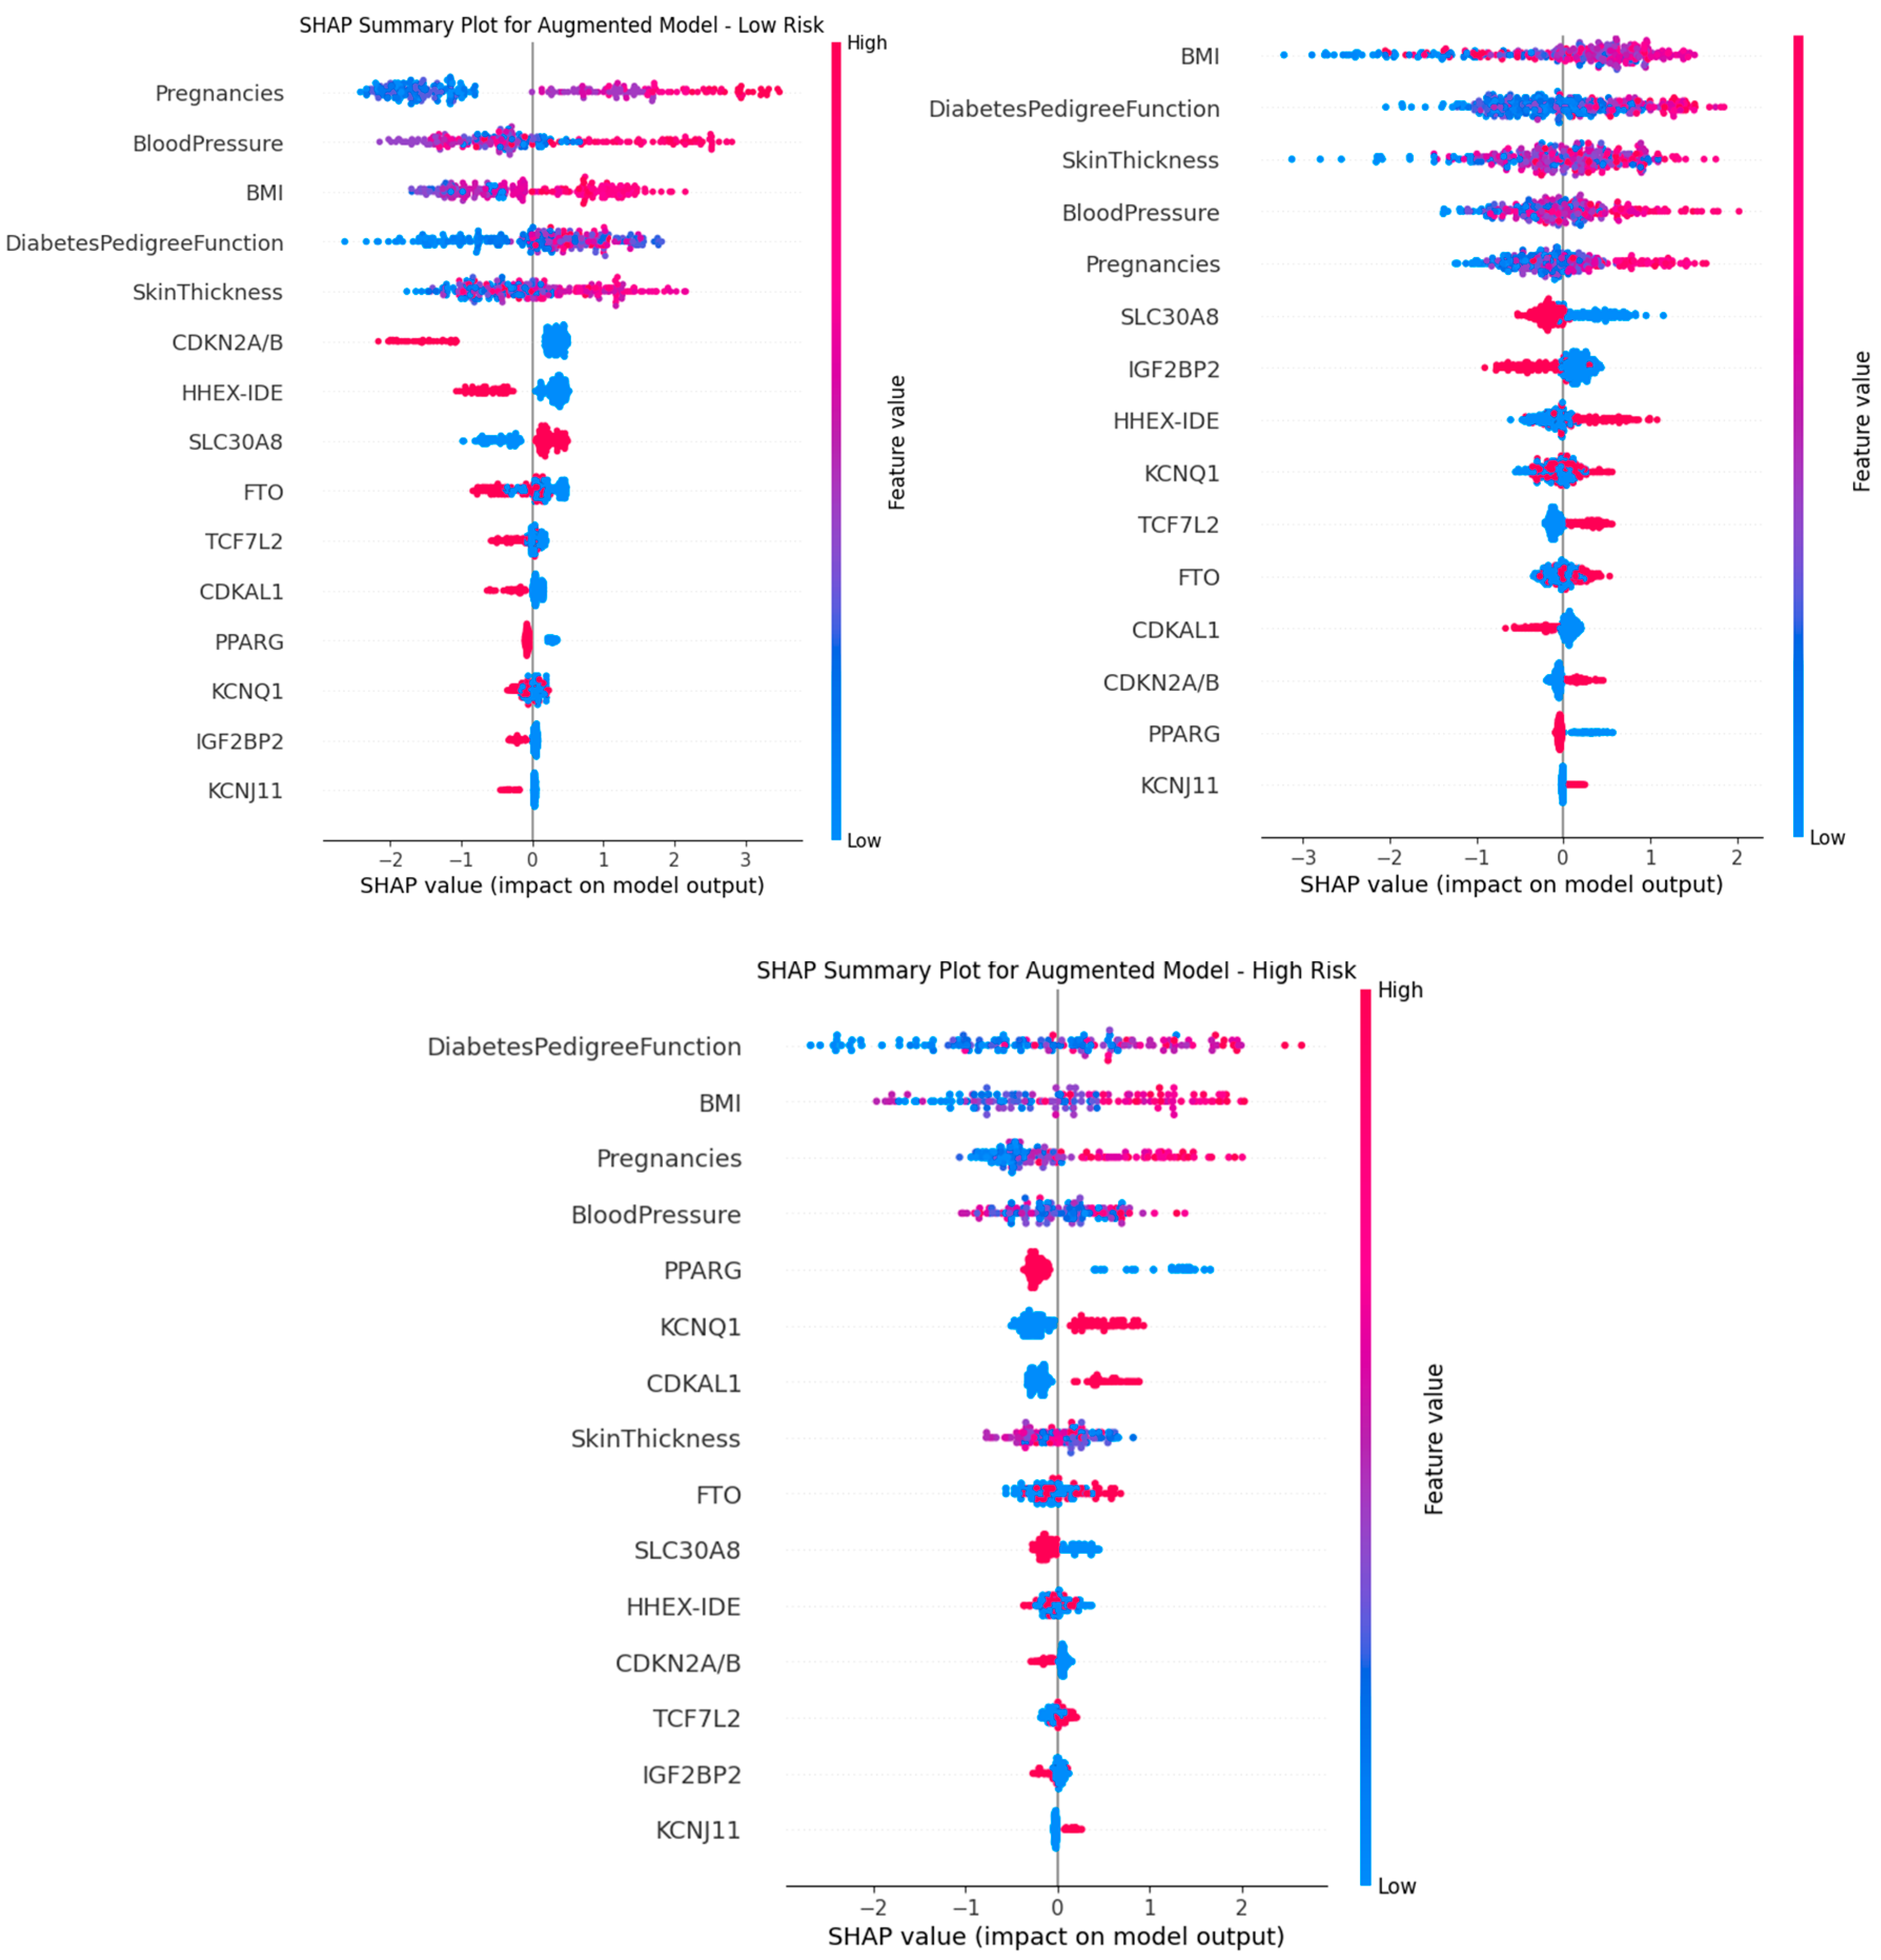
Figure 3.
(a–c) Learning curve showing training vs. validation AUC across training epochs for each model.
Figure 3.
(a–c) Learning curve showing training vs. validation AUC across training epochs for each model.
Disclaimer/Publisher’s Note: The statements, opinions and data contained in all publications are solely those of the individual author(s) and contributor(s) and not of MDPI and/or the editor(s). MDPI and/or the editor(s) disclaim responsibility for any injury to people or property resulting from any ideas, methods, instructions or products referred to in the content. |
© 2025 by the authors. Licensee MDPI, Basel, Switzerland. This article is an open access article distributed under the terms and conditions of the Creative Commons Attribution (CC BY) license (http://creativecommons.org/licenses/by/4.0/).
Copyright: This open access article is published under a Creative Commons CC BY 4.0 license, which permit the free download, distribution, and reuse, provided that the author and preprint are cited in any reuse.


