Submitted:
25 November 2025
Posted:
27 November 2025
Read the latest preprint version here
Abstract
This study aimed to investigate the protective effect of Changchun Baike varicella vaccine in Yanji City from 2018 to 2024. Varicella surveillance data from 2018 to 2024 and vaccination records from 2018 to 2020 were collected from the China Disease Prevention and Control Information System and analyzed. In total, 2,452 varicella cases were reported in Yanji from 2018 to 2024, with an average annual incidence rate of 62.71 per 100,000 population. Notably, the annual incidence rates decreased from 142.37 per 100,000 in 2018 to 55.25 per 100,000 population in 2024. Additionally, the highest and lowest incidence rates were observed in the 10–14 and ≥ 40 years age groups, respectively. Moreover, Changchun Baike varicella vaccine showed protective efficacies of 98.0–99.0% and 99% for the first and second doses, respectively, from 2018 to 2024. Importantly, the two-dose varicella vaccination schedule demonstrated superior protective efficacy compared with the single-dose schedule.
Keywords:
varicella
; live attenuated varicella vaccine
; epidemiological characteristics
; protective effect
1. Introduction
Varicella, caused by the varicella-zoster virus (VZV), is highly contagious and primarily transmitted through respiratory droplets or direct contact (1). Varicella affects individuals of all ages, with a higher incidence among infants, preschool, and school-aged children, often leading to outbreaks (2). Globally, approximately 140 million people are infected with varicella annually, posing a significant public health challenge (3). Recently, varicella has become the leading vaccine-preventable infectious disease among children in China, with a national incidence rate of approximately 25–30 per 100,000 population in 2022, highlighting the urgent need for enhanced control measures (4,5). As an economic and transportation hub in Jilin Province with a dense population, Yanji City is prone to varicella outbreaks in schools and childcare facilities. Vaccination is the most effective method for preventing the disease (6). Notably, Changchun Baike varicella vaccine is the primary vaccine used in the immunization program of Yanji, reducing the average annual incidence rate to 62.71 per 100,000 population between 2018 and 2024. However, single-dose vaccination has limited protective efficacy, and breakthrough infections may occur (7, 8). In this study, we conducted an epidemiological analysis of varicella in Yanji from 2018 to 2024 and evaluated the protective efficacy of varicella vaccine from 2018 to 2020 to provide guidance for varicella prevention and control.
2. Materials and Methods
2.1. Data Sources
Varicella case data were obtained from the China Disease Prevention and Control Information System and the Infectious Disease Reporting System. Varicella cases were filtered for residents of Yanji with onset dates of January 1, 2018, to December 31, 2024, totaling 2,452 confirmed cases, excluding suspected cases. Additionally, varicella vaccination data from 2018 to 2020 were collected for this study.
2.2. Methods
Descriptive epidemiological methods were used to analyze the temporal, spatial, and population distributions of varicella incidence in Yanji from 2018 to 2024. Additionally, a screening method was employed to assess varicella vaccination rates and protective efficacy. Individuals were divided into vaccinated and unvaccinated groups based on vaccination status in 2018, 2019, and 2020, categorized as one dose, two doses, or both. Disease occurrence was observed from 2018 to 2022, 2019 to 2023, and 2020 to 2024. Cases were matched by age (< 15 years), excluding those with onset within 1 year of birth or within 42 days post-vaccination. Matched cases were included in the protective efficacy analysis of Changchun Baike varicella vaccine.
Due to imbalances in variables, such as age and dose number between the vaccinated and unvaccinated groups, propensity score matching (PSM) was used to balance covariates. A 1:1 matching ratio was applied with a caliper value of 0.2 and random seed of 50. Logistic regression was used to estimate propensity scores, and nearest-neighbor matching was used. Considering that the vaccinated group was smaller, the unvaccinated group was matched with replacement, with each unvaccinated subject matched no more than three times (9).
2.3. Statistical Analysis
Data collected in this study were organized using Excel 365. Descriptive epidemiological methods and SPSS 22.0 were used for count data analysis, with chi-square tests (p < 0.05 indicating statistical significance). Varicella incidence trend was analyzed using the Joinpoint regression model. Data were processed using SPSS 24.0 after PSM was performed using the MatchIt package in R (version 4.4.1). Additionally, the survival package was used for stratified Cox regression analysis. Covariate distributions between the vaccinated and unvaccinated groups were compared using chi-square tests (α = 0.05). Notably, the Kaplan–Meier survival curves showed no crossover, meeting the Cox regression assumptions. Disease occurrence was the dependent variable, with covariates included in the stratified Cox regression model to calculate the adjusted hazard ratios (aHR) and 95% confidence intervals (CI). Additionally, adjusted vaccine efficacy (aVE) was calculated as (1-aHR) × 100% (9).
2.4. Ethical Reflections
Informed consent was secured from all study participants; they were apprised of their right to withdraw from the study and assured that their data would remain strictly confidential and utilized solely for scientific analysis. The research was executed in accordance with the principles of the Declaration of Helsinki and received approval from the Institutional Review Board of Yanbian University. (Ethics Code: 10249).
3. Results
3.1. Temporal Distribution
In total, 2,452 varicella cases were reported in Yanji from 2018 to 2024, with an average annual incidence rate of 62.71 per 100,000 population. Although not statistically significant, the incidence rate decreased during this period. Cases were reported monthly, with a biphasic pattern peaking from April to July (31.83%, 2,219/6,972 cases) and from October to January of the following year (51.71%, 3,605/6,972 cases) (Figure 1, Figure 2 and Figure 3).
3.2. Spatial Distribution
All six streets and four towns in Yanji reported varicella cases from 2018 to 2024, with annual incidence rates ranging from 7.29 per 100,000 population (Xinxing Street) to 20.16 per 100,000 population (Jin Xue Street). Although not statistically significant, the incidence rate decreased in all areas (Figure 4).
3.3. Population Distribution
3.3.1. Sex Distribution
From 2018 to 2024, 1,366 male and 1,086 female cases were reported, with a sex ratio of 1.26:1. Additionally, the annual incidence rates were 34.93 per 100,000 males and 27.77 per 100,000 females. Moreover, varicella incidence declined for both sexes, with a faster decline in males (APC = ˗14.62, p < 0.01) than in females (Figure 5).
3.3.2. Age Distribution
From 2018 to 2024, children aged 0–12 years accounted for 1,337 cases (54.53%), whereas those aged 35–49 years accounted for 96 cases (3.92%). Notably, the annual incidence rates per 100,000 population by age group were: 0–4 years (4.67), 5–9 years (17.32), 10–14 years (18.08), 15–19 years (11.41), 20–24 years (3.80), 25–29 years (3.12), 30–34 years (2.38), 35–39 years (1.71), and ≥ 40 years (0.89). Additionally, the 10–14 years age group had the highest incidence, with a declining trend (APC = ˗8.79%, p < 0.01), followed by the 5–9 years age group. Moreover, the 0–4 age years group showed the fastest decline (APC = ˗32.74%, p < 0.01), followed by the 30–34 years age group (APC = ˗14.72%, p < 0.01). However, the other age groups showed no significant trends (Figure 6).
3.3.3. Occupational Distribution
In this study, the top three occupations among varicella cases from 2018 to 2024 were students (69.86%), preschool children (13.34%), and unemployed/household workers (8.24%) (Figure 7).
3.3.4. Vaccination Status
In total, 31,088 doses of varicella vaccine were administered in Yanji from 2018 to 2020, including 5,091 doses of Changchun Baike vaccine (16.38% of total doses). In 2018, 3,491 doses of Changchun Baike vaccine were administered (28.3% of total vaccinations), with Henan street having the highest proportion (35.7%) and Sandaowan town the lowest (0%). In 2019, 641 doses were administered (7.34%), with Jin Xue street having the highest proportion (11.3%) and Sandaowan town the lowest (0%). In 2020, 959 doses were administered (9.58%), with Chaoyangchuan and Sandaowan towns having the highest (76.1%) and lowest (0%) proportions, respectively (Table 1, Table 2 and Table 3).
3.4. Vaccine Protective Efficacy
3.4.1. Protective Efficacy of Changchun Baike Varicella Vaccine, 2018–2022
For one-dose vaccination, 558,172 cases met the inclusion criteria: 1,904 vaccinated and 70,882 unvaccinated cases in the < 15 years age group and 23 vaccinated and 485,363 unvaccinated cases in the ≥ 15 years age group, with significant age differences (p < 0.001). After 1:1 PSM, 1,927 case-control pairs showed no significant age differences (p > 0.05). For two-dose vaccination, 558,172 cases were included: 1,559 vaccinated and 71,241 unvaccinated in the < 15 age group and 9 vaccinated and 485,363 unvaccinated in the ≥ 15 age group, with significant age differences (p < 0.001). After PSM, 1,568 pairs showed no significant differences (p > 0.05). For one- or two-dose schedule, 557,972 cases were included: 3,463 vaccinated and 69,386 unvaccinated in the < 15 years age group and 32 vaccinated and 485,091 unvaccinated in the ≥ 15 years age group, with significant differences (p < 0.001). After PSM, 3,495 pairs showed no significant differences (p > 0.05). Cox regression showed that the varicella-positive risk in the one-dose vaccinated group was 0.01 times that of the unvaccinated group (OR = 0.01, 95% CI: 0.01–0.02; p < 0.001), with a protective efficacy of 99.0% (95% CI: 98.0–99.0%). Additionally, the efficacy of two doses and combined doses was 99.0% (95% CI: 98.0–99.0%) (Table 5).
3.4.2. Protective Efficacy of Changchun Baike Varicella Vaccine, 2019–2023
For one-dose vaccination, 560,743 cases were included: 321 vaccinated and 72,273 unvaccinated in the < 15 years age group and 22 vaccinated and 488,127 unvaccinated in the ≥ 15 years age group, with significant age differences (p < 0.001). After 1:1 PSM, 343 pairs showed no significant differences (p > 0.05). For two-dose vaccination, 560,743 cases were included: 321 vaccinated and 72,273 unvaccinated in the < 15 years age group and 22 vaccinated and 488,127 unvaccinated in the ≥ 15 years age group, with significant differences (p < 0.001). After PSM, 343 pairs showed no significant differences (p > 0.05). For one or two vaccine doses, 561,502 cases were included: 642 vaccinated and 72,139 unvaccinated in the < 15 years age group and 44 vaccinated and 488,677 unvaccinated in the ≥ 15 years age group, with significant differences (p < 0.001). After PSM, 686 pairs showed no significant differences (p > 0.05). Cox regression analysis showed that varicella-positive risk in the one- and two-dose vaccinated groups was 0.01 times that of the unvaccinated group (OR = 0.01, 95% CI: 0.00–0.03; p < 0.001), with a protective efficacy of 99.0% (95% CI: 97.0%–100.0%). For one or two doses, the risk was 0.01 times (OR = 0.01, 95% CI: 0.01–0.02; p < 0.001), with an efficacy of 99.0% (95% CI: 97.0%–100.0%) (Table 7).
3.4.3. Protective Efficacy of Changchun Baike Varicella Vaccine, 2020–2024
For one-dose vaccination, 506,747 cases were included: 325 vaccinated and 72,273 unvaccinated in the < 15 years age group and 22 vaccinated and 488,127 unvaccinated in the ≥ 15 years age group, with significant age differences (p < 0.001). After 1:1 PSM, 343 pairs showed no significant differences (p > 0.05). For two-dose vaccination, 561,826 cases were included: 606 vaccinated and 72,130 unvaccinated in the < 15 years age group and 6 vaccinated and 489,084 unvaccinated in the ≥ 15 years age group, with significant differences (p < 0.001). After PSM, 343 pairs showed no significant differences (p > 0.05). For one or two doses, 561,878 cases were included: 931 vaccinated and 71,857 unvaccinated in the < 15 years age group and 28 vaccinated and 489,062 unvaccinated in the ≥ 15 years age group, with significant differences (p < 0.001). After PSM, 959 pairs showed no significant differences (p > 0.05). Cox regression showed that the varicella-positive risk in the one-dose vaccinated group was 0.02 times that of the unvaccinated group (OR = 0.02, 95% CI: 0.00–0.07; p < 0.001), with a protective efficacy of 98.0% (95% CI: 97.0–99.0%). For two doses, the risk was 0.01 times (OR = 0.01, 95% CI: 0.00–0.02; p < 0.001), with an efficacy of 99.0% (95% CI: 98.0–100.0%). For one or two doses, the risk was 0.01 times, with an efficacy of 99.0% (95% CI: 98.0–100.0%) (Table 9).
4. Discussion
In this study, we investigated the epidemiological characteristics of varicella and the protective efficacy of Changchun Baike in Yanji from 2018 to 2024. In total, 2,452 cases were reported from 2018 to 2024, with an average annual incidence rate of 62.71 per 100,000 population. Notably, the incidence rate declined from 142.37 per 100,000 in 2018 to 55.25 per 100,000 population by 2024. This decline is closely linked to the widespread use of Changchun Baike varicella vaccine, which reduces the risk of VZV transmission through humoral and cellular immunity (7). Additionally, cases were concentrated among preschool and school-aged children, with a slightly higher incidence in males than in females. Moreover, the decline in the incidence rate was faster in males than in females during the period under consideration. Among the areas surveyed, the densely populated Jin Xue and Beishan streets had relatively high incidence rates. Additionally, the economically underdeveloped Sandaowan town had a higher transmission risk due to low vaccination coverage (10,11). Vaccine efficacy analysis showed an adjusted efficacy of 98.0–99.0% (95% CI: 97.0–100.0%) for the one-dose schedule and 99.0% (95% CI: 98.0–100.0%) for the two-dose schedule, with latter schedule significantly outperforming the former schedule in preventing breakthrough infections (12,13). However, breakthrough infections and inadequate vaccination coverage suggest the need for optimized vaccination strategies to further reduce the disease burden (14,15).
Consistent with findings in Qingyang, Gansu, and Shenyang (2,16), varicella incidence exhibited a distinct seasonal pattern, with peaks from April to July (31.83%) and October to January (51.71%). Winter peaks are associated with increased indoor gatherings and higher respiratory droplet transmission risk in cold conditions, whereas late spring to early summer peaks are correlated with increased school-related contact and social activities (7,8). Despite the declining incidence, the seasonal pattern remained unchanged, indicating that VZV transmission is driven by climate and behavioral factors (17). Enhanced surveillance in schools and childcare facilities during peak seasons is crucial for identifying and controlling outbreaks.
Spatially, all six streets and four towns reported cases with significant variations in incidence rates. Jin Xue and Beishan streets, with high population density and frequent mobility, were high-risk areas, reflecting the role of social contact in transmission chains (18–20). Economically disadvantaged areas, such as Sandaowan town, had a higher transmission risk due to poor sanitation and low vaccination coverage (21). Targeted interventions, including increased vaccination coverage, improved public health infrastructure, and health education, are necessary to reduce transmission in high-risk areas.
Regarding population distribution, cases were concentrated among children aged 0–14 years, with the 10–14 years age group having the highest incidence, followed by the 5–9 years age group. Preschool- and school-aged children are more susceptible to the disease than adults because of their underdeveloped immune systems and frequent contact in crowded settings (22,23). Notably, the incidence rate increased in the ≥ 40 years age group, possibly due to waning single-dose vaccine efficacy or lack of vaccination in some adults (24). Additionally, the higher incidence rate in males than in females may be due to more active social interactions, poorer hygiene, and lower parental acceptance of vaccination among males (25–27). Male patients are more prone to complications, such as skin infections and pneumonia, which may increase the healthcare burden (28). Moreover, occupational distribution highlighted students, preschool children, and unemployed/household workers as primary case groups, driven by school and childcare environments, low vaccination coverage, and limited parental awareness of vaccine safety (29,30).
Importantly, Changchun Baike varicella vaccine demonstrated excellent protective efficacy. One-dose aVE was 99.0% (95% CI: 98.0–99.0%) and two-dose was 99.0% (95% CI: 98.0–99.0%) from 2018 to 2022; both were 99.0% (95% CI: 97.0–100.0%) from 2019 to 2023; and one-dose was 98.0% (95% CI: 97.0–99.0%) and two-dose was 99.0% (95% CI: 98.0–100.0%) from 2020 to 2024. Cox regression confirmed that two-dose vaccination had a lower hazard ratio, offering significant advantages in preventing breakthrough infections (31). Our results align with international findings, such as the > 90% incidence reduction in the U.S. after implementing a two-dose strategy (32). However, the incidence of breakthrough infections suggests that vaccine efficacy is influenced by individual immune responses, age at vaccination, and storage conditions (33). Children vaccinated at ≤ 15 months had a higher infection risk, and single-dose antibody titers wane over time, whereas two doses significantly extend protection (31). Economic barriers and insufficient health education limit second-dose uptake (17). For example, the free two-dose policies in Shanghai and Tianjin significantly reduced the incidence of the disease (34,35). Additionally, schools and childcare facilities should implement vaccination verification and routine VZV surveillance to curb varicella outbreaks (36). Future research should focus on the long-term efficacy of two-dose vaccination schedule and the pathogenesis of breakthrough infections to optimize strategies and strengthen control measures.

Table 4.
Distribution characteristics of vaccinated and unvaccinated groups before and after PSM, 2018–2022.
Table 4.
Distribution characteristics of vaccinated and unvaccinated groups before and after PSM, 2018–2022.
| Before matching | After matching | |||||||||||
| Variable | Unvaccinated group | Vaccinated group | X2 | p | Unvaccinated group | Vaccinated group | X2 | p | ||||
| Cases | Proportion (%) | Cases | Proportion (%) | Cases | Proportion (%) | Cases | Proportion (%) | |||||
| 1 Dose | ||||||||||||
| < 15 | 70882 | 12.74 | 1904 | 98.81 | 12543.498 | <.001 | 1904 | 98.81 | 1904 | 98.81 | 0.000 | 1.000 |
| ≥ 15 | 485363 | 87.26 | 23 | 1.19 | 23 | 1.19 | 23 | 1.19 | ||||
| 2 Doses | ||||||||||||
| < 15 | 71241 | 12.80 | 1559 | 99.43 | 10345.675 | <.001 | 1559 | 99.43 | 1559 | 99.43 | 0.000 | 1.000 |
| ≥ 15 | 485363 | 87.20 | 9 | 0.57 | 9 | 0.57 | 9 | 0.57 | ||||
| 1 or 2 Doses | ||||||||||||
| < 15 | 69386 | 12.55 | 3463 | 99.08 | 19121.808 | <.001 | 3463 | 99.08 | 3463 | 99.08 | 0.000 | 1.000 |
| ≥ 15 | 485091 | 87.45 | 32 | 0.92 | 32 | 0.92 | 32 | 0.92 | ||||
Table 6.
Distribution characteristics of vaccinated and unvaccinated groups before and after PSM, 2019–2023.
Table 6.
Distribution characteristics of vaccinated and unvaccinated groups before and after PSM, 2019–2023.
| Before matching | After matching | |||||||||||
| Variable | Unvaccinated group | Vaccinated group | X2 | p | Unvaccinated group | Vaccinated group | X2 | p | ||||
| Cases | Proportion (%) | Cases | Proportion (%) | Cases | Proportion (%) | Cases | Proportion (%) | |||||
| 1 Dose | ||||||||||||
| < 15 | 72273 | 12.90 | 321 | 93.59 | 1660.372 | <.001 | 321 | 93.59 | 321 | 93.59 | 0.000 | 1.000 |
| ≥ 15 | 488127 | 87.10 | 22 | 6.41 | 22 | 6.41 | 22 | 6.41 | ||||
| 2 Dose | ||||||||||||
| < 15 | 72273 | 12.90 | 321 | 93.59 | 1660.372 | <.001 | 321 | 93.59 | 321 | 93.59 | 0.000 | 1.000 |
| ≥ 15 | 488127 | 87.10 | 22 | 6.41 | 22 | 6.41 | 22 | 6.41 | ||||
| 1 or 2 Doses | ||||||||||||
| < 15 | 72139 | 12.79 | 642 | 93.59 | 6371.477 | <.001 | 642 | 93.59 | 642 | 93.59 | 0.000 | 1.000 |
| ≥ 15 | 488677 | 87.21 | 44 | 6.41 | 44 | 6.41 | 44 | 6.41 | ||||
Table 8.
Distribution characteristics of vaccinated and unvaccinated groups before and after PSM, 2020–2024.
Table 8.
Distribution characteristics of vaccinated and unvaccinated groups before and after PSM, 2020–2024.
| Before matching | After matching | |||||||||||
| Variable | Unvaccinated group | Vaccinated group | X2 | p | Unvaccinated group | Vaccinated group | X2 | p | ||||
| Cases | Proportion (%) | Cases | Proportion (%) | Cases | Proportion (%) | Cases | Proportion (%) | |||||
| 1 Dose | ||||||||||||
| < 15 | 72273 | 12.90 | 325 | 93.66 | 1660.372 | <.001 | 321 | 93.59 | 321 | 93.59 | 0.000 | 1.000 |
| ≥ 15 | 488127 | 87.10 | 22 | 6.34 | 22 | 6.41 | 22 | 6.41 | ||||
| 2 Dose | ||||||||||||
| < 15 | 72130 | 12.85 | 606 | 99.02 | 3686.416 | <.001 | 321 | 93.59 | 321 | 93.59 | 0.000 | 1.000 |
| ≥ 15 | 489084 | 87.15 | 6 | 0.97 | 22 | 6.41 | 22 | 6.41 | ||||
| 1 or 2 Doses | ||||||||||||
| < 15 | 71857 | 12.79 | 931 | 97.08 | 6371.477 | <.001 | 931 | 97.08 | 931 | 97.08 | 0.000 | 1.000 |
| ≥ 15 | 489062 | 87.21 | 28 | 2.92 | 28 | 2.92 | 28 | 2.92 | ||||
Author Contributions
Zheng Wang conceived the study, conducted data analysis, interpreted the results, and drafted the manuscript. Na Xu contributed equally to this work, supervised data collection, and assisted with study design and manuscript revision. Hanxue Gu contributed equally to this work, participated in data curation, statistical analysis, and figure preparation. Shuhan Shang assisted in data analysis, literature review, and manuscript editing. Xiaoguang Guo contributed to data validation, methodology support, and interpretation of findings. Shiyuan Song participated in manuscript preparation, formatting, and proofreading. Feng Guo provided technical and policy guidance and contributed to the study’s conceptual framework. Feifan Ren assisted with statistical modeling and data visualization. Zijian Chen contributed to data interpretation, reviewed the manuscript, and provided feedback on the final draft. Yihua Li supervised the entire study, provided critical revisions, and approved the final version of the manuscript. All authors read and approved the final manuscript. Zheng Wang, Na Xu, and Hanxue Gu contributed equally to this work and share first authorship.
Funding
This study was funded by Changchun encyclopedia Biotechnology Co., Ltd. (Changchun 130012, China), project number: 492025001, and was funded by the health science and technology capacity improvement project of Jilin Province, project number: 2023GW001.
Data Availability Statement
The datasets presented in this article are not readily available to avoid misuse of data and information, the datasets used or analyzed during the current study are available from the corresponding author Yihua Li on reasonable request. Requests to access the datasets should be directed to Yihua Li, liyihua@ybu.edu.cn.
Acknowledgments
The authors gratefully acknowledge Changchun Baike Biotechnology Co., Ltd. for their valuable project collaboration and financial support.
References
- Rasizadeh R, Shamekh A, Shiri Aghbash P, Bannazadeh Baghi H. Comparison of human monkeypox, chickenpox and smallpox: a comprehensive review of pathology and dermatological manifestations. Curr Med Res Opin. 2023 May;39(5):751-760.
- Bai S. Epidemiological characteristics of varicella among primary and secondary school students in Shenyang City, 2006–2018. Chin J Sch Health. 2020;41(01):148–150.[18] Bai S. Epidemiological characteristics of varicella among primary and secondary school students in Shenyang City, 2006–2018. Chin J Sch Health. 2020;41(01):148–150.
- Ayoade F, Kumar S. (2022). Varicella-Zoster Virus (Chickenpox). In: StatPearls [Internet]. Treasure Island (FL): StatPearls Publishing.
- China Center for Disease Control and Prevention. Overview of National Notifiable Infectious Diseases in 2022 [EB/OL]. [2023-10-01].
- Dong PM, Wang M, Liu YM. Epidemiological characteristics of varicella in China, 2016–2019. Chin J Vaccines Immun. 2020;26(04):403–406.
- Wang HY, Liu F. Progress in research on epidemiological characteristics and vaccine protective efficacy of varicella in China. Prev Med Forum. 2021;27(10):800–802.
- Di Pietrantonj C, Rivetti A, Marchione P, Debalini MG, Demicheli V. Vaccines for measles, mumps, rubella, and varicella in children. Cochrane Database Syst Rev. 2021 Nov 22;11(11):CD004407.
- Di Pietrantonj C, Rivetti A, Marchione P, Debalini MG, Demicheli V. Vaccines for measles, mumps, rubella, and varicella in children. Cochrane Database Syst Rev. 2021 Nov 22;11(11):CD004407.
- Lin M, Yang T, Deng P, Yang L, Xue C. Analysis on the Epidemiological Characteristics of Breakthrough Varicella Cases and Incremental Effectiveness of 2-Dose Varicella Vaccine in China. Vaccines (Basel). 2025 Feb 6;13(2):160.
- Lin M, Yang T, Deng P, Yang L, Xue C. Analysis on the Epidemiological Characteristics of Breakthrough Varicella Cases and Incremental Effectiveness of 2-Dose Varicella Vaccine in China. Vaccines (Basel). 2025 Feb 6;13(2):160.
- Li W, Liu LL, Tan HL, et al. Protective efficacy evaluation of trivalent inactivated influenza vaccine among primary and secondary school students in Longgang District, Shenzhen, during the 2023–2024 influenza season. Chin J Vaccines Immun. 2025;31(02):132–137.
- Zhang RY, Jiang Z, Gao L. Epidemiological characteristics of varicella in Guiyang City, 2010–2022. Mod Prev Med. 2023;50(23):4386–4391.
- Luo RJ, Wen Y, Cheng YP, et al. Epidemiological trends of major respiratory infectious diseases among people aged 6–19 years in Shenzhen, 2013–2022. Chin J Trop Med. 2024;24(02):184–189.
- Zhang XQ, Lü Y, Wang Y, et al. Epidemiological characteristics and vaccine protective efficacy of varicella in Liu’an City, 2010–2022. Chin J Vaccines Immun. 2023;29(03):285–289.
- Lin MZ, Ding MH, Deng PF, et al. Epidemiological characteristics of varicella in Pudong New Area, Shanghai, 2011–2020. Chin J Biol. 2022;35(06):695–699+705.
- Ding X, Ren DF, Gao QR, et al. Epidemiological characteristics of varicella in Tongren City, 2010–2020. Mod Prev Med. 2021;48(18):3411–3414.
- Chen Q, Wang MC, Zeng XP. Epidemiological characteristics of infectious diseases in schools and childcare facilities in Haikou City, 2015–2019. Mod Prev Med. 2021;48(12):2214–2217+2225.
- Wu JJ, Zou LP, He YJ, et al. Epidemiological characteristics and vaccine protective efficacy of varicella in Jinan City, 2006–2022. Mod Prev Med. 2024;51(18):3422–3427+3441.
- Wang Z, Chen L, Lu F, Peng J, Huang F, Xie X, Kong D. Analysis of the implementation effect and evaluation of the vaccine protection effect of the live attenuated varicella vaccine program for school-age children in Bao’an district of Shenzhen,China. Hum Vaccin Immunother. 2024 Dec 31;20(1):2364485.
- Zhang Z, Zhang Y, Yu J, Dong C, Zhang J, Liu N, Qian C, Luan L. Seroprevalence rates in children aged 3-6 years after implementing a two-dose varicella vaccination: A observational study. Hum Vaccin Immunother. 2023 Dec 31;19(1):2211465.
- Li Y, Xu F, Liu M, Teng S, Liang F, Wang F. Effectiveness of two-dose vs. one-dose varicella vaccine in children in Shanghai, China: a prospective cohort study. Front Public Health. 2024 Jun 4;12:1320407.
- Wang L, Wang MM, Xu CD, Wang PH, You MY, Li ZH, Chen XM, Liu XY, Li XD, Wang YY, Hu YH, Yin DP. Spatial Dynamics of Chickenpox Outbreaks in Rapidly Developing Regions: Implications for Global Public Health. Biomed Environ Sci. 2024 Jul 20;37(7):687-697.
- Williame I, George M, Shah HA, Homer N, Alderson D, Jamet N. Healthcare resource use and costs of varicella and its complications: A systematic literature review. Hum Vaccin Immunother. 2023 Dec 15;19(3):2266225.
- Zeng T, Lian CX, Zhang XY, etal.Clinical symptoms and molecular epidemiologic characteristics of varicella patients among children and adults in Ganzhou, China. Virol J. 2025 Feb 21;22(1):44.
- Luan G, Yao H, Yin D, etal.Trends and Age-Period-Cohort Effect on Incidence of Varicella Under Age 35 - China, 2005-2021. China CDC Wkly. 2024 ;6(18):390-395. 3 May.
- Zhang M, Gui GP, Guo F, etal.A Centralized Outbreak of Varicella among Children Attending Preschool in Suzhou, China. Biomed Res Int. 2020 ;2020:6183936. 2 May.
- Ribeiro MZ, Kupek E, Ribeiro PVZ, Pinheiro CEA. Impact of the tetra viral vaccine introduction on varicella morbidity and mortality in the Brazilian macro regions. J Pediatr (Rio J). 2020 Nov-Dec;96(6):702-709.
- Hu YH, Luo XF, Lyu M, etal. [A Meta-analysis on varicella-zoster virus antibody levels in healthy population in China]. Zhonghua Liu Xing Bing Xue Za Zhi. 2021 Sep 10;42(9)1650-1661. Chinese.
- Liu XY, Wang MM, You MY, Wang PH, Wang TQ, Chen XM, Xu CD, Li XD, Wang L, Hu YH, Yin DP. (2024). Epidemiological characteristics and influencing factors of public health emergency events of varicella in the Beijing-Tianjin-Hebei region, 2006-2021. Zhonghua Yu Fang Yi Xue Za Zhi, 58(12), 1999-2004.
- Tam WWS, Chan J, Lo KKH, etal.Parental Attitudes and Factors Associated With Varicella Vaccination in Preschool and Schoolchildren in Hong Kong: A Cross-Sectional Study. Medicine (Baltimore). 2015 Sep;94(36):e1519.
- Zhu H, Zhao H, Ou R, etal. Spatiotemporal Epidemiology of Varicella in Chongqing, China, 2014-2018. Int J Environ Res Public Health. 2020 Jan 20;17(2):662.
- Liang H, Qi X, Chen Y, etal.Surveillance of Adverse Events Following Varicella Vaccine Immunization in Zhejiang Province, China, from 2020 to 2022. Vaccines (Basel). 2025 Jan 10;13(1):57.
- Chen YF, Zhou Q, Liu JY,etal.Characteristics of within-household varicella transmission events associated with school outbreaks in Shanghai, China, 2009-2018. Epidemiol Infect. 2020 Feb 14;148:e127.
- Chen D, Li Y, Wu Q. Effectiveness of varicella vaccine as post-exposure prophylaxis: a meta-analysis. Hum Vaccin Immunother. 2021 Dec 2;17(12):5316-5324.
- Varela FH, Pinto LA, Scotta MC. Global impact of varicella vaccination programs [J]. Human vaccines & immunotherapeutics, 2019, 15(3): 645-57.
- Chemaitelly H, AlMukdad S, Ayoub HH, Altarawneh HN, Coyle P, Tang P, Yassine HM, Al-Khatib HA, Smatti MK, Hasan MR, Al-Kanaani Z, Al-Kuwari E, Jeremijenko A, Kaleeckal AH, Latif AN, Shaik RM, Abdul-Rahim HF, Nasrallah GK, Al-Kuwari MG, Al-Romaihi HE, Butt AA, Al-Thani MH, Al-Khal A, Bertollini R, Abu-Raddad LJ. (2022). Covid-19 Vaccine Protection among Children and Adolescents in Qatar. N Engl J Med, 387(20), 1865-1876.
- Sun X, Zhu Y, Sun H, etal.Comparison of varicella outbreaks in schools in China during different vaccination periods. Hum Vaccin Immunother. 2022 Nov 30;18(6):2114255.
- Shi L, Lu J, Sun X, etal. Impact of Varicella Immunization and Public Health and Social Measures on Varicella Incidence: Insights from Surveillance Data in Shanghai, 2013-2022. Vaccines (Basel). 2023 Nov 1;11(11):1674.
Figure 1.
Varicella case counts and incidence rates in Yanji city from 2018 to 2024.
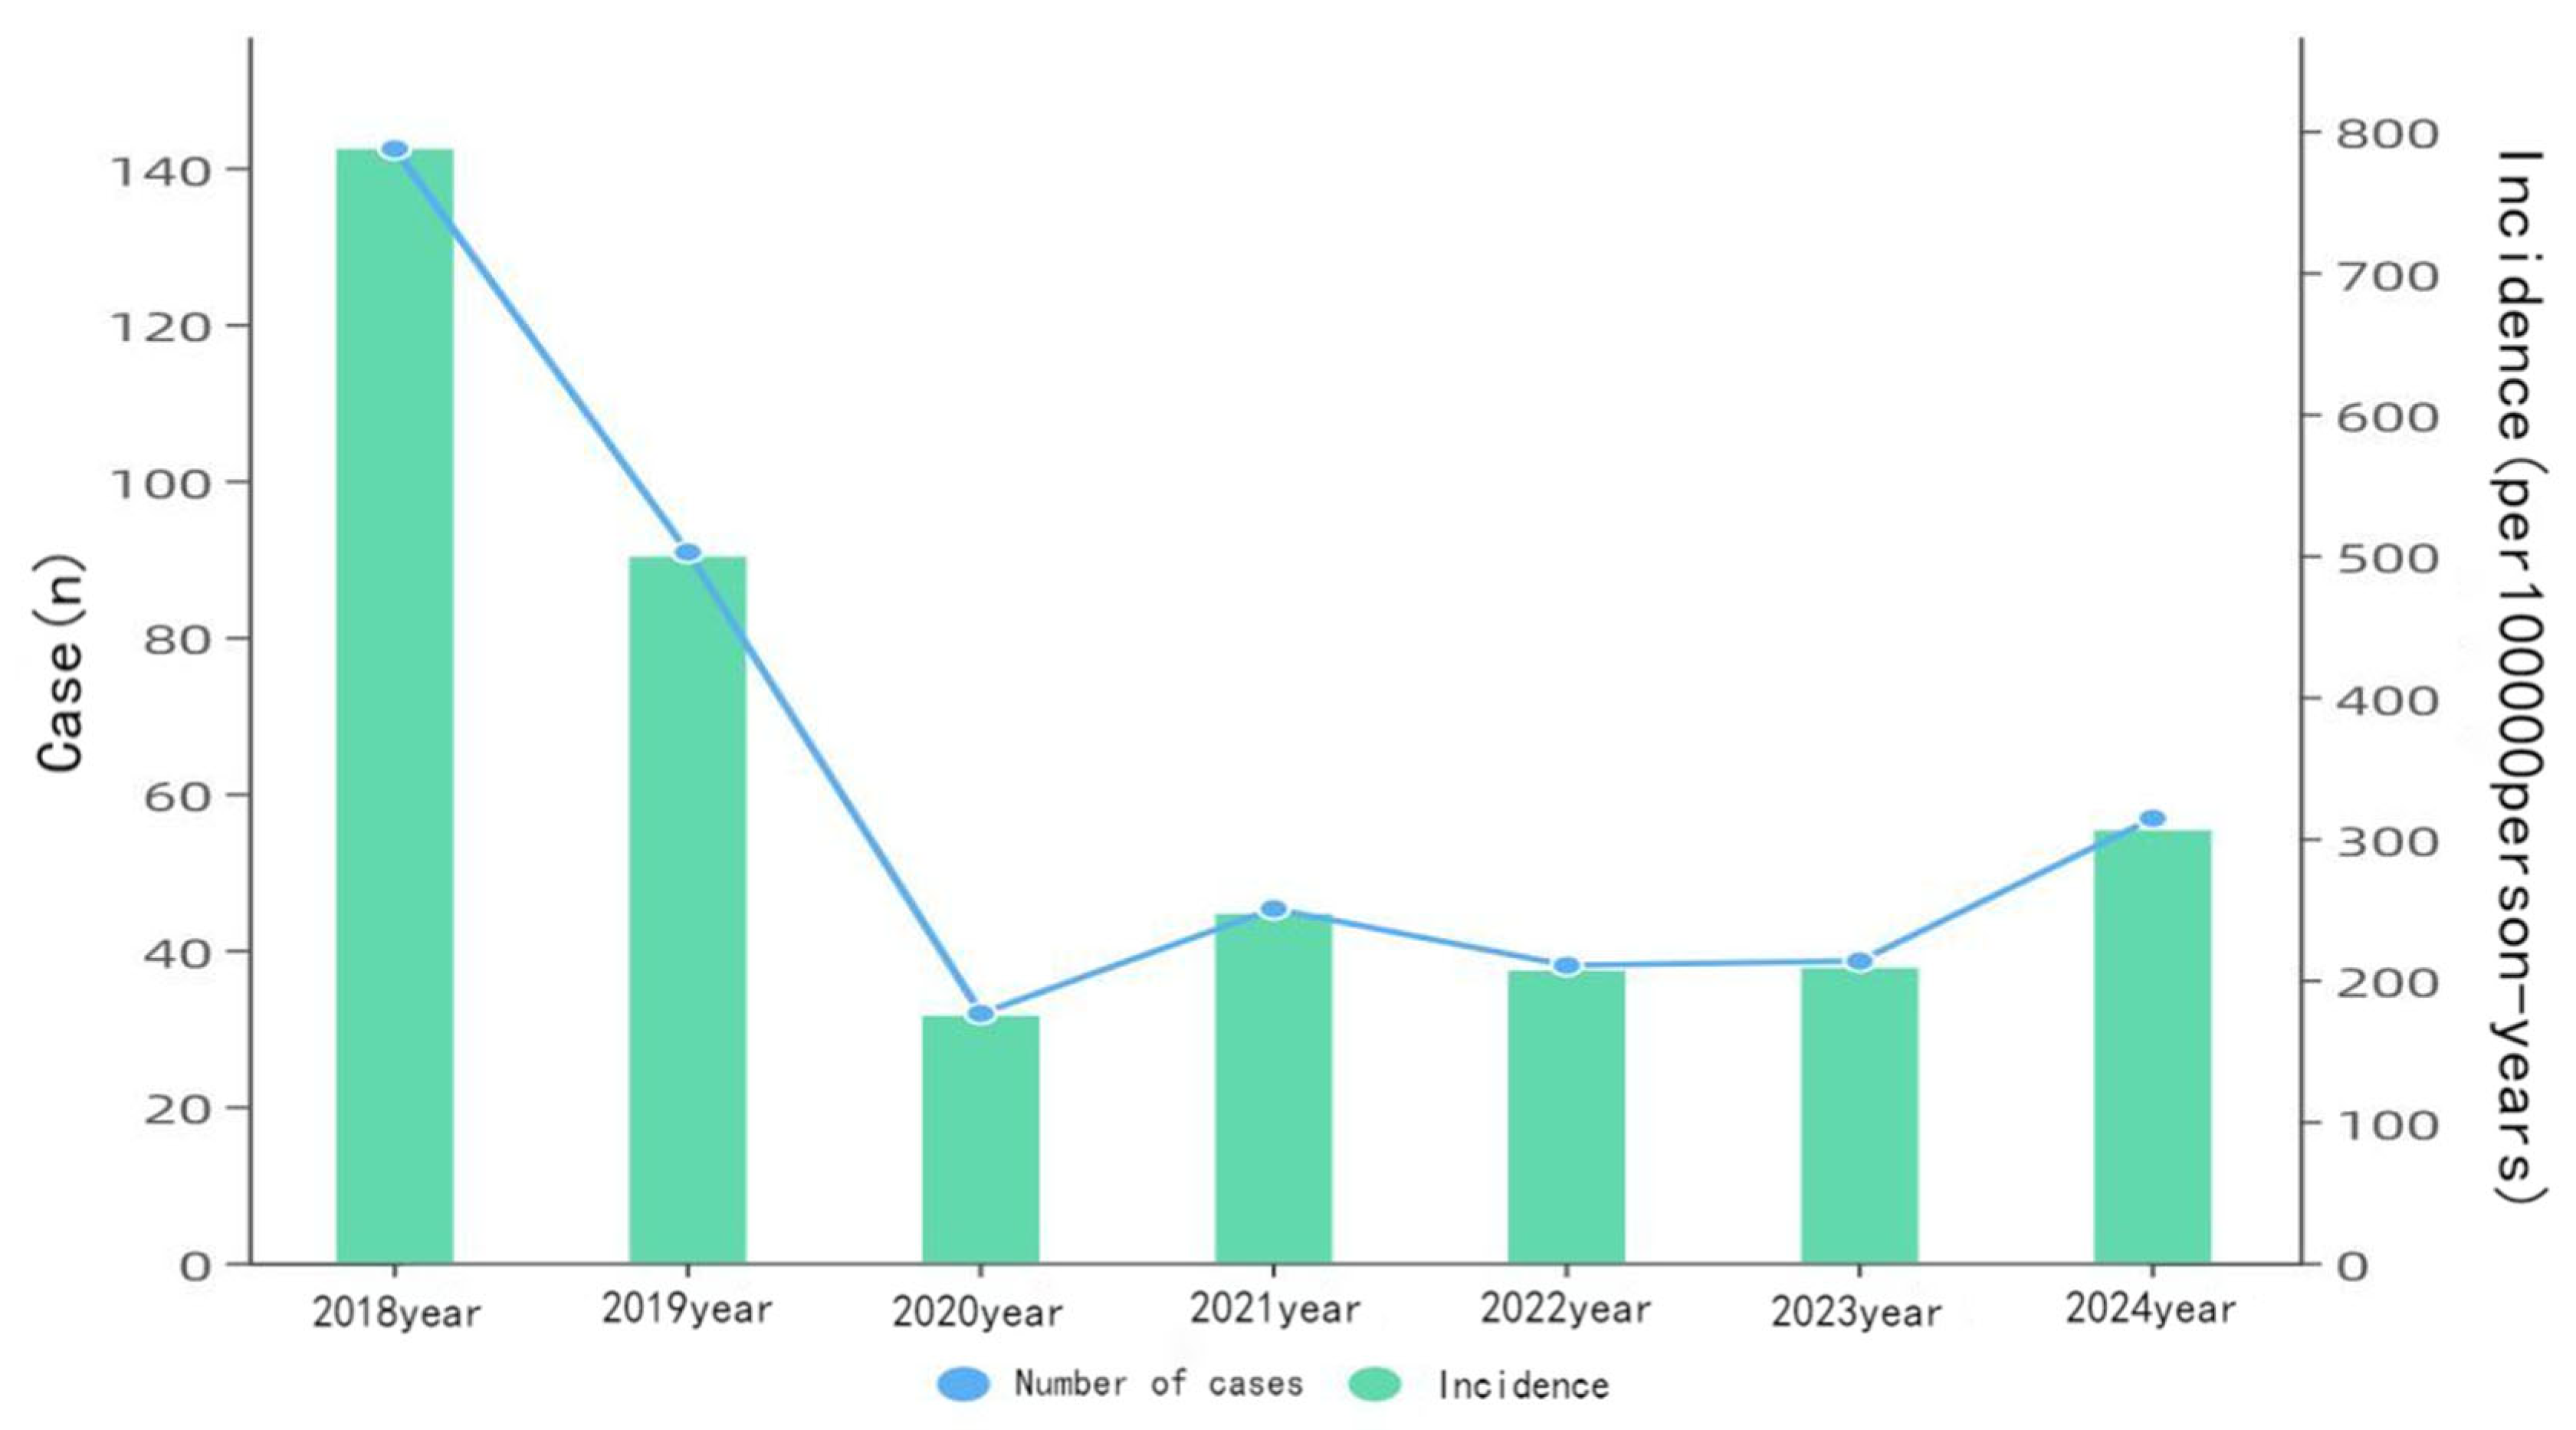
Figure 2.
Trends in varicella incidence rates in Yanji city from 2018 to 2024.
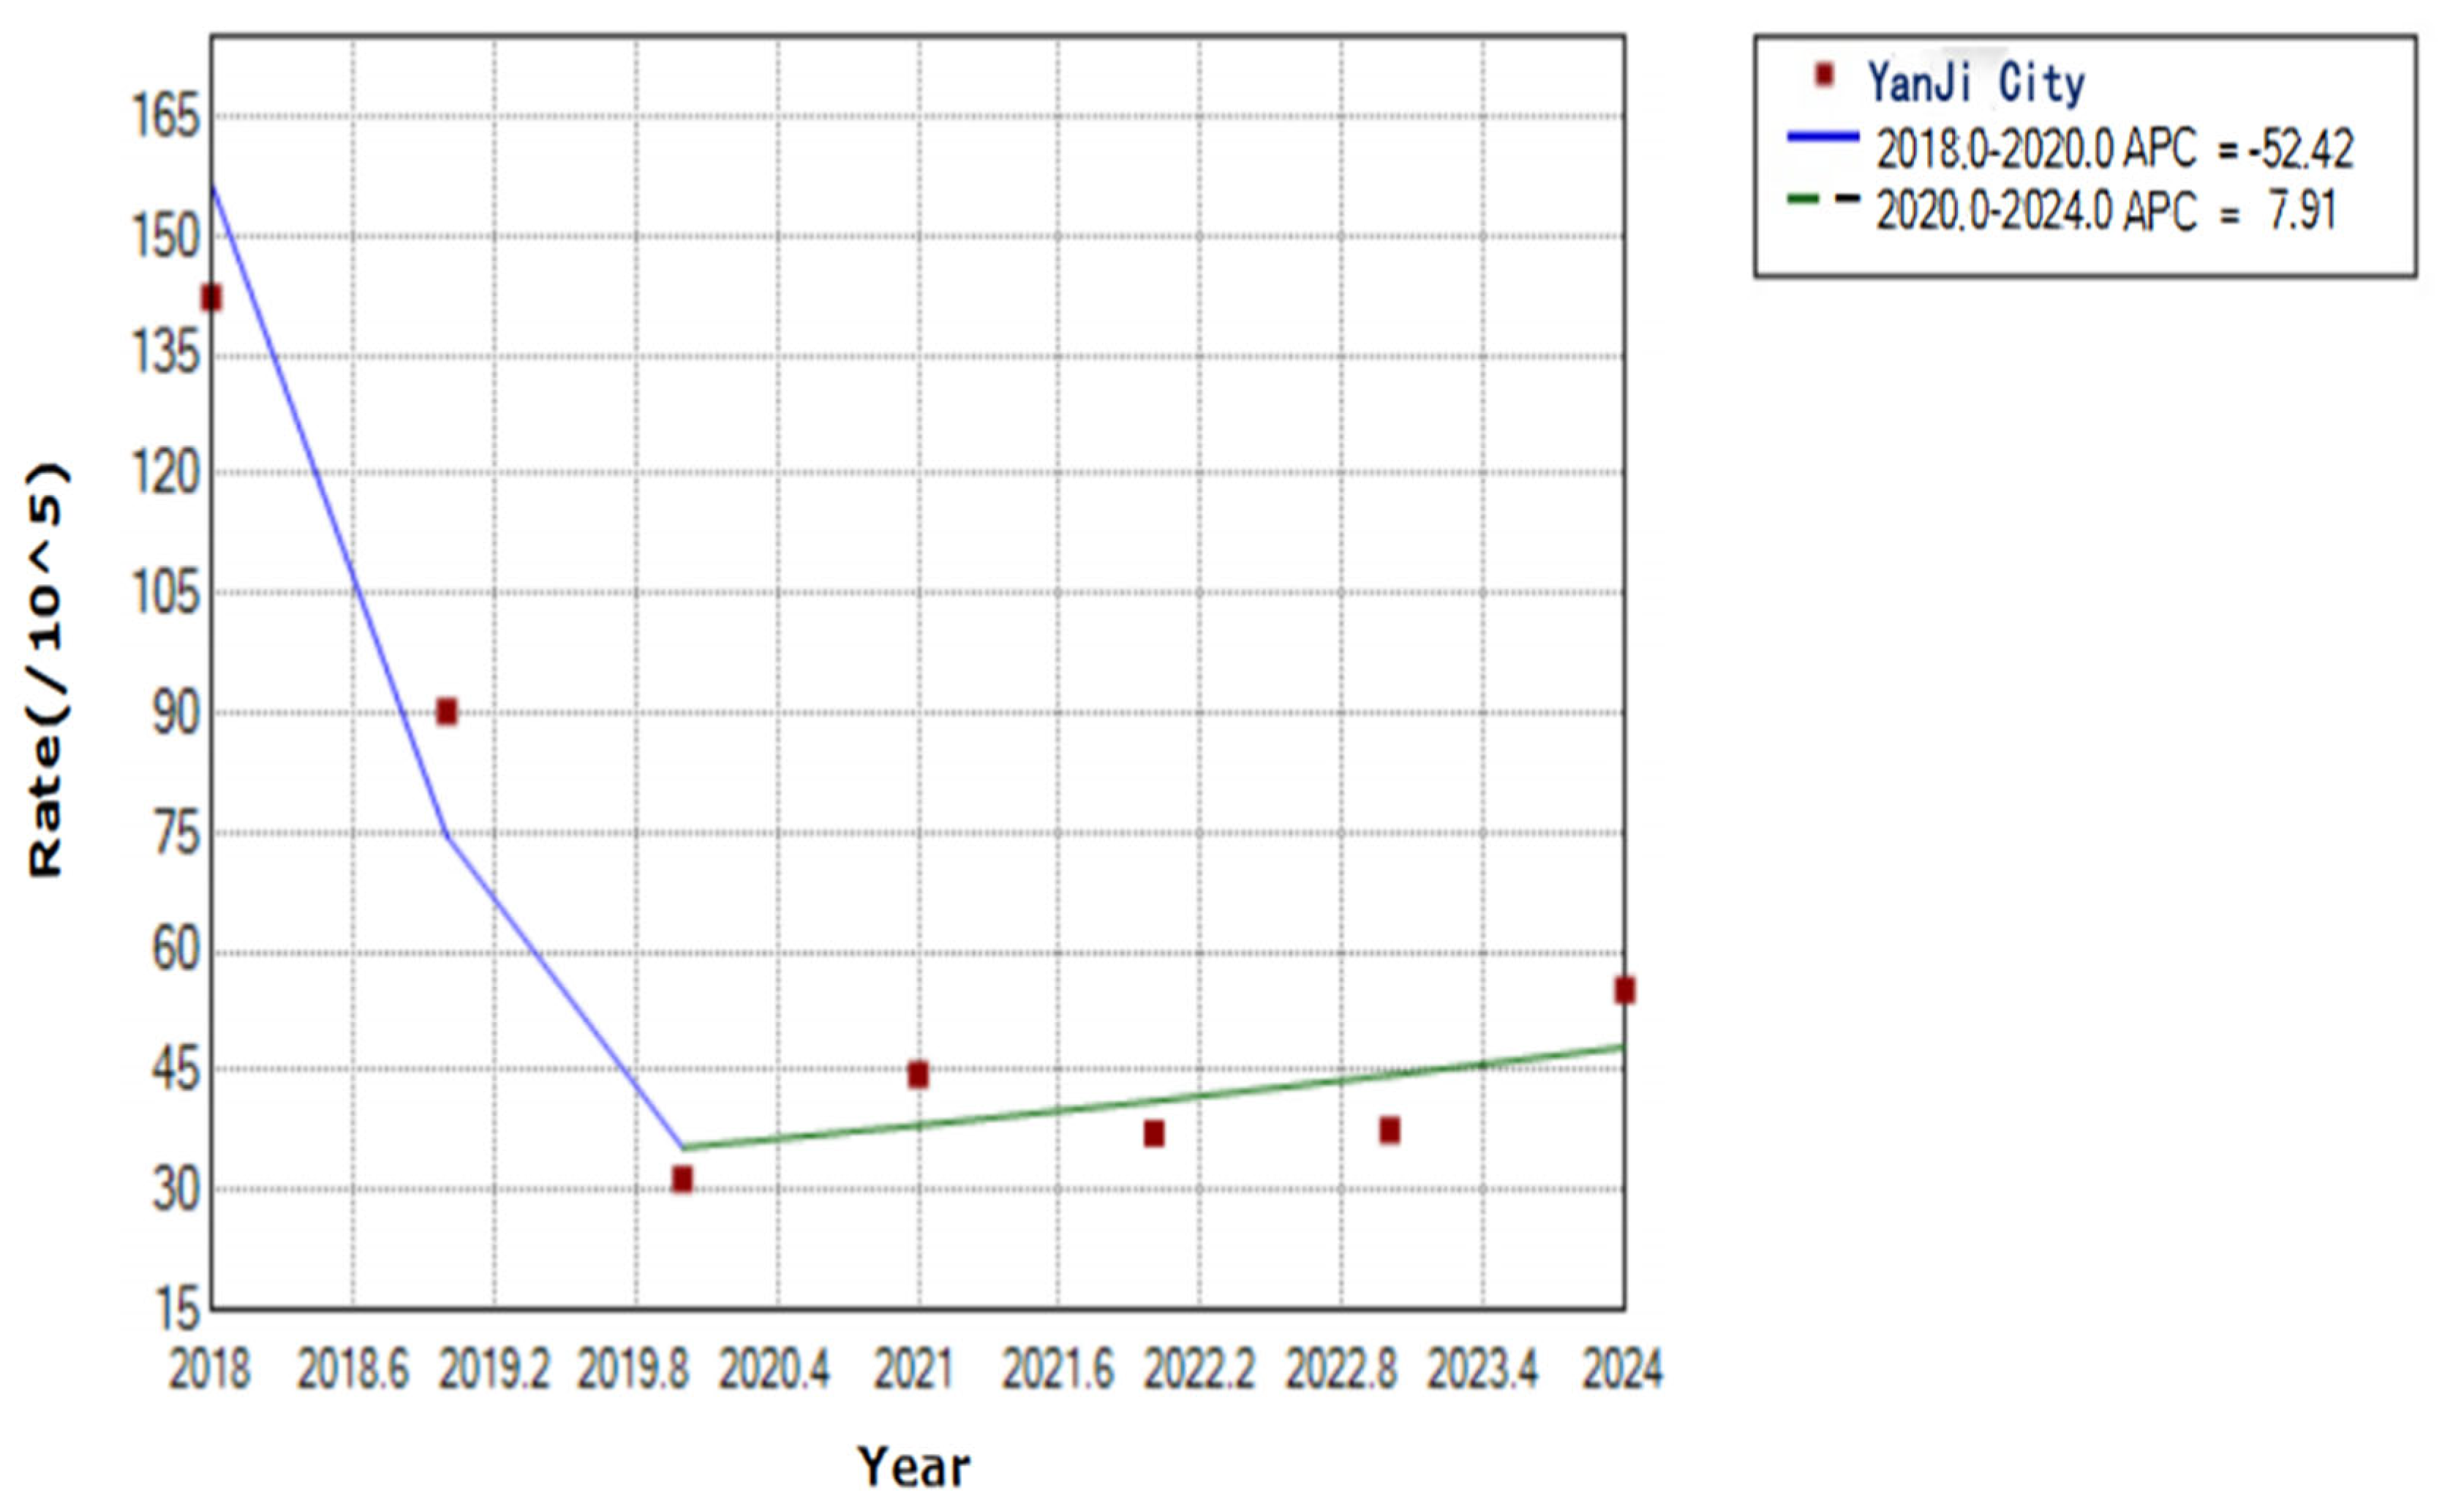
Figure 3.
Monthly distribution of varicella cases in Yanji city from 2018 to 2024.
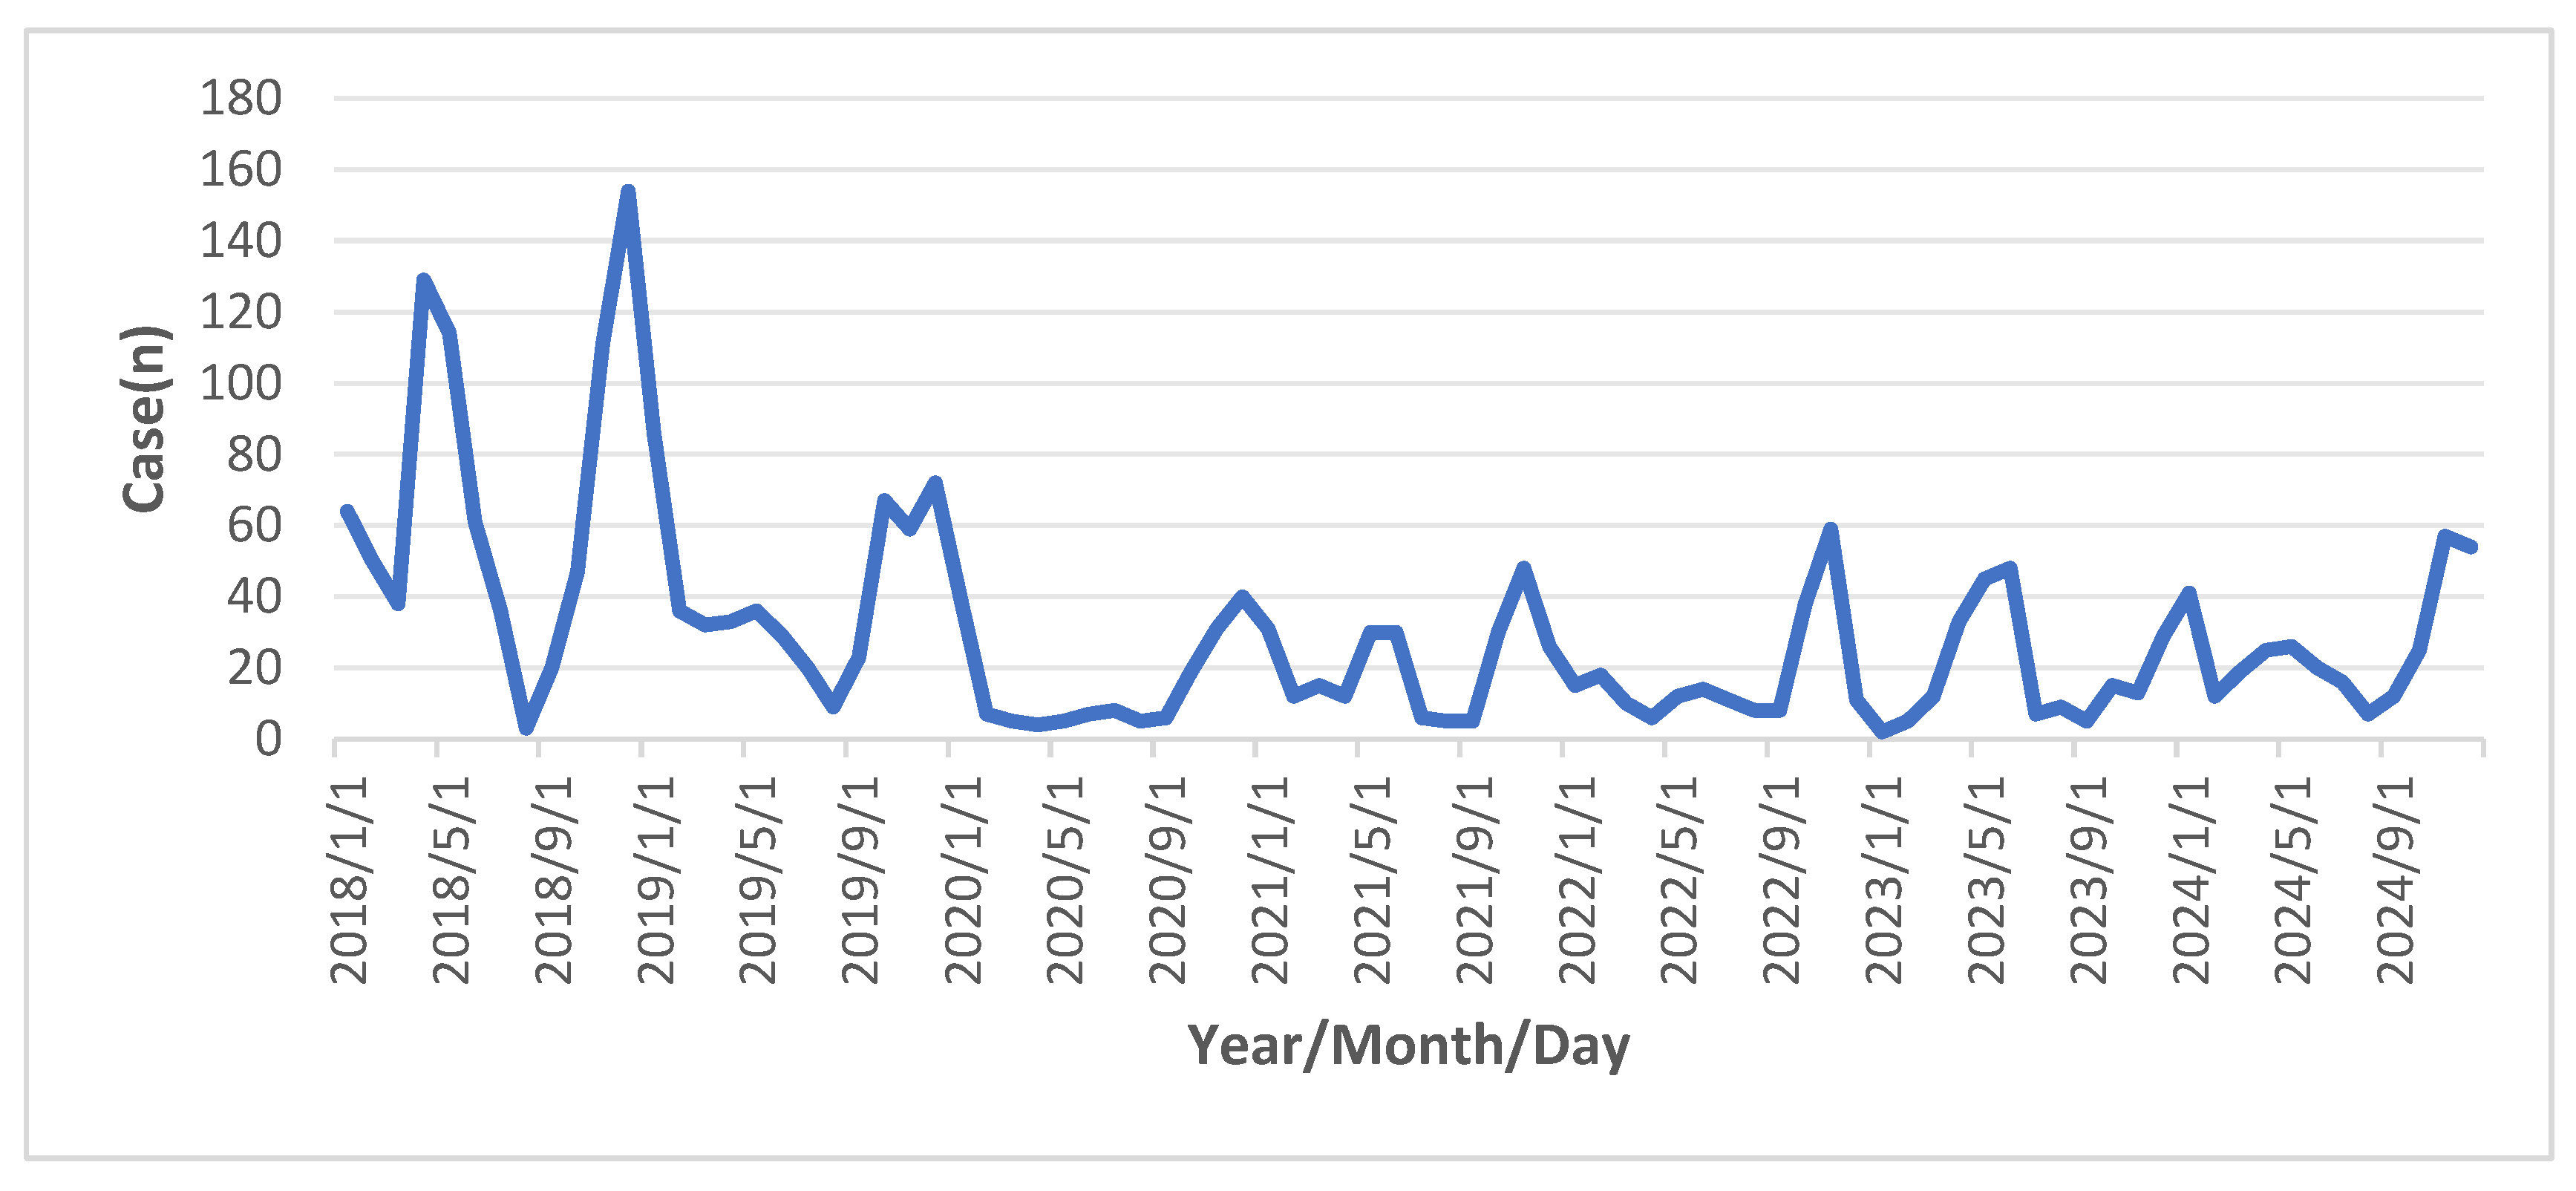
Figure 4.
Trends in varicella incidence rates in six streets and four towns in Yanji city from 2018 to 2024.
Figure 4.
Trends in varicella incidence rates in six streets and four towns in Yanji city from 2018 to 2024.
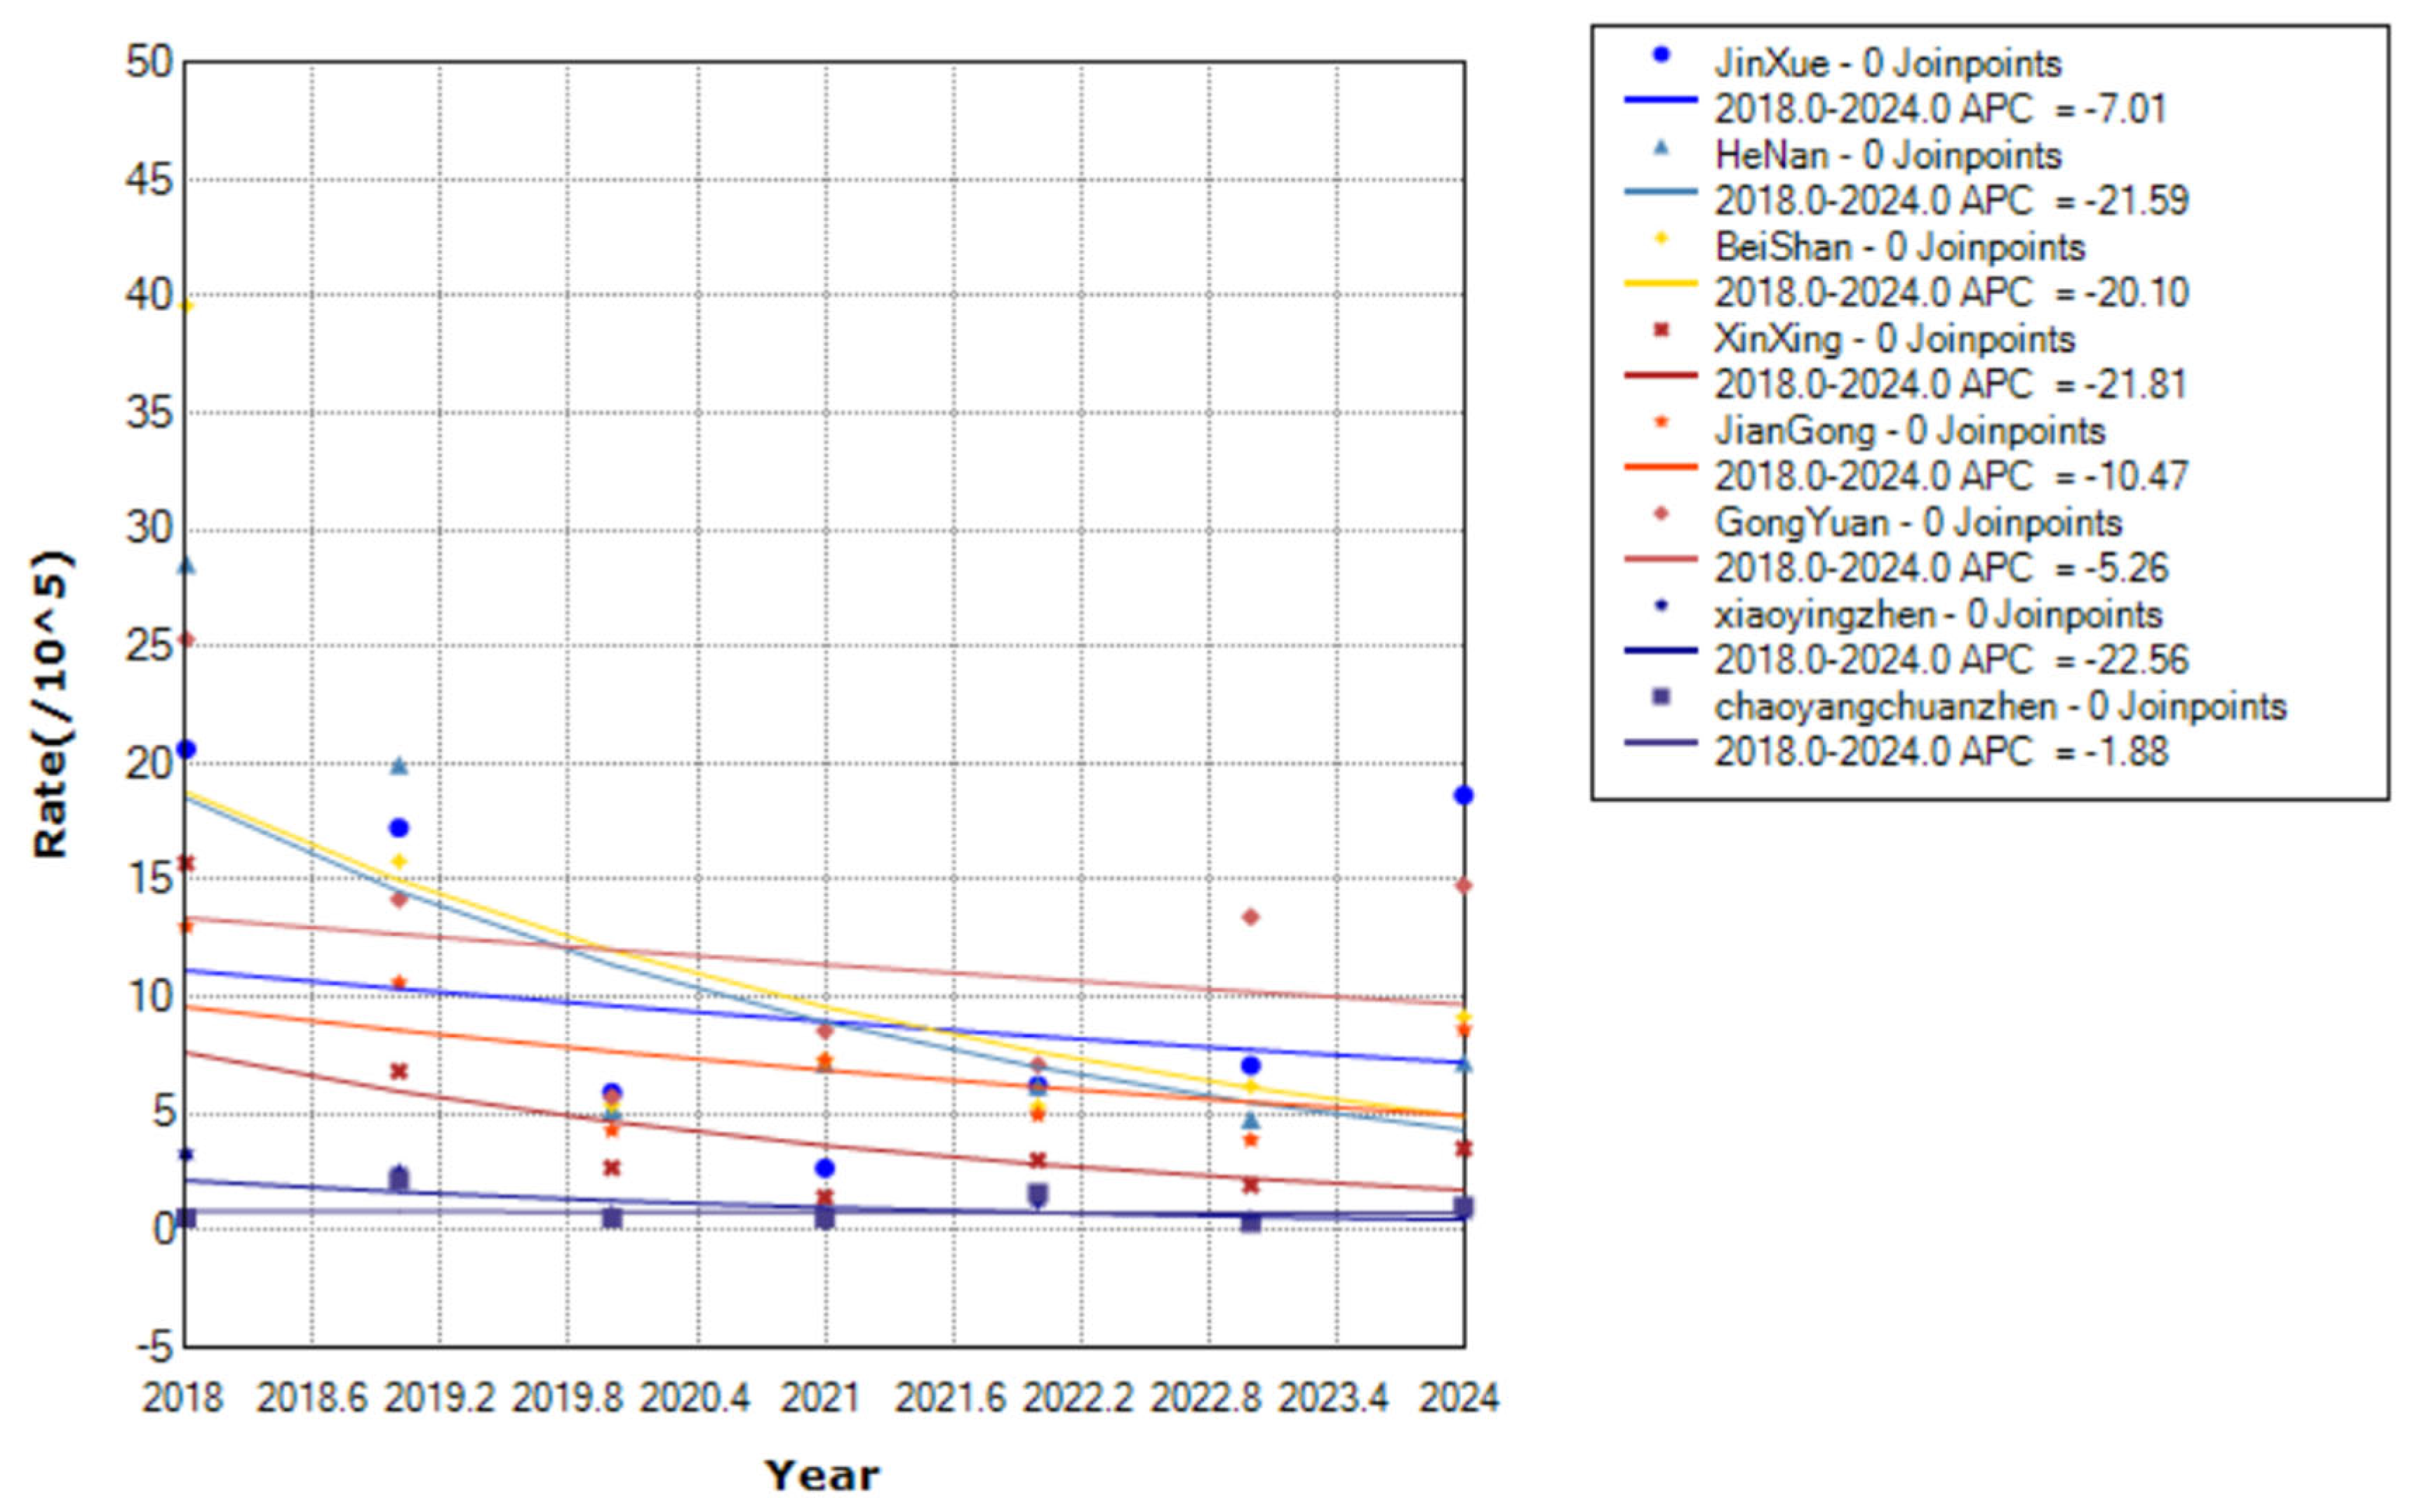
Figure 5.
Trends in varicella incidence rates by sex in Yanji city from 2018 to 2024.
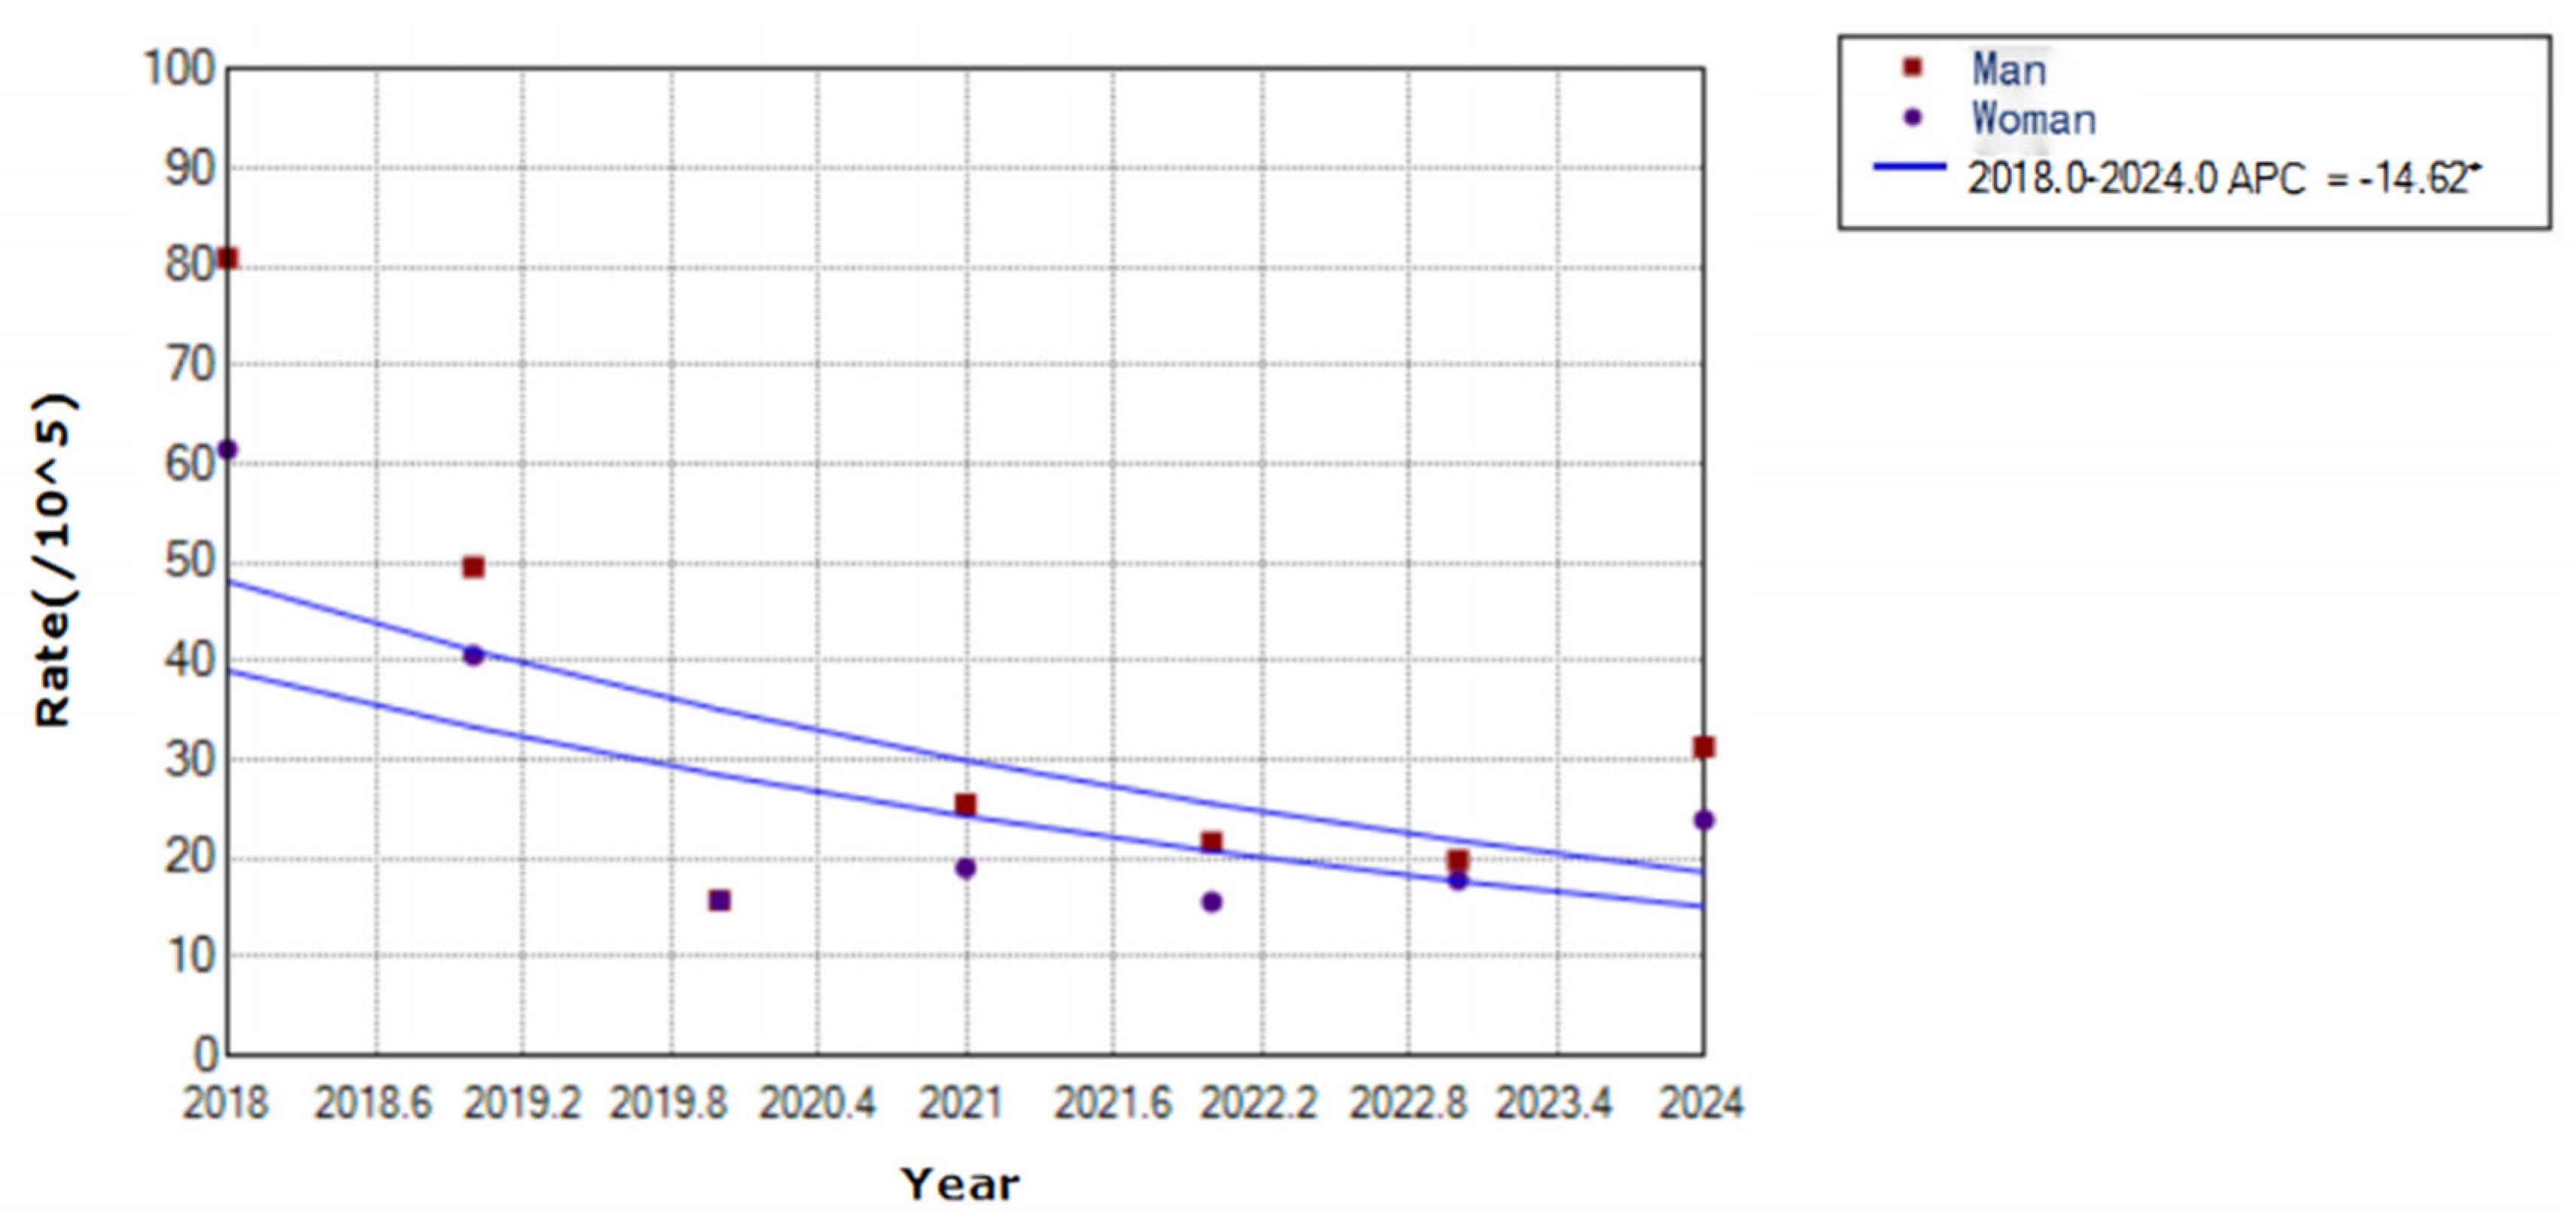
Figure 6.
Trends in varicella incidence rates by age group in Yanji city from 2018 to 2024.
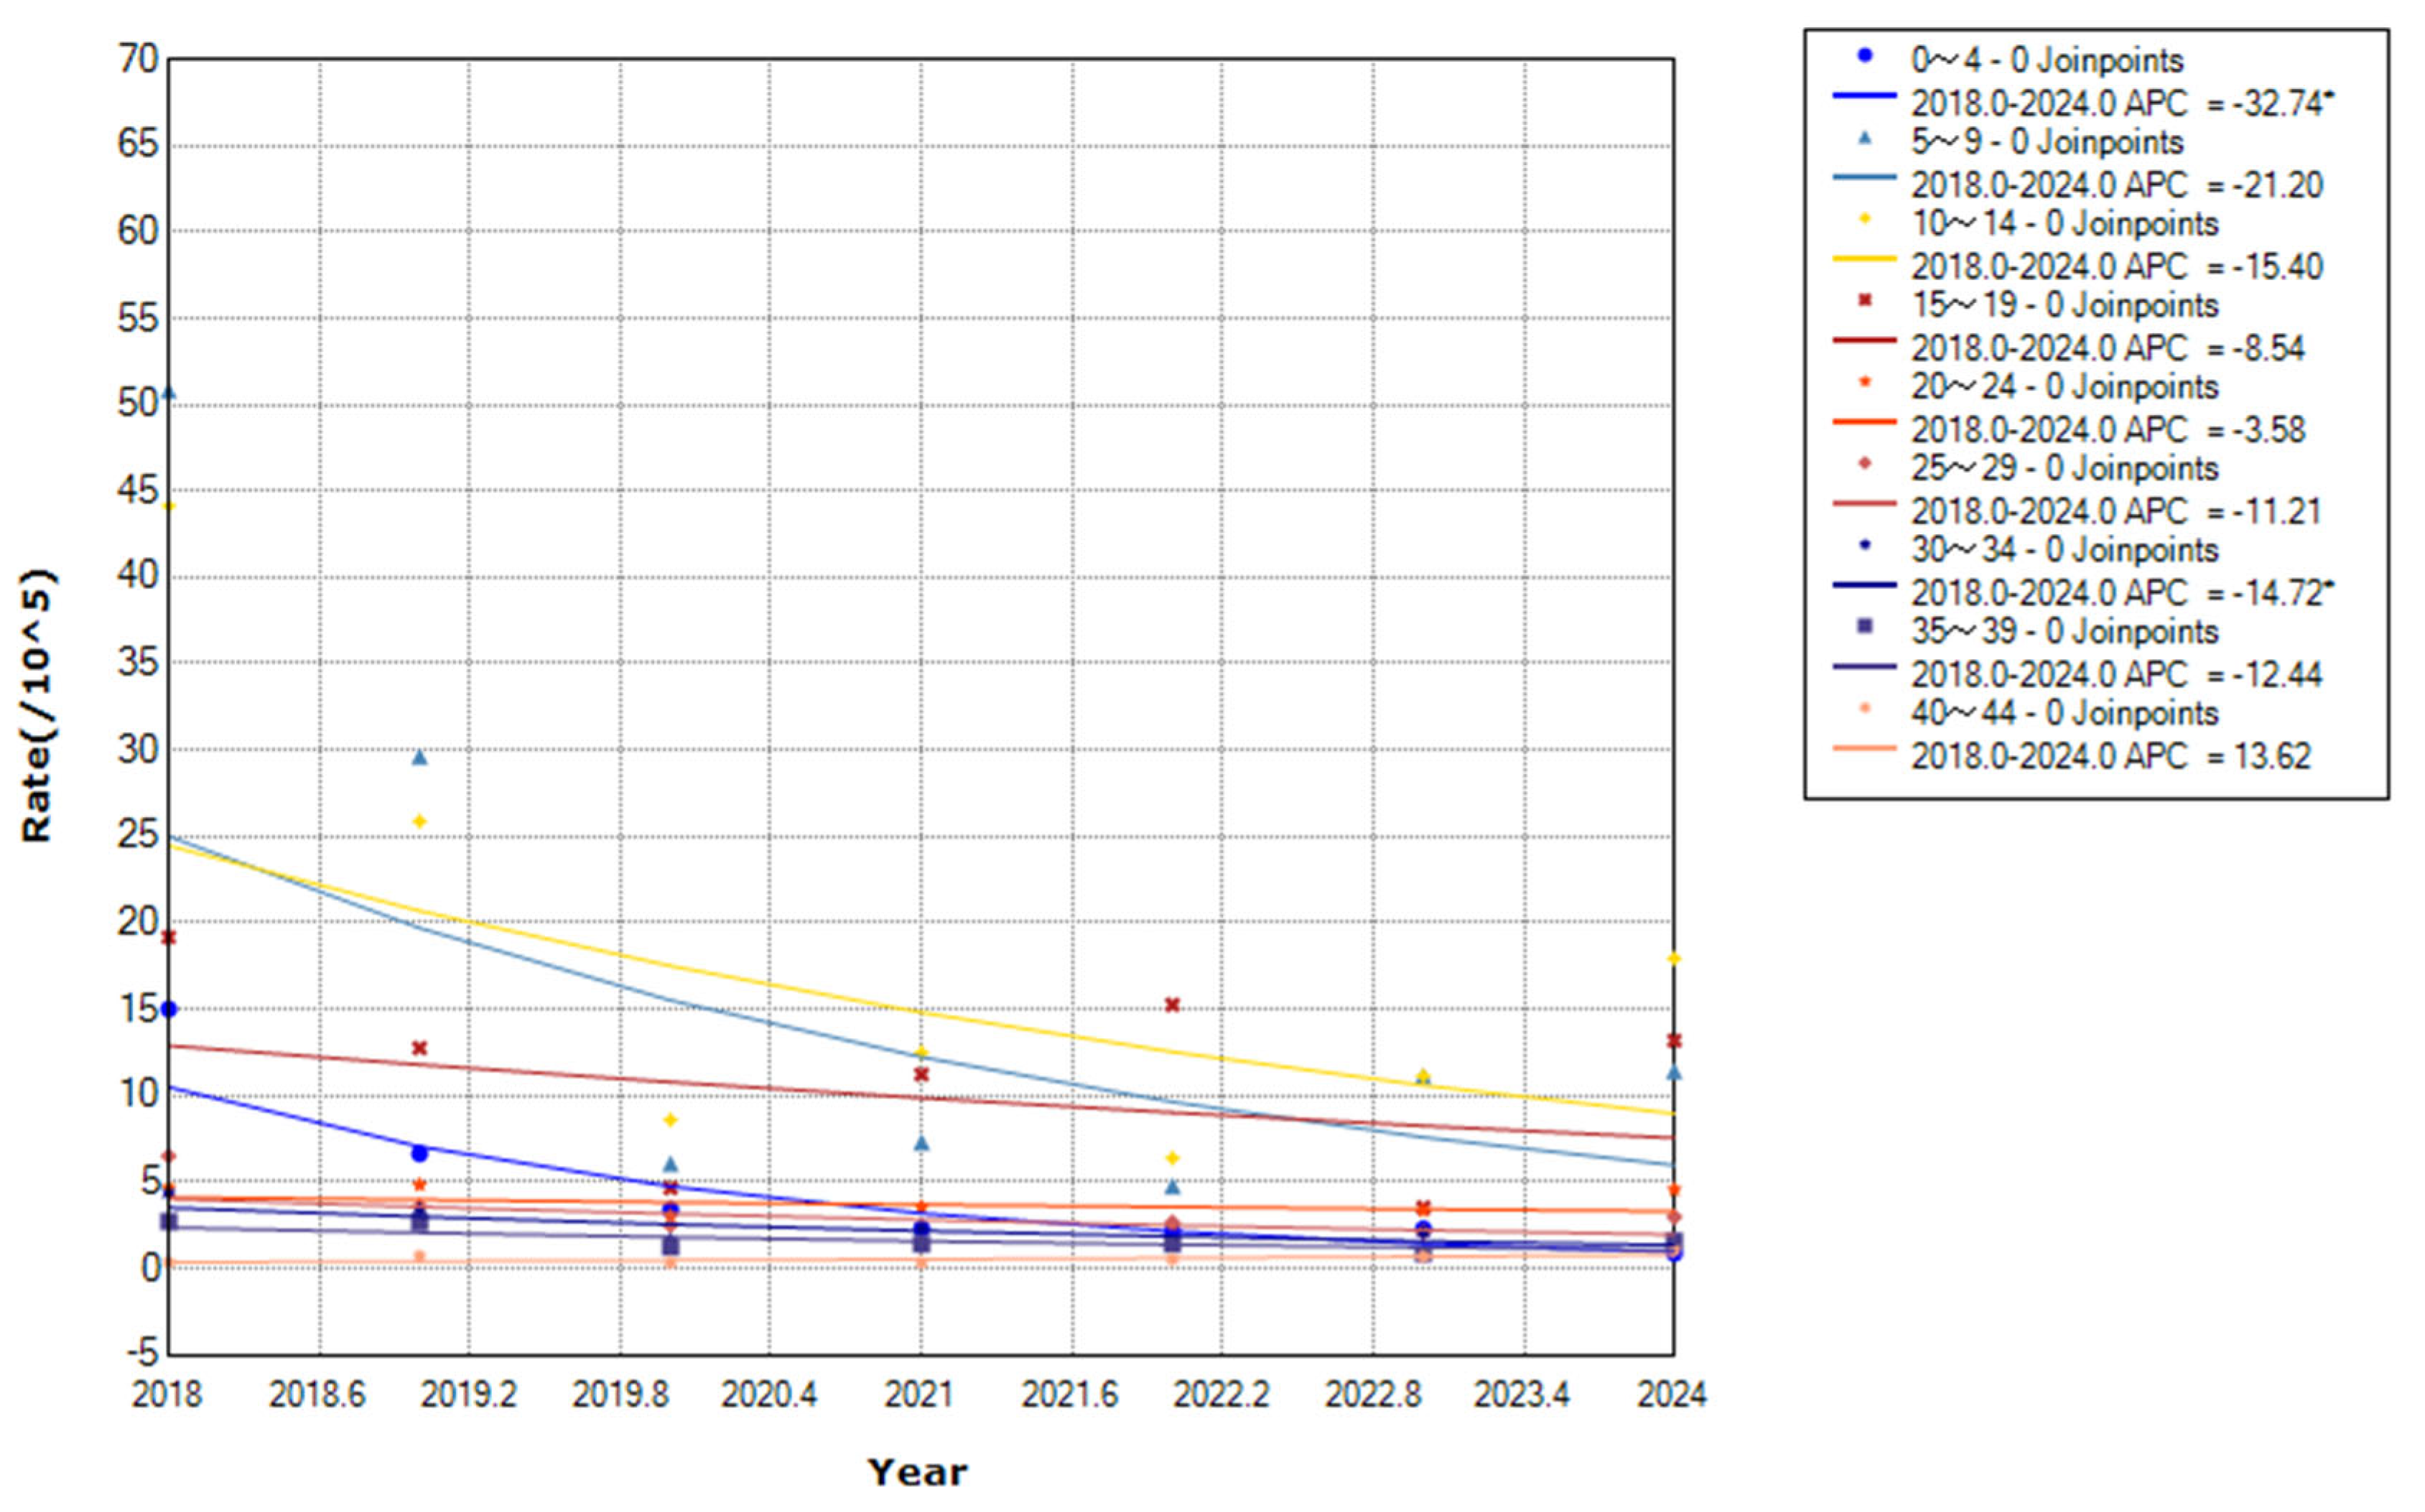
Figure 7.
Occupational distribution of varicella cases in Yanji city from 2018 to 2024.
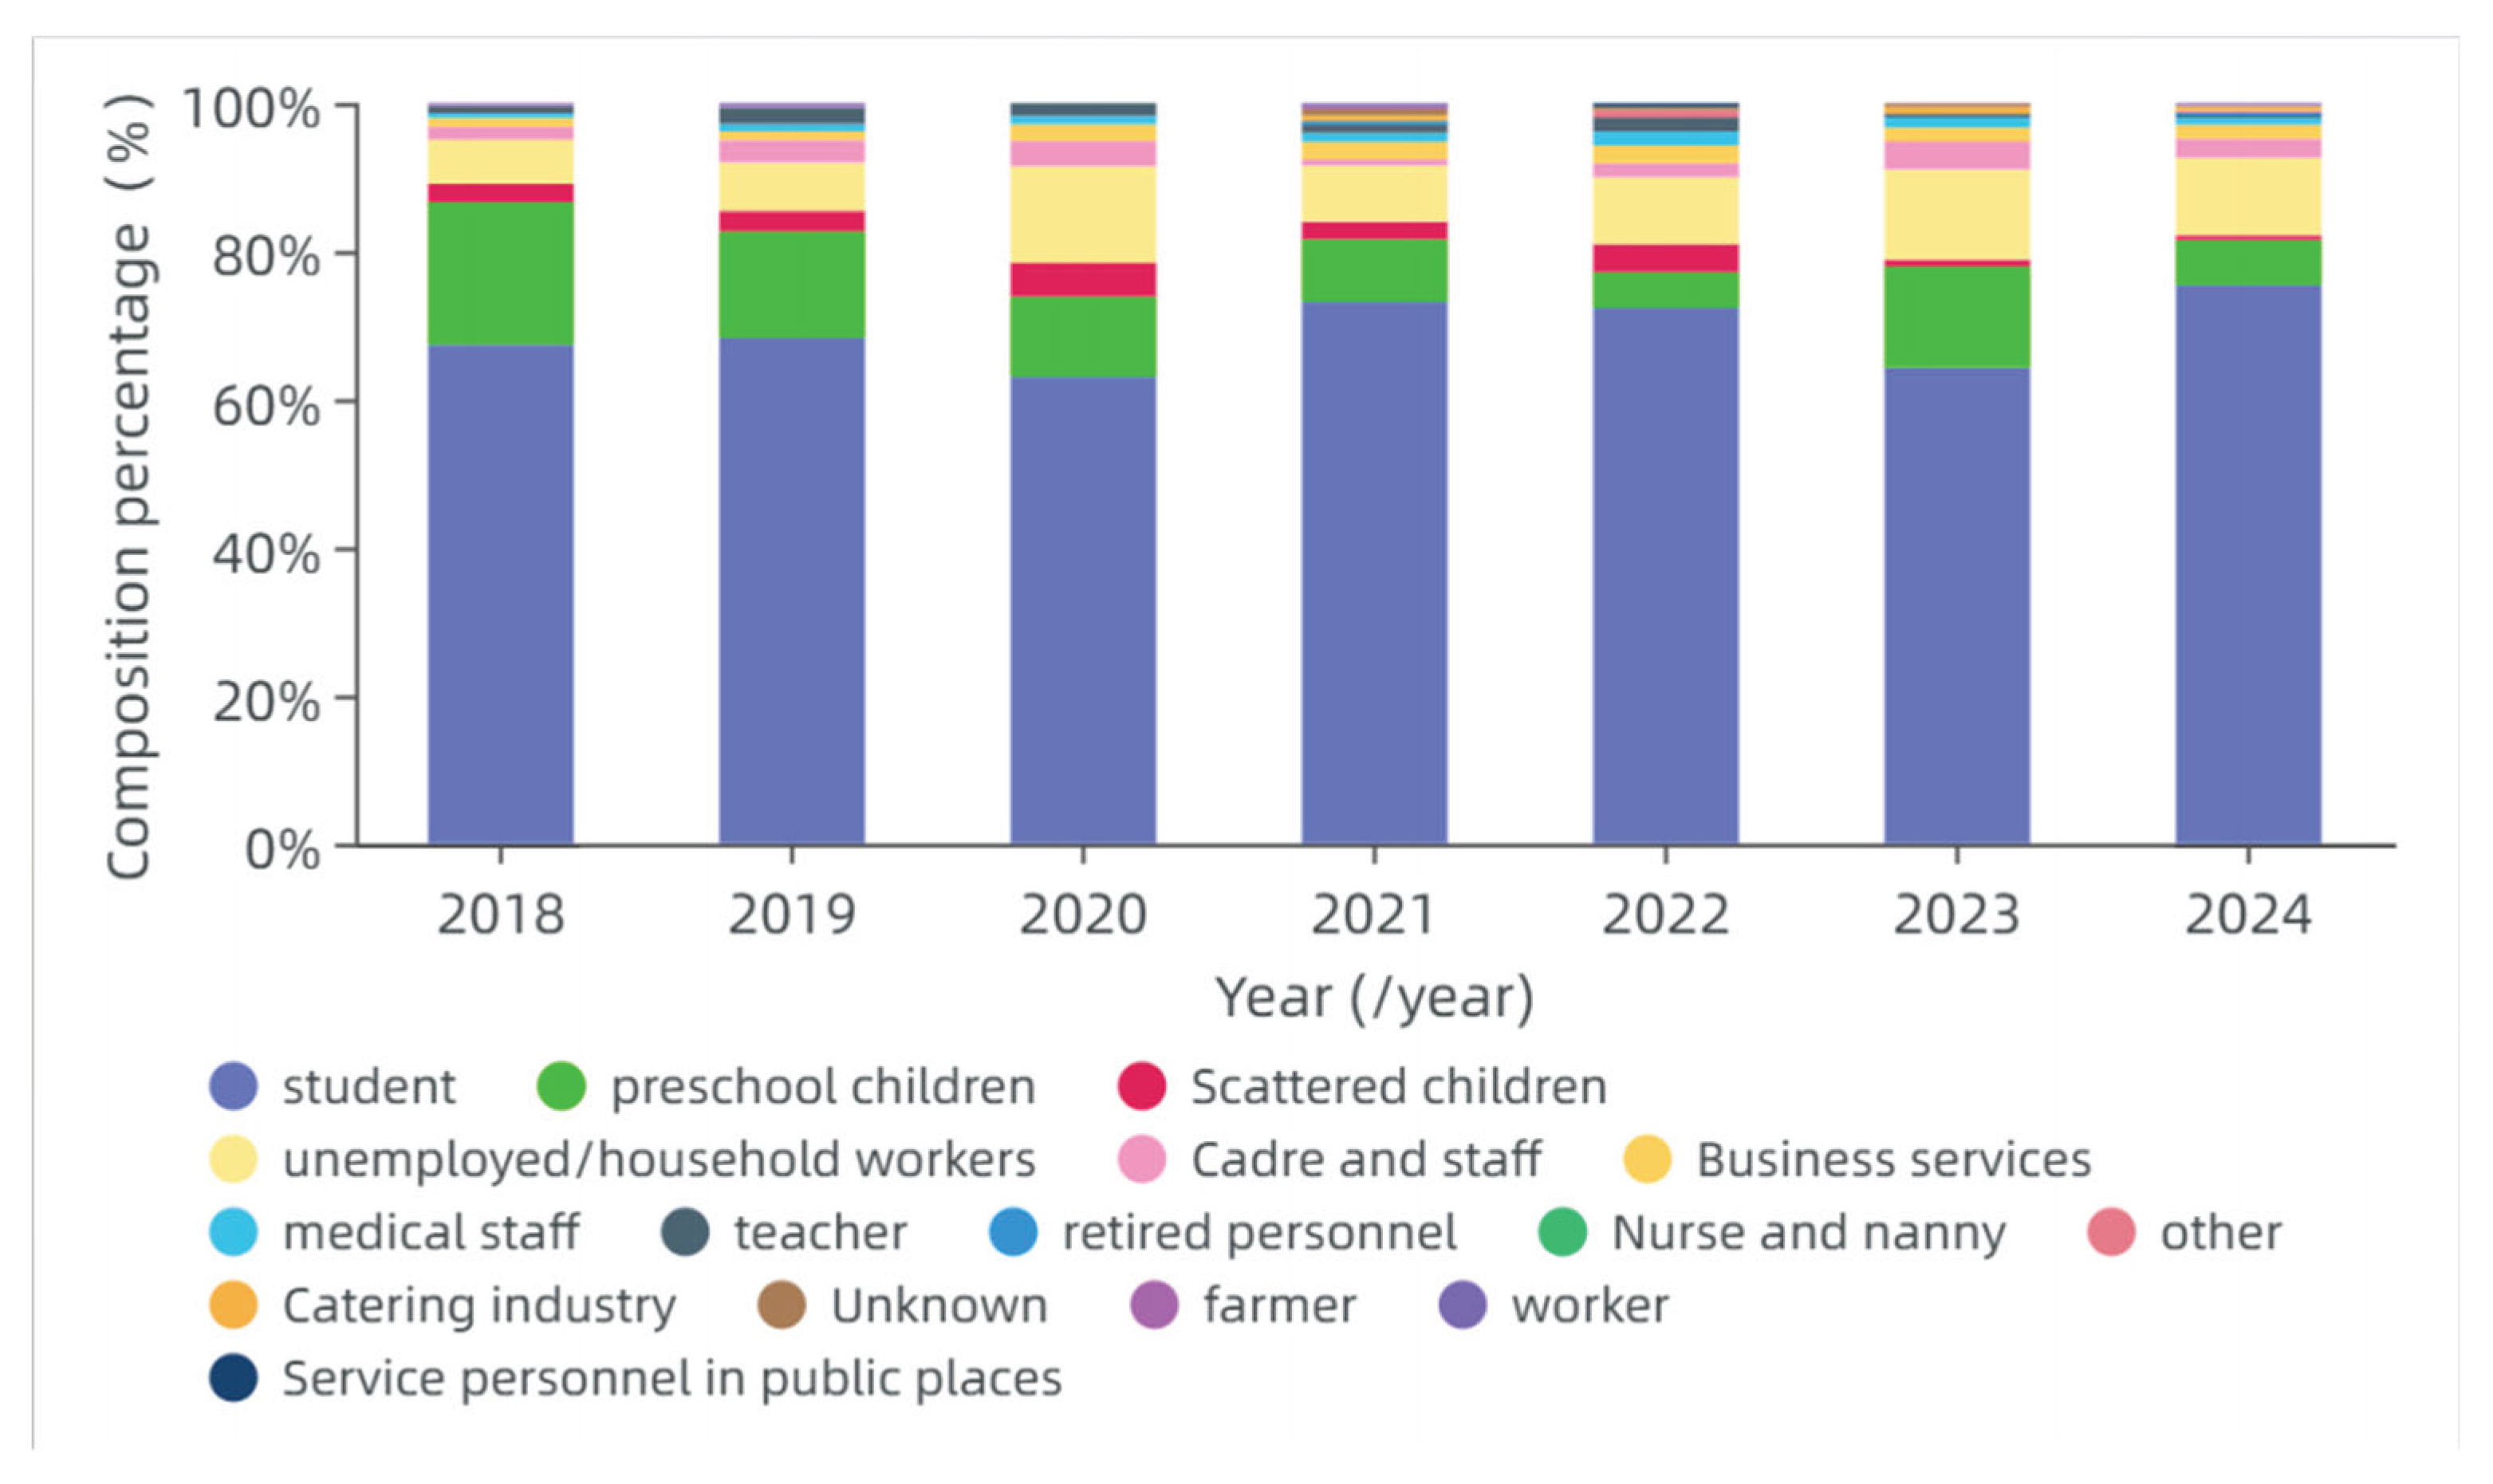
Table 1.
Proportion of Changchun Baike Varicella vaccine in Yanji City, 2018.
| Region | Total varicella vaccinations | Changchun Baike vaccinations | Proportion (%) |
| Yanji city | 12,342 | 3,491 | 28.3 |
| Jin Xue street | 2,198 | 631 | 28.7 |
| Beishan street | 1,999 | 487 | 24.4 |
| Xinxing street | 1,771 | 373 | 21.1 |
| Jiangong street | 2,647 | 723 | 27.3 |
| Henan street | 1,780 | 636 | 35.7 |
| Gongyuan street | 2,062 | 522 | 25.3 |
| Chaoyangchuan town | 234 | 71 | 30.3 |
| Yilan town | 523 | 25 | 4.7 |
| Xiaoying town | 77 | 23 | 29.8 |
| Sandaowan town | 0 | 0 | 0 |
Table 2.
Proportion of Changchun Baike Varicella vaccine in Yanji City, 2019.
| Region | Total varicella vaccinations | Changchun Baike vaccinations | Proportion (%) |
| Yanji city | 8735 | 641 | 7.34 |
| Jin Xue street | 1203 | 137 | 11.3 |
| Beishan street | 1169 | 39 | 3.3 |
| Xinxing street | 766 | 57 | 7.4 |
| Jiangong street | 2120 | 161 | 7.6 |
| Henan street | 1619 | 161 | 9.9 |
| Gongyuan street | 1602 | 202 | 10.1 |
| Chaoyangchuan town | 164 | 15 | 9.1 |
| Yilan town | 25 | 5 | 20 |
| Xiaoying town | 69 | 2 | 2.8 |
| Sandaowan town | 0 | 0 | 0 |
Table 3.
Proportion of Changchun Baike Varicella vaccine in Yanji City, 2020.
| Region | Total varicella vaccinations | Changchun Baike vaccinations | Proportion (%) |
| Yanji city | 10011 | 959 | 9.58 |
| Jin Xue street | 1249 | 85 | 6.8 |
| Beishan street | 1256 | 43 | 3.4 |
| Xinxing street | 996 | 40 | 4 |
| Jiangong street | 1917 | 269 | 14 |
| Henan street | 1171 | 15 | 1.2 |
| Gongyuan street | 2105 | 232 | 11 |
| Chaoyangchuan town | 210 | 160 | 76.1 |
| Yilan town | 20 | 10 | 50 |
| Xiaoying town | 139 | 105 | 75.5 |
| Sandaowan town | 0 | 0 | 0 |
Table 5.
Cox regression analysis of changchun Baike Varicella vaccine, 2018–2022.
| Variable | β | S.E | Z | p | HR (95% CI) | aVE (%) (95% CI) |
| Doses | ||||||
| 0 | - | - | - | - | 1.00 (Reference) | - |
| 1 | -4.68 | 0.29 | -16.14 | <.001 | 0.01 (0.01–0.02) | 99.0 (98.0–99.0) |
| 2 | -4.70 | 0.30 | -15.51 | <.001 | 0.01 (0.01–0.02) | 99.0 (98.0–99.0) |
| All Doses | -4.22 | 0.21 | -20.09 | <.001 | 0.01 (0.01–0.02) | 99.0 (98.0–99.0) |
Table 7.
Cox regression analysis of Changchun Baike Varicella vaccine, 2019–2023.
| Variable | β | S.E | Z | p | HR (95% CI) | aVE (%) (95% CI) |
| Doses | ||||||
| 0 | - | - | - | - | 1.00 (Reference) | - |
| 1 | -4.99 | 0.71 | -7.04 | <.001 | 0.01 (0.00–0.03) | 99.0 (97.0–100.0) |
| 2 | -4.99 | 0.71 | -7.04 | <.001 | 0.01 (0.00–0.03) | 99.0 (97.0–100.0) |
| All Doses | -4.59 | 0.58 | -7.91 | <.001 | 0.01 (0.01–0.02) | 99.0 (97.0–100.0) |
Table 9.
Cox regression analysis of Changchun Baike Varicella vaccine, 2020–2024.
| Variable | β | S.E | Z | p | HR (95% CI) | aVE (%) (95% CI) |
| Doses | ||||||
| 0 | - | - | - | - | 1.00 (Reference) | - |
| 1 | -3.82 | 0.58 | -6.54 | <.001 | 0.02 (0.00 ~ 0.07) | 98.0 (97.0~99.0) |
| 2 | -5.23 | 0.58 | -9.04 | <.001 | 0.01 (0.00 ~ 0.02) | 99.0 (98.0~100.0) |
| All Doses | -4.63 | 0.41 | -10.65 | <.001 | 0.01 (0.01 ~ 0.03) | 99.0 (98.0~100.0) |
Disclaimer/Publisher’s Note: The statements, opinions and data contained in all publications are solely those of the individual author(s) and contributor(s) and not of MDPI and/or the editor(s). MDPI and/or the editor(s) disclaim responsibility for any injury to people or property resulting from any ideas, methods, instructions or products referred to in the content. |
© 2025 by the authors. Licensee MDPI, Basel, Switzerland. This article is an open access article distributed under the terms and conditions of the Creative Commons Attribution (CC BY) license (http://creativecommons.org/licenses/by/4.0/).
Copyright: This open access article is published under a Creative Commons CC BY 4.0 license, which permit the free download, distribution, and reuse, provided that the author and preprint are cited in any reuse.


