
Submitted:
24 November 2025
Posted:
25 November 2025
You are already at the latest version
Abstract
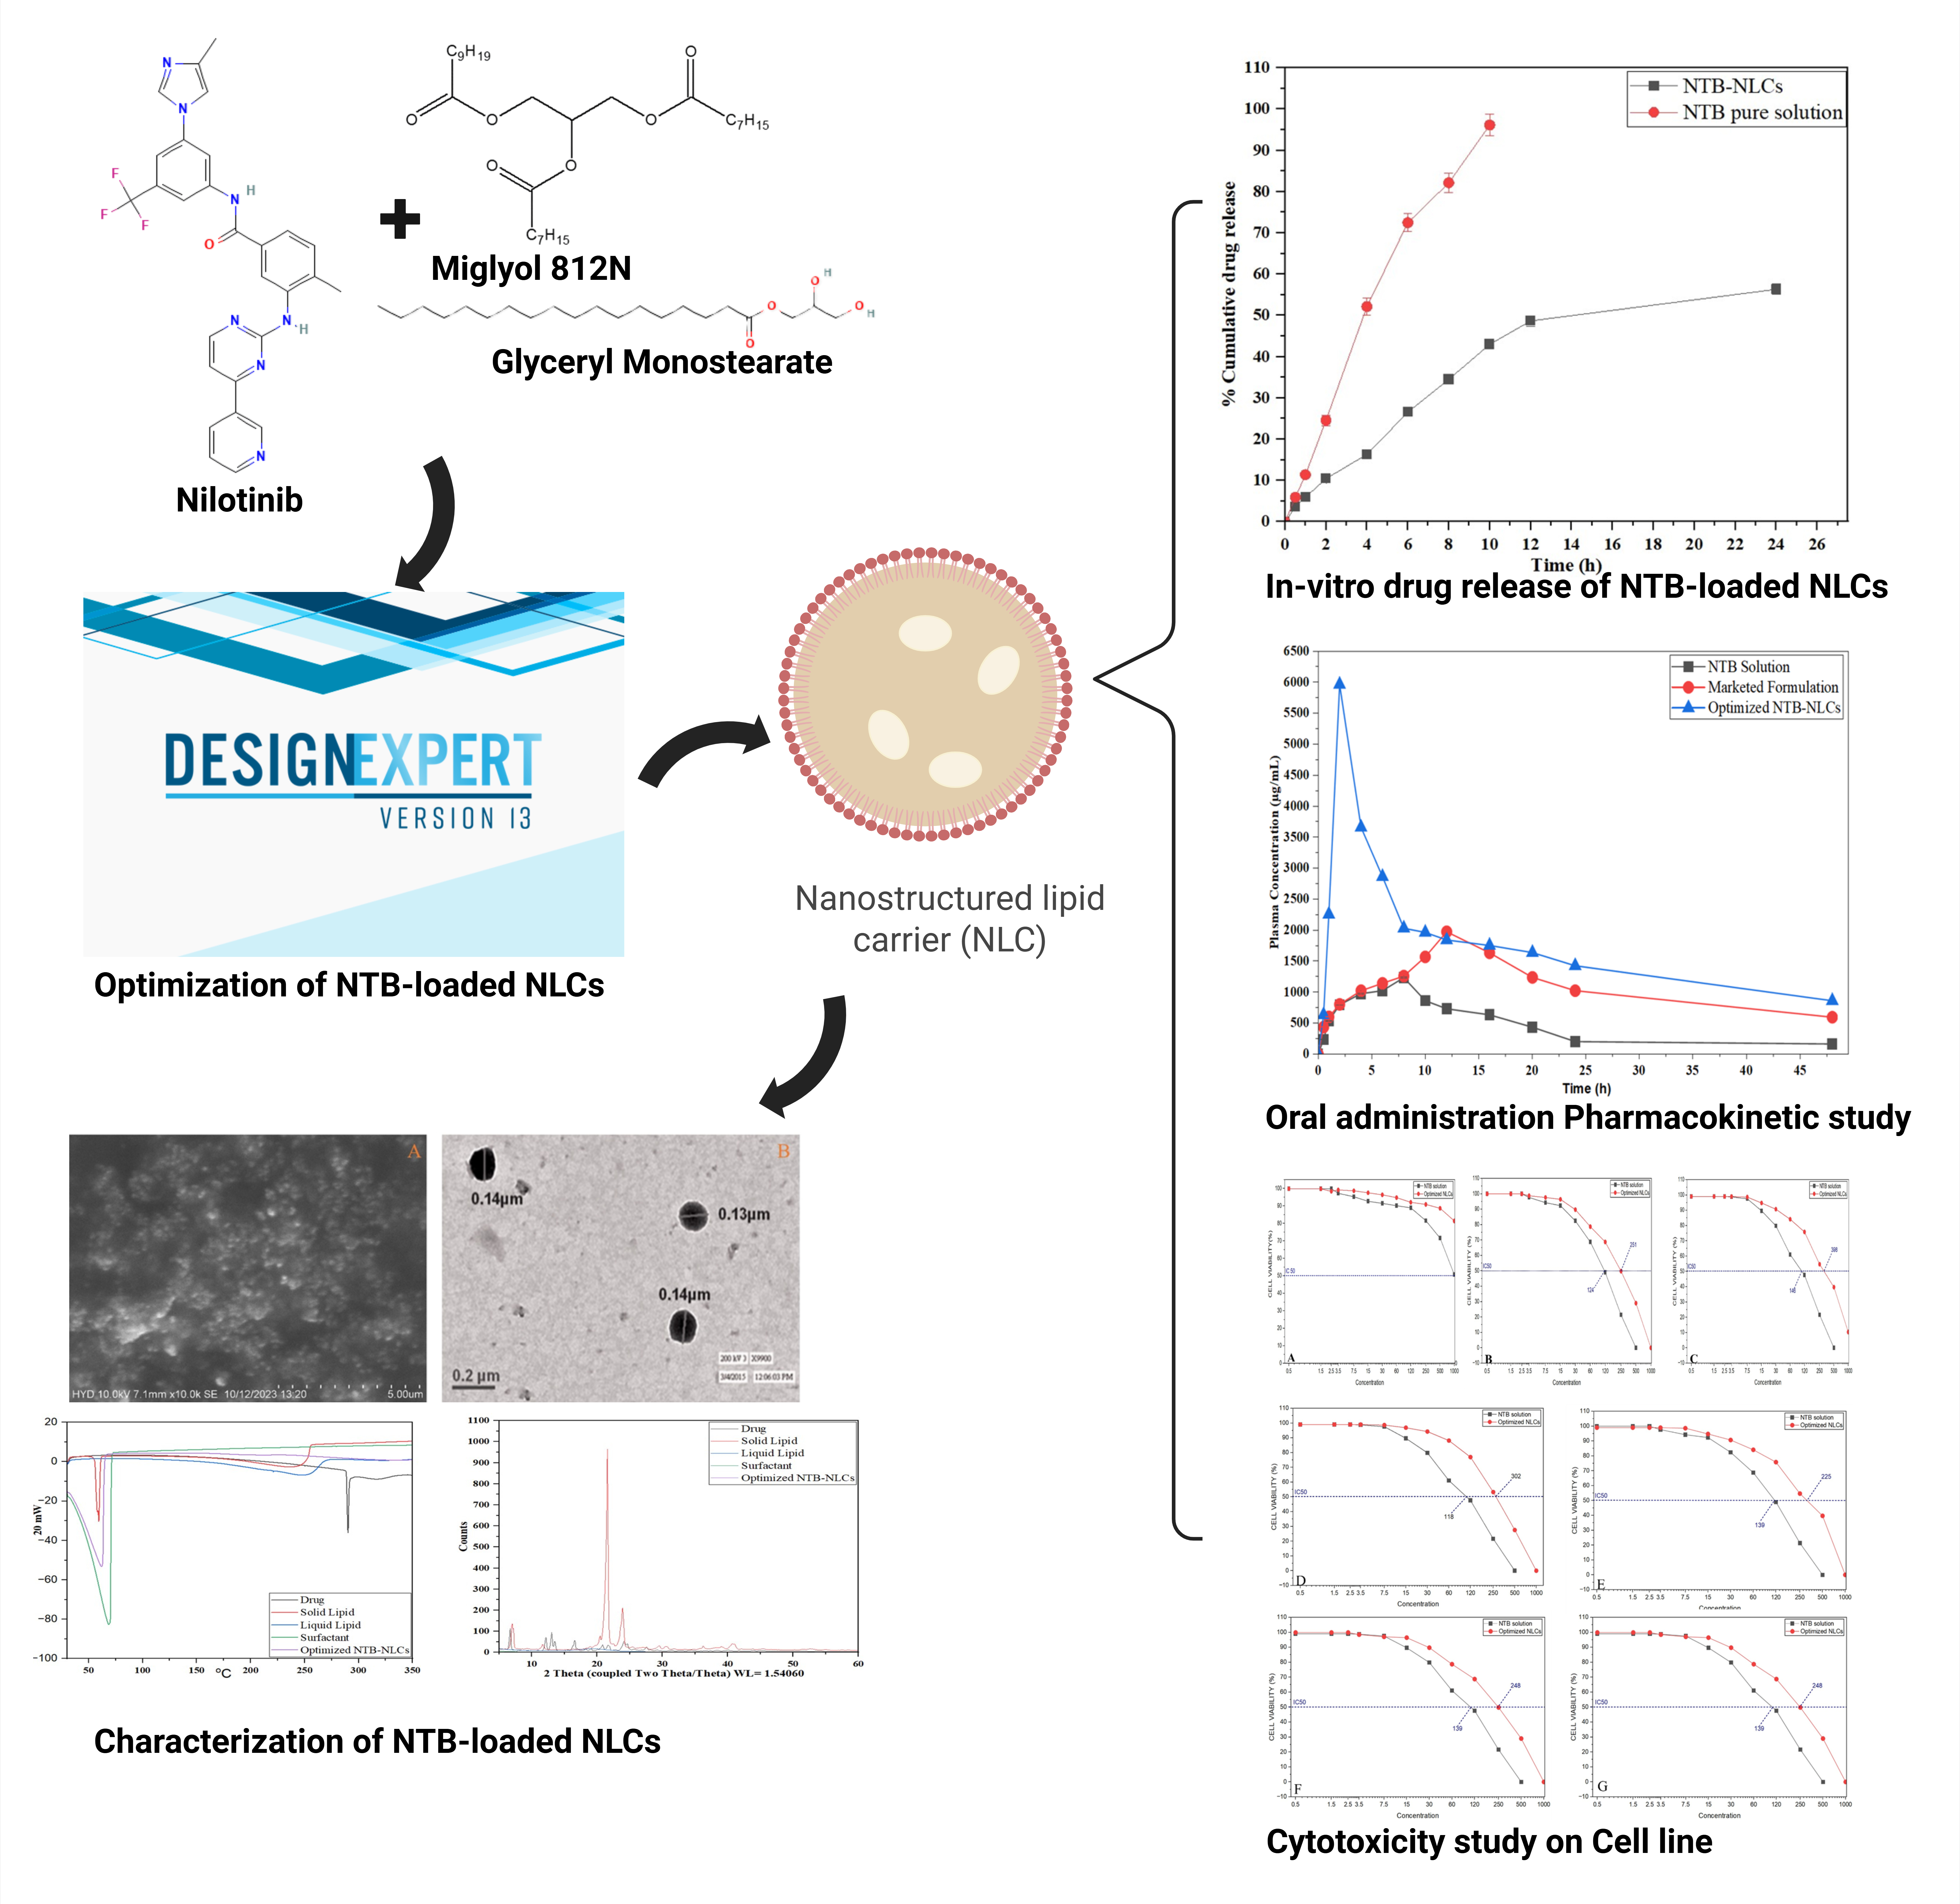
Background/Objectives: Nilotinib (NTB) a tyrosine kinase inhibitor, helps CML patients with the Philadelphia chromosome. An increasingly rigorous dose regimen and a boxed warning limit the drug's use. NTB should be taken orally on an empty stomach two hours before and one hour after the dosage. A new reduced-dose nanoparticle formulation of NTB reduces the effect of food on PK and achieves equivalent bioavailability (BA) while fasting. The study investigated if nanostructured lipid carriers could make BCS class II medication NTB more soluble and easier to swallow. Methods: The formulation was optimized using the "Box-Behnken design (3-factor, 3-level)". Polydispersity index, Zeta potential, EE, and particle size were dependent variables, while total lipid concentration, surfactant concentration, and sonication time were independent. Investigation of the optimized formulation's in vivo pharmacokinetics, tissue absorption, and in vitro release. Results: In the optimized formulation, PDI, particle size, EE%, and ZP were 135.26±3.86 nm, 0.126±0.09, 89.62±1.26%, and -42.16±1.75mV, respectively. Transmission electron microscopy revealed circular particles. In vitro, NTB released 96.15% with pure NTB dispersion and 56.34% with NTB-NLCs after 24 hours. The data was acquired using a zero order. NTB was ad-ministered to acute myeloid, acute lymphoblastic, and acute T cell leukaemia at IC50 values of 251, 302, 398, 218, 248, and 225 µg/mL, respectively. NTB had IC50 values of 124, 118, 146, 125, 139, and 135 µg/mL against acute myeloid, acute lymphoblastic, and acute T cell leukaemia cell lines. Conclusions: The malignant leukaemia cell line's vitality decreased dose-dependently with NLCs and NTB. Our cytotoxicity experiments in various cell lines and Wistar rats enhanced oral bioavailability of NTB suggest that the optimized NTB-loaded NLCs.
Keywords:
nilotinib
; Philadelphia chromosome
; chronic myeloid leukemia
; nanostructure lipid carrier
; Box-Behnken design
; bioavailability
1. Introduction
Cancer is an umbrella term for a variety of disorders characterized by uncontrolled and abnormal cell growth. When it comes to global mortality, cancer ranks second, with 9.7 million fatalities in 2022, according to sources cited by the World Health Organization [1]. One of the most successful ways to treat cancer is using chemotherapy. Unfortunately, there are a lot of problems that may arise from utilizing traditional ways of administering chemotherapy since it cannot differentiate between healthy and sick cells. Reduced chemotherapy-related side effects are possible with focused delivery of anti-cancer medications to malignant cells. To improve therapeutic efficacy while reducing toxicity, many nanomedicines have been created [2,3].
“Nanomedicine” is defined by the NIH as a nanotechnology-based drug delivery system that addresses the physicochemical and clinical issues associated with therapeutic medicines. To cure, diagnose, and prevent illnesses, nanomedicine acts as a molecular bridge for pharmaceuticals. Researchers have shown a lot of interest in nanomedicine and have attempted to use it to diagnose and treat cancer in an effort to lower the high mortality and morbidity rates associated with the disease [4]. A number of practical features of nanomedicine lend themselves well to the medication delivery system. Among these characteristics include the ability to load several drugs, substantial surface area relative to volume, and a size that is less than a micron. The addition of certain ligands allows both passive and active targeting, which is another potential use. Similarly, by blocking opsonization and lymphatic targeting of cancer medications, the nanoparticle may prolong the elimination half-life of chemotherapy medicines [5].
Acute myeloid leukaemia is the most common kind of myeloid blood cancer, which is notoriously hard to treat in individuals 65 and above [6,7,8,9]. There are now two parts to the standard of treatment for AML, and these are remission induction therapy and consolidation therapy [10]. The conventional induction therapy is known as the “7 + 3” protocol and consists of a 7-day cytarabine administration followed by three full days of daunorubicin, an anthracycline [11]. Consolidation treatment, which usually involves large dosages of cytarabine or hematopoietic stem cell transplantation, is administered to patients after they attain first remission after induction therapy in order to remove remaining leukemic cells [12]. In an effort to find better treatments, clinical studies were conducted during these years to look at different schedules, dosages, and even novel cytotoxic agents [13,14].
Relapse and the same treatment hurdles await AML patients even when they achieve full remission. Thankfully, many new AML treatments have been authorized since 2017 [15], including Midostaurin, Nilotinib, Dasatanib, Vyxeos, and Venetoclax. Having said that, Patients with AML who are 65 and older have a survival rate after five years of around 10% [16], making for a very bleak outlook. Improving treatment results for AML patients requires new therapeutic techniques immediately. When it comes to treating AML, Nilotinib is one possibility that has shown encouraging results [17].
As people become older, their risk of developing acute myeloid leukaemia (AML) rises. The exact cause of the illness is often a mystery, however it might manifest after being exposed to Infectious chemicals or after an underlying haematological problem (such myelodysplastic syndromes, MDS). The advancements of AML begin with a series of genetic changes in multipotential haematopoietic stem cells, which in turn cause aberrant clonal proliferation and myeloid cell differentiation [18]. The median age of AML patients is 64 years old, and the majority of patients are adults [19]. The prognosis is still dismal, particularly for elderly patients; less than 30% of patients make it through the first year after diagnosis [20].
Induction treatment has not altered much since 1973, despite our improved knowledge of the illness and its basic features in the last few decades. On the other hand, four new medications were authorized by the FDA in 2017, which completely altered the treatment landscape of AML. A new liposomal combination of daunorubicin and cytarabine, Vyxeos® (Jazz Pharmaceuticals), is one example. Illnesses such severe infections, anaemias that need red blood cell transfusions, and thrombocytopenia that may lead to hemorrhagic events are the majority of adverse reactions of AML therapy, which is myelosuppression with neutropenia. Total AML patient survival rates have been steadily rising over the past few decades [21,22] because to supportive therapy with anti-infectious medications [23,24] and growth factors [25].
Nilotinib has limited therapeutic potential because of its low absorption when taken orally and limited water solubility, notwithstanding its effectiveness [26,27]. One potential solution to these problems is to improve the solubility of the medication, the rate of controlled release, and the distribution to cancer cells of nilotinib by using formulations based on nanocarriers. As targeted therapeutic medicines in cancer, TKIs, or tyrosine kinase inhibitors, have had encouraging therapeutic benefits in the past [28]. Imatinib was the first TKI utilized, however several resistances in CML therapy [29] urgently necessitated the development of subsequent generations of TKIs, including PF-114 [30], ponatinib [31], nilotinib [32], and bosutinib [30]. The “gatekeeper” mutation T315I, is the most lethal and common mutation that causes nilotinib resistance [33,34]. To begin with, Bcr-Abl kinase domain variations frequently result in resistance. There is encouraging evidence that this protein might be used to treat cancer because of the significant cancer-specific activity it has shown [33].
As many as 70% of synthetic therapeutic compounds and 40% of medications in development suffer from issues related to oral bioavailability and delivery due to poor solubility [35,36]. It is difficult to transfer poorly soluble medicines from the stomach to the bloodstream after taking them orally due to the small concentration gradient between the two. The same holds true for the injection location; small solute levels, sufficient drug levels in bodily fluids cannot be attained when supplied parenterally as micro suspensions [36]. So as to boost the saturation solubility of drugs that are not very soluble in bodily fluids, new delivery strategies are required [37]. To make these medications more soluble, one strategy is to load them onto solid lipids and then employ them as nanocarriers [38,39].
Considering these nanoparticles that contain drugs to work like a medication delivery system, they need to be stable at the nanometer scale, exhibit sustained-release properties, and be able to pass through various anatomical barriers [39]. To achieve this goal, many nanocarriers have been created, such as lipid-drug conjugates, SLN, and NLC [40,41]. Among the numerous advantageous characteristics of nanocarriers of lipid as a carrier system are their ability to degrade, lack of hazardous degradation products, compatibility with polar and lipophilic medicines, controlled drug release, and simplicity of scalability and cheap cost [41]. NLCs, the next generation of SLN, has all these qualities and show significant potential as a site-specific, controlled drug delivery method that gets beyond SLN’s drawbacks. items [42,43]. Improved sustained reliability and regulation of medicine release are two of the most important benefits of NLC over SLN [44,45]. Nanostructured lipid carriers are created by combining and closely integrating a solid lipid matrix with oils, which may increase the total lipid content to as much as 95% [46,47]. A extremely viscous or pasty NLC dispersion is the result of the NLC preparation process known as high-pressure homogenization [48,49].
A number of statistical experimental designs have emerged in recent years that allow for the optimization of preparation with some test and the estimation of the significance relationship among elements [49]. When dealing with complex variable interactions, several studies have demonstrated that response surface methodologies (RSMs) like the Box-Behnken design (BBD), and D-optimal design are useful for improving lipid component compositions [50]. In BBD’s, the process space’s midpoints and edges house the three levels of the factors. Experiments with severe factors in BBD may be easily avoided using this cubic design, which does not have any vertices. Furthermore, compared to other three-level response surface design models, BBD needs the fewest runs. For this reason, BBD has reportedly proven helpful in the optimization of a wide range of nanocarriers for a variety of uses [51].
The purpose of this research was to create and test NTB-loaded nanolayered chemokines (NTB-NLCs) in vitro by employing a variety of cell lines from various types of cancers, including human HL-60/vcr, acute lymphoblastic leukaemia, acute T cell leukaemia, and encapsulation and release performance studies.
2. Materials and Methods
2.1. Materials
A free sample of nilotinib was provided by “Hetero Laboratories pvt, Hyderabad (India)”. “S.D. Fine Chemicals (New Delhi, India)” was the source of stearic acid, oleic acid, and Tween 20. The following ingredients were sourced from Sigma-Aldrich: olive oil, sorbitol, lipoid S100 (lecithin or phosphatidylcholine), and thimerosal.
2.2. Methods
2.2.1. Selection of the Liquid Lipid and Surfactant
The ability to dissolve of NTB in different fluid lipids and surfactants was tested using a 2.0 mL tube. One mL of every vehicle was added to the tube with an excess of NTB. A vortex shaker was used to shake the mixtures for 72 hours at 25 °C until they reached an equilibrium condition. The next step was to spin the mixes at 16,000 rpm for 5 minutes. The surplus NTB in the resulting supernatant was filtered out using a 0.20 µm needle filter. The NTB was determined utilizing HPLC-UV analysis after the filtrates were properly diluted with methanol. Based on the results of the NTB solubility investigation, the fluid lipid used in the NLC formulation is Miglyol 812N, and the surfactant is Tween 80 [52].
2.2.2. Screening of Solid Lipids and Selection of Surfactant
The medication’s solubility in various liquid lipids was considered during lipid selection. In order to choose the right ones, a quantity of solid fats, weighing 1 gram, were heated up at 75 degrees Celsius, mixed with a magnetic stirrer, and the drug was incorporated to the surfactant in stages until saturation was reached [53]. Based on how well they dissolved in NTB saturation, we chose the solid lipids and surfactant. For the purpose of evaluating saturation solubility. The samples were mixed with three milliliters of the medication and mixed well by vortexing until completely dissolved. It was continued until the drug solution in every sample was completely used up. Following that, it was set aside for 12 hours to reach a stable state. To spin the combination at 5000 rpm for 30 minutes, a “Model R 23 centrifuge was used. Upon pipetting off the supernatant and diluting it with methanol, the drug concentration was measured using a “UV spectrometer” set up at 296 nm [54]. In addition, the drug’s solubility and ionic nature were considered while selecting the surfactant.
2.2.3. Miscibility of Solid and Liquid Lipids
The lipids that dissolved NTB the best, both liquid and solid, were selected for the miscibility study and melted at temperatures that were above the point at which they melted. The maximal solubilizing potential of the solid and liquid lipids were then determined by mixing them in various quantities (3:1, 4:1, 5:2, and 6:3), as shown in Table 1. The resulting mixtures were further mixed with a magnetic stirrer at 70ºC and 200 rpm for 1 hour before being left to stand for twenty-four hours. At last, the mixture was examined visually to check for phase separation [55].
2.2.4. Preparation of NTB Loaded NLCs
In order to create the drug-loaded NLCs system, the “ultra-sonication method” was used. At first, a 6:3 ratio of glyceryl monostearate and Miglyol 812N, which had the highest solubilizing potential, was mixed with NTB according to weight. The combination was then heated at 70ºC until it formed a transparent oil phase. The next step was to make 10 mL of the liquid phase by boiling distilled water with the surfactant (Tween 80) until it was completely dissolved. The oil and water phases were mixed at 70 degrees Celsius with a magnetic stirring device operating at 500 revolutions per minute [56]. A clear pre-emulsion was created by constantly rotating and agitating the mixture with the magnetic stirrer. A “probe sonicator was used to sonicate the final dispersion. The sonication cycle lasted 20 minutes and had an amplitude of 80%. The same experimental settings were also used to generate the placebo formulation.
2.2.5. Formulation Optimization Using Box-Behnken Design
An optimization method called the “Box-Behnken design” with 3 tiers and 3 components was used to fine-tune the NLCs’ formulation in the “design expert software (Design-Expert 12.0.3.0, State-Ease Inc., Minneapolis, MN, USA)” application. The formulation of the NLCs was statistically optimized using the Box-Behnken experimental methodology. The amounts of lipid concentration, surfactant volume, and sonication time were the independent variables for optimization, while the dependent factors were the particle size (R1), (EE) (R2), (PDI) (R3), and (R4) ZP [57]. In the Box-Behnken layout, points are established three times: once in the center and once at the halfway of each side of a three-dimensional cube. The results of the first trials were used to calculate the values of the independent variables, which are shown in Table 1 as low (−1), medium (0), and high (+1). As part of the optimization of the NLCs formulation, Table 2 also includes the dependent variables, Yi, which act as response criteria. Table 2 shows the results of a design matrix that was created using the program Design-Expert 12.0.3.0. This matrix included 17 separate trial runs. The non-linear quadratic model generated by the design had the following form:
Yi = B0 +B1X1 +B2X2 +B3X3 +B12X1X2 +B23X2X3 +B13X1X3 +B11X1X1 +B22X2X2 +B33X3X3
A statistically significant result was defined as a P-value below 0.05. We also used analysis of variance (ANOVA) to see how significant the model was [58].
2.3. Characterization of NTB-NLCs
It was crucial to adequately and properly define the NLC in order to determine its quality. The characteristics of the NTB-NLCs that were evaluated were the size of the particles, ZP, polymorphism, drug amount and stability, in vitro drug release, morphology, and the existence or lack of other colloidal structures [59].
2.3.1. Particle Size and Polydispersity Index
During regular measurements of the size of particles and nanoparticle width distribution, photonic correlation analysis, also known as light scattering dynamically, is the most efficient technique. In a disposable cuvette, NTB-NLCs were dissolved in a fixed amount of filtered, doubly distilled water. Based on the investigation, PDI and average size of particles of NTB-NLCs were calculated. The measurements were made three times at 25 °C, and the standard variations were calculated using a constant 90° diffraction angle [60].
2.3.2. Measurement of Zeta Potential
The zeta potential is a tool for predicting long-term stability; it is an indirect way to estimate the diffusion layer thickness. The zeta potential was found with the use of the Zetasizer Nano ZS, and the laser-based Doppler electrophoresis technique was used to measure the component electrostatic mobility. In order to achieve the optimal kilo counts per second range of 50-200, the newly produced particles were diluted appropriately in double-distilled water before the tests were carried out three times [61].
2.3.3. Entrapment Efficiency and Drug-Loading Capacity
The drug-release properties are affected by the chemical composition of the NLCs; hence, it is crucial to know how much medication is contained in each nanoparticle [62]. This was accomplished by use of Centrisart® filter tubes, manufactured by Sartorius AG of Göttingen. The 3 mL pure NTB-NLC sample that had been deposited in the outer chamber was placed on top of the specimen recovery container. Centrifuge 32 was used to spin the closed unit at 20,000 × g for 15 minutes. The procedure works on the idea that the material in the recovery container is connected to the water phase by means of a thin layer of membrane, while the NTB-NLCs stay in the outside chamber isolated from it. Next, validated HPLC was used to assess the concentration of NTB in the water phase. The concentration of NTB in the NLC was determined using the technique described by Wa Kasongo et al. [63], which involves subtracting the concentration of NTB from the total dispersion and then adding it to the concentration of NTB in the aqueous phase after ultrafiltration.
To find the % drug loading capacity of NTB-NLCs, the following equation was used.
2.4. Morphological Investigation of NLCs
A transmission electron microscope called an 80 Kv “Morgagni 268D” was used to examine the NLCs scattering colored with 1% phosphotungstic acid (Fei Electron Optics, Eindhoven, Netherlands)” [64]. The surface structure and morphological properties of the NTB-loaded NLCs that were generated were examined using a “scanning electron microscopy (Carl Zeiss Evo 18, Germany)” instrument.
2.4.1. Transmission Electron Microscopy (TEM) Analysis
The surface structure of the nanomaterials and form were studied using transmission electron microscopy. A hydrophilic filter membrane was used to remove excess liquid, and then a carbon-coated copper grid was treated with a little quantity of the diluted NTB-loaded NLCs dispersion. A short drying time at 25 °C was followed by one minute of negatively staining the 300-mesh grid with 2% phosphotungstic acid (w/v). After that, the grid of cells was let to cure at ambient temp. [65]. A TEM was used to examine the NTB-loaded NLCs sample, which was mounted on a sample holder. The picture was then taken.
2.4.2. Differential Scanning Calorimetry
Differential scanning calorimetry may be utilized to find out the crystallization and polymorphism of bulk substances, drugs, and drug nanoparticles. This technique measures the melting point temp. at their resp. energies [66]. We used a DSC to find out the thermal properties of the hydrogenated surfactant, NTB, and optimized NTB-NLCs. The reference was an empty aluminum pan. Using pure ultrahigh dry nitrogen, a constant pace of 5 oC each minute was preserved, while the temperature range across which DSC curves were obtained was 20 °C to 80 °C. Three runs of the analysis were conducted. The Mettler Energy Star software was then used to calculate the enthalpies [67].
2.4.3. Wide-Angle X-Ray Diffraction
The degree of crystallinity may be assessed by measuring the geometrical dispersion of light from crystal surfaces inside the nanoparticle dispersion using broad-angle X-ray diffraction. We detected the crystallinity of the optimized NTB-NLCs using an X-ray diffractometer that had the radioactive anode made of copper. Placed on top of X-ray plates, powdered samples of hydrogenated surfactant, NTB, and optimized NTB-NLCs of about 10 mm in length were subjected to a 45 kV voltage. This X-ray diffractogram pattern was observed across a 20°-80° range [68].
2.5. In Vitro Drug Release Study
To ascertain the NTB-NLCs’ quality and anticipate their behavior, in vitro drug release research is helpful. A lipid nanoparticle dispersion-based in vitro kinetic method for releasing media was used to enable the release of NTB from the NLCs to continue for 48 hours. Through the use of a 0.785 cm2 modified Franz diffusion cell setup and a volume of 5 mL, the parameters of NTB release from the NLCs were determined. An interconnecting rubber band separates the donor and receptor sections was used to insert a cellulose acetate membrane from HiMedia (Mumbai, India) [69]. In both instances, the conc. of NTB was 4.0 mg/mL. To keep the sodium dodecyl sulphate 2% and 0.1 M phosphate-buffered saline pH 7.4 conditions constant throughout the experiment, 5 mL of dialysis medium (Sigma-Aldrich) was added to the receptor compartment. At a constant temp., the contents of the cell were constantly combined with a 500rpm stirring mechanism. Utilizing an injection needle made of metallic stainless steel 316 and a sidearm pipe, 500 μL of the medium from the time intervals between withdrawals of the receptor segment were 0, 1, 2, 4, 6, 8, 10, 12, 24, and 48 hours. In order to keep the quantities of all the samples consistently identical throughout the investigation, they were all diluted with new phosphate-buffered solution to the same volume [70]. The quantity of NTB released by the NLCs was determined by analyzing the samples using HPLC. The trial was carried out three times, and the kinetics of drug release were calculated using three different equations: zero-order, first-order, and the Higuchi equation [71].
2.6. Pharmacokinetic Study
When testing the oral bioavailability of NTB laden NLC, Wistar rats were used as test subjects. Adherence to standards for animal care and handling was maintained throughout the toxicity study (Society of toxicity USP 1989). Approval number: CPCSEA/IAEC/JLS/06/03/25/001. The six-rat Wistar experiment included three groups: A, B, and C. Each group received an oral feeding tube dosage of 10 mg/kg of NTB, and each group also received the optimized NTB-NLCs, the commercially available drug solution, or a pure drug placebo. Centrifugation was used for 30 min at 5000 rpm to divide the plasma and keep it at -20 °C until it was time for HPLC analysis. Blood samples were collected at predefined intervals (0, 0.5, 1, 2, 4, 6, 8, 10, 12, 16, 20, 24, and 48 h) [72].
2.6.1. Determination of Anti-Acute Leukemia Effects of NTB-NLCs
NLCs’ anti-acute leukemia and cytotoxic properties were examined using the commonly used MTT assay on the following cell lines: (1) leukaemia cell lines that represent acute myeloid leukaemia, and acute lymphoblastic leukaemia. (2) HUVEC. Treated with trypsin-EDTA (Gibco BRL, Scotland), 3000 cells were cultivated in 96-well wells either with or without NTB-NLCs after they were separated from the flask surface. Cell viability was also assessed. A 24 hours assessment was conducted using an inverted microscope (Motic, AE31 model) to examine morphological alterations and general cell properties [73].
A colorimetric assay known as the Methy Thiazol Tetrazolium (MTT) was used to assess the cytotoxic effects of the NTB-NLCs. This process produces crystals of formazan that are hydrophobic in water but solubility in dimethyl sulfoxide. The cells were first cultured in 75 cm round T-flasks with 15 mL of medium, each containing 106 cells. Trypsin-Versen was used to enzymatically remove the cell layer that had adhered to the flask bottom after 72 hours of coating, and the flask was centrifuged in Germany for 10 minutes at 1200 rpm. Use Sigma, 3–30 kHz, to simulate. Using a pasteuriser pipette, the cells were immersed in new culture fluid to achieve a cell density of 3000 cells/well in the plate with 96 wells. Each well was then supplemented with 100 μl of the cell suspension that had been produced, either with or without NLCs. The plates were kept in a German Memmert incubator for a day after the trypsinization stress was removed in order to recover cell viability.
The next step was to dilute the necessary NTB-NLCs to the proper concentration. The wells of the plates were then columnarly filled with 100 mL of each dilution. The next day, the cells were kept in a 37 °C. After 72 hours of incubation with NTB-NLCs, each well was enhanced by 20 εL of an MTT solution containing 5 milligrams per milliliter. Carefully remove the culture media containing MTT after incubating the plates for 4 hours. A regulated light density was defined as cells free of NLCs, while a blank was defined as a well devoid of cells and containing just RPMI1640 media supplemented with bovine fetal serum. Lastly, the IC50 level was determined using linear regression. This level indicates the conc. of the extract that reduces the development of cancer cells by 50%.
2.7. Statistical Analysis
An ANOVA in one direction and the Duncan post-hoc test (p ≤ 0.01) were used in the SPSS-22 software to examine the obtained results.
3. Results
3.1.1. Lipid Screening and Selection of Surfactant Solubility Study
One of the most crucial steps in creating the NLCs was choosing an appropriate vehicle, as NTB has low solubility in water (<50 ng/mL). Out of all the liquid lipids that were evaluated, NTB had the greatest solubility in Miglyol 812 N (18.63 ± 0.96 mg/mL), with Lauroglycol CC, and Labrafac CC following closely behind.
Among the surfactants, Tween 80 had the maximum solubility at 9.68 ± 0.24 mg/mL, being succeeded by limonene, PEG 400, isopropyl myristate, Tween 20, and the like. Accordingly, Tween 80 and Miglyol 812 N were utilized to optimize the formulation with the liquid fat and lubricant for the synthesis of NLCs. The concentrations of NTB in different solutions were determined to be as follows: 22.36 ± 3.21 mg/mL in GM, 18.74 ± 1.29 mg/mL in stearic acid, 19.58 ± 1.02 mg/mL in Gelucire 44/14, and 15.34 ± 0.95 mg/mL in Apifil. The study’s findings showed that NTB was more soluble in GM (22.36 ± 3.21 mg/mL) and Tween 80 (12.68 ± 0.24 mg/mL) (Figure 1). Tween 80 was also used. Because of minimal toxic effect, outstanding compatibility and durability, and pH-independent functionality, the non-ionic surfactant was selected. Compared to other non-ionic surfactants, Tween 80 had a greater solubility of NTB (9.68 ± 0.24) [73]. and, therefore, It was chosen to be the surfactant in the formulation of NLCs.
3.1.2. Miscibility of Solid and Liquid Lipids
Mixtures of glyceryl monostearate and Miglyol 812 N demonstrated excellent miscibility at the various ratios tested. It is additionally recognized that the concentration of liquid fats affects the trapping of medication molecules. Hence, it is important to use the greatest quantity of the chosen lipid. The reason for this is because as the proportion of liquid lipids in the transporting lipid increases, it disrupts the crystalline makeup that is very organized and leaves more space for the medicinal product molecules. Therefore, a 6:3 ratio of oleic acid to glyceryl monostearate was used.
This section may be divided by subheadings. It should provide a concise and precise description of the experimental results, their interpretation, as well as the experimental conclusions that can be drawn.
3.1.3. Preparation and Optimization of NTB-Loaded NLCs
The SFN-packed NLC formulation was optimized and constructed using Design-Expert software utilizing a “Box-Behnken design” that had three variables that were autonomous at three separate levels (Table 2). The dependent elements of PS, PDI, EE, ZP were clearly correlated with the independent factors of Tween 80 conc. (B), sonication time (C), and total lipid conc.(A). We looked at the effects of each independent variable separately and together. As shown in Figure 2, Figure 3, Figure 4 and Figure 5, three-dimensional (3-D) plots were created for each of the four responses (R1, R2, R3, and R4). The predictive analysis is shown in Table 3, which summarizes the findings of the quadratic equation fitting of responses R1, R2, R3, and R4 [74]. In Figure 5, the overlay plot, desirability plot, and perturbation plot of the optimized formulation were quantitatively compared. Table 2, which shows the outcomes of 17 separate runs, indicates that the quadratic model was the best fit for all three variables that were dependent that the nonlinear program generated. Its correlation coefficient (R2) was about 1. The model summary statistics and polynomial equations for the dependent variables are shown in Table 3.
3.1.4. Fitting of Data to the Model
The outcomes of the regression evaluation performed on various replies as shows in Table 3. It is clear from Table 2 that the response R1 (PS), R2 (PDI), R3 (EE), and R4 (ZP) the content in overall lipids the only unknown variable has a favourable effect on. Surfactant concentration (in this case, Tween 80) positively affects responses R2, R3, and R4, but negatively affects response R1. Time spent sonicating has a negative impact on all four responses (R1, R3, and Y4).
3.1.5. Response 1 (R1): Effect of Independent Variables on Particle Size
An essential characteristic of NLCs is their particle size, and the stability of these new drug carriers may be inferred from their PDI. While particle size does affect nanocarrier dispersion, NLCs benefit from tiny particles due to decreased liver absorption, increased blood circulation time, and improved bioavailability [29]. The range of PS for the NLC was 135.26±3.86 to 310.69±4.57nm, as shown in Table 2. R1 PS was shown to be substantially affected by B (amount of surfactant) and C (sonication duration) according to the quadratic equation, but A (volume of lipid) was found to have a statistically significant impact. A had the most pronounced detrimental impact on NLC particle size among the three independent factors (Figure 2). Among the many characteristics of NLCs, the polydispersity index and mean particle size are particularly useful for predicting the stability of drug-loaded nanoparticles. If the particles are tiny, their polydispersity index will be narrow, and if they are large, the opposite would be true. Consequently, particle size might affect nanoparticle dispersion. Reduced liver absorption, longer blood circulation, and enhanced bioavailability are all benefits of NTB-NLCs with a tiny particle size [75]. Minimal phagocytosis of small particles by macrophages further reduces their clearance and destruction by the body [76]. With a discrepancy of under 0.2, both the Modified R² of 0.9762 and the Expected R² of 0.8725 are inside an acceptable range. To get the signal-to-noise ratio, Adeq Precision is used. Preferably, the ratio should be higher than 4A ratio of 26.790 indicates a strong signal. One way to go around the design space is using this model.
Particle size = +182.17 -2.68A -3.72B -44.27C -58.24AB +27.65AC -28.55BC +9.53A2 +44.15B2 +22.04C2
Particle size as a function of the variables that are autonomous is seen in Figure 2’s. 3-dimensional RSP. According to the theory, the surfactant increased the stability of the particles by creating a steric inhibitor on their outermost layer, which stopped tiny particles from combining into larger ones [77]. Formulation 15 had the smallest particle size of 135.26±3.86 nm out of the 17 formulations that were developed, while formulation 5 had the largest particle size of 310.69±4.57 nm. It should be mentioned that no particle agglomeration occurred in the NLCs system when the sonication period was doubled. Other researchers have found findings that are consistent with ours [14,78].
3.1.6. Response 2 (R2): Effect of Independent Variables on Entrapment Efficiency
The mean EE%, including all the experiments in Table 2, was 65.96%, with a lowest value of 42.13±1.28 and a highest of 89.62±1.26%. Because of their hydrophilic nature, liquid as well as solid lipids provide for an ideal EE estimate for NLCs, allowing for higher drug loading and subsequent delivery to the target location [79]. In Figure 3, we can see that when the conc. of surfactant (B) and sonication duration (C) were raised, the entrapment efficacy of NLCs was reduced. A higher drug partition from the interior to the outside portion of the medium may occur when the outer layer has a high surfactant concentration. When medicine is more easily dissolved in water, more of it may diffuse and dissolve in the exterior phase of water, increasing the partition [80]. The rise in the sonication duration resulted in a decrease in entrapment efficiency, since a smaller particle size implies less efficient drug entrapment. The results are as follows, in line with previous research [81].
An elevated value of F of 88.31 indicates the relevance of a model. There is a pathetic 0.01% chance that a random event would result in an F-value this high. Whether or whether the significance level is below 0.0500 will determine how significant the model terms are. A Lack of a fit F-value of 4.70 indicates that noise is the cause 8.46% of the time. The updated R2 value of 0.9800 closely matches the predicted R2 value of 0.8882 with a difference of 0.2 or less. The proportion of noise to signal is obtained using Adeq Precision. The ratio should ideally be more than 4. With a percentage of 30.983, you have provided enough evidence.
Entrapment Efficiency = +74.13 -4.34A +2.73B +14.40C +11.77AB -5.21AC +1.91BC -0.6285A2 -9.01B2 -7.72C2
3.1.7. Response 3 (R3): Effect of Independent Variables on PDI
The model’s F-value of 9.30 demonstrates significance in statistics. The probability of an F-value this high being caused by noise is a pitiful 0.38%. The predictive keywords are deemed significant when the significance level is lower than 0.0500. The template includes significant words such as C, AB, BC, and B³. If the outcomes are greater than 0.1000, the predictive terms will not be deemed relevant. The chances of unpredictability explaining this big Lack of Fit F-value is 87.90%. The actual R² of 0.8237 and the expected R² of 0.7225 are extremely similar to each other, with a variance of 0.2 or less.
PDI = +0.2210 -0.0086A +0.0145B -0.0531C -0.0805AB +0.0312AC -0.0440BC -0.0176A2 +0.0741B2 +0.0144C2
To demonstrate how each of the variables independently affect the PDI, Figure 3 displays the three-dimensional responses plot. As the overall amount of lipids rose, it was observed that the PDI of the NTB-loaded NLCs decreased. From 0.126±0.09 to 0.412±0.06, the PDI values (R2) that were noted ranged. Despite the fact that both X2 and X3 had substantial impacts on the PDI (p<0.05), the most evident beneficial impact was B. In addition, every formulation had a PDI ≤ 0.5, indicating a very restricted and homogenous size dispersion [82]. Table 2 displays the PDI of the NLCs loaded with NTB. Reportedly, the PDI is a metric for the degree to which particles in nano systems aggregate. As a result, a PDI value approaching zero suggests that the system is likely to display monodispersed behavior (Figure 4).
Additionally, a greater PDI value (>0.5) is indicative of system polydispersity. Compared to polydispersed systems, monodispersed systems are less likely to clump together.
3.1.8. Response 4 (R4): Effect of Independent Variables on Zeta Potential
An accurate measure of the system’s stability, the surface zeta potential (ZP) of particles determines the ultimate charges. The proven electric repulsion between the particles, as evidenced by ZP values of ±30 Mv, maintains the system’s stability [83]. According to the zeta potential, nanosuspension particles possess a surface charge that is negative. According to the ZP, nanosuspension particles possess a surface charge that is negative. The zeta potential is a crucial factor in predicting and evaluating the consistency of a dispersion of colloids, as shown in Table 2, the calculated ZP values for the synthetic blend ranged from -22.49±1.42 to -42.16±1.75 mV. Analyzing and forecasting a colloidal dispersion’s stability relies heavily on the zeta potential [94]. A strong negative charge, shown by a zeta potential distribution of -22.49±1.42 and -42.16±1.75 mV in NTB-NLCs, suggests strong cellular absorption and exceptional stability, and also aids in the transport of NTB-NLCs to cancer cells that have a negative charge [84]. Zeta potential assessments often rely on the drug’s electrophoretic mobility in aqueous media. To a lesser extent, particles are able to float and aggregate in solutions with a greater zeta potential, perhaps as a result of electrostatic attraction (Figure 5). However, several tests have shown that a nanoparticle suspension’s stability is determined by both electrostatic repulsion and the employment of steric stabilizers during nanoparticle synthesis. Also, the amount of lecithin in the lipid matrix has no effect on the ZP of NLC while the concentration of the emulsifier in the water phase is constant [85].
Zeta Potential = -34.59 +1.87A +0.4875B -5.01C -2.38AB +3.13AC -1.88BC +0.2800A2 +3.24B2 +1.60C2
A high value of F (0.03%) can only be explained by sheer chance. A significance level of less than 0.0500 indicates that the predicted terms are relevant. The terms A, C, AB, AC, BC, and B³ are important in this model. In the event that the values exceed 0.1000, the predicted parameters will not be considered significant. The coefficient of determination for Lack of Fit is 0.37, which indicates that the lack of fit is not statistically significant in comparison to the basic error. A 78.26% F- value for Lack of Fit could indicate the result of random chance. There is a mismatch of not more than 0.2 between the adjusted R2 of 0.9156 and the predicted R2 of 0.8275.
3.2. Optimization
The ideal formulation of NTB-loaded NLCs was chosen by maximizing entrapment efficiency and zeta potential while minimizing particle size [47]. An examination of practical searches and comprehensive grid searches, together with the “trading” of many response factors, led to the conclusion that a formulation containing 1% total lipid, 2.5% surfactant, and sonication would be optimal (15 minutes) met the requirements of an ideal formulation, here known as NLCs15. The NLCs 15 formulation, which is optimized for NTB loading, has a PS of 135.26±3.86 nm, an EE of 89.62±1.26%, a PDI of 0.126±0.09, and a ZP of -42.16±1.75, respectively. In Figure 6, we can see the quantitative link between the dependent variables (responses) and the independent factors (perturbation and desirability) as well as the overlay of all independent variables.
3.3. Characterization of Optimized NTB-Loaded NLCs Formulation
3.3.1. Particle Size, Polydispersity Index (PDI) and Zeta Potential Measurement
The optimized formulation of NLCs loaded with NTB had a PS of 135.26±3.86 nm and a PDI of 0.126±0.09, (Figure 7). The optimized formulation of NLCs loaded with NTB had a ZP of -42.16±1.75 mV, as shown in the figure. Particle stability in a dispersion medium is indicated by their zeta potential. Particles are less likely to aggregate when their zeta potential values are larger, indicating a stronger attraction between them. The improved stability and dispersion quality of NLCs loaded with optimized NTB were shown by a negative zeta potential value [86].
3.3.2. Particle Size, Polydispersity Index (PDI) and Zeta Potential Measurement
Entrapment efficiency is a crucial aspect of formulation creation since it is a key element in determining drug-release properties. An increase in entrapment efficiency indicates that, on average, medications dissolve better in water than in solid fats [47]. When liquids are added to solid lipids, the crystal lattice becomes less crystallin and more defective. The drug molecules are able to fit more snugly into the nanosuspension particles because of these flaws, leading to more efficient entrapment [87]. The medicine needs to be designed to dissolve well in oil melts in order to deliver adequate loading of drugs. Reducing the dispersion’s lipid content is essential for achieving a high entrapment efficiency using NLCs. More control over medication release and loading efficiency is possible due to the lipophilic components of liquid lipids’ higher solubility compared to solid lipids. A reduction in lipid quantity was associated with an increase in EE for NTB-NLCs. A minimizing the EE was seen when the tween 80 conc. was raised over 2.5%. The occurrence of lipid precipitation during particle generation might be the cause of this [88]. When the NLCs are cooled after formulation, the lipids recrystallize, leaving either a core with decreased drug content or no core at all. Consequently, EE suffers when lipid levels rise over a certain point. Furthermore, Tween-80 showed a significant impact. Increasing the concentration of Tween 80 resulted in a higher EE for the formulation. The dispersion of NLCs had an EE of 89.62±1.26%.
3.3.3. Scanning Electron Microscopy
The scanning electron microscopy examination of the NLCs formulation was made possible by images of the improved NTB loaded NLCs. Their form was found to be ovoid (Figure 8A). The findings of the size study corroborate those of the photon correlation spectroscopy report.
3.3.4. Transmission Electron Microscopy (TEM)
The optimized NTB-loaded NLCs formulation’s surface shape and average diameter were observed using TEM. The TEM pictures confirmed the zeta sizer particle size measurements and indicated that the optimized formulation of NLCs loaded with NTB exhibited a homogeneous size distribution and a surface that was virtually spherical (<200 nm). The findings show that the particles were spaced out and dispersed evenly. Figure 8B shows a TEM of the most effective formulation of NTB-loaded NLCs.
3.3.5. Differential Scanning Calorimetry
DSC was an elementary technique for studying the amorphous or crystallization state of drugs. Optimal NTB-NLCs, solid lipids, liquid lipids, surfactant, and NTB are shown in Figure 9 DSC curve. At about 288.24 °C, the thermogram of NTB shown a peak at the melting point. At 60.93 °C, the melting process peaked for the excipients. On the lipid and surfactant curve, all of the melting points were present and almost identical in value. Nevertheless, the optimized NTB-NLCs did not show the NTB melting peak in their thermograms. If the endothermic peak of NTB is absent in NTB-NLCs, then the drug has likely been molecularly disseminated throughout the matrix of lipids and has transformed from an amorphous to a crystalline state [89].
3.3.6. X-Ray Diffraction Studies
XRD was used to examine the crystalline structure of lipid structures and drugs loaded and unloaded NLCs. Lipids with a highly crystalline structure produce reflections of sharp, high intensity, whereas those with an incomplete lattice of lipids on an amorphous backdrop produce reflections of low intensity. Lipids, such as precirol, often crystallize with several impurities, creating room for more drug molecules. Diffraction patterns of NTB, solid lipid, liquid lipid, surfactant, and optimized NTB-loaded NLCs are shown in Figure 10. In contrast to the crisp reflections of pure NTB and the high intensity reflections of NLCs, the optimized NTB-loaded NLCs displayed low intensity diffractograms compared to the placebo, indicating that the NLCs are amorphous [55].
3.4. In Vitro Drug Release Study
Dialysis was the technique we employed during our in vitro release trial. Fitting the data gained from this experiment to different kinetic equations [90] allowed us to establish the mechanism of NTB release from a concurrent 12-hour dispersion of pure NTB and NTB-NLCs. Because of its poor water solubility and hydrophobicity, 2% sodium dodecyl sulphate was used as a solvent in the receptor compartment dialysis fluid [91]. Donor compartments in the control group were filled with dimethyl sulfoxide. The in vitro kinetics of the release of NTB from NLCs across the cellulose acetate membrane were found to be very consistent with the zero-order kinetic model (r2 = 0.963), according to this study. Over the course of 24 hours, Figure 11 displays the total percentage profiles of NTB delivered from the mixture of pure NTB and NTB-NLCs. This demonstrates that the NTB in the NTB-NLCs was released during the specified time period in a more progressive manner than in the control group, which exhibited a faster release of NTB. According to the data at the conclusion of the period of 24 hours, the nanosuspension may be a helpful carrier with excellent control over the release of NTB. 56.34 percent in total was made public. Ten hours after mixing, the pure drug dispersion had released 96.15 percent of its NTB.
3.5. Pharmacokinetic Study
The effects of oral administration of pure drug solution, optimized NTB loaded NLCs, and a commercial formulation on the plasma conc.-time profiles of NTB in Wistar rats are shown in Figure 12 and Table 4. Cmax values 33.63 and 154.28 times higher, respectively, were recorded when rats were administered NTB-loaded NLCs as opposed to pure drug solutions and commercial formulations. In addition, to the commercially available formulation and the pure medication solution, the relative bioavailability of NTB after NLC therapy was 1.86- and 2.55-2.55-fold greater in Wistar rats, respectively. One possible explanation is because the optimized formulation’s nano size particles improved absorption. Tmax of 4.36 ± 0.25 hours was also seen in rats after they were treated with the NLCs formulation. The marketed formulation resulted in a Tmax of 6.02 ± 1.34 hours, whereas the pure drug solution showed a Tmax of 2.36 ± 1.75 hours. As far as anybody can tell, the NTB concentration in the NLCs formulation peaked at its fastest. This might be because the medication was absorbed more quickly.
3.6. Cytotoxicity and Anti-Human Leukameia Cancer Potentials of NLCs Synthesized Using NTB
The effectiveness of nanoparticles as anticancer agents against many kinds of tumor cells is influenced by their size, shape, and surface coating, which are structural characteristics. Among these factors, nanoparticle size is the most important one [92,93,94,95,96]. Previous research shown that nanoparticles’ capacity to bind to and kill cancer cell types improved as their size decreased. Nanoparticles produced by NTB have diameters ranging from 135 to 310 nm, as seen in the transmission electron micrograph of our research. Nanoparticles of a size of 100 nm or less play important roles in the elimination of tumor cell lines, according to related research.
Prior research has validated the anticancer effects of drug-synthesized nanoparticles. At very high concentrations, the metallic nanoparticles in the earlier research destroyed all of the HeLa cells. The cytotoxicity features of treated cells with various doses of the current NTB. A, NTB loaded NLCs were tested for 48 hours using the MTT test and human acute leukaemia cell lines, according to recent study. The absorbance rate measurement at 570 nm demonstrated the exceptional vivacity of Cytarabine, and gold nanoparticles on the normal cell line (HUVEC), and this vigor continued even at doses of 1000 μg/mL.
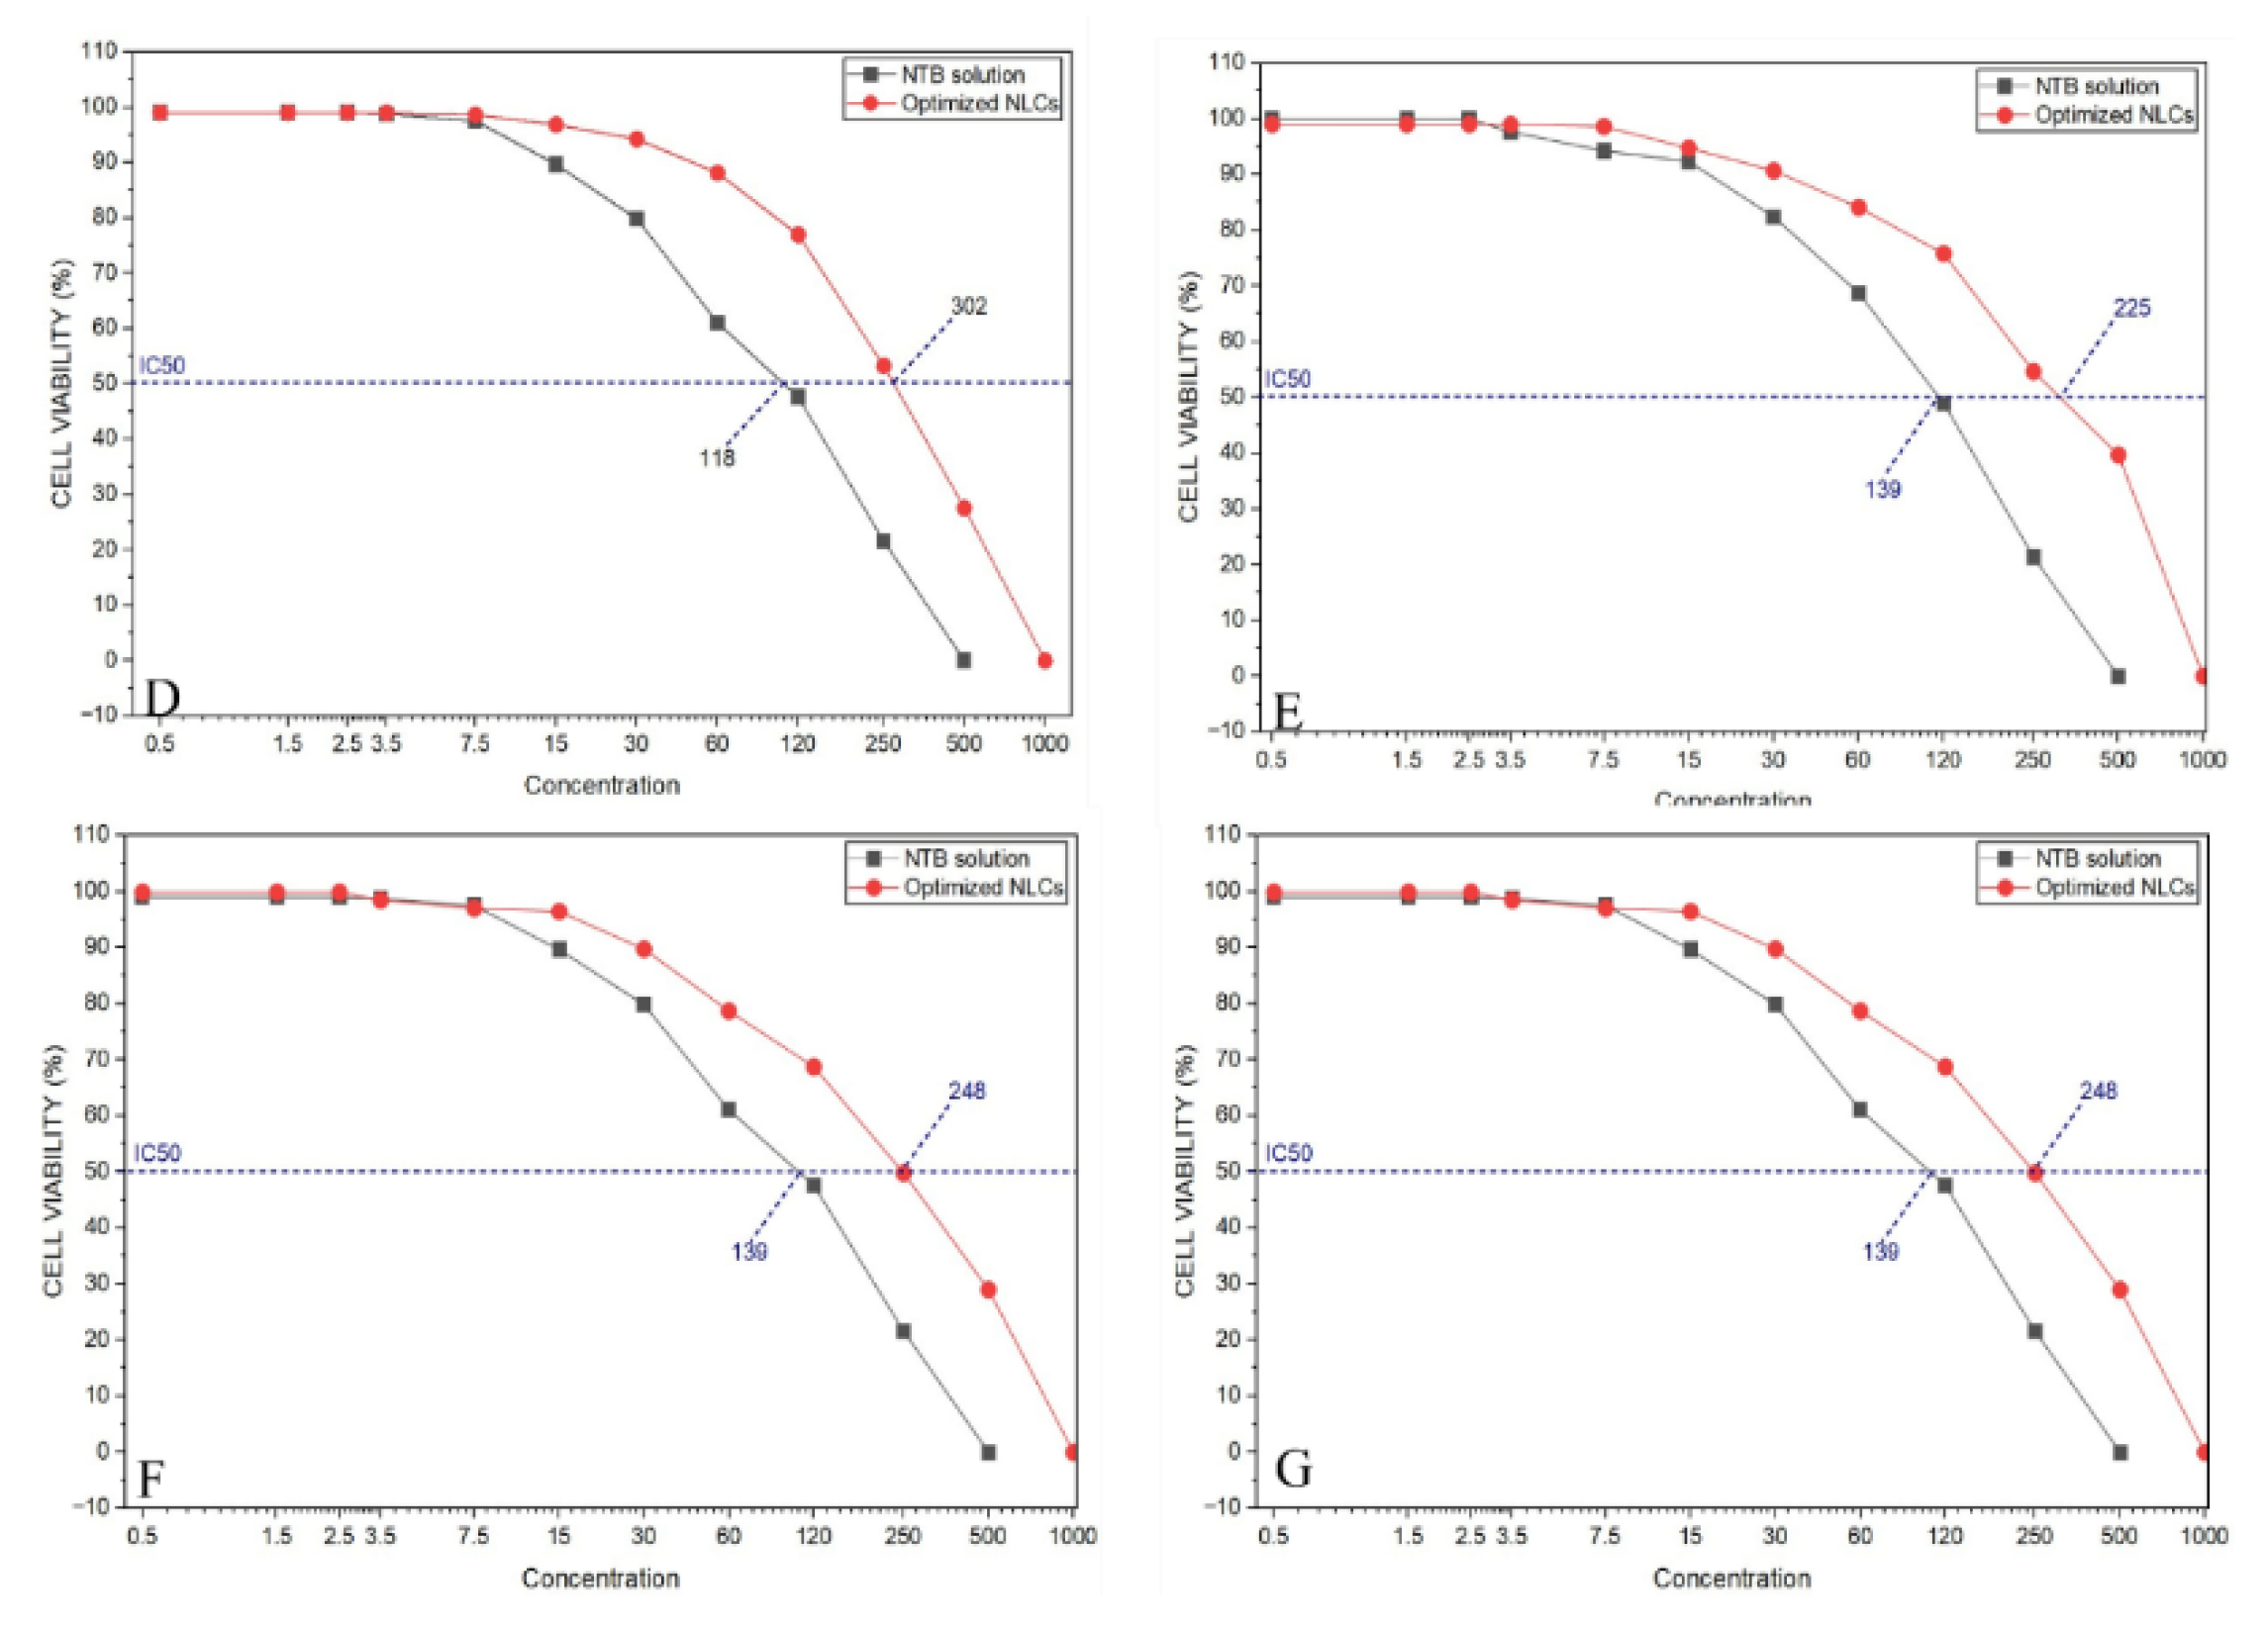
Each of the three types of leukaemia cell lines acute myeloid, acute lymphoblastic, and acute T cell had an IC50 value of 242, 297, 383, 207, 234, and 218 µg/mL, respectively. The IC50 values for NTB against the Human HL-60/vcr and 32D-FLT3-ITD cell lines, MOLT-3 and TALL-104 cell lines, and other cell lines were 117, 113, 145, 119, 131, and 135 µg/mL, respectively (Figure 13).
Figure 13.
A. The cytoxicity effects of NTB solution and optimized NTB-NLCs against normal (HUVEC) cell line. B. The anti-leukemia activities of NTB solution and optimized NTB-NLCs against acute myeloid leukemia (Human H and 32D-FLT3-ITD (C)) cell line.
Figure 13.
A. The cytoxicity effects of NTB solution and optimized NTB-NLCs against normal (HUVEC) cell line. B. The anti-leukemia activities of NTB solution and optimized NTB-NLCs against acute myeloid leukemia (Human H and 32D-FLT3-ITD (C)) cell line.
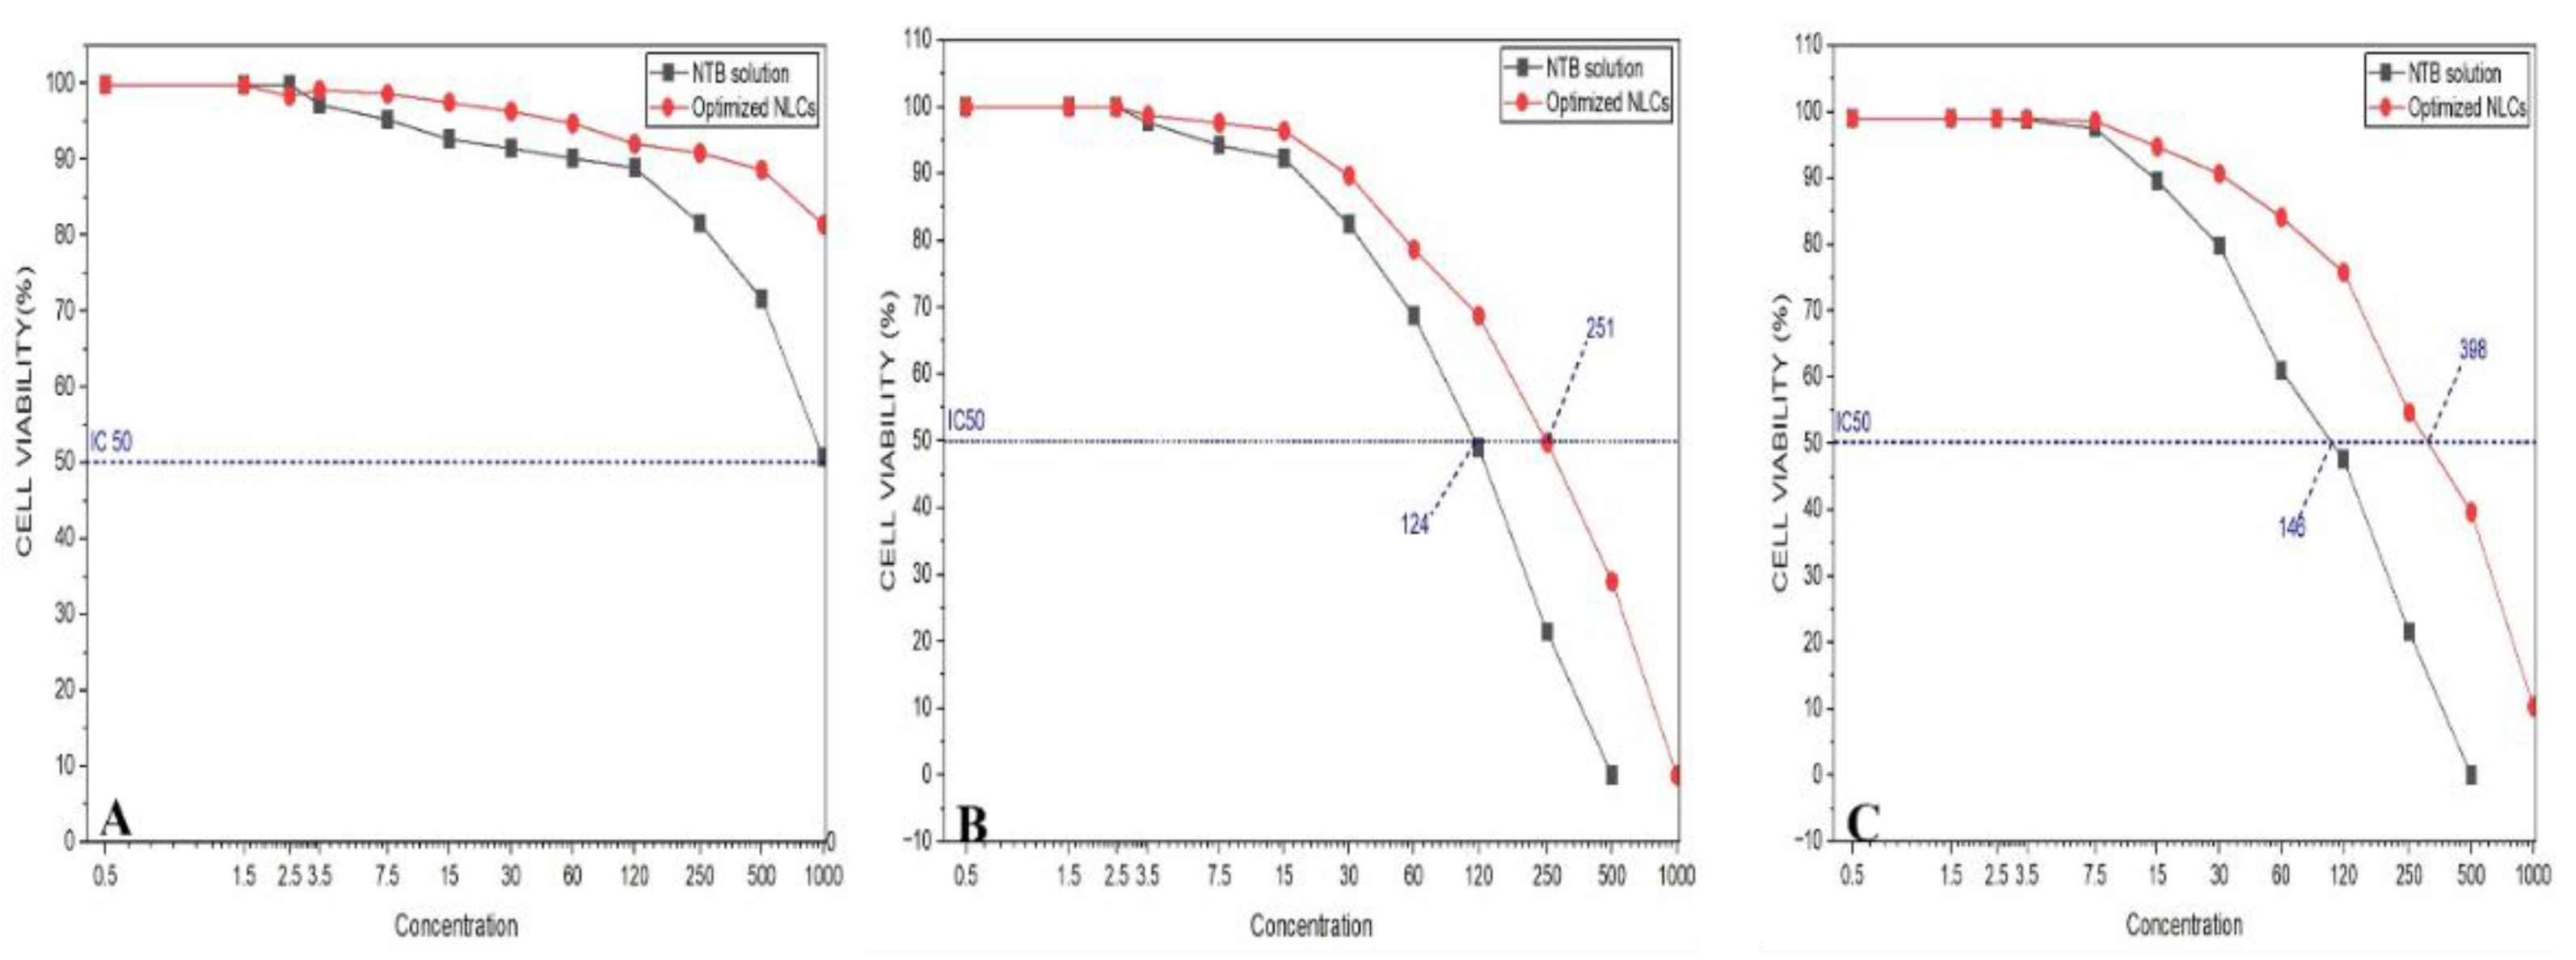
Figure 14.
The anti-acute leukemia activities of NTB solution and optimized NTB-NLCs against acute lymphoblastic leukemia (D. MOLT-3, E. TALL-104, F. J.RT3-T3.5 at clone E6-1 (G) cell lines.
Figure 14.
The anti-acute leukemia activities of NTB solution and optimized NTB-NLCs against acute lymphoblastic leukemia (D. MOLT-3, E. TALL-104, F. J.RT3-T3.5 at clone E6-1 (G) cell lines.
4. Discussion
The current research was able to improve the solubility, oral bioavailability, and anticancer activity of Nilotinib (NTB), a BCS class II tyrosine kinase inhibitor that has low water solubility and poor absorption in the gastrointestinal tract, by creating and optimizing nanostructured lipid carriers (NLCs). The formulation parameters of NTB-NLCs were methodically optimized using a Box-Behnken design in order to achieve the desired physicochemical properties. These included a small particle size (135.26 ± 3.86 nm), a narrow PDI (0.126 ± 0.09), a high entrapment efficiency (89.62 ± 1.26%), and an acceptable zeta potential (−42.16 ± 1.75 mV). These characteristics point to a stable formulation that is well-suited for improved cellular absorption.
Results from solubility screenings clearly supported the selection of Tween-80 and Miglyol 812 N as excipients, with NTB demonstrating the maximum solubility. This supports earlier findings that lipidic system solubility greatly affects entrapment efficiency and release behavior of weakly watery medicines. In addition, the ideal miscibility of the solid lipid (glyceryl monostearate) and liquid lipid (Miglyol 812 N) was discovered, allowing for the formation of an imperfect crystal matrix that may accommodate greater drug payloads—a natural benefit of NLCs over conventional SLNs.
In contrast to the quick release (96.15 percent at 24 hours) shown with pure NTB dispersion, the in vitro release profile of NTB-NLCs showed a continuous release pattern over 48 hours. A diffusion-controlled release mechanism was suggested by the release kinetics, which were in line with zero-order behavior. With sustained release, plasma concentration can be maintained for longer and dose frequency can be reduced in clinical settings.
The pharmacokinetic investigation provided additional evidence that the optimized NLCs had better oral performance. NTB-NLCs shown much improved absorption compared to the commercial formulation and pure drug solution, with Cmax (5901.81 ng/mL), AUC0-t (623.65 h·ng/mL), and AUC total (122,516.8 h·ng/mL) being substantially greater. Increased systemic availability and decreased distribution variability are suggested by the decreased volume of distribution and shorter elimination half-life in NTB-NLCs. Nanosized lipid carriers have the potential to enhance lymphatic transport, evade first-pass metabolism, and prolong the residence duration of drugs in the systemic circulation, according to these results.
Cell lines from acute myeloid leukaemia (AML), acute lymphoblastic leukaemia (ALL), and acute T-cell leukaemia (TCL) shrank in viability as a function of dose, according to cytotoxicity investigations. Aside from Cytarabine’s better IC50 values, NTB-NLCs outperformed free NTB in terms of activity, demonstrating how nanocarriers could improve intracellular accumulation. It is possible that the enhanced cellular uptake caused by the nanoscale size range (135-310 nm) seen in TEM images enhances therapeutic efficacy, as suggested by the IC50 shift. Previous research has shown that lipid nanoparticles have better anticancer performance because of their higher permeability, retention, and intracellular trafficking. These findings are consistent with that.
Notably, normal HUVEC cells showed no morphological evidence of toxicity to NTB-NLCs even at high concentrations, suggesting that the lipid matrix is biocompatible. The safety profile of lipid-based carriers is well-documented; thus, this seems sense.
Poor solubility, low bioavailability, and inefficient cellular uptake were all factors that the formulation technique attempted to address in NTB. In haematological cancers, where effective intracellular accumulation and prolonged drug availability are crucial, the data show that NLCs offer a potential platform for oral delivery of tyrosine kinase inhibitors.
5. Conclusions
In order to prepare Nilotinib-loaded NLC, the “ultrasonication method” was used, and the BBD was used for optimization. The next step was to optimize the formulation parameters statistically. Of all the formulations tested, the optimized NTB-loaded NLCs (F15) had the following average values: 135.26±3.86 nm for particle size, 0.126±0.09 for zeta potential, 89.62±1.26% for content uniformity, and -42.16±1.75 mV of drug release in vitro. Efficacy was shown by in vitro, pharmacokinetic, and cell line evaluations of the optimized NTB-loaded NLCs formulation. Particles with a perfectly round form were seen via transmission electron microscopy. In contrast to the placebo group’s experimental condition, the optimized NLCs formulation had a greater in vitro drug release. With a pure zerumbone dispersion, the in vitro drug release of nilotinib was 96.15% over 24 hours, but with NTB-NLCs, it was 56.34%. This data was obtained by using a zero equation. Acute myeloid leukaemia and leukaemia cells in a recent oncology study. Acute myeloid leukaemia, acute lymphoblastic leukaemia, and acute T cell leukaemia were each treated with NTB at IC50 values of 251, 302, 398, 218, 248, and 225 µg/mL, respectively. Acute myeloid leukaemia, acute lymphoblastic leukaemia, and acute T cell leukaemia were the cell lines against which Cytarabine had IC50 values of 124, 118, 146, 125, 139, and 135 µg/mL, respectively. When exposed to NLCs and NTB, the malignant leukaemia cell line’s vitality decreased in a dose-dependent manner.
Author Contributions
Formal analysis, A.K.C; funding acquisition, M.Y.B; investigation, N.B. and S.B.; methodology, K.O., A.A.S.M and A.K.C; project administration, A.K.C, M.Y.B and N.B.; software, S.B. and A.A.S.M; supervision, A.K.C and C.M; writing—original draft, A.K.C. All authors have read and agreed to the published version of the manuscript.
Funding
The authors extend their appreciation to the Deanship of Research and Graduate Studies at King Khalid University for funding this work through Small Research Project under grant number RGP1/107/46.
Institutional Review Board Statement
The use of animals in toxicology was conducted in accordance with the standards established for animal care and procedures (Society of Toxicology USP 1989). Jeeva Life Sciences’ Institutional Animal Ethics Committee (IAEC), located in Uppal, Hyderabad, India (approval number: CPCSEA/IAEC/JLS/06/03/25/001).
Informed Consent Statement
Not applicable.
Data Availability Statement
Data is contained within the article.
Acknowledgments
The authors extend their appreciation to the Deanship of Research and Graduate Studies at King Khalid University for funding this work through Small Research Project under grant number RGP1/107/46.
Conflicts of Interest
The authors declare no conflict of interest.
References
- H. Sung et al., “Global Cancer Statistics 2020: GLOBOCAN Estimates of Incidence and Mortality Worldwide for 36 Cancers in 185 Countries,” CA. Cancer J. Clin., vol. 71, no. 3, pp. 209–249, May 2021. 20 May; 21. [CrossRef]
- D. Peer, J. M. Karp, S. Hong, O. C. Farokhzad, R. Margalit, and R. Langer, “Nanocarriers as an emerging platform for cancer therapy,” Nat. Nanotechnol., vol. 2, no. 12, pp. 751–760, Dec. 2007. [CrossRef]
- Md. Rizwanullah, J. Ahmad, S. Amin, A. Mishra, M. R. Ain, and M. Rahman, “Polymer-Lipid Hybrid Systems: Scope of Intravenous-To-Oral Switch in Cancer Chemotherapy,” Curr. Nanomedicine, vol. 10, no. 2, pp. 164–177, Aug. 2020. [CrossRef]
- Md. Rizwanullah, M. Z. Ahmad, A. Garg, and J. Ahmad, “Advancement in design of nanostructured lipid carriers for cancer targeting and theranostic application,” Biochim. Biophys. Acta BBA - Gen. Subj., vol. 1865, no. 9, p. 129936, Sept. 2021. [CrossRef]
- J. Shi, P. W. Kantoff, R. Wooster, and O. C. Farokhzad, “Cancer nanomedicine: progress, challenges and opportunities,” Nat. Rev. Cancer, vol. 17, no. 1, pp. 20–37, Jan. 2017. [CrossRef]
- E. Estey and H. Döhner, “Acute myeloid leukaemia,” The Lancet, vol. 368, no. 9550, pp. 1894–1907, Nov. 2006. [CrossRef]
- J. E. Lancet, “Is the overall survival for older adults with AML finally improving?” Best Pract. Res. Clin. Haematol., vol. 31, no. 4, pp. 387–390, Dec. 2018. [CrossRef]
- T. W. LeBlanc and H. P. Erba, “Shifting paradigms in the treatment of older adults with AML,” Semin. Hematol., vol. 56, no. 2, pp. 110–117, Apr. 2019. [CrossRef]
- B. Lowenberg, J. R. Downing, and A. Burnett, “Acute Myeloid Leukemia,” N. Engl. J. Med., vol. 341, no. 14, pp. 1051–1062, Sept. 1999. [CrossRef]
- C. C. Kumar, “Genetic Abnormalities and Challenges in the Treatment of Acute Myeloid Leukemia,” Genes Cancer, vol. 2, no. 2, pp. 95–107, Feb. 2011. [CrossRef]
- K. T. J. Chen, G. G. C. Militao, M. Anantha, D. Witzigmann, A. W. Y. Leung, and M. B. Bally, “Development and characterization of a novel flavopiridol formulation for treatment of acute myeloid leukemia,” J. Controlled Release, vol. 333, pp. 20 May; 21. [CrossRef]
- H. D. Klepin and L. Balducci, “Acute Myelogenous Leukemia in Older Adults,” The Oncologist, vol. 14, no. 3, pp. 222–232, Mar. 2009. [CrossRef]
- E. J. Feldman et al., “First-In-Man Study of CPX-351: A Liposomal Carrier Containing Cytarabine and Daunorubicin in a Fixed 5:1 Molar Ratio for the Treatment of Relapsed and Refractory Acute Myeloid Leukemia,” J. Clin. Oncol., vol. 29, no. 8, pp. 979–985, Mar. 2011. [CrossRef]
- F. Ferrara and C. A. Schiffer, “Acute myeloid leukaemia in adults,” The Lancet, vol. 381, no. 9865, pp. 484–495, Feb. 2013. [CrossRef]
- A. H. Wei and I. S. Tiong, “Midostaurin, enasidenib, CPX-351, gemtuzumab ozogamicin, and venetoclax bring new hope to AML,” Blood, vol. 130, no. 23, pp. 2469–2474, Dec. 2017. [CrossRef]
- K. T. J. Chen, R. Gilabert-Oriol, M. B. Bally, and A. W. Y. Leung, “Recent Treatment Advances and the Role of Nanotechnology, Combination Products, and Immunotherapy in Changing the Therapeutic Landscape of Acute Myeloid Leukemia,” Pharm. Res., vol. 36, no. 9, p. 125, Sept. 2019. [CrossRef]
- J. L. Liesveld et al., “Flavonoid effects on normal and leukemic cells,” Leuk. Res., vol. 27, no. 6, pp. 517–527, June 2003. [CrossRef]
- D. Rodriguez-Abreu, A. Bordoni, and E. Zucca, “Epidemiology of hematological malignancies,” Ann. Oncol., vol. 18, pp. i3–i8, Feb. 2007. [CrossRef]
- A. Shah, T. M. --L. Andersson, B. Rachet, M. Björkholm, and P. C. Lambert, “Survival and cure of acute myeloid leukaemia in E ngland, 1971--2006: a population–based study,” Br. J. Haematol., vol. 162, no. 4, pp. 509–516, Aug. 2013. [CrossRef]
- B. H. Segal et al., “Prevention and Early Treatment of Invasive Fungal Infection in Patients with Cancer and Neutropenia and in Stem Cell Transplant Recipients in the Era of Newer Broad-Spectrum Antifungal Agents and Diagnostic Adjuncts,” Clin. Infect. Dis., vol. 44, no. 3, pp. 402–409, Feb. 2007. [CrossRef]
- T. Briot, E. Roger, S. Thépot, and F. Lagarce, “Advances in treatment formulations for acute myeloid leukemia,” Drug Discov. Today, vol. 23, no. 12, pp. 1936–1949, Dec. 2018. [CrossRef]
- D. Pulte, A. Gondos, and H. Brenner, “Improvements in survival of adults diagnosed with acute myeloblastic leukemia in the early 21st century,” Haematologica, vol. 93, no. 4, pp. 594–600, Apr. 2008. [CrossRef]
- M. W. McCarthy and T. J. Walsh, “Prophylactic Measures During Induction for Acute Myeloid Leukemia,” Curr. Oncol. Rep., vol. 19, no. 3, p. 18, Mar. 2017. [CrossRef]
- W. R. Sperr et al., “Intensive consolidation with G-CSF support: Tolerability, safety, reduced hospitalization, and efficacy in acute myeloid leukemia patients ≥60 years,” Am. J. Hematol., vol. 92, no. 10, pp. E567–E574, Oct. 2017. [CrossRef]
- M. Sant et al., “Survival for haematological malignancies in Europe between 1997 and 2008 by region and age: results of EUROCARE-5, a population-based study,” Lancet Oncol., vol. 15, no. 9, pp. 931–942, Aug. 2014. [CrossRef]
- L. Pechlivani, N. Ntemou, D. Pantazi, D. Alivertis, K. Skobridis, and A. D. Tselepis, “Synthesis of Novel Nilotinib Analogues and Biological Evaluation of Their Antiplatelet Activity and Functionality towards Cancer Cell Proliferation In Vitro,” Pharm. Basel Switz., vol. 17, no. 3, p. 349, Mar. 2024. [CrossRef]
- J. Senapati et al., “Management of chronic myeloid leukemia in 2023 - common ground and common sense,” Blood Cancer J., vol. 13, no. 1, p. 58, Apr. 2023. [CrossRef]
- L.-Y. Zhou and L.-Y. Zhou, “[Research Advance of BCR-ABL Mutation and the Efficacy of Second and Third Generation TKI in Chronic Myeloid Leukemia--Review],” Zhongguo Shi Yan Xue Ye Xue Za Zhi, vol. 31, no. 2, pp. 585–588, Apr. 2023. [CrossRef]
- L. Gao, D. Zhang, and M. Chen, “Drug nanocrystals for the formulation of poorly soluble drugs and its application as a potential drug delivery system,” J. Nanoparticle Res., vol. 10, no. 5, pp. 845–862, May 2008. [CrossRef]
- J. H. Lipton et al., “Ponatinib versus imatinib for newly diagnosed chronic myeloid leukaemia: an international, randomised, open-label, phase 3 trial,” Lancet Oncol., vol. 17, no. 5, pp. 612–621, May 2016. 20 May; 16. [CrossRef]
- H. M. Kantarjian et al., “Ponatinib after failure of second-generation tyrosine kinase inhibitor in resistant chronic-phase chronic myeloid leukemia,” Am. J. Hematol., vol. 97, no. 11, pp. 1419–1426, Nov. 2022. [CrossRef]
- A. Jarkowski and R. P. Sweeney, “Nilotinib: a new tyrosine kinase inhibitor for the treatment of chronic myelogenous leukemia,” Pharmacotherapy, vol. 28, no. 11, pp. 1374–1382, Nov. 2008. [CrossRef]
- M. Kaehler et al., “Clonal evolution in tyrosine kinase inhibitor-resistance: lessons from in vitro-models,” Front. Oncol., vol. 13, p. 1200897, 2023. [CrossRef]
- J. Liu et al., “Recent advances in Bcr-Abl tyrosine kinase inhibitors for overriding T315I mutation,” Chem. Biol. Drug Des., vol. 97, no. 3, pp. 649–664, Mar. 2021. [CrossRef]
- S. J. Gilani et al., “Chitosan Coated Luteolin Nanostructured Lipid Carriers: Optimization, In Vitro-Ex Vivo Assessments and Cytotoxicity Study in Breast Cancer Cells,” Coatings, vol. 11, no. 2, p. 158, Jan. 2021. [CrossRef]
- H. Wang et al., “Nanostructured lipid carriers for MicroRNA delivery in tumor gene therapy,” Cancer Cell Int., vol. 18, p. 101, 2018. [CrossRef]
- K. Rajpoot, “Lipid-based Nanoplatforms in Cancer Therapy: Recent Advances and Applications,” Curr. Cancer Drug Targets, vol. 20, no. 4, pp. 271–287, 2020. [CrossRef]
- E. Kahraman, S. Güngör, and Y. Özsoy, “Potential enhancement and targeting strategies of polymeric and lipid-based nanocarriers in dermal drug delivery,” Ther. Deliv., vol. 8, no. 11, pp. 967–985, Nov. 2017. [CrossRef]
- J. J. Lee, L. Saiful Yazan, and C. A. Che Abdullah, “A review on current nanomaterials and their drug conjugate for targeted breast cancer treatment,” Int. J. Nanomedicine, vol. 12, pp. 2373–2384, 2017. [CrossRef]
- A. Jurj, C. Braicu, L.-A. Pop, C. Tomuleasa, C. D. Gherman, and I. Berindan-Neagoe, “The new era of nanotechnology, an alternative to change cancer treatment,” Drug Des. Devel. Ther., vol. 11, pp. 2871–2890, 2017. [CrossRef]
- M. Lamberti, S. Zappavigna, N. Sannolo, S. Porto, and M. Caraglia, “Advantages and risks of nanotechnologies in cancer patients and occupationally exposed workers,” Expert Opin. Drug Deliv., vol. 11, no. 7, pp. 1087–1101, July 2014. [CrossRef]
- Y. Chen, L. Pan, M. Jiang, D. Li, and L. Jin, “Nanostructured lipid carriers enhance the bioavailability and brain cancer inhibitory efficacy of curcumin both in vitro and in vivo,” Drug Deliv., vol. 23, no. 4, pp. 1383–1392, May 2016. [CrossRef]
- H. S. Rahman et al., “Zerumbone-loaded nanostructured lipid carrier induces G2/M cell cycle arrest and apoptosis via mitochondrial pathway in a human lymphoblastic leukemia cell line,” Int. J. Nanomedicine, vol. 9, pp. 527–538, 2014. [CrossRef]
- J. Ahmad et al., “Bile Salt Stabilized Vesicles (Bilosomes): A Novel Nano-Pharmaceutical Design for Oral Delivery of Proteins and Peptides,” Curr. Pharm. Des., vol. 23, no. 11, pp. 1575–1588, 2017. [CrossRef]
- Harshita et al., “Paclitaxel-loaded Nanolipidic Carriers with Improved Oral Bioavailability and Anticancer Activity against Human Liver Carcinoma,” AAPS PharmSciTech, vol. 20, no. 2, p. 87, Jan. 2019. [CrossRef]
- H. A. Makeen et al., “Gefitinib loaded nanostructured lipid carriers: characterization, evaluation and anti-human colon cancer activity in vitro,” Drug Deliv., vol. 27, no. 1, pp. 622–631, Dec. 2020. [CrossRef]
- K. Soni, M. Rizwanullah, and K. Kohli, “Development and optimization of sulforaphane-loaded nanostructured lipid carriers by the Box-Behnken design for improved oral efficacy against cancer: in vitro, ex vivo and in vivo assessments,” Artif. Cells Nanomedicine Biotechnol., vol. 46, no. sup1, pp. 15–31, 2018. [CrossRef]
- P. R. Ravi, N. Aditya, H. Kathuria, S. Malekar, and R. Vats, “Lipid nanoparticles for oral delivery of raloxifene: Optimization, stability, in vivo evaluation and uptake mechanism,” Eur. J. Pharm. Biopharm., vol. 87, no. 1, pp. 114–124, May 2014. [CrossRef]
- Xinsheng Peng and Fang, “Development and optimization of solid lipid nanoparticle formulation for ophthalmic delivery of chloramphenicol using a Box-Behnken design,” Int. J. Nanomedicine, p. 683, Apr. 2011. [CrossRef]
- A. A. Abdelbary and M. H. H. AbouGhaly, “Design and optimization of topical methotrexate loaded niosomes for enhanced management of psoriasis: Application of Box–Behnken design, in-vitro evaluation and in-vivo skin deposition study,” Int. J. Pharm., vol. 485, no. 1–2, pp. 235–243, May 2015. 20 May; 15. [CrossRef]
- K. M. Ranch, F. A. Maulvi, M. J. Naik, A. R. Koli, R. K. Parikh, and D. O. Shah, “Optimization of a novel in situ gel for sustained ocular drug delivery using Box-Behnken design: In vitro, ex vivo, in vivo and human studies,” Int. J. Pharm., vol. 554, pp. 264–275, Jan. 2019. [CrossRef]
- M.-H. Kim et al., “Formulation And Evaluation Of Nanostructured Lipid Carriers (NLCs) Of 20(S)-Protopanaxadiol (PPD) By Box-Behnken Design,” Int. J. Nanomedicine, vol. Volume 14, pp. 8509–8520, Oct. 2019. [CrossRef]
- J. Varshosaz, S. Eskandari, M. Minaiyan, and M. Tabbakhian, “Brain delivery of valproic acid via intranasal administration of nanostructured lipid carriers: in vivo pharmacodynamic studies using rat electroshock model,” Int. J. Nanomedicine, p. 363, Feb. 2011. [CrossRef]
- K. Patel, A. Patel, J. Dave, and C. Patel, “Absorbance correction method for estimation of telmisartan and metoprolol succinate in combined tablet dosage forms,” Pharm. Methods, vol. 3, no. 2, pp. 106–111, July 2012. [CrossRef]
- C. Thapa, A. Ahad, Mohd. Aqil, S. S. Imam, and Y. Sultana, “Formulation and optimization of nanostructured lipid carriers to enhance oral bioavailability of telmisartan using Box–Behnken design,” J. Drug Deliv. Sci. Technol., vol. 44, pp. 431–439, Apr. 2018. [CrossRef]
- J. Zhu, Y. Huang, J. Zhang, Y. Feng, and L. Shen, “Formulation, Preparation and Evaluation of Nanostructured Lipid Carrier Containing Naringin and Coix Seed Oil for Anti-Tumor Application Based on ‘Unification of Medicines and Excipients,’” Drug Des. Devel. Ther., vol. 14, pp. 1481–1491, 2020. [CrossRef]
- P. R. Amarachinta, G. Sharma, N. Samed, A. K. Chettupalli, M. Alle, and J.-C. Kim, “Central composite design for the development of carvedilol-loaded transdermal ethosomal hydrogel for extended and enhanced anti-hypertensive effect,” J. Nanobiotechnology, vol. 19, no. 1, p. 100, Dec. 2021. [CrossRef]
- “Design, Formulation, In-Vitro and Ex-Vivo Evaluation of Atazanavir Loaded Cubosomal Gel,” Biointerface Res. Appl. Chem., vol. 11, no. 4, pp. 12037–12054, Dec. 2020. [CrossRef]
- A. Unnisa et al., “Development of Dapagliflozin Solid Lipid Nanoparticles as a Novel Carrier for Oral Delivery: Statistical Design, Optimization, In-Vitro and In-Vivo Characterization, and Evaluation,” Pharmaceuticals, vol. 15, no. 5, p. 568, May 2022. 20 May; 22. [CrossRef]
- Unnisa, A. K. Chettupalli, T. Hussain, and M. A. Kamal, “Recent Advances in Epidermal Growth Factor Receptor Inhibitors (EGFRIs) andtheir Role in the Treatment of Cancer: A Review,” Anticancer Agents Med. Chem., vol. 22, no. 20, pp. 3370–3381, Dec. 2022. [CrossRef]
- Unnisa et al., “Nanostructured Lipid Carriers to Enhance the Bioavailability and Solubility of Ranolazine: Statistical Optimization and Pharmacological Evaluations,” Pharmaceuticals, vol. 16, no. 8, p. 1151, Aug. 2023. [CrossRef]
- K. Chettupalli, P. A. Rao, M. Kuchukuntla, and V. Bakshi, “Development and optimization of aripiprazole ODT by using box-behnken design,” Res. J. Pharm. Technol., vol. 13, no. 12, pp. 6195–6201, 2020. [CrossRef]
- K. Wa Kasongo, R. Shegokar, R. H. Müller, and R. B. Walker, “Formulation development and in vitro evaluation of didanosine-loaded nanostructured lipid carriers for the potential treatment of AIDS dementia complex,” Drug Dev. Ind. Pharm., vol. 37, no. 4, pp. 396–407, Apr. 2011. [CrossRef]
- P. Rao Avula, A. K. Chettupalli, V. Chauhan, and R. K. Jadi, “Design, formulation, in-vitro and in-vivo pharmacokinetic evaluation of Nicardipine- nanostructured lipid carrier for transdermal drug delivery system,” Mater. Today Proc., p. S2214785323036751, July 2023. [CrossRef]
- R. R. Prasad, J. R. Kumar, B. Vasudha, and C. A. Kumar, “FORMULATION DEVELOPMENT AND EVALUATION OF ALLOPURINOL SOLID DISPERSIONS BY SOLVENT EVAPORATION TECHNIQUE,” Int. J. Appl. Pharm., vol. 10, no. 4, p. 168, July 2018. [CrossRef]
- “Formulation and Evaluation of Poly Herbal Liqui-Solid Compact for its Anti-Inflammatory Effect,” Biointerface Res. Appl. Chem., vol. 12, no. 3, pp. 3883–3899, Aug. 2021. [CrossRef]
- A. K. Chettupalli, S. Ajmera, P. R. Amarachinta, R. M. Manda, and R. K. Jadi, “Quality by Design Approach for Preparation, Characterization, and StatisticalOptimization of Naproxen Sodium-loaded Ethosomes via TransdermalRoute,” Curr. Bioact. Compd., vol. 19, no. 10, p. e060623217712, Dec. 2023. [CrossRef]
- Unnisa and A. K. Chettupalli, “Promising Role of Phytochemicals in the Prevention and Treatment of Cancer,” Anticancer Agents Med. Chem., vol. 22, no. 20, pp. 3382–3400, 2022. [CrossRef]
- K. Chettupalli, S. Ajmera, M. Kuchukuntla, V. Palanivel, and S. Katta, “Design Formulation of Nanospanlastic Novel Carriers as a PromisingApproach to Enhanced Bioavailability in Intranasal Drug Delivery forSinusitis: Statistical Optimization and In vitro and In vivo Characterization,” Curr. Nanomedicine, vol. 14, no. 3, pp. 266–288, Nov. 2024. [CrossRef]
- L. C. Fuhrman, B. B. Michniak, C. R. Behl, and A. W. Malick, “Effect of novel penetration enhancers on the transdermal delivery of hydrocortisone: an in vitro species comparison,” J. Controlled Release, vol. 45, no. 2, pp. 199–206, Mar. 1997. [CrossRef]
- K. Derakhshandeh, M. Soheili, S. Dadashzadeh, and R. Saghiri, “Preparation and in vitro characterization of 9-nitrocamptothecin-loaded long circulating nanoparticles for delivery in cancer patients,” Int. J. Nanomedicine, vol. 5, pp. 463–471, Aug. 2010. [CrossRef]
- L. H. Sameina, S. Idamakantia, A. K. Chettupalli, R. R. Velamala, and M. O. Ezzat, “Design of mesalamine loaded micro-particles: Preparation, in vitro and in-vivo characterization,” Mater. Today Proc., p. S2214785323039251, July 2023. [CrossRef]
- A. Ahmeda, A. Zangeneh, and M. M. Zangeneh, “Preparation, formulation, and chemical characterization of silver nanoparticles using MELISSA OFFICINALIS leaf aqueous extract for the treatment of acute myeloid leukemia in vitro and in vivo conditions,” Appl. Organomet. Chem., vol. 34, no. 2, p. e5378, Feb. 2020. [CrossRef]
- K. Chettupalli, P. R. Avula, and V. Chauhan, “Improved Transdermal Delivery of Anti-hypertensive Drug LoadedNanostructured Lipid Carriers: Statistical Design, Optimization, Depictionand Pharmacokinetic Assessment,” Curr. Drug Ther., vol. 19, no. 7, pp. 828–845, Nov. 2024. [CrossRef]
- K. Chettupalli et al., “Design, optimization, and characterization of Zolmitriptan loaded liposomal gels for intranasal delivery for acute migraine therapy,” Intell. Pharm., vol. 3, no. 1, pp. 11–25, Feb. 2025. [CrossRef]
- K. Chettupalli, A. Unnisa, H. Peddapalli, R. K. Jadi, K. Anusha, and P. R. Amarachinta, “Development and evaluation of empagliflozin-loaded solid lipid nanoparticles: Pharmacokinetics and pharmacodynamics for oral delivery,” Intell. Pharm., vol. 3, no. 3, pp. 193–206, June 2025. [CrossRef]
- K. Chettupalli et al., “Development and optimization of dapagliflozin oral nano-bilosomes using response surface method: in vitro evaluation, in vivo evaluation,” Nanotheranostics, vol. 9, no. 1, pp. 1–19, 2025. [CrossRef]
- K. Marati, S. Palatheeya, A. K. Chettupalli, and S. P. Naik Bukke, “Characterization and interactions between piperine and ezetimibe in their Anti-hyperlipidemic efficacy using Biopharmaceutics and Pharmacokinetics,” BMC Pharmacol. Toxicol., vol. 26, no. 1, p. 7, Jan. 2025. [CrossRef]
- A. K. Chettupalli et al., “Investigating New Bilosomes for Ex vivo Skin Deposition, In Vitro Characterization, and Transdermal Delivery of Nimodipine,” Nanoscale Adv., p. 10.1039.D4NA00510D, 2024. [CrossRef]
- K. Chettupalli, S. Chokkarapu, A. Singh, M. R. Babu, M. P. Singh, and S. P. N. Bukke, “Development and fabrication of a novel nano-bilosomal system for enhanced oral delivery of Trametinib: apoptotic induction and anticancer efficacy evaluation,” Mater. Technol., vol. 40, no. 1, p. 2495346, Dec. 2025. [CrossRef]
- K. Chettupalli et al., “Design, development, and preclinical evaluation of pirfenidone-loaded nanostructured lipid carriers for pulmonary delivery,” Sci. Rep., vol. 15, no. 1, p. 11390, Apr. 2025. [CrossRef]
- T. Zhang, J. Chen, Y. Zhang, Q. Shen, and W. Pan, “Characterization and evaluation of nanostructured lipid carrier as a vehicle for oral delivery of etoposide,” Eur. J. Pharm. Sci. Off. J. Eur. Fed. Pharm. Sci., vol. 43, no. 3, pp. 174–179, June 2011. [CrossRef]
- A. K. Chettupalli et al., “Ritonavir loaded solid lipid nanoparticles for oral drug delivery and bioavailability enhancement,” Discov. Appl. Sci., vol. 7, no. 1, p. 58, Jan. 2025. [CrossRef]
- S. P. N. Bukke, S. Mishra, C. Thalluri, C. S. Reddy, A. K. Chettupalli, and G. A. Kumar, “Transformative Approaches in Bone Pathology Treatment: The Efficacy of Alendronate-Infused Hydroxyapatite Microspheres,” J. Biochem. Technol., vol. 15, no. 4, pp. 9–16, 2024. [CrossRef]
- Department of Pharmaceutics, Nibha Institute of Pharmaceutical Sciences, Rajgir, India and M. A. Jahangir, “Efficacy of Metallic Nanoparticles and Nanocarriers as an Advanced Tool for Imaging and Diagnosis: Insight into Theranostic Applications,” Int. J. Biomed. Investig., vol. 6, no. 2, pp. 1–17, Nov. 2023. [CrossRef]
- M. Rizwanullah, S. Amin, and J. Ahmad, “Improved pharmacokinetics and antihyperlipidemic efficacy of rosuvastatin-loaded nanostructured lipid carriers,” J. Drug Target., vol. 25, no. 1, pp. 58–74, Jan. 2017. [CrossRef]
- H. S. Rahman et al., “Zerumbone-loaded nanostructured lipid carriers: preparation, characterization, and antileukemic effect,” Int. J. Nanomedicine, vol. 8, pp. 2769–2781, 2013. [CrossRef]
- R. G. Madane and H. S. Mahajan, “Curcumin-loaded nanostructured lipid carriers (NLCs) for nasal administration: design, characterization, and in vivo study,” Drug Deliv., vol. 23, no. 4, pp. 1326–1334, May 2016. [CrossRef]
- S. M. M. Moghddam, A. Ahad, M. Aqil, S. S. Imam, and Y. Sultana, “Optimization of nanostructured lipid carriers for topical delivery of nimesulide using Box-Behnken design approach,” Artif. Cells Nanomedicine Biotechnol., vol. 45, no. 3, pp. 617–624, May 2017. [CrossRef]
- M.-P. Gratacap et al., “The new tyrosine-kinase inhibitor and anticancer drug dasatinib reversibly affects platelet activation in vitro and in vivo,” Blood, vol. 114, no. 9, pp. 1884–1892, Aug. 2009. [CrossRef]
- L. Sahoo, G. K. Jena, C. S. Patro, C. N. Patro, and N. R. Meher, “In Vitro and In Vivo Characterization of Transdermal Patch Loaded with Nanostructured Lipid Carrier for Bioavailability Enhancement of Dolutegravir Sodium Using Taguchi and Box-Behnken Design,” BioNanoScience, vol. 13, no. 3, pp. 1213–1230, Sept. 2023. [CrossRef]
- S. Justin Packia Jacob, J. S. Finub, and A. Narayanan, “Synthesis of silver nanoparticles using Piper longum leaf extracts and its cytotoxic activity against Hep-2 cell line,” Colloids Surf. B Biointerfaces, vol. 91, pp. 212–214, Mar. 2012. [CrossRef]
- F. Namvar et al., “Cytotoxic effect of magnetic iron oxide nanoparticles synthesized via seaweed aqueous extract,” Int. J. Nanomedicine, vol. 9, pp. 2479–2488, 2014. [CrossRef]
- R. Sankar, R. Maheswari, S. Karthik, K. S. Shivashangari, and V. Ravikumar, “Anticancer activity of Ficus religiosa engineered copper oxide nanoparticles,” Mater. Sci. Eng. C Mater. Biol. Appl., vol. 44, pp. 234–239, Nov. 2014. 2014. [CrossRef]
- T. Y. Suman, S. R. Radhika Rajasree, A. Kanchana, and S. B. Elizabeth, “Biosynthesis, characterization and cytotoxic effect of plant mediated silver nanoparticles using Morinda citrifolia root extract,” Colloids Surf. B Biointerfaces, vol. 106, pp. 74–78, June 2013. 20 June; 78. [CrossRef]
- R. Vivek, R. R. Vivek, R. Thangam, K. Muthuchelian, P. Gunasekaran, K. Kaveri, and S. Kannan, “Green biosynthesis of silver nanoparticles from Annona squamosa leaf extract and its in vitro cytotoxic effect on MCF-7 cells,” Process Biochem., vol. 47, no. 12, pp. 2405–2410, Dec. 2012. [Google Scholar] [CrossRef]
Figure 1.
Solubility determination of NTB with different lipids and surfactants.
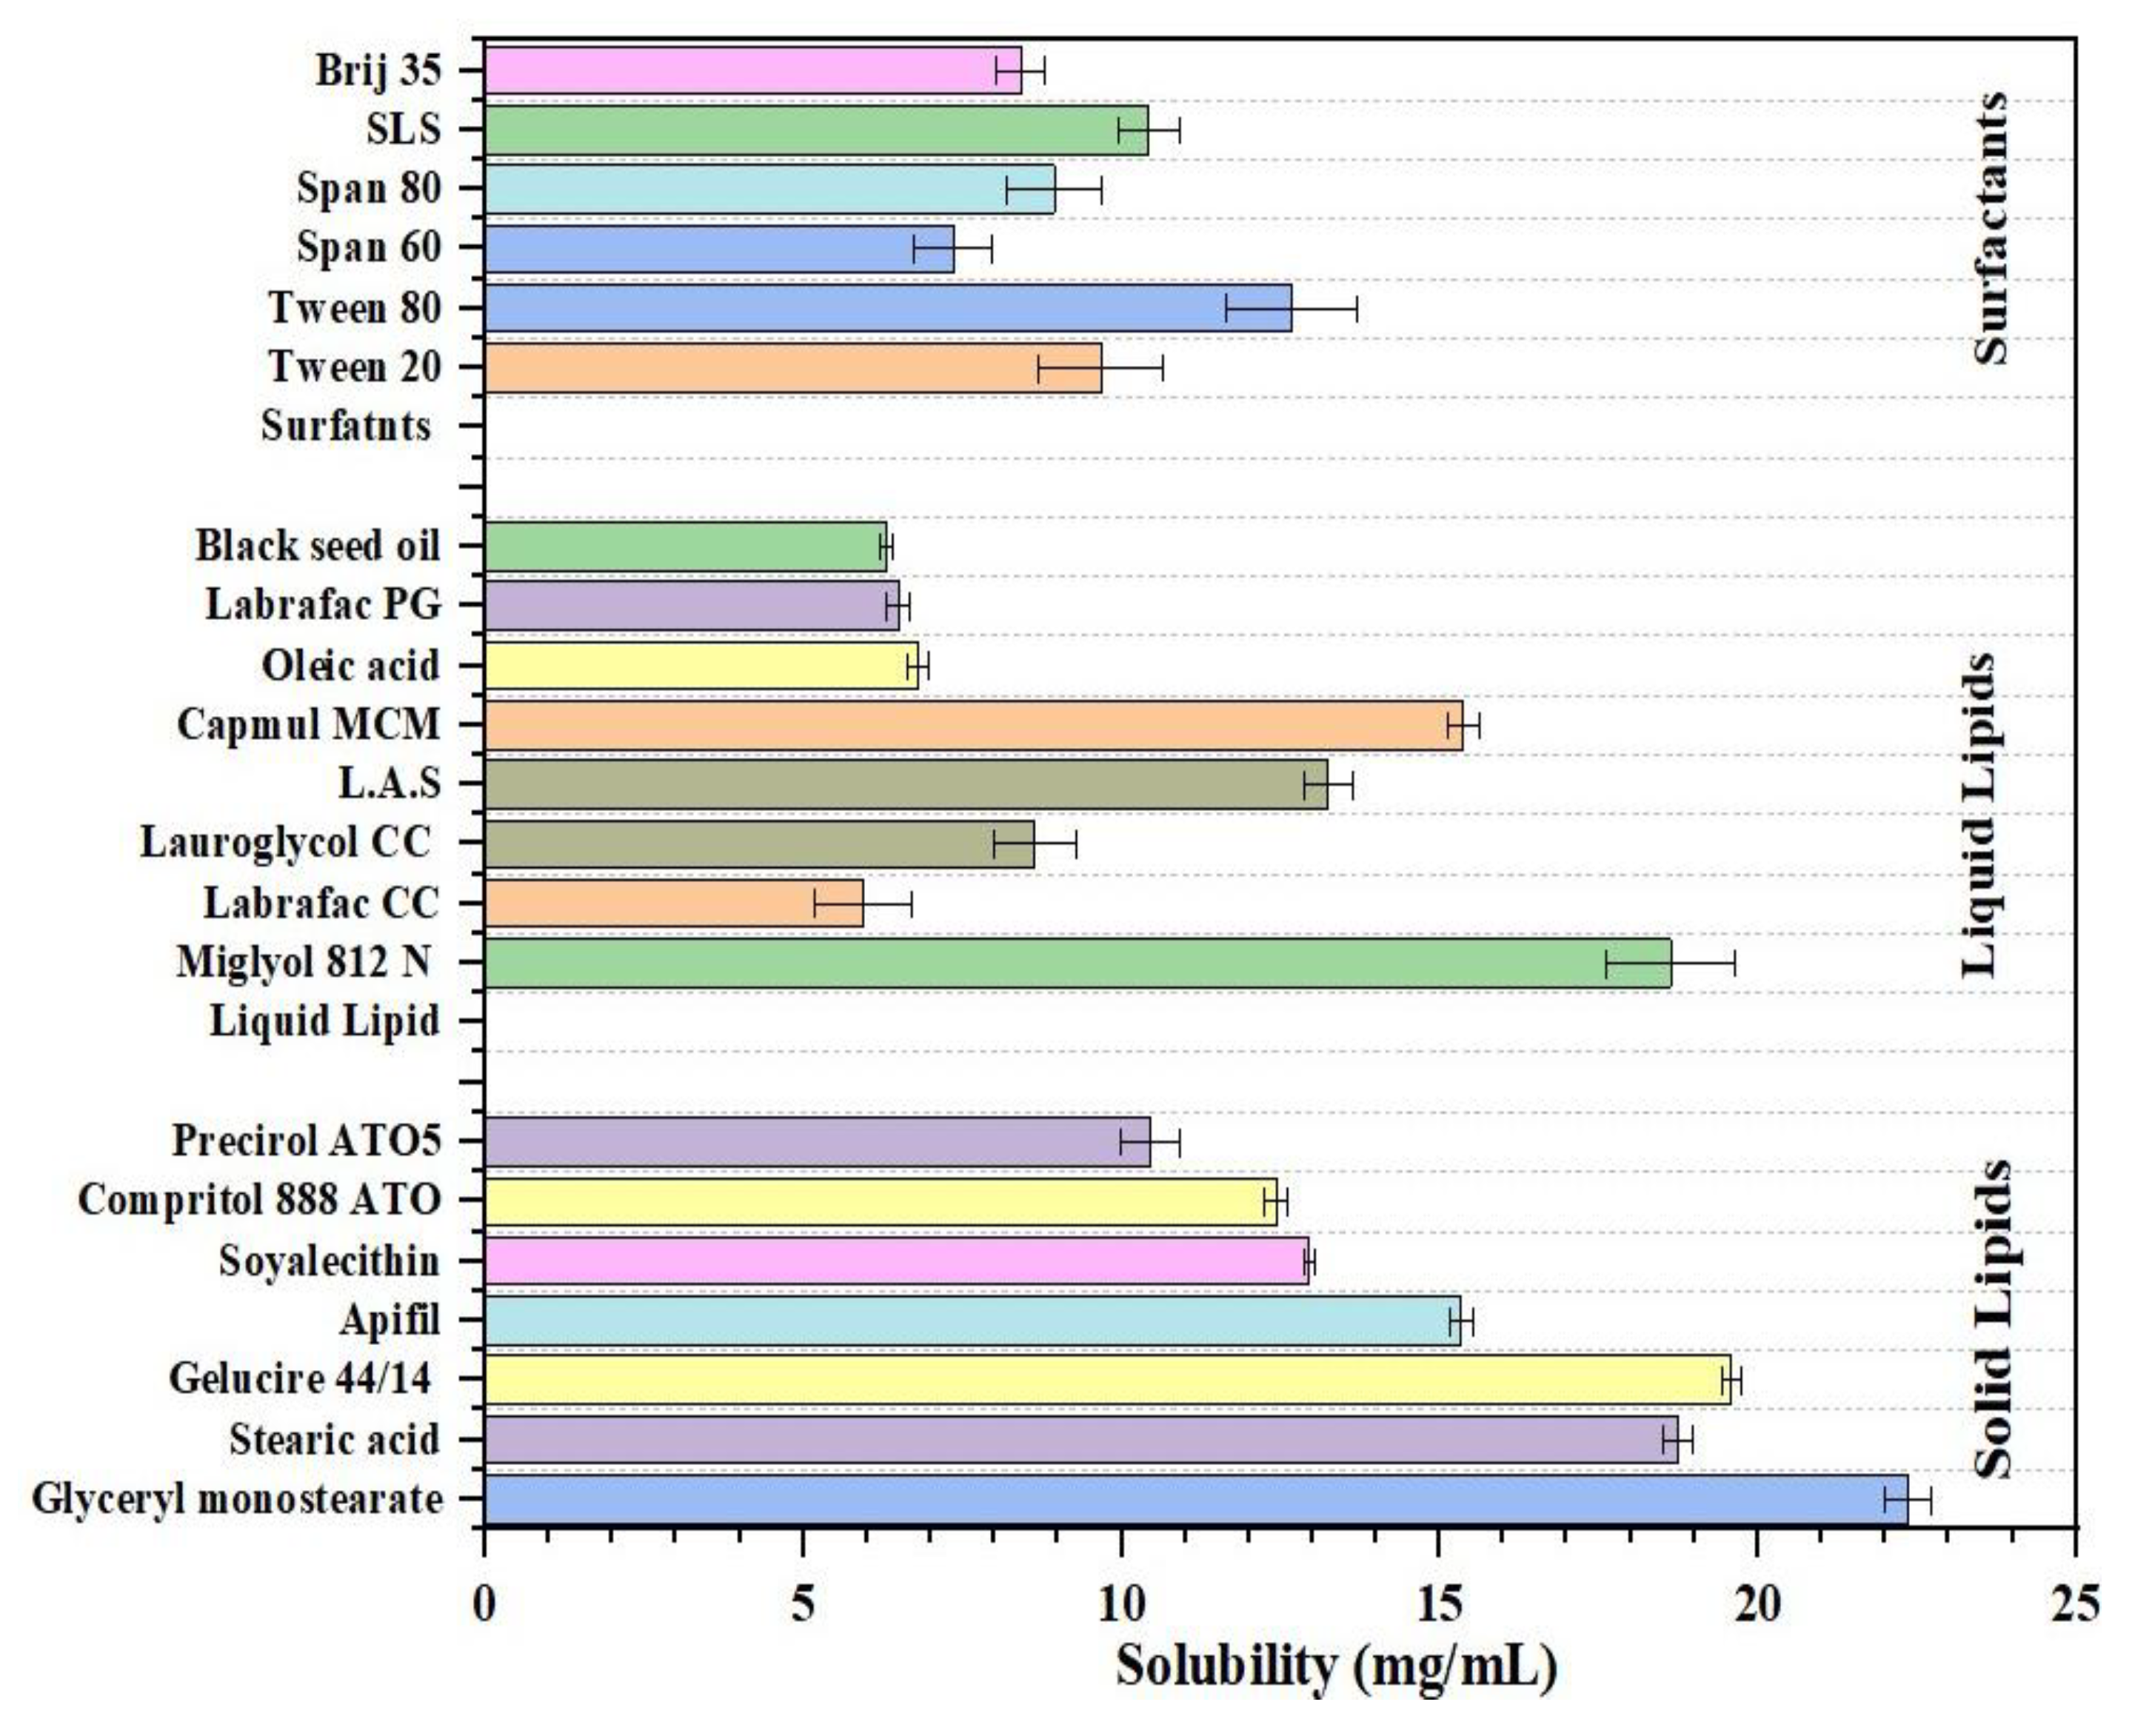
Figure 2.
Three-dimensional response surface plot showing effect of independent variables on NTB-loaded NLC particle size.
Figure 2.
Three-dimensional response surface plot showing effect of independent variables on NTB-loaded NLC particle size.
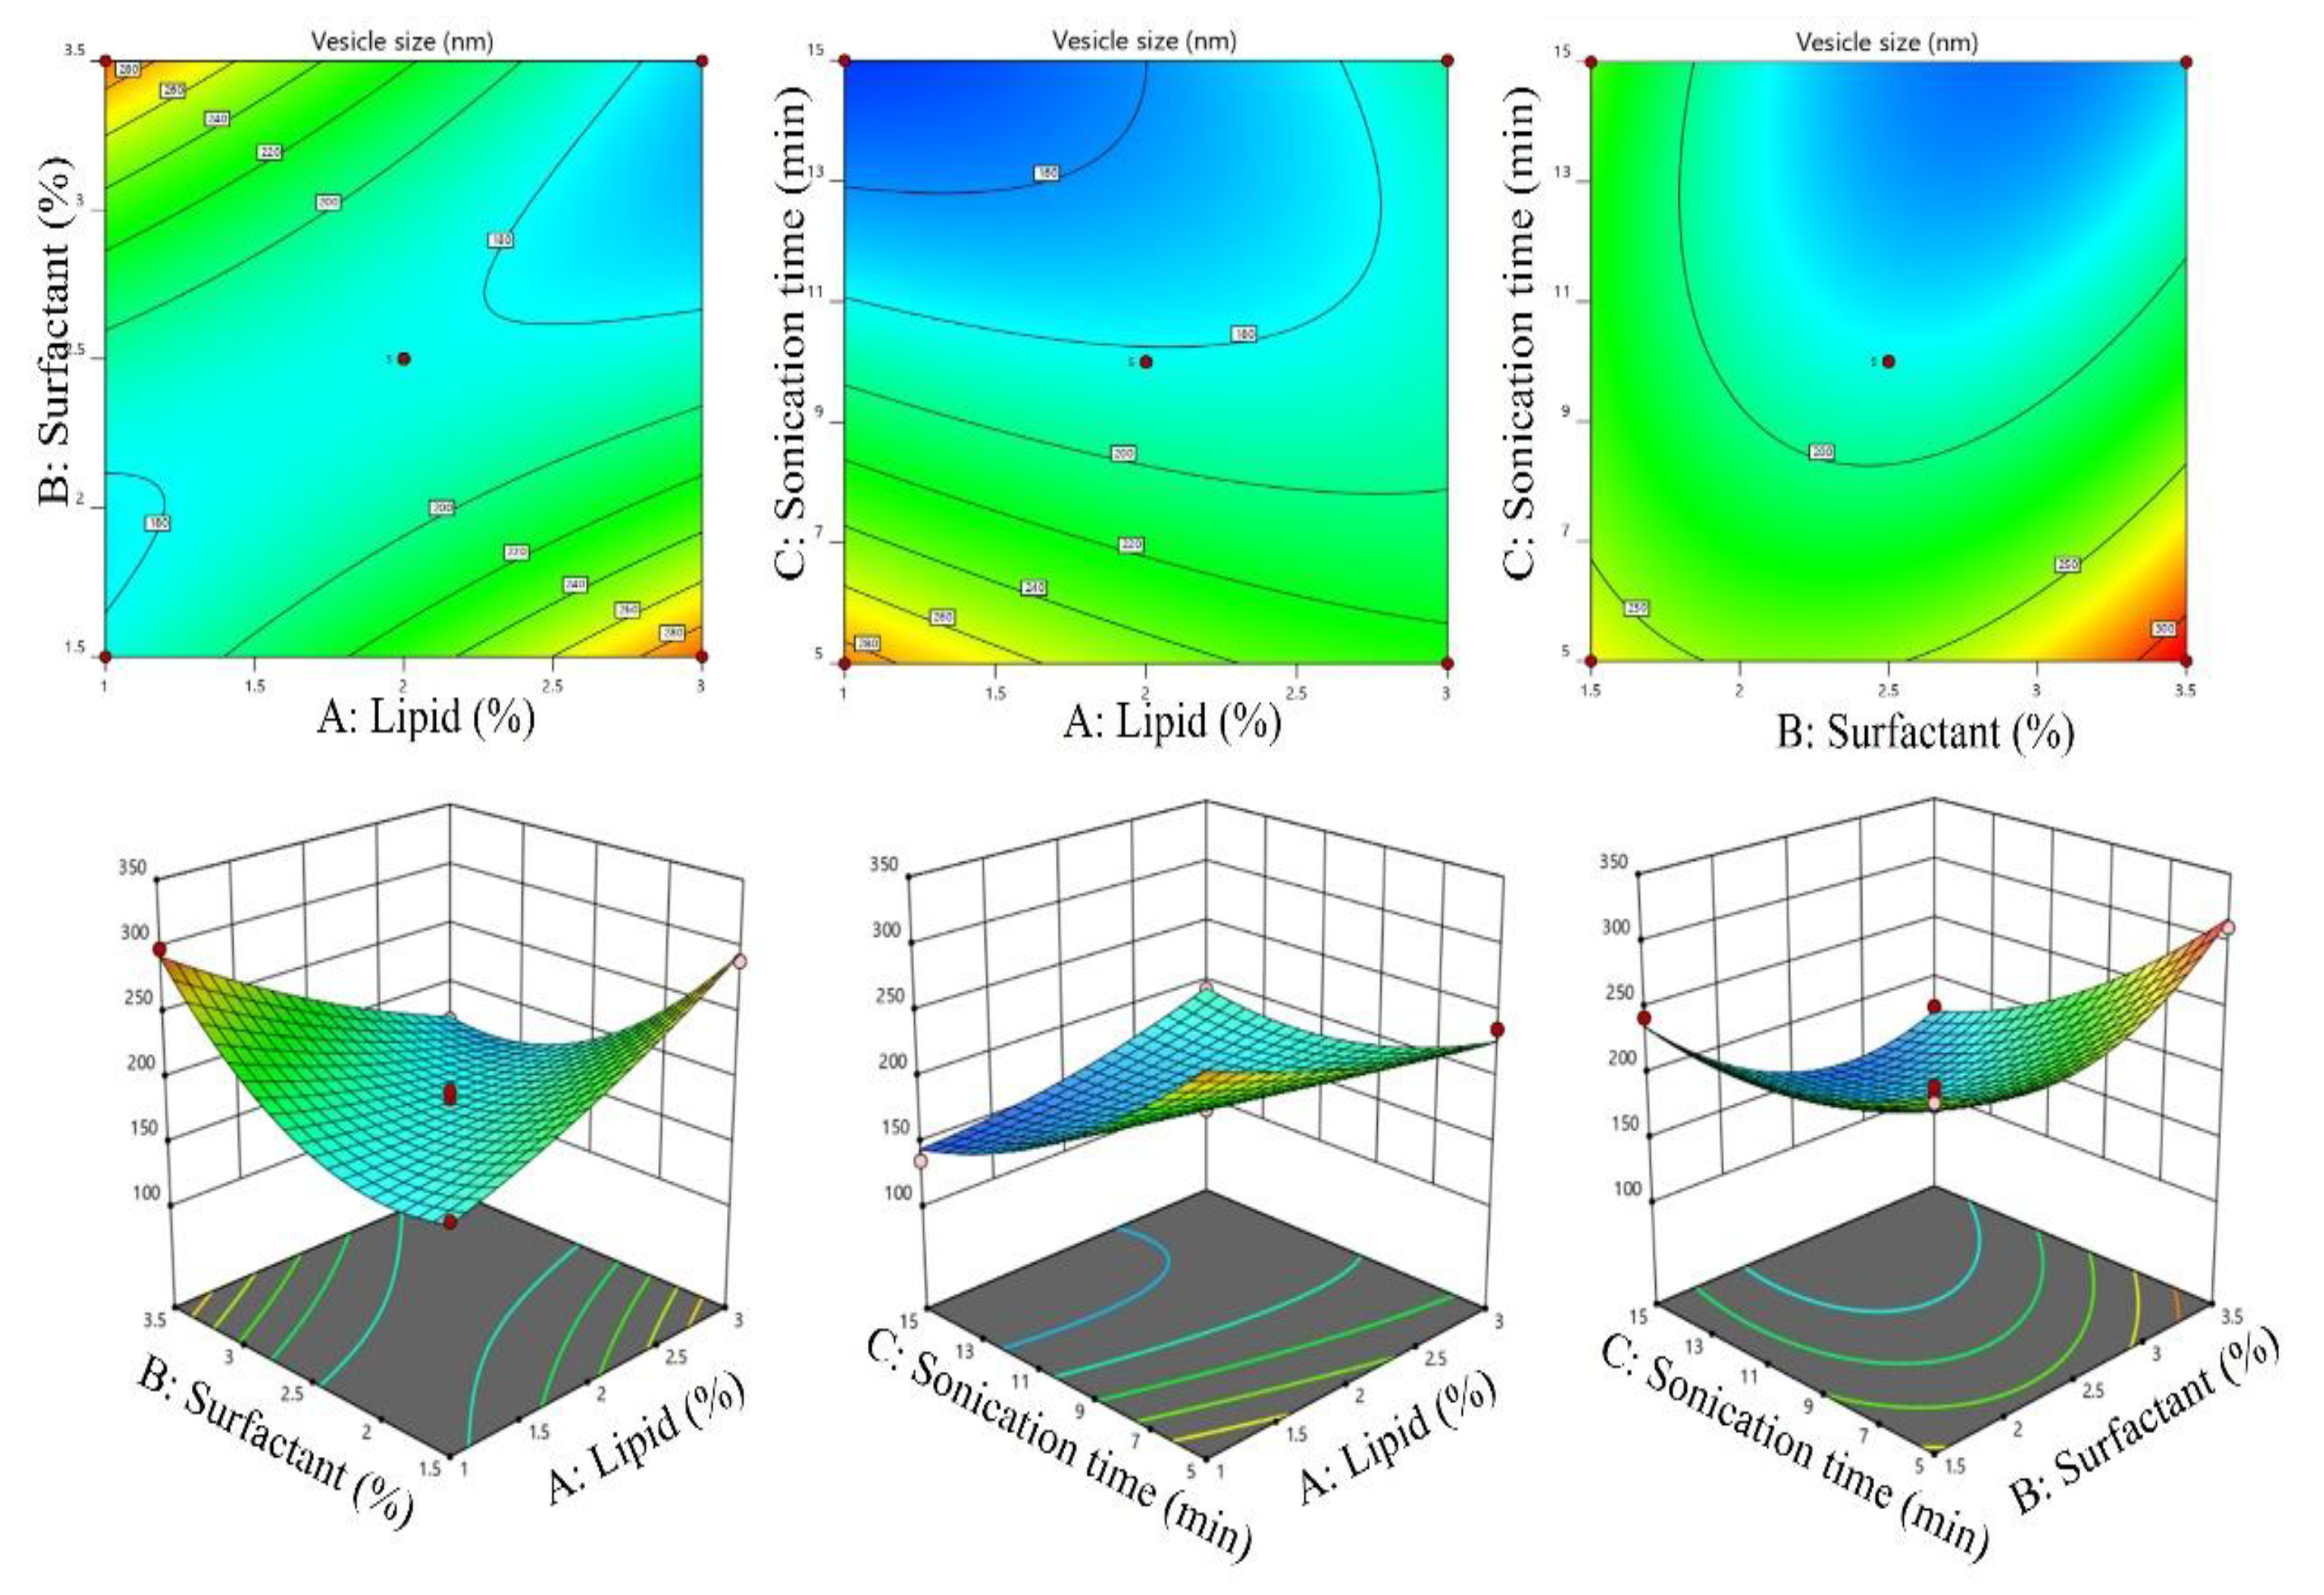
Figure 3.
Three-dimensional response surface plot showing effect of independent variables on NTB-loaded NLCs Entrapment Efficiency.
Figure 3.
Three-dimensional response surface plot showing effect of independent variables on NTB-loaded NLCs Entrapment Efficiency.
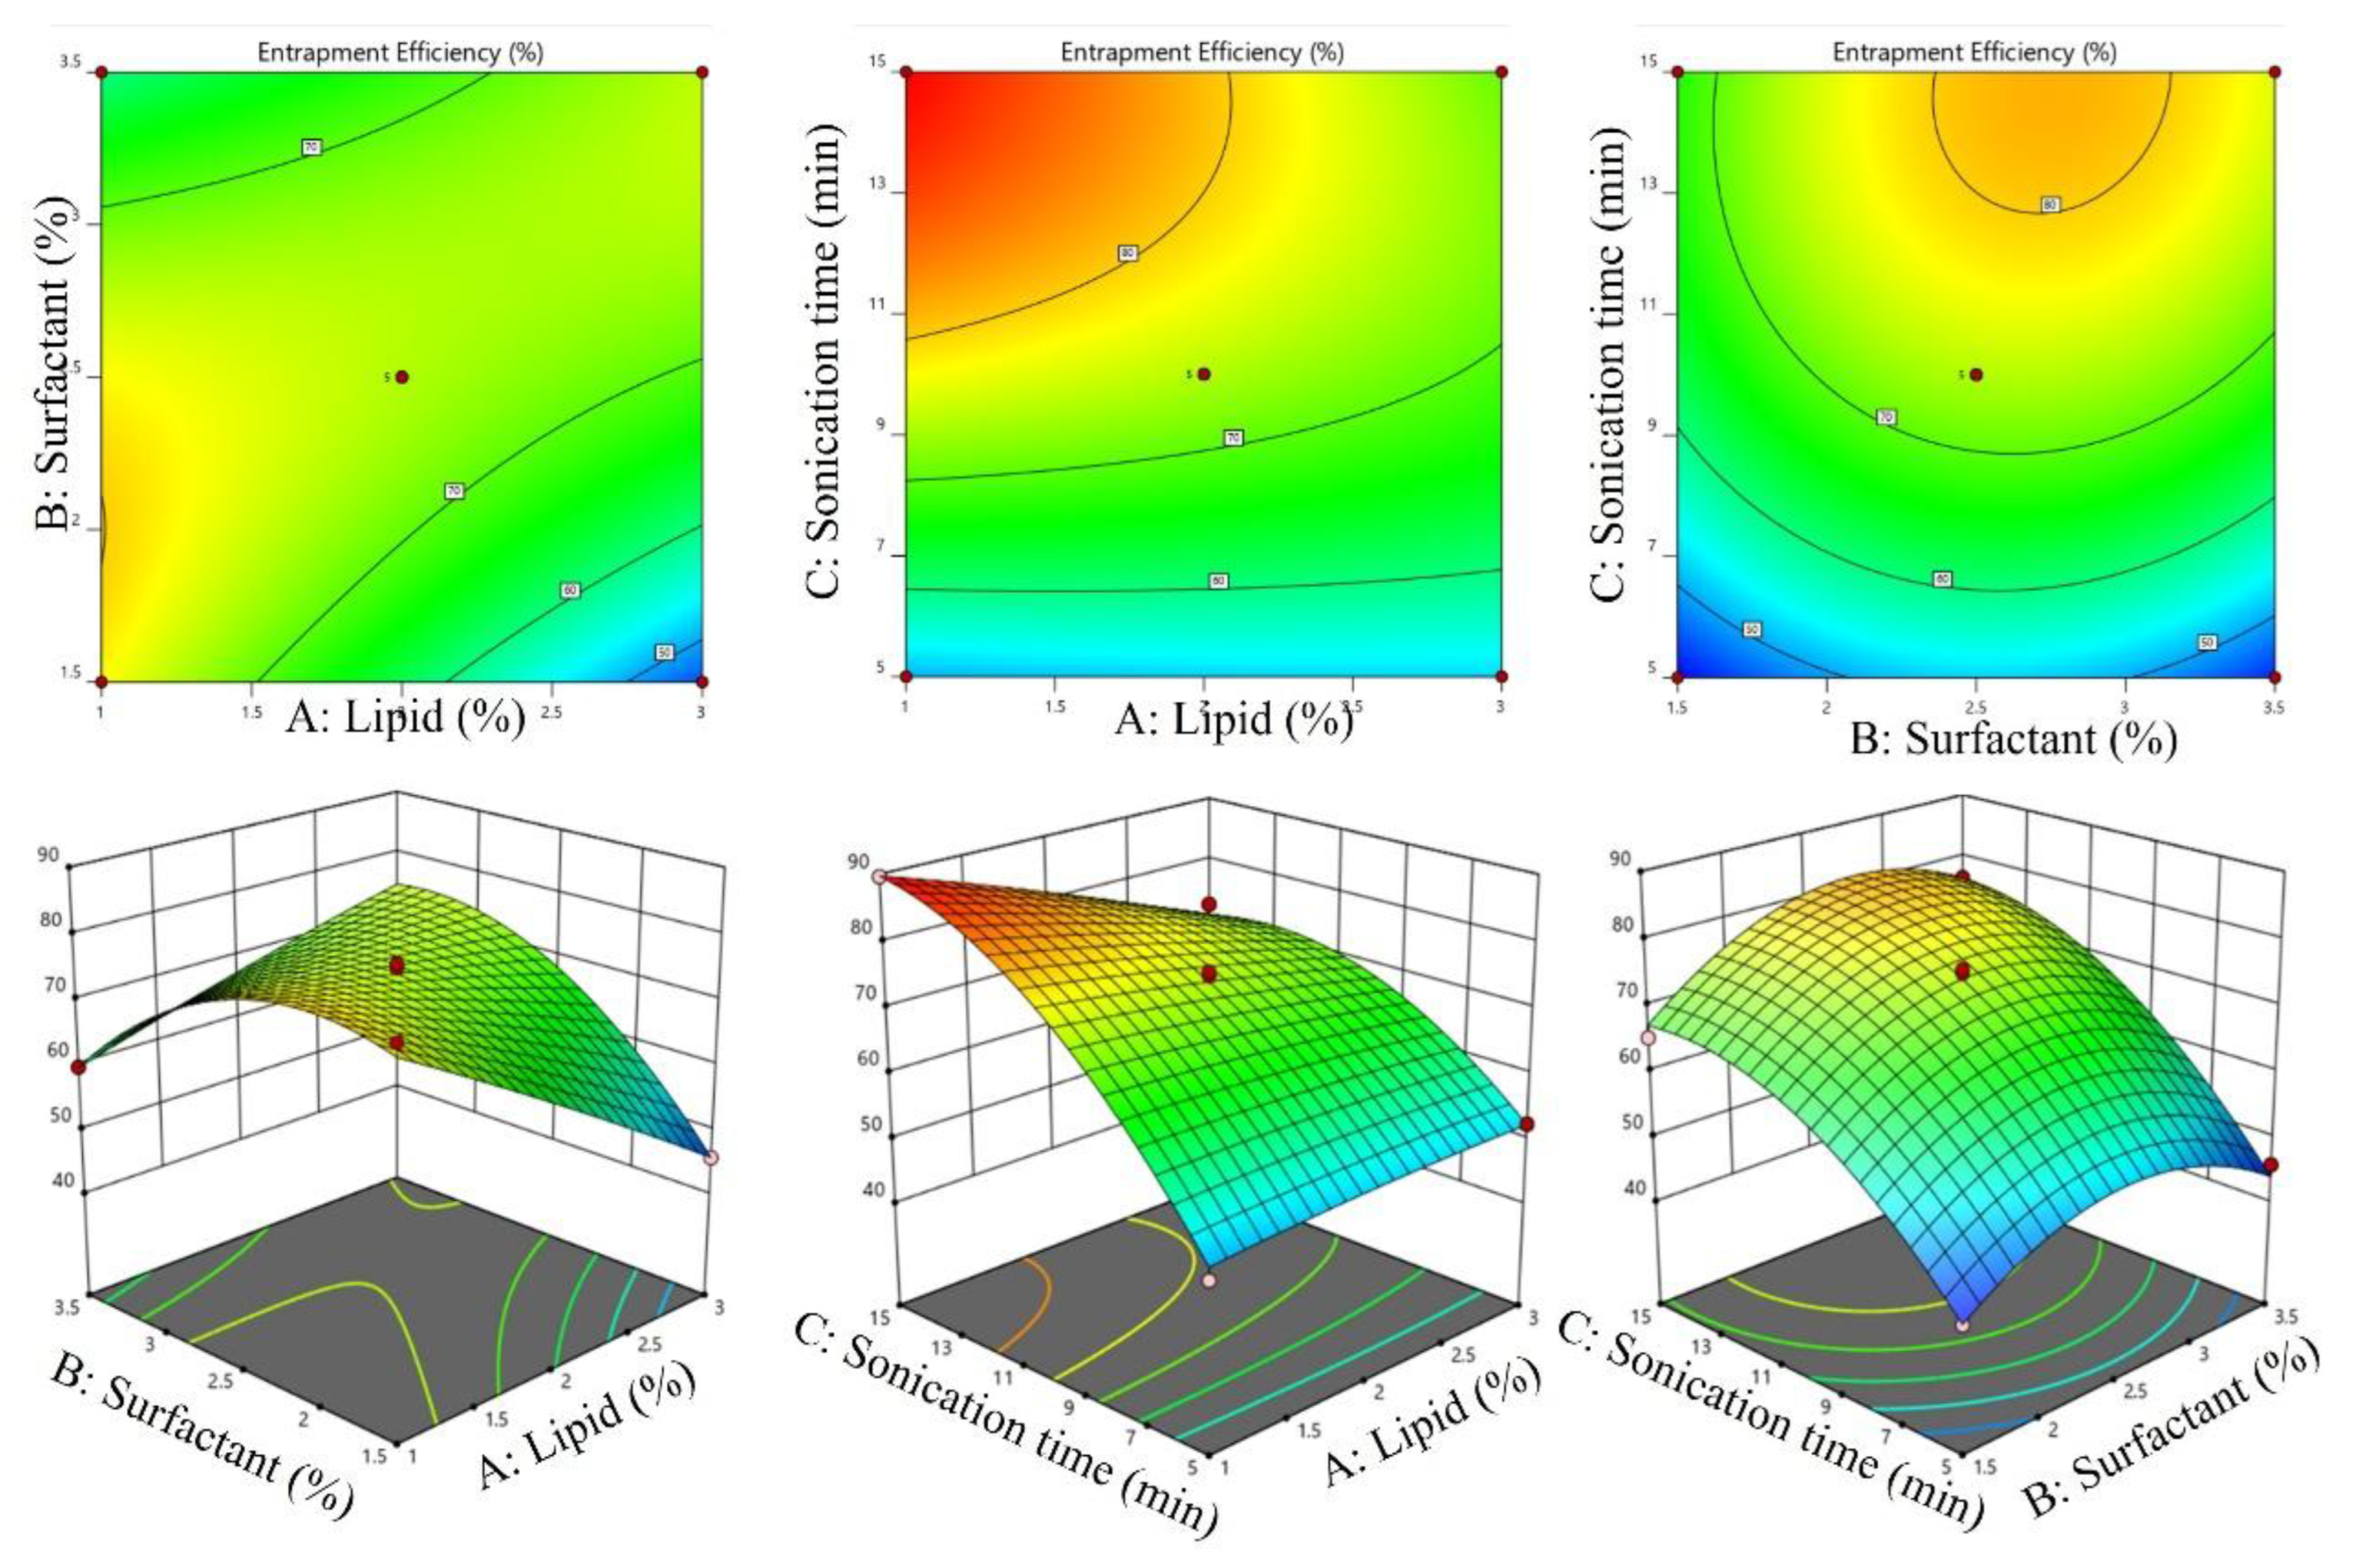
Figure 4.
Three-dimensional response surface plot showing effect of independent variables on NTB-loaded NLC PDI.
Figure 4.
Three-dimensional response surface plot showing effect of independent variables on NTB-loaded NLC PDI.
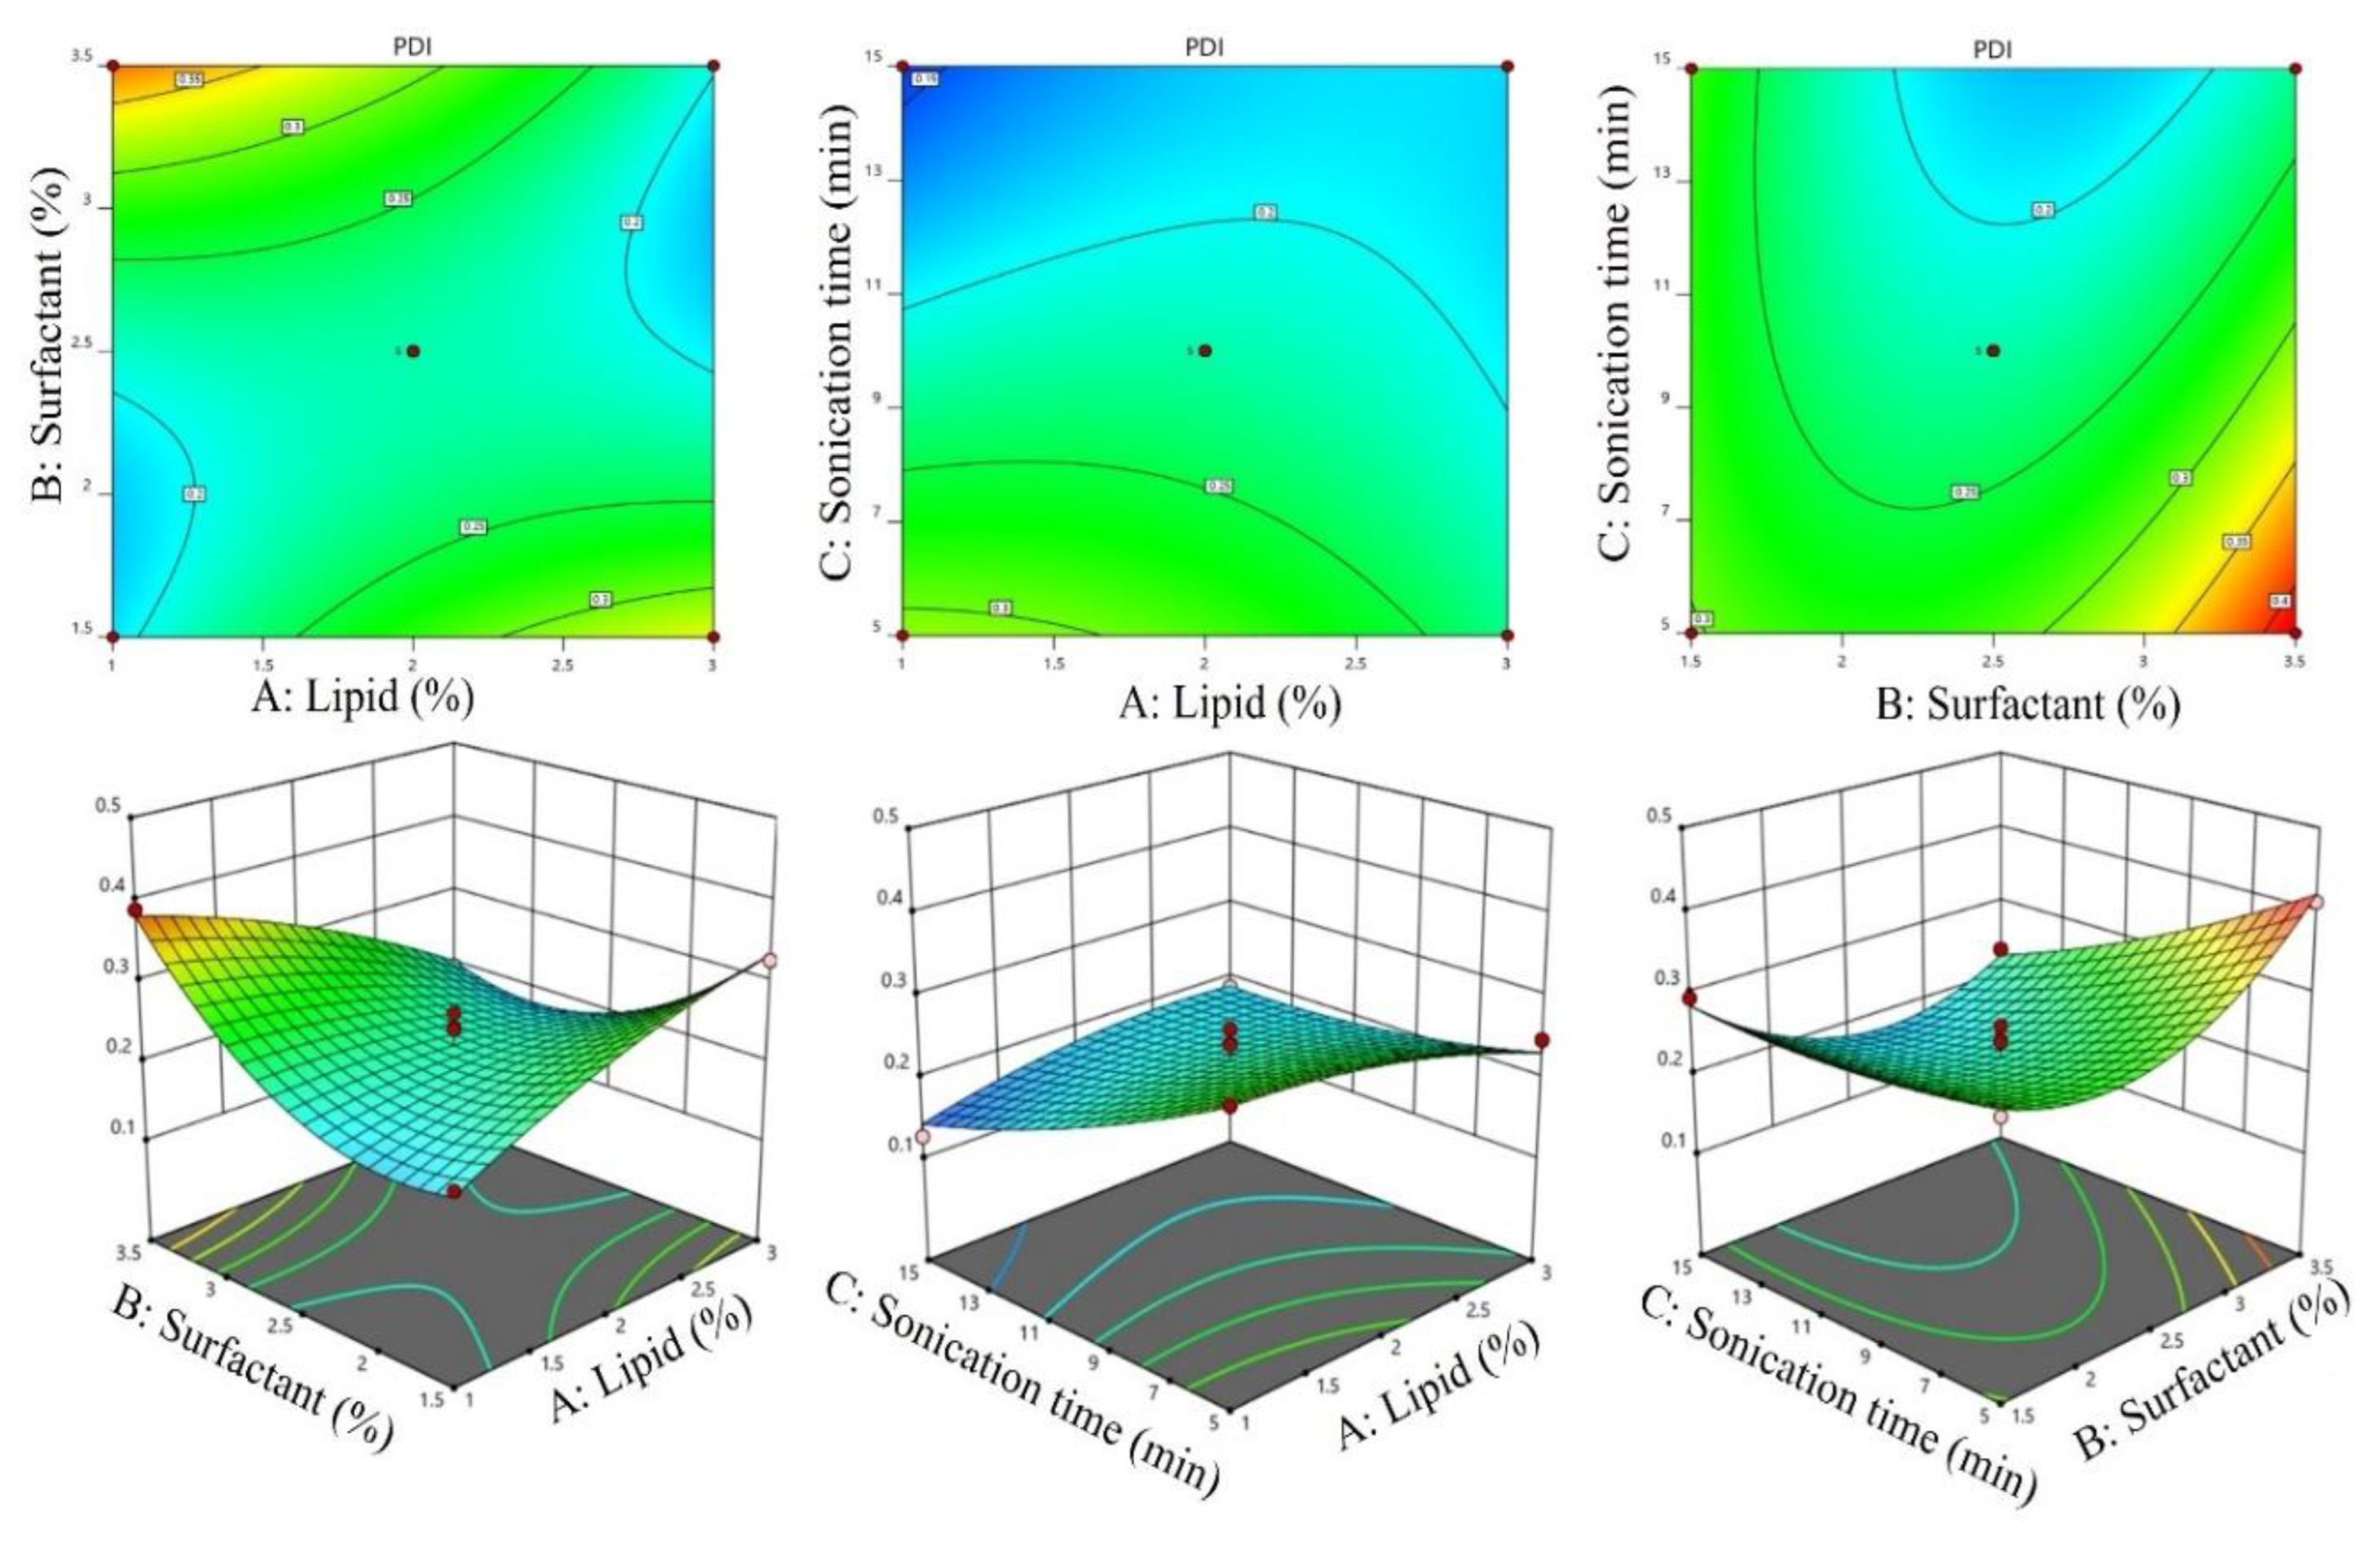
Figure 5.
Three-dimensional response surface plot showing effect of independent variables on NTB-loaded NLC Zeta potential.
Figure 5.
Three-dimensional response surface plot showing effect of independent variables on NTB-loaded NLC Zeta potential.
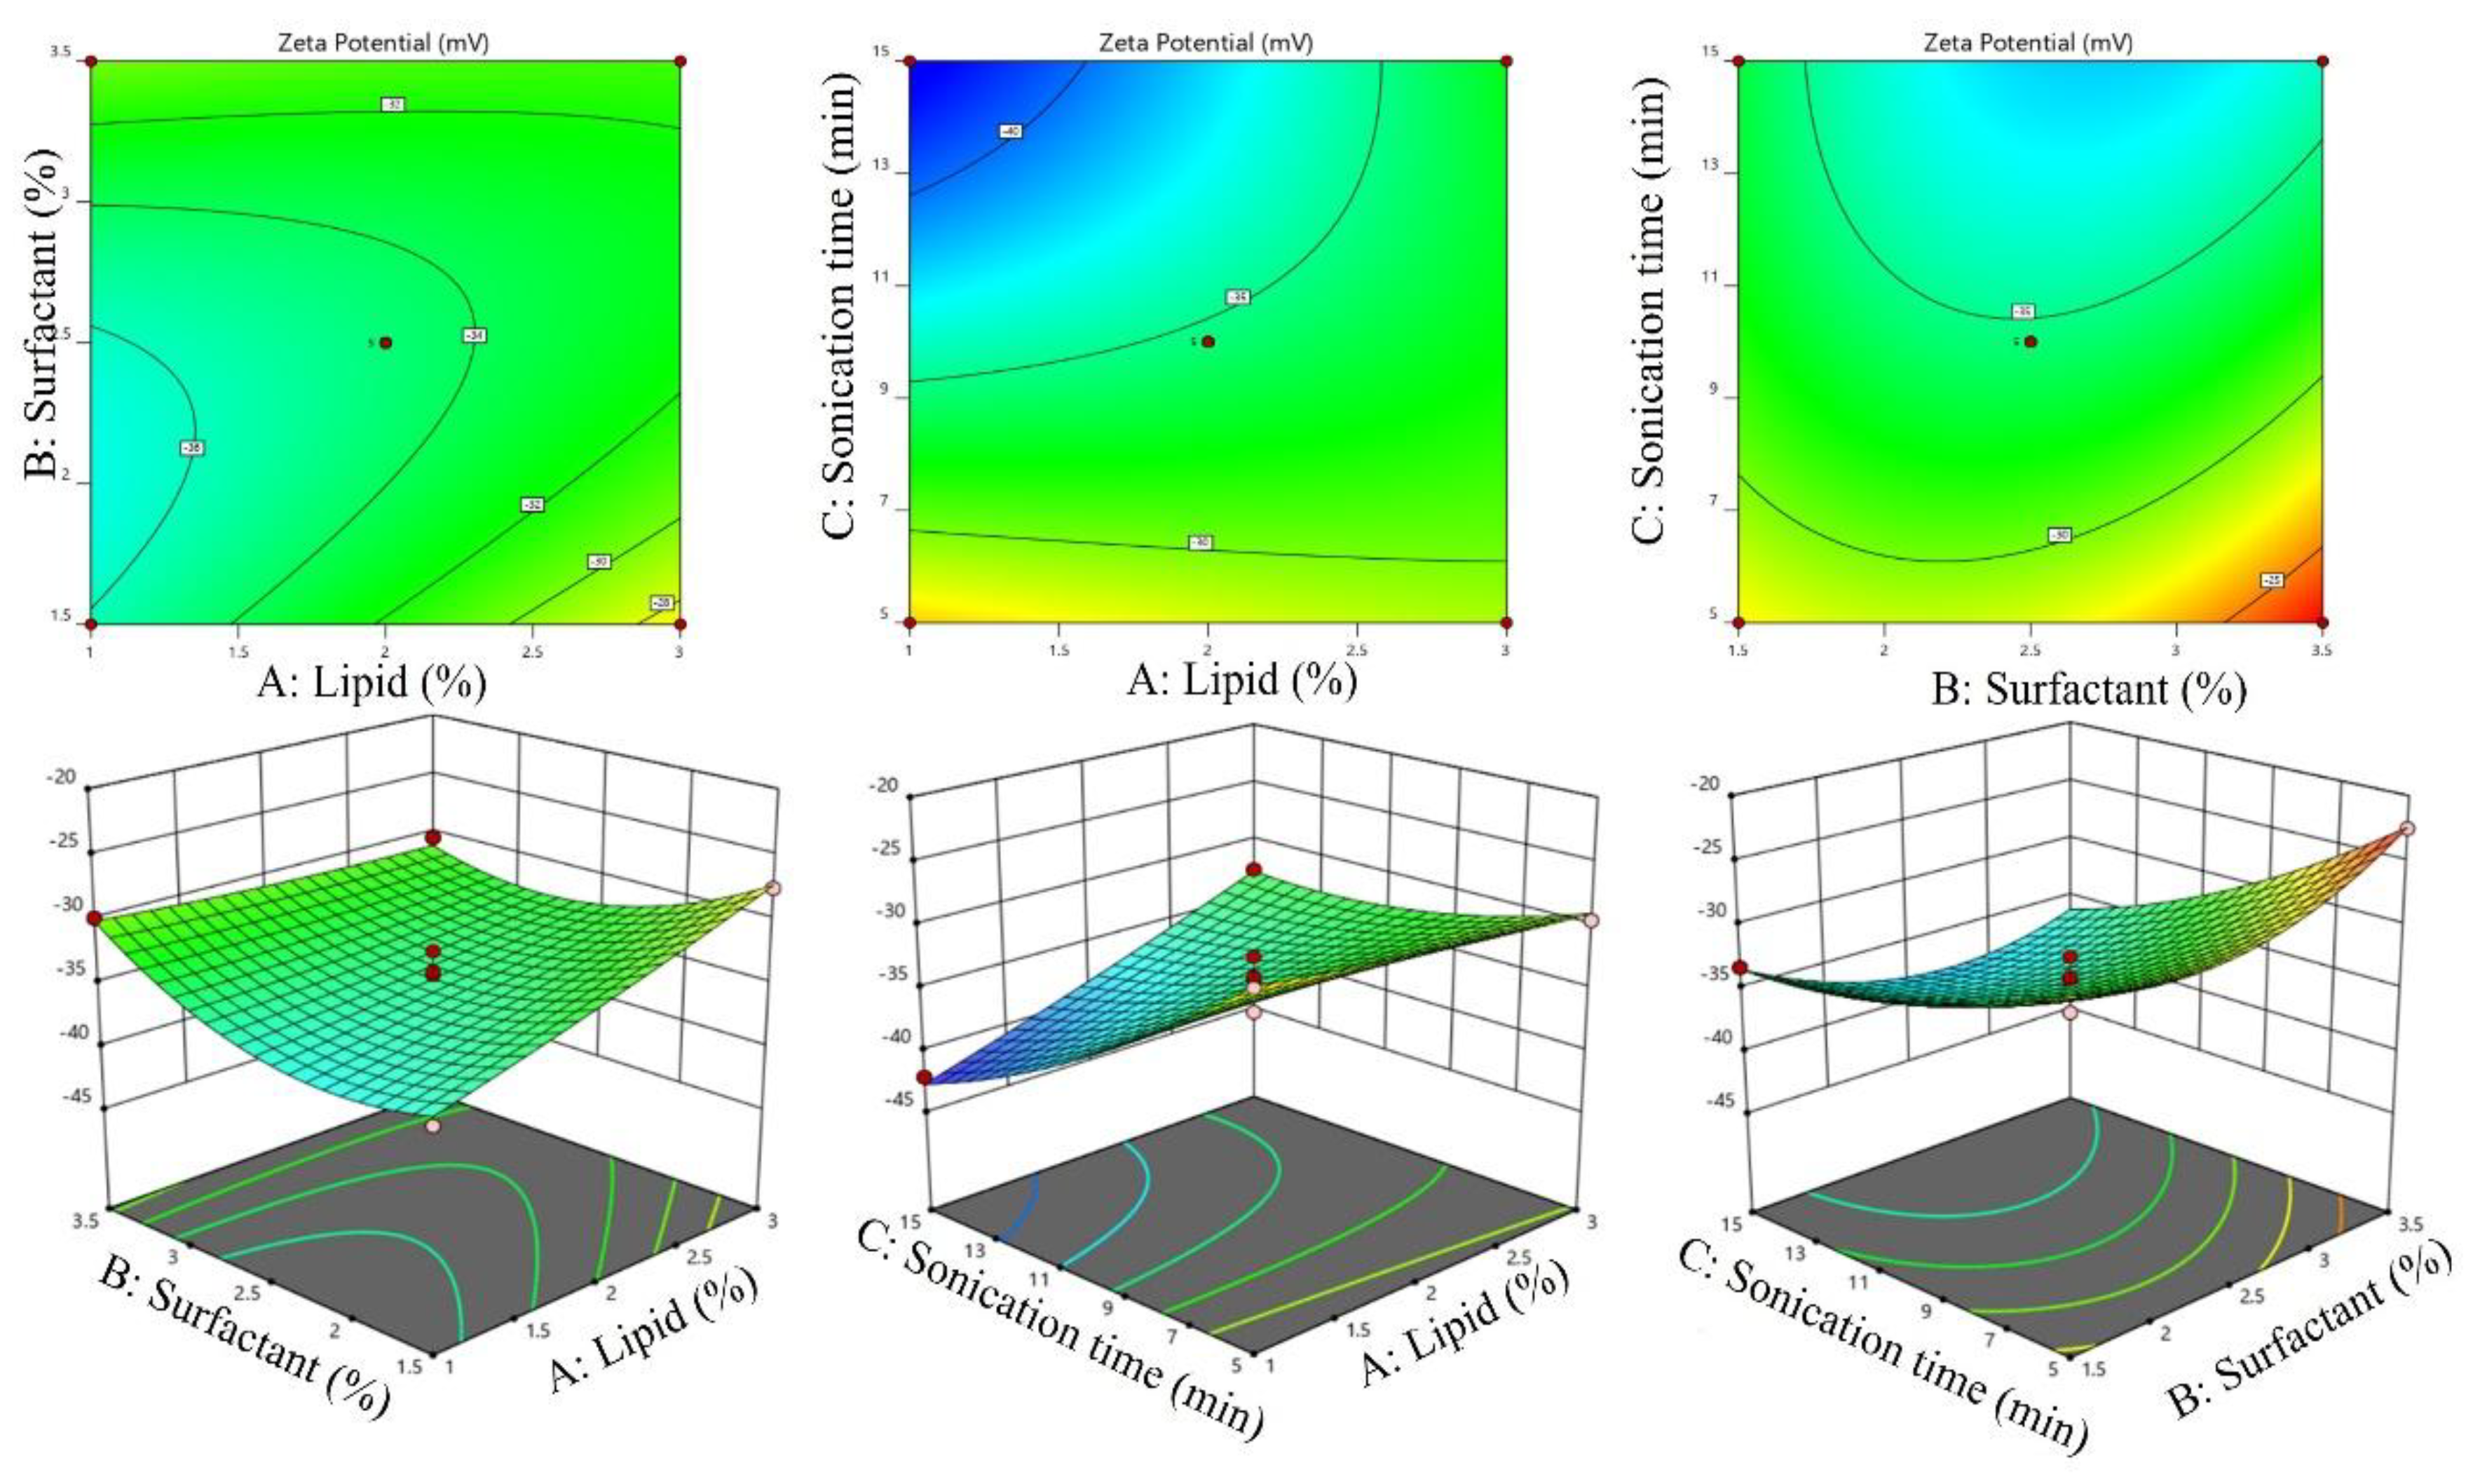
Figure 6.
Perturbation, Desirability and overlay plot for interaction of dependent and independent variables.
Figure 6.
Perturbation, Desirability and overlay plot for interaction of dependent and independent variables.
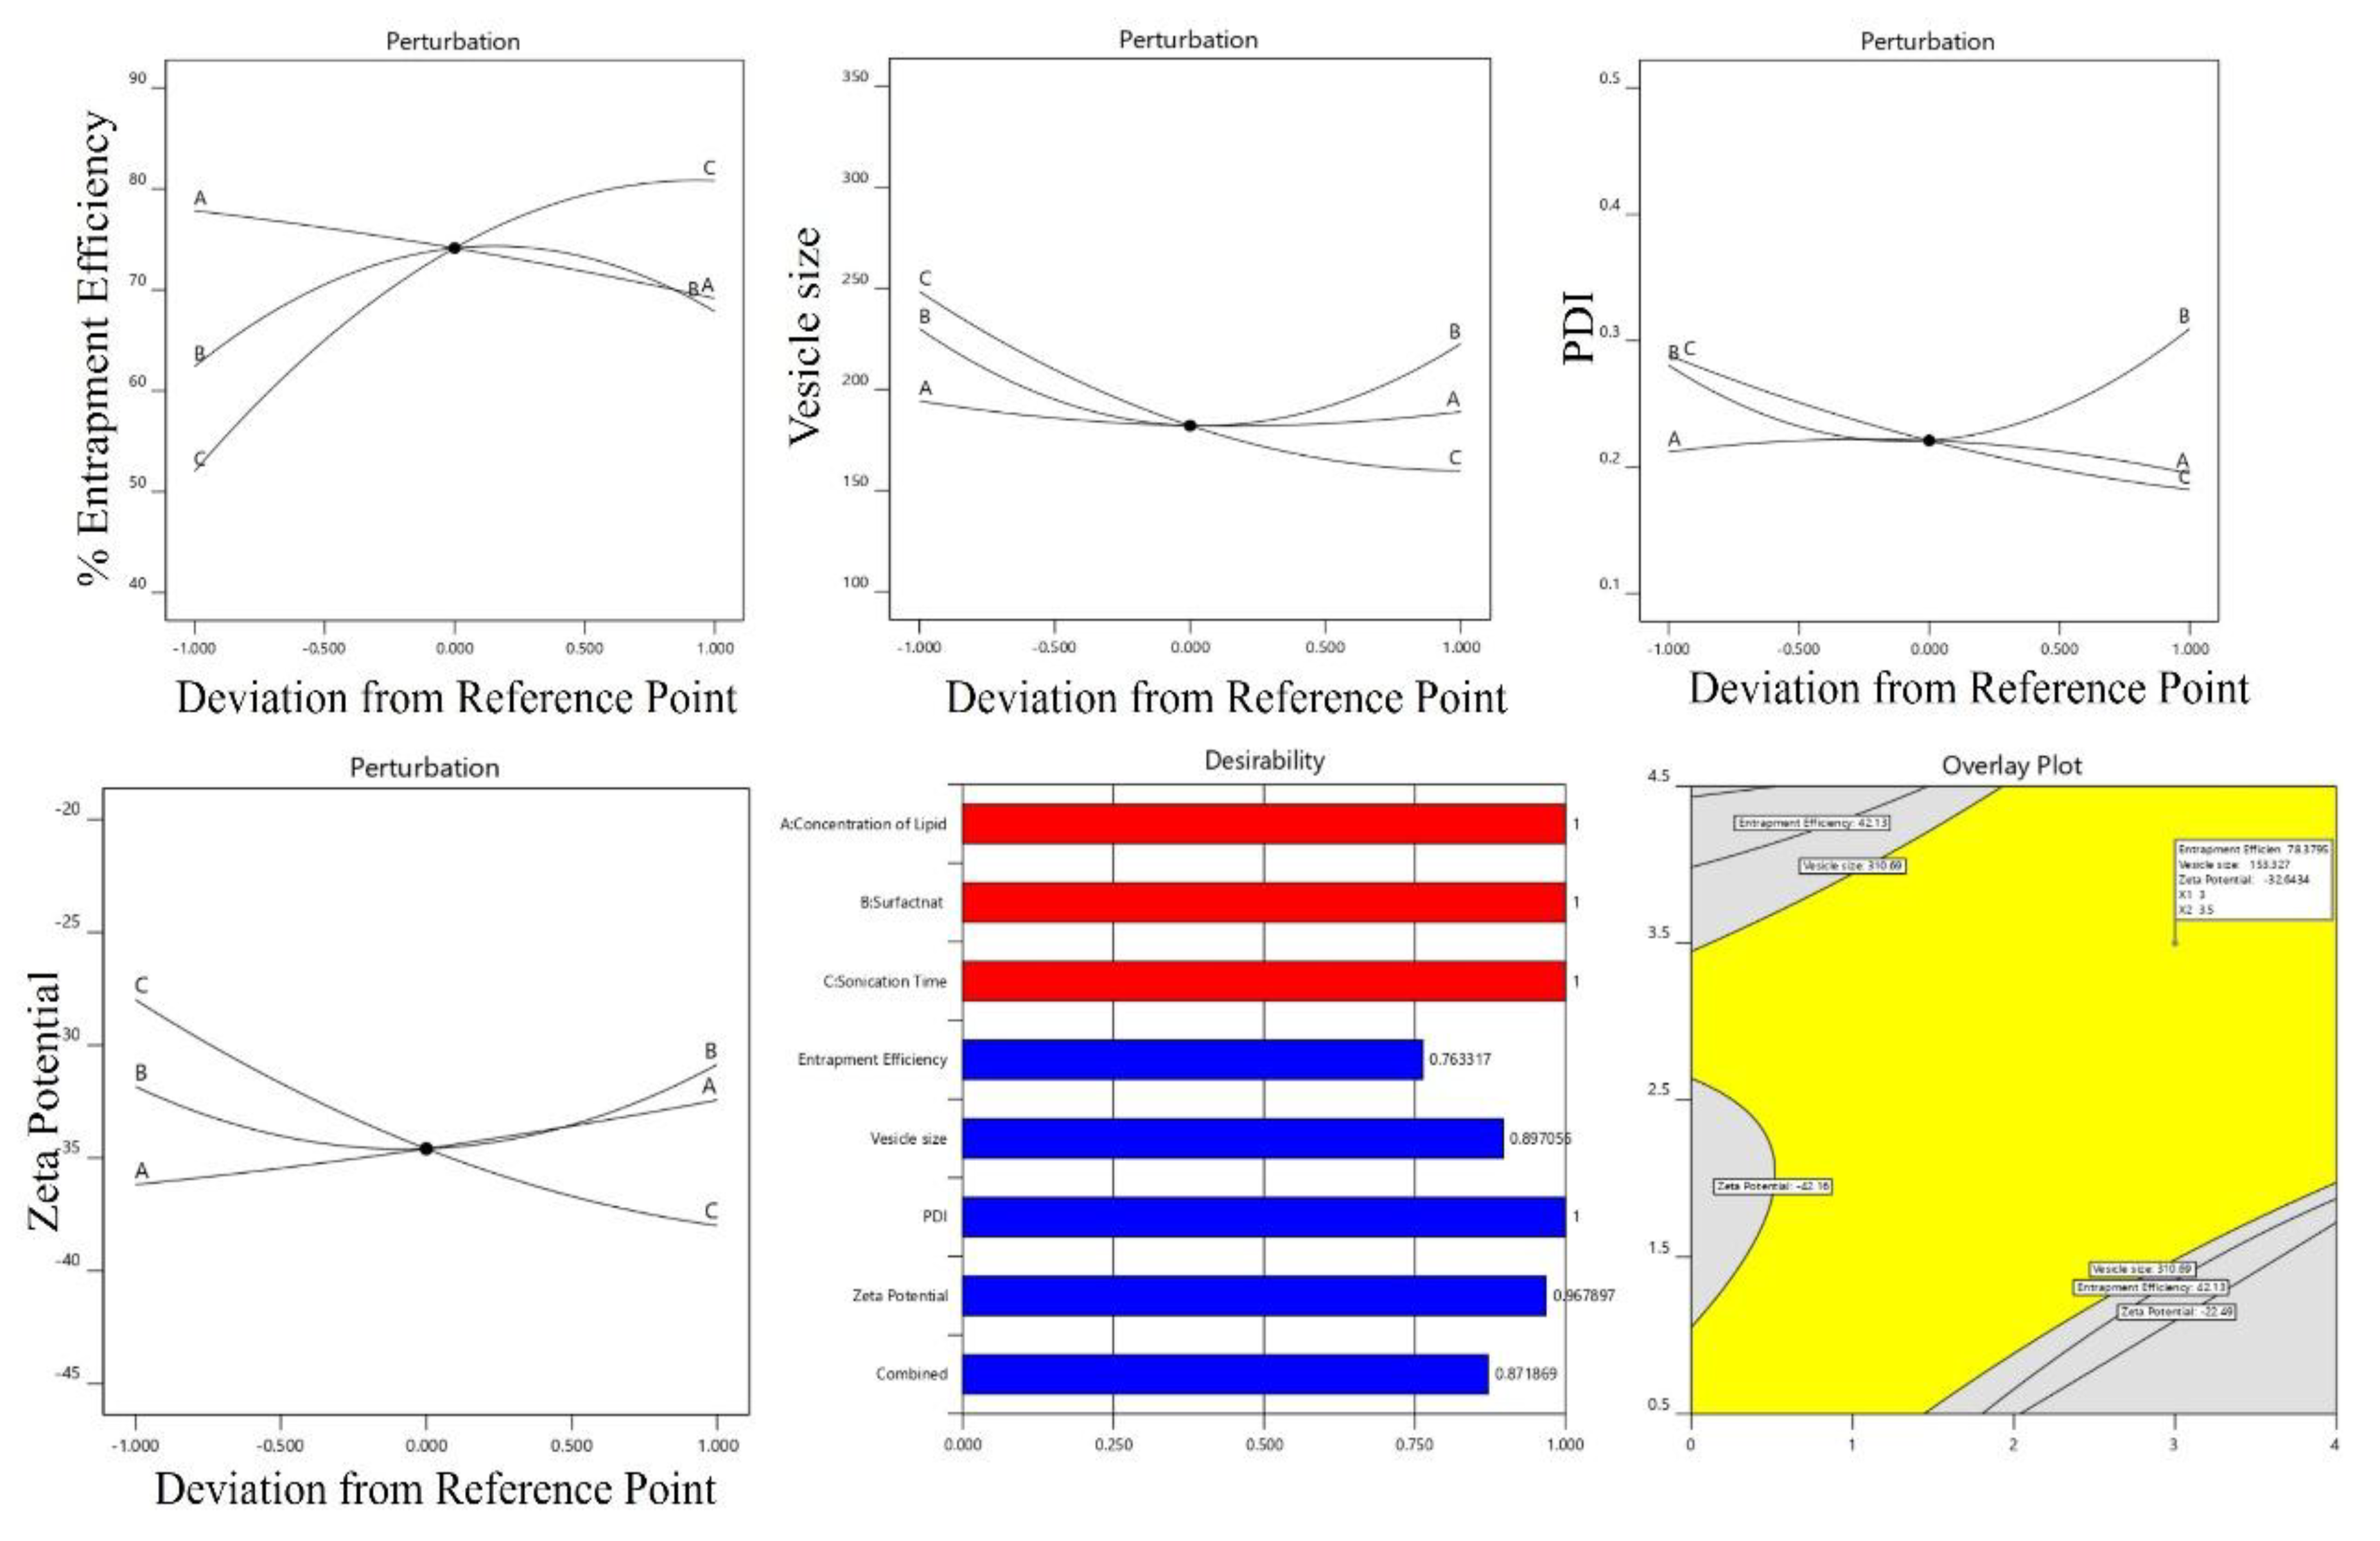
Figure 7.
Image showing particle size and particle size distribution, (B) zeta potential of optimized NTB-loaded NLCs formulation.
Figure 7.
Image showing particle size and particle size distribution, (B) zeta potential of optimized NTB-loaded NLCs formulation.
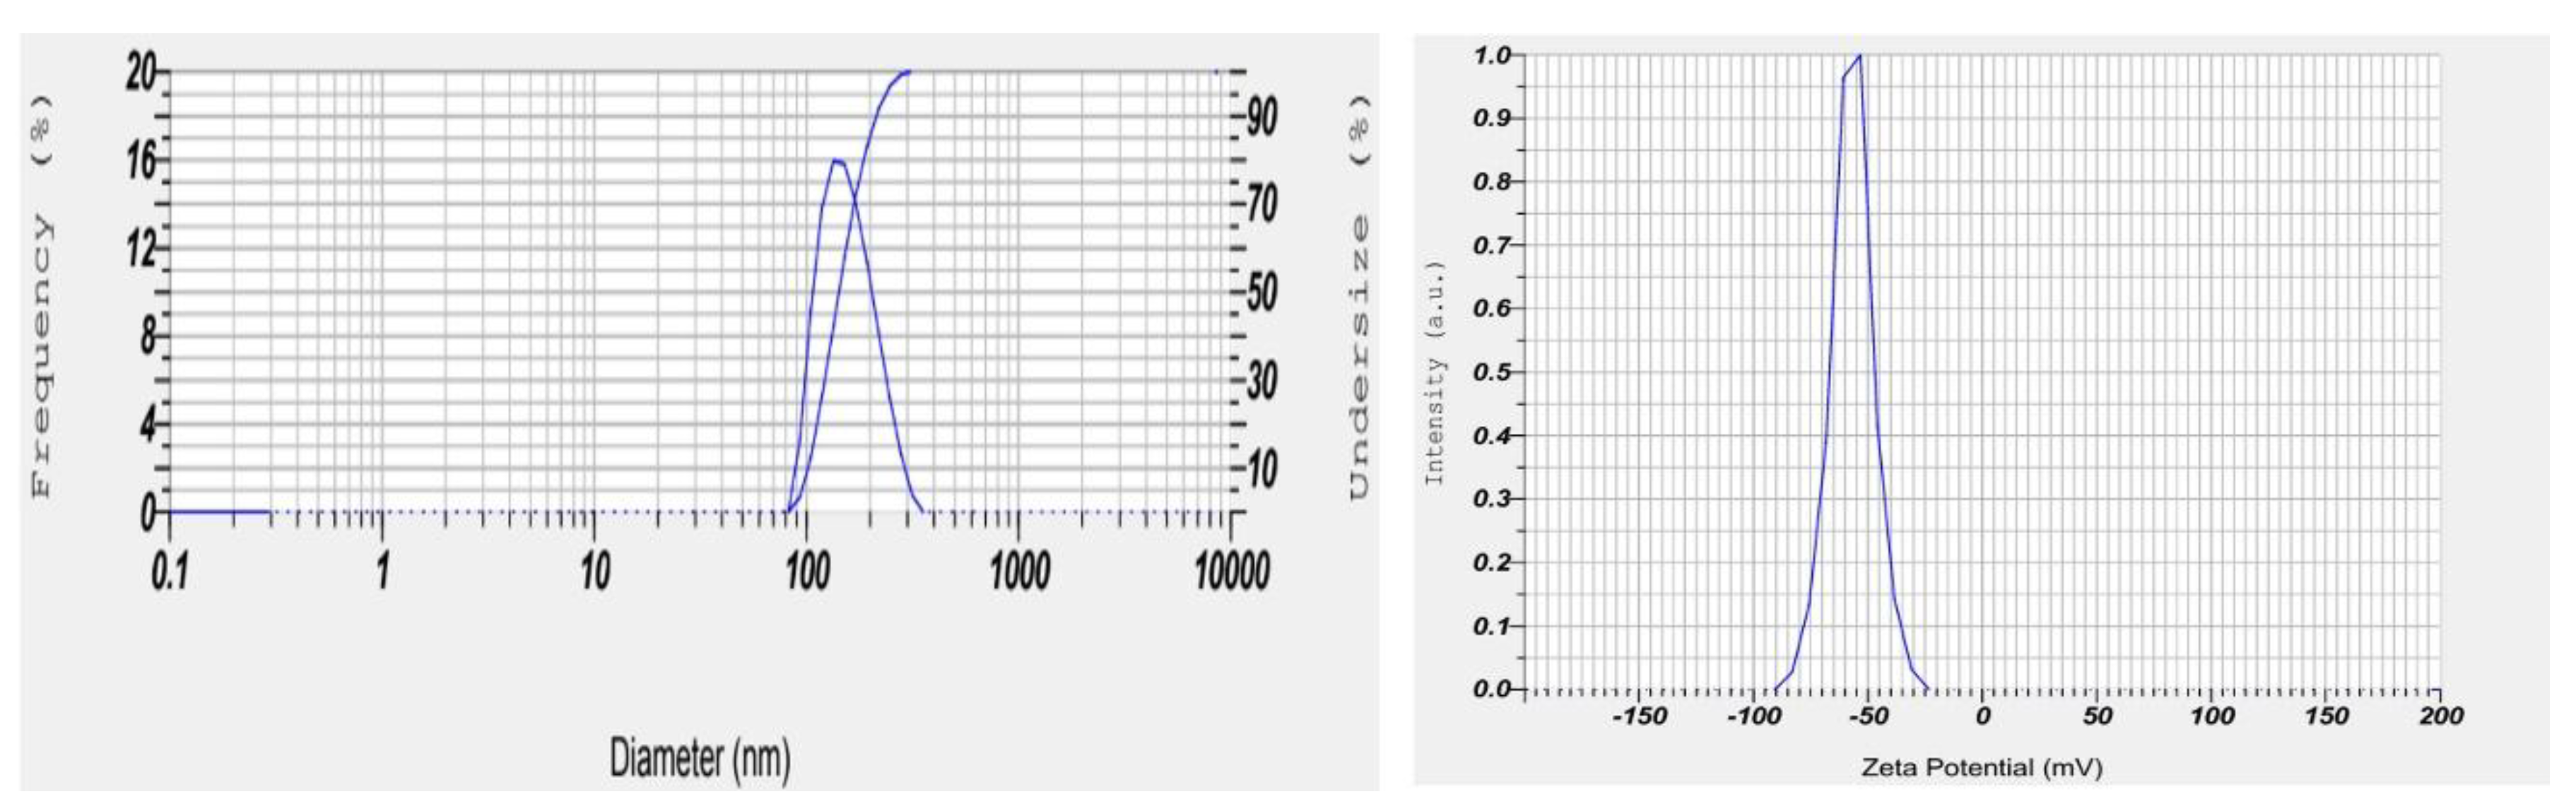
Figure 8.
SEM and TEM images of optimized NTB loaded NLCs.
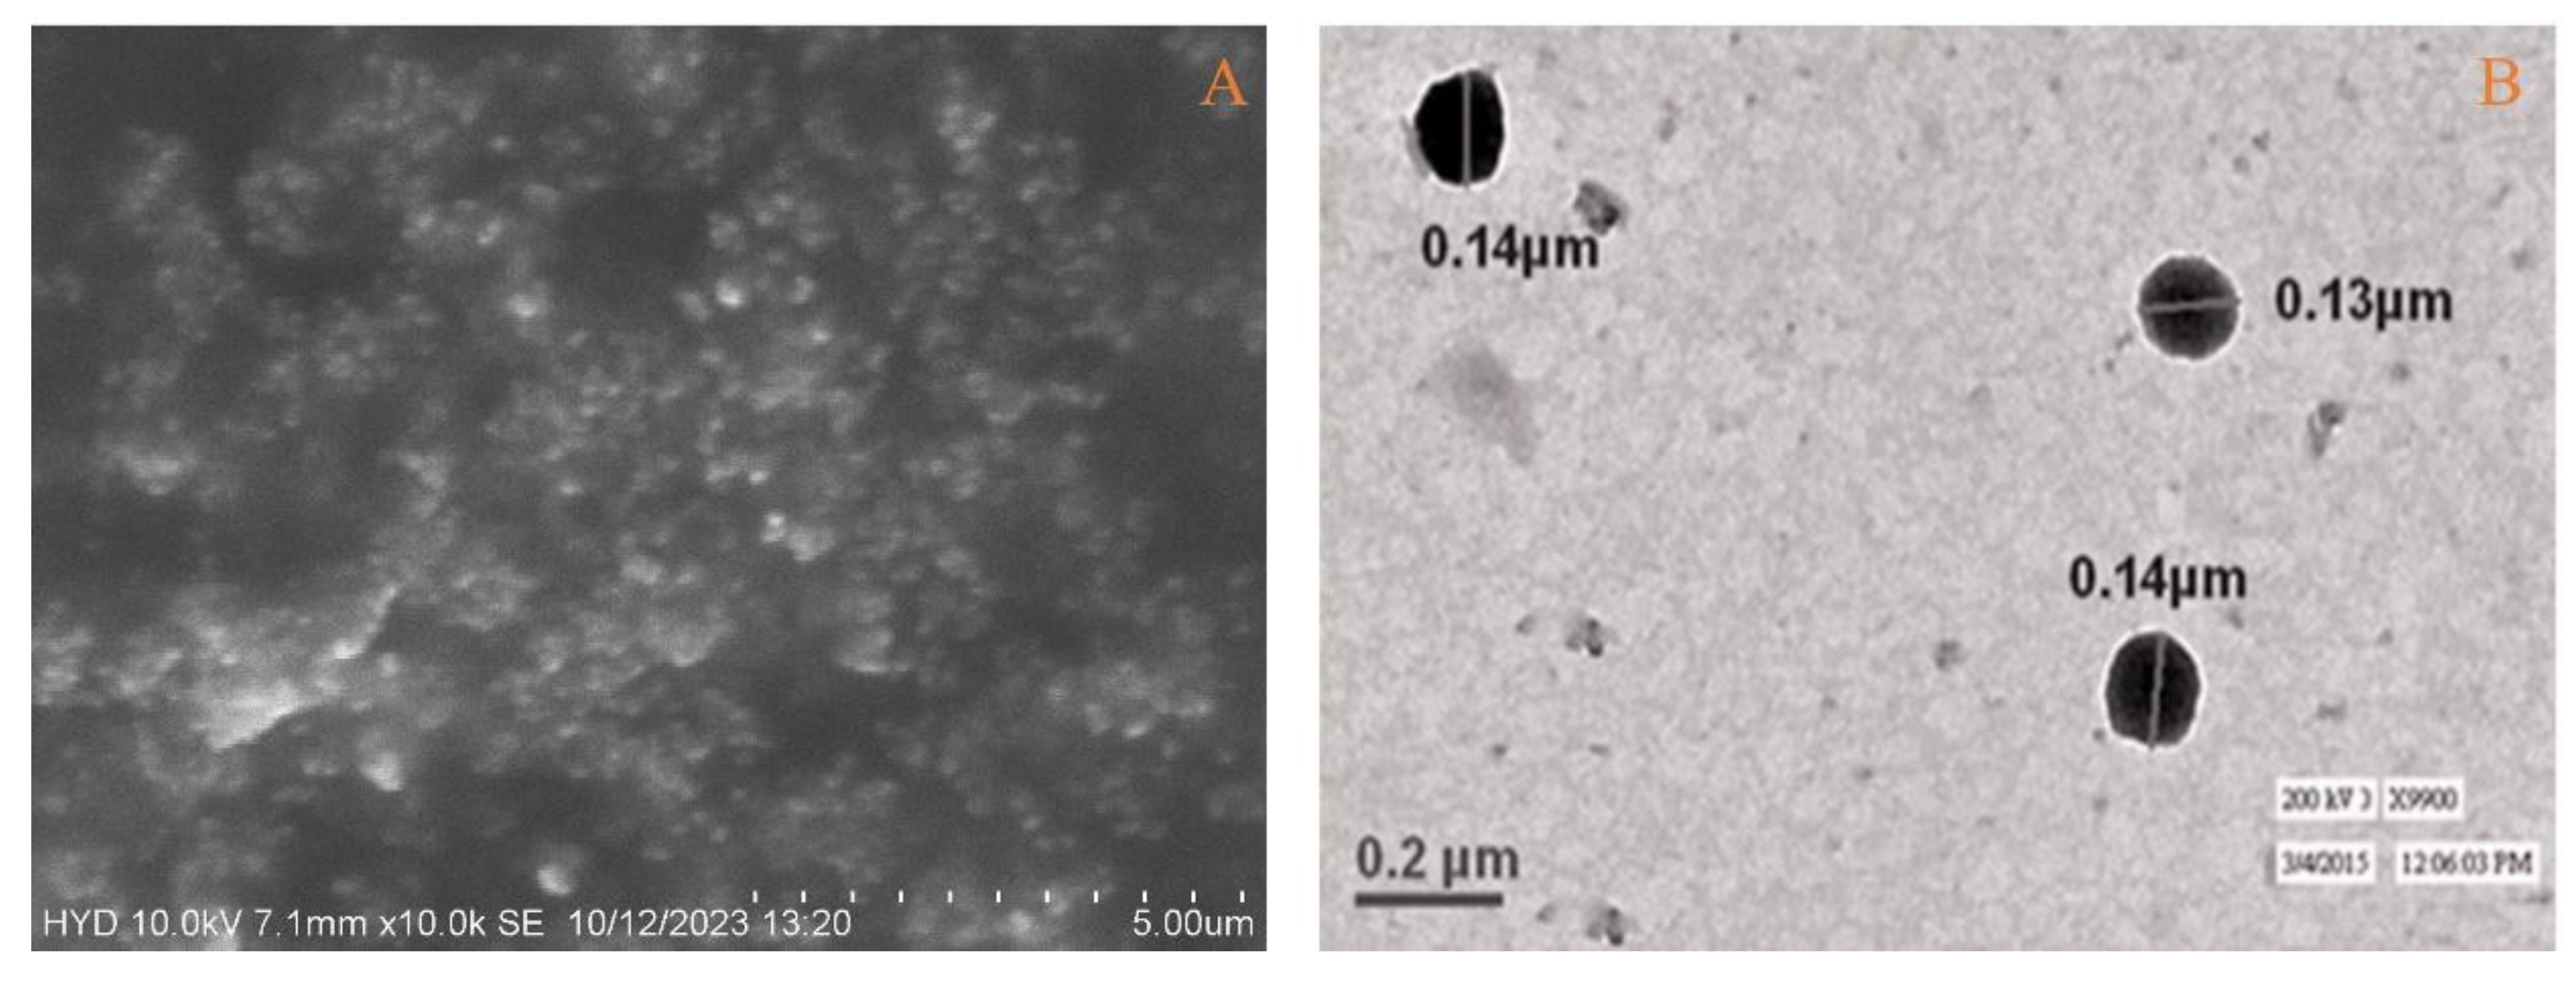
Figure 9.
DSC thermogram of NTB, Solid lipid, Liquid lipid, surfactant and optimized NTB-NLCs.
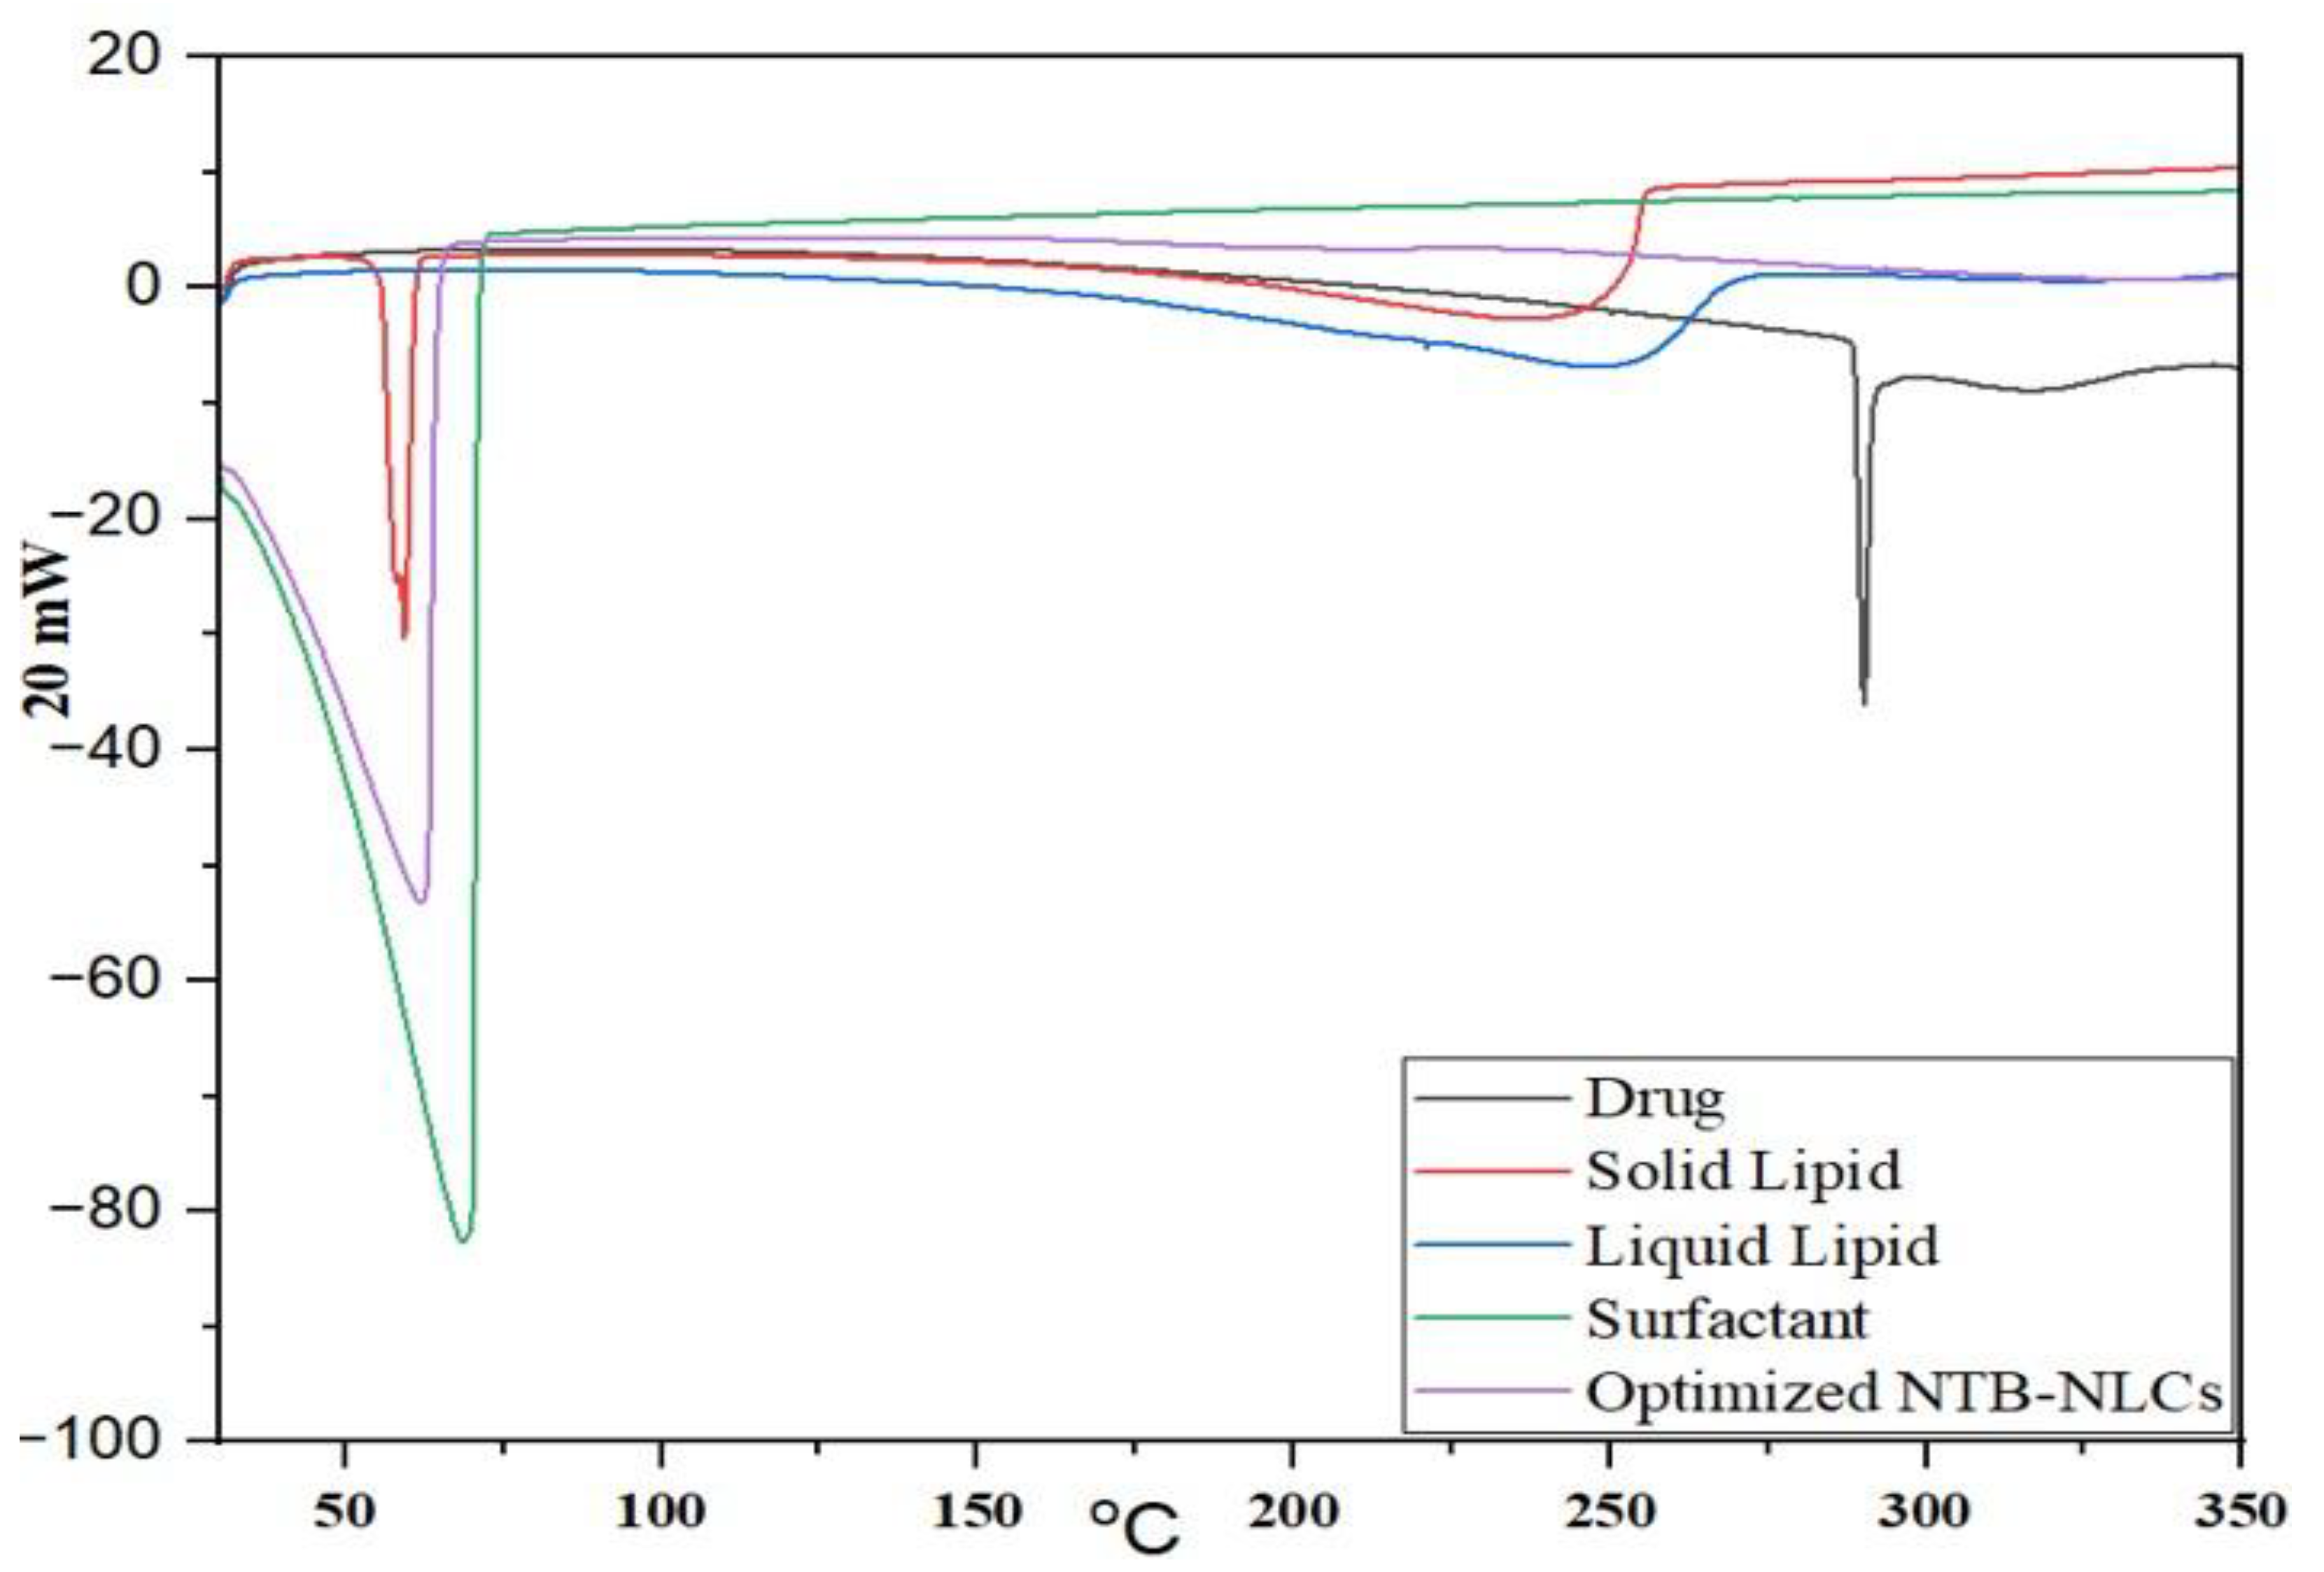
Figure 10.
Powdered X-ray diffractogram of NTB, Solid lipid, Liquid lipid, surfactant and optimized NTB-NLCs.
Figure 10.
Powdered X-ray diffractogram of NTB, Solid lipid, Liquid lipid, surfactant and optimized NTB-NLCs.
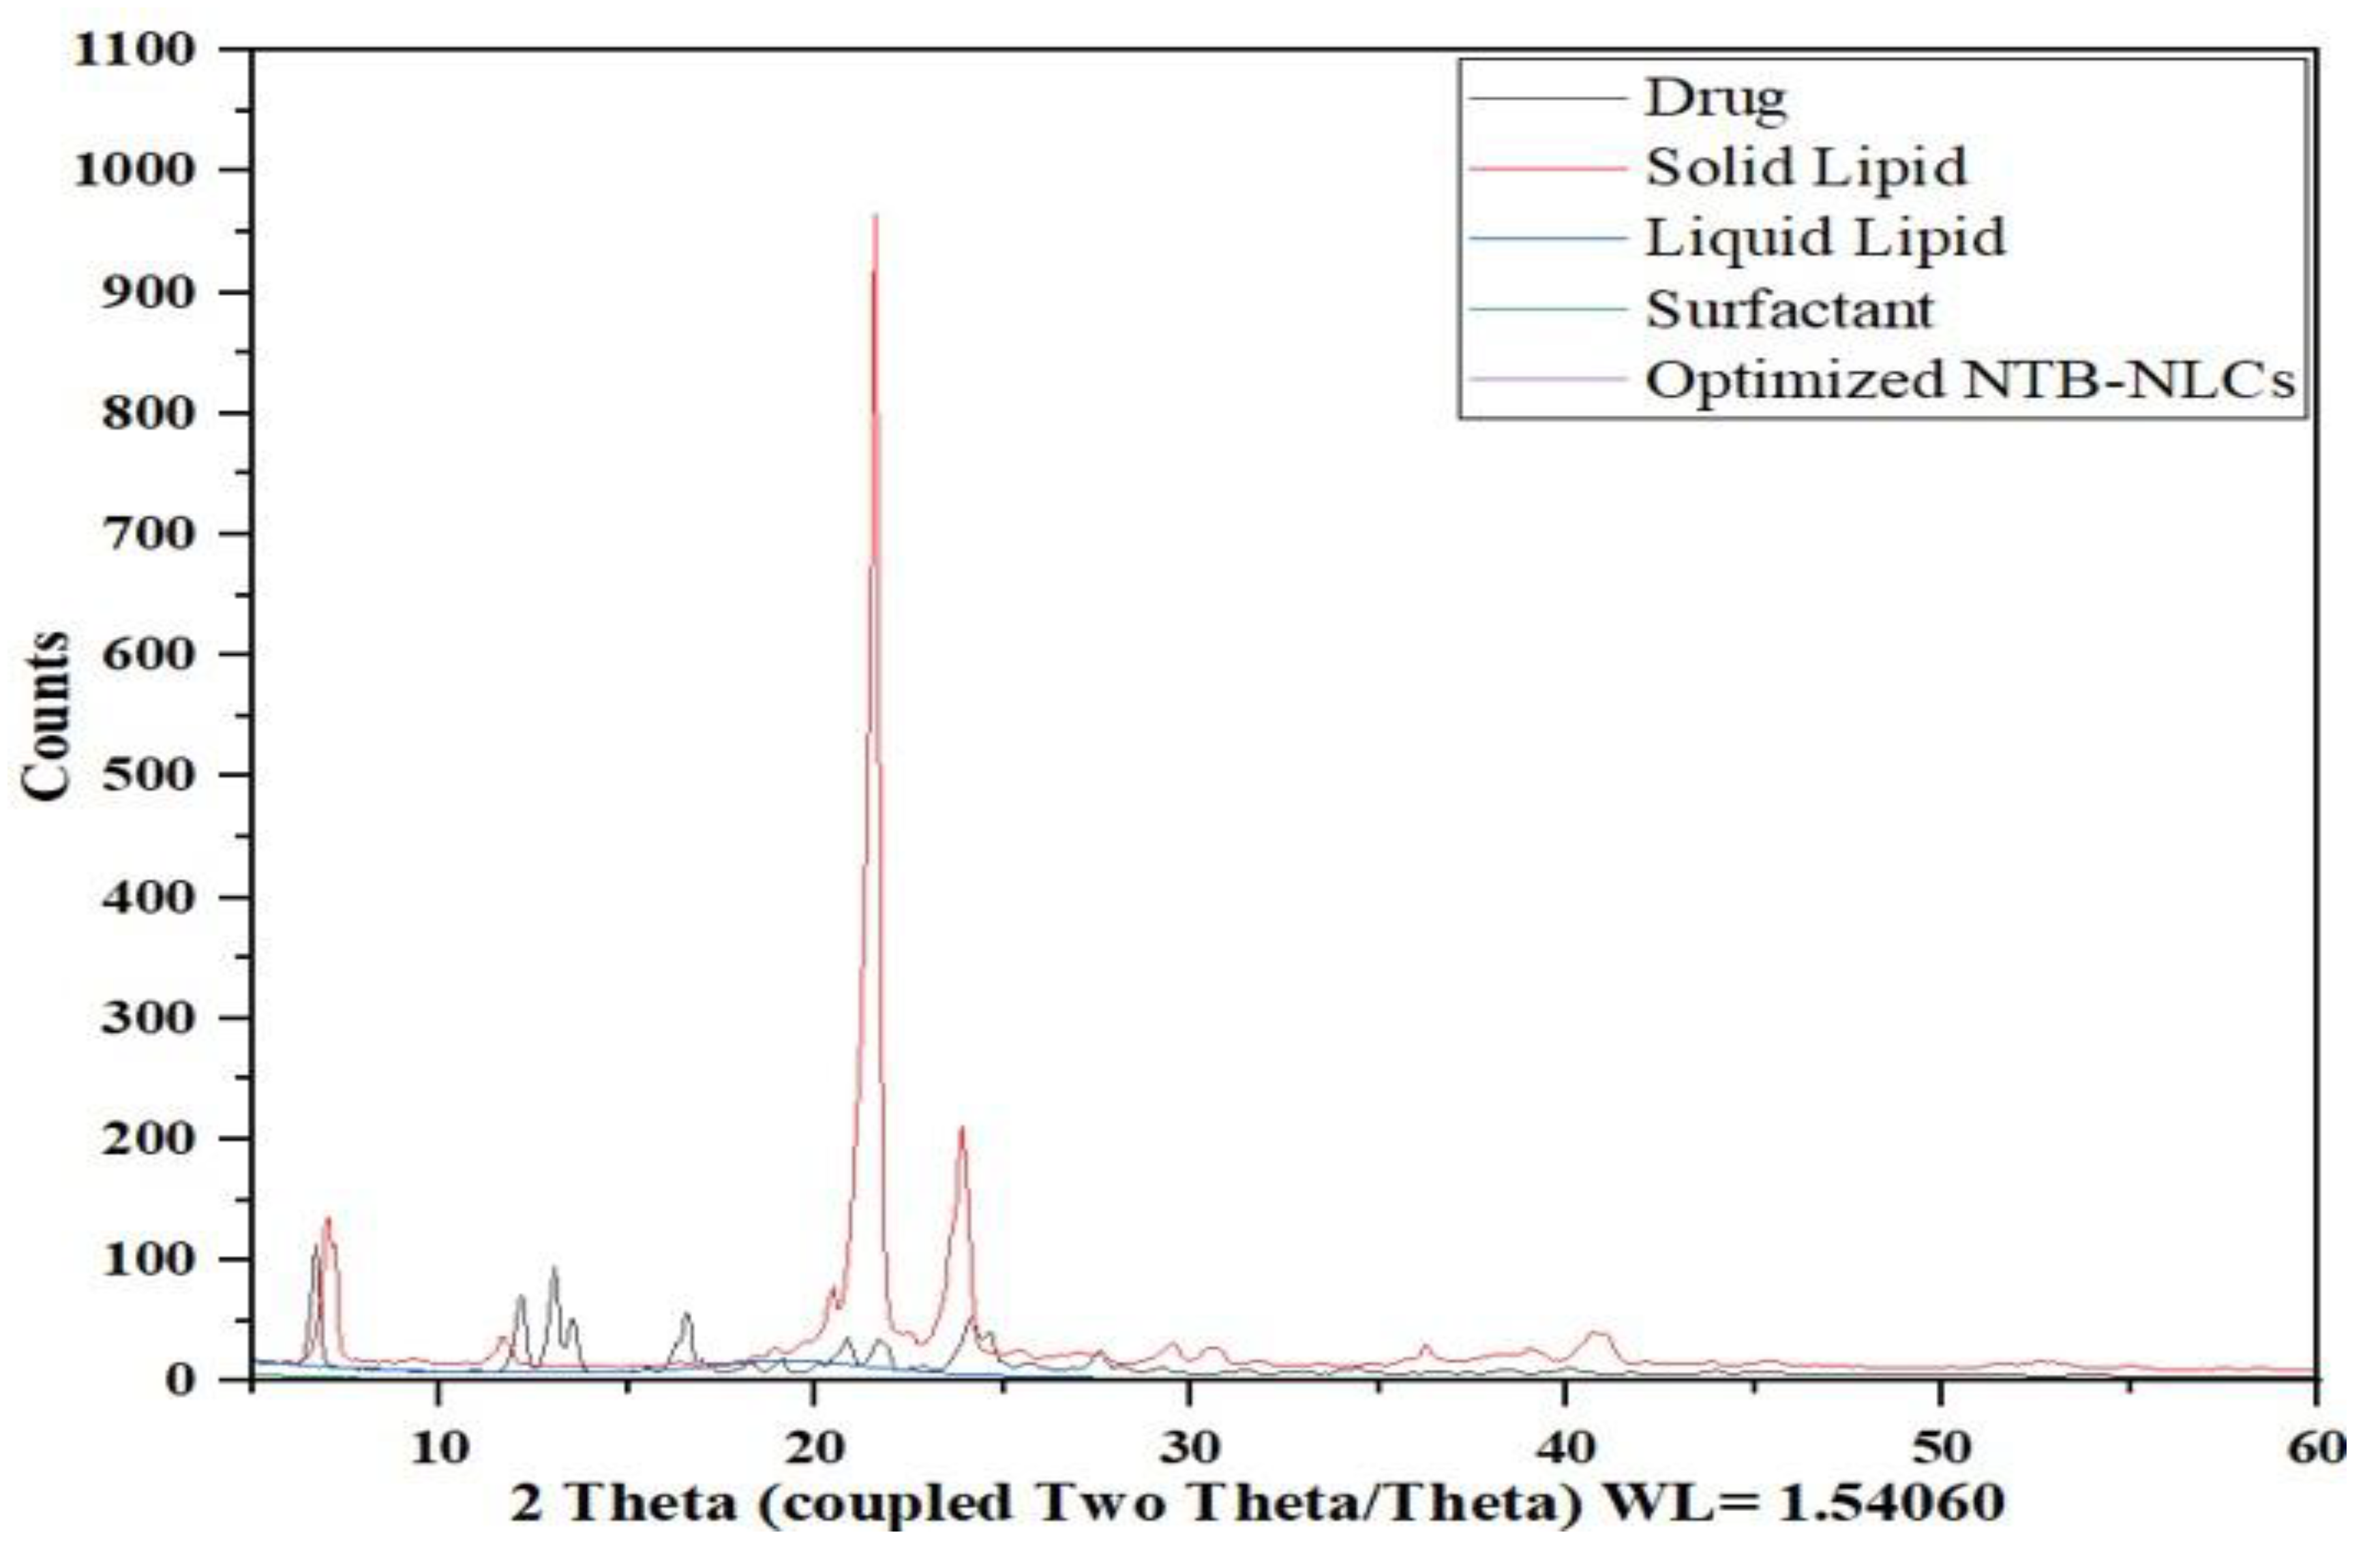
Figure 11.
In vitro release studies of optimized NTB-NLCs and Pure NTB suspension.
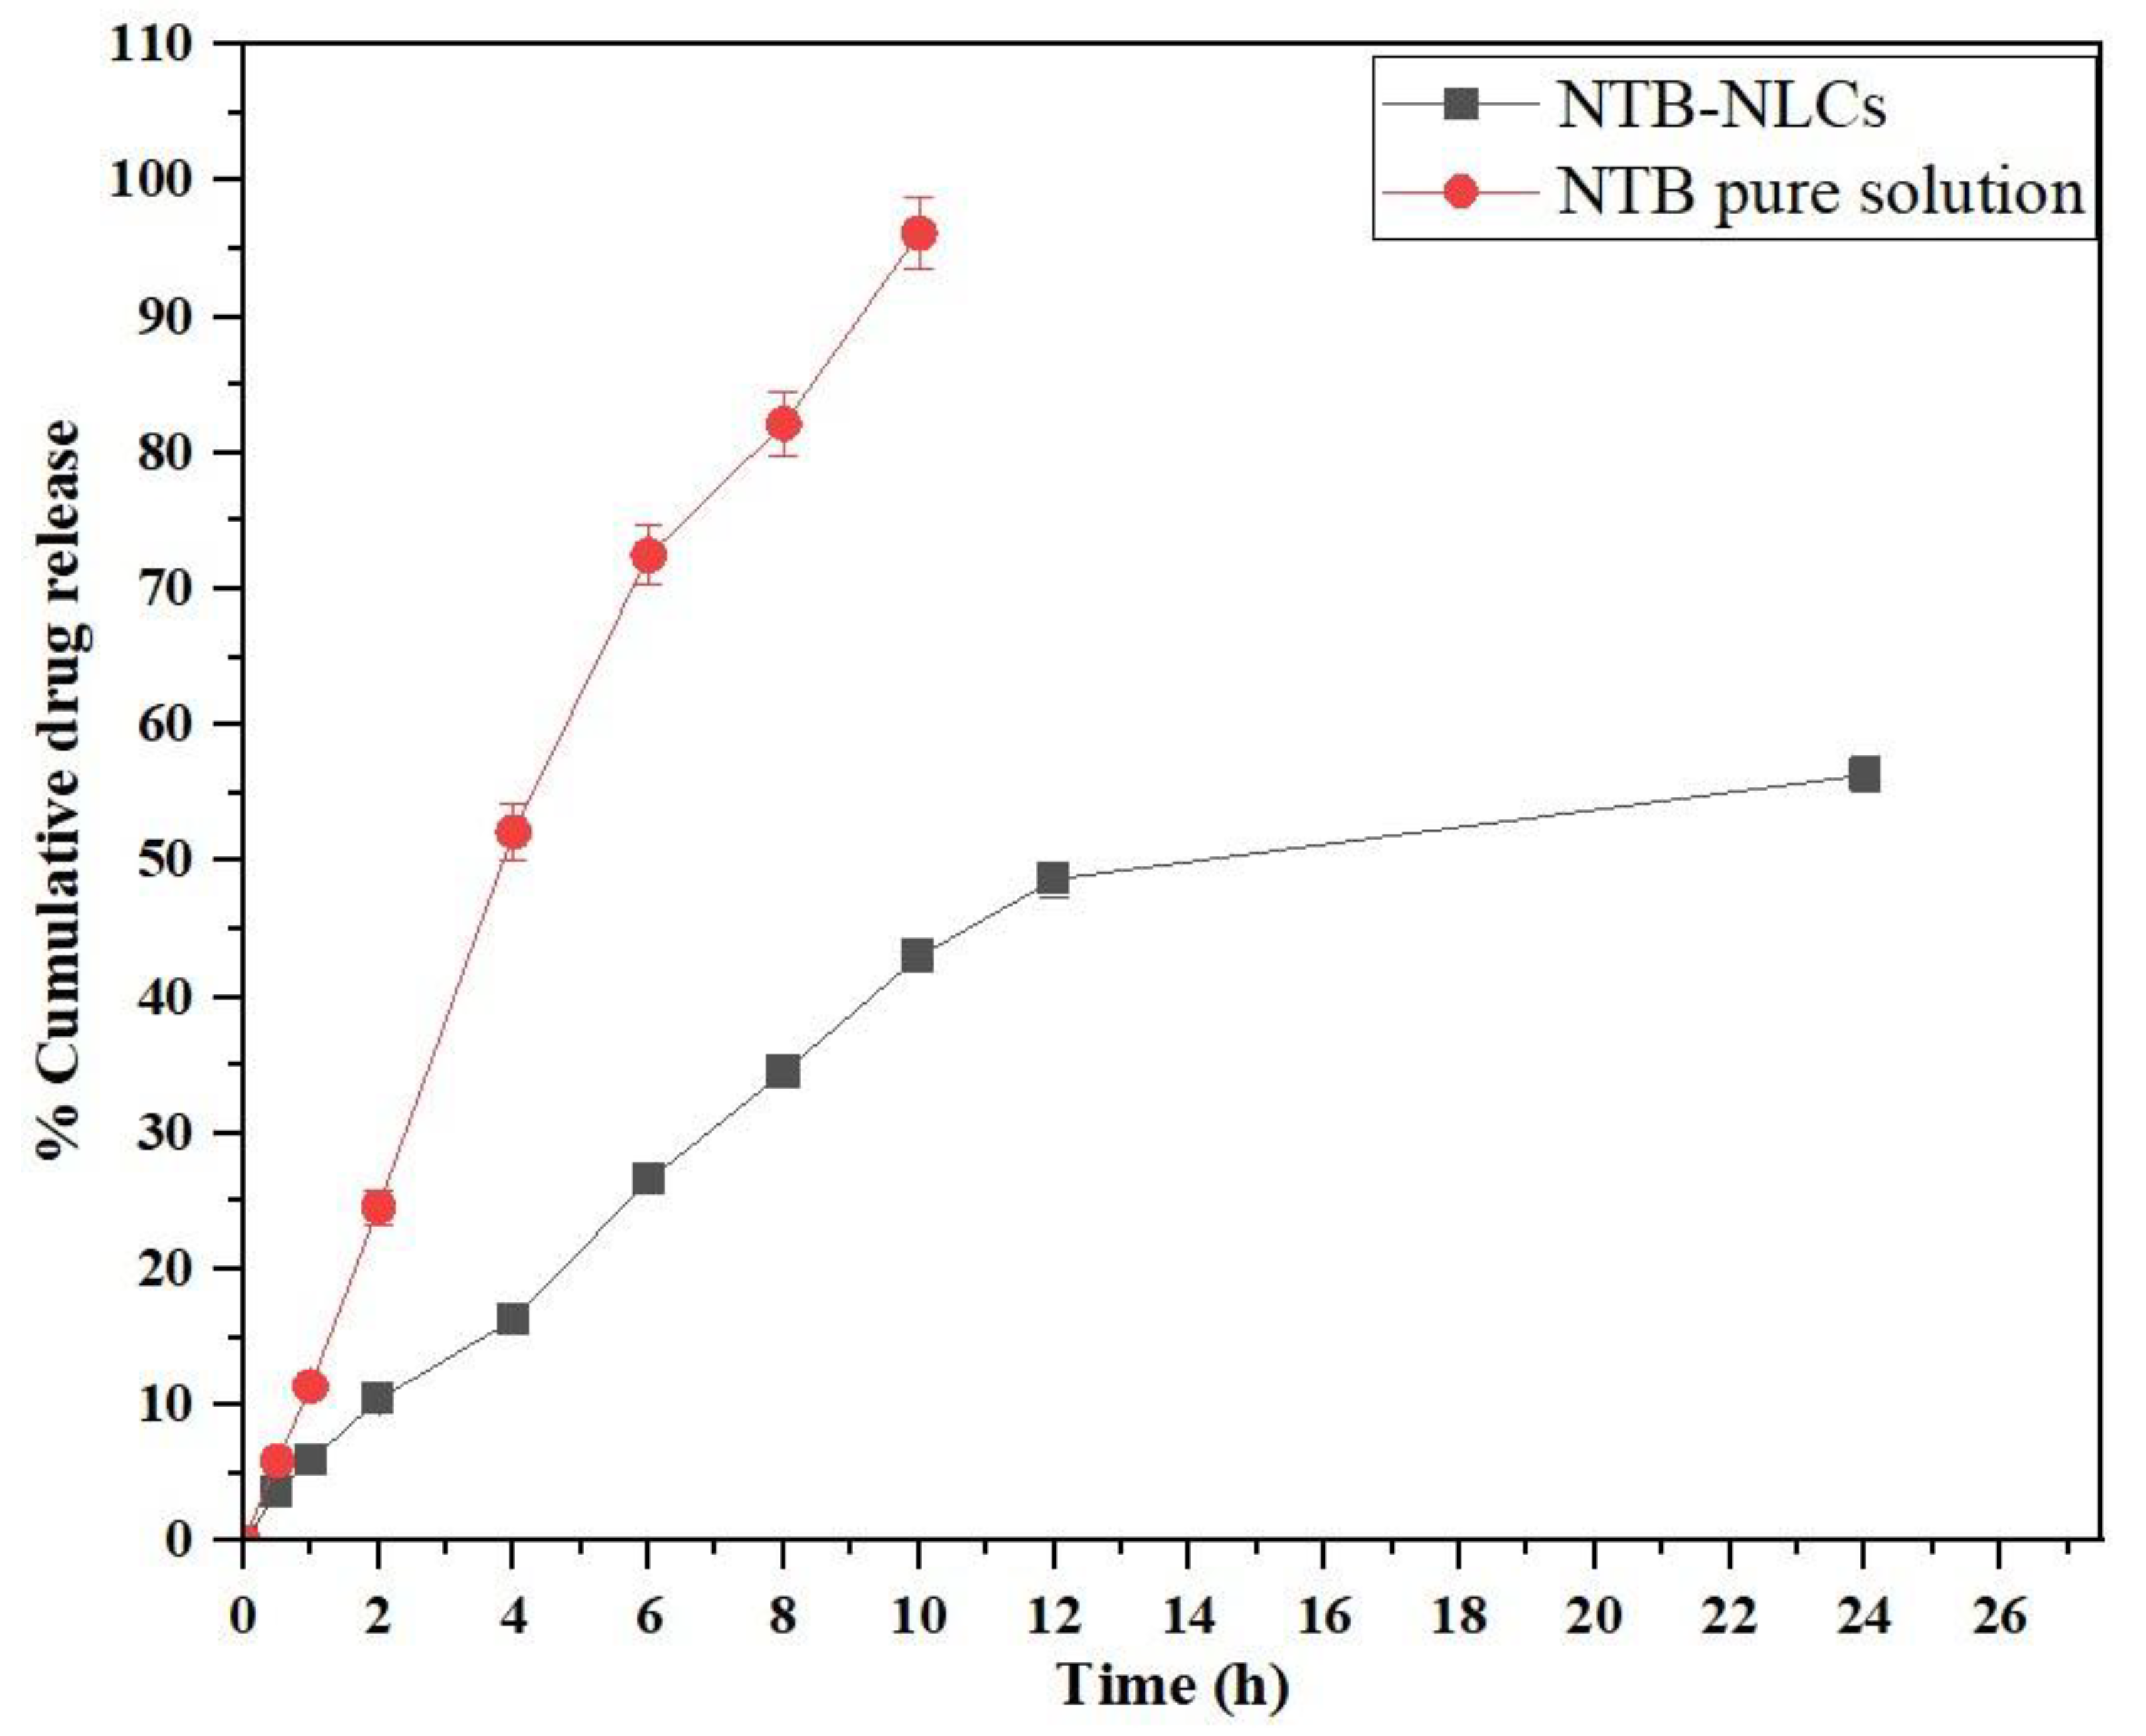
Figure 12.
Plasma Concentration vs. Time Curves for NTB Solution, Marketed Formulation, and Optimized NTB-NLCs.
Figure 12.
Plasma Concentration vs. Time Curves for NTB Solution, Marketed Formulation, and Optimized NTB-NLCs.
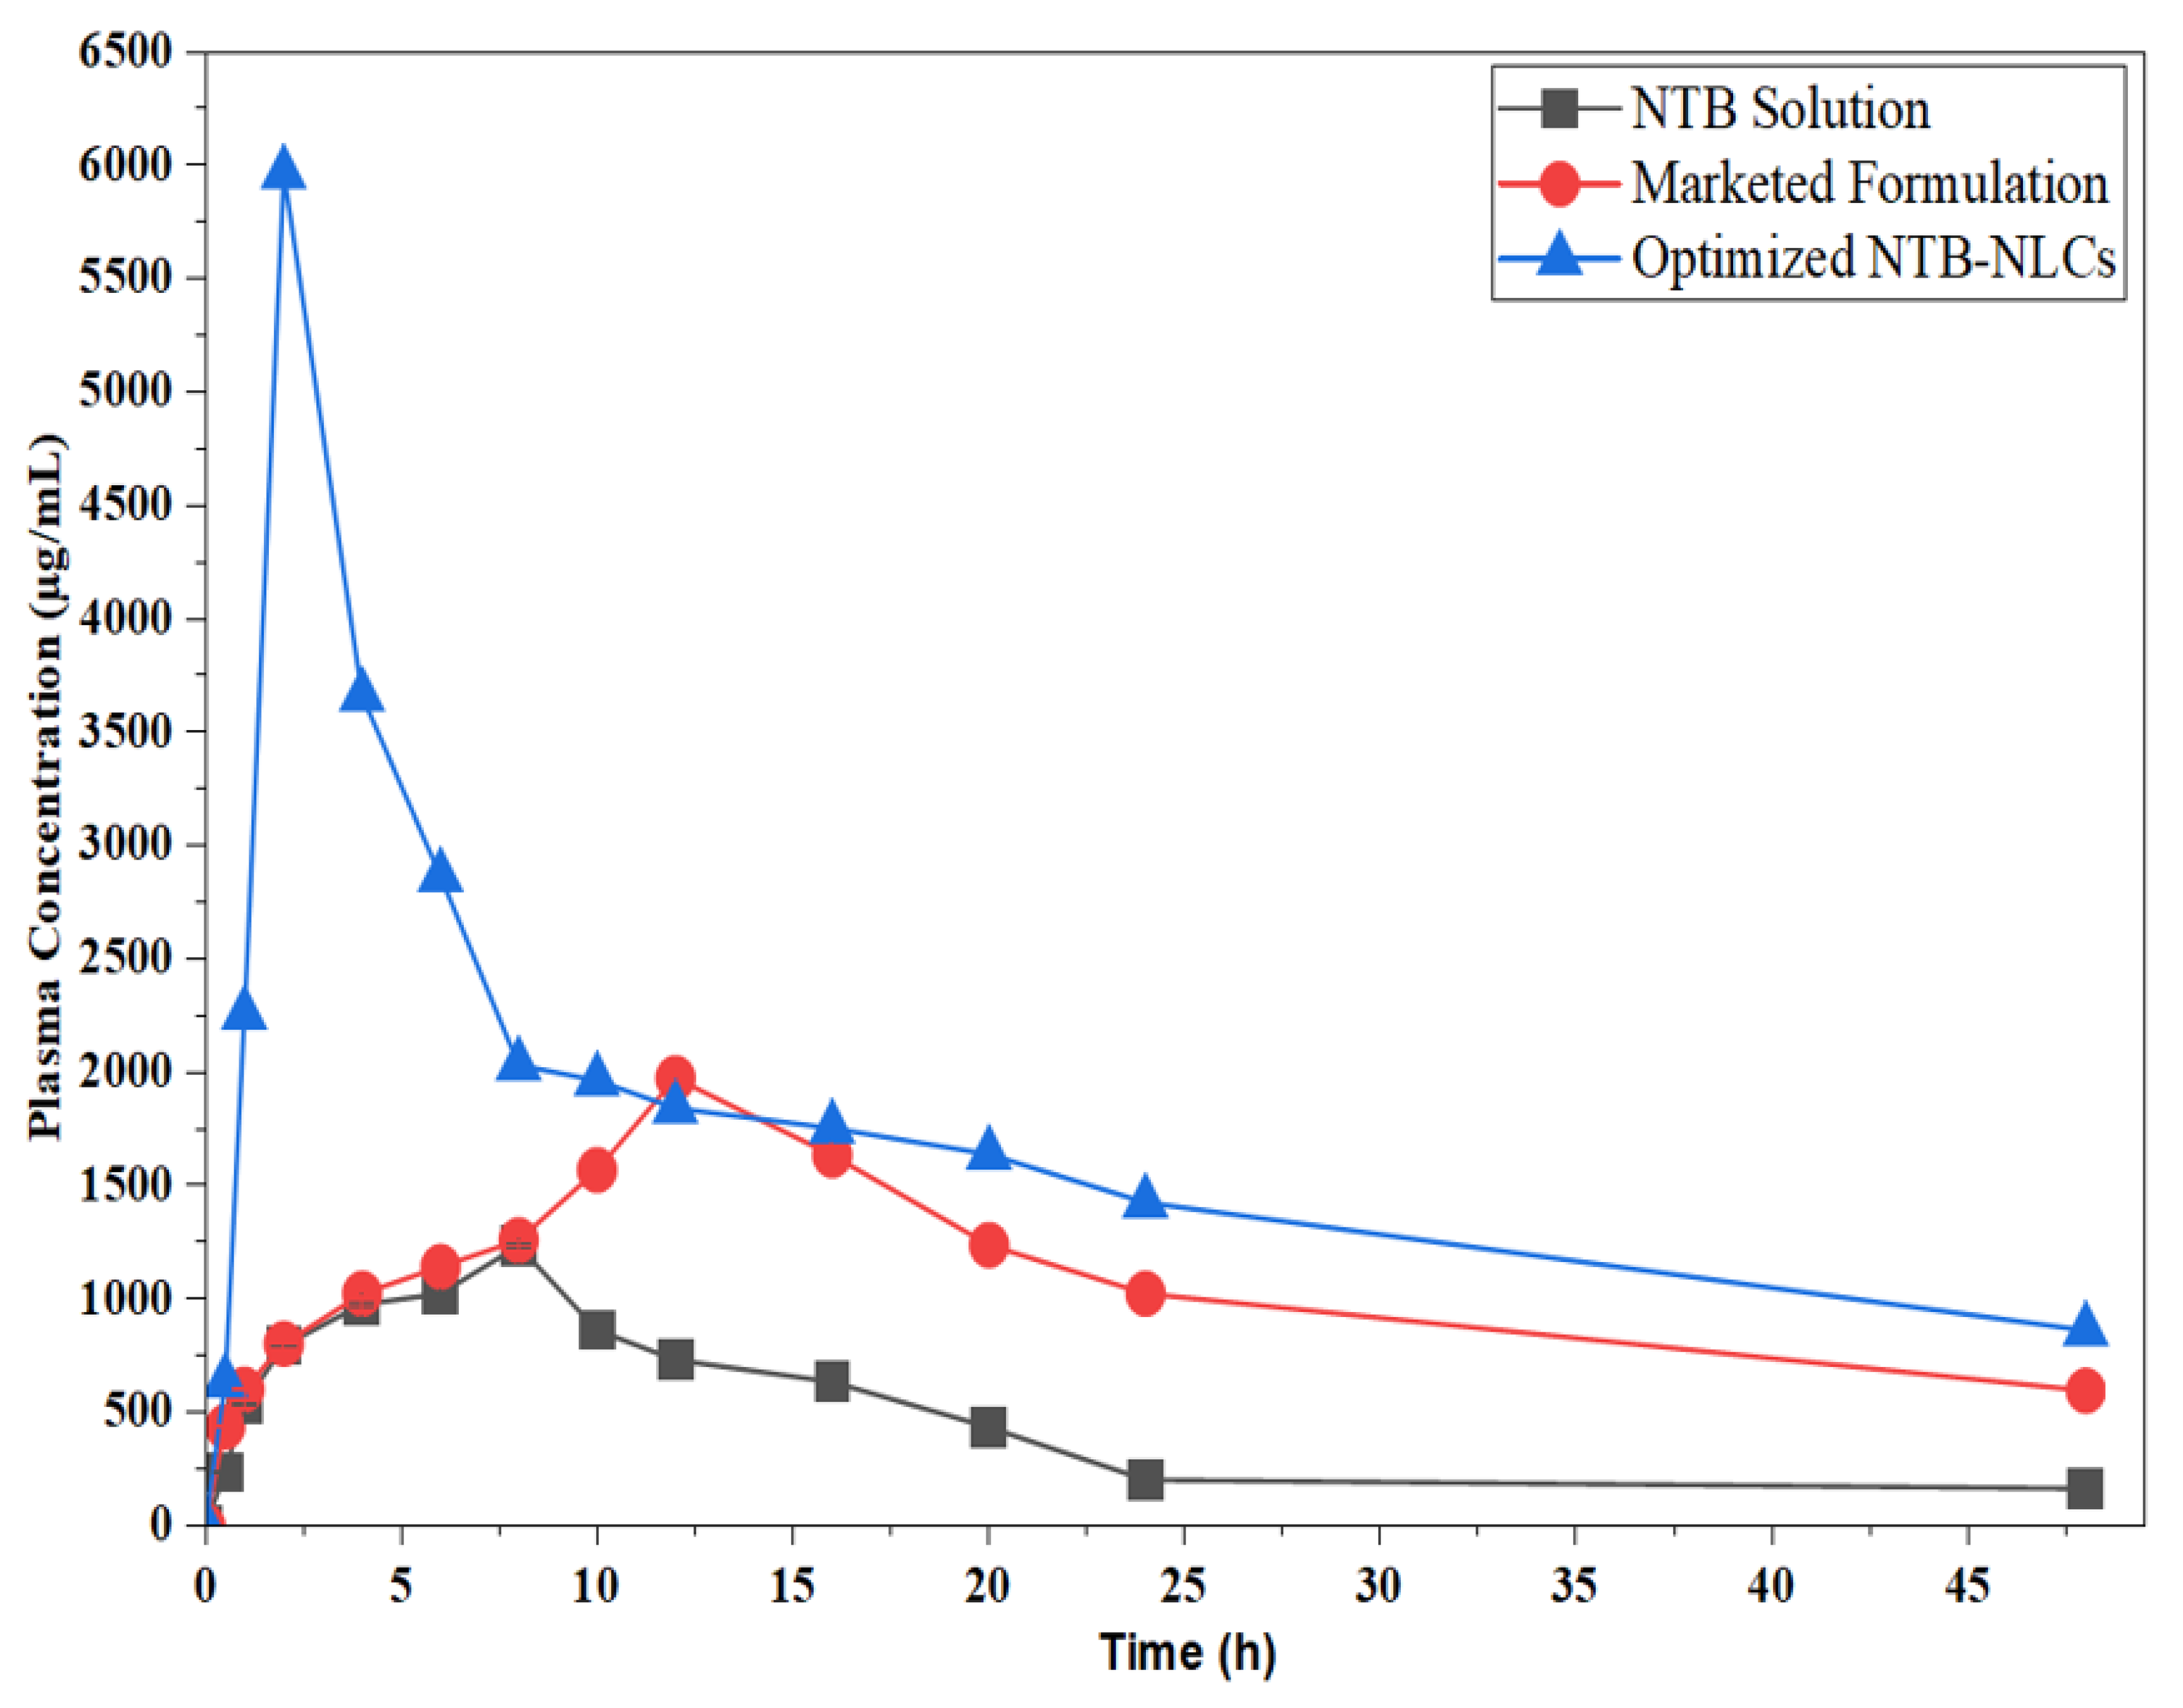

Table 1.
Experimental range of formulation parameters (factors) and critical quality attributes (CQAs) of NTB-NLCs.
Table 1.
Experimental range of formulation parameters (factors) and critical quality attributes (CQAs) of NTB-NLCs.
| Independent Variables | |||
| Parameters | Low (-1) | Medium (0) | High (+1) |
| A: Lipid concentration (%) | 1 | 2 | 3 |
| B: Tween 80 (%) | 1.5 | 2.5 | 3.5 |
| C: sonication time (min) | 5 | 10 | 15 |
| Dependent Variables | |||
| R1: Particle size (nm) | Minimize | ||
| R2: Entrapment efficiency (%) | Maximize | ||
| R3: Polydispersity index (PDI) | Target | ||
| R4: Zeta Potential (mV) | In range | ||
Table 2.
Observed Box–Behnken experimental runs of NTB-loaded NLCs with their actual experimental value of R1 (particle size), R2 (entrapment efficiency), R3 (PDI) and R4 (Zeta potential).
Table 2.
Observed Box–Behnken experimental runs of NTB-loaded NLCs with their actual experimental value of R1 (particle size), R2 (entrapment efficiency), R3 (PDI) and R4 (Zeta potential).
| Run | Std | A | B | C | R1 | R2 | R3 | R4 |
|---|---|---|---|---|---|---|---|---|
| 1 | 1 | 1 | 1.5 | 10 | 79.84±0.96 | 186.49±3.62 | 0.198±0.05 | -36.49±2.35 |
| 8 | 2 | 3 | 2.5 | 15 | 72.53±1.23 | 193.25±2.51 | 0.186±0.06 | -32.59±1.64 |
| 14 | 3 | 2 | 2.5 | 10 | 75.02±1.45 | 180.36±4.35 | 0.243±0.04 | -34.01±2.05 |
| 16 | 4 | 2 | 2.5 | 10 | 74.01±1.28 | 190.58±3.29 | 0.261±0.08 | -36.85±1.96 |
| 10 | 5 | 2 | 3.5 | 5 | 45.68±1.34 | 310.69±4.57 | 0.412±0.06 | -22.49±1.42 |
| 3 | 6 | 1 | 3.5 | 10 | 59.84±0.89 | 298.64±5.68 | 0.389±0.09 | -29.84±2.16 |
| 4 | 7 | 3 | 3.5 | 10 | 72.69±1.24 | 168.74±4.95 | 0.196±0.07 | -30.41±1.95 |
| 5 | 8 | 1 | 2.5 | 5 | 48.62±1.36 | 289.53±6.25 | 0.312±0.13 | -26.57±1.27 |
| 11 | 9 | 2 | 1.5 | 15 | 65.31±1.25 | 243.15±4.51 | 0.295±0.15 | -33.26±1.36 |
| 2 | 10 | 3 | 1.5 | 10 | 45.61±1.4 | 289.53±3.58 | 0.327±0.16 | -27.53±1.85 |
| 15 | 11 | 2 | 2.5 | 10 | 73.54±1.37 | 175.32±5.74 | 0.195±0.24 | -32.41±1.95 |
| 9 | 12 | 2 | 1.5 | 5 | 42.13±1.28 | 264.15±4.69 | 0.296±0.15 | -26.31±1.42 |
| 6 | 13 | 3 | 2.5 | 5 | 52.36±1.64 | 236.94±6.31 | 0.247±0.18 | -29.54±1.68 |
| 13 | 14 | 2 | 2.5 | 10 | 72.46±1.52 | 184.25±5.29 | 0.165±0.14 | -34.26±1.43 |
| 7 | 15 | 1 | 2.5 | 15 | 89.62±1.26 | 135.26±3.86 | 0.126±0.09 | -42.16±1.75 |
| 12 | 16 | 2 | 3.5 | 15 | 76.49±1.43 | 175.48±6.52 | 0.235±0.05 | -36.95±1.26 |
| 17 | 17 | 2 | 2.5 | 10 | 75.63±1.59 | 180.36±4.39 | 0.241±0.01 | -35.42±1.29 |
Table 3.
Summary of regression analysis for responses R1 (particle size in nm), R2 (entrapment efficiency in %) R3 (PDI) and R4 (zeta potential) for fitting data to different models.
Table 3.
Summary of regression analysis for responses R1 (particle size in nm), R2 (entrapment efficiency in %) R3 (PDI) and R4 (zeta potential) for fitting data to different models.
| Model | R2 | Adjusted R2 | Predicted R2 | SD | %CV |
| Response (R1) | |||||
| Linear | 0.5822 | 0.4857 | 0.2275 | 10.16 | |
| 2FI | 0.7932 | 0.6691 | 0.3621 | 8.25 | |
| Quadratic | 0.9913 | 0.9800 | 0.8882 | 2.0 | 3.03 |
| Response (R2) | |||||
| Linear | 0.3324 | 0.1783 | -0.2665 | 49.48 | |
| 2FI | 0.7494 | 0.5990 | 0.2571 | 34.57 | |
| Quadratic | 0.9896 | 0.9762 | 0.8725 | 8.42 | 3.86 |
| Response (R3) | |||||
| Linear | 0.2617 | 0.0913 | -0.4251 | 0.0734 | |
| 2FI | 0.6572 | 0.4516 | -0.2606 | 0.0571 | |
| Quadratic | 0.9228 | 0.8237 | 0.7225 | 0.0324 | 12.72 |
| Response (R4) | |||||
| Linear | 0.6076 | 0.5171 | 0.2803 | 3.38 | |
| 2FI | 0.8083 | 0.6933 | 0.4377 | 2.70 | |
| Quadratic | 0.9631 | 0.9156 | 0.8275 | 1.41 | 4.40 |
The results are expressed as mean ± standard deviation, n=3 of the obtained values.
Table 4.
Pharmacokinetic Parameters of NTB Following Oral Administration of NTB Solution, Marketed Formulation, and Optimized NTB-NLCs.
Table 4.
Pharmacokinetic Parameters of NTB Following Oral Administration of NTB Solution, Marketed Formulation, and Optimized NTB-NLCs.
| Pharmacokinetic Parameters | NTB Solution | Marketed Formulation | Optimized NTB-NLCs |
| Intercept | 2.912294378 | 3.007327094 | 3.396911 |
| Slope | -0.013743333 | -6.28321E-05 | -0.00921 |
| Co | 817.1360629 | 1017.014381 | 2494.083 |
| K | 0.031650897 | 0.000144702 | 0.021217 |
| Dose | 10 | 10 | 10 |
| 10000 | 10000 | 10000 | |
| Vd | 12.23786399 | 9.832702655 | 4.009489 |
| 0.012237864 | 0.009832703 | 0.004009 | |
| t1/2 | 21.89511423 | 4789.139093 | 32.66182 |
| Cl | 0.38733937 | 1.47164E-05 | 5.291805 |
| AUC-o-t | 204.4090157 | 254.3785951 | 623.6459 |
| AUC 1-t | 21159.4625 | 50685.48 | 81251.57 |
| AUC 1-inf | 5189.426425 | 4121147.484 | 40641.58 |
| AUC total | 26553.29794 | 4172087.343 | 122516.8 |
| Cmax | 1206.35 | 1936.59 | 5901.81 |
| Tmax | 4.36 | 6.02 | 2.36 |
The results are expressed as mean ± standard deviation, n=3 of the obtained values.
Disclaimer/Publisher’s Note: The statements, opinions and data contained in all publications are solely those of the individual author(s) and contributor(s) and not of MDPI and/or the editor(s). MDPI and/or the editor(s) disclaim responsibility for any injury to people or property resulting from any ideas, methods, instructions or products referred to in the content. |
© 2025 by the authors. Licensee MDPI, Basel, Switzerland. This article is an open access article distributed under the terms and conditions of the Creative Commons Attribution (CC BY) license (http://creativecommons.org/licenses/by/4.0/).
Copyright: This open access article is published under a Creative Commons CC BY 4.0 license, which permit the free download, distribution, and reuse, provided that the author and preprint are cited in any reuse.


