
Submitted:
24 November 2025
Posted:
25 November 2025
You are already at the latest version
Abstract
Background and Purpose:
Hepatocellular carcinoma (HCC) is the third leading cause of cancer-related mortality, and intrahepatic progression after treatment is common. Accurate tumor evaluation is essential for treatment decisions but remains challenging due to tumor heterogeneity, cirrhotic liver background, and treatment-related artifacts. This study investigated the feasibility of a deep learning–based auto-segmentation approach for response evaluation in locally advanced HCC treated with concurrent chemoradiotherapy (CCRT).
Methods:
We retrospectively analyzed 83 patients with locally advanced, treatment-naïve HCC who underwent definitive CCRT between 2016 and 2021. Tumor contours were manually delineated on pre-treatment (CTpre) and first post-treatment CT (CTpost). A fully convolutional DenseNet (FCD) and an Intentional Deep Overfit Learning (IDOL) framework were trained and validated. Performance was assessed using the Dice similarity coefficient (DSC), and RECIST-based diameters were compared between manual and predicted contours.
Results:
In the full cohort, the FCD model achieved mean DSCs of 0.53 for CTpre and 0.33 for CTpost, while the IDOL model improved CTpost DSCs to 0.49. In the RECIST cohort (n = 63), mean DSCs were 0.61 for CTpre and 0.53 for CTpost using FCD, versus 0.63 for IDOL. Predicted RECIST diameters differed by ~6% from manual values, with concordance in 13 of 14 validation cases. Volumetric predictions showed lower correlation, with a tendency toward overestimation at tumor poles.
Conclusions:
The patient-specific IDOL framework improved auto-segmentation accuracy compared with conventional models and provided clinically acceptable RECIST-based response assessment. Despite limitations and lack of external validation, this study demonstrates preliminary feasibility of auto-segmentation to support response evaluation in treated HCC.
Keywords:
hepatocellular carcinoma
; RECIST
; auto-segmentation
; CCRT
1. Introduction
Hepatocellular carcinoma (HCC) is the sixth most common type of cancer and the third leading cause of cancer-related mortality, with particularly high prevalence in East Asia. [1] In treatment of locally advanced hepatocellular carcinoma, there are several options including local-ablative therapy (e.g. Transcatheter arterial chemoembolization (TACE), External beam radiotherapy (EBRT), hepatic arterial infusion chemotherapy (HAIC) as well as systemic therapies. According to the National Comprehensive Cancer Network (NCCN) guidelines for HCC, EBRT is recommended for patients with unresectable disease who are not transplant candidates, as well as for those with inoperable local disease, although the level of evidence remains Category 2B [2]. Recent studies have reported definitive concurrent chemoradiotherapy (CCRT) with HAIC yields more favorable results compared with non-CCRT group. [3] Nevertheless, intrahepatic progression is common even after treatment, leading to liver failure and mortality. Thus, detection of loco-regional progression and timely transition to alternative treatment options are critical for optimizing patient prognosis.
Computed tomography (CT) scans is an essential modality for response evaluation, especially in HCC, which has unique enhancement patterns in contrast-dynamic CT. Determining whether a tumor has progressed, remained stable, or responded to therapy is crucial for clinical decision-making; however, such assessments are often subject to inter-observer variability among physicians and radiologists. The Response Evaluation Criteria in Solid Tumors (RECIST) are among the most widely adopted guidelines for treatment response assessment. [4] In RECIST criteria, evaluation requires measurement of the “Target lesion” based on its longest axis in axial slices. However, two major challenges exist; first, measuring tumor diameters requires significant professional expertise and is a time-consuming task, which is why rigid application of RECIST is often limited to clinical trials rather than routine clinical practice. Second, RECIST measurements are often subjective and may vary between radiologists, resulting in inconsistency.
Nowadays, with the advancement of deep learning tools, several studies have aimed to support treatment response evaluation with less effort. For instance, Xu et al. proposed a model to predict lung cancer treatment response. Deep learning models can predict survival and cancer-specific outcomes, especially when combined with serial follow-up images. [5] Similarly, Omar Ibrahim et al. introduced deep learning models for liver and tumor segmentation from CT scans; however, the validation accuracy for tumor segmentation remains suboptimal. [6]
Developing reliable auto-segmentation models for treated HCC is particularly challenging for several reasons. HCC patients often suffer from severe liver cirrhosis, making the liver parenchyma coarse in appearance, and HCC lesions themselves are radiologically heterogeneous. Treated HCC lesions can take various forms depending on the treatment modality, such as scar tissue, necrotic areas, or fluid collections. Furthermore, residual embolic materials or artifacts from treatments like TACE or RFA can complicate image interpretation. [7] Therefore, this study focuses on evaluating size differences in the main HCC lesions using RECIST criteria after definitive CCRT in locally advanced, treatment-naïve HCC.
2. Methods
Study Design and Patient Selection
Patients diagnosed with locally advanced HCC without nodal or distant metastasis who received definitive CCRT or RT between January 2016 and February 2021 at a single institution were identified. The medical records of all patients were retrospectively reviewed. All patients received intra-arterial 5-fluorouracil (FU) chemotherapy concurrently with 25 fractions of radiotherapy. The most commonly used dose fractionation was 2.4/1.8 Gy per fraction, employing a simultaneous integrated boost (SIB) technique to deliver a higher dose to the tumor. Tumor characteristics including tumor size, extent, tumor markers, and survival status data were collected from medical records and diagnostic imaging. Diagnostic Computed Tomography (CT) image data were collected both at pre-treatment (CT_pre) and post-treatment (CT_post) – the first follow-up within 3 months.
Tumor contour at both time points: (Tumor_pre, Tumor_post) were manually delineated on portal phase CT images by a radiation oncologist and subsequently reviewed by a radiology expert. MRI scans were referred to further define ground truth tumor boundaries whenever available. As RECIST evaluation was a secondary goal of this study, tumors with extensive diffuse portal vein tumor thrombosis(PVTT) out of main lesion and not meeting RECIST criteria were categorized separately in order to generate optimal model and (RECIST cohort).
Training and Validation Dataset
After image review and processing, a dataset of 83 patients was collected. In entire cohort collected and divided into a training set(n=67) and a validation set(n=16). After excluding 20 RECIST-unfavorable cases, 63 patients remained and were divided into a training set (n=49) and a validation set(n=14). For each patient, dataset consists of two time points as follows: {CT_pre, Tumor_pre} and {CT_post, Tumor_post}, where each element represented a radiotherapy planning CT, tumor contour on CT_pre, first follow-up CT, and tumor contour on CT_post, respectively. The dataset structure is illustrated in the upper panel of Figure 1.
Fully Convolutional DenseNet
For both the comparison model and the pretrained network used in the IDOL framework, a Fully Convolutional DenseNet (FCD) - a deep learning network for semantic segmentation- was employed. The input dimension of FCD model was adjusted from two to three so that the entire 3D CT image can be processed. In addition, the original RGB-based three-channel input structure was converted to a single-channel gray level medical image for this study. [7]
IDOL (Intentional Deep Overfit Learning) Framework
The IDOL framework, originally proposed for adaptive radiotherapy (ART), is task-agnostic and can therefore be applied to any task that meets its two-stage training strategy; (a) training a generalized model i.e., a conventional deep learning training, and (b) intentionally overfitting the generalized model to prior information of interest. In this study, we implemented the IDOL framework to generate a personalized model that automatically contours the tumor volume on the CT_post image. [8]
For a pretrained network, we used the Fully Convolutional DenseNet as described above. Firstly, the pretrained FCD was re-trained until over fitted to the target patient using prior information of CT_pre and the corresponding tumor contour. The prior information {CT_pre, Tumor_pre} was augmented through perturbation and repetition to achieve intentional overfitting. Once an over fitted personalized model was generated, the model predicted the tumor contour using the CT_post image of the target patient. The performance was measured using the Dice Similarity Coefficient (DSC), comparing the predicted post-treatment tumor (Tumor_post) with the manually contoured Tumor post. A schematic diagram of the model structure is shown in the lower panel of Figure 1.
RECIST Evaluation
After completion of the deep learning model analyses, maximal axial diameter was measured on both pre- and post- treatment CT images in the RECIST cohort according to RECIST guidelines.
3. Results
3.1. Patient and Tumor Characteristics
Among the 83 patients diagnosed with HCC who received CCRT at a single institution, 67 patients were male and 16 patients were female. The patients' ages ranged from 33 to 82 years, with a median of 60. Forty-seven patients had α-fetoprotein (AFP) elevation, whereas 76 patients had protein induced by vitamin K absence (PIVKA)-II elevation. The maximal axial diameter decreased from an average of 118.6mm before treatment to 96.9mm after treatment, and the mean tumor volume decreased from an average of 672cc to 427cc. The 1-year loco-regional free survival rate was 55.5%, and the 1-year overall survival rate was 64.4%. (Table 1)
3.2. FCD Model and IDOL Model in the Entire Cohort
In model building process for the entire cohort, the FCD model was applied to predict tumor contours on both CT_pre and CT_post images, while the IDOL model was generated by incorporating each case’s CT_pre data to improve performance. Sixty-seven cases (134 CT images in total) were used as the training set, and 16 cases were used for validation. For CTpre images, Dice Similarity Coefficient (DSC) between manually drawn contour(manual contour) and predicted contour was calculated by both Models. DSCs between manual contour and auto-segmented results from the IDOL model for CT_post images were also calculated (sup Table 1a). In the 16 validation cases, the mean DSC of CT_pre was 0.53 using the FCD model and 0.33 for CT_post. In contrast, the IDOL model improved CT_post DSCs to 0.49. The IDOL model demonstrated better performance in challenging cases compared with the conventional FCD model.
3.3. FCD Model and IDOL Model in the RECIST Cohort
In RECIST group, 49 cases were used as the training set and 14 cases as the validation set for developing the FCD and IDOL models within the RECIST cohort. The DSCs between manual and predicted contours are summarized in (Table 2). The mean DSC for CTpre was 0.61 with the FCD model. For CT_post, the mean DSCs were 0.53 and 0.63 for the FCD and IDOL models, respectively. A cross- comparison of DSCs between cohorts and models is summarized in (Table 3).
3.4. Predicted Maximum Axial Diameter (RECIST) and Tumor Volume
The maximal axial diameter for 14 validation cases in the RECIST cohort was measured for both manual and IDOL model-predicted contours. Measurements and post-treatment changes are summarized in (Table 4). The average maximal axial diameter of manually delineated tumors was 118.2mm before treatment and decreased to 90.4mm after treatment, corresponding to an average reduction of 19.9% (range, -52.6% to +2.1%). The average predicted value by the auto-segmentation model was 97.6mm, differing by approximately 6.1% from the manual measurement. The model tended to predict slightly larger tumor contours compared with manual delineation. According to RECIST criteria, four patients exhibited partier response (PR) and ten had stable disease (SD). The IDOL model predicted three cases as PR and one true PR case as SD, which showed a -36.0% reduction in maximum axial diameter manually, but -13.2% according to the model predication.
4. Discussion
The purpose of this study was to assist post-treatment response evaluation with deep-learning based auto segmentation. In general, HCC has been considered challenging target for auto segmentation by deep learning models due to the irregularity of the background liver and the heterogeneity of the tumor itself.[9] Furthermore, in patients with locally advanced disease, the difficulty is further compounded by the accompanying diffuse PVTT and tumor irregularity among hepatic vasculature. In this study, through IDOL analysis, we attempted to improve the performance of automated tumor localization and size measurement to a clinically useful level of accuracy.
In the analysis of entire 83 patients cohort, the general FCD model demonstrated relatively low performance. (supplement table 1) Previous studies on liver tumor auto-segmentation, including mostly metastatic lesions and few HCC tumors, have reported DSCs of approximately 0.6-0.7. In this study, most patients presented with large, irregularly shaped tumors, and several cases with PVTT showed poorly defined tumor boundaries on dynamic CT scans. The predictive performance of the FCD model was further reduced for CT_post images, particularly in cases with small PVTT lesions that were difficult to delineate. In contrast, the IDOL model, which was over fitted to each individual patient’s CT and tumor contour, showed improved accuracy with an increasing average DSC of 0.49.
In the analysis of the RECIST cohort, relatively higher performance was achieved. The FCD model achieved a mean DSC of 0.61, similar to values reported in prior studies. After treatment, the mean DSC decreased to 0.53; however, the IDOL model improved performance to a mean DSC of 0.63 – the highest among models and comparable to pre-treatment accuracy.
The FCD model tended to overestimate tumor boundaries, particularly at the superior and inferior poles, whereas the IDOL model produced tighter, more anatomically accurate contours (Figure 2 : Case 2,3) Distant liver metastasis were not detected in model predictions.
Within the IDOL framework, both pre-treatment imaging and the corresponding tumor segmentations were utilized for model training. When applied to post-treatment images, the model facilitated tumor segmentation but tended to over-segment peritumoral areas such as regions around tumors, such as post-treatment edema. This tendency resulted in general overestimation of tumor volumes and lower DSC scores on post -treatment CT scans. (Figure 2 : Case 4)
To confirm whether RECIST response evaluation by deep learning was reasonable, maximal axial diameter was evaluated using the IDOL(RECIST) model. The model achieved reasonable prediction accuracy, with an absolute difference of approximately 9% in maximal axial diameter compared with manual measurements. However, tumor volume correlation was relatively low. The predicted contours were slightly larger and smoother than actual tumors, occasionally including adjacent non-tumorous liver tissue, leading to uncertainty in volumetric estimation. This discrepancy mainly arose from accurate predictions in central slices but overestimation at the tumor poles.
There are some limitations to our study. First, this auto segmentation study did not perform external validation due to constraints in patient data availability. Second, there is an information gap between the ground truth tumor contour and the dataset used for model training. Due to the nature of HCC, it is often difficult to clearly determine the boundaries of locally advanced patients, especially with PVTT or micro invasion, using dynamic CT alone. To overcome this uncertainty, all available CT and MRI phases were used to create manual tumor contour, which was reviewed by an expert liver radiologist to maximize ground truth quality. On the other hand, since the deep learning model was trained only on the single (portal) phase of CT, there was a limitation to predict true tumor boundaries. Because of the characteristics of HCC, post-treatment liver shrinkage and changes in adjacent bowel or gallbladder regions negatively affected model performance on post-treatment images. Finally, this study was based on the IDOL framework model, which requires segmentation labels from pre-treatment CT scans. Although such labels are readily available during treatment planning for CCRT patients, this dependency may limit the applicability of the model to populations not undergoing radiotherapy.
5. Conclusions
In conclusion, the individually over-fitted model trained using pre-treatment data from HCC patients was able to predict post-treatment tumors more accurately than conventional models. The predicted contours tended to include peripheral liver tissue near the tumor poles but demonstrated better accuracy in the main tumor slices, which are most relevant for RECIST-based evaluation. Although research on auto-segmentation for treated HCC remains challenging, this study provides preliminary but meaningful evidence that automated segmentation can assist both lesion delineation and RECIST-based response assessment. We anticipate that such tools may aid clinical decision-making and save time for radiologist and clinicians. Future studies incorporating multi-phase CT and MRI are warranted to overcome current limitations and improve prediction accuracy, particularly for cases with diffuse PVTT or high tumor heterogeneity.
Supplementary Materials
The following supporting information can be downloaded at the website of this paper posted on Preprints.org.
Author Contributions
Jinyoung Moon, MD and Minseo Choi, PhD contributed equally to this work and share first authorship. Yejin Kim, PhD and Hyungjin Rhee, MD contributed to image data preparation and deep learning model building. Sang Jun Park, MD, PhD participated in the critical review and revision of the manuscript. Jin Sung Kim, PhD and Ik Jae Lee, MD, PhD contributed to the conceptualization of the study and provided overall supervision and final approval of the manuscript.
Funding Sources
This study was not supported by any sponsor or funder.
Data Availability Statement
Data availability is limited due to institutional data protection law and the confidentiality of patient data.
Statement of Ethics
This study was approved by the institutional review board of the Yonsei University Health System (4-2022-0217).
Conflicts of Interest Statement
No potential conflict of interest relevant to this article was reported.
References
- Sung, H.; Ferlay, J.; Siegel, R.L.; Laversanne, M.; Soerjomataram, I.; Jemal, A.; Bray, F. Global Cancer Statistics 2020: GLOBOCAN Estimates of Incidence and Mortality Worldwide for 36 Cancers in 185 Countries. CA. Cancer J. Clin. 2021, 71, 209–249. [Google Scholar] [CrossRef] [PubMed]
- Benson, A.B.; D’Angelica, M.I.; Abbott, D.E.; Anaya, D.A.; Anders, R.; Are, C.; Bachini, M.; Borad, M.; Brown, D.; Burgoyne, A.; et al. Hepatobiliary Cancers, Version 2.2021, NCCN Clinical Practice Guidelines in Oncology. J. Natl. Compr. Cancer Netw. JNCCN 2021, 19, 541–565. [Google Scholar] [CrossRef] [PubMed]
- Yoon, H.I.; Song, K.J.; Lee, I.J.; Kim, D.Y.; Han, K.-H.; Seong, J. Clinical Benefit of Hepatic Arterial Infusion Concurrent Chemoradiotherapy in Locally Advanced Hepatocellular Carcinoma: A Propensity Score Matching Analysis. Cancer Res. Treat. 2016, 48, 190–197. [Google Scholar] [CrossRef] [PubMed]
- Eisenhauer, E.A.; Therasse, P.; Bogaerts, J.; Schwartz, L.H.; Sargent, D.; Ford, R.; Dancey, J.; Arbuck, S.; Gwyther, S.; Mooney, M.; et al. New response evaluation criteria in solid tumours: revised RECIST guideline (version 1.1). Eur. J. Cancer Oxf. Engl. 1990 2009, 45, 228–247. [Google Scholar] [CrossRef] [PubMed]
- Xu, Y.; Hosny, A.; Zeleznik, R.; Parmar, C.; Coroller, T.; Franco, I.; Mak, R.H.; Aerts, H.J.W.L. Deep Learning Predicts Lung Cancer Treatment Response from Serial Medical Imaging. Clin. Cancer Res. 2019, 25, 3266–3275. [Google Scholar] [CrossRef] [PubMed]
- Alirr, O.I. Deep learning and level set approach for liver and tumor segmentation from CT scans. J. Appl. Clin. Med. Phys. 2020, 21, 200–209. [Google Scholar] [CrossRef] [PubMed]
- Jégou, S.; Drozdzal, M.; Vazquez, D.; Romero, A.; Bengio, Y. The One Hundred Layers Tiramisu: Fully Convolutional DenseNets for Semantic Segmentation 2017. [CrossRef]
- Chun, J.; Park, J.C.; Olberg, S.; Zhang, Y.; Nguyen, D.; Wang, J.; Kim, J.S.; Jiang, S. Intentional deep overfit learning (IDOL): A novel deep learning strategy for adaptive radiation therapy. Med. Phys. 2022, 49, 488–496. [Google Scholar] [CrossRef] [PubMed]
- Park, S.; Kim, J.H.; Kim, J.; Joseph, W.; Lee, D.; Park, S.J. Development of a deep learning-based auto-segmentation algorithm for hepatocellular carcinoma (HCC) and application to predict microvascular invasion of HCC using CT texture analysis: preliminary results. Acta Radiol. 2023, 64, 907–917. [Google Scholar] [CrossRef] [PubMed]
Figure 1.
General workflow of FCN, IDOL mode. At first, a generalized FCN model is produced by utilizing a training dataset of the patients. Next, optional task-driven augmentation by specific prior information produce a personalized model called IDOL. Tumor prediction was done 4 times for each datasets and deep learning models.
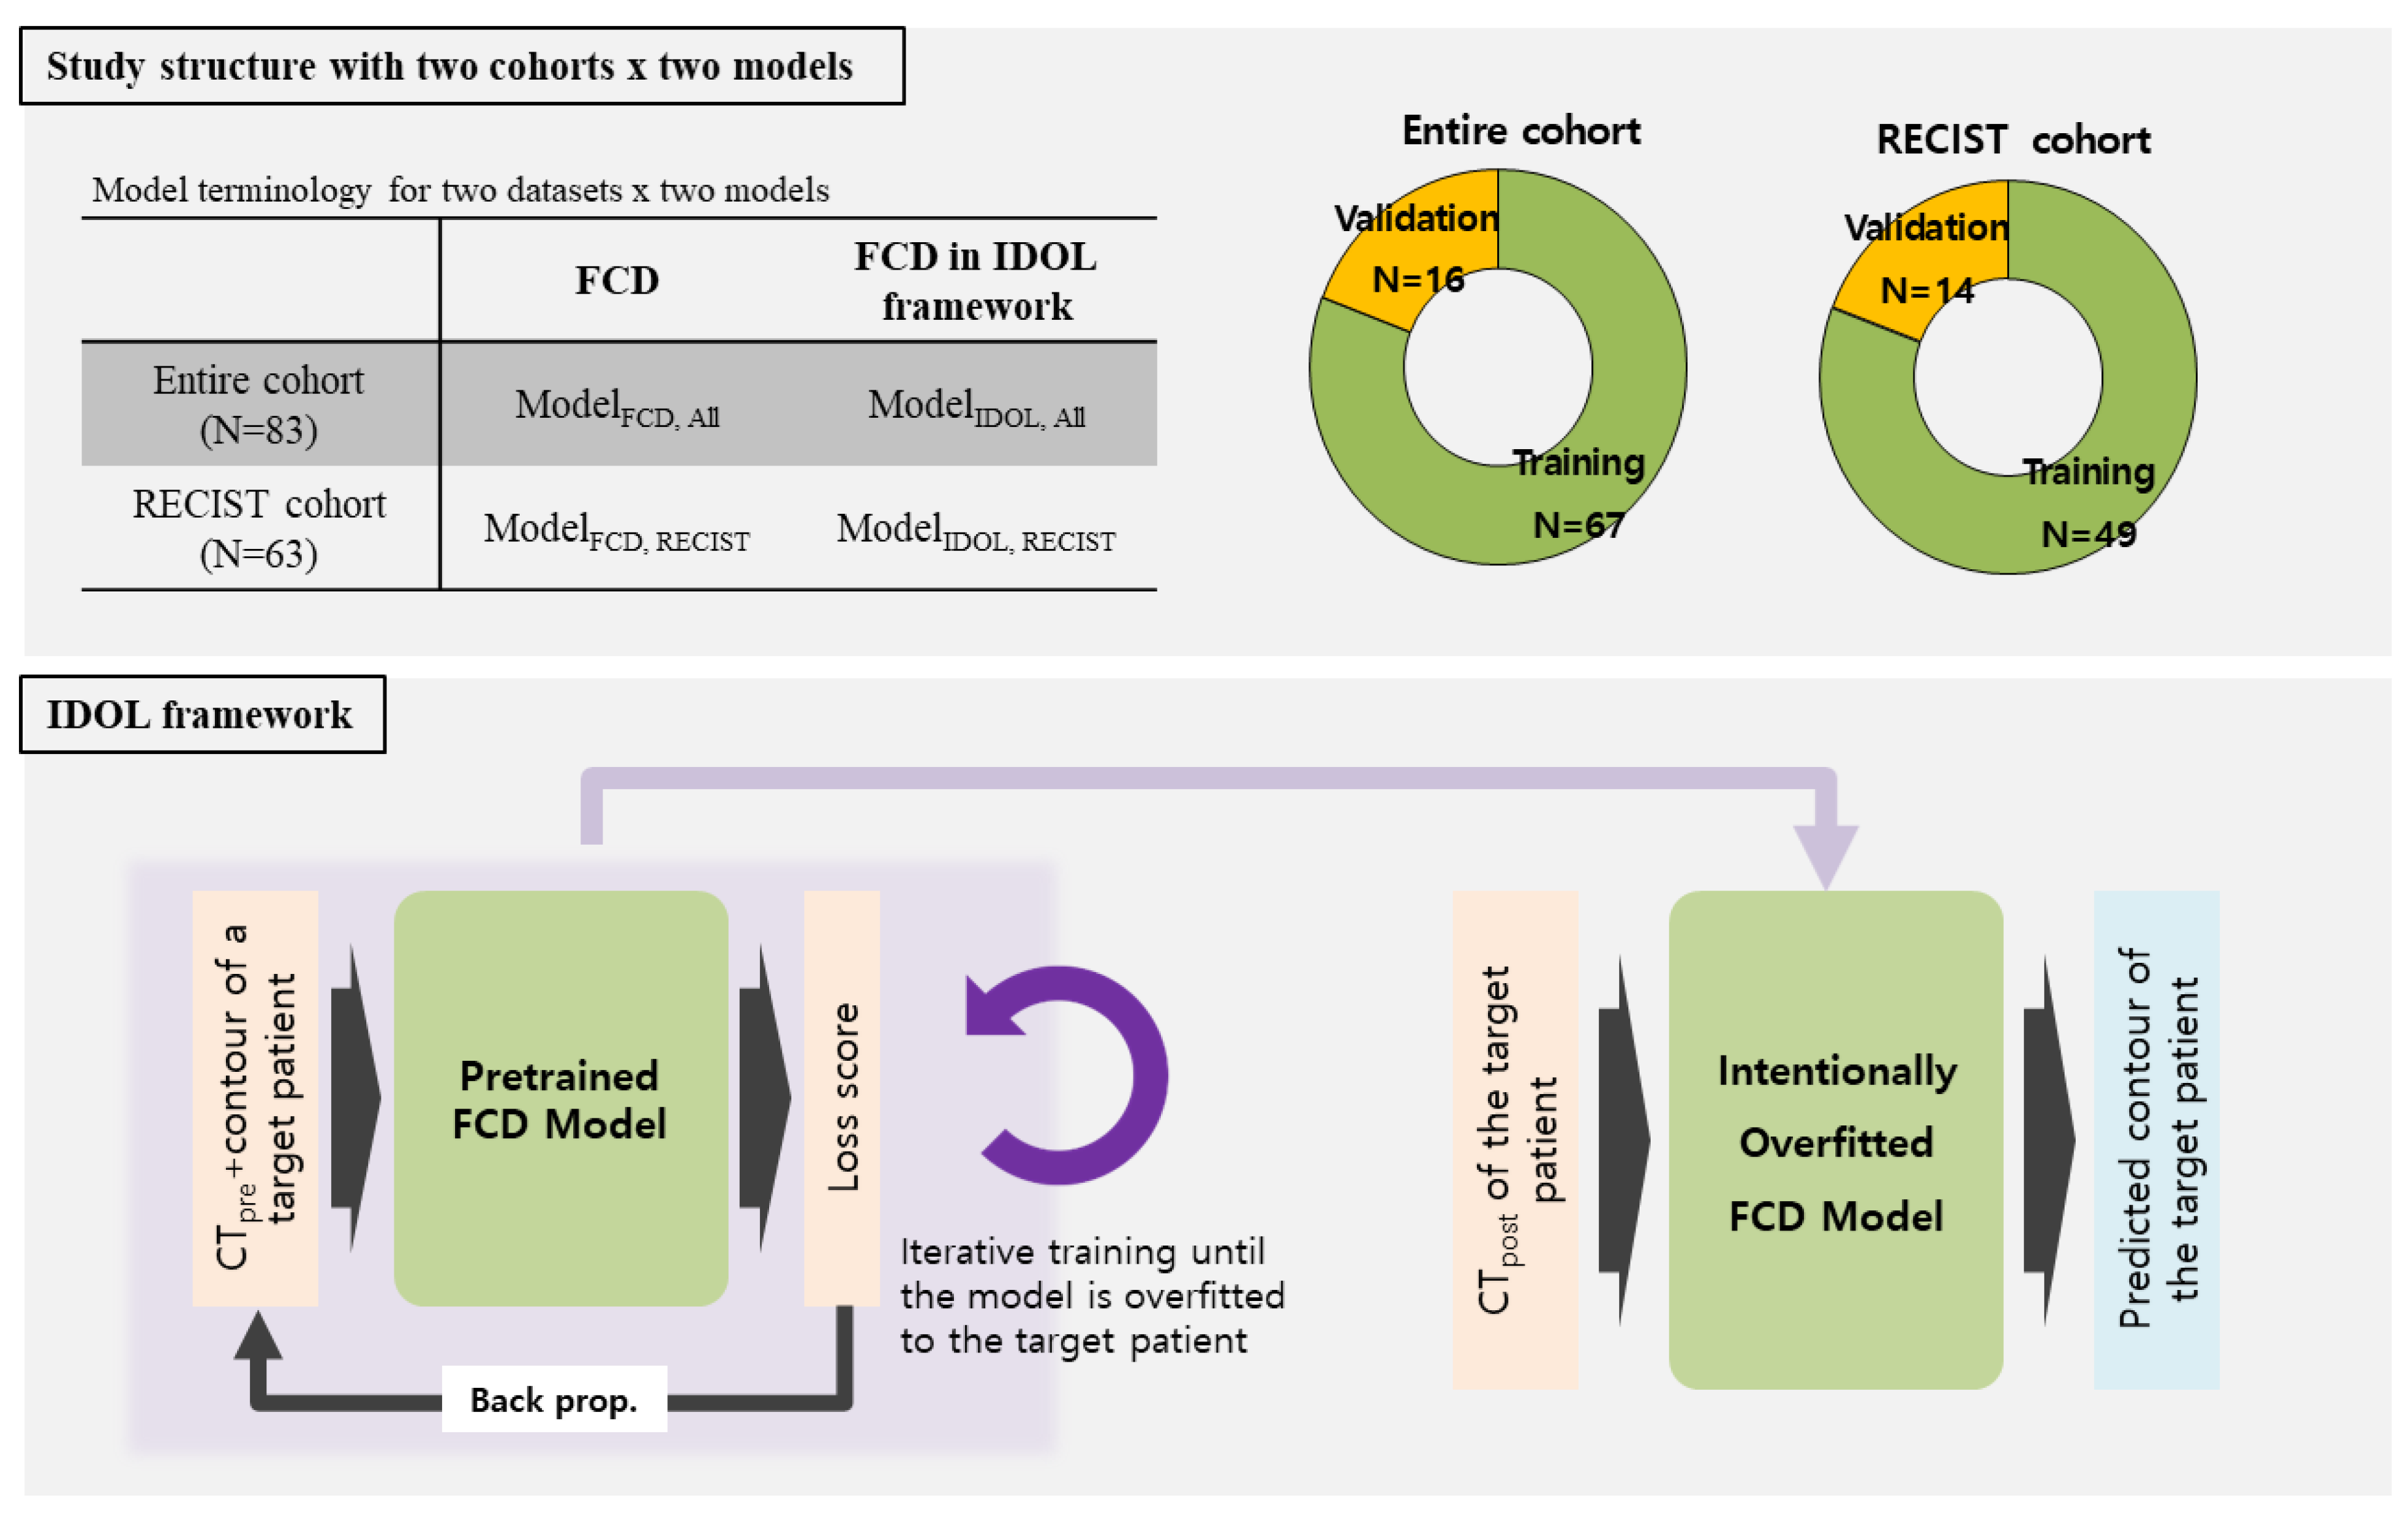
Figure 2.
Examples of tumor prediction model and comparison with manually drawn contour in RECIST cohort. Tumor contours on CT scans after treatment are arranged in rows according to manual contour and model FCD & IDOL.
Figure 2.
Examples of tumor prediction model and comparison with manually drawn contour in RECIST cohort. Tumor contours on CT scans after treatment are arranged in rows according to manual contour and model FCD & IDOL.
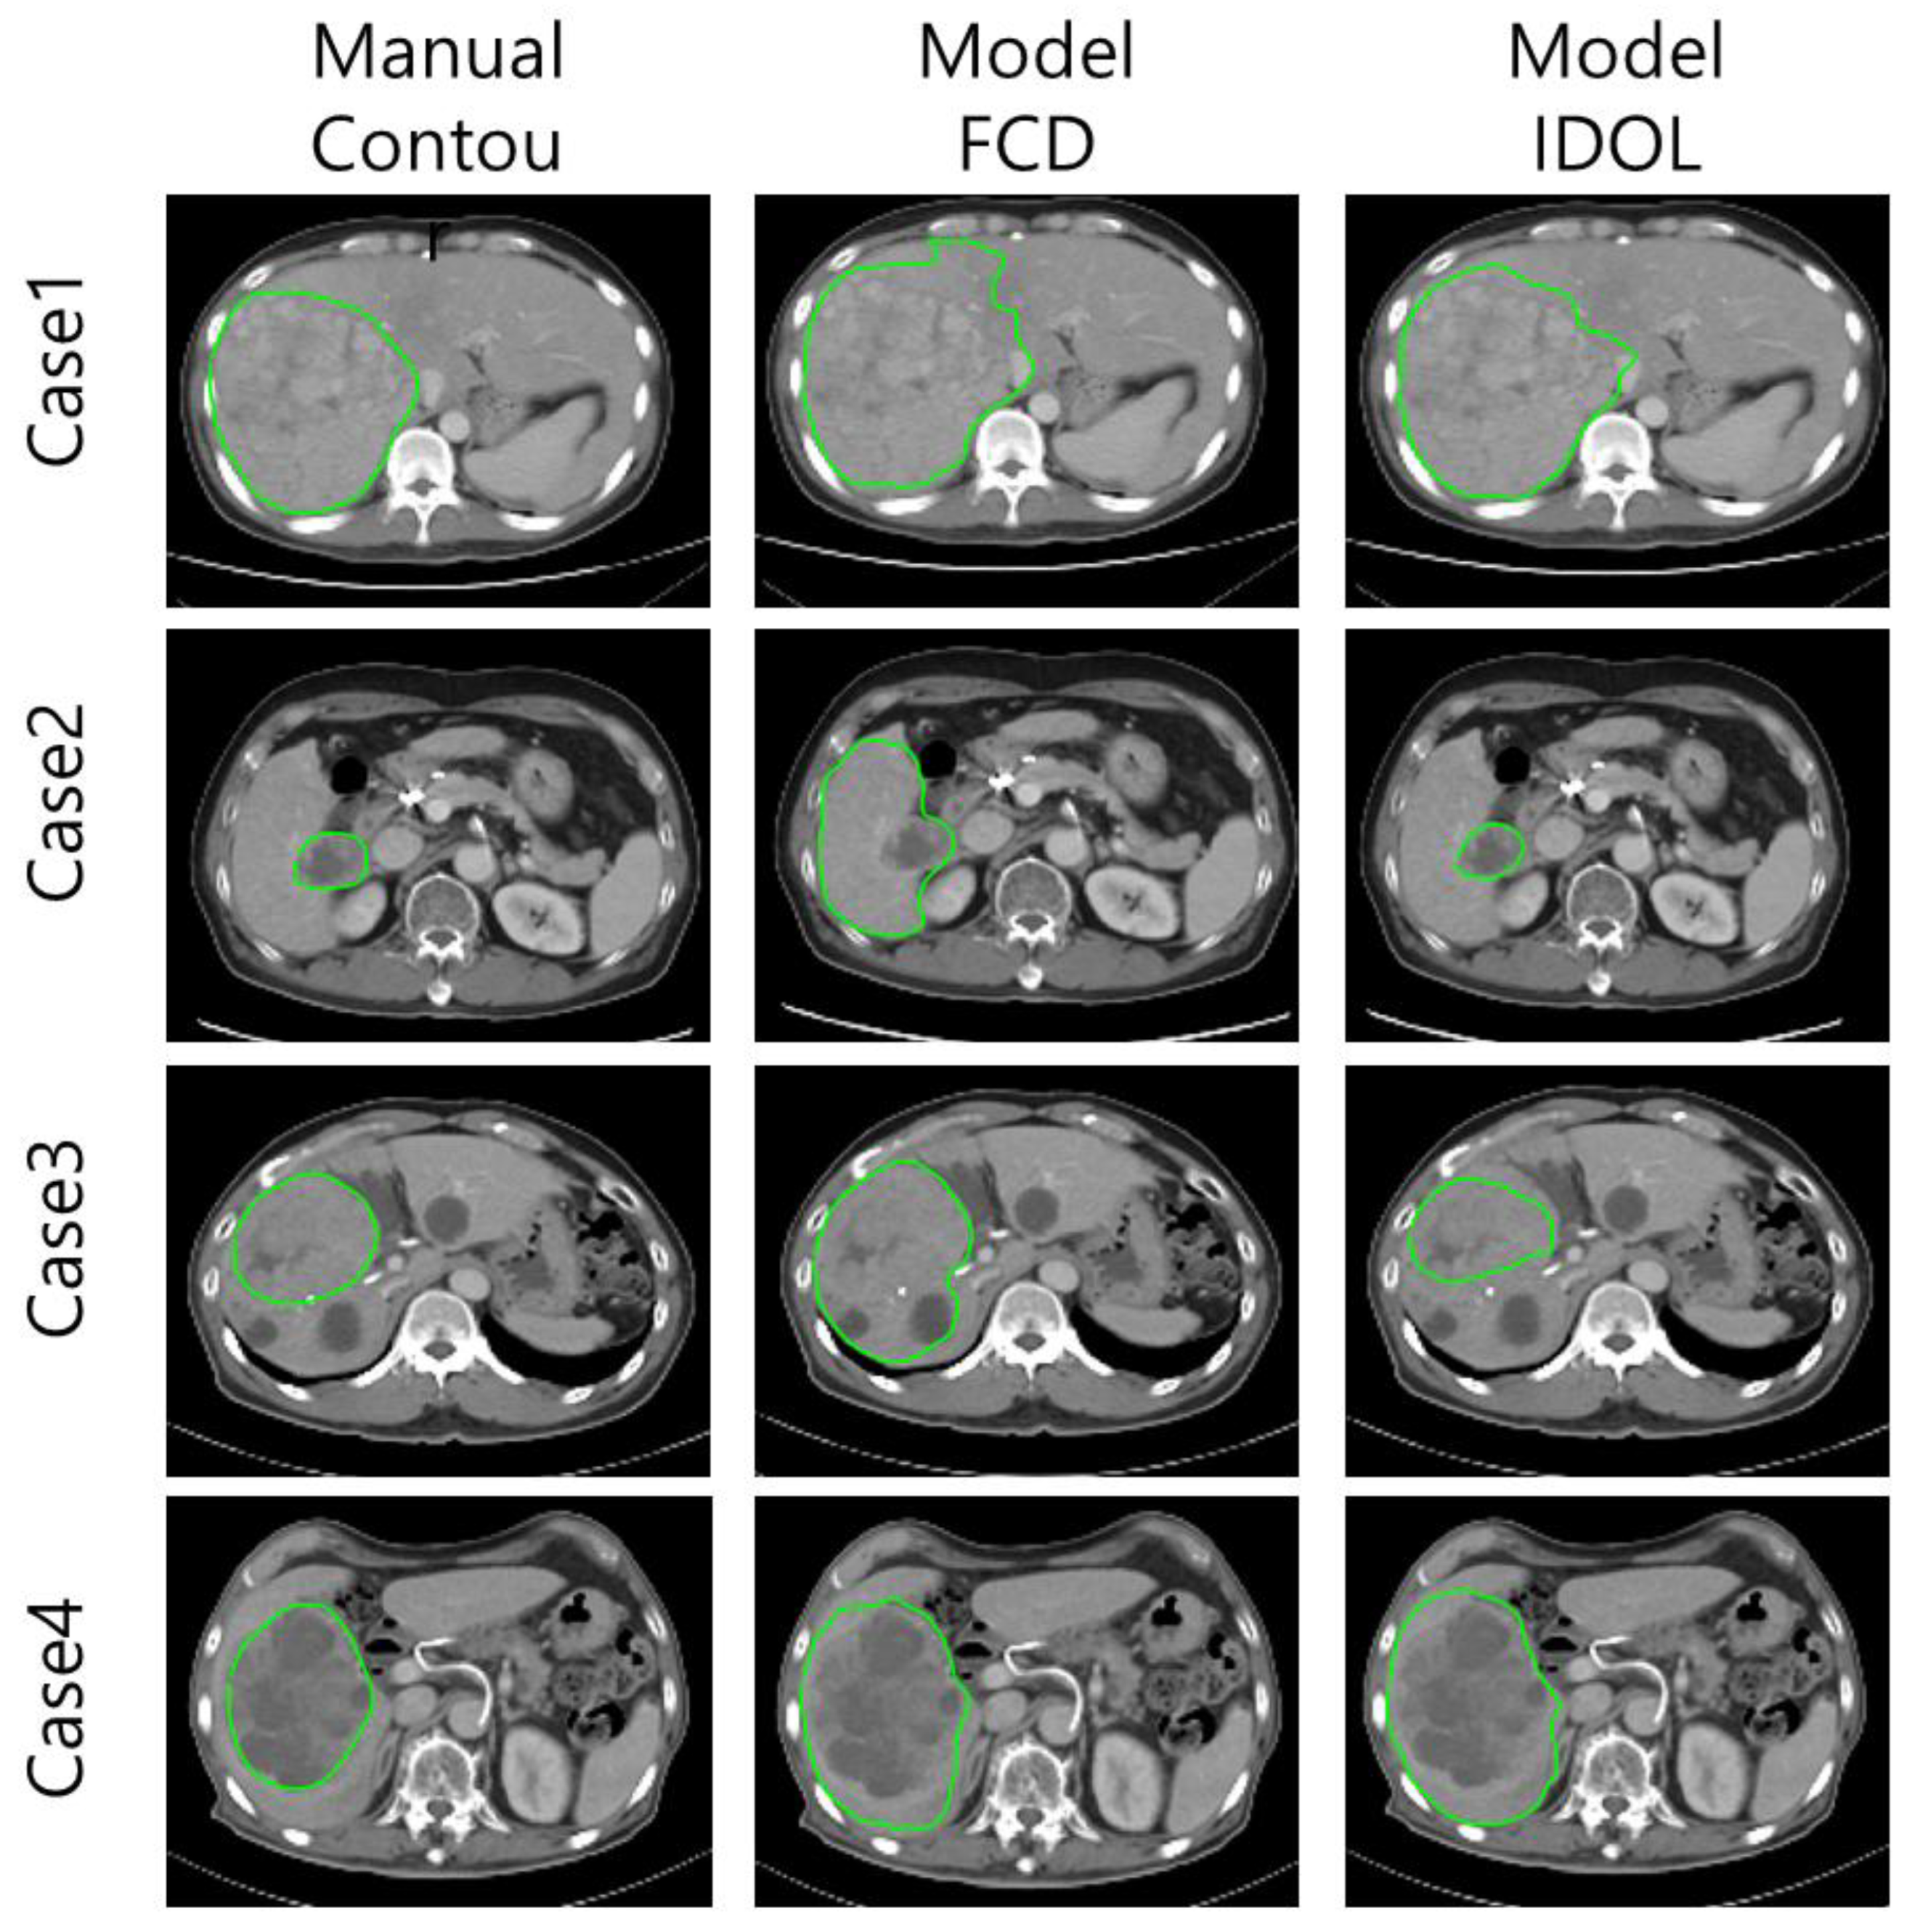

Table 1.
Patient and tumor characteristics.
| Characteristics | No. | % |
|---|---|---|
| Sex | ||
| Male | 67 | 80.7 |
| Female | 16 | 19.3 |
| Age (year) | Median 60 (33~82) | |
| AFP elevation (>10ng/ml) | ||
| Yes | 47 | 56.6 |
| No | 36 | 43.4 |
| PIVKA-II elevation (>40mAU/ml) | ||
| Yes | 76 | 91.6 |
| No | 7 | 8.4 |
| Diffuse PVTT | ||
| Yes | 20 | 24.1 |
| No | 63 | 75.9 |
| Maximum axial diameter (CTpre) | 118.6 ± 45.1 (mm) | |
| Maximum axial diameter (CTpost) | 96.9± 43.8 (mm) | |
| Tumor volume (CTpre) | 672.0 ± 623.9 (cc) | |
| Tumor volume (CTpost) | 426.9 ± 508.7 (cc) | |
| 1yr-LRFS | 55.50% | |
| 1yr-Overal survival | 64.40% | |
Abbreviations: AFP:α-fetoprotein, PIVKA : Proteins Induced by Vitamin K Absence, LRFS : Loco-regional progression Free Survival.
Table 2.
Dice similarity coefficient (DSC) of RECIST cohort per FCD and IDOL model.
| Model | FCD, | FCD, | IDOL, |
|---|---|---|---|
| Case | CTpre | CTpost | CTpost |
| 1 | 0.45 | 0.07 | 0.21 |
| 2 | 0.77 | 0.57 | 0.52 |
| 3 | 0.65 | 0.69 | 0.78 |
| 4 | 0.46 | 0.29 | 0.62 |
| 5 | 0.90 | 0.75 | 0.83 |
| 6 | 0.82 | 0.80 | 0.85 |
| 7 | 0.61 | 0.16 | 0.58 |
| 8 | 0.55 | 0.42 | 0.68 |
| 9 | 0.92 | 0.87 | 0.90 |
| 10 | 0.81 | 0.70 | 0.57 |
| 11 | 0.16 | 0.14 | 0.64 |
| 12 | 0.26 | 0.54 | 0.57 |
| 13 | 0.83 | 0.76 | 0.63 |
| 14 | 0.32 | 0.64 | 0.50 |
| Mean | 0.61 | 0.53 | 0.63 |
Abbreviations: RECIST: Response Evaluation Criteria in Solid Tumours, FCD : Fully Convolutional DenseNet. IDOL : Intentional deep overfit learning.
Table 3.
Comparison of mean dice similarity coefficient of 2 by 2 model.
| Model | Patients group | Mean DSC | |
|---|---|---|---|
| CTpre | CTpost | ||
| FCD | All | 0.53 | 0.33 |
| IDOL | All | - | 0.49 |
| FCD | RECIST | 0.61 | 0.53 |
| IDOL | RECIST | - | 0.63 |
Abbreviations: DSC : mean dice similarity coeffcient, FCD : Fully Convolutional DenseNet. IDOL : Intentional deep overfit learning.
Table 4.
Maximal axial diameters and differences after treatment by manually drawn contour and predicted contour by Model (IDOL, RECIST).
Table 4.
Maximal axial diameters and differences after treatment by manually drawn contour and predicted contour by Model (IDOL, RECIST).
| Maximal axial diameter(mm) | Difference after treatment (%) | ||||||
|---|---|---|---|---|---|---|---|
| Case | Manual | Model | Manual | RECIST | Model | RECIST | |
| CTpre | CTpost | CTpost | |||||
| 1 | 113.5 | 64.6 | 80.8 | -28.4 | SD | -10.5 | SD |
| 2 | 151.8 | 74.3 | 80.4 | -52.6 | PR | -48.7 | PR |
| 3 | 129.3 | 87.5 | 84.8 | 1.9 | SD | -1.2 | SD |
| 4 | 100.1 | 61.8 | 63.1 | -33.7 | PR | -32.3 | PR |
| 5 | 178.0 | 159.0 | 170.1 | -2.9 | SD | 3.9 | SD |
| 6 | 152.5 | 138.5 | 147.7 | -8.8 | SD | -2.8 | SD |
| 7 | 100.0 | 91.7 | 85.5 | -5.3 | SD | -11.8 | SD |
| 8 | 95.6 | 81.1 | 82.0 | -7.8 | SD | -6.8 | SD |
| 9 | 156.8 | 144.0 | 145.0 | -0.3 | SD | 0.4 | SD |
| 10 | 114.3 | 80.4 | 109.1 | -36.0 | PR | -13.2 | SD |
| 11 | 128.9 | 47.1 | 48.9 | -14.3 | SD | -11.0 | SD |
| 12 | 68.2 | 95.9 | 116.3 | -43.8 | PR | -31.9 | PR |
| 13 | 143.1 | 114.4 | 126.8 | -25.9 | SD | -17.9 | SD |
| 14 | 22.6 | 25.3 | 26.3 | 2.1 | SD | 6.3 | SD |
| Mean | 118.2 | 90.4 | 97.6 | ||||
Abbreviations: RECIST: Response Evaluation Criteria in Solid Tumours, IDOL : Intentional deep overfit learning.
Disclaimer/Publisher’s Note: The statements, opinions and data contained in all publications are solely those of the individual author(s) and contributor(s) and not of MDPI and/or the editor(s). MDPI and/or the editor(s) disclaim responsibility for any injury to people or property resulting from any ideas, methods, instructions or products referred to in the content. |
© 2025 by the authors. Licensee MDPI, Basel, Switzerland. This article is an open access article distributed under the terms and conditions of the Creative Commons Attribution (CC BY) license (http://creativecommons.org/licenses/by/4.0/).
Copyright: This open access article is published under a Creative Commons CC BY 4.0 license, which permit the free download, distribution, and reuse, provided that the author and preprint are cited in any reuse.


