Submitted:
24 November 2025
Posted:
25 November 2025
You are already at the latest version
Abstract
Human breast milk is a dynamic biological fluid essential for infant growth, immune regulation, and early metabolic development. Maternal diabetes mellitus can alter its molecular composition, potentially impacting its nutritional value and the infant’s future metabolic health. This study compared the metabolomic profiles of breast milk from healthy versus diabetic women using untargeted metabolomics with GC/MS-QTOF on samples from normoglycemic and type 2 diabetic cohorts. Supervised multivariate statistics and metabolic pathway analysis identified discriminant metabolites and clarified biological relevance. Distinct metabolomic signatures were found: milk from diabetic mothers showed changes in short-chain fatty acids, amino acid derivatives, carbohydrates, and lipid-related molecules, with alterations in pathways such as energy metabolism, oxidative stress, and microbial co-metabolism. These specific changes in the milk metabolome may influence infant metabolic programming and highlight the need for personalized nutritional approaches for mothers with metabolic disorders, supporting metabolomics as a tool to monitor breast milk quality.
Keywords:
human breast milk
; human milk metabolome
; gestational diabetes mellitus
; maternal type 2 diabetes
; untargeted metabolomics
1. Introduction
Breast milk is widely recognized as the “gold” biological fluid in nutrition due to its unique adaptability to the evolving nutritional and energetic needs of the infant. Its composition changes according to the baby's age and physiological stage [1], and shows substantial inter- and intra-individual variability, differing not only among women but also within each mother throughout lactation. This dynamic quality allows breast milk to facilitate crucial physiological functions for the growing child and reflects a personalized response that is absent in artificial substitutes [2]. Its three fundamental sources—lactocyte synthesis, dietary intake, and maternal reserves—contribute to the rich and variable matrix of nutrients [3].
Classic nutritional tables, such as Table 1, summarize average values: colostrum, the initial postpartum milk, is dense and yellow with high betacarotene, rich in water, proteins, fat-soluble vitamins (A, D, C, E, K), minerals, IgA, lactoferrin, lymphocytes, macrophages, and oligosaccharides that help shape the neonatal gut microbiome [4,5]. Subsequent stages—transitional milk and mature milk—are characterized by nutrient stabilization and adaptations for ongoing growth [6]. Lactose remains the key carbohydrate, increasing through lactation stages, while protein and fat content adjust as nutritional priorities change. Oligosaccharides in all stages provide prebiotic functions favoring the microbiota [7].
Breast milk’s composition reflects an intricate web of interactions in the mammary gland, supplying all infant nutritional needs for the first six months and supporting the baby’s immunological, neurological, and musculoskeletal development [20,21]. Discontinuation not only compromises infant health, but also maternal well-being [22].
Despite advances, a precise molecular description remains elusive, primarily due to the challenge of replicating the natural environmental conditions of this complex food matrix in the laboratory, even with traditional techniques. The development of bioinformatics and omics sciences [metagenomics, metabolomics, and lipidomics] has expanded understanding, revealing new layers of complexity and gene-nutrient interactions with profound functional consequences in infants [23,24]. This research paradigm facilitates more personalized nutritional approaches, especially for at-risk infants such as those with diabetes.
In this context, this study aims to analyze the differences in the human breast milk metabolome between mothers with and without diabetes and to establish associations between these profiles despite sample differences, seeking to clarify how maternal health conditions may affect the dynamic composition of breast milk and thereby influence infant outcomes.
2. Results
2.1. Identification of candidate biomarkers in mothers with GDM and healthy mothers
The multivariate comparison of metabolomic profiles using PERMANOVA showed a statistically significant differentiation between the groups (F = 81.297; R² = 0.78702$; p = 0.001 with 999 permutations), suggesting that the health status (diabetic vs. healthy) explains a substantial proportion (53.4%) of the total variation in the distances between samples. Figure 1a reveals that PC1 (42.6%) and PC2 (10.8%) capture most of the variability and separate the groups mainly along PC1, with well-differentiated centroids. The concentration ellipses indicate greater intra-group heterogeneity in the diabetic set.
In the oPLS-DA, metabolites with a Variable Importance in Projection (VIP) > 1.0 were prioritized. Subsequently, a Student's t-test and an FDR were performed to select metabolites that showed statistical significance (p-value < 0.05) in the comparison between the sampled groups, resulting in 39 relevant metabolites to explain the differences in the breast milk metabolome of healthy mothers and mothers with diabetes (Table 2). Figure 1b shows the performance of the oPLS-DA model. It adequately discriminated between both groups with a high predictive capacity (R2 Y = 0.973 and Q2 = 0.965). These results confirm the classification between the metabolomic profiles of breast milk from mothers with diabetes (GDM and/or T2D) and healthy mothers, indicating the existence of systematic alterations in the metabolite composition of the two sampled groups. The permutation test (Figure 1c) also supports the validity of the model to discriminate between diabetic and healthy mothers. The confidence ellipses [95%] showed homogeneous internal dispersion within each group, suggesting high consistency among the samples and good discriminant power of the model. Therefore, these results support the hypothesis that maternal diabetes alters the metabolomic profile of human milk, with possible implications for nutritional quality, metabolic signaling, and infant health.
The metabolites with the highest discriminant power are reported in Table 2. According to frequency, mainly amino acids, organic acids, acylcarnitines, phospholipids, bile acids, sugars, and fatty acids are reported; these compounds are derivatives of redox and microbial metabolism, which could function as potential biomarkers of metabolic alteration in GDM. The metabolites are reported from highest to lowest VIP. Additionally, the Fold Change is reported, and the last column shows in blue the compounds that are down regulated and in red the up regulated according to the relative abundance in the Diabetes vs. Healthy comparison.
2.2. Metabolic pathway analysis
The analysis of metabolic pathways altered in GDM was carried out in MetaboAnalyst based on the discriminating metabolites of said metabolic state. Figure 2 summarizes the altered pathways, the sub- or supra-regulation, and the interconnection among them. The circular nodes represent the metabolic pathways prioritized by the hits with the representative metabolites; the color scale indicates relevance (color intensity increases with relevance). The square nodes represent the metabolites that interconnect them. Three components are distinguished in the network. The first component involves amino acids and nitrogen metabolism, represented by the pathways: glycine, serine and threonine metabolism; alanine, aspartate and glutamate metabolism; cysteine and methionine metabolism; arginine and proline metabolism; histidine metabolism; nitrogen metabolism; D-amino acid metabolism; and arginine biosynthesis. The relevant metabolites found that interconnect these pathways are: L-Serine, L-Glutamine, L-Glutamate, and Urea. This core suggests a reprogramming of nitrogen flux and the carbon-nitrogen exchange. In GDM, nitrogen metabolism and branched-chain amino acid biosynthesis undergo milder changes, without marked protein catabolism, since a generalized anabolic environment prevails during pregnancy, although moderate imbalances may appear.
The second component relates to carbohydrates (lower-right module). The pathways represented in this component are: starch and sucrose metabolism; galactose metabolism; pentose and glucuronate interconversions; and glyoxylate and dicarboxylate metabolism. In GDM, the central axis of the problem is insulin resistance induced by placental hormones during pregnancy, which alters various metabolisms, but with less severity than T2D and generally in a transient manner. Starch and sucrose metabolism is also supra-regulated at the intestinal level, which increases postprandial blood glucose; however, the hepatic and muscular capacity to store glucose as glycogen is partially reduced due to insulin resistance. The connector metabolites: D-Glucose, Lactose, D-Xylose, Cellobiose. These pathways and metabolites could indicate adjustments in the catabolism of simple sugars and polysaccharide derivatives.
The third component includes lipids and fatty acids [upper-right module], represented by the pathways: fatty acid degradation; biosynthesis of unsaturated fatty acids; glycerolipid metabolism; and propanoate/butanoate metabolism (derivatives of beta-oxidation and fermentation). The connector metabolites are: Hexadecanoic acid [palmitate], omega-hydroxy fatty acid, and Glycerone (dihydroxyacetone), which link lipid degradation and remodeling with glycerolipid metabolism. Although lipogenesis may slightly decrease due to lower insulin efficacy, some pregnant women paradoxically exhibit an increase in lipid accumulation due to hormonal changes geared toward energy storage. The biosynthesis of unsaturated fatty acids may also be moderately sub-regulated. Regarding linoleic acid metabolism, it may be slightly altered, with a slight supra-regulation of inflammatory mediators derived from arachidonic acid predominating.
Other relevant links present in the model are Branched Chain Amino Acids (BCAA), (valine, leucine and isoleucine biosynthesis), to which the L-Threonine, 2-Oxobutanoate and L-Isoleucine pathways are articulated, indicating biosynthetic demand. Nicotinate and nicotinamide metabolism (redox cofactors) appear connected by Nicotinate, suggesting adaptation of the NAD+/NADH balance.
The presence of metabolites such as L-Serine, L-Glutamine, L-Glutamate, D-Glucose/Lactose, and C16/omega-hydroxy fatty acids indicates that the observed changes aren't isolated but rather affect nodes that redistribute carbon and nitrogen and coordinate energy, macromolecule synthesis, and redox signaling. The coupling between amino acid, carbohydrate, and lipid pathways suggests a systemic adjustment of central metabolism.
3. Discussion
Recent studies have shown that in mothers with gestational diabetes mellitus (GDM) or type 2 diabetes (T2D), the metabolomic composition of breast milk can be significantly altered [25]. These variations reflect changes in maternal metabolism and may influence the availability of nutrients and critical biochemical signals for infant development [26].
The metabolomic footprint observed in our study, when comparing breast milk from mothers with GDM or T2D versus healthy mothers, with increases in D-glucose, polyols [sorbitol, mannitol], lactose/organic acids (lactic, 3-hydroxybutyric), phosphate, saturated fatty acids (palmitic, stearic, myristic), monoacylglycerides, and a bias in amino acids [up arrow glutamate and isoleucine; downward arrow serine/alanine/threonine], is consistent with a hyperglycemic state with activation of the polyol pathway, lipolysis/ketogenesis, and insulin resistance, a pattern described in diabetes and, specifically, in the human milk of mothers with GDM. The activation of the polyol pathway explains the accumulation of sorbitol/mannitol and the subsequent osmotic/oxidative stress, a mechanism well-established in diabetic complications [25]. Convergent with this, BCAA (e.g., isoleucine) and their ketoacids (2-ketobutyric/2-ketocaproic) are associated with insulin resistance and mitochondrial overload; this relationship is supported by recent meta-analyses and reviews [27]. At the lipid level, the increase in saturated fatty acids (especially palmitic and stearic acid) forms a lipotoxic profile compatible with metabolic inflammation; studies of human milk and maternal cardiometabolic status support that the lipid composition of the milk reflects the cardiometabolic state [28]. Taken together, our data align with recent cohorts and meta-analyses demonstrating that GDM alters the milk metabolome and that certain milk metabolites are associated with infant growth trajectories, reinforcing the biological relevance of these alterations [25,29].
Since breast milk reflects the mother's systemic metabolic status, the identified metabolites were organized according to the main biochemical pathways involved. This analysis allows us to visualize how alterations in glucose metabolism cascade into amino acid utilization, lipid oxidation, and the generation of secondary compounds, providing a comprehensive overview of milk metabolism in diabetes.
Carbohydrates
Glucose, as the starting point for all metabolic dysregulation, is used in breast milk as a substrate for lactose synthesis. In this study, D-glucose showed a high discriminatory value and a significant difference in its relative abundance, indicating a pronounced increase in samples from mothers with diabetes compared to healthy mothers. This finding confirms the existence of a persistent hyperglycemic state and positions glucose as the main metabolic determinant in differentiating the milk profile associated with diabetes.
The mammary gland possesses active glucose regulation mechanisms that depend on specific transporters, including GLUT-1, the main mediator of glucose uptake into the alveolar epithelium. This system helps maintain a relative balance in milk glucose concentration, even in the face of systemic variations. However, in poorly controlled diabetes, this regulatory capacity can be overwhelmed [30]. According to Choi et al. women with any type of diabetes during pregnancy had significantly higher glucose levels in their breast milk compared to women without diabetes. However, the subgroup with GDM showed intermediate concentrations, lower than those of mothers with type 1 or type 2 diabetes, suggesting that metabolic control during pregnancy and lactation may partially mitigate the hyperglycemic impact on milk composition [31].
The sustained increase in glucose in the mammary microenvironment promotes the activation of alternative metabolic pathways aimed at reducing the intracellular excess of hexoses. Among these, the polyol pathway is one of the most relevant in the context of maternal hyperglycemia.
The significant increase in D-sorbitol and D-mannitol observed in samples from mothers with diabetes suggests the activation of the polyol pathway, a compensatory mechanism that converts excess glucose into sugar alcohols. In this pathway, aldose reductase catalyzes the reduction of glucose to sorbitol by consuming NADPH, while sorbitol dehydrogenase subsequently oxidizes sorbitol to fructose, generating NADH. Although this mechanism contributes to maintaining intracellular glucose homeostasis, its sustained activation under hyperglycemic conditions leads to oxidative stress, redox imbalance, and intracellular osmotic accumulation [32]. Sorbitol, in particular, has been described as a marker of endothelial and tissue dysfunction in insulin-sensitive tissues, and its increase in breast milk could reflect the metabolic overload of the mammary gland under a hyperglycemic environment. Mannitol, derived from the same metabolic axis, is considered an indirect indicator of polyol flux, and its increase has been associated with advanced glycation and oxidative damage. These changes, in addition to having implications for the osmotic stability of milk, could modify the bioavailability of fermentable carbohydrates for the infant microbiome, affecting the establishment of beneficial bacteria and early intestinal metabolism [25,26,33]. A case-control study involving 109 women [34] revealed that serum sorbitol concentrations were significantly higher in women with GDM compared to women without GDM. Every 1 standard deviation increase in sorbitol raised the risk of GDM by 155% (OR = 2.55, 95% CI 1.77-3.69). Furthermore, the same increase in sorbitol was related to a 52% higher risk of large-for-gestational-age (LGA) newborns (OR = 1.52, 95% CI 1.00-2.30) [34].
The disaccharides lactose and cellobiose also showed significant increases in samples from mothers with diabetes. Lactose, the main carbohydrate in human milk, depends on the intracellular availability of glucose and UDP-galactose, as well as the activity of the lactose synthase complex located in the Golgi apparatus. Their increase may reflect elevated glucose entry into the mammary gland or a compensatory dysregulation in carbohydrate synthesis under hyperglycemic conditions [26]. In parallel, cellobiose (a disaccharide derived from the partial hydrolysis of polysaccharides) has been detected in milk metabolomic profiles as a marker of oxidative or fermentative alterations, suggesting that its increase could be associated with secondary glucidic degradation processes due to oxidative stress or to microbial activity modulated by the maternal metabolic environment [35]. Collectively, these changes reinforce the idea of a shunted glucidic metabolism in the diabetic mammary gland, where the excess of energetic substrates is channeled toward the overproduction and accumulation of disaccharides.
In addition to these main metabolites, increases were observed in other simple sugars and sugar alcohols, such as erythritol, maltitol, and xylose, which reinforce the activation of alternative glucose pathways under a hyperglycemic environment.
Energy intermediates: lactate, 1,3-dihydroxyacetone, and phosphate
The significant increase in L-lactate is one of the most evident metabolic adaptations to excess available glucose. Under conditions of hyperglycemia and insulin resistance, pyruvate dehydrogenase (PDH) activity is inhibited by the accumulation of acetyl-CoA and NADH, diverting glycolytic flux toward the reduction of pyruvate to lactate by lactate dehydrogenase (LDH). This process, while allowing for NAD⁺ regeneration and the continuation of glycolysis, reflects an increasing dependence on anaerobic metabolism and a decrease in mitochondrial oxidative efficiency [36]. The elevated lactate levels observed in breast milk samples from mothers with diabetes could represent both a systemic biomarker of metabolic dysfunction and an indicator of local energy readjustment in the mammary gland, where lactogenesis demands a high consumption of ATP.
Additionally, the increase in 1,3-dihydroxyacetone (DHAP) (an intermediate in the reversal phase of glycolysis) suggests a partial blockage of the flow into the Krebs cycle and an accumulation of triose phosphates. This excess can fuel secondary pathways, such as the formation of glycerol-3-phosphate and lipid synthesis, contributing to ectopic lipogenesis and redox stress [26]. In breast milk, the increase in DHAP and its derivatives could reflect an alteration in the synthesis of glycerophospholipids and triglycerides, with a potential impact on the lipid composition of the milk fluid and its bioenergetic function [37].
Finally, the increase in phosphoric acid observed in parallel with these metabolites supports the hypothesis of high intracellular phosphorus turnover and sustained activation of ATP-dependent reactions. This increase is interpreted as a sign of high energy demand and bioenergetic stress, which translates into the activation of sensors such as AMPK and the modulation of metabolic signaling pathways involved in redox homeostasis [38,39]. Taken together, the alterations in lactate, DHAP, and phosphate reflect a metabolic reprogramming of the mammary gland, characterized by the prioritization of rapid glycolytic pathways at the expense of complete oxidation, a pattern consistent with the adaptive response to maternal hyperglycemia and with the energy changes typical of diabetes.
Amino Acids:
The results showed alterations in the profile of free amino acids and their derivatives, with significant increases in L-glutamic acid, L-isoleucine, 2-ketobutyric acid, and 2-ketocaproic acid, accompanied by a relative reduction in L-glutamine, L-serine, L-alanine, and L-threonine. This pattern reflects anaplerotic and mitochondrial reprogramming aimed at sustaining energy metabolism under an environment of hyperglycemia and oxidative stress. The increase in glutamate (one of the metabolites with the highest contribution to the discriminant model, high VIP, p < 0.001) indicates an activation of the glutamine–glutamate cycle, which acts as a compensatory pathway to maintain the redox balance and feed the Krebs cycle through α-ketoglutarate. In parallel, the decrease in glutamine can be attributed to its accelerated conversion to glutamate and an increased nitrogen requirement for the synthesis of non-essential amino acids, consistent with what is described in insulin resistance models [40,41].
The elevation of BCAA (particularly isoleucine and its catabolic products 2-ketobutyric acid and 2-ketocaproic acid) reinforces the evidence of alterations in protein homeostasis and mitochondrial oxidation. BCAA are catabolized in muscle and liver to generate acetyl-CoA and succinyl-CoA, feeding anaplerotic pathways of the Krebs cycle. In states of insulin resistance, the incomplete oxidation of BCAA leads to the accumulation of ketoacid intermediates and mitochondrial stress, phenomena that are associated with metabolic inflammation and lipotoxicity [42]. From a bioenergetic standpoint, 2-ketobutyric acid can alter parameters of substrate-level phosphorylation and the mitochondrial membrane potential, supporting the hypothesis of mitochondrial stress when these ketoacids accumulate; extrapolated to the mammary gland, this mechanism could contribute to the redox imbalance observed in hyperglycemic states, although direct studies in breast milk are lacking [43].
In contrast, the decrease in glucogenic amino acids such as alanine, serine, and threonine suggests their increased utilization in hepatic and renal gluconeogenesis, which is consistent with a catabolic state and accelerated substrate oxidation. Alanine actively participates in the glucose–alanine cycle, transporting amino groups from the muscle to the liver; its reduction reflects the shunting of protein metabolism toward the maintenance of glycemia. In diabetes models, an increase in hepatic alanine extraction and an overexpression of alanine aminotransferase (ALT2) have been demonstrated, reinforcing its role as a key substrate in altered gluconeogenesis [44]. Similarly, serine and threonine, precursors of pyruvate and glycerate, participate in the biosynthesis of membrane phospholipids and in the production of glutathione, a molecule essential for cellular redox balance; therefore, their decrease may contribute to the reduction of antioxidant capacity and amplify the oxidative stress previously described [45]. Collectively, these alterations reflect an anaplerotic reprogramming aimed at sustaining glucidic homeostasis at the expense of protein catabolism and the loss of reducing capacity in the mammary gland.
Among the identified metabolites, BCAA, especially L-isoleucine and its ketoacid intermediates (2-ketobutyric acid, 2-ketocaproic acid, and 3-methyl-2-oxobutanoic acid) showed significant increases in samples from diabetic mothers, suggesting an alteration of BCAA catabolism and a mitochondrial overload in the mammary gland. Under physiological conditions, BCAA are primarily oxidized in muscle and mammary tissue to support protein synthesis and energy production. However, in hyperglycemic and insulin-resistant states, their incomplete oxidation leads to the accumulation of derived ketoacids (Branched-Chain Keto Acids – BCKA), generating redox stress, mitochondrial dysfunction, and an increase in the production of reactive oxygen species [46]. Isoleucine, along with leucine and valine, has been recognized as an early metabolic biomarker of insulin resistance and impaired metabolic flexibility [47]. Its increased levels in breast milk may reflect reduced mitochondrial oxidation capacity in the mammary gland and impaired energy exchange between amino acids and fatty acids [48]. In parallel, elevated levels of 2-ketobutyric acid and 2-ketocaproic acid are consistent with an unbalanced anaplerotic flux and the activation of decarboxylation pathways that compromise the efficiency of the Krebs cycle. The accumulation of these keto acids has been described as an indicator of mitochondrial stress and impaired oxidative phosphorylation, which favors a pro-oxidant and pro-inflammatory state [49].
Likewise, the detection of L-norvaline, a structural analog of arginine, suggests a possible compensatory attempt by the mammary gland to modulate nitric oxide (NO) synthesis. Norvaline inhibits arginase, an enzyme that competes with nitric oxide synthase for arginine utilization, and its increase could represent an adaptive response to oxidative stress and metabolic inflammation induced by hyperglycemia [50]. Taken together, these findings outline a reprogramming of BCAA metabolism aimed at sustaining energy production under conditions of mitochondrial dysfunction, but at the cost of the accumulation of byproducts that exacerbate redox imbalance and local and systemic insulin resistance.
Lipids:
The results obtained show a consistent increase in medium and long-chain saturated fatty acids, particularly myristic acid (C14:0), palmitic acid (C16:0), and stearic acid [C18:0], along with monoacylglyceride derivatives such as 1-monopalmitin and 1-stearoyl-rac-glycerol. This pattern is characteristic of a state of increased lipolysis and incomplete betaoxidation, phenomena widely described in diabetes and in conditions of insulin resistance [25,51].
Under physiological conditions, saturated fatty acids are utilized by the mammary gland as energetic substrates and for the synthesis of triglycerides and milk phospholipids. However, the accumulation of saturated fatty acids in hyperglycemic states contributes to cellular lipotoxicity, characterized by mitochondrial dysfunction, increased response to excess reactive oxygen species (ROS), and activation of inflammatory pathways mediated by NF-κB and TLR4 [52]. In particular, palmitic acid has been identified as one of the main inducers of endoplasmic reticulum stress and insulin resistance in metabolically active tissues, and its increase in breast milk could reflect an alteration of the mammary gland's lipid metabolism in response to hyperglycemia [53].
The increase in monoacylglycerides (MAG) such as 1-monopalmitin and 1-stearoyl-rac-glycerol suggests an imbalance between triglyceride synthesis and degradation. In the mammary gland, MAG may result from the partial hydrolysis of triacylglycerides or from incomplete esterification, processes sensitive to the availability of glycerol-3-phosphate and NADPH [25]. The accumulation of these intermediates may interfere with lipid secretion into the milk and reflect a compensatory attempt to maintain the fluidity and energetic function of the milk fluid.
Additionally, the increase in 3-hydroxybutyric acid [beta-hydroxybutyrate] indicates greater fatty acid oxidation and active ketogenesis, consistent with a decrease in the utilization of glucose as an energy source. This mixed metabolic profile (elevated glucose and active ketogenesis) has been described in mothers with T2D and reflects a dual catabolic state, where peripheral hyperglycemia and compensatory lipid oxidation coexist [54]. Furthermore, 3-hydroxypropionic acid can be derived from the incomplete oxidation of propionate or BCAA, and its increase supports the existence of mitochondrial overload and redox imbalance in the mammary gland.
Thus, the alterations observed in fatty acids and their derivatives evidence an adjustment of lipid metabolism toward less efficient and more oxidizing pathways, which seek to compensate for the energetic deficit resulting from insulin resistance. This lipid profile is not only consistent with what is described in the plasma and tissues of mothers with diabetes but could also have implications for the composition and biochemical stability of breast milk, modulating the energy availability and the metabolic response of the infant.
Energy compounds and oxidative stress: ketones, organic acids, and redox cofactors
The presence of 3-hydroxybutyrate (β-hydroxybutyrate) at high concentrations indicates an intensified state of lipid oxidation and a decrease in the availability or utilization of glucose as an energy substrate [55]. This ketone body is the main product of hepatic β-oxidation during fasting or insulin resistance [56], and its increase in breast milk from mothers with diabetes reflects a metabolic transfer from the systemic ketogenic state to the mammary gland. In addition to its role as an energy source, 3-hydroxybutyrate acts as a signaling molecule that modulates the expression of antioxidant and anti-inflammatory genes by inhibiting histone deacetylases (HDACs) and activating PPARα [57]. However, persistently elevated concentrations may indicate a compensatory metabolic adaptation to mitochondrial dysfunction and excess circulating fatty acids, which is consistent with the profile of mothers with gestational and T2D [58].
The concomitant increase in 3-hydroxypropionate complements this pattern, as it is an intermediate in the catabolism of propionate and branched-chain amino acids, as well as in the incomplete oxidation of fatty acids. Its accumulation is associated with a state of mitochondrial overload, reflecting inefficient anaplerotic utilization of the citric acid cycle. Both metabolites (3-hydroxybutyrate and 3-hydroxypropionate) show an imbalance between the production and consumption of reducing equivalents (NADH/NAD⁺), consistent with the redox stress observed in hyperglycemic tissues [59,60].
Likewise, urea levels were found to be elevated, indicating activation of protein catabolism and the urea cycle, a process that intensifies in states of chronic hyperglycemia to eliminate excess nitrogen derived from amino acid turnover [61]. This adaptive response, while necessary to maintain nitrogen homeostasis, involves a high consumption of ATP and reducing equivalents, exacerbating energy and oxidative stress in the mammary gland [62].
On the other hand, the reduction of nicotinic acid [niacin], an essential precursor of NAD⁺ and NADP⁺, suggests a depletion of redox cofactors and a possible limitation in cellular antioxidant regeneration capacity. In diabetic states, the decrease in NAD⁺ affects multiple bioenergetic pathways, including fatty acid oxidation and the repair of oxidative damage [63]. This alteration could contribute to the mitochondrial dysfunction described previously, generating a vicious cycle of redox stress and energy depletion.
Finally, the increase in benzoic acid, an aromatic metabolite with antioxidant and detoxifying properties, could represent a compensatory ROS. This compound participates in conjugation with glycine and other amino acids for the elimination of oxidative byproducts, reinforcing the hypothesis of a glandular microenvironment subjected to persistent metabolic stress [64].
Taken together, this group of metabolites reflects an adaptive energy phenotype characterized by the activation of alternative catabolic pathways, increased ketogenesis, and altered redox balance. These modifications not only demonstrate the systemic impact of diabetes on the mammary gland but also suggest potential functional consequences for the bioenergetic and antioxidant quality of breast milk, with possible implications for early metabolic programming in infants.
4. Materials and Methods
4.1. Reagents
4.2. Breast Milk Sample Collection
Breast milk samples were collected at the Hospital Universitario San Jorge using sterile containers via manual expression. Lactating mothers between 7 and 28 days postpartum participated, and samples were collected from 8 mothers with diabetes and 16 without gestational diabetes. The samples were stored at -80°C until processing. All procedures complied with institutional ethical standards and approvals.
4.3. Metabolite extraction and derivatization
Sample processing was carried out at the MetCore laboratory of the University of the Andes (Colombia). Briefly, metabolites from the milk samples were extracted using methanol (MeOH) at -20°C and methyl tert-butyl ether (MTBE). Subsequently, the extracts were evaporated in a vacuum system (SpeedVac). Derivatization was performed using O-methoxylamine in pyridine, followed by the addition of BSTFA with 1% TMCS (trimethylchlorosilane).
4.4. Data acquisition by gas chromatography coupled to mass spectrometry (GC-QTOF).
Data acquisition was performed using a GC-QTOF system (Agilent 7890B) equipped with an electron ionization (EI) source operating at 70 eV. An Agilent J&W HP-5MS column (30 m × 0.25 mm × 0.25 μm) was used with helium as the carrier gas at a constant flow of 0.7 mL/min. The oven temperature program was: starting at 60 °C for 1 minute, increasing at 10°C/min up to 325°C, and holding at this temperature for 10 minutes. The temperature of the transfer line to the detector was 280°C, the ionization source was maintained at 230 °C, and the mass analyzer (quadrupole) at 150°C. Detection was performed in a mass range from 50 to 600 m/z, with an acquisition speed of 5 spectra per minute.
4.5. Data Processing
Data processing was carried out at the MetCore facilities, using automated algorithms for signal deconvolution, alignment, and mass extraction, via the MassHunter software. Metabolite identification was performed by comparison with the NIST and Fiehn libraries based on retention indices.
4.6. Data analysis
The data were normalized using the QC areas, followed by a logarithmic transformation and Pareto scaling. Subsequently, a Principal Component Analysis was performed to determine the variance explained by each component and to visualize the experimental groups, followed by a PERMANOVA to test the overall differences between the groups. Then, an Orthogonal Partial Least Squares Regression with Discriminant Analysis (oPLS-DA) was performed to prioritize the metabolites that exhibited differential behavior between the sampled groups and their behavior in terms of relative concentration between the groups. This model underwent cross-validation to determine the predictive capacity (Q2), the model fit (R2Y), and a permutation test (n=1000) to evaluate the model's performance. Once the metabolites with the greatest impact were prioritized, a Student's t-test was performed to determine the statistical significance of the prioritized metabolites. The False Discovery Rate and Fold Change were also determined for the discriminating metabolites. Once the differential metabolites were selected with high certainty, a metabolic pathway analysis was performed, prioritizing the Betweenness/Centrality parameters in the network topology. These analyses were performed using Metaboanalyst 6.0 software [65].
5. Conclusions
The metabolomic profile obtained reveals a profound interconnection between protein catabolism, lipotoxicity, and oxidative stress in the mammary gland of mothers with diabetes. The increase in BCAAs, their derived keto acids, and saturated fatty acids (palmitic, stearic, myristic) indicates mitochondrial overload and an unbalanced oxidative flux, accompanied by activation of the urea cycle and a decrease in redox cofactors (NAD⁺/NADP⁺). These findings suggest that the milk of mothers with diabetes not only reflects plasma alterations but also a local metabolic reprogramming aimed at maintaining energy homeostasis under hyperglycemic conditions, at the cost of a pro-oxidant and bioenergetically stressed environment. The increase in compounds such as urea, 3-hydroxypropionate, and benzoic acid reinforces the existence of compensatory detoxification and glycine conjugation mechanisms, indicative of a mammary microenvironment subjected to persistent metabolic stress.
The metabolites identified in this study suggest that maternal metabolic alterations transcend the physiology of the mammary gland and modify the functional composition of human milk, affecting its bioenergetic, antioxidant, and immunomodulatory potential. The coexistence of hyperglycemia, accelerated lipolysis, active ketogenesis, and redox stress could alter the bioavailability of essential nutrients and signaling metabolites for the infant. This scenario can impact early metabolic programming, influencing the child's energy flexibility and inflammatory response. Thus, maternal metabolism emerges as a key determinant of the functional and bioactive quality of milk, opening the possibility of designing personalized nutritional and intervention strategies aimed at restoring metabolic eubiosis during lactation in women with diabetes.
Finally, the findings outline a comprehensive metabolic reprogramming of the mammary gland, in which alterations in the glycolytic, anaplerotic, lipid, and oxidative pathways converge. This reorganization reflects a multifactorial mitochondrial adaptation to hyperglycemia, characterized by incomplete substrate oxidation, increased energy demand, and loss of redox balance. Far from being a passive organ, the mammary gland responds dynamically to the maternal metabolic load, adjusting its metabolism to prioritize milk synthesis and secretion even in an adverse environment. This study provides an integrative framework that redefines the understanding of mammary metabolism in diabetes, positioning breast milk as a molecular mirror of the maternal metabolic state and as a window into intergenerational metabolic prevention strategies.
Author Contributions
All authors actively and substantially contributed to the conceptualization, methodology, investigation, data analysis, original draft preparation, review and editing, and development of all sections of the research. Each author participated in the formulation, execution, and discussion of the work. The translation and grammatical style correction were done using AI. All authors have read and approved the final published version of the manuscript.
Funding
This research was funded by the Ministry of Science, Technology and Innovation [Minciencias], through Call 34 for doctoral internships, project number 99465, carried out at BIOS Colombia.
Institutional Review Board Statement
The study was conducted in accordance with the Declaration of Helsinki and approved by the Ethics Committee of Universidad Libre de Colombia AVAL N° 104.
Informed Consent Statement
Informed consent was obtained from all subjects involved in the study
Data Availability Statement
Due to bioethical restrictions and the sensitive nature of the research participants' data, the datasets generated and analyzed during this study are not publicly available. Researchers interested in access to the data may contact the corresponding author; however, data sharing will be subject to ethical approval and applicable regulations.
Acknowledgments
The authors thank Minciencias, BIOS, and Universidad Libre (Pereira) for funding the project. They also thank Hospital San Jorge de Pereira and Clínica Risaralda for their contributions to the clinical development of the project.
Conflicts of Interest
The authors declare no conflict of interest.
Abbreviations
The following abbreviations are used in this manuscript:
| ALT | Alanine Aminotransferase |
| AMPK | AMP-activated protein kinase |
| ATP | Adenosine Tryphosphate |
| BCAA | Branched Chain Amino Acids |
| BCKA | Branched-Chain Keto Acids |
| BSTFA | N,O-Bis[trimethylsilyl]trifluoroacetamide |
| DHAP | 1,3-dihydroxyacetone |
| EI | Electron ionization |
| FDR | False Discovery Rate |
| GC/MS-QTOF | Gas Chromatography Coupled to Mass Spectrometry |
| GDM | Gestational Diabetes Mellitus |
| GLUT | Glucose Transporter |
| HDAC | Histone Deacetylase |
| LDH | Lactate Dehydrogenase |
| LGA | Large for Getational Age |
| MAG | Monoacylglycerides |
| MeOH | Methanol |
| MTBE | Methyl tert-butyl ether |
| NAD+/NADH | Nicotinamide Adenine Dinucleotide oxidized/reduced form |
| NADP⁺/NADPH | Nicotinamide Adenine Dinucleotide Phosphate oxidized/reduced form |
| NF-κB | Nuclear Factor kappa-light-chain-enhancer of activated B cells |
| NO | Nitric Oxide |
| oPLS-DA | Orthogonal Partial Least Squares Regression with Discriminant Analysis |
| PPARα | Peroxisome Proliferator-Activated Receptor Alpha |
| PDH | Pyruvate Dehydrogenase |
| ROS | Reactive Oxygen Species |
| TLR | Toll-Like Receptor |
| TMCS | Trimethylchlorosilane |
| T2D | Type 2 Diabetes |
| UDP | Uridine Diphosphate |
| VIP | Variable Importance in Projection |
References
- Dessí A, Briana D, Corbu S, Gavrili S, Marincola FC, Georgantzi S, et al. Metabolomics of Breast Milk : The Importance of Phenotypes. Metabolites. 2018;1–10. [CrossRef]
- Cesare F, Dessì A, Corbu S, Reali A, Fanos V. Clinical impact of human breast milk metabolomics. Clinica Chimica Acta. 2015;451:103–6. [CrossRef]
- Abdelhamid ER, Kamhawy AH, Elkhatib AA, Megawer AS, El Shafie AI, El Gendy YG, et al. Breast milk macronutrients in relation to infants’ anthropometric measures. Open Access Maced J Med Sci. 2020;8:845–50. [CrossRef]
- Caba-Flores MD, Ramos-Ligonio A, Camacho-Morales A, Martínez-Valenzuela C, Viveros-Contreras R, Caba M. Breast Milk and the Importance of Chrononutrition. Front Nutr. 2022;9(May):3–10. [CrossRef]
- Andreas NJ, Kampmann B, Le-Doare KM. Human breast milk: A review on its composition and bioactivity. Early Hum Dev. 2015;91(11):629–35. [CrossRef]
- Deferm N, Dinh J, Pansari A, Jamei M, Abduljalil K. Postpartum changes in maternal physiology and milk composition: a comprehensive database for developing lactation physiologically-based pharmacokinetic models. Front Pharmacol. 2025;16. [CrossRef]
- Cheema AS, Stinson LF, Rea A, Lai CT, Payne MS, Murray K, et al. Human Milk Lactose, Insulin, and Glucose Relative to Infant Body Composition during Exclusive Breastfeeding. Nutrients. 2021;13(11). [CrossRef]
- Brunser Tesarschü O. Leche Materna: Efectos de los oligosacáridos de la leche materna en el crecimiento y desarrollo de los lactantes (Parte 3). Revista chilena de nutrición. 2019;46(5):644–52. [CrossRef]
- Gómez C, Pérez D, Bernal M, Periago M, Ros G. Compuestos funcionales de la leche materna. Enfermería Global. 2009;(16):1–14.
- Rios-Leyvraz M, Yao Q. Calcium, zinc, and vitamin D in breast milk: a systematic review and meta-analysis. Int Breastfeed J. 2023;18(1):1–14. [CrossRef]
- Keikha M, Shayan-Moghadam R, Bahreynian M, Kelishadi R. Nutritional supplements and mother’s milk composition: a systematic review of interventional studies. Int Breastfeed J. 2021;16(1):1–30. [CrossRef]
- Xi Y, Wang X, Liu K, Zhang H, Ren X, Zhao A, et al. Vitamin E concentration in breast milk in different periods of lactation: Meta-analysis. Front Nutr. 2022;9. [CrossRef]
- Beulens JWJ, Booth SL, van den Heuvel EGHM, Stoecklin E, Baka A, Vermeer C. The role of menaquinones (vitamin K 2 ) in human health. British Journal of Nutrition. 2013;110(8):1357–68. [CrossRef]
- Manganaro R, Marseglia L, Mamì C, Palmara A, Paolata A, Loddo S, et al. Breast milk sodium concentration, sodium intake and weight loss in breast-feeding newborn infants. British Journal of Nutrition. 2007;97(2):344–8. [CrossRef]
- Rennie JM, Kendall GS. Metabolic Disorders. In: Press C, editor. A Manual of Neonatal Intensive Care. 6th ed. Boca Raton: CRC Press; 2025. p. 17. [CrossRef]
- Giuffrida F, Fleith M, Goyer A, Samuel TM, Elmelegy-Masserey I, Fontannaz P, et al. Human milk fatty acid composition and its association with maternal blood and adipose tissue fatty acid content in a cohort of women from Europe. Eur J Nutr. 2022;61(4):2167–82. [CrossRef]
- Rio-Aige K, Azagra-Boronat I, Castell M, Selma-Royo M, Collado MC, Rodríguez-Lagunas MJ, et al. The Breast Milk Immunoglobulinome. Nutrients. 2021;13(6):1810. 10.3390/nu13061810.
- Kowalczyk P, Kaczyńska K, Kleczkowska P, Bukowska-Ośko I, Kramkowski K, Sulejczak D. The Lactoferrin Phenomenon—A Miracle Molecule. Molecules. 2022;27(9):2941. [CrossRef]
- Okburan G, Kızıler S. Human milk oligosaccharides as prebiotics. Pediatr Neonatol. 2023;64(3):231–8. [CrossRef]
- Pérez-Escamilla R, Buccini GS, Segura-Pérez S, Piwoz E. Perspective: Should Exclusive Breastfeeding Still Be Recommended for 6 Months? Advances in Nutrition. 2019;10(6):931–43. [CrossRef]
- Gómez-Gallego C, Morales JM, Monleón D, Du Toit E, Kumar H, Linderborg KM, et al. Human Breast Milk NMR Metabolomic Profile across Specific Geographical Locations and Its Association with the Milk Microbiota. Nutrients. 2018;10(10):1355. [CrossRef]
- Ares Segura S, Arena Ansótegui J, Díaz-Gómez NM. La importancia de la nutrición materna durante la lactancia, ¿necesitan las madres lactantes suplementos nutricionales? An Pediatr (Engl Ed). 2016;84(6):347.e1-347.e7. [CrossRef]
- Bardanzellu F, Fanos V, Reali A. Omics in human colostrum and mature milk: Looking to old data with new eyes. Nutrients. 2017;9(8). [CrossRef]
- Sosa-Castillo E, Rodríguez-Cruz M, Moltó-Puigmartí C. Genomics of lactation: role of nutrigenomics and nutrigenetics in the fatty acid composition of human milk. Br J Nutr. 2017;118(3):161–8. [CrossRef]
- Nagel EM, Peña A, Dreyfuss JM, Lock EF, Johnson KE, Lu C, et al. Gestational Diabetes, the Human Milk Metabolome, and Infant Growth and Adiposity. JAMA Netw Open. 2024;7(12):e2450467. [CrossRef]
- Wu Y, Yu J, Liu X, Wang W, Chen Z, Qiao J, et al. Gestational diabetes mellitus-associated changes in the breast milk metabolome alters the neonatal growth trajectory. Clinical Nutrition. 2021;40(6):4043–54. [CrossRef]
- De Bandt JP, Coumoul X, Barouki R. Branched-Chain Amino Acids and Insulin Resistance, from Protein Supply to Diet-Induced Obesity. Nutrients. 2022;15(1):68. [CrossRef]
- Scime N V, Turner S, Miliku K, Simons E, Moraes TJ, Field CJ, et al. Association of Human Milk Fatty Acid Composition with Maternal Cardiometabolic Diseases: An Exploratory Prospective Cohort Study. Breastfeed Med. 2024;19(5):357–67. [CrossRef]
- Fradet A, Berthiaume L, Laroche LA, Dugas C, Perron J, Doyen A, et al. Variations in Human Milk Metabolites After Gestational Diabetes: Associations with Infant Growth. Nutrients. 2025;17(9). [CrossRef]
- Zhao FQ. Biology of Glucose Transport in the Mammary Gland. J Mammary Gland Biol Neoplasia. 2014;19(1):3–17. [CrossRef]
- Choi Y, Nagel EM, Kharoud H, Johnson KE, Gallagher T, Duncan K, et al. Gestational Diabetes Mellitus Is Associated with Differences in Human Milk Hormone and Cytokine Concentrations in a Fully Breastfeeding United States Cohort. Nutrients. 2022;14(3):1–14. [CrossRef]
- Srikanth KK, Orrick JA. Biochemistry, Polyol Or Sorbitol Pathways. 2022 Nov 14. In: StatPearls [Internet]. Treasure Island (FL): StatPearls Publishing; 2025 Jan–. PMID: 35015406.
- Fradet A, Berthiaume L, Laroche LA, Dugas C, Perron J, Doyen A, et al. Variations in Human Milk Metabolites After Gestational Diabetes: Associations with Infant Growth. Nutrients. 2025;17(9):1466. [CrossRef]
- Li X, Liu Y, Qi Y, Wu Y, Wang M, Gao J, et al. Maternal Serum Polyols and Its Link to Gestational Diabetes Mellitus: A Population-Based Nested Case-Control Study. J Clin Endocrinol Metab. 2024;109(7):1858–65. [CrossRef]
- Saben JL, Sims CR, Piccolo BD, Andres A. Maternal adiposity alters the human milk metabolome: associations between nonglucose monosaccharides and infant adiposity. Am J Clin Nutr. 2020;112(5):1228–39. [CrossRef]
- Kim MJ, Lee H, Chanda D, Thoudam T, Kang HJ, Harris RA, et al. The Role of Pyruvate Metabolism in Mitochondrial Quality Control and Inflammation. Mol Cells. 2023;46(5):259–67. [CrossRef]
- Pelley JW. Glycolysis and Pyruvate Oxidation. In: Elsevier’s Integrated Biochemistry. Elsevier; 2007. p. 47–53. [CrossRef]
- Hardie DG. AMP-activated protein kinase—an energy sensor that regulates all aspects of cell function. Genes Dev. 2011;25(18):1895–908. [CrossRef]
- Ke R, Xu Q, Li C, Luo L, Huang D. Mechanisms of AMPK in the maintenance of ATP balance during energy metabolism. Cell Biol Int. 2018;42(4):384–92. [CrossRef]
- Dollet L, Kuefner M, Caria E, Rizo-Roca D, Pendergrast L, Abdelmoez AM, et al. Glutamine Regulates Skeletal Muscle Immunometabolism in Type 2 Diabetes. Diabetes. 2022;71(4):624–36. [CrossRef]
- Hristov M, Nankova A, Andreeva-Gateva P. Alterations of the glutamatergic system in diabetes mellitus. Metab Brain Dis. 2023;39(2):321–33. [CrossRef]
- Wang X, Zhang Y, Zheng W, Wang J, Wang Y, Song W, et al. Dynamic changes and early predictive value of branched-chain amino acids in gestational diabetes mellitus during pregnancy. Front Endocrinol (Lausanne). 2022;13. [CrossRef]
- Bui D, Ravasz D, Chinopoulos C. The Effect of 2-Ketobutyrate on Mitochondrial Substrate-Level Phosphorylation. Neurochem Res. 2019;44(10):2301–6. [CrossRef]
- Holeček M. Origin and Roles of Alanine and Glutamine in Gluconeogenesis in the Liver, Kidneys, and Small Intestine under Physiological and Pathological Conditions. Int J Mol Sci. 2024;25(13):7037. [CrossRef]
- Adnan Khalaf M, Ghassan Zainal I. Investigation of Antioxidant Markers in Diabetic Patients. Arch Razi Inst. 2021;76(5):1453–60. [CrossRef]
- Bo T, Fujii J. Primary Roles of Branched Chain Amino Acids (BCAAs) and Their Metabolism in Physiology and Metabolic Disorders. Molecules. 2024;30(1):56. [CrossRef]
- Arjmand B, Ebrahimi Fana S, Ghasemi E, Kazemi A, Ghodssi-Ghassemabadi R, Dehghanbanadaki H, et al. Metabolic signatures of insulin resistance in non-diabetic individuals. BMC Endocr Disord. 2022;22(1):212. [CrossRef]
- De Luca A, Hankard R, Alexandre-Gouabau MC, Ferchaud-Roucher V, Darmaun D, Boquien CY. Higher concentrations of branched-chain amino acids in breast milk of obese mothers. Nutrition. 2016;32(11–12):1295–8. [CrossRef]
- Vanweert F, Schrauwen P, Phielix E. Role of branched-chain amino acid metabolism in the pathogenesis of obesity and type 2 diabetes-related metabolic disturbances BCAA metabolism in type 2 diabetes. Nutr Diabetes. 2022;12(1):35. [CrossRef]
- Ren Y, Li Z, Li W, Fan X, Han F, Huang Y, et al. Arginase: Biological and Therapeutic Implications in Diabetes Mellitus and Its Complications. Oxid Med Cell Longev. 2022;2022:2419412. [CrossRef]
- Ito A. Lipid metabolic reprogramming in immune regulation and chronic inflammatory diseases. Endocr J. 2025;72(9):EJ25-0180. [CrossRef]
- Khoi CS, Lin TY, Chiang CK. Targeting Insulin Resistance, Reactive Oxygen Species, Inflammation, Programmed Cell Death, ER Stress, and Mitochondrial Dysfunction for the Therapeutic Prevention of Free Fatty Acid-Induced Vascular Endothelial Lipotoxicity. Antioxidants. 2024;13(12):1486. [CrossRef]
- Vidrio-Huerta B, Plötz T, Lortz S. Oxidative and ER stress by elevated insulin biosynthesis and palmitic acid in insulin-producing cells. J Mol Endocrinol. 2023;72(2). [CrossRef]
- Ruze R, Liu T, Zou X, Song J, Chen Y, Xu R, et al. Obesity and type 2 diabetes mellitus: connections in epidemiology, pathogenesis, and treatments. Front Endocrinol (Lausanne). 2023;14. [CrossRef]
- Mierziak J, Burgberger M, Wojtasik W. 3-Hydroxybutyrate as a Metabolite and a Signal Molecule Regulating Processes of Living Organisms. Biomolecules. 2021;11(3):402. [CrossRef]
- Fernandes GW, Bocco BMLC. Hepatic Mediators of Lipid Metabolism and Ketogenesis: Focus on Fatty Liver and Diabetes. Curr Diabetes Rev. 2021;17(7). [CrossRef]
- He Y, Cheng X, Zhou T, Li D, Peng J, Xu Y, et al. β-Hydroxybutyrate as an epigenetic modifier: Underlying mechanisms and implications. Heliyon. 2023;9(11):e21098. [CrossRef]
- Olsson DGE. Mitochondrial ß-oxidation disorders : from screening to diagnosis, fasting metabolism and optimized treatment. 2024. [CrossRef]
- Matsakas L, Hrůzová K, Rova U, Christakopoulos P. Biological Production of 3-Hydroxypropionic Acid: An Update on the Current Status. Fermentation. 2018;4(1):13. [CrossRef]
- Vardar Acar N, Özgül RK. The Role of Cellular Stress, Antioxidant System Response, Mitochondrial Function, and Metabolic Alterations in the Pathophysiology of Propionic Acidemia: A Systematic Review. J Cell Physiol. 2025;240(8). [CrossRef]
- Kajani S, Laker RC, Ratkova E, Will S, Rhodes CJ. Hepatic glucagon action: beyond glucose mobilization. Physiol Rev. 2024;104(3):1021–60. [CrossRef]
- Schimmel P, Kleinjans L, Bongers RS, Knol J, Belzer C. Breast milk urea as a nitrogen source for urease positive Bifidobacterium infantis. FEMS Microbiol Ecol. 2021;97(3). [CrossRef]
- Chini CCS, Zeidler JD, Kashyap S, Warner G, Chini EN. Evolving concepts in NAD+ metabolism. Cell Metab. 2021;33(6):1076–87. [CrossRef]
- Irwin C, van Reenen M, Mason S, Mienie LJ, Westerhuis JA, Reinecke CJ. Contribution towards a Metabolite Profile of the Detoxification of Benzoic Acid through Glycine Conjugation: An Intervention Study. Krishnan V V, editor. PLoS One. 2016;11(12):e0167309. [CrossRef]
- Pang Z, Lu Y, Zhou G, Hui F, Xu L, Viau C, et al. MetaboAnalyst 6.0: towards a unified platform for metabolomics data processing, analysis and interpretation. Nucleic Acids Res. 2024;52(W1):W398–406. [CrossRef]
Figure 1.
[a] Biplot Principal Component Analysis. [b] OPLS-DA model performance. [c] oPLS-DA Permutation test.
Figure 1.
[a] Biplot Principal Component Analysis. [b] OPLS-DA model performance. [c] oPLS-DA Permutation test.
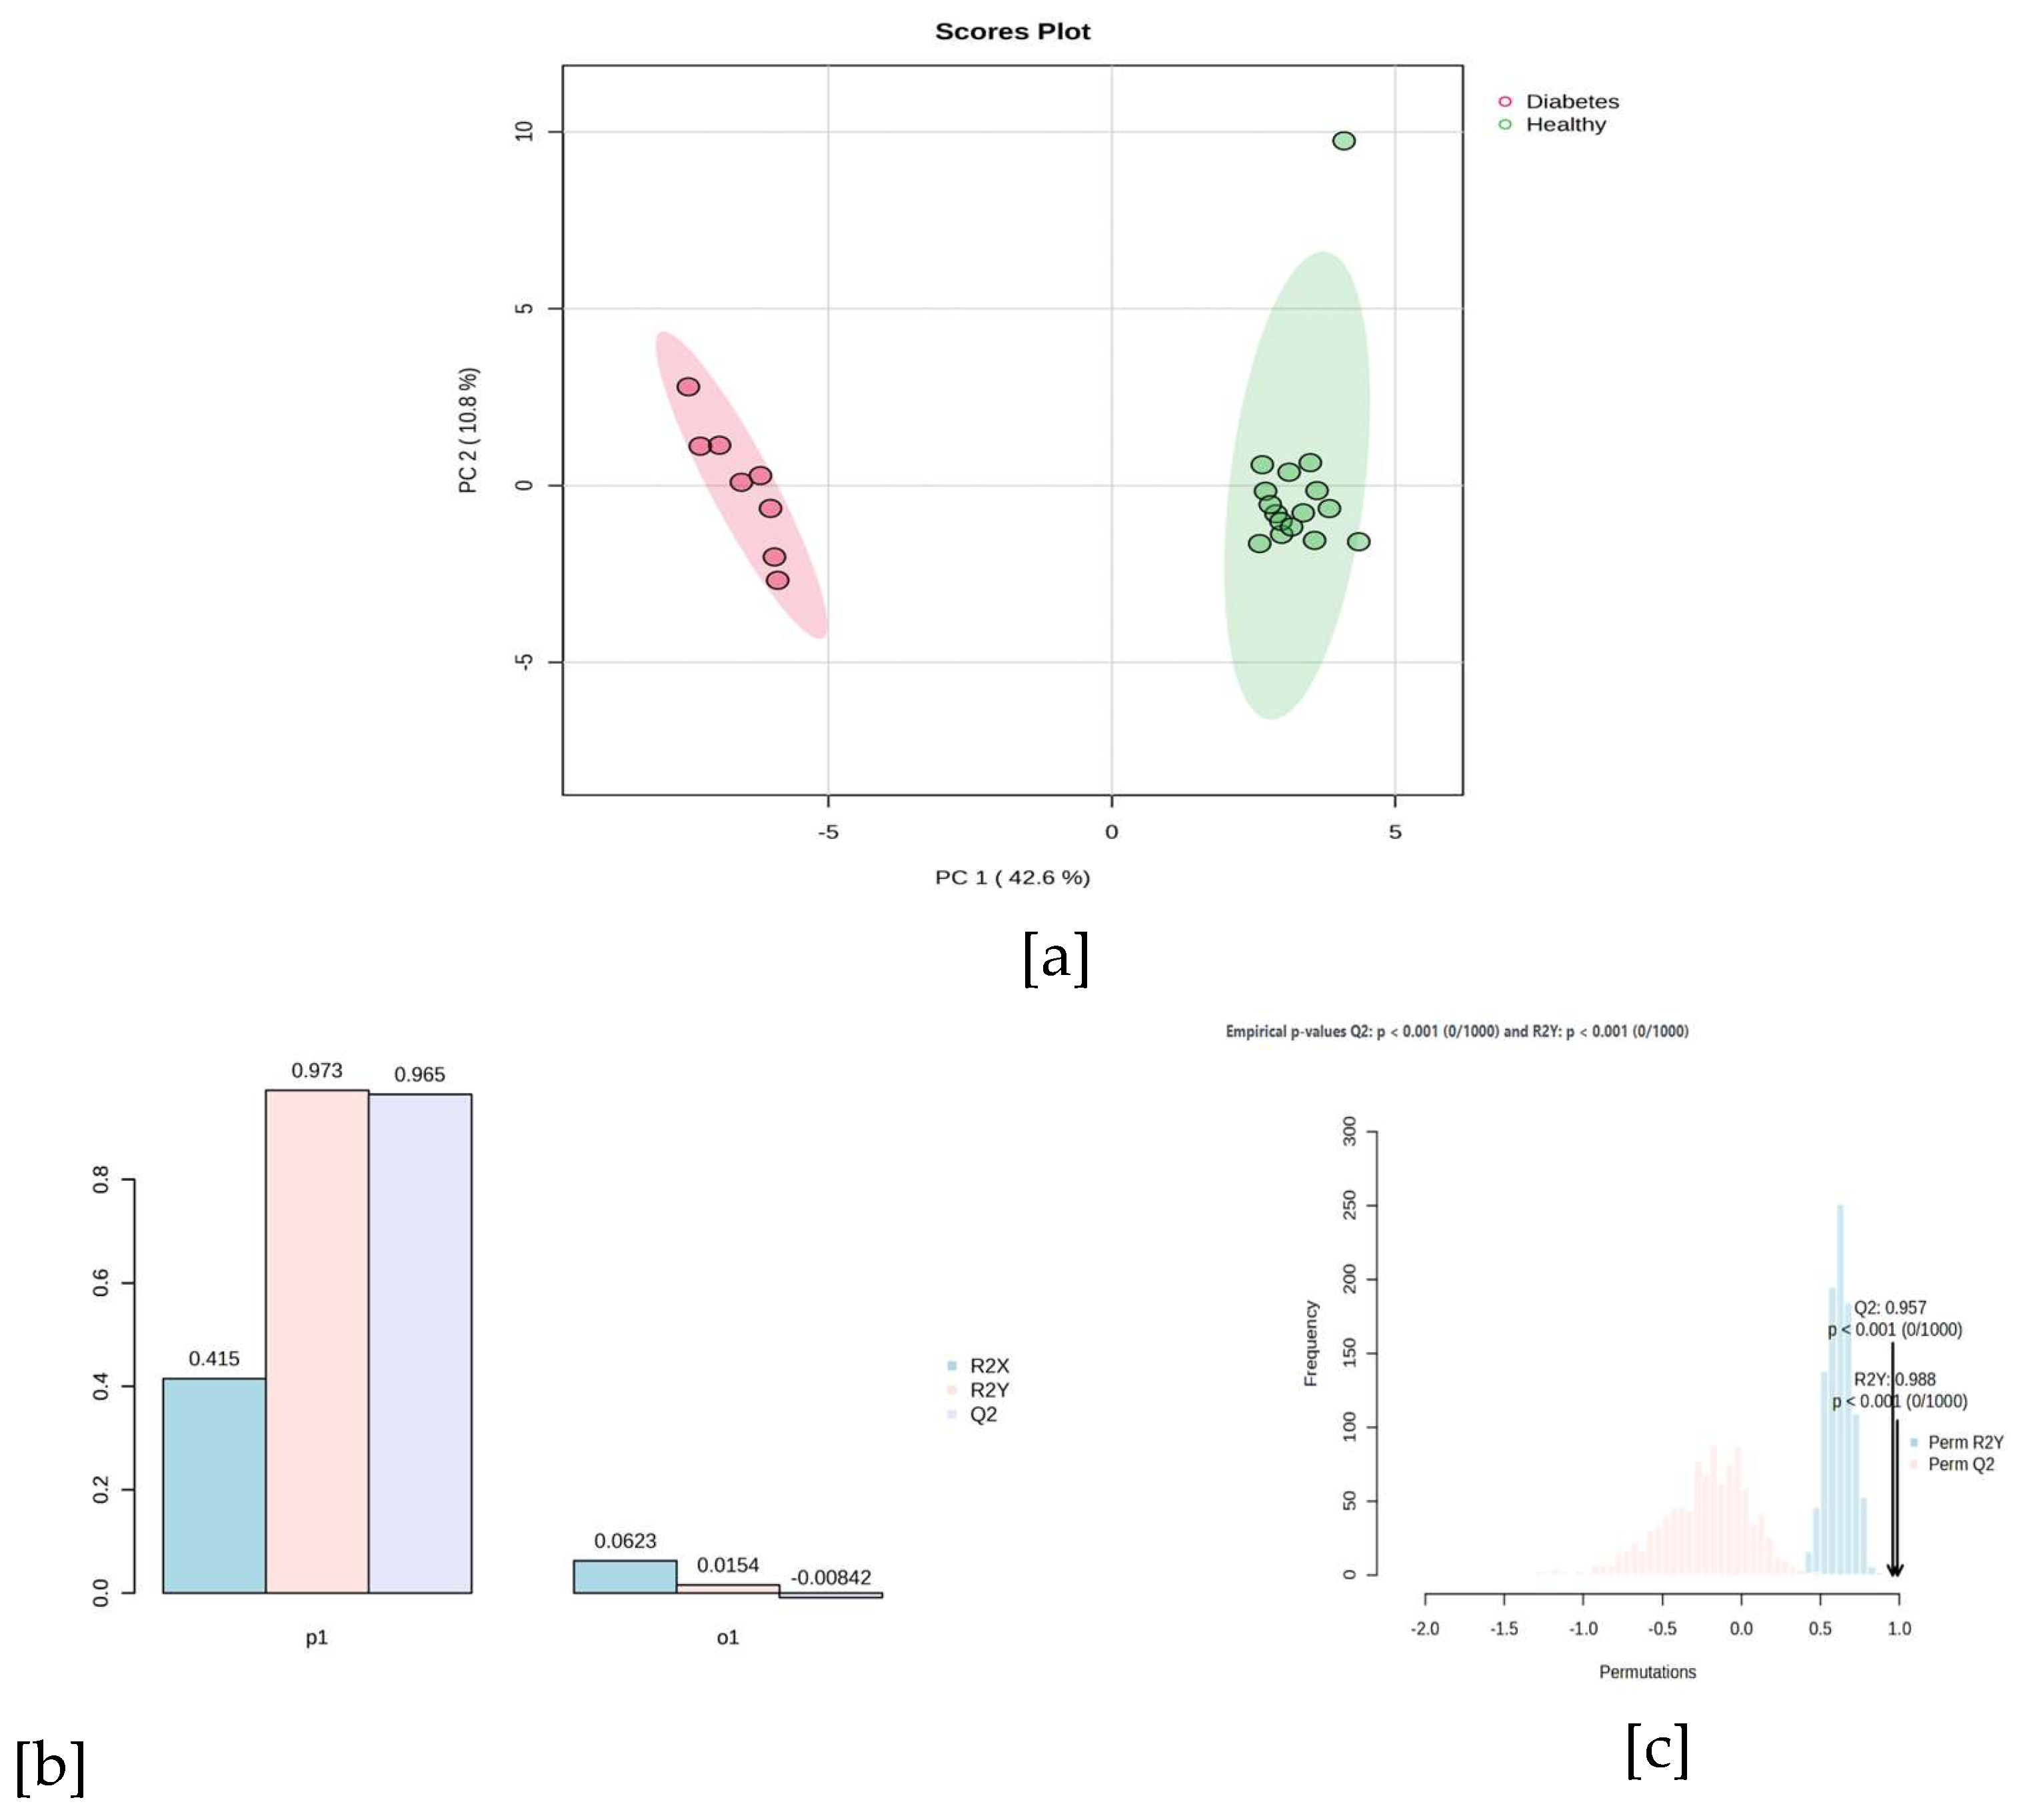
Figure 2.
Network of metabolic pathways and representative metabolites in breast milk from mothers with gestational diabetes mellitus and healthy mothers.
Figure 2.
Network of metabolic pathways and representative metabolites in breast milk from mothers with gestational diabetes mellitus and healthy mothers.
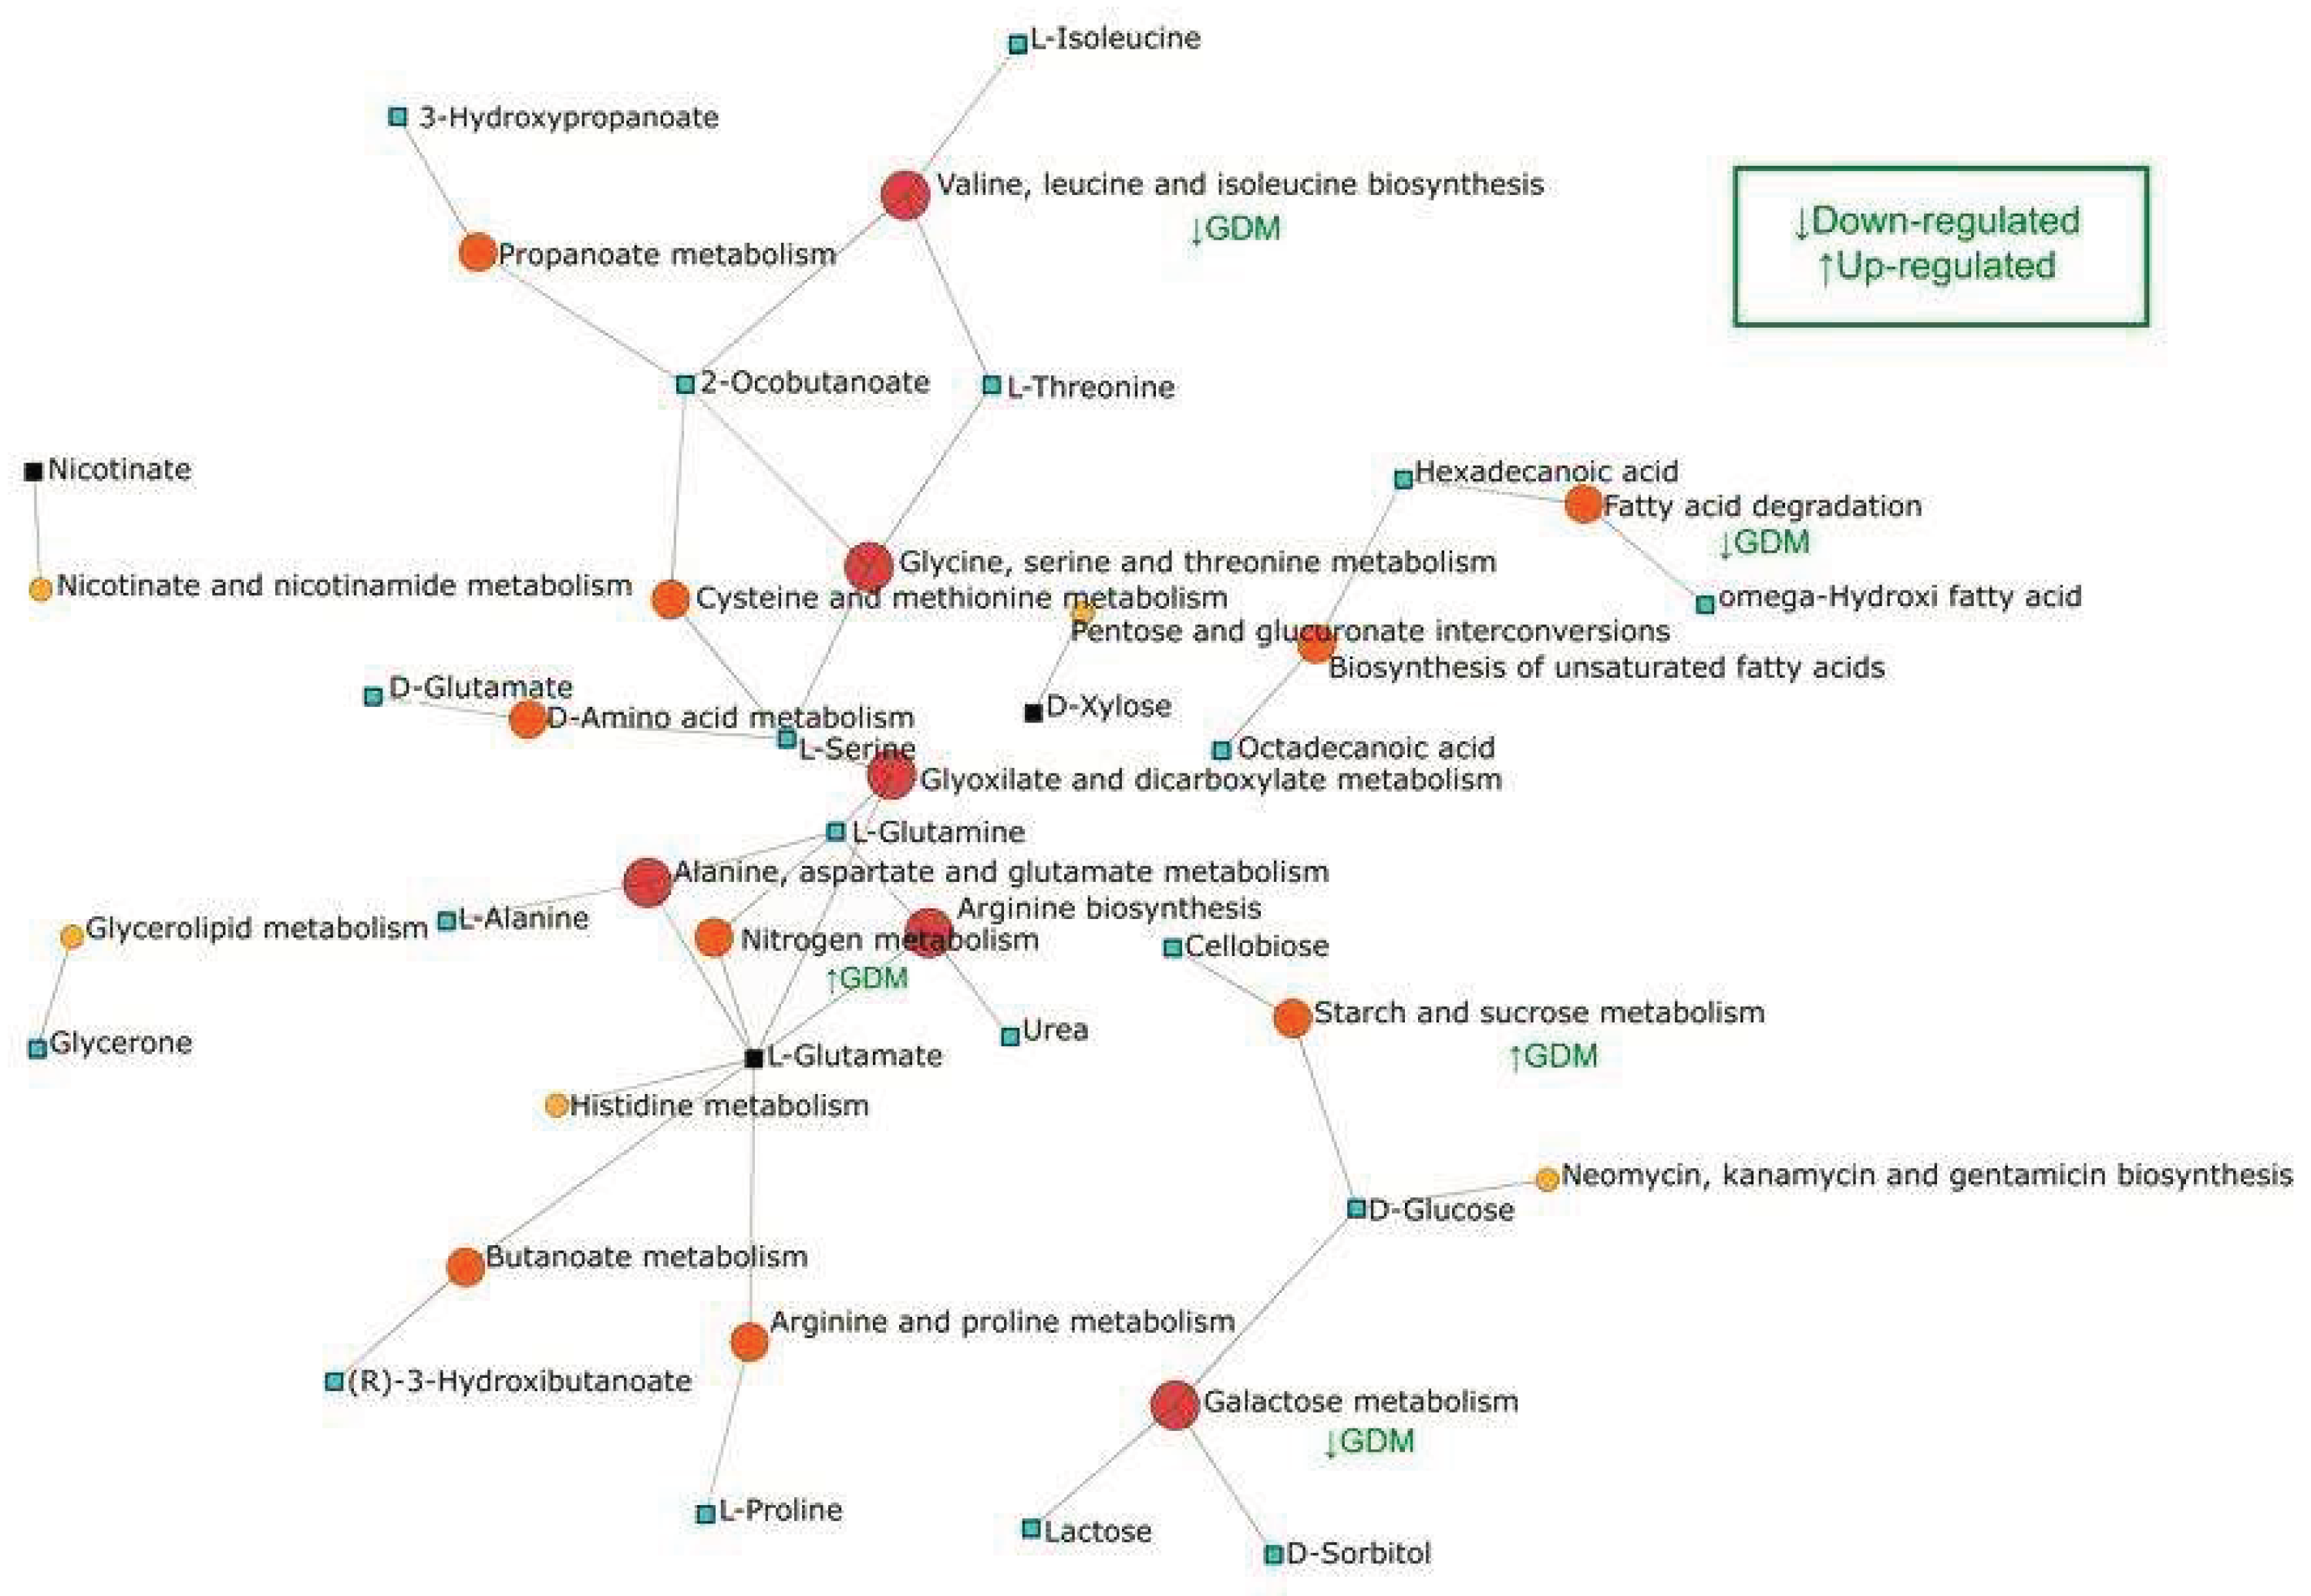

Table 1.
General composition of breast milk according to maturation time.
| Component | Colostrum (0−5 days) | Transitional Milk (6−15 days) | Mature Milk (≥15 days) | Reference |
| Proteins (g/100 mL) | 2.0−2.5 (IgA, lactoferrin, and albumin predominate) | 1.2−1.5 (casein increases, maintains immune proteins) | 0.8−1.2 (40% casein - 60% whey) | [5,8,9] |
| Carbohydrates (g/100 mL) | 5.5−6.0 (80−85% lactose, stimulates bifidobacteria) | 7.0−8.0 (lactose predominates, favors brain development) | 6.7−7.5 (85−90% lactose, main energy source) | [5,8,9] |
| Fats (g/100 mL) | 2.0−3.0 (high content of essential fatty acids) | 3.0−4.0 (increase in DHA and AA for neuronal development) | 3.5−4.5 (balance of saturated, monounsaturated, and polyunsaturated fats) | [5,8,9] |
| Vitamin A (μg/100 mL) | 200−400 (high in beta-carotenes, protects vision and mucous membranes) | 100−200 (decreases as immunological function stabilizes) | 50−80 (sufficient to meet baby's needs) | [5,8,9] |
| Vitamin D (μg/100 mL) | 0.5−1.0 (depends on maternal sun exposure) | 0.5−0.8 (maintains stable levels) | 0.4−1.0 (supports calcium absorption and bone mineralization) | [10] |
| Vitamin C (mg/100 mL) | 5−15 (favors iron absorption and immune development) | 4−10 (stabilizes as initial oxidative stress decreases) | 4−10 (supports antioxidant functions and collagen production) | [11] |
| Vitamin E (mg/100 mL) | 2.0−3.0 (highest concentration to protect against oxidative stress) | 1.0−2.0 (decreases, but maintains antioxidant support) | 0.5−1.5 (lower concentration, sufficient for baby's needs) | [12] |
| Vitamin K (μg/100 mL) | 2.0−5.0 (fundamental for coagulation initiation) | 1.5−2.5 (decreases slightly) | 1.0−1.5 (stable levels for coagulation) | [13] |
| Sodium (mg/100 mL) | 60−90 (necessary for initial water balance) | 50−60 (decreases as the renal system matures) | 15−30 (adequate levels to maintain homeostasis) | [14] |
| Potassium (mg/100 mL) | 50−70 (support for electrolyte balance and cellular function) | 60−75 (increases with metabolic demands) | 55−70 (maintains neuromuscular homeostasis and cellular function) | [15] |
| Calcium (mg/100 mL) | 20−30 (bioavailable for initial bone development) | 25−40 (increases due to growth demands) | 25−35 (stable for continuous bone development) | [10] |
| Iron (mg/100 mL) | 0.5−1.0 (high bioavailability of 50−70%) | 0.4−0.6 (sufficient to meet hematological needs) | 0.2−0.4 (bioavailable thanks to lactoferrin) | [16] |
| Zinc (mg/100 mL) | 2−4 (essential for initial growth and immune function) | 1−2 (adjusts to baby's accelerated growth) | 0.3−1.2 (fundamental for cellular and enzymatic development) | [10] |
| Secretory IgA (mg/mL) | 5−6 (protects respiratory and digestive mucous membranes) | 2−3 (progressively decreases) | 1−2 (maintains basic immunological protection) | [17] |
| Lactoferrin (mg/mL) | 4−5 (inhibits pathogens and improves iron absorption) | 2−3 (decreases, but remains present at functional levels) | 1−2 (supports intestinal immunity) | [18] |
| Oligosaccharides (g/100 mL) | 1.5−2.0 (act as prebiotics and protect against pathogens) | 1.3−1.5 (remain stable) | 1.3−1.5 (favor healthy microbiota) | [19] |
Table 2.
Differential metabolites between mothers with gestational diabetes mellitus and healthy mothers.
Table 2.
Differential metabolites between mothers with gestational diabetes mellitus and healthy mothers.
| Compound | Quant Ion | Retention Time | VIP | p-Value (t-test) | FDR | Fold Change | Relative abundance* | |
|---|---|---|---|---|---|---|---|---|
| Diabetes | Healthy | |||||||
| L-threonine | 182.10 | 10.40 | 2.98 | 1.52E-06 | 1.65E-05 | 0.27 | -1 | 1 |
| Cellobiose | 204.10 | 24.47 | 2.24 | 3.62E-06 | 2.53E-05 | 9274.00 | 1 | -1 |
| Lactose | 308.81 | 24.31 | 2.09 | 1.07E-05 | 5.30E-05 | 8500.90 | 1 | -1 |
| Urea | 189.09 | 9.51 | 2.07 | 2.53E-06 | 2.16E-05 | 8447.50 | 1 | -1 |
| 2-Ketobutyric acid | 89.04 | 7.36 | 2.01 | 3.31E-08 | 6.57E-07 | 7399.20 | 1 | -1 |
| Phosphoric acid | 299.07 | 10.14 | 1.80 | 3.14E-05 | 1.29E-04 | 28.28 | 1 | -1 |
| 1,3-dihydroxyacetone | 100.08 | 9.48 | 1.79 | 2.72E-06 | 2.16E-05 | 0.24 | -1 | 1 |
| L-serine | 131.09 | 9.66 | 1.76 | 5.95E-06 | 3.37E-05 | 0.29 | -1 | 1 |
| β-glutamic acid | 163.76 | 13.41 | 1.69 | 6.95E-06 | 3.76E-05 | 0.31 | -1 | 1 |
| 1-stearoyl-rac-glycerol | 399.33 | 24.95 | 1.59 | 1.44E-05 | 6.87E-05 | 0.20 | -1 | 1 |
| L-Norvaline | 144.12 | 9.29 | 1.56 | 5.13E-05 | 1.97E-04 | 0.23 | -1 | 1 |
| Benzoic acid | 179.05 | 9.70 | 1.54 | 9.35E-06 | 4.84E-05 | 43.53 | 1 | -1 |
| Nicotinic acid | 180.05 | 10.35 | 1.54 | 2.61E-07 | 4.44E-06 | 0.00 | -1 | 1 |
| 1-Monopalmitin | 371.30 | 23.54 | 1.52 | 1.96E-02 | 4.02E-02 | 9.53 | 1 | -1 |
| L-glutamic acid | 163.76 | 13.41 | 1.49 | 2.09E-06 | 2.07E-05 | 13.56 | 1 | -1 |
| glycolic acid | 177.08 | 7.17 | 1.44 | 3.92E-07 | 5.84E-06 | 0.14 | -1 | 1 |
| 3-methyl-2-oxobutanoic acid | 75.03 | 7.60 | 1.41 | 5.41E-06 | 3.36E-05 | 5737.10 | 1 | -1 |
| L-glutamine | 155.11 | 13.22 | 1.41 | 4.21E-06 | 2.78E-05 | 0.30 | -1 | 1 |
| L-Glutamic acid | 163.76 | 13.41 | 1.41 | 2.16E-04 | 7.34E-04 | 0.21 | -1 | 1 |
| L-Isoleucine | 122.12 | 8.67 | 1.39 | 9.38E-04 | 2.86E-03 | 0.28 | -1 | 1 |
| Glutaconic acid | 133.05 | 11.82 | 1.38 | 4.98E-05 | 1.97E-04 | 0.20 | -1 | 1 |
| Palmitic acid | 312.25 | 18.88 | 1.38 | 4.02E-04 | 1.29E-03 | 31.03 | 1 | -1 |
| D-glucose | 319.16 | 17.97 | 1.38 | 3.97E-04 | 1.29E-03 | 189.43 | 1 | -1 |
| Erythritol | 103.06 | 12.92 | 1.37 | 2.20E-05 | 9.37E-05 | 0.20 | -1 | 1 |
| D-Mannitol | 205.11 | 17.61 | 1.35 | 2.57E-06 | 2.16E-05 | 80.28 | 1 | -1 |
| N-acetyl-D-mannosamine | 204.10 | 19.06 | 1.30 | 2.99E-06 | 2.23E-05 | 0.12 | -1 | 1 |
| Myristic acid | 284.22 | 16.65 | 1.25 | 1.22E-06 | 1.45E-05 | 99.69 | 1 | -1 |
| L-threonine | 182.10 | 10.40 | 1.25 | 1.35E-04 | 4.73E-04 | 0.25 | -1 | 1 |
| L-Lactic acid | 191.09 | 6.96 | 1.23 | 1.81E-05 | 7.97E-05 | 706.38 | 1 | -1 |
| 2-ketocaproic acid | 73.05 | 9.51 | 1.22 | 5.64E-06 | 3.36E-05 | 4784.60 | 1 | -1 |
| Stearic acid | 341.29 | 20.66 | 1.17 | 3.10E-10 | 3.69E-08 | 3974.50 | 1 | -1 |
| D-sorbitol | 268.15 | 16.98 | 1.17 | 6.37E-10 | 3.79E-08 | 39.74 | 1 | -1 |
| Maltitol | 361.17 | 25.40 | 1.16 | 6.01E-05 | 2.23E-04 | 0.11 | -1 | 1 |
| Xylose | 217.11 | 14.67 | 1.14 | 3.30E-03 | 8.92E-03 | 6.05 | 1 | -1 |
| Sophorose | 191.19 | 24.87 | 1.11 | 5.88E-04 | 1.84E-03 | 0.35 | -1 | 1 |
| 3-Hydroxybutyric acid | 147.07 | 8.44 | 1.10 | 5.96E-07 | 7.88E-06 | 62.15 | 1 | -1 |
| L-proline | 230.16 | 12.47 | 1.04 | 7.82E-03 | 1.82E-02 | 0.41 | -1 | 1 |
| L-alanine | 116.09 | 7.59 | 1.03 | 2.37E-03 | 6.87E-03 | 0.29 | -1 | 1 |
| 3-hydroxypropionic acid | 147.07 | 8.17 | 1.02 | 1.28E-04 | 4.60E-04 | 14.63 | 1 | -1 |
* The cell coloring represents the relative abundance of each metabolite: red (high) and blue (low).
Disclaimer/Publisher’s Note: The statements, opinions and data contained in all publications are solely those of the individual author(s) and contributor(s) and not of MDPI and/or the editor(s). MDPI and/or the editor(s) disclaim responsibility for any injury to people or property resulting from any ideas, methods, instructions or products referred to in the content. |
© 2025 by the authors. Licensee MDPI, Basel, Switzerland. This article is an open access article distributed under the terms and conditions of the Creative Commons Attribution (CC BY) license (http://creativecommons.org/licenses/by/4.0/).
Copyright: This open access article is published under a Creative Commons CC BY 4.0 license, which permit the free download, distribution, and reuse, provided that the author and preprint are cited in any reuse.


