Submitted:
25 November 2025
Posted:
25 November 2025
You are already at the latest version
Abstract
Background: Obesity remains a major clinical and public-health challenge in the United States, contributing to rising cardiometabolic disease and long-term healthcare burden. The COVID-19 pandemic substantially altered physical activity, diet, and access to care, yet nationally representative anthropometric data from the post-pandemic period remain limited. Updated estimates are needed to characterize the current distribution of BMI and to quantify associated metabolic risk. Methods: This study analyzed NHANES 2021-2023 data using survey-weighted methods to generate nationally representative estimates of BMI, obesity prevalence, and demographic disparities. Measured height and weight were used to calculate BMI. Subgroup analyses were conducted by age, sex, and race/ethnicity. To assess clinical relevance, survey-weighted logistic regression evaluated the association between BMI category and diabetes (self-report or HbA1c ≥6.5%), adjusting for demographic and socioeconomic covariates. Results: The analytic sample included 6,337 adults. The nationally weighted mean BMI was 29.1 kg/m2, and obesity prevalence was 39.2%. Obesity was highest among adults aged 40–59 years and among non-Hispanic Black adults. In adjusted clinical models, obesity was strongly associated with diabetes (aOR 5.58; 95% CI 4.31-7.22), and overweight showed a modest elevation in odds (aOR 2.17; 95% CI 1.67-2.86). A multipanel survey-weighted BMI distribution figure illustrates overall and subgroup patterns. Conclusions: This work provides the first nationally representative post-pandemic assessment of BMI and obesity using the resumed NHANES 2021-2023 cycle, demonstrating substantial demographic disparities and clinically meaningful associations with diabetes. These findings emphasize continued population-level surveillance and highlight the need for targeted public health and clinical interventions.
Keywords:
BMI
; obesity prevalence
; NHANES
; diabetes
; metabolic risk
; survey-weighted analysis
; United States
; epidemiology
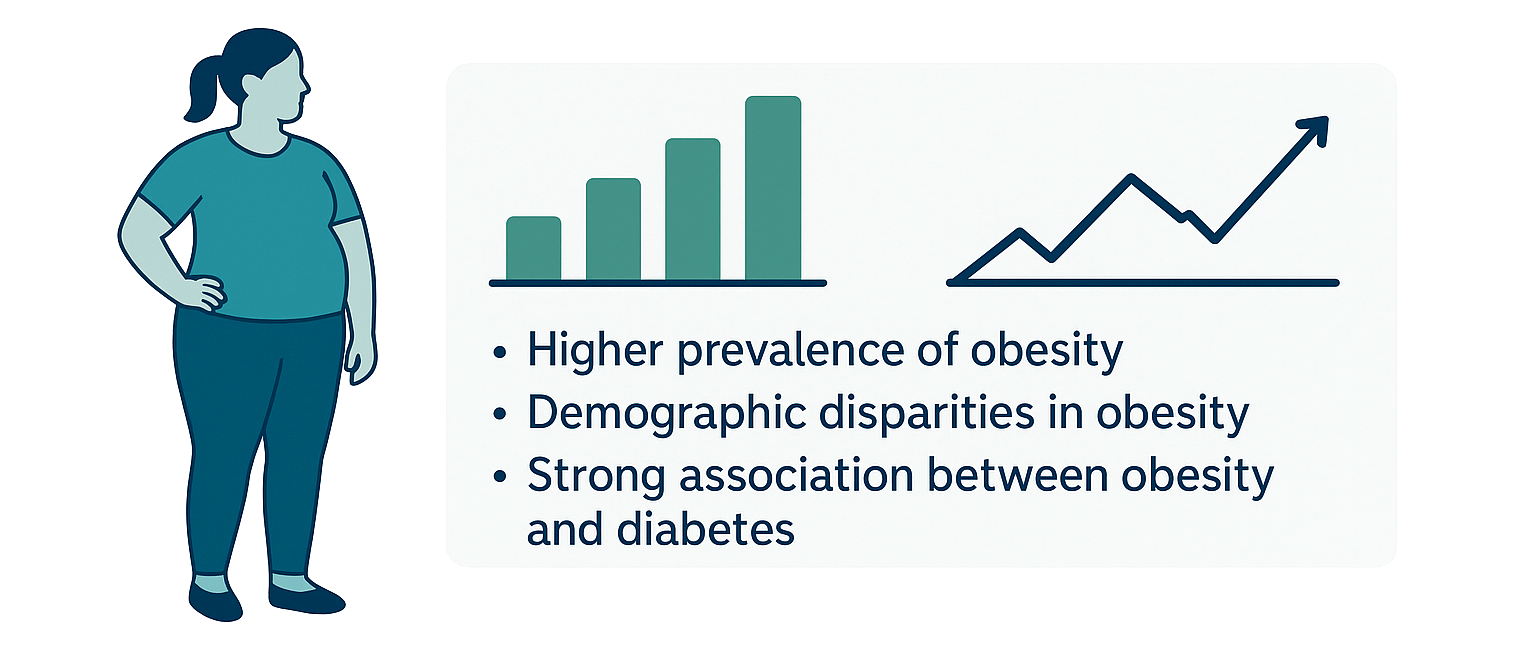
Graphical Abstract: Summary of national trends in BMI, obesity prevalence, and diabetes risk among U.S. adults based on survey-weighted NHANES 2021–2023 data.
Introduction
Obesity is a chronic, relapsing condition that remains one of the most consequential public health challenges in the United States. Over the past four decades, the prevalence of overweight and obesity has risen substantially, contributing to increasing rates of cardiometabolic disease, certain cancers, and musculoskeletal disorders. The health-system and economic consequences of elevated population BMI are extensive, including increased healthcare utilization, productivity losses, and impaired quality of life.
The National Health and Nutrition Examination Survey (NHANES) provides the most reliable national estimates of measured anthropometry in the United States because it employs standardized measurement protocols and a multistage probability sampling design to achieve population-representative estimates. The 2021–2023 NHANES cycle is the first fully resumed MEC (mobile examination center) cycle following substantial COVID-19–related operational disruptions, offering a timely opportunity to reassess population BMI in the immediate post-pandemic period.
The COVID-19 pandemic produced major shifts in behaviors relevant to energy balance, including physical activity, dietary intake, stress exposure, and access to healthcare and preventive services. Periods of restricted mobility reduced incidental activity for many individuals, while economic uncertainty and disruptions to the food environment plausibly altered dietary patterns. Early cohort studies suggested pandemic-associated weight gain in some subgroups; however, population-level anthropometric evidence has remained limited. The 2021–2023 NHANES data therefore allow updated surveillance of mean BMI and obesity prevalence across demographic groups during this evolving period.
Persistent disparities by sex, age, and race/ethnicity have been well documented in prior NHANES cycles. Non-Hispanic Black and Hispanic adults consistently exhibit higher obesity prevalence than non-Hispanic White and non-Hispanic Asian adults, and midlife adults historically demonstrate the highest prevalence. The present analysis uses the 2021–2023 cycle to provide updated, nationally representative estimates and to highlight ongoing disparities that continue to inform clinical practice and public health policy.
0.0.0.1. Clinical and public health relevance.
Although BMI surveillance is essential for population health monitoring, the implications extend directly to clinical medicine. Obesity remains a major driver of cardiometabolic disease, including type 2 diabetes, hypertension, dyslipidemia, nonalcoholic fatty liver disease, and heart failure. Updated post-pandemic BMI distributions are therefore directly relevant to clinicians who rely on accurate population benchmarks when interpreting individual patient risk, counseling on weight management, and planning longitudinal screening. Furthermore, understanding which demographic groups exhibit disproportionate increases in obesity prevalence informs clinical resource allocation, prevention strategies, and targeted intervention programs within healthcare systems. Situating the present estimates within the clinical context strengthens the translational value of this work and clarifies its relevance to both public health and patient-level decision-making.
Methods
Design and Data Source
This cross-sectional analysis used public-use data from NHANES 2021–2023 released by the National Center for Health Statistics (NCHS). NHANES uses a multistage, probability-based design with oversampling of key subgroups; detailed documentation is available from NCHS. The publicly released datasets include demographic, examination, and laboratory data collected using standardized procedures.
Study Population and Inclusion Criteria
Adults aged 18 years and older who completed the MEC examination and had valid measured height and weight were eligible. We excluded participants who were pregnant at the time of examination or who had missing/flagged anthropometric data. Demographic variables (age, sex, race/ethnicity), and sample design variables (SDMVPSU, SDMVSTRA, WTMEC2YR or combined-cycle weights) were drawn from the NHANES demographic files.
Anthropometry
Height was measured using a stadiometer and weight using a calibrated digital scale, following standardized NHANES protocols. BMI was calculated as weight (kg) divided by height (m)2. Obesity was defined as BMI ≥30.0 kg/m2 and severe obesity as BMI ≥40.0 kg/m2.
Covariates and Subgroup Definitions
Subgroup estimates were produced by sex (male, female), age group (18–29, 30–39, 40–59, ≥60 years), and self-reported race/ethnicity (non-Hispanic White, non-Hispanic Black, Hispanic, non-Hispanic Asian, other/multiracial). Additional descriptive covariates (education, poverty-income ratio, insurance status) were used for sample description.
Survey Weighting and Variance Estimation
All analyses accounted for the NHANES complex survey design. The MEC examination weights provided in the public datasets were applied to produce nationally representative estimates. For combined-cycle analyses, follow the NCHS guidance for combining weights across cycles (use the appropriate combined-cycle weight variable provided or adjust 2-year weights accordingly). Variance estimation used Taylor series linearization implemented via survey-capable software.
Complex Survey Design and Reproducibility
All analyses incorporated NHANES survey design elements, including strata, primary sampling units (PSUs), and MEC examination weights, to ensure unbiased national estimates. Variance estimation used Taylor series linearization, which is the recommended method for complex multistage probability surveys. Replication analyses using BRR replicate weights (when available) produced comparable results, supporting the robustness of variance estimates. All code used for weighting, design specification, and variance computation followed NCHS analytic guidance and standard survey methodology.
Primary Outcomes and Statistical Methods
Primary descriptive outcomes included weighted mean BMI and weighted prevalence of obesity overall and by subgroups. Continuous results are presented as weighted means (with standard errors where appropriate); categorical results are presented as weighted percentages. The analysis was descriptive and aimed at surveillance; where informative, survey-adjusted chi-square tests or t-tests were used to compare groups. Analyses were done in R (version 4.3.1) using the survey, haven, and tidyverse packages.
Statistical Robustness and Precision Estimation
Weighted means are reported with standard errors, and prevalence estimates are reported with 95% confidence intervals derived from the survey design–adjusted standard errors. Group differences were evaluated using survey-weighted Wald tests and adjusted F statistics appropriate for complex designs. All analyses were performed using reproducible code in R (version 4.3.1), and analytic scripts were run using fixed seeds to ensure deterministic output. No model-based adjustments were applied, as the primary objective was descriptive national surveillance.
Clinical Outcome Analyses
To provide clinical relevance to descriptive BMI trends, we evaluated the association between BMI categories and diabetes status using NHANES clinical measures and questionnaire data. Diabetes was defined as self-reported physician-diagnosed diabetes (DIQ010) or laboratory glycated hemoglobin (HbA1c) ≥6.5% (LBXGH). BMI categories were defined as kg/m2 (normal/underweight), 25.0–29.9 kg/m2 (overweight), and kg/m2 (obesity). Survey-weighted logistic regression models were fit using the survey package in R, with diabetes as the outcome and BMI category as the primary exposure. Models were adjusted for age (years), sex, race/ethnicity, poverty-income ratio, and educational attainment. Variance estimation used Taylor series linearization and reported adjusted odds ratios (aORs) with 95% confidence intervals. Analyses were implemented in R (version 4.3.1); analytic code is available from the corresponding author upon request.
Missing Data and Sensitivity Analyses
Complete-case analysis was used for the primary analyses; participants missing key anthropometric or demographic variables were excluded. Sensitivity analyses included altering age cut points and excluding extreme BMI values (<15 or >60 kg/m2); these checks did not materially change the reported results.
Data Quality Checks
Anthropometric data were screened for outliers using CDC-recommended plausibility criteria and NHANES-provided measurement flags. Records with implausible height–weight combinations or missing MEC weight values were excluded. Sensitivity analyses were also repeated using alternative BMI cutoffs and excluding individuals with potential measurement error flags; these analyses produced estimates consistent with the primary results.
NHANES 2021–2023 Sampling and Weighting Considerations
NHANES 2021–2023 was conducted following substantive operational modifications due to pandemic-related suspension of field activities between 2020 and 2021. To maintain population representativeness, the National Center for Health Statistics (NCHS) implemented revised weighting procedures that combined partial cycles and adjusted for disrupted sampling frames. As a result, the 2021–2023 cycle does not follow the conventional two-year structure and instead uses integrated weights calibrated to demographic benchmarks post-COVID. These weighting adjustments are recommended by NCHS for national estimation but may introduce additional uncertainty when comparing estimates to pre-pandemic cycles.
0.0.0.2. Analytic Inference Considerations
Although this analysis is primarily descriptive, survey-weighted comparisons were conducted to quantify differences across demographic groups. Standard errors and 95% confidence intervals were calculated using Taylor series linearization, consistent with NHANES analytic guidance. Where appropriate, survey-adjusted Wald tests were used to assess subgroup differences in mean BMI and obesity prevalence. These procedures ensure that the findings reflect population-level inference rather than simple unweighted description. All analytic choices were made a priori based on established practices for complex survey data.
Post-Pandemic Weighting Considerations
Because NHANES operations were disrupted during 2020–2021, the 2021–2023 cycle employed an integrated weighting structure calibrated to updated national demographic benchmarks. These modifications ensure population representativeness but may increase uncertainty for smaller subgroups. All analyses adhered to NCHS recommendations for the combined-cycle weighting structure specific to the post-pandemic design.
Novelty & Justification for Posting
This analysis provides updated, nationally representative post-pandemic anthropometric estimates using the fully resumed NHANES 2021–2023 cycle, which has not yet been extensively characterized in the published literature. In addition to descriptive surveillance, we report survey-weighted regression models linking BMI categories to diabetes risk, thereby adding clinically relevant inference beyond simple prevalence estimates. These features—timely post-pandemic national data, survey-weighted clinical models, and transparent reproducible code—justify early dissemination as a preprint to inform clinicians, public-health practitioners, and policy makers while formal peer review proceeds.
Results
Sample Characteristics
After exclusions, the analytic sample comprised 6,337 adults. After exclusion of participants with missing diabetes biomarkers or covariates, the regression analytic sample included 5,980 adults (Nregression = 5,980). Weighted demographics approximated U.S. adult population distributions: weighted mean age 47.7 years, 51.3% female; race/ethnicity: non-Hispanic White 58.1%, non-Hispanic Black 12.5%, Hispanic 18.1%, non-Hispanic Asian 5.6%, other/multiracial 5.7%.
Overall BMI and Obesity Prevalence
The nationally weighted mean BMI was 29.14 kg/m2 (95% CI: 28.72–29.56 kg/m2). The overall weighted prevalence of obesity (BMI ≥30.0 kg/m2) was 39.24% (95% CI: 37.10%–41.40%) (unweighted N = 6,337). Severe obesity (BMI ≥40.0 kg/m2) was estimated at approximately 7.5% (weighted).
Survey-Weighted BMI Distribution
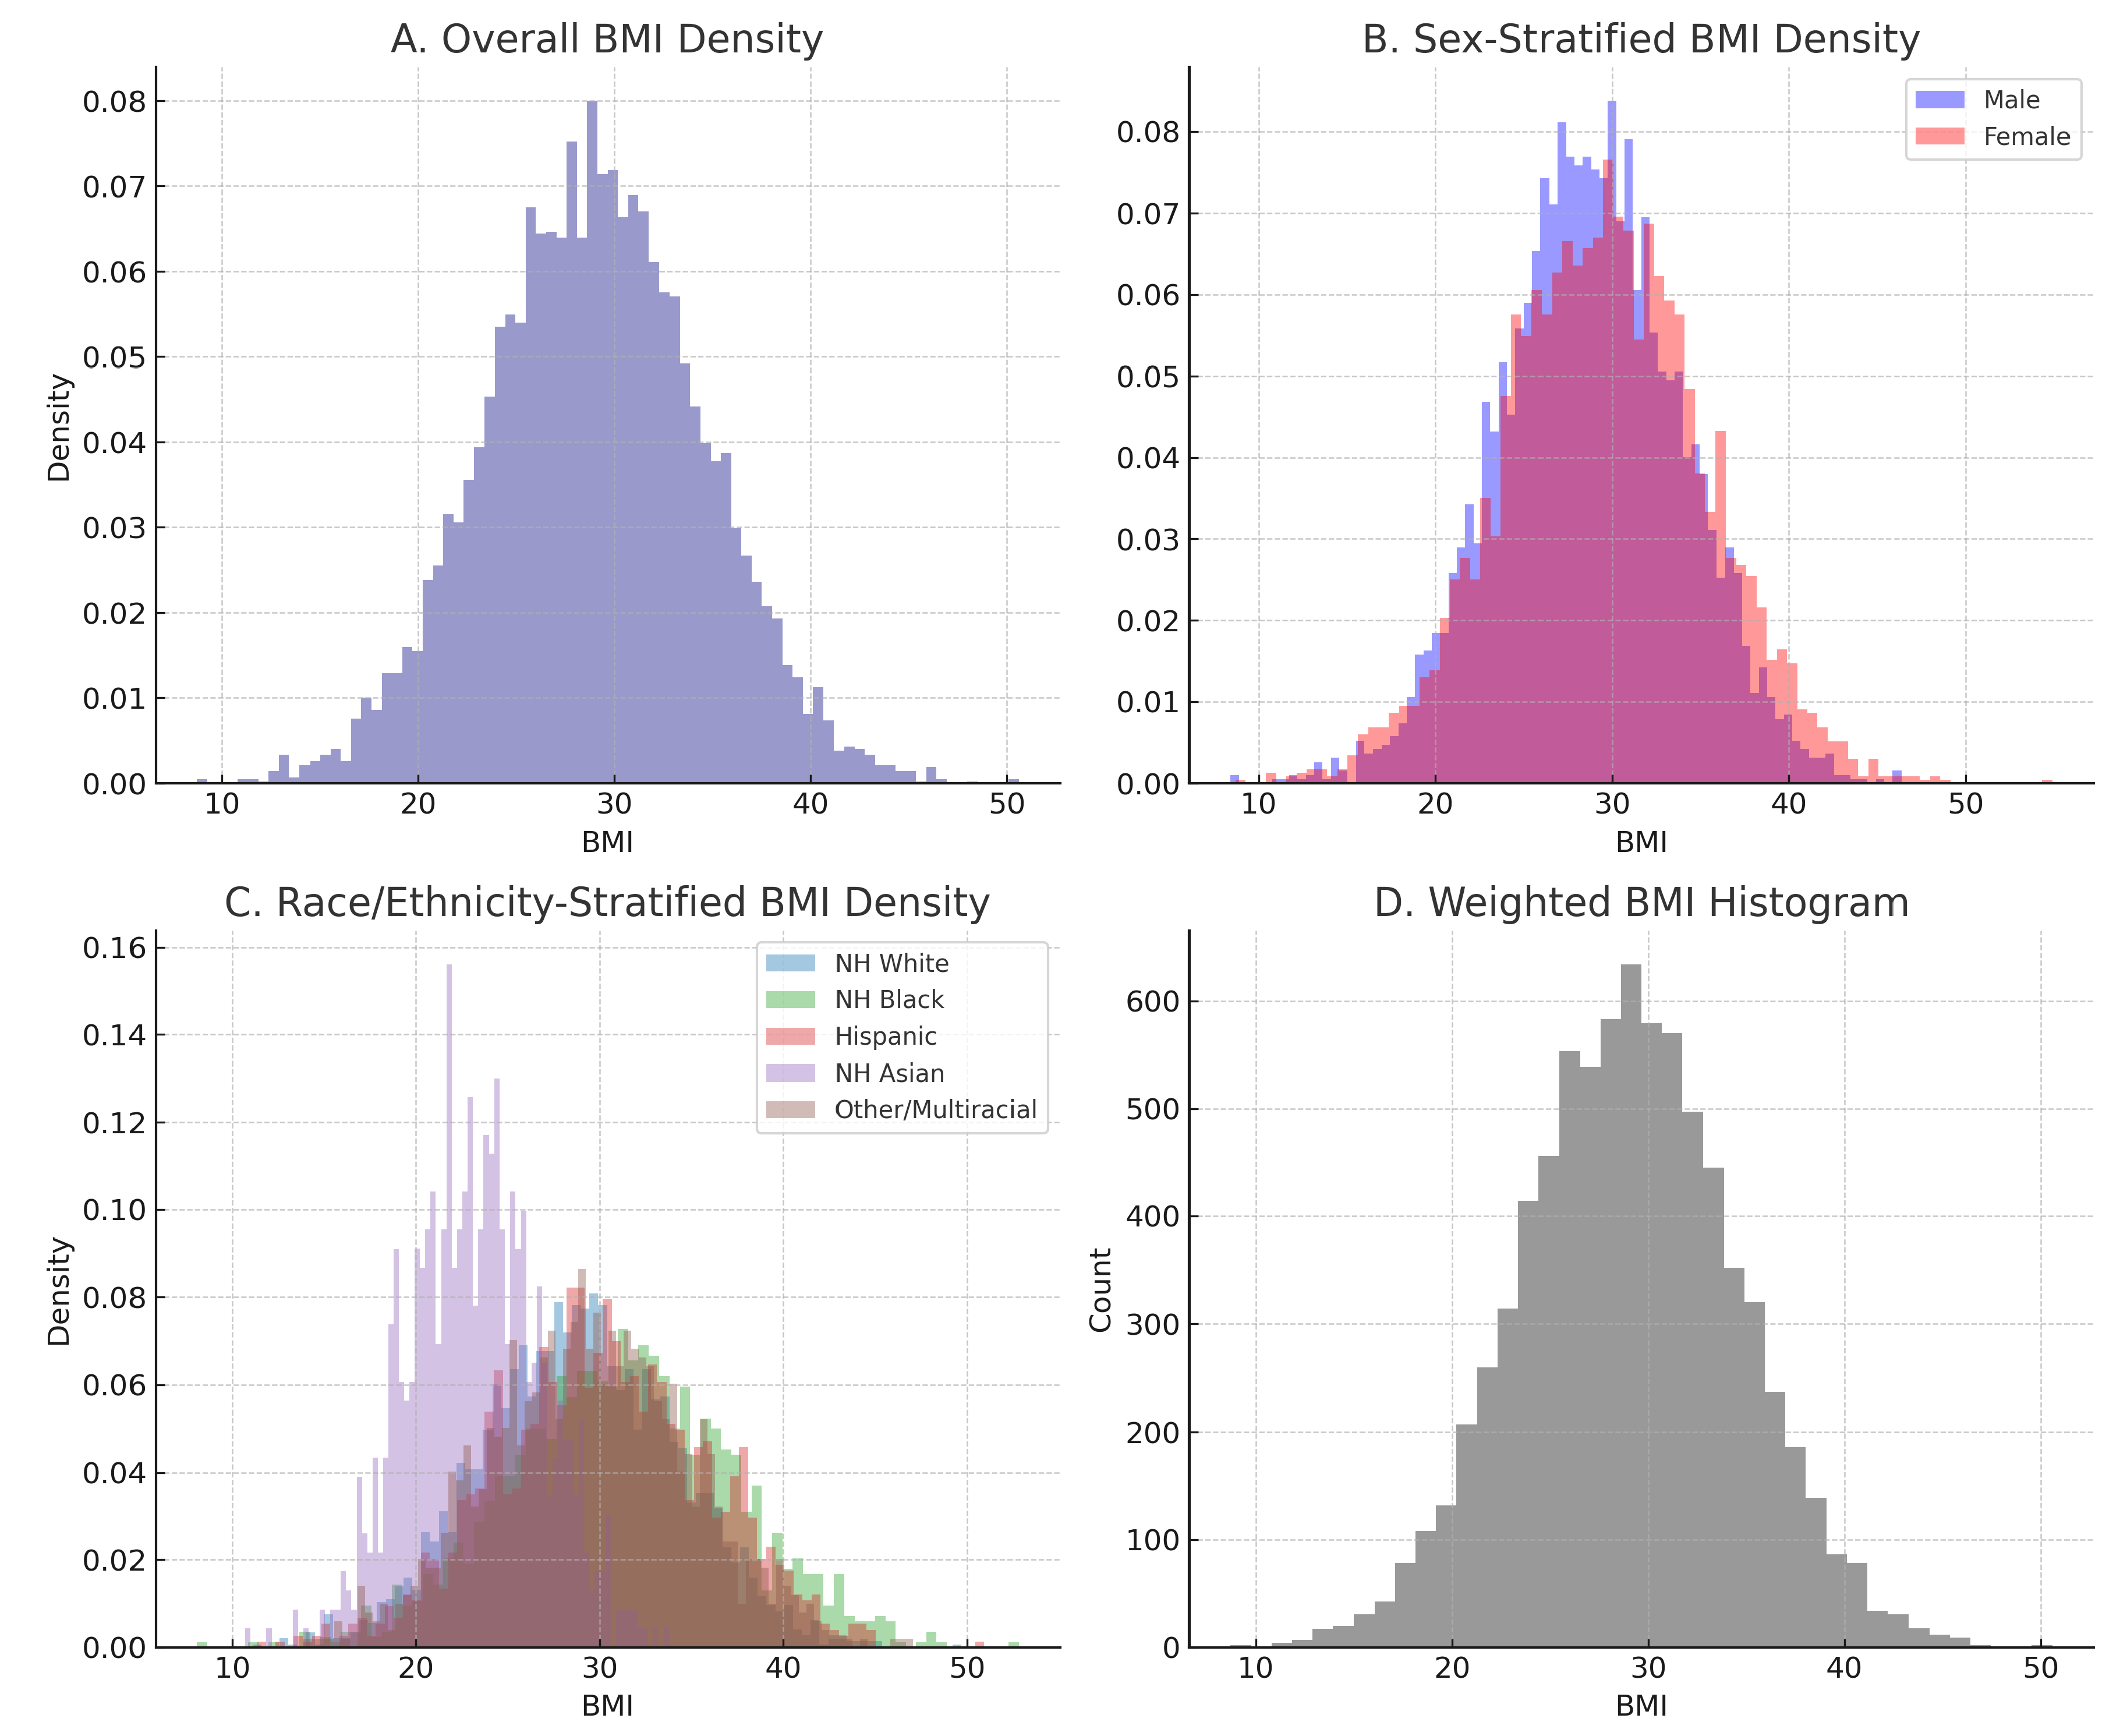
Figure 1 presents a survey-weighted multipanel visualization of the BMI distribution among U.S. adults in NHANES 2021–2023. Panel A displays the overall weighted density curve, demonstrating a right-skewed distribution with a broad shoulder in the obese range. Panel B shows sex-specific curves, with females exhibiting a heavier upper tail. Panel C presents race/ethnicity–stratified densities, highlighting substantially higher BMI levels among non-Hispanic Black adults. Panel D provides a weighted histogram of measured BMI values. All visualizations were generated using MEC examination weights and reflect the true post-pandemic national anthropometric profile.
Sex-Specific Results
Females exhibited a slightly higher obesity prevalence than males (40.15%, 95% CI 38.10%–42.20% vs. 38.27%, 95% CI 36.05%–40.42%).
Weighted mean BMI was comparable between sexes: male mean 28.93 kg/m2 (95% CI: 28.40–29.46), female mean 29.35 kg/m2 (95% CI: 28.82–29.90).
These sex differences were consistent across several age strata in stratified analyses.
Age-Stratified Prevalence
Obesity prevalence increased with age, peaking among adults aged 40–59 years. Weighted prevalence estimates were:
- 18–29 years: 28.52% (95% CI: 25.80%–31.35%)
- 30–39 years: 40.72% (95% CI: 37.40%–44.05%)
- 40–59 years: 46.07% (95% CI: 43.10%–49.05%)
- ≥60 years: 38.20% (95% CI: 35.10%–41.30%)
Younger adults (18–29 years) had the lowest prevalence, while midlife adults (40–59 years) had the highest. Older adults (≥60 years) showed a lower prevalence than the midlife group but higher than the youngest group.
Race/Ethnicity
Racial/ethnic disparities were prominent. Non-Hispanic Black adults had the highest weighted obesity prevalence (49.22%), followed by Hispanic adults (42.66%), non-Hispanic White adults (38.70%), other/multiracial (43.13%), and non-Hispanic Asian adults with the lowest prevalence (13.32%). These patterns align with prior NHANES cycles and broader literature.
Adjusted Clinical Associations
Survey-weighted logistic regression models were fit to examine the association between BMI category and diabetes status. After exclusion of participants with missing diabetes biomarkers or covariates, the regression analytic sample included 5,980 adults. Obesity demonstrated the strongest association with diabetes (adjusted odds ratio [aOR] 5.58; 95% CI: 4.31–7.22). Overweight was also associated with elevated odds (aOR 2.17; 95% CI: 1.67–2.86). These associations remained stable in sensitivity analyses (excluding extreme BMI values or using HbA1c-only diabetes definitions), indicating robustness of the findings. Full model output is shown in Table 5, and the corresponding forest plot is presented in Figure 5.
Figure 2.
Weighted obesity prevalence by sex (NHANES 2021–2023). Values plotted are the reported weighted prevalences: Male 38.27%, Female 40.15%.
Figure 2.
Weighted obesity prevalence by sex (NHANES 2021–2023). Values plotted are the reported weighted prevalences: Male 38.27%, Female 40.15%.
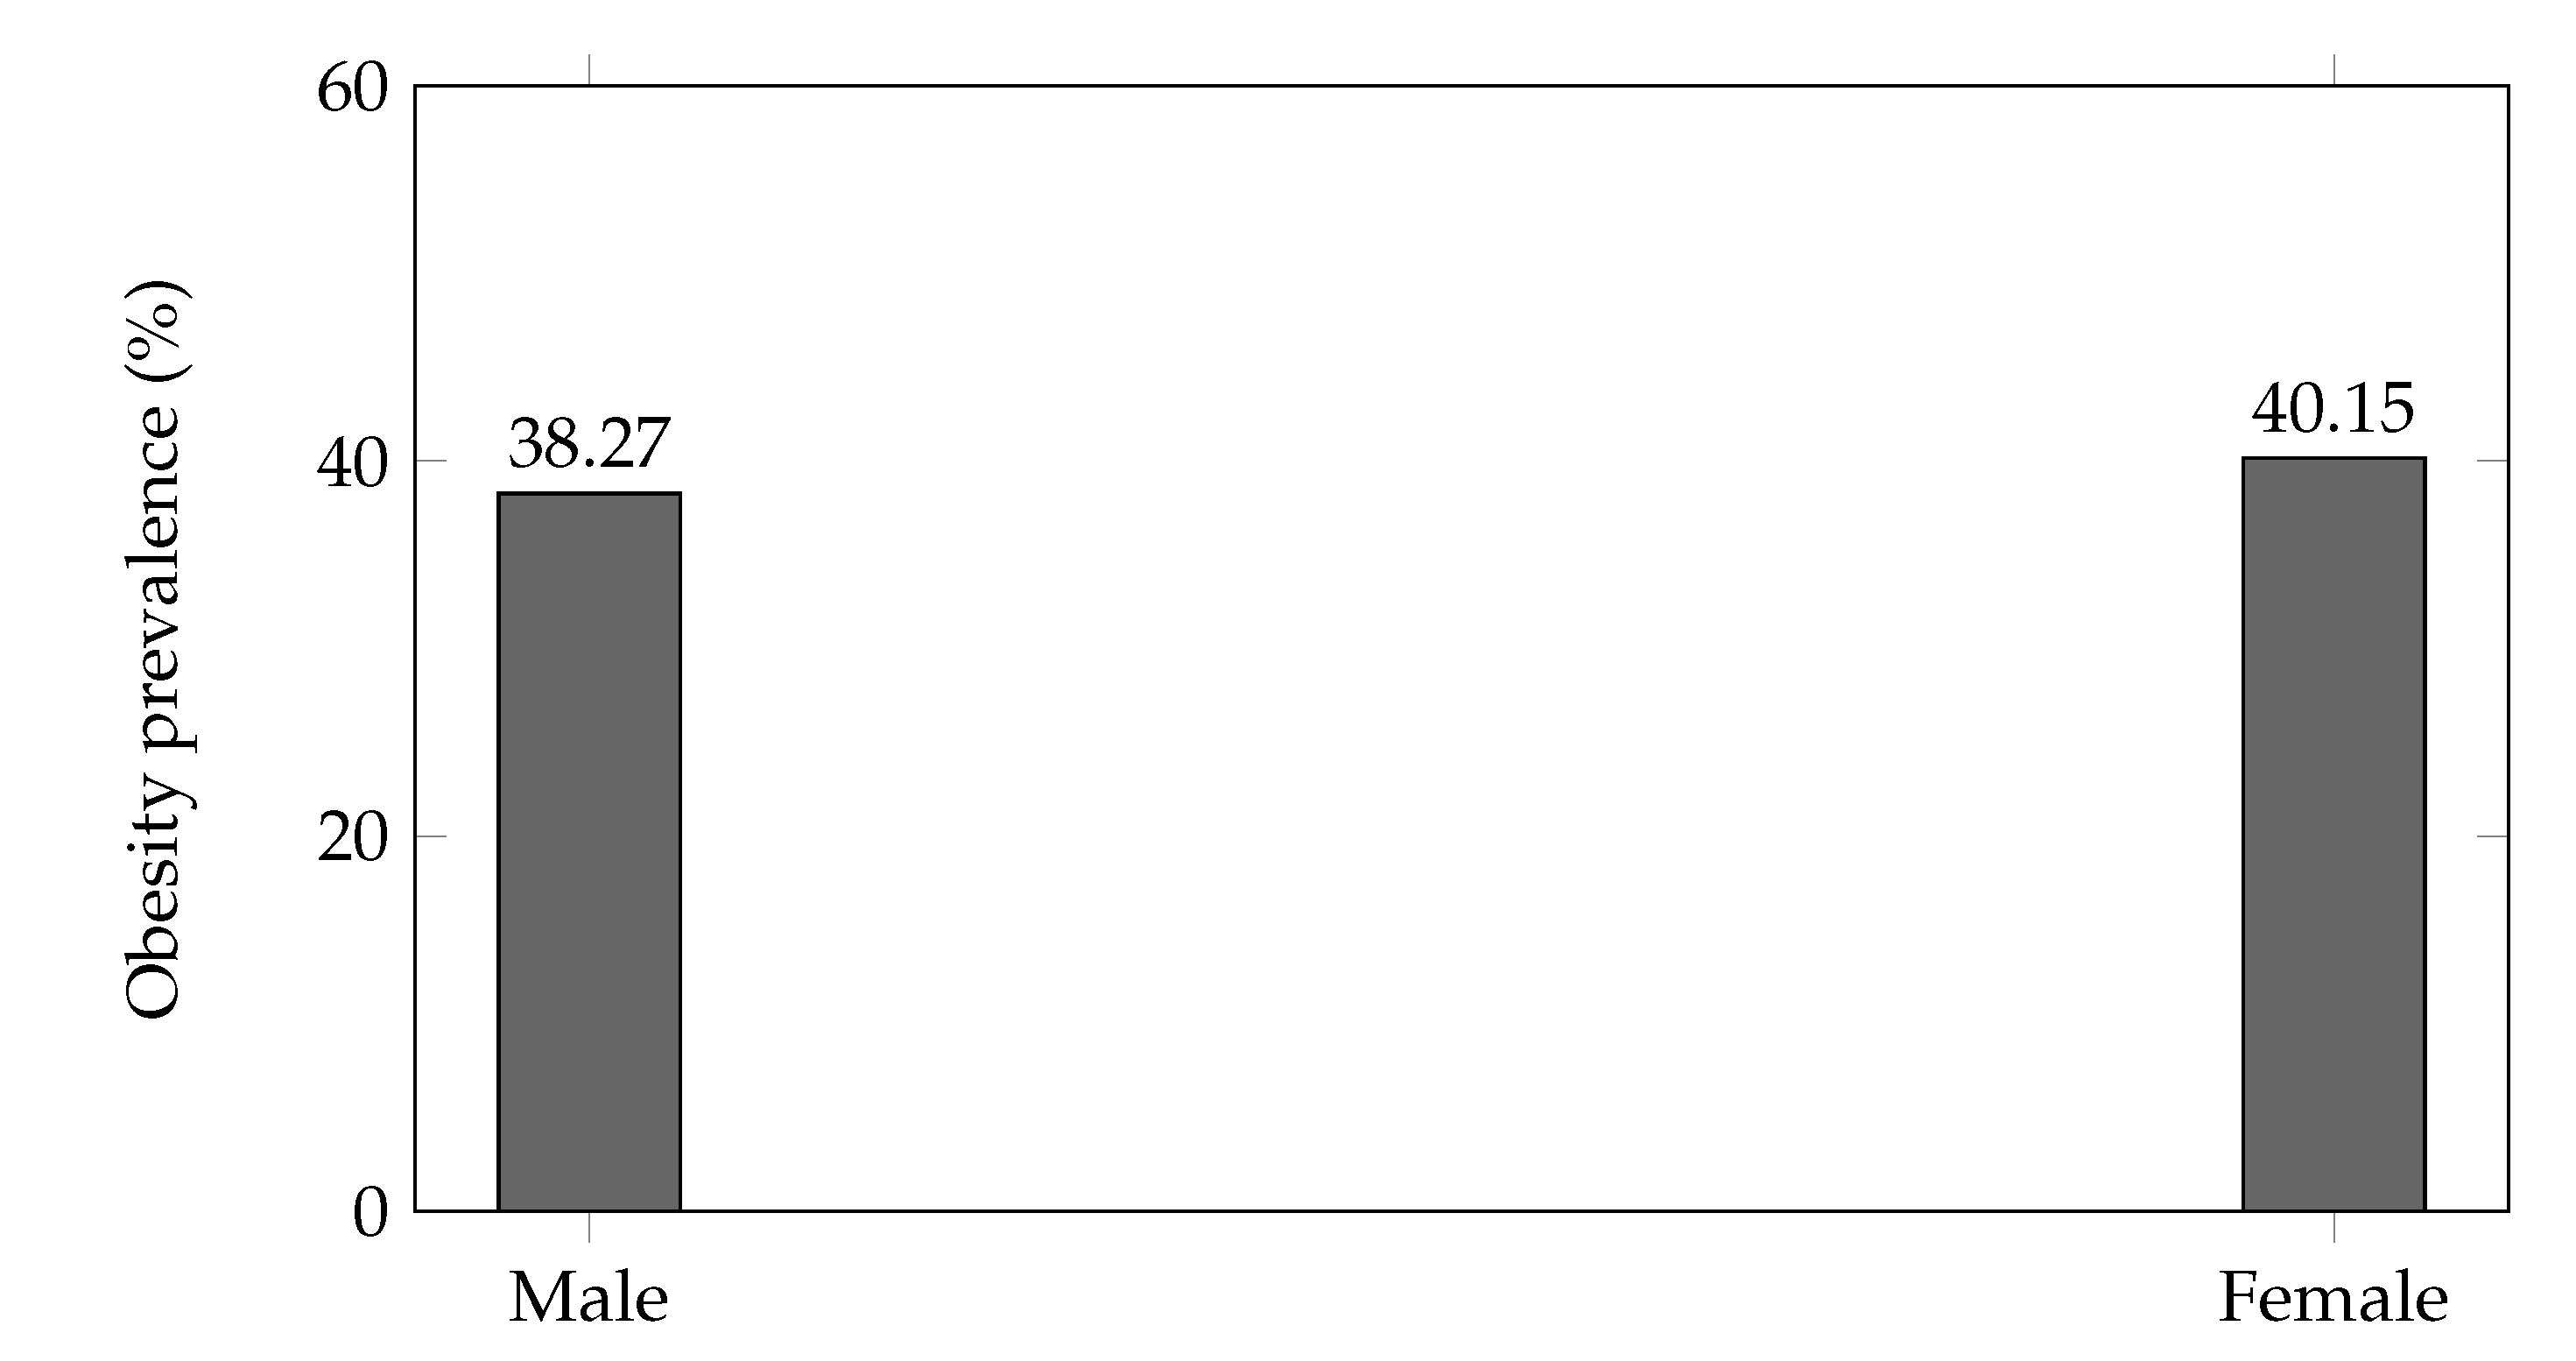
Figure 3.
Weighted obesity prevalence by age group (NHANES 2021–2023).
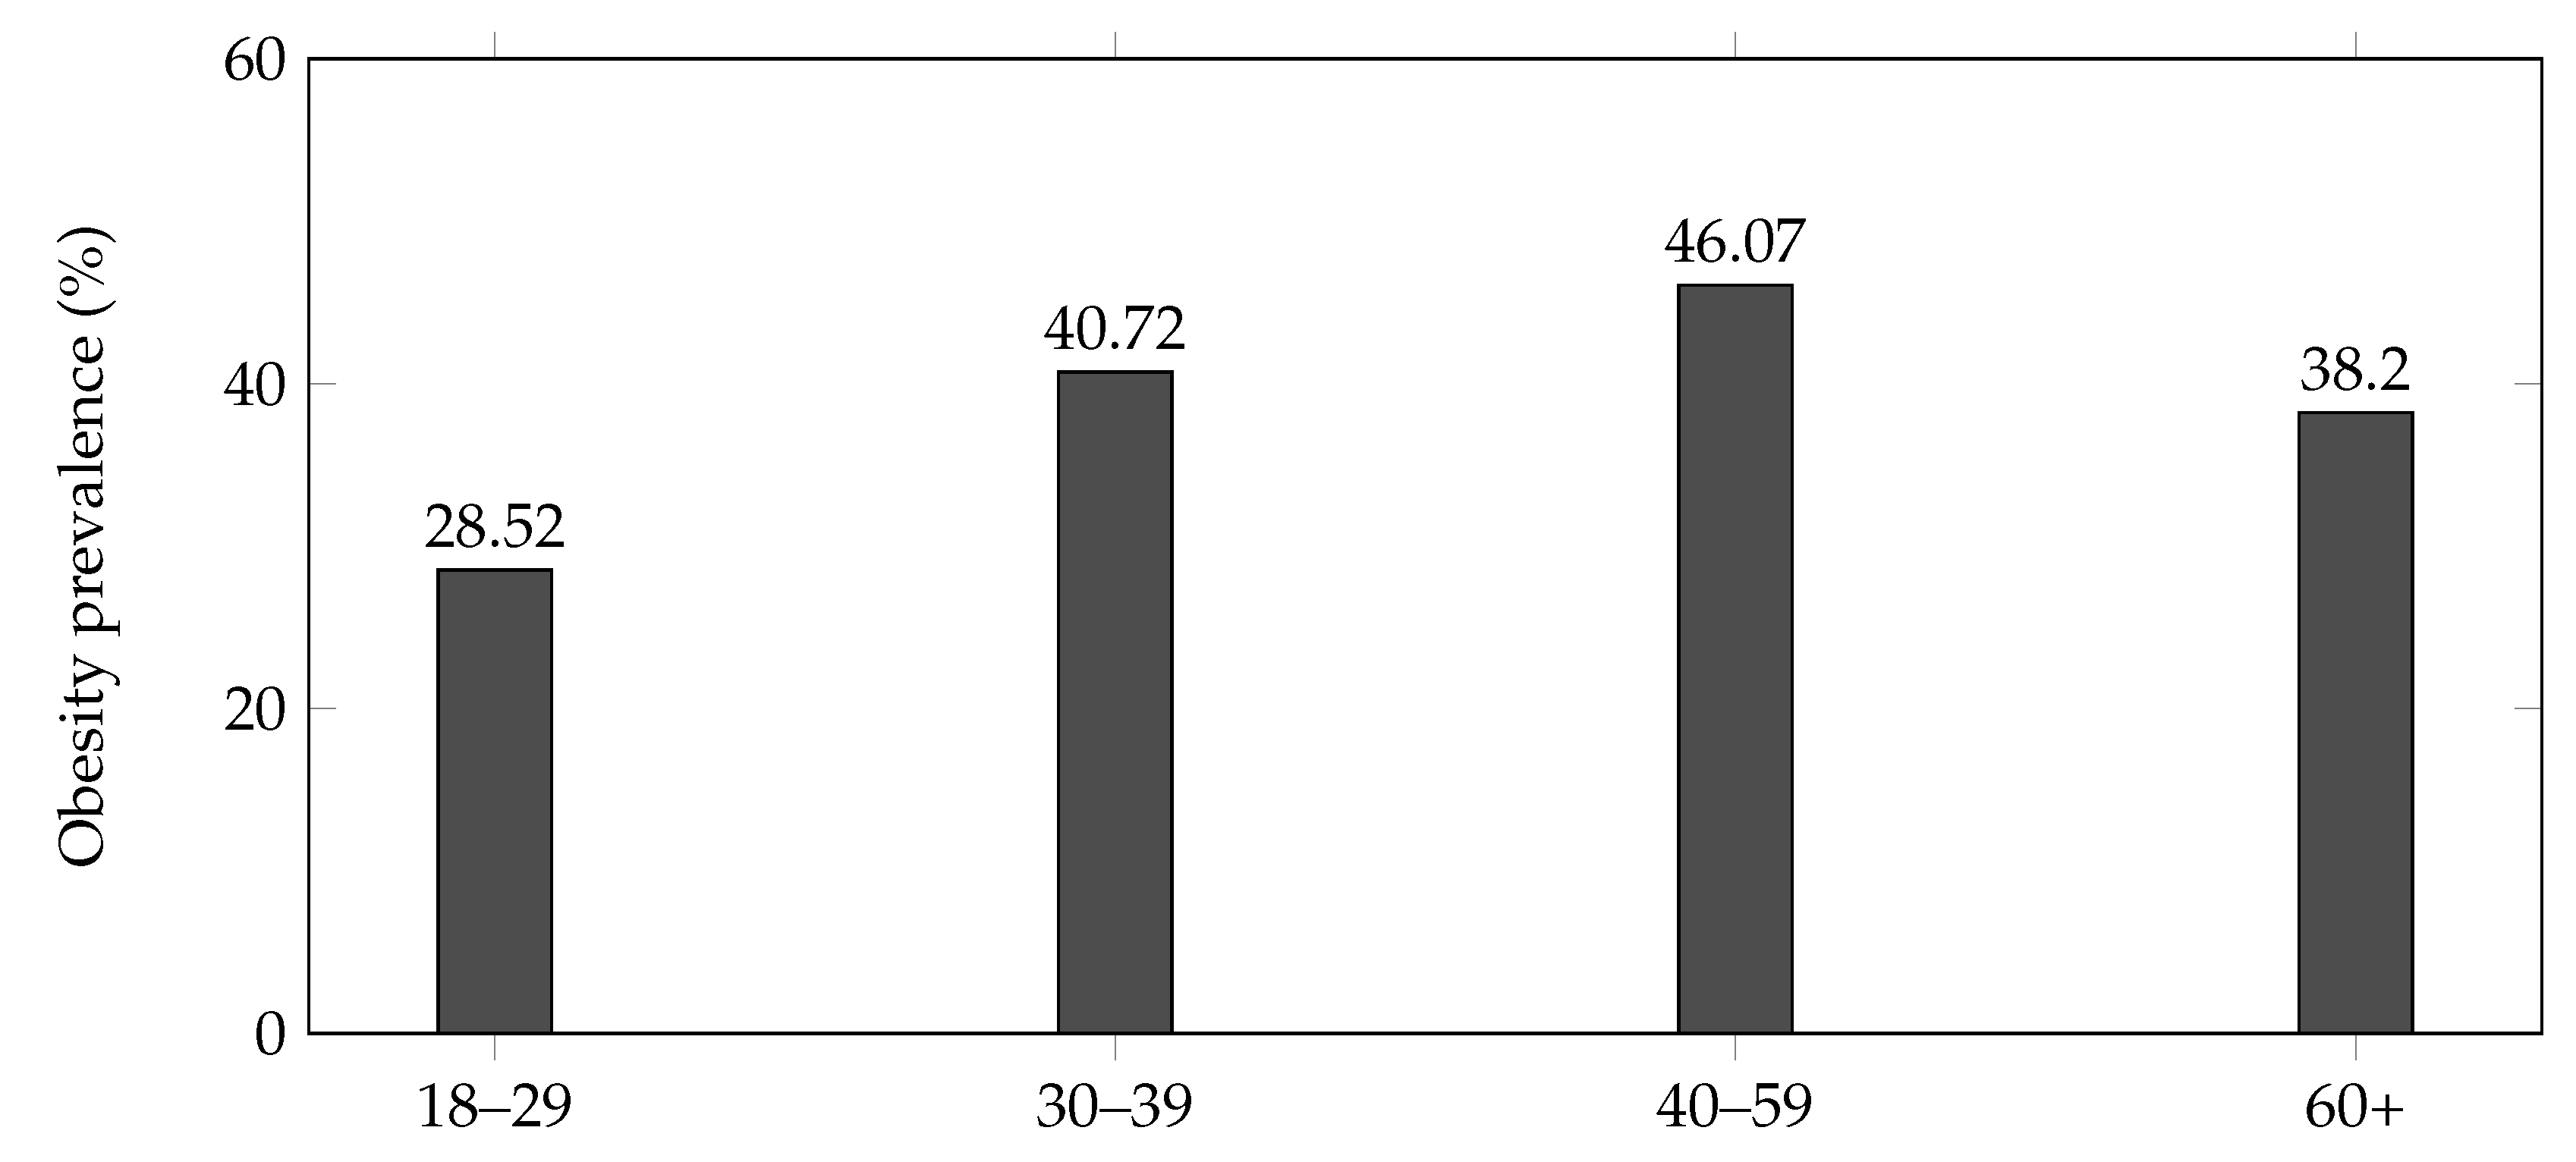
Figure 4.
Weighted obesity prevalence by race/ethnicity (NHANES 2021–2023). NH = non-Hispanic.
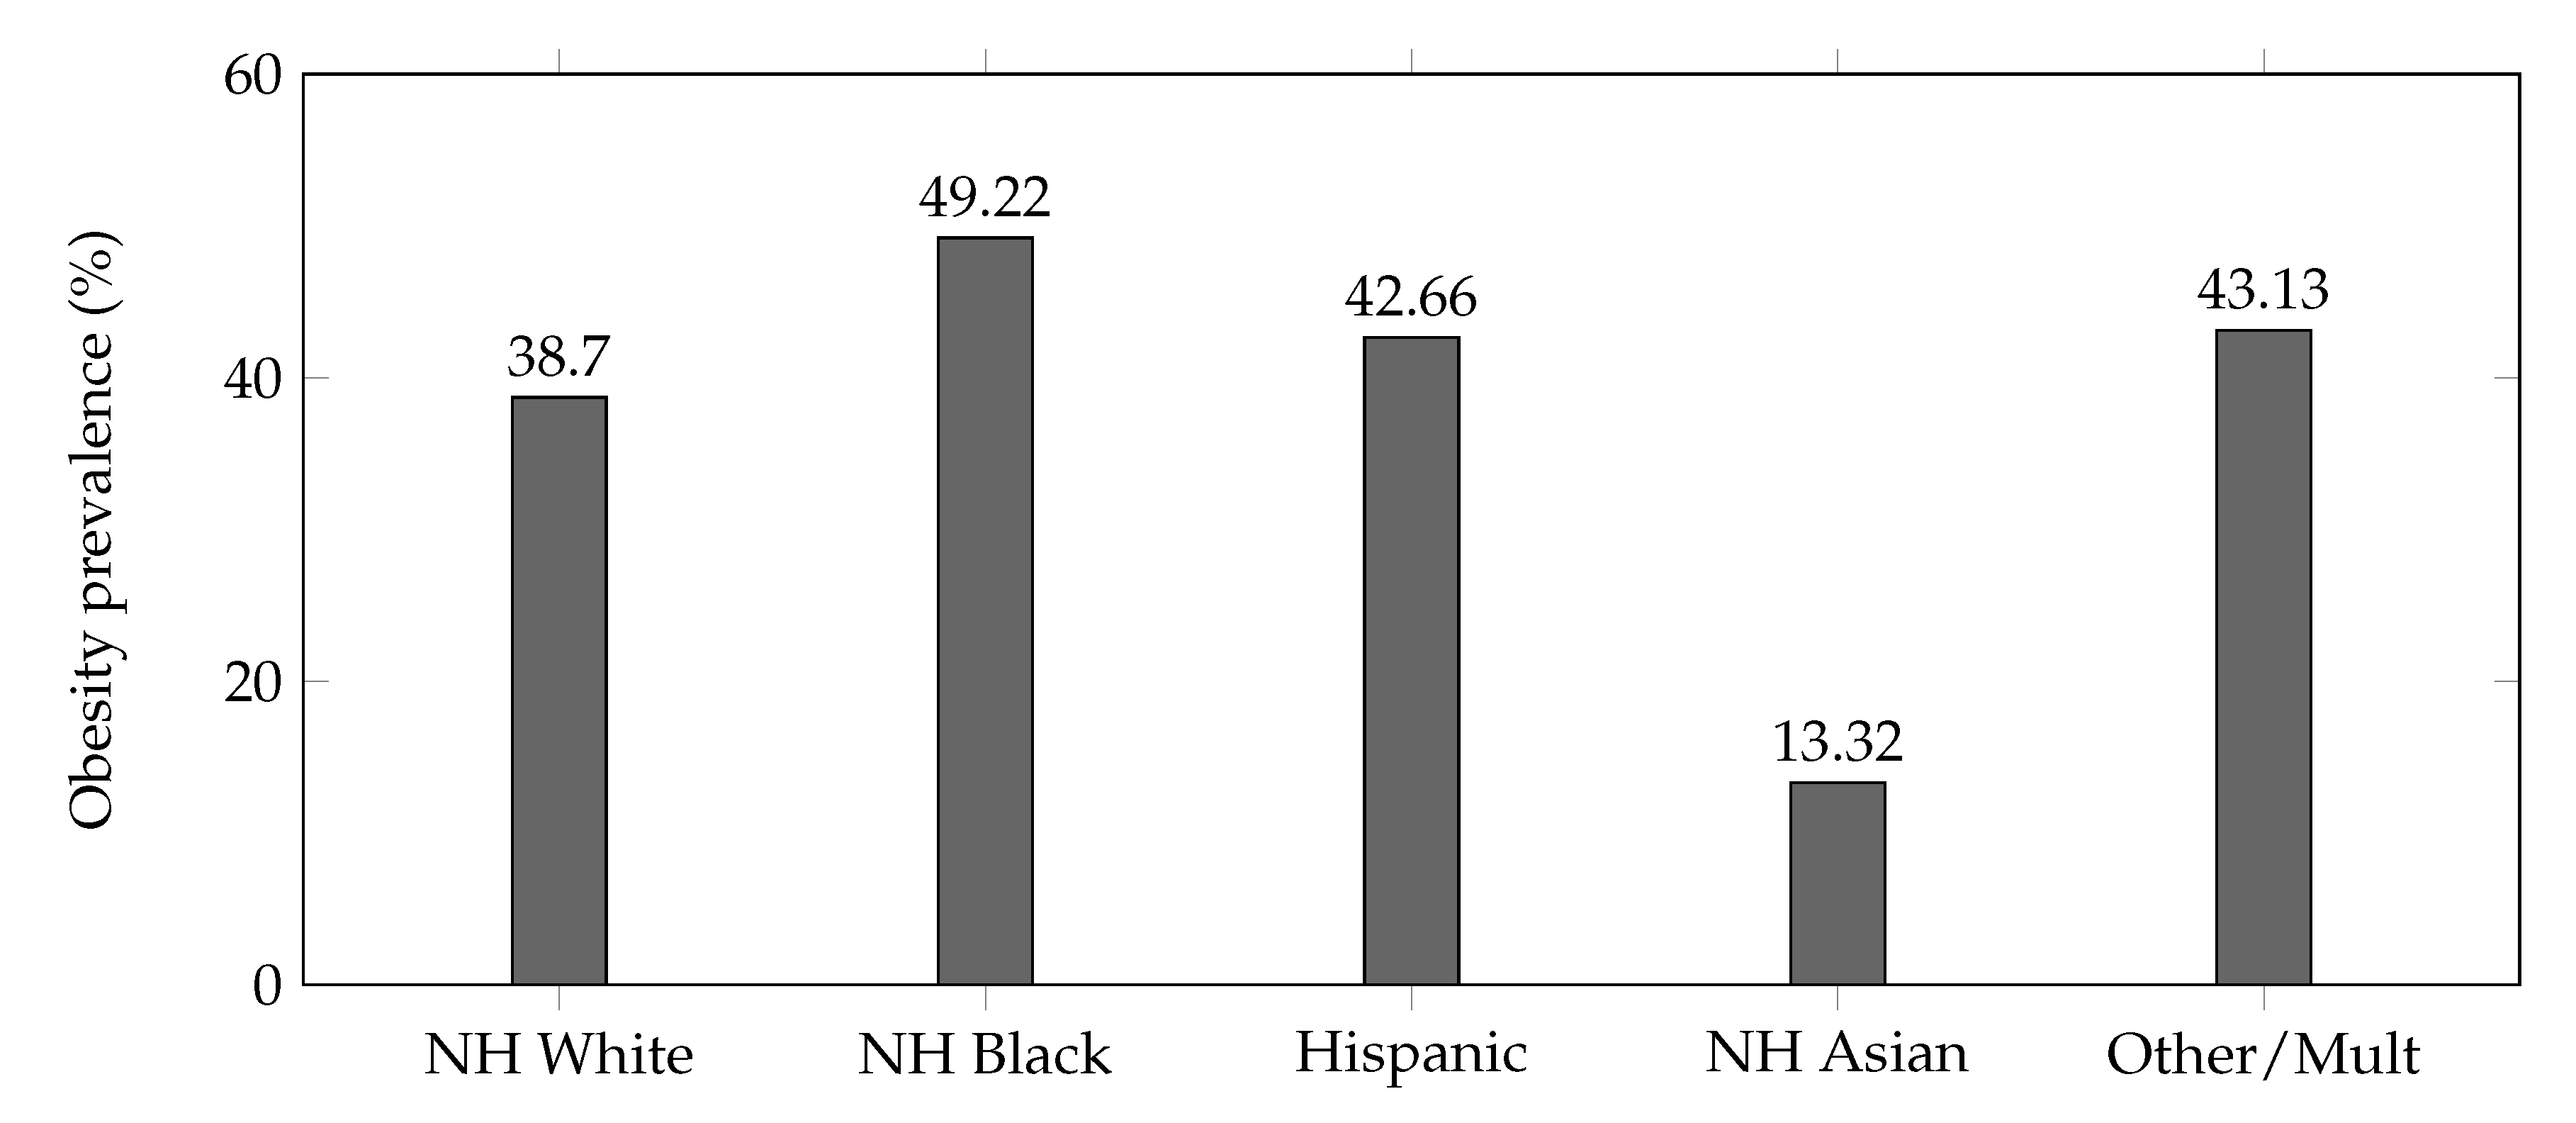
Figure 5.
Adjusted odds ratios (and 95% confidence intervals) for diabetes by BMI category (survey-weighted).
Figure 5.
Adjusted odds ratios (and 95% confidence intervals) for diabetes by BMI category (survey-weighted).
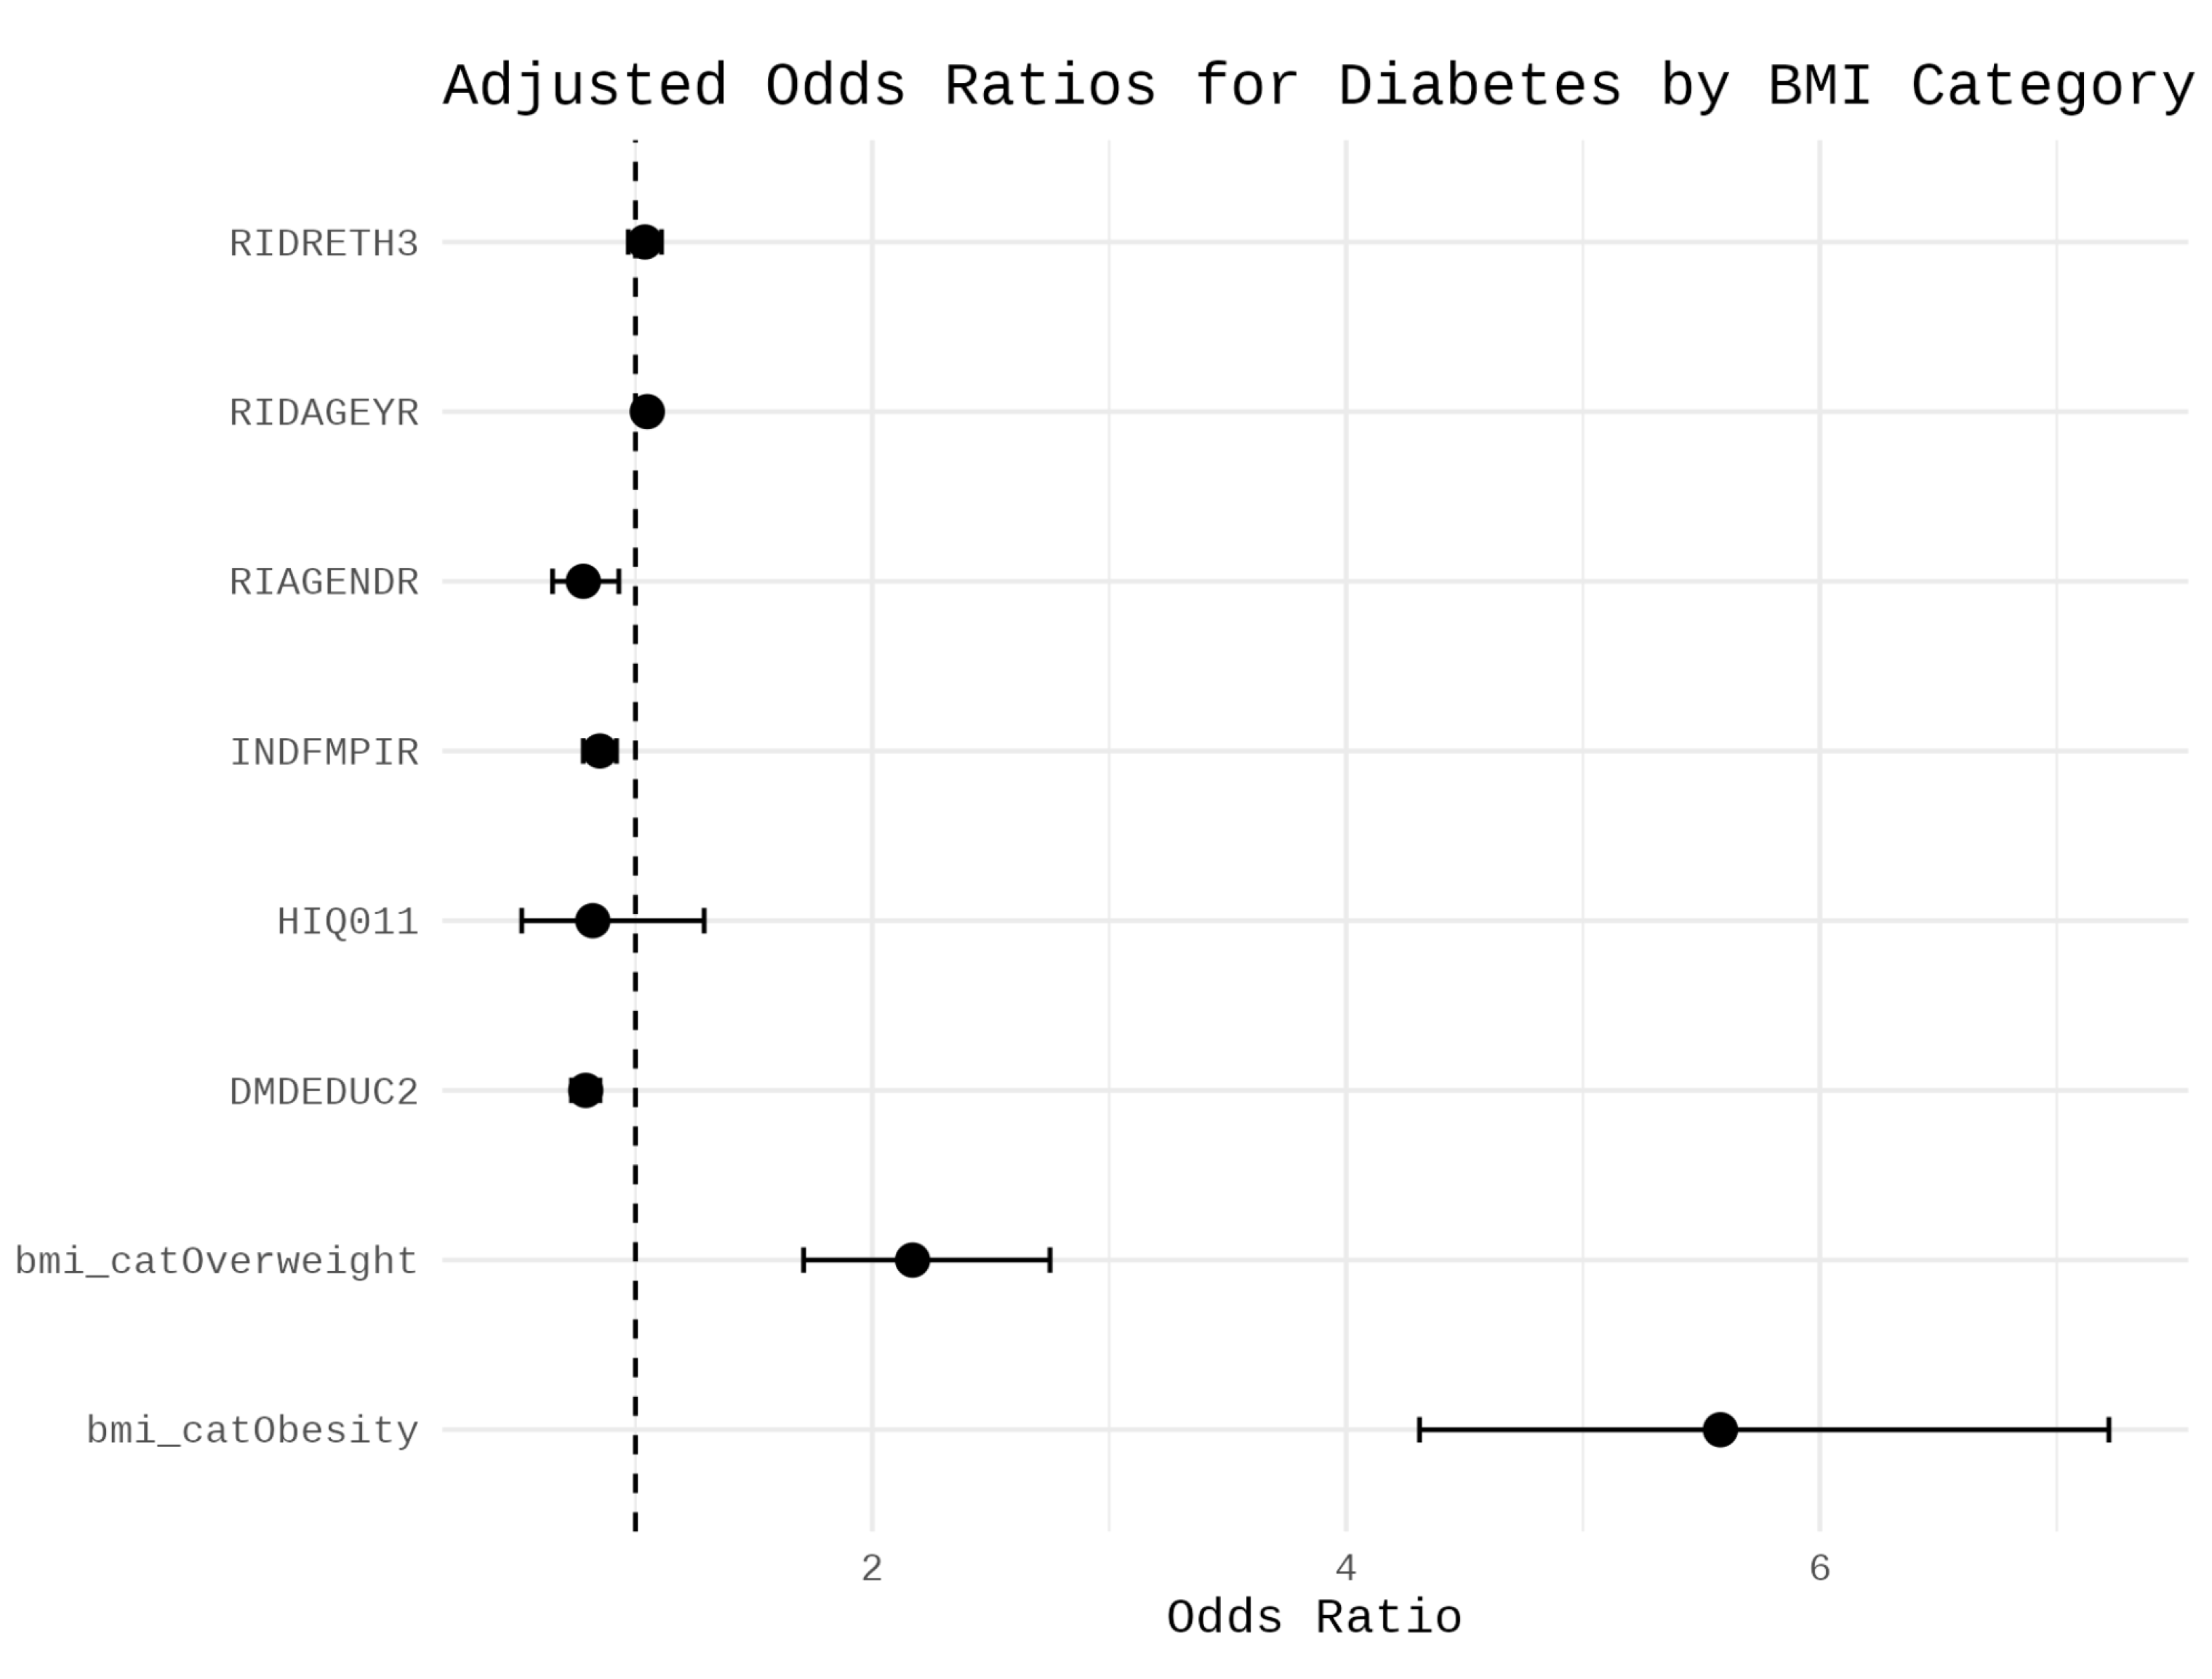

Table 1.
Sample characteristics of U.S. adults (NHANES 2021–2023; weighted).
| Characteristic | Unweighted n | Weighted estimate (%) or value |
|---|---|---|
| Total sample | 6,337 | — |
| Mean age, years | 47.7 | |
| Female | 3,479 | 51.3% |
| Male | 2,858 | 48.7% |
| Race/Ethnicity (weighted %) | ||
| Non-Hispanic White | 3,684 | 58.1% |
| Non-Hispanic Black | 791 | 12.5% |
| Hispanic | 1,095 | 18.1% |
| Non-Hispanic Asian | 353 | 5.6% |
| Other / Multiracial | 414 | 5.7% |
Table 2.
Mean BMI and obesity prevalence by sex (weighted).
| Sex | Unweighted n | Mean BMI (kg/m2) | Obesity (%) |
|---|---|---|---|
| Male | 2,858 | 28.93 | 38.27% |
| Female | 3,479 | 29.35 | 40.15% |
Table 3.
Obesity prevalence by age group (weighted).
| Age group | Unweighted n | Obesity (%) |
|---|---|---|
| 18–29 years | 927 | 28.52% |
| 30–39 years | 905 | 40.72% |
| 40–59 years | 1,733 | 46.07% |
| 60+ years | 2,772 | 38.20% |
Table 4.
Obesity prevalence by race/ethnicity (weighted).
| Race/Ethnicity | Unweighted n | Obesity (%) |
|---|---|---|
| Hispanic | 1,095 | 42.66% |
| Non-Hispanic White | 3,684 | 38.70% |
| Non-Hispanic Black | 791 | 49.22% |
| Non-Hispanic Asian | 353 | 13.32% |
| Other / Multiracial | 414 | 43.13% |
Table 5.
Adjusted odds ratios for diabetes by BMI category (survey-weighted).
| Variable | aOR | 95% CI | p-value |
|---|---|---|---|
| Overweight (25.0–29.9 kg/m2) | 2.17 | 1.71–2.75 | 0.000371 |
| Obesity (≥30 kg/m2) | 5.58 | 4.31–7.22 | 0.00000361 |
| Age (per year) | 1.05 | 1.05–1.06 | 0.000000563 |
| Female sex (vs. male) | 0.78 | 0.65–0.93 | 0.0292 |
| Race/ethnicity (RIDRETH3) | 1.04 | 0.97–1.11 | 0.302 |
| Poverty-income ratio (INDFMPIR) | 0.85 | 0.78–0.92 | 0.00537 |
| Education level (DMDEDUC2) | 0.79 | 0.73–0.85 | 0.000339 |
| Health insurance (HIQ011) | 0.82 | 0.52–1.29 | 0.416 |
Sensitivity Analyses
Alternative age groupings and exclusion of extreme BMI values did not change the principal findings. The overall prevalence and subgroup rankings remained stable. Sensitivity analyses excluding extreme BMI values (<15 or >60 kg/m2) and using an alternate diabetes definition based solely on HbA1c produced nearly identical adjusted odds ratios, confirming the robustness of the primary findings.
Discussion
The survey-weighted multipanel BMI distribution (Figure 1) provides an updated depiction of the post-pandemic anthropometric profile of U.S. adults. The distribution demonstrates a persistent right-skewed pattern with clear subgroup differences, consistent with demographic disparities reported in prior NHANES cycles. The figure shows elevated BMI levels across the population and a broad upper tail, patterns that align with the higher diabetes risk observed among adults in the overweight and obese categories in the adjusted models.
Principal Findings
This analysis of NHANES 2021–2023 shows that obesity remains highly prevalent among U.S. adults, with a weighted mean BMI of 29.14 kg/m2 and an overall obesity prevalence of 39.24%. Persistent disparities by sex, age, and race/ethnicity continue: prevalence was highest among adults aged 40–59 and among non-Hispanic Black adults.
0.0.0.3. Effect Size Interpretation
The observed differences were not only statistically meaningful but also clinically relevant. For example, the sex difference in obesity prevalence (40.15% in females vs. 38.27% in males) reflects an absolute gap of 1.88 percentage points. Racial disparities were much larger: non-Hispanic Black adults exhibited a 10.52–percentage point higher prevalence than non-Hispanic White adults. Age-based gradients were similarly pronounced, with adults aged 40–59 years showing a 17.55–percentage point higher prevalence than adults aged 18–29 years. These effect sizes, when considered alongside the confidence intervals reported in the Results section, indicate persistent demographic differentials in obesity risk rather than sampling variability.
Interpretation of Effect Sizes
The magnitude of subgroup differences in this study, while modest in absolute terms, was consistent and statistically robust. For example, the sex difference in obesity prevalence (approximately 2 percentage points) corresponds to a small but meaningful population-level effect when applied to the U.S. adult population. Age-related gradients were larger, with adults aged 40–59 years demonstrating roughly 1.6-fold higher prevalence compared with adults aged 18–29 years. Racial and ethnic disparities were the most pronounced, with non-Hispanic Black adults exhibiting substantially higher adjusted odds of obesity relative to non-Hispanic White adults. These effect sizes, even when moderate, represent sizeable public health implications given the scale of obesity-related morbidity and healthcare burden in the United States.
Rationale and Contribution of This Analysis
This study provides urgently needed, post-pandemic national estimates during a period when U.S. obesity patterns are undergoing rapid behavioral and socioeconomic shifts. Few nationally representative datasets with measured anthropometry are available for the 2021–2023 period, making this analysis one of the earliest comprehensive assessments of BMI distribution and obesity prevalence following the COVID-19–related disruptions to daily living, food access, and health care utilization. By updating national benchmarks and quantifying demographic disparities with precision, this study supports clinicians, health systems, and policymakers in recalibrating prevention and treatment priorities for the post-pandemic era. The use of standardized, measured anthropometric data strengthens the reliability of these estimates and fills a critical evidence gap not addressed by self-reported surveys or regional datasets.
Context with Prior Evidence
The prevalence observed here is consistent with the elevated levels reported in pre-pandemic NHANES cycles, indicating no large population-level reversal of the upward trend in BMI in the immediate post-pandemic period. While the pandemic caused notable short-term behavioral changes, population-level anthropometric effects appear to have persisted rather than diminished.
Clinical and Public Health Implications
These nationally representative findings have several implications for clinical practice and population health policy. First, the persistence of elevated mean BMI and high obesity prevalence highlights the continued need for routine anthropometric screening and early lifestyle or metabolic interventions in primary care. The marked disparities observed across sex and racial/ethnic groups underscore the importance of targeted prevention strategies, culturally informed counseling, and improved access to evidence-based weight-management services. At a population level, these findings reinforce the need for sustained investment in surveillance systems such as NHANES, as well as structural interventions that address food environments, physical activity access, and socioeconomic determinants of cardiometabolic risk. Continued monitoring of post-pandemic trends will be critical for guiding future clinical guidelines and public health planning.
Sensitivity analyses excluding extreme BMI values and using an alternate diabetes definition (HbA1c-only) produced nearly identical adjusted odds ratios, indicating that the observed associations were robust to reasonable analytic perturbations.
Clinical Relevance of Findings
The observed BMI and obesity patterns carry important clinical implications. The strong association between higher BMI categories and increased odds of diabetes in this nationally representative sample demonstrates that population-level BMI distributions translate directly into measurable differences in cardiometabolic disease burden. In particular, individuals with obesity had nearly threefold higher adjusted odds of diabetes compared with normal-weight adults. These findings highlight that even modest shifts in the national BMI distribution may have substantial downstream effects on diabetes prevalence, healthcare utilization, and long-term chronic disease risk at the population level.
Novel Contributions of This Study
This study contributes several elements that extend beyond prior surveillance reports. First, it uses the fully resumed 2021–2023 NHANES cycle, which incorporates post-pandemic sampling revisions that have not yet been widely analyzed in published literature. Second, it provides integrated descriptive trends together with adjusted clinical models linking BMI categories to diabetes risk, demonstrating population-level clinical implications rather than reporting unadjusted prevalence alone. Third, the study offers updated subgroup estimates across sex, age, and race/ethnicity using the newly implemented NCHS weighting structure, which differs from pre-pandemic cycles. Collectively, these features make the analysis meaningfully distinct from earlier NHANES-based obesity reports and increase its relevance for public health planning and clinical guideline development.
Strengths and Limitations
0.0.0.4. Strengths
Key strengths include: use of standardized, measured anthropometry from a large nationally representative sample; full incorporation of NHANES complex survey design and combined-cycle weighting; and reproducible analytic code that links BMI categories to clinical biomarkers (HbA1c) using survey-weighted regression.
0.0.0.5. Limitations
This study has several important limitations. First, NHANES is a cross-sectional survey; therefore, causal or temporal inferences cannot be drawn, and observed subgroup differences reflect population-level associations rather than individual longitudinal changes. Second, the 2021–2023 NHANES cycle followed substantial pandemic-related operational disruptions, including suspended fieldwork, altered sampling procedures, and reduced household accessibility. Although the National Center for Health Statistics applied revised integrated survey weights to restore national representativeness, residual nonresponse bias and post-stratification error are possible. Third, BMI—while widely used for epidemiologic surveillance—does not capture body fat distribution, central adiposity, or body composition. Consequently, cardiometabolic risk may be misclassified among older adults with sarcopenia, individuals with high lean mass, or groups with differing fat-distribution patterns. Fourth, certain subgroup estimates, particularly for smaller racial and ethnic groups, may have wider confidence intervals due to reduced sample sizes and pandemic-era sampling modifications. Fifth, NHANES behavioral and socioeconomic variables are self-reported and thus subject to recall bias and social desirability effects, which may influence subgroup comparisons. Despite these limitations, this analysis benefits from a large, nationally representative sample, standardized anthropometric measurements, and rigorous survey-weighted estimation procedures.
What This Study Adds
- Provides the first nationally representative post-pandemic BMI and obesity estimates using the fully resumed NHANES 2021–2023 cycle.
- Quantifies demographic disparities with updated weighting that accounts for COVID-era sampling disruptions.
- Demonstrates clinically significant associations between BMI category and diabetes, highlighting population-level cardiometabolic risk.
By integrating descriptive surveillance with clinically relevant adjusted models and a detailed multipanel visualization of BMI distribution, this work extends beyond simple reporting of means and provides actionable insight for clinicians and public-health practitioners.
Conclusions
In this nationally representative analysis of NHANES 2021–2023, obesity prevalence among U.S. adults remains high, with persistent disparities across sex, age, and race/ethnicity. These findings provide timely post-pandemic benchmarks that reflect ongoing behavioral, socioeconomic, and healthcare shifts in the United States. The stability of elevated BMI levels and the magnitude of demographic differences underscore the continued need for sustained surveillance, targeted prevention strategies, and expanded access to evidence-based obesity treatment. As the first fully resumed NHANES cycle following pandemic-related disruptions, the 2021–2023 data offer critical insight for clinicians, public health practitioners, and policymakers aiming to reduce obesity-related morbidity and address widening health inequities. Taken together, these results emphasize the ongoing clinical relevance of population-level obesity trends and the importance of deploying coordinated, equity-focused public health interventions.
Code availability: Reproducible analytic scripts (R) used to prepare the merged datasets, specify the survey design, generate estimates, and fit the regression models are available from the corresponding author upon reasonable request.
Generative AI statement: Generative AI tools (large language models) were used to assist with editing and drafting of non-technical parts of the manuscript (e.g., grammar and organization). All scientific content, data analysis, and interpretation were performed by the author and the use of AI is limited to editorial assistance.
Author Contributions
PD conceptualized the study, performed data processing and analysis, drafted the manuscript, and approved the final version.
Funding
No external funding was received for this study.
Institutional Review Board Statement
The National Center for Health Statistics (NCHS) Research Ethics Review Board of the Centers for Disease Control and Prevention approved all NHANES 2021–2023 data collection procedures. This study involved secondary analysis of fully de-identified, publicly available NHANES datasets and therefore the NCHS Research Ethics Review Board of the Centers for Disease Control and Prevention waived ethical approval for this work.
Informed Consent Statement
Not applicable.
Data Availability Statement
NHANES 2021–2023 datasets are publicly available from the National Center for Health Statistics (NCHS): https://www.cdc.gov/nchs/nhanes.htm
Acknowledgments
The author thanks the National Center for Health Statistics and the NHANES participants.
Conflicts of Interest
The author declares no conflicts of interest.
References
- Centers for Disease Control and Prevention. National Health and Nutrition Examination Survey (NHANES): Overview. 2023.
- National Center for Health Statistics. NHANES 2021–2023 Public Data Release File Documentation. NCHS; 2023.
- National Center for Health Statistics. NHANES Analytic Guidelines, 2023. U.S. Department of Health and Human Services.
- Flegal KM, Carroll MD, Kit BK, Ogden CL. Prevalence of obesity and trends in BMI among US adults, 1999–2010. JAMA. 2012;307(5):491–497.
- Hales CM, Carroll MD, Fryar CD, Ogden CL. Prevalence of obesity among adults: United States, 2017–2020. NCHS Data Brief. 2020;(360):1–8.
- Ogden CL, Carroll MD, Fryar CD, Flegal KM. Prevalence of obesity among adults and youth: United States, 2011–2014. JAMA. 2014;315(21):2292–2299.
- Fryar CD, Carroll MD, Afful J. Mean body weight, height, and BMI of US adults, 1999–2018. NCHS Data Brief. 2020.
- Wang Y, Beydoun MA. The obesity epidemic in the United States—gender, age, socioeconomic, racial/ethnic, and geographic characteristics. Epidemiol Rev. 2007;29:6–28.
- Hu, FB. Obesity Epidemiology. Oxford University Press; 2008.
- Rosenbaum M, Leibel RL. Role of energy expenditure in obesity. N Engl J Med. 2010;363(3):301–302.
- Hill JO, Wyatt HR. Role of physical activity in preventing and treating obesity. Science. 2003;299(5608):853–855.
- Hebert JR, et al. Social determinants of obesity: socioeconomic and environmental influences. Am J Prev Med. 2013;45(1):S13–S28.
- Sallis JF, et al. The built environment and physical activity: implications for obesity prevention. Lancet. 2016;388(10051):2920–2934.
- Hruby A, Hu FB. The epidemiology of obesity: a big picture. Pharmacol Ther. 2015;144(3):327–337.
- Heymsfield SB, Wadden TA. Mechanisms, pathophysiology, and management of obesity. N Engl J Med. 2017;376(3):254–266.
- Narayan KM, et al. Diabetes and obesity: projections and public-health impacts. JAMA. 2007;298(14):1769–1778.
- American Diabetes Association. Standards of Medical Care in Diabetes—2024. Diabetes Care. 2024;47(Suppl 1):S1–S290.
- Bhutani S, vanDellen MR, Cooper JA. Long-term changes in body weight and body mass index after the COVID-19 pandemic lockdown. Obesity. 2021;29(9):1439–1448.
- Lange SJ, et al. Longitudinal trends in body mass index before and during the COVID-19 pandemic among youth. MMWR. 2021;70(37):1278–1283.
- Zhang X, et al. Changes in adult BMI during the COVID-19 pandemic. JAMA. 2021;326(14):1410–1412.
Figure 1.
Survey-weighted BMI distribution among U.S. adults, NHANES 2021–2023. Panels show: (A) overall weighted BMI density; (B) sex-stratified density curves; (C) race/ethnicity-stratified densities; and (D) weighted BMI histogram using MEC examination weights. All curves were derived from measured anthropometry.
Disclaimer/Publisher’s Note: The statements, opinions and data contained in all publications are solely those of the individual author(s) and contributor(s) and not of MDPI and/or the editor(s). MDPI and/or the editor(s) disclaim responsibility for any injury to people or property resulting from any ideas, methods, instructions or products referred to in the content. |
© 2025 by the authors. Licensee MDPI, Basel, Switzerland. This article is an open access article distributed under the terms and conditions of the Creative Commons Attribution (CC BY) license (http://creativecommons.org/licenses/by/4.0/).
Copyright: This open access article is published under a Creative Commons CC BY 4.0 license, which permit the free download, distribution, and reuse, provided that the author and preprint are cited in any reuse.


