
Submitted:
24 June 2025
Posted:
25 June 2025
You are already at the latest version
Abstract
Noncommunicable diseases (NCDs) are the leading cause of global morbidity and mor-tality, accounting for over 43 million deaths in 2021, with 18 million occurring in indi-viduals under 70 years. Low- and middle-income countries (LMICs) bear the brunt, with over 80% of premature deaths attributed to NCDs, primarily cardiovascular diseases, cancers, chronic respiratory diseases, and diabetes. Beyond health impacts, NCDs drive significant economic losses, estimated at $7 trillion between 2011 and 2025, while preven-tion costs are far lower. This secondary analysis of a national survey explores how body mapping measures such as BMI, waist circumference, and waist-to-hip ratio can predict the risk of major NCDs, including hypertension, diabetes, and heart diseases.
The Ghana STEPS survey employed a cross-sectional design to assess noncommunicable disease (NCD) risk factors nationwide using the WHO STEPwise approach, incorporating demographic and behavioral data collection (Step 1), physical measurements (Step 2), and biochemical assessments (Step 3). A nationally representative sample of 5,775 partici-pants was selected using multistage stratified sampling, ensuring proportional represen-tation by region, urban/rural residency, age, and gender. Ethical approval was obtained, and informed consent was secured from participants. Anthropometric and biochemical data were collected following standardized protocols, including measurements of height, weight, waist and hip circumferences, blood pressure, fasting glucose, and lipid profiles. Data were analyzed using STATA 17.0, accounting for complex survey design with ap-propriate weighting.
The study found significant sex-based differences in anthropometric measures, with men being taller and lighter while women had higher waist and hip circumferences and BMI. The prevalence of NCDs increased with age, highest in participants aged 60–69 years, and was more common in females than males. Lower educational attainment and marital status (widowed, divorced, or separated) were associated with higher NCD prevalence, while obesity and very high waist circumference were the strongest predictors of NCD risk. ROC analysis of anthropometric measures showed fair predictive ability, with waist circumference, BMI, and waist-to-hip ratio showing similar modest performance in iden-tifying individuals with at least one NCD.
Anthropometric measures such as waist circumference, hip circumference, BMI, waist-to-hip ratio, and waist-to-height ratio are strongly associated with the risk of major noncommunicable diseases (NCDs) like hypertension, diabetes, dyslipidemia, and cardi-ovascular events. However, individually, these measures lack sufficient accuracy for effec-tive screening. Integrated screening approaches combining multiple risk factors, along with tailored interventions, should be implemented to improve early detection and man-agement of NCDs, particularly in resource-limited settings.
Keywords:
obesity
; hypertension
; diabetes
; screening
; anthropometric
; BMI
; NCD
1. Introduction
Globally, noncommunicable diseases have the highest morbidity and mortality more than any other group of diseases. According to the World Health Organization, in 2021, noncommunicable diseases (NCDs) was responsible for over 43 million deaths globally, of which 18 million were deaths in people less than 70 years [1]. More than 80% of all noncommunicable diseases deaths in persons aged less than 70 years occurs in low-and middle-income countries (LMIC) [2]. Cardiovascular diseases are leading cause, responsible for 19 million deaths, followed by cancers (10 million), chronic respiratory diseases (4 million), and diabetes (over 2 million) [1].
NCDs pushes many people into poverty, as it leads to loss of productivity along with catastrophic health expenditure which leads to insuperable access barriers to healthcare services for some people living with NCDS [3]. LMICs are projected to lose about $7 trillion (2011 – 2025) with annual loss of about $500 billion due to treatment of NCDs. Cost of interventions to prevent or reduce the burden of NCDs are projected as $170 billion for the same period [4]. There is therefore the urgency of improving financial risk protection in health in LMIC settings and ensuring that NCDs are taken into to integrated NCDs interventions to address NCDs related mortality [5].
Addressing NCDs requires among other interventions, screening and identification of high-risk individuals and putting measures to address the modifiable risk factors. Global evidence shows that a combination of four behavioral risk factors—notably tobacco smoking, harmful consumption of alcohol, lack of physical exercise, and unhealthy diets—account for more than a third of NCDs. Genetic or metabolic risk factors like obesity, high cholesterol, high fasting blood glucose, and high blood pressure also have direct impacts on risk vulnerability for NCDs [6]. However, other factors easily identifiable through body mapping and anthropometric measures with the aid of less expensive tools include body mass index (BMI), waist circumference, hip circumference, waist to hip ratio [7]. Waist circumference and waist-to-hip ratio (WHR) are widely used as proxy measures for visceral adipose tissue (VAT) due to their strong association with elevated risks of various health conditions and mortality across most populations [7,8].
Obesity is a well-known risk factor for prediabetes, impaired glucose intolerance and diabetes [9,10]. The impact of obesity is also garnering greater attention among cancer prevention efforts as well particularly with colorectal cancer and female breast cancer [11,12]. Additionally, there is increasing evidence that obesity and chronic lung disease are inter-related [13]. In Ghana, Nuertey et al. demonstrated that, hypertension, arthritis, dyslipidemia, blindness and visual impairment were associated with obesity among the elderly [14,15]. In addition , several other studies in Ghana have shown the rising trend of obesity across the lifespan [16,17,18] with prominence among children, and young adults [19,20,21,22]. Obesity is one side of the double burden of malnutrition, and in 2024, more people were obese than underweight in every WHO region of the world except for South-East Asia Region [23]. The aim of this secondary analysis of the data from the nationwide survey of risk factors for NCDs using the WHO STEPwise approach to NCD surveillance is to determine the association of elements of body mapping such as BMI, waist circumference, hip circumference, waist to hip ratio on the risk of developing any of the major noncommunicable diseases; hypertension, diabetes, dyslipidemia and history of heart attack or stroke and determine the ability of each of the body mapping factors to correctly predict the likelihood of an adult living with any of the major NCDs.
2. Materials and Methods
Study Design
The Ghana STEPS survey utilized a cross-sectional design to assess the prevalence of non-communicable diseases (NCDs) risk factors across the country. The study followed the World Health Organization’s (WHO) STEPwise approach, which includes three sequential components: Step 1: Collection of demographic and behavioral data through a structured questionnaire. Step 2: Physical measurements such as height, weight, blood pressure, and waist circumference. Step 3: Biochemical assessments, including fasting blood glucose and lipid profiles.
Sample Size and Sampling Procedure
The sample size of 5,775 participants was calculated based on a precision-based formula, considering a 95% confidence level, a 5% margin of error, and a design effect of 1.5 to account for cluster sampling and stratification . A multistage sampling technique was employed to ensure national representation:
Stage 1: Enumeration areas (EAs) were selected using a probability proportional to size method. Stage 2: Fifteen households were randomly selected from each EA.
Stage 3: One eligible participant was randomly selected from each household using an electronic randomization tool embedded in the eSTEPS application. Stratification was applied to ensure proportional representation by region, urban/rural residency, age, and gender.
Ethical Approval and Participant Consent
Ethical clearance was obtained from the Ghana Health Service Ethics Review Committee before initiating the survey (GHS-ERC 032/08/22). All participants received detailed information about the study’s purpose, procedures, and potential risks. Written informed consent was obtained from each participant before enrollment. Confidentiality was maintained through data anonymization and secure storage systems.
Outcome Variables
The outcome variable is defined as having being diagnosed of the at least one of the major noncommunicable diseases; hypertension, diabetes, dyslipidemia, history of heart attack or stroke. To obtain this, any participant who answered “yes” to any of the questions “Have you ever been told by a doctor or other health worker that you have raised blood pressure or hypertension?”, “Have you ever been told by a doctor or other health worker that you have raised blood sugar or diabetes?”, “Have you ever been told by a doctor or other health worker that you have raised cholesterol?”, and “Have you ever had a heart attack or chest pain from heart disease (angina) or a stroke (cerebrovascular accident or incident)?” were coded as having an NCD event and those who did not answer yes to any of these questions were coded as not having an NCD diagnosis. For the measurements, for hypertension, diabetes and total cholesterol, the reference ranges were applied to classify each individual as having any of the above diagnosis or not. For hypertension, the average of all three repeated measurements of systolic and diastolic blood pressures were used to classify a patient as hypertensive.
Anthropometric and Other Measurements
Pregnant women were excluded from all anthropometric measurements. Height was measured to the nearest 0.1 cm using a portable stadiometer, with participants standing upright without shoes, feet together. Weight was measured to the nearest 0.1 kg using a calibrated (Omron body composition monitor) digital weighing scale, with participants wearing light clothing and no shoes. Waist circumference (WC) was measured to the nearest 0.1 cm using a flexible, non-stretchable measuring tape placed midway between the lower margin of the last rib and the top of the iliac crest, with the participant in a standing position at the end of a normal expiration. Hip circumference (HC) was measured at the widest part of the hips to the nearest 0.1 cm. The waist-to-hip ratio (WHR) was calculated as the ratio of waist circumference to hip circumference, and the waist-to-height ratio (WHtR) was also computed. Hip circumference was classified as normal, increased, or substantially increased based on established thresholds.
A point-of-care analyzer, CardioChek plus was used to measure the Total Cholesterol, and HDL and the result recorded directly on the Android tablet , and the Onetouch Select Plus for fasting blood glucose.
Data Collection Process
The data collection process occurred in three phases: Phase 1: Questionnaire Administration; Demographic and behavioral data, including age, gender, education, smoking habits, alcohol consumption, physical activity, and dietary habits, were collected using an interviewer-administered questionnaire. Interviews were conducted in local languages, including Twi, Ga, Ewe, and Dagbanli, with interpreters engaged where necessary. Phase 2: Physical Measurements; Physical measurements were conducted using standardized equipment and protocols: Height was measured using a portable stadiometer. Weight was measured using calibrated digital scales. Blood pressure was recorded using automated monitors (Omron), with three readings taken at five-minute intervals. Waist circumference was measured with a non-stretchable measuring tape. Phase 3: Bio-sample Collection; Fasting blood and urine samples were collected to assess glucose levels using One Touch select plus flex, lipid profiles, and other biochemical markers measured with CardioChek Plus. Participants were instructed to fast for 8–12 hours before sample collection. Samples were processed in accordance with WHO biosafety and quality control guidelines.
Data Analysis
Data were analyzed using STATA version 17.0 (StataCorp, College Station, TX, USA). Analysis accounted for the complex survey design, with appropriate weighting applied to generate nationally representative estimates. Prevalence and associations between variables were assessed using descriptive and inferential statistical methods. The weighting process was conducted at three distinct levels: individual-level weighting, population distribution weighting, and adjustment for non-response. The final weight was calculated as the inverse of the product of these three components. For the analysis, data were stratified by age groups and rural-urban classifications. Descriptive statistical methods were utilized to summarize the socio-demographic characteristics of the participants and the prevalence of obesity and categorized using the standard BMI cutoffs. Categorical variables were reported as frequencies and percentages, while continuous variables were summarized as means with their corresponding standard deviations (SD), where appropriate.
BMI was coded according to the WHO classification; Underweight: BMI <18.499, Normal weight: BMI 18.5-24.99, Overweight: ≥25.0 BMI ≤ 29.99 and Obesity: BMI ≥30.0. Also for waist circumference, the following cut offs were used: for men, <94.9cm normal, 95-101.9 cm high and ≥102 cm very High. And for females, <80cm for normal, 80 – 87.9 cm for high and ≥ 88cm for very high. Also for hip circumference, males, <93.999=normal, 94/101.999=increased, ≥102 =substantially increased and for the females, ≤79.999=normal, 80 - 87.99=increased, and ≥88/max=Substantially increased. For waist to hip ratio, whr ≥ 0.9 for men and 0.85cm for women was considered as substantially increased. Statistical significance was determined using a p-value threshold of <0.05. To explore factors linked to the outcome variable of having a diagnosis of a non-communicable disease (NCD), univariate logistic regression was conducted to calculate crude odds ratios (ORs) along with 95% confidence intervals (CIs). Variables with a p-value below 0.20 in the univariate analysis were included in a multivariable logistic regression model to control for potential confounding factors and to compute adjusted odds ratios (AORs) with 95% CIs. The final model was optimized using a backward stepwise approach guided by the Akaike Information Criterion (AIC). Variance inflation factor (VIF) analysis was employed to check for multicollinearity among independent variables, with a VIF >10 indicating no significant collinearity. The Hosmer-Lemeshow test was used to assess the goodness-of-fit of the multivariable model. All analyses adhered to the STROBE (Strengthening the Reporting of Observational Studies in Epidemiology) guidelines to ensure clarity and reproducibility.
3. Results
3.1. Characteristics of Study Participants
Table 1 presents the characteristics of study participants by sex, including age, height, weight, waist circumference, hip circumference, BMI, waist-to-hip ratio, and waist-to-height ratio. The mean age for all participants was 35.14 years, with men having a slightly lower mean age (34.82 years) compared to women (35.47 years). Men were taller (170.3 cm) than women (159.71 cm), and their weight was slightly lower (65.56 kg) compared to women (66.89 kg). Waist circumference was smaller in men (81.9 cm) than in women (88.3 cm), while women had a larger hip circumference (101 cm) compared to men (94.3 cm). The overall BMI was 24.9, with men having a lower BMI (22.7) than women (26.3). The waist-to-hip ratio was similar between men and women, while the waist-to-height ratio was lower in men (0.481) than in women (0.555). These differences in physical characteristics highlight variations between male and female participants.
3.2. Characteristics of Participants with at Least One Self-Reported NCD Diagnosis
Table 2 presents the distribution of participants with at least one non-communicable disease (NCD) diagnosis according to demographic, socioeconomic, and anthropometric variables. Significant findings are as follows: The prevalence of NCDs increased progressively with age, with the lowest prevalence observed in the youngest group (18–29 years: 14.2%, 95% CI: 11.8–17.0) and the highest in participants aged 60–69 years (52.1%, 95% CI: 46.8–57.4, p < 0.001). This trend underscores age as a strong determinant of NCD burden. Sex differences were notable, with females exhibiting a higher prevalence of NCDs (30.8%, 95% CI: 28.6–33.1) compared to males (21.3%, 95% CI: 18.7–24.0, p < 0.001).
Educational attainment showed a significant association with NCD prevalence (p = 0.006). Participants with no formal education had the highest prevalence (30.6%, 95% CI: 27.8–33.5), whereas those with primary education had the lowest (21.6%, 95% CI: 16.9–27.2). Participants with secondary or tertiary education demonstrated intermediate prevalence rates, suggesting a complex interaction between education level and health outcomes. Marital status was significantly associated with NCD prevalence (p < 0.001). Those currently married had the highest prevalence (31.6%, 95% CI: 29.4–33.9). This was followed by participants classified as “others” (36.0%, 95% CI: 32.3–39.9), which include widowed, divorced, or separated individuals. Participants who had never married had the lowest prevalence (14.9%, 95% CI: 12.3–17.8). Occupation also influenced NCD prevalence (p < 0.001). Self-employed individuals had a higher prevalence (30.3%, 95% CI: 28.2–32.6), as did government employees (27.2%, 95% CI: 20.4–35.3). Unemployed participants and those in non-government employment demonstrated lower prevalence rates.
Body mass index (BMI) revealed a strong association with NCD prevalence. Obesity was associated with the highest prevalence (44.6%, 95% CI: 40.2–49.0), followed by overweight individuals (32.0%, 95% CI: 28.5–35.6). Participants with normal BMI had significantly lower prevalence (20.5%, 95% CI: 18.3–22.9), and underweight individuals had the lowest prevalence (19.9%, 95% CI: 15.3–25.3). Anthropometric measurements further highlighted the association between body composition and NCDs. Participants with very high waist circumference had a prevalence of 44.5% (95% CI: 40.8–48.2), compared to 27.7% (95% CI: 24.2–31.6) for those with high waist circumference and 20.2% (95% CI: 18.1–22.5) for those with normal waist circumference. Similarly, participants with substantially increased hip circumference had the highest prevalence (32.0%, 95% CI: 29.8–34.2), while those with normal hip circumference had the lowest prevalence (18.5%, 95% CI: 15.3–22.0, p < 0.001).
In contrast, ethnicity and religion did not show statistically significant differences in NCD prevalence. Across ethnic groups, prevalence ranged from 24.7% (95% CI: 20.7–29.3) among Mole Dagbani participants to 33.3% (95% CI: 27.3–40.0) among Ga/Dangme participants (p = 0.238). Similarly, across religious groups, prevalence varied minimally, ranging from 20.4% (95% CI: 13.5–29.5) among participants of other religions to 29.2% (95% CI: 22.6–36.8) among those practicing traditional religions (p = 0.412).
3.3. Body Mapping Related Factors Associated with at Least One Self-Reported NCD Diagnosis
Table 3 presents the risk factors associated with non-communicable diseases (NCDs), with crude odds ratios (CORs) and adjusted odds ratios (AORs) reported alongside confidence intervals (CIs) and p-values. Age was strongly associated with NCD risk, with the odds increasing progressively in older age groups. Compared to participants aged 18–29 years, those aged 30–44 years had an AOR of 1.85 (95% CI: 1.43–2.41, p < 0.001), while participants aged 45–59 years and 60–69 years had higher risks, with AORs of 3.18 (95% CI: 2.37–4.26, p < 0.001) and 5.38 (95% CI: 3.90–7.42, p < 0.001), respectively. Females had higher odds of having NCDs compared to males in crude analysis (COR: 1.65, 95% CI: 1.36–2.01, p < 0.001); however, the association was not statistically significant after adjustment (AOR: 1.22, 95% CI: 0.91–1.63, p = 0.186).
Educational attainment showed mixed associations. While primary education was protective in crude analysis (COR: 0.63, 95% CI: 0.45–0.87, p = 0.006), the association was not significant after adjustment (AOR: 0.87, 95% CI: 0.60–1.26, p = 0.473). Tertiary education was associated with increased NCD risk after adjustment (AOR: 1.36, 95% CI: 1.01–1.82, p = 0.042). Ethnicity showed limited associations, with Mole Dagbani participants having a significantly higher NCD risk compared to Akan participants after adjustment (AOR: 1.42, 95% CI: 1.02–1.97, p = 0.036). Marital status was a significant factor, as participants classified as “others” (widowed, divorced, or separated) had an elevated NCD risk compared to those who were never married (AOR: 1.40, 95% CI: 1.04–1.89, p = 0.028), while the association for currently married participants was not significant after adjustment (AOR: 1.26, 95% CI: 0.94–1.68, p = 0.118).
Obesity was a strong risk factor, with obese participants having an AOR of 1.77 (95% CI: 1.15–2.74, p = 0.010) compared to underweight individuals. Overweight participants showed elevated crude odds (COR: 1.90, 95% CI: 1.32–2.74, p = 0.001), but the association was not significant after adjustment (AOR: 1.29, 95% CI: 0.86–1.94, p = 0.219). Participants with very high waist circumference had significantly increased odds of NCDs compared to those with normal waist circumference (AOR: 1.47, 95% CI: 1.06–2.02, p = 0.019). Substantially increased hip circumference was associated with higher NCD risk in crude analysis (COR: 2.08, 95% CI: 1.62–2.66, p < 0.001); however, this association was not significant after adjustment (AOR: 1.04, 95% CI: 0.74–1.47, p = 0.813).
Occupational status did not show statistically significant associations with NCD risk after adjustment for otther socio-demographic variables. Self-employment and government employment, among other categories, were not significantly related to NCD risk (p > 0.05). Religious affiliation also showed no significant associations with NCD risk in both crude and adjusted models. These findings highlight the critical role of age, obesity, and body composition as primary risk factors for NCDs, while other variables like education and marital status demonstrate nuanced relationships. Table 4 displays risk factors associated with having at least one of the measured NCDs: raised blood pressure, raised fasting blood sugar, raised total cholesterol and a history of myocardial infarction or Cerebrovascular accident.
3.4. Receiver Operator Curve Analysis of Body Mapping Indicators as a Predictor of Having at Least One Measured NCD; Hypertension, Diabetes, Dyslipidemia or Self-Reported Myocardial Infarction or Stroke
The Receiver Operator Curve (ROC) analysis assessed body mapping indicators as predictors of having at least one non-communicable disease (NCD), including hypertension, diabetes, dyslipidemia, myocardial infarction, or stroke. Waist circumference had an ROC area of 0.607 (95% CI: 0.593–0.621), indicating fair predictive performance. Using a cut-off of “high,” it demonstrated a sensitivity of 52.9%, specificity of 66.4%, and correctly classified 59.1% of participants. Hip circumference showed an ROC area of 0.576 (95% CI: 0.562–0.591) with a cut-off of “increased,” achieving 81.3% sensitivity, 30.2% specificity, and 57.5% correct classification. Waist-to-hip ratio had an ROC area of 0.592 (95% CI: 0.578–0.606) with a cut-off of “increased,” sensitivity of 54.7%, specificity of 63.7%, and correctly classified 58.9% of participants. Body mass index (BMI) showed an ROC area of 0.598 (95% CI: 0.584–0.613) with a cut-off of “overweight,” sensitivity of 49.0%, specificity of 69.3%, and 58.5% correct classification. Overall, all indicators demonstrated modest predictive ability, with no single measure strongly outperforming the others. Table 5 and Figure 1 displays the results from the ROC analysis.
4. Discussion
The study examined body mapping related factors as Risk Factors for Non-Communicable Diseases in Ghana using the data evidence from Ghana’s 2023 Nationwide STEPS Survey. The analysis revealed statistically significant association of body mapping factors such as BMI, waist circumference, hip circumference and waist to hip ratio with the likelihood of having at least one diagnosis of a noncommunicable disease. However, none of these factors demonstrate strong test performance in a receiver operator characteristics analysis to successfully predict a person living with at least one of the major NCDS; hypertension, Diabetes, Dyslipidemia and a history of Myocardial infarction or cerebrovascular accident.
Anthropometric measures, including BMI, waist circumference, and hip circumference, are well known factors that are associated with the risk of developing noncommunicable diseases. Hewage et al. in 2023 found out that, BMI, WC, WHR, and HC are intercorrelated anthropometric measurements that can be used either alone or in combination to define obesity and detect the risk for NCDs, including diabetes mellitus, cardiovascular disease, and infertility [24]. Other studies in other African countries produced similar findings [25,26,27]. Also the WHO expert consultation on Waist circumference and waist-hip ratio in 2008 [28], concluded that previously used anthropometric indicators and measures, such as BMI, waist circumference, and waist-to-hip ratio, are effective in predicting chronic disease risk. The experts further recommended that result of any waist circumference and waist-to-hip ratio thresholds established through the recommended process could be applied independently or alongside BMI. Notwithstanding these recommendations, in this study, BMI emerged as a particularly significant risk factor for having at least one of the major NCDs, with obese participants experiencing the highest prevalence rates when compared to the other body measurements. These findings emphasize the critical role of body composition in NCD risk and highlight the need for interventions targeting obesity as a modifiable factor. Older age groups demonstrated significantly increased odds of NCDs, with participants aged 60–69 years showing over fivefold higher odds compared to those aged 18–29 years.
Several studies revealed a range of health risks associated with elevated waist circumference, including hypertension, diabetes mellitus, high cholesterol, joint and lower back pain, hyperuricemia, and Obstructive Sleep Apnea Syndrome [29]. Cardiovascular diseases particularly have been found to have a high association with elevated waist circumference [30,31,32]with most studies describing weight to height ratio as a more accurate tool for predicting hypertension than waist to hip circumference and BMI [33,34].
This study explored which of this body mapping factors that produce a better screening test performance for predicting the likelihood of a person having at least one of the major NCDs included in the WHO STEPS survey. Receiver Operator Curve (ROC) analysis showed that body mapping indicators provided modest predictive value for NCDs. Waist circumference demonstrated the highest area under the curve (AUC), but no single measure exhibited strong predictive performance. Jia et al. using ROC analysis also found out that Waist to height ratio, and to some degree Waist circumference, are the best predictors of type 2 diabetes, followed by BMI then waist to hip ratio which is the weakest predictor in the tested adults [35].
These findings suggests that, it is not absolutely correct to look at a person and based on the perceived size or measurement of BMI, waist circumference, hip circumference, waist to hip ratio to accurately make a determination on the likelihood of the individual to be living with a major NCDs such as diabetes or Hypertension or raised total cholesterol or have a history of a non-fatal heart attack or stroke.
This study had some limitations. It did not compare the test performance of each of the body mapping characteristics studied in this study with the individual NCDs studied in the study. Future studies should consider this type of analysis..
5. Conclusions
Waist circumference, hip circumference, BMI, waist to hip ratio, waist to height ratio have a strong association with the likelihood of living with at least one of this NCDs; hypertension, Diabetes, dyslipidemia, and a history of a non-fatal myocardial infarction or stroke. However, none of these factors independently has a good test performance in screening for individuals living with any of these noncommunicable diseases.
Author Contributions
Conceptualization, Benjamin Nuertey, Joana Ansong and Philip Tabong; Data curation, Benjamin Nuertey, Joana Ansong, Yaw Ampem Amoako, Frank Lule, Sybill Sori and Abraham Hodgson; Formal analysis, Benjamin Nuertey; Investigation, Priscilla Eshun, Yaw Ampem Amoako and Terrence Totah; Methodology, Benjamin Nuertey, Joana Ansong, Edmond Nartey and Philip Tabong; Project administration, Pascal Mwin and Sybill Sori; Supervision, Joana Ansong, Yaw Ampem Amoako and Abraham Hodgson; Validation, Pascal Mwin, Leveana Gyimah and Emmanuel Abbequaye; Writing – original draft, Benjamin Nuertey, Joana Ansong, Edmond Nartey and Philip Tabong; Writing – review & editing, Benjamin Nuertey, Emmanuel Abbequaye, Priscilla Eshun and Yaw Ampem Amoako.
Funding
This research was funded by the Norwegian Government and UK Foreign, Commonwealth and Development Office (FCDO) through the World Health Organization. and “The APC was funded by authors”.
Institutional Review Board Statement
The study was conducted in accordance with the Declaration of Helsinki, and approved by the Ethics Review Committee of the Ghana Health Service (GHS-ERC 032/08/22).
Informed Consent Statement
Informed consent was obtained from all subjects involved in the study.
Data Availability Statement
The raw data supporting the conclusions of this article will be made available by the authors on request.
Acknowledgments
We would like to thank Gladys Obuobie, Cynthia Hagan, Samuel Hagan, Dr Baffour Awuah, Dr Emmanuel Boateng, Rosemary Kisseh, Mr Eric Oppong, Dr Patrick Kuma Aboagye, the Regional Directors of Health Service, Data Collectors, Ghana Health Service NCD Program Staff for various level of support to this work.
Conflicts of Interest
The authors declare no conflicts of interest. The funders had no role in the design of the study; in the collection, analyses, or interpretation of data; in the writing of the manuscript; or in the decision to publish the results.
Abbreviations
The following abbreviations are used in this manuscript:
| NCD | Non-Communicable Disease |
| LMIC | Low- and Middle-Income Countries |
| BMI | Body Mass Index |
| WC | Waist Circumference |
| HC | Hip Circumference |
| WHR | Waist-to-Hip Ratio |
| WHtR | Waist-to-Height Ratio |
| VAT | Visceral Adipose Tissue |
| STEPS | STEPwise Approach to Surveillance (WHO methodology) |
| WHO | World Health Organization |
| GHS-ERC | Ghana Health Service Ethics Review Committee |
| ROC | Receiver Operator Characteristic |
| AUC | Area Under the Curve |
| COR | Crude Odds Ratio |
| AOR | Adjusted Odds Ratio |
| HDL | High-Density Lipoprotein |
| eSTEPS | Electronic STEPS application used for data collection |
References
- World Health Organization. Non communicable diseases, fact sheets. In: Noncommunicable disease fact sheet [Internet]. 23 Dec 2024 [cited 14 Jan 2025]. Available online: https://www.who.int/news-room/fact-sheets/detail/noncommunicable-diseases.
- Ezzati M, Pearson-Stuttard J, Bennett JE, Mathers CD. Acting on non-communicable diseases in low- and middle-income tropical countries. Nature. 2018, 559, 507–516. [Google Scholar] [CrossRef] [PubMed]
- Eze P, Lawani LO, Agu UJ, Acharya Y. Catastrophic health expenditure in sub-Saharan Africa: systematic review and meta-analysis. Bull World Health Organ. 2022, 100, 337–351J. [Google Scholar] [CrossRef]
- World Economic Forum. Why the 21st century’s biggest health challenge is our shared responsibility. 2018.
- Kankeu HT, Saksena P, Xu K, Evans DB. The financial burden from non-communicable diseases in low- and middle-income countries: a literature review. Health Res Policy Syst. 2013, 11, 31. [Google Scholar] [CrossRef] [PubMed]
- World Health Organization. Noncommunicable diseases country profiles 2018. 2018 [cited 14 Jan 2025]. Available online: https://apps.who.int/iris/bitstream/handle/10665/274512/9789241514620-eng.pdf.
- Mbanya VN, Kengne AP, Mbanya JC, Akhtar H. Body mass index, waist circumference, hip circumference, waist–hip-ratio and waist–height-ratio: Which is the better discriminator of prevalent screen-detected diabetes in a Cameroonian population? Diabetes Res Clin Pract. 2015, 108, 23–30. [Google Scholar] [CrossRef]
- Hewage N, Wijesekara U, Perera R. Determining the best method for evaluating obesity and the risk for non-communicable diseases in women of childbearing age by measuring the body mass index, waist circumference, waist-to-hip ratio, waist-to-height ratio, A Body Shape Index, and hip index. Nutrition. 2023, 114, 112135. [Google Scholar] [CrossRef]
- Yoon KH, Lee JH, Kim JW, Cho JH, Choi YH, Ko SH, et al. Epidemic obesity and type 2 diabetes in Asia. Lancet. 2006. [Google Scholar] [CrossRef]
- Chan JCN, Malik V, Jia W, Kadowaki T, Yajnik CS, Yoon KH, et al. Diabetes in Asia: epidemiology, risk factors, and pathophysiology. JAMA - Journal of the American Medical Association 2009. [CrossRef]
- De Pergola G, Silvestris F. Obesity as a Major Risk Factor for Cancer. J Obes. 2013. [CrossRef]
- Fortner RT, Katzke V, Kühn T, Kaaks R. Obesity and breast cancer. Recent Results in Cancer Research. 2016. [Google Scholar] [CrossRef]
- Zammit C, Liddicoat H, Moonsie I, Makker H. Obesity and respiratory diseases. Int J Gen Med. 2010. [Google Scholar]
- Nuertey BD, Alhassan AI, Nuertey AD, Mensah IA, Adongo V, Kabutey C, et al. Prevalence of obesity and overweight and its associated factors among registered pensioners in Ghana; a cross sectional studies. BMC Obes. 2017, 4, 26. [Google Scholar] [CrossRef]
- Nuertey BD, Amissah-Arthur KN, Addai J, Adongo V, Nuertey AD, Kabutey C, et al. Prevalence, Causes, and Factors Associated with Visual Impairment and Blindness among Registered Pensioners in Ghana. J Ophthalmol. 2019, 2019, 1717464. [Google Scholar] [CrossRef]
- Akowuah PK, Kobia-Acquah E. Childhood Obesity and Overweight in Ghana: A Systematic Review and Meta-Analysis. J Nutr Metab. 2020, 2020, 1–11. [Google Scholar] [CrossRef]
- Boateng GO, Adams EA, Odei Boateng M, Luginaah IN, Taabazuing M-M. Obesity and the burden of health risks among the elderly in Ghana: A population study. PloS One. 2017, 12, e0186947. [Google Scholar]
- Ofori-Asenso R, Agyeman AA, Laar A, Boateng D. Overweight and obesity epidemic in Ghana—a systematic review and meta-analysis. BMC Public Health. 2016, 16, 1239. [Google Scholar] [CrossRef]
- Amoadu M, Obeng P, Abekah Baah J, Acquah P, Cobbinah G, Aku Ogum M, et al. Overweight and Obesity Among In-School Children and Adolescents (5–19 Years) in Ghana: A Scoping Review of Prevalence and Risk Factors. Weller A, editor. J Obes. 2024, 2024, 8895265. [Google Scholar] [CrossRef]
- Abubakar MB, Uthman YA, Ibrahim KG. Prevalence of overweight and obesity among health-care workers in Ghana: a systematic review. Niger J Exp Clin Biosci. 2021, 9, 47–53. [Google Scholar] [CrossRef]
- Asosega KA, Adebanji AO, Abdul IW. Spatial analysis of the prevalence of obesity and overweight among women in Ghana. BMJ Open. 2021, 11, e041659. [Google Scholar] [CrossRef]
- Asosega KA, Aidoo EN, Adebanji AO, Owusu-Dabo E. Examining the risk factors for overweight and obesity among women in Ghana: A multilevel perspective. Heliyon. 2023, 9, https://www.cell.com/heliyon/fulltext/S2405-8440(23)03414–X. [Google Scholar]
- World Health Organization. Obesity. In: Health topics [Internet]. 2024 [cited 14 Jan 2025]. Available online: https://www.who.int/westernpacific/health-topics/obesity.
- Hewage N, Wijesekara U, Perera R. Determining the best method for evaluating obesity and the risk for non-communicable diseases in women of childbearing age by measuring the body mass index, waist circumference, waist-to-hip ratio, waist-to-height ratio, A Body Shape Index, and hip index. Nutrition. 2023, 114, 112135. [Google Scholar] [CrossRef]
- Mbanya VN, Kengne AP, Mbanya JC, Akhtar H. Body mass index, waist circumference, hip circumference, waist–hip-ratio and waist–height-ratio: Which is the better discriminator of prevalent screen-detected diabetes in a Cameroonian population? Diabetes Res Clin Pract. 2015, 108, 23–30. [Google Scholar] [CrossRef]
- Kruger HS, Venter CS, Vorster HH. Obesity in African women in the North West Province, South Africa is associated with an increased risk of non-communicable diseases: the THUSA study. Br J Nutr. 2001, 86, 733–740. [Google Scholar] [CrossRef] [PubMed]
- Oumer A, Ale A, Tariku Z, Hamza A, Abera L, Seifu A. Waist-to-hip circumference and waist-to-height ratio could strongly predict glycemic control than body mass index among adult patients with diabetes in Ethiopia: ROC analysis. Plos One. 2022, 17, e0273786. [Google Scholar]
- Organization WH. Waist circumference and waist-hip ratio: report of a WHO expert consultation, Geneva, 8-11 December 2008. 2011 [cited 17 Jan 2025]. Available online: https://apps.who.int/iris/bitstream/handle/10665/44583/?sequence=1.
- Darsini D, Hamidah H, Notobroto HB, Cahyono EA. Health Risks Associated with High Waist Circumference: A Systematic Review. J Public Health Res. 2020, 9, jphr.2020.1811. [Google Scholar] [CrossRef] [PubMed]
- Zhang W, He K, Zhao H, Hu X, Yin C, Zhao X, et al. Association of body mass index and waist circumference with high blood pressure in older adults. BMC Geriatr. 2021, 21, 260. [Google Scholar] [CrossRef]
- Sun J, Ma Y, Liu H, Qu Q, Cheng C, Kong X, et al. High waist circumference is a risk factor of new-onset hypertension: Evidence from the China Health and Retirement Longitudinal Study. J Clin Hypertens. 2022, 24, 320–328. [Google Scholar] [CrossRef]
- Sun J-Y, Hua Y, Zou H-Y-Y, Qu Q, Yuan Y, Sun G-Z, et al. Association between waist circumference and the prevalence of (Pre) hypertension among 27,894 US adults. Front Cardiovasc Med. 2021, 8, 717257. [Google Scholar] [CrossRef]
- Moosaie F, Fatemi Abhari SM, Deravi N, Karimi Behnagh A, Esteghamati S, Dehghani Firouzabadi F, et al. Waist-to-height ratio is a more accurate tool for predicting hypertension than waist-to-hip circumference and BMI in patients with type 2 diabetes: a prospective study. Front Public Health. 2021, 9, 726288. [Google Scholar] [CrossRef] [PubMed]
- Ke J-F, Wang J-W, Lu J-X, Zhang Z-H, Liu Y, Li L-X. Waist-to-height ratio has a stronger association with cardiovascular risks than waist circumference, waist-hip ratio and body mass index in type 2 diabetes. Diabetes Res Clin Pract. 2022, 183, 109151. [Google Scholar] [CrossRef]
- Jia Z, Zhou Y, Liu X, Wang Y, Zhao X, Wang Y, et al. Comparison of different anthropometric measures as predictors of diabetes incidence in a Chinese population. Diabetes Res Clin Pract. 2011, 92, 265–271. [Google Scholar] [CrossRef]
Figure 1.
Receiver operator characteristic curve showing area under curve for A. Body Mass Index, B. Hip circumference, C. Waist circumference and D. Waist to hip ratio.
Figure 1.
Receiver operator characteristic curve showing area under curve for A. Body Mass Index, B. Hip circumference, C. Waist circumference and D. Waist to hip ratio.
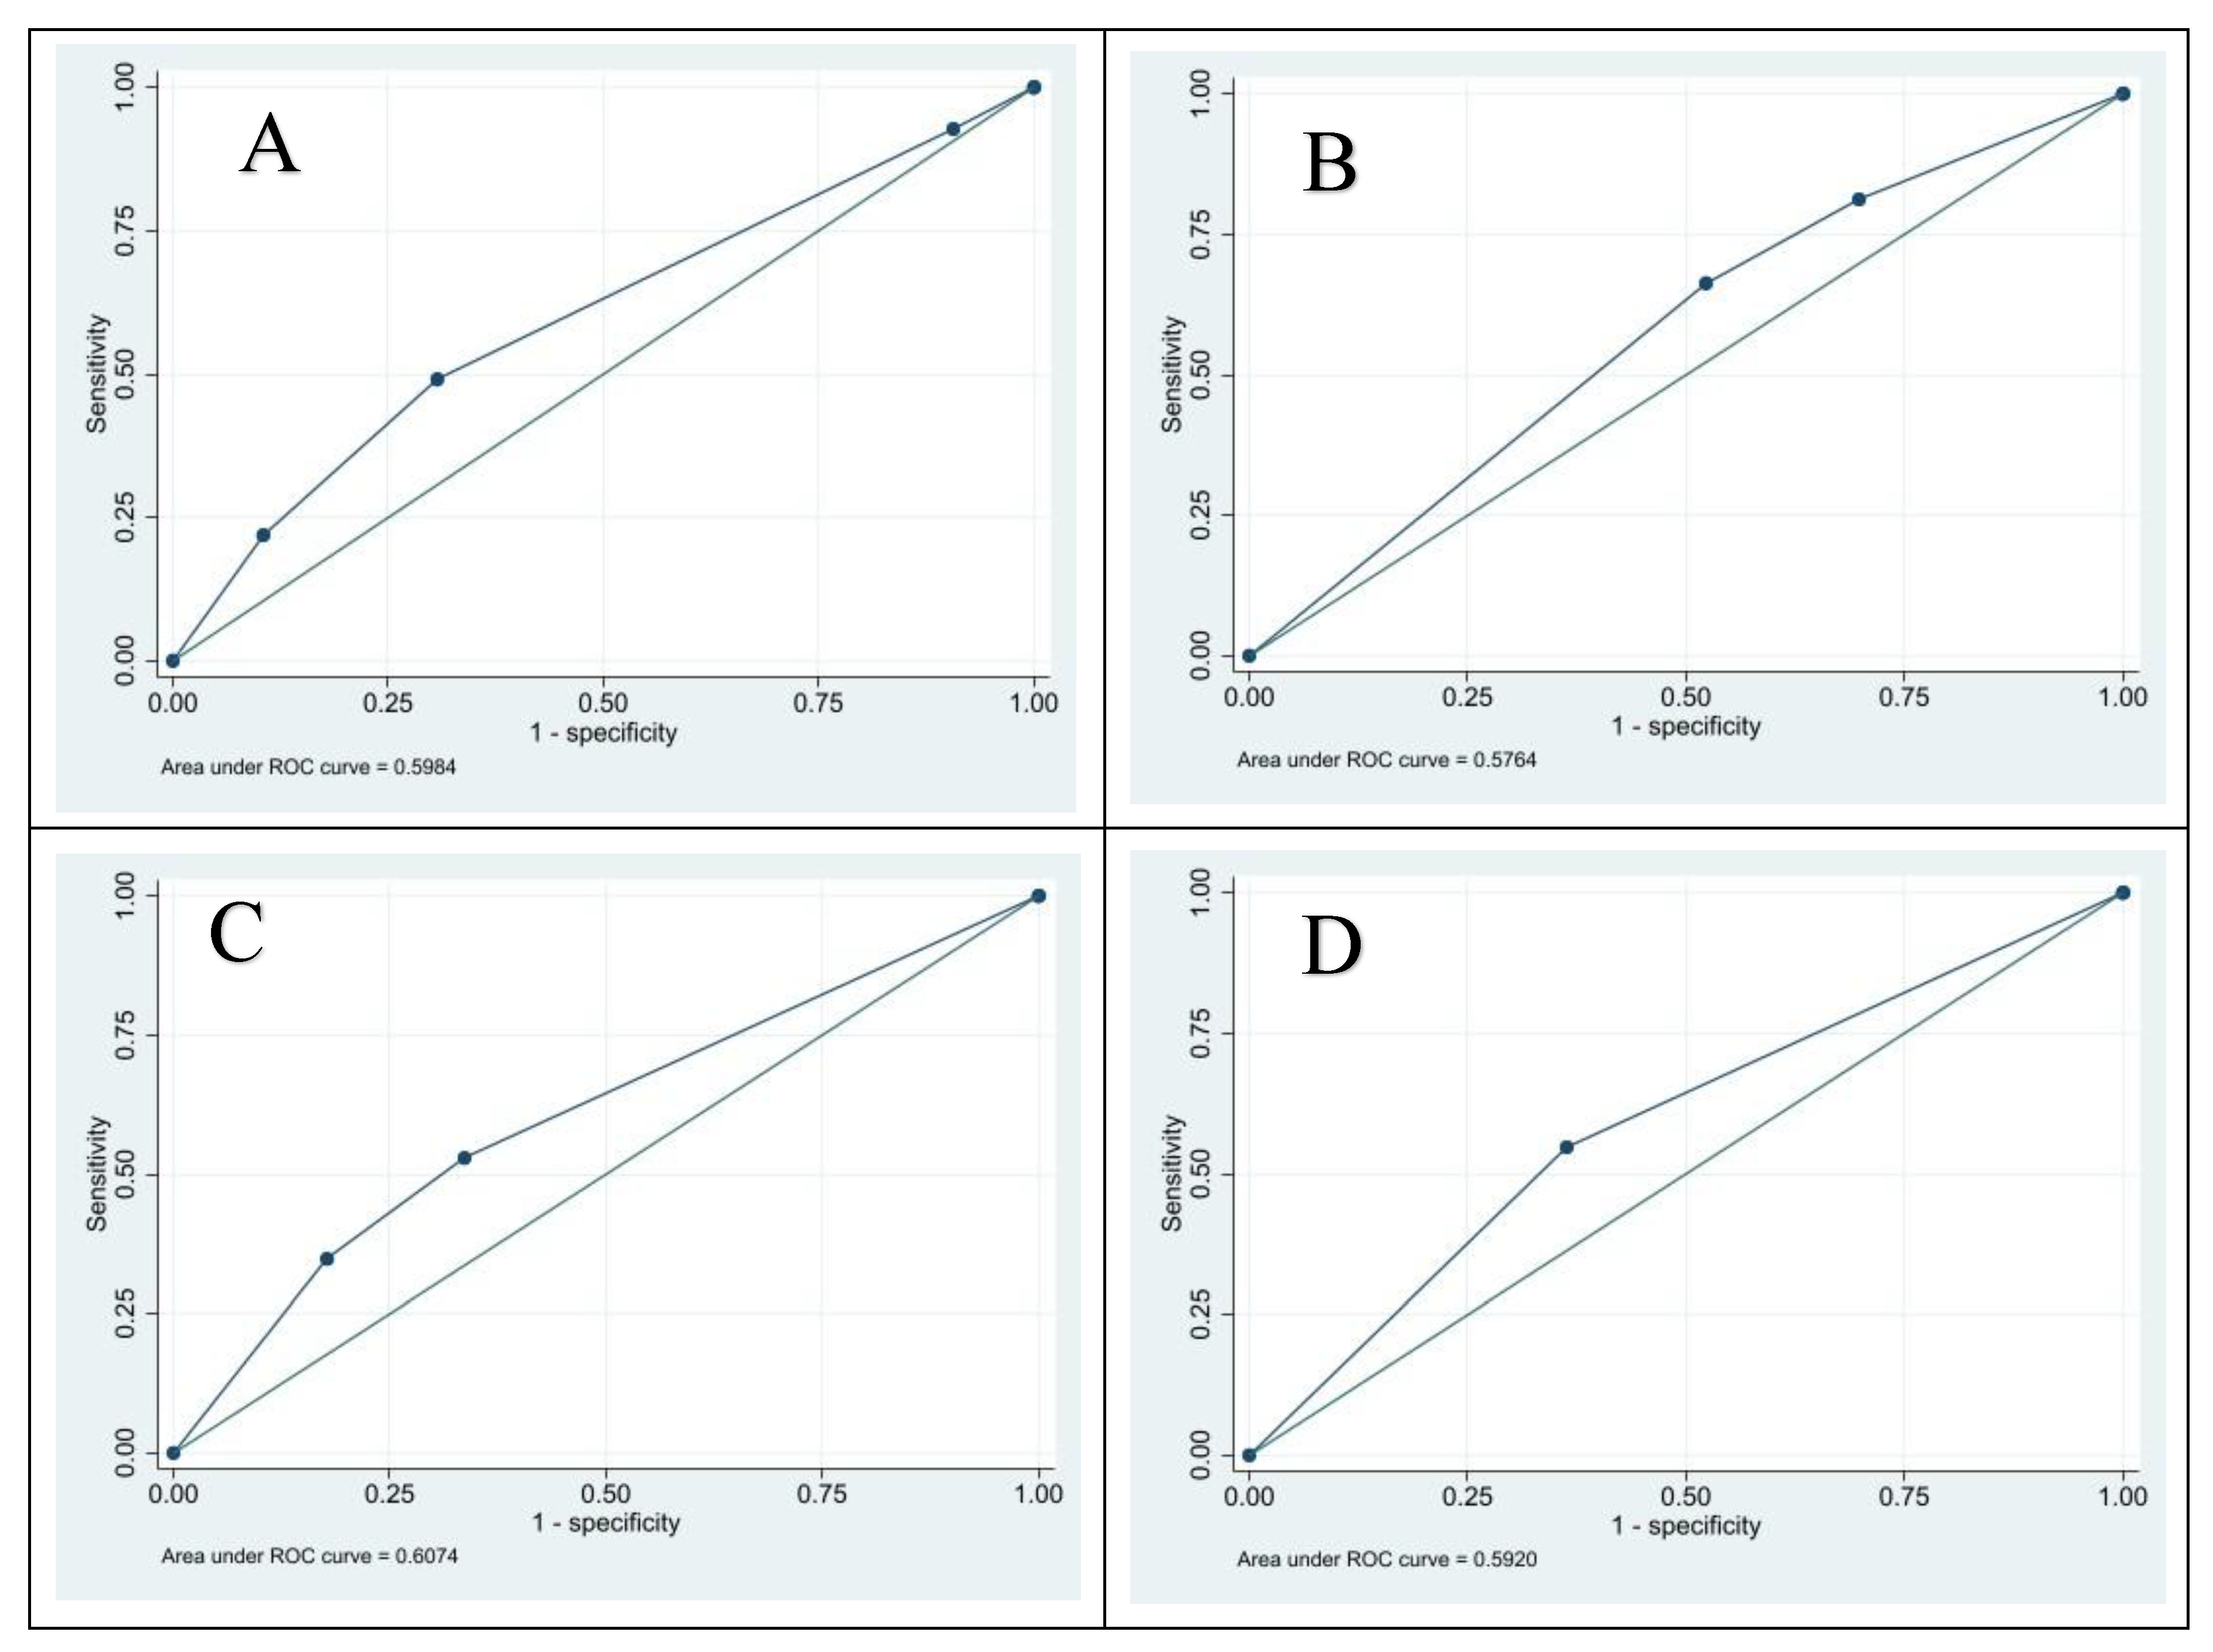

Table 1.
Characteristics of study participants segregated by sex.
| Characteristics | All Participants | Men | Women |
| Mean (95% CI) | Mean (95% CI) | Mean (SD) | |
| Age (years) | 35.14 [34.6-35.7] | 34.82 [33.9-35.7] | 35.47 [34.9-36.1] |
| Height (cm) | 165.2 [163.9-166.5] | 170.3[168.2-172.5] | 159.71[158.4-161.0] |
| Weight (Kg) | 66.0 [64.5-67.5] | 65.56 [63.87-67.24] | 66.89 [65.75-68.04] |
| Waist Circumference (cm) | 85.9 [84.9-86.8] | 81.9 [80.1-83.7] | 88.3 [87.3-89.3] |
| Hip Circumference | 98.9 [98.0-99.8] | 94.3 [92.5-96.1] | 101 [100.8-102.7] |
| BMI (kg/m2) | 24.9 [24.7-25.1] | 22.7[22.3-23.1] | 26.3[26.0-26.6] |
| Waist to Hip ratio | 0.867 [0.865-0.869] | 0.866[0.863-0.870] | 0.867[0.846-0.870] |
| Waist to height ratio | 0.527 [0.523-0.531] | 0.481 [0.474-0.488] | 0.555 [0.551-0.560] |
Table 2.
Proportion of participants with at least one self-reported NCD diagnosis.
| Variable | Self-reported at least | Measured with at least one NCD | |||||
| Weighted N(%) | NCD (%) [95%CI] | p-value | Weighted N(%) | NCD (%) [95%CI] | p-value | ||
| Age | <0.001 | <0.001 | |||||
| 18 to 29 years | 2292 (44.0) | 14.2 [11.8,17.0] | 1420 (26.2) | 27.6 [24.6,30.9] | |||
| 30 to 44 years | 1641 (31.5) | 28.6 [26.1,31.4] | 2110 (38.9) | 47.3 [43.9,50.7] | |||
| 45 to o59 years | 930 (17.9) | 40.8 [37.2,44.6] | 1331 (24.5) | 64.4 [60.6,68.0] | |||
| 60 to 69 years | 345 (6.6) | 52.1 [46.8,57.4] | 570 (10.5) | 72.3 [40.6,45.4] | |||
| Sex | <0.001 | <0.001 | |||||
| Male | 2624 (50.4) | 21.3 [187,24.0] | 2019 (37.2) | 37.5 [34.5,40.6] | |||
| Female | 2583 (49.6) | 30.8 [28.6,33.1] | 3412 (62.8) | 48.6 [45.8,51.5] | |||
| Level of education | 0.006 | 0.005 | |||||
| No formal education | 1381 (26.5) | 30.6 [27.8,33.5] | 1866 (34.4) | 48.7 [44.3,53.1] | |||
| Primary | 611 (11.7) | 21.6 [16.9,27.2] | 660 (12.2) | 50.0 [35.34,46.88] | |||
| SHS | 1597 (30.7) | 25.7 [23.0, 28.7] | 1608 (29.6) | 42.9 [39.46,46.37] | |||
| Tertiary | 1618 (31.1) | 24.0 [21.0,27.4] | 1297 (23.9) | 39.1 [35.07,43.3] | |||
| Ethnicity | 0.238 | 0.0178 | |||||
| Akan | 2050 (39.4) | 25.5 [23.2,28.0] | 2197 (40.5) | 44.9 [41.9,48.0] | |||
| Ga/Dangme | 300 (5.8) | 33.3 [27.3,40.0] | 283 (5.2) | 53.8 [43.7,63.5] | |||
| Ewe | 689 (13.2) | 27.3 [22.9,32.1] | 693 (12.8) | 44.3 [38.9,49.8] | |||
| Mole Dagbani | 1040 (20.0) | 24.7 [20.7,29.3] | 1000 (18.4) | 37.9 [32.8,43.3] | |||
| Others | 1127 (21.7) | 25.5 [22.2,29.1] | 1259 (23.2) | 40.7 [35.8,45.7] | |||
| Religion | 0.412 | 0.0511 | |||||
| Chistian | 3608 (69.3) | 26 [24.6,28.5] | 3916 (72.1) | 44.9 [42.3,47.5] | |||
| Muslim | 1312 (25.2) | 24.7 [21.1,28.7] | 1915 (22.0) | 38.9 [33.5,44.7] | |||
| Traditional | 183 (3.5) | 29.2 [22.6,36.8] | 197 (3.6) | 34.0 [25.8,43.3] | |||
| Others | 104 (2.0) | 20.4 [13.5,29.5] | 123 (2.3) | 46.7 [34.1,59.7] | |||
| Marital Status | <0.001 | <0.001 | |||||
| Never married | 1954 (37.5) | 14.9 [12.3,17.8] | 1252 (23.1) | 28.4 [25.0,32.0] | |||
| Currently married | 2445 (47.0) | 31.6 [29.4,33.9] | 2964 (54.6) | 49.9 [46.9,52.8] | |||
| Others | 808 (15.5) | 36.0 [32.3,39.9] | 1215 (22.4) | 58.5 [54.4,62.5] | |||
| Occupation | <0.001 | <0.001 | |||||
| Unemployed | 441 (8.5) | 25.9 [19.5,33.5] | 421 (7.8) | 43.3 [35.5,51.5] | |||
| Government employee | 232 (4.5) | 27.2 [20.4,35.3] | 254 (4.7) | 51.2 [43.0,59.4] | |||
| Non-government employee | 516 (9.9) | 21.3 [17.1,26.3] | 397 (7.3) | 42.0 [35.1,49.2] | |||
| Self-employed | 2974 (57.1) | 30.3 [28.2,32.6] | 3682 (67.8) | 48.5 [46.0,51.0] | |||
| Others | 1044 (20.1) | 15.8 [12.6,19.6] | 677 (12.5) | 26.2 [21.5,31.6] | |||
| BMI | <0.001 | ||||||
| Underweight | 495 (9.5) | 19.9 [15.3,25.3] | 440 (8.8) | 33.7 [27.0,41.1] | |||
| Normal | 2943 (56.5) | 20.5 [18.3,22.9] | 2698 (51.3) | 36.0 [33.3,38.8] | |||
| Overweight | 1082 (20.8) | 32.0 [28.5,35.6] | 1246 (23.7) | 51.5 [47.1,55.8] | |||
| Obese | 688 (13.2) | 44.6 [40.2,49.0] | 872 (16.6) | 66.0 [60.74,70.86] | |||
| Waist Circumference | <0.001 | ||||||
| Normal | 3383 (65.0) | 20.2 [18.1,22.5] | 2964 (56.4) | 35.1 [32.4,37.8] | |||
| High | 837 (16.1) | 27.7 [24.2,31.6] | 890 (16.9) | 51.1 [46.2,56.0] | |||
| Very High | 987 (19.0) | 44.5 [40.8,48.2] | 1402 (26.7) | 64.9 [60.8,68.8] | |||
| Hip Circumference | <0.001 | <0.001 | |||||
| Normal | 1693 (32.5) | 18.5 [15.3,22.0] | 1269 (24.1) | 32.3 [28.5,36.4] | |||
| Increased | 920 (17.7) | 23.2 [19.8,27.1] | 862 (16.4) | 39.1 [34.6,43.9] | |||
| Substantially increased | 2593 (49.8) | 32.0 [29.8,34.2] | 3125 (59.5) | 52.0 [49.0,55.0] | |||
| Waist to Hip ration | <0.001 | ||||||
| Normal | 2839 (54.0) | 15.2 [13.9,16.7] | 2839 (54.0) | 35.0 [32.2,37.8] | |||
| Increased | 2417 (46.0) | 20.6 [19.1,22.3] | 2417 (46.0) | 57.5 [54.3,60.7] | |||
Table 3.
Risk factors associated with self-reported NCDs.
| Variables | COR | 95%CI | p-value | AOR | 95%CI | p-value | |
| Age | |||||||
| 18 to 29 years | Ref | Ref | |||||
| 30 to 44 years | 2.43 | 1.91, 3.09 | <0.001 | 1.85 | 1.43, 2.41 | <0.001 | |
| 45 to o59 years | 4.17 | 3.16, 5.50 | <0.001 | 3.18 | 2.37, 4.26 | <0.001 | |
| 60 to 69 years | 6.58 | 4.87, 8.89 | <0.001 | 5.38 | 3.90, 7.42 | <0.001 | |
| Sex | |||||||
| Male | Ref | Ref | |||||
| Female | 1.65 | 1.36, 2.01 | <0.001 | 1.22 | 0.91, 1.63 | 0.186 | |
| Level of education | |||||||
| No formal education | Ref | Ref | |||||
| Primary | 0.63 | 0.45, 0.87 | 0.006 | 0.87 | 0.60, 1.26 | 0.473 | |
| SHS | 0.79 | 0.64, 0.96 | 0.019 | 1.05 | 0.81, 1.35 | 0.719 | |
| Tertiary | 0.72 | 0.58, 0.89 | 0.003 | 1.36 | 1.01, 1.82 | 0.042 | |
| Ethnicity | |||||||
| Akan | Ref | Ref | |||||
| Ga/Dangme | 1.46 | 1.07, 2.00 | 0.019 | 1.36 | 1.00, 1.84 | 0.052 | |
| Ewe | 1.09 | 0.84, 1.43 | 0.505 | 1.24 | 0.96, 1.62 | 0.103 | |
| Mole Dagbani | 0.96 | 0.74, 1.25 | 0.757 | 1.42 | 1.02, 1.97 | 0.036 | |
| Others | 1.00 | 0.80, 1.24 | 0.980 | 1.22 | 0.96, 1.54 | 0.098 | |
| Religion | |||||||
| Chistian | Ref | ||||||
| Muslim | 0.91 | 0.73, 1.14 | 0.401 | ||||
| Traditional | 1.14 | 0.79, 1.65 | 0.470 | ||||
| Others | 0.71 | 0.43, 1.17 | 0.174 | ||||
| Marital Status | |||||||
| Never married | Ref | Ref | |||||
| Currently married | 2.65 | 2.08, 3.37 | <0.001 | 1.26 | 0.94, 1.68 | 0.118 | |
| Others | 3.23 | 2.47, 4.22 | <0.001 | 1.40 | 1.04, 1.89 | 0.028 | |
| Occupation | |||||||
| Unemployed | Ref | Ref | |||||
| Government employee | 1.07 | 0.65, 1.78 | 0.786 | 0.73 | 0.42, 1.26 | 0.259 | |
| Non-government employee | 0.78 | 0.50, 1.21 | 0.260 | 0.83 | 0.50, 1.39 | 0.478 | |
| Self-employed | 1.25 | 0.85, 1.84 | 0.261 | 0.87 | 0.56, 2.35 | 0.547 | |
| Others | 0.54 | 0.34, 0.85 | 0.009 | 0.72 | 0.42, 1.22 | 0.219 | |
| BMI | |||||||
| Underweight | Ref | Ref | |||||
| Normal | 1.04 | 0.76, 1.43 | 0.792 | 1.04 | 0.74, 1.46 | 0.816 | |
| Overweight | 1.90 | 1.32, 2.74 | 0.001 | 1.29 | 0.86, 1.94 | 0.219 | |
| Obese | 3.25 | 2.27, 4.65 | <0.001 | 1.77 | 1.15, 2.74 | 0.010 | |
| Waist Circumference | |||||||
| Normal | Ref | Ref | |||||
| High | 1.52 | 1.19, 1.93 | 0.001 | 1.11 | 0.83, 1.49 | 0.469 | |
| Very High | 3.16 | 2.56, 3.92 | <0.001 | 1.47 | 1.06, 2.02 | 0.019 | |
| Hip Circumference | |||||||
| Normal | Ref | Ref | |||||
| Increased | 1.34 | 0.99, 1.81 | 0.060 | 1.08 | 0.79, 1.46 | 0.639 | |
| Substantially increased | 2.08 | 1.62, 2.66 | <0.001 | 1.04 | 0.74, 1.47 | 0.813 | |
Reference=Ref; COR=Crude Odds Ratio; AOR=Adjusted Odds Ratio.
Table 4.
Risk factors associated with having at least one of the measured NCDs: raised blood pressure, raised fasting blood sugar, raised total cholesterol and a history of myocardial infarction or Cerebrovascular accident.
Table 4.
Risk factors associated with having at least one of the measured NCDs: raised blood pressure, raised fasting blood sugar, raised total cholesterol and a history of myocardial infarction or Cerebrovascular accident.
| Variables | COR | 95%CI | p-value | AOR | 95%CI | p-value | |
| Age | |||||||
| 18 to 29 years | Ref | Ref | |||||
| 30 to 44 years | 2.35 | 1.98, 2.79 | <0.001 | 1.79 | 1.38, 2.32 | <0.001 | |
| 45 to o59 years | 4.73 | 3.78, 5.92 | <0.001 | 3.00 | 2.24, 4.04 | <0.001 | |
| 60 to 69 years | 6.85 | 5.22, 8.99 | <0.001 | 5.09 | 3.73, 6.94 | <0.001 | |
| Sex | |||||||
| Male | Ref | Ref | |||||
| Female | 1.58 | 1.36, 1.82 | <0.001 | 1.20 | 0.90, 1.59 | 0.218 | |
| Level of education | |||||||
| No formal education | Ref | Ref | |||||
| Primary | 0.73 | 0.56, 0.95 | 0.022 | 0.92 | 0.65, 1.29 | 0.624 | |
| SHS | 0.73 | 0.64, 0.97 | 0.026 | 1.06 | 0.82, 1.36 | 0.645 | |
| Tertiary | 0.67 | 0.53, 0.86 | 0.001 | 1.34 | 1.01, 1.77 | 0.041 | |
| Ethnicity | |||||||
| Akan | Ref | Ref | |||||
| Ga/Dangme | 1.42 | 0.94, 2.15 | 0.093 | 1.33 | 0.98, 1.81 | 0.068 | |
| Ewe | 1.42 | 0.76, 1.26 | 0.505 | 1.17 | 0.92, 1.50 | 0.182 | |
| Mole Dagbani | 0.75 | 0.58, 0.96 | 0.024 | 1.46 | 1.04, 2.04 | 0.026 | |
| Others | 0.84 | 0.67, 1.06 | 0.143 | 1.23 | 0.98, 1.55 | 0.079 | |
| Religion | |||||||
| Chistian | Ref | ||||||
| Muslim | 0.78 | 0.61, 1.01 | 0.061 | ||||
| Traditional | 0.63 | 0.42, 0.996 | 0.031 | ||||
| Others | 1.07 | 0.63, 1.84 | 0.788 | ||||
| Marital Status | |||||||
| Never married | Ref | Ref | |||||
| Currently married | 2.51 | 2.08, 3.02 | <0.001 | 1.29 | 0.96, 1.74 | 0.068 | |
| Others | 3.55 | 2.85, 4.42 | <0.001 | 1.43 | 1.05, 1.94 | 0.022 | |
| Occupation | |||||||
| Unemployed | Ref | Ref | |||||
| Government employee | 1.37 | 0.84, 2.23 | 0.202 | 0.78 | 0.48, 1.31 | 0.361 | |
| Non-government employee | 0.95 | 0.63, 1.42 | 0.784 | 0.85 | 0.50, 1.44 | 0.546 | |
| Self-employed | 1.23 | 0.88, 1.73 | 0.229 | 0.89 | 0.57, 1.37 | 0.589 | |
| Others | 0.46 | 0.29, 0.73 | 0.001 | 0.73 | 0.42, 1.25 | 0.260 | |
| BMI | |||||||
| Underweight | Ref | Ref | |||||
| Normal | 1.01 | 0.80, 1.53 | 0.541 | 1.01 | 0.72, 1.41 | 0.952 | |
| Overweight | 2.09 | 1.46, 2.98 | <0.001 | 1.27 | 0.85, 1.91 | 0.240 | |
| Obese | 3.82 | 2.56, 5.62 | <0.001 | 1.67 | 1.01, 2.54 | 0.019 | |
| Waist Circumference | |||||||
| Normal | Ref | Ref | |||||
| High | 1.93 | 1.57, 2.38 | <0.001 | 1.11 | 0.83, 1.50 | 0.478 | |
| Very High | 3.42 | 2.77, 4.21 | <0.001 | 1.40 | 1.02, 1.993 | 0.036 | |
| Hip Circumference | |||||||
| Normal | Ref | Ref | |||||
| Increased | 1.34 | 1.014, 1.79 | 0.040 | 1.04 | 0.78, 1.40 | 0.783 | |
| Substantially increased | 2.27 | 1.86, 2.76 | <0.001 | 1.08 | 0.77, 1.52 | 0.647 | |
| Waist to hip ratio | |||||||
| Normal | Ref | ||||||
| Increased | 2.52 | 2.13, 2.97 | <0.001 | 1.08 | 0.89, 1.31 | 0.433 | |
Reference=Ref; COR=Crude Odds Ratio; AOR=Adjusted Odds Ratio.
Table 5.
Receiver Operator Curve analysis of Body mapping indicators as a predictor of having at least one measured NCD; hypertension, diabetes, dyslipidemia or self-reported myocardial infarction or Stroke.
Table 5.
Receiver Operator Curve analysis of Body mapping indicators as a predictor of having at least one measured NCD; hypertension, diabetes, dyslipidemia or self-reported myocardial infarction or Stroke.
| Screening tool | ROC Area [95% CI] | Cut off | Sensitivity % | Specificity % | Correctly classify % |
| Waist circumference | 0.607 [0.593, 0.621] | High | 52.9 | 66.4 | 59.1 |
| Hip Circumference | 0.576 [0.562, 0.591] | Increased | 81.3 | 30.2 | 57.5 |
| Waist to Hip Ratio | 0.592 [0.578, 0.606] | increased | 54.7 | 63.7 | 58.9 |
| Body mass index | 0.598 [0.584, 0.613] | Overweight | 49.0 | 69.3 | 58.5 |
Disclaimer/Publisher’s Note: The statements, opinions and data contained in all publications are solely those of the individual author(s) and contributor(s) and not of MDPI and/or the editor(s). MDPI and/or the editor(s) disclaim responsibility for any injury to people or property resulting from any ideas, methods, instructions or products referred to in the content. |
© 2025 by the authors. Licensee MDPI, Basel, Switzerland. This article is an open access article distributed under the terms and conditions of the Creative Commons Attribution (CC BY) license (http://creativecommons.org/licenses/by/4.0/).
Copyright: This open access article is published under a Creative Commons CC BY 4.0 license, which permit the free download, distribution, and reuse, provided that the author and preprint are cited in any reuse.


