Submitted:
24 November 2025
Posted:
26 November 2025
You are already at the latest version
Abstract
Lung cancer continues to be among the most common reasons for death caused by cancer all over the world, mainly because the diagnosis is often delayed and treatment options in advanced stages are limited. Besides, immediate recognition is very important in improving the survival rate-making predictive analytics a necessary tool in the healthcare sector. The present research work employs data mining and machine learning methods to separate lung cancer patients into early and late disease stages. This is done using a Kaggle dataset that contains 53,427 clinical and demographic records. After a thorough cleaning of data, addressing of missing values and encoding of categorical variables, three different classification models—Logistic Regression, Random Forest and XGBoost—were created and their performances evaluated. Through the exploratory data analysis, it was found that there is a class distribution that is balanced and there is slight multicollinearity between the variables like age, gender, tobacco usage, race and days to diagnosis, etc. The performance of the models was measured by accuracy, precision, recall, F1-score, and ROC-AUC metrics. The best performance was obtained by Logistic Regression (Accuracy = 0.56, F1-score = 0.57, AUC = 0.58) which was better than Random Forest and XGBoost. Though the overall predictive accuracy did not exceed a certain level, the results have pointed out the possibility of data-based modeling in helping doctors to give priority to the high-risk patients in terms of early treatment. Among the things to be recommended for the next research work are advanced feature engineering, hyperparameter tuning, handling of class imbalance, and incorporation of different clinical variables which would make the model stronger and more useful for diagnosis.
Keywords:
Logistic Regression
; lung cancer
; Random Forest
; XGBoost
1. Background of the Study
Lung cancer is still considered as one of the most common and dangerous cancers around the world and it is responsible for millions of deaths every year. The improvements in cancer treatment have not changed much the situation for lung cancer patients, as their survival is mostly determined by the cancer stage at which they come for treatment. People diagnosed with early cancer stages usually benefit a lot from surgery or local treatments and thus have much higher survival rates. On the other hand, late diagnosis is accompanied by metastasis, limited treatment options, and poor prognosis. Therefore, the accurate and prompt detection of lung cancer stage is a must for the improvement of clinical outcomes and for the timely intervention that follows.
The growing availability of large medical datasets that include not only the clinical but also the lifestyle and demographic information of the patients has made it possible to implement the data-driven approaches in healthcare. Yet, the traditional manual analysis is no longer sufficient for pattern detection due to the complexity and volume of these datasets. Therefore, data mining and machine learning methods are becoming the most preferred ones for their ability to extract important insights, detect risk factors, and contribute to the development of predictive models in the clinical area.
1.1. Introduction
The upsurge in the use of big data in the healthcare sector has machine learning as one of the main instruments for analyzing intricate patient details and raising the standards of diagnostic precision. It is possible to gather and notice very important things about the development of diseases in the future by applying advanced analytical methods on the large datasets containing factors like age, tobacco habits, gender, race, and time to diagnosis. Machine Learning is one of the approaches to analyze and pinpoint the patterns which are not easily picked up by the doctors and thus, it can assist the doctors in making the right decisions and early detection.
The research is about how different data mining methods can be used in predicting the stage of lung cancer that is either early or late depending on the patient data. By taking the ’Smoker Lung Cancer Stage Detection’ dataset from Kaggle, the project employs three supervised machine learning algorithms namely Logistic Regression, Random Forest, and XGBoost. These methods were chosen because of their proven successes in various classification tasks and their wide usage in healthcare data analysis.
The study objectives include data cleaning and preprocessing of the dataset to affirm reliability, comparing the accuracy of different models to spot the best classifier, and producing insights that could be useful in strategizing for early detection. The study will be looking at the performance indicators of accuracy, precision, recall, F1-score, and ROC-AUC in order to classify the predictive power of each model and the role of data mining in clinical decision-making. In the end, the project will showcase the advantages that come with the adoption of machine learning in the healthcare sector like the enhancement of diagnosis, the identification of high risk patients, and the support of personalized treatment planning.
1.2. Rationale
Lung cancer has not lost its place in the top spots of the most deadly cancers worldwide, mainly because the majority of the diagnoses are made when the disease is already at an advanced stage. It’s usually the case that patients diagnosed early are given the option of surgery or one of the localized treatments, which in turn gives them a significant chance of survival. However, late diagnosis is usually the result of metastasis, which in turn leads to limited treatment options and poor prognosis. The need for tools that could enable the cancer states to be determined earlier and more accurately is hence emphasized.
To provide an alternative, the large medical data sets now available can be considered as an opportunity to implement data-driven methods to solve this problem. However, due to the complexity and size of such datasets, manual interpretation is not feasible. The use of data mining and machine learning techniques is a great support as they make revealing patterns, relationships, and predictive signals hidden in the vast health records automatically possible. By these methods, not only is the right insight attained but the diagnosis, assessment of risk, and treatment planning are also done according to the individual patient. The reason behind this project is to facilitate the machine learning technology to the extent that it can bear the decision-making process in management of lung cancer. Identifying such patient characteristics as age, sex, smoking habits, race, and time to diagnosis can allow predictive models to indicate whether the cancer is at an early or late stage. The ability to classify in this manner is of utmost clinical importance, as it can lead to either rapid intervention or more precise treatment strategies. Furthermore, the evaluation of different machine learning models, including Logistic Regression, Random Forest, and XGBoost, allows discovering the best method for predicting the stage in this dataset.
Generally speaking, the research is aimed at contributing to the acceptance of artificial intelligence in healthcare analytics which, in turn, would allow for the adoption of more informed and preventive clinical practices. Consequently, the whole issue revolves around a very significant medical problem—early diagnosis of lung cancer—and that would be performed through robust data mining methods and systematic appraisal of the models through evidence.
2. Dataset Description
The research involved the dataset called "Smoker Lung Cancer Stage Detection Model" which was acquired from Kaggle. The dataset was selected due to its inclusion of significant clinical demographic and lifestyle factors which have a strong association with lung cancer both in terms of occurrence and progression. It includes age, gender, smoking status, race, and the number of days to cancer diagnosis among others, all of which are regularly considered in cancer studies. The variable, stage_of_cancer, is able to provide categorical data representing the patient’s lung cancer stage, hence the dataset is very suitable for supervised classification tasks.
The dataset went through rigorous processing before modeling, consisting of the elimination of missing or wrong values, removing repeated records, and converting non-numerical variables to numerical ones. With these steps, the data was of high quality, consistent, and ready for the application of the machine learning algorithms employed in this research.
2.1. Dataset Overview
Wholesomely the dataset is made up of many patients’ records, each one detailed with its respective demographic and clinical information. When the data was cleaned completely, a considerable amount of reliable entries that were apt for predictive modeling were left behind in the dataset. The features that the dataset shows could be classified into three major categories: demographic features (age, gender, race), lifestyle factors (smoking status), and clinical indicators (days to cancer diagnosis).
To make the classification task easier, the original cancer stage categories—from IA to IV—were combined into two groups defined by their clinical significance: Early Stage (IA, IB, IIA, IIB) and Late Stage (IIIA, IIIB, IV). This binary change made it possible for the machine learning algorithms to easily differentiate between the initial and the advanced stages of the disease.
The dataset contains a wide range of numerical and categorical variables that provide a complete picture of the factors that might affect the progression of lung cancer. The attributes in combination allow the creation of models that not only predict but also identify patients who are likely to be diagnosed with an advanced stage of the disease.
2.2. Suitability for Data Mining
The primary key reasons for which the dataset is extensively considered for data mining are its huge and diverse sample size, clinically relevant attributes and good mix of numerical and categorical variables. The dataset consisting of more than 53,000 patient records and seven primary features is a perfect candidate to be the base for pattern extraction, model training and statistical analysis. The presence of both types of variables allows the use of a wide range of statistical techniques such as classification, regression, and association analysis. In addition, the revelation of the main variable stage_of_cancer also renders the dataset apt for these kinds of operations.
At first, the raw data was replete with missing values, especially the days_to_cancer and stage_of_cancer variables. Still, by the procedure of systematic cleaning and preprocessing, a dataset of high quality was produced which was used for predictive modeling. In addition, receiving the dataset from a reputable platform like Kaggle enhances its credibility and research potential. In short, the dataset is well-structured, its diverse, and it has clinical significance, thus making it a good candidate for data mining applications, which will further bring about better early detection and more precise decision-making in the area of lung cancer diagnosis.
2.3. Exploratory Data Analysis (EDA)
Exploratory data analysis (EDA) was the first step taken before modeling to explore the distribution of the target variable and the correlations between predictors and the stages of the cancer. Distribution of Cancer Stages: The target variable, stage_of_cancer, was examined to see if there was any class balance. The data set shown in Figure 1 indicates that there is a relatively balanced distribution between the two categories: early-stage cancer (1 = Early Stage) and late-stage cancer (2 = Late Stage). In this case, the balance is very important for classification models, as it decreases the chance of bias towards one class and also guarantees the reliability of performance.
- Relationship Between Smoking Status and Cancer Stage:
The association of smoking history with cancer progression was studied then by comparing the two conditions of cancer and smoking. According to Figure 2, it can be interpreted that current smokers have a little bit more frequent occurrence in late-stage cancer, thus, there is a possible connection between smoking and later cancer stages. On the other hand, people who used to smoke are evenly distributed between the early and late stages, which can be interpreted as a sign of reduced risk of getting cancer or slowing down the process of cancer growth after quitting smoking.
3. Methodology
This research made use of an organized data mining process to produce and assess predictive models that would result in the classification of lung cancer stages according to the combination of demographic factors and clinical attributes. The approach was composed of five principal actions: acquiring datasets, preprocessing data, exploring data, building models, and evaluating performance.
3.1. Dataset Acquisition
The dataset applied in this The data for the research came from Kaggle under the file "Smoker Lung Cancer Stage Detection Model." It contained the demographic information of the patients (age, gender, race), the lifestyle factors (smoking status), and clinical parameters (days to cancer diagnosis), apart from the target variable stage_of_cancer. The dataset was initially composed of more than 53,000 records of patients, which provided a great basis for machine learning applications.
3.2. Data Cleaning and Preprocessing
Data cleaning and preprocessing have been the most important and unavoidable steps taken to confirm the accuracy, consistency, and reliability of the dataset before its use in data mining and machine learning analyses. A systematic preprocessing workflow was applied in this study where dealing with missing values, removing duplicates and irrelevant entries, and standardizing data types for modeling happened. These actions added not only the overall quality of the dataset but also the completeness and analytical validity of the inputs used in the model training.
3.3. Handling Missing Values
The primary dataset lacked a lot of information, especially the days_to_cancer and stage_of_cancer attributes. To perform a visual evaluation of the missing values, the first step was to create a heatmap of missing values (Figure 1), which showed that a large portion of the data needed cleaning.
In order to fix the problem, several steps were taken. Completely removing the records with missing or invalid entries in the stage_of_cancer attribute was the first step, since the attribute was the target variable for all classification models. For numerical attributes, especially days_to_cancer, missing values were treated based on the degree of their incompleteness: extensive missing data rows were removed, partially missing values were imputed using the median to preserve the underlying distribution, and dataset consistency was also maintained.
After these steps, a new heatmap (Figure 2) was produced to check if the missing values had been completely resolved. This visual verification gave the researchers the assurance that the dataset was ready for the subsequent analysis.
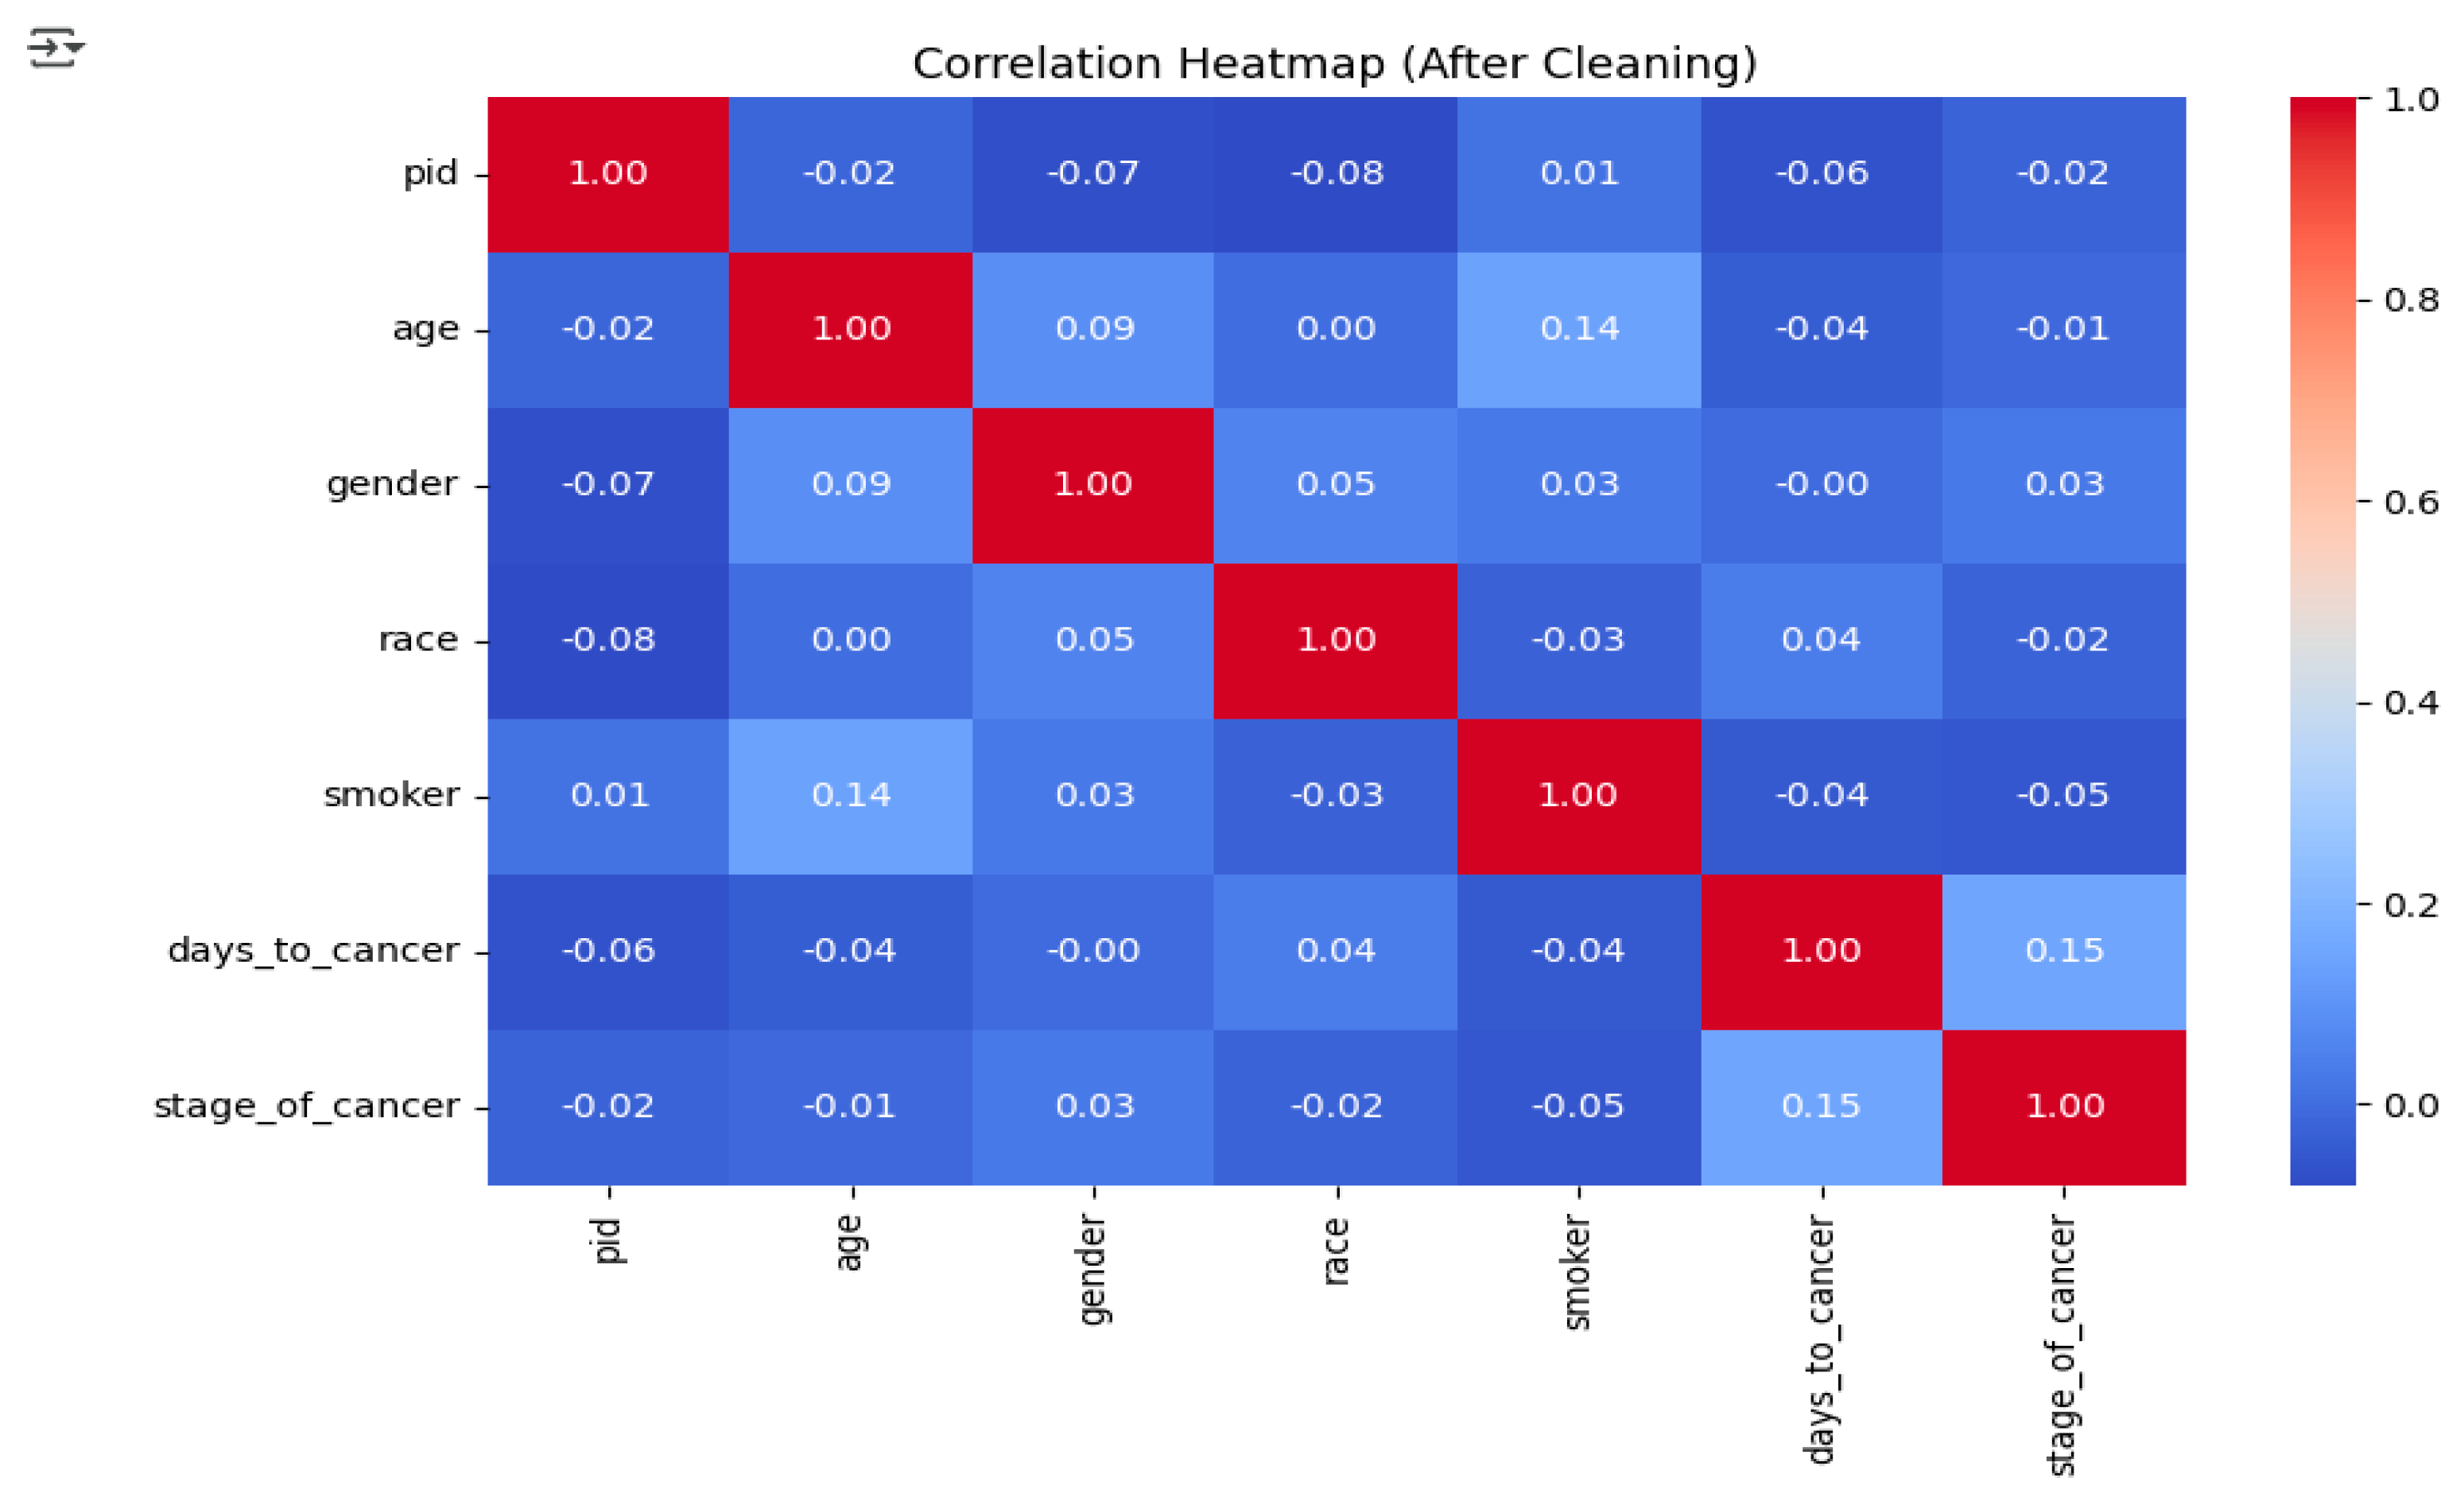
After the dataset was cleaned, correlation analysis was performed to study the relationships between numerical variables and to identify the existence of multicollinearity. The correlation heatmap (Figure 3) demonstrated that most of the variables had weak or nearly no correlation with each other. For example, while there was a slight positive correlation between age and smoking status, the associations of other variables like income and race with the target variable were negligible. These results suggest that the dataset is not very repetitive and all the features can be used for training the model without the fear that the performance would be affected due to multicollinearity.
3.4. Removing Duplicates and Irrelevant Entries
Duplicate rows were wiped out in order to eliminate any bias and to prevent redundancy in the analysis. All the inconsistent and irrelevant entries were also cleaned up, and only the highest quality and the most reliable observations were retained.
3.5. Encoding Categorical Variables
The categorical variables like gender, race, and smoker status were per one-hot encoding converted into numerical values so as to be compatible with the machine learning algorithms.
3.6. Target Variable Transformation
The cancer stage categories were transformed from original four (IA–IV) to a binary classification scheme:
- Early Stage = 1 (IA, IB, IIA, IIB)
- Late Stage = 2 (IIIA, IIIB, IV)
This transformation simplifies the modeling process and enhances the interpretability.
3.7. Correlation Analysis:
A correlation heatmap was created post-cleaning in order to analyze the numerical variables’ relationships and to find out multicollinearity. The correlations of all features turned out to be weak or very close to zero, thus indicating their suitability for use in the predictive models.
Figure 4.
Correlation Heatmap (After Cleaning).
4. Modeling
The initial phase of modeling involved selecting and assessing different machine learning models that would determine the cancer stage (early or late) based on the patients’ demographic and medical data. The process began with choosing the most appropriate classification models, feeding the preprocessed dataset into them for training and finally, assessing the models’ performances to identify the best one.
The models that were employed in this process included:
- Logistic Regression (LR) - A traditional statistical model which is appropriate for binary outcomes.
- Random Forest Classifier (RF) - An ensemble learning technique that enhances the predictions by merging the outputs of several decision trees.
- Extreme Gradient Boosting (XGBoost) - A boosting technique that is capable of managing imbalanced datasets and complex patterns effectively.
The dataset was split into a training portion (80%) and a testing portion (20%) through stratified splitting which guaranteed equal representation of early and late-stage cancer patients in both sets.
4.1. Model Training Process
The first step in the model training procedure was to apply One-Hot Encoding technique to all categorical variables present in the dataset so that they could be compatible with the machine learning algorithms. The target variable, stage_of_cancer, was then converted into numbers for easy processing, where early-stage cancer was represented as 1 and late-stage cancer as 2. Post preprocessing, every model was trained with the training set assigned to it and afterwards tested on the testing set to see how well it was able to predict. The model’s effectiveness was evaluated by using a number of evaluation parameters, one of which was accuracy that showed the overall percentage of right predictions; precision that showed the percentage of correctly identified late-stage cases among all predicted late-stage cases; recall, the percentage of correctly detected late-stage cases among all actual late-stage cases; and the F1-score that provided a single measure which was more like a fusion of precision and recall and especially useful when dealing with class imbalance issues. In addition, the ROC–AUC curve was used to measure each model’s capacity to separate early from late cancer stages by looking at the trade-off between true positive and false positive rates.
4.2. Logistic Regression Model
The Logistic Regression (LR) model was utilized as a baseline classifier to predict if the patient’s cancer stage was early (1) or late (2). This model is chosen as the first comparative model owing to its straightforwardness, clarity, and power in laying down a comparative base for the advanced algorithms. In the initial phase of model development, the cleansed and encoded dataset was split into a training set with 80% and a testing set with 20% by means of stratified splitting to maintain the ratio of early- to late-stage cases. The target variable was transformed into numerical values where number 1 indicated the early-stage cancer and number 2 indicated the late-stage one. The Scikit-Learn’s Logistic Regressor approach was applied to model training with default hyperparameters and larger max_iter (1000) so that surely proper optimization convergence would be reached. Therefore, the Logistic Regression model was not only a reliable benchmark but also an indicator for the evaluation of the following models’ performances in machine learning.
4.3. Model Evaluation Metrics
The Logistic Regression model’s performance was assessed through the application of standard classification metrics to the testing dataset, resulting in specific numerical values for this machine learning model. The accuracy score obtained by the model was 0.55, which means that the model was able to classify correctly around 55% of the cases. The precision score, determined to be 0.56, implies that the majority of the cases classified as late-stage cancer were indeed true cases. The recall value (0.57) pointed out the model’s ability to detect late-stage instances, while the F1-score (0.56) signaled a trade-off between precision and recall. Therefore, the figures indicate that the model was able to perform better than random guessing, but its overall predictive power was still moderate, indicating the complexity of the dataset and the overlap in feature distributions as potential limiting factors for the model’s effectiveness. The confusion matrix corresponding to the model also gives further evidence of correct and incorrect predictions’ distribution, thus revealing the model’s classification behavior across early-stage and late-stage cancer categories.
Figure 5.
Confusion Matrix.
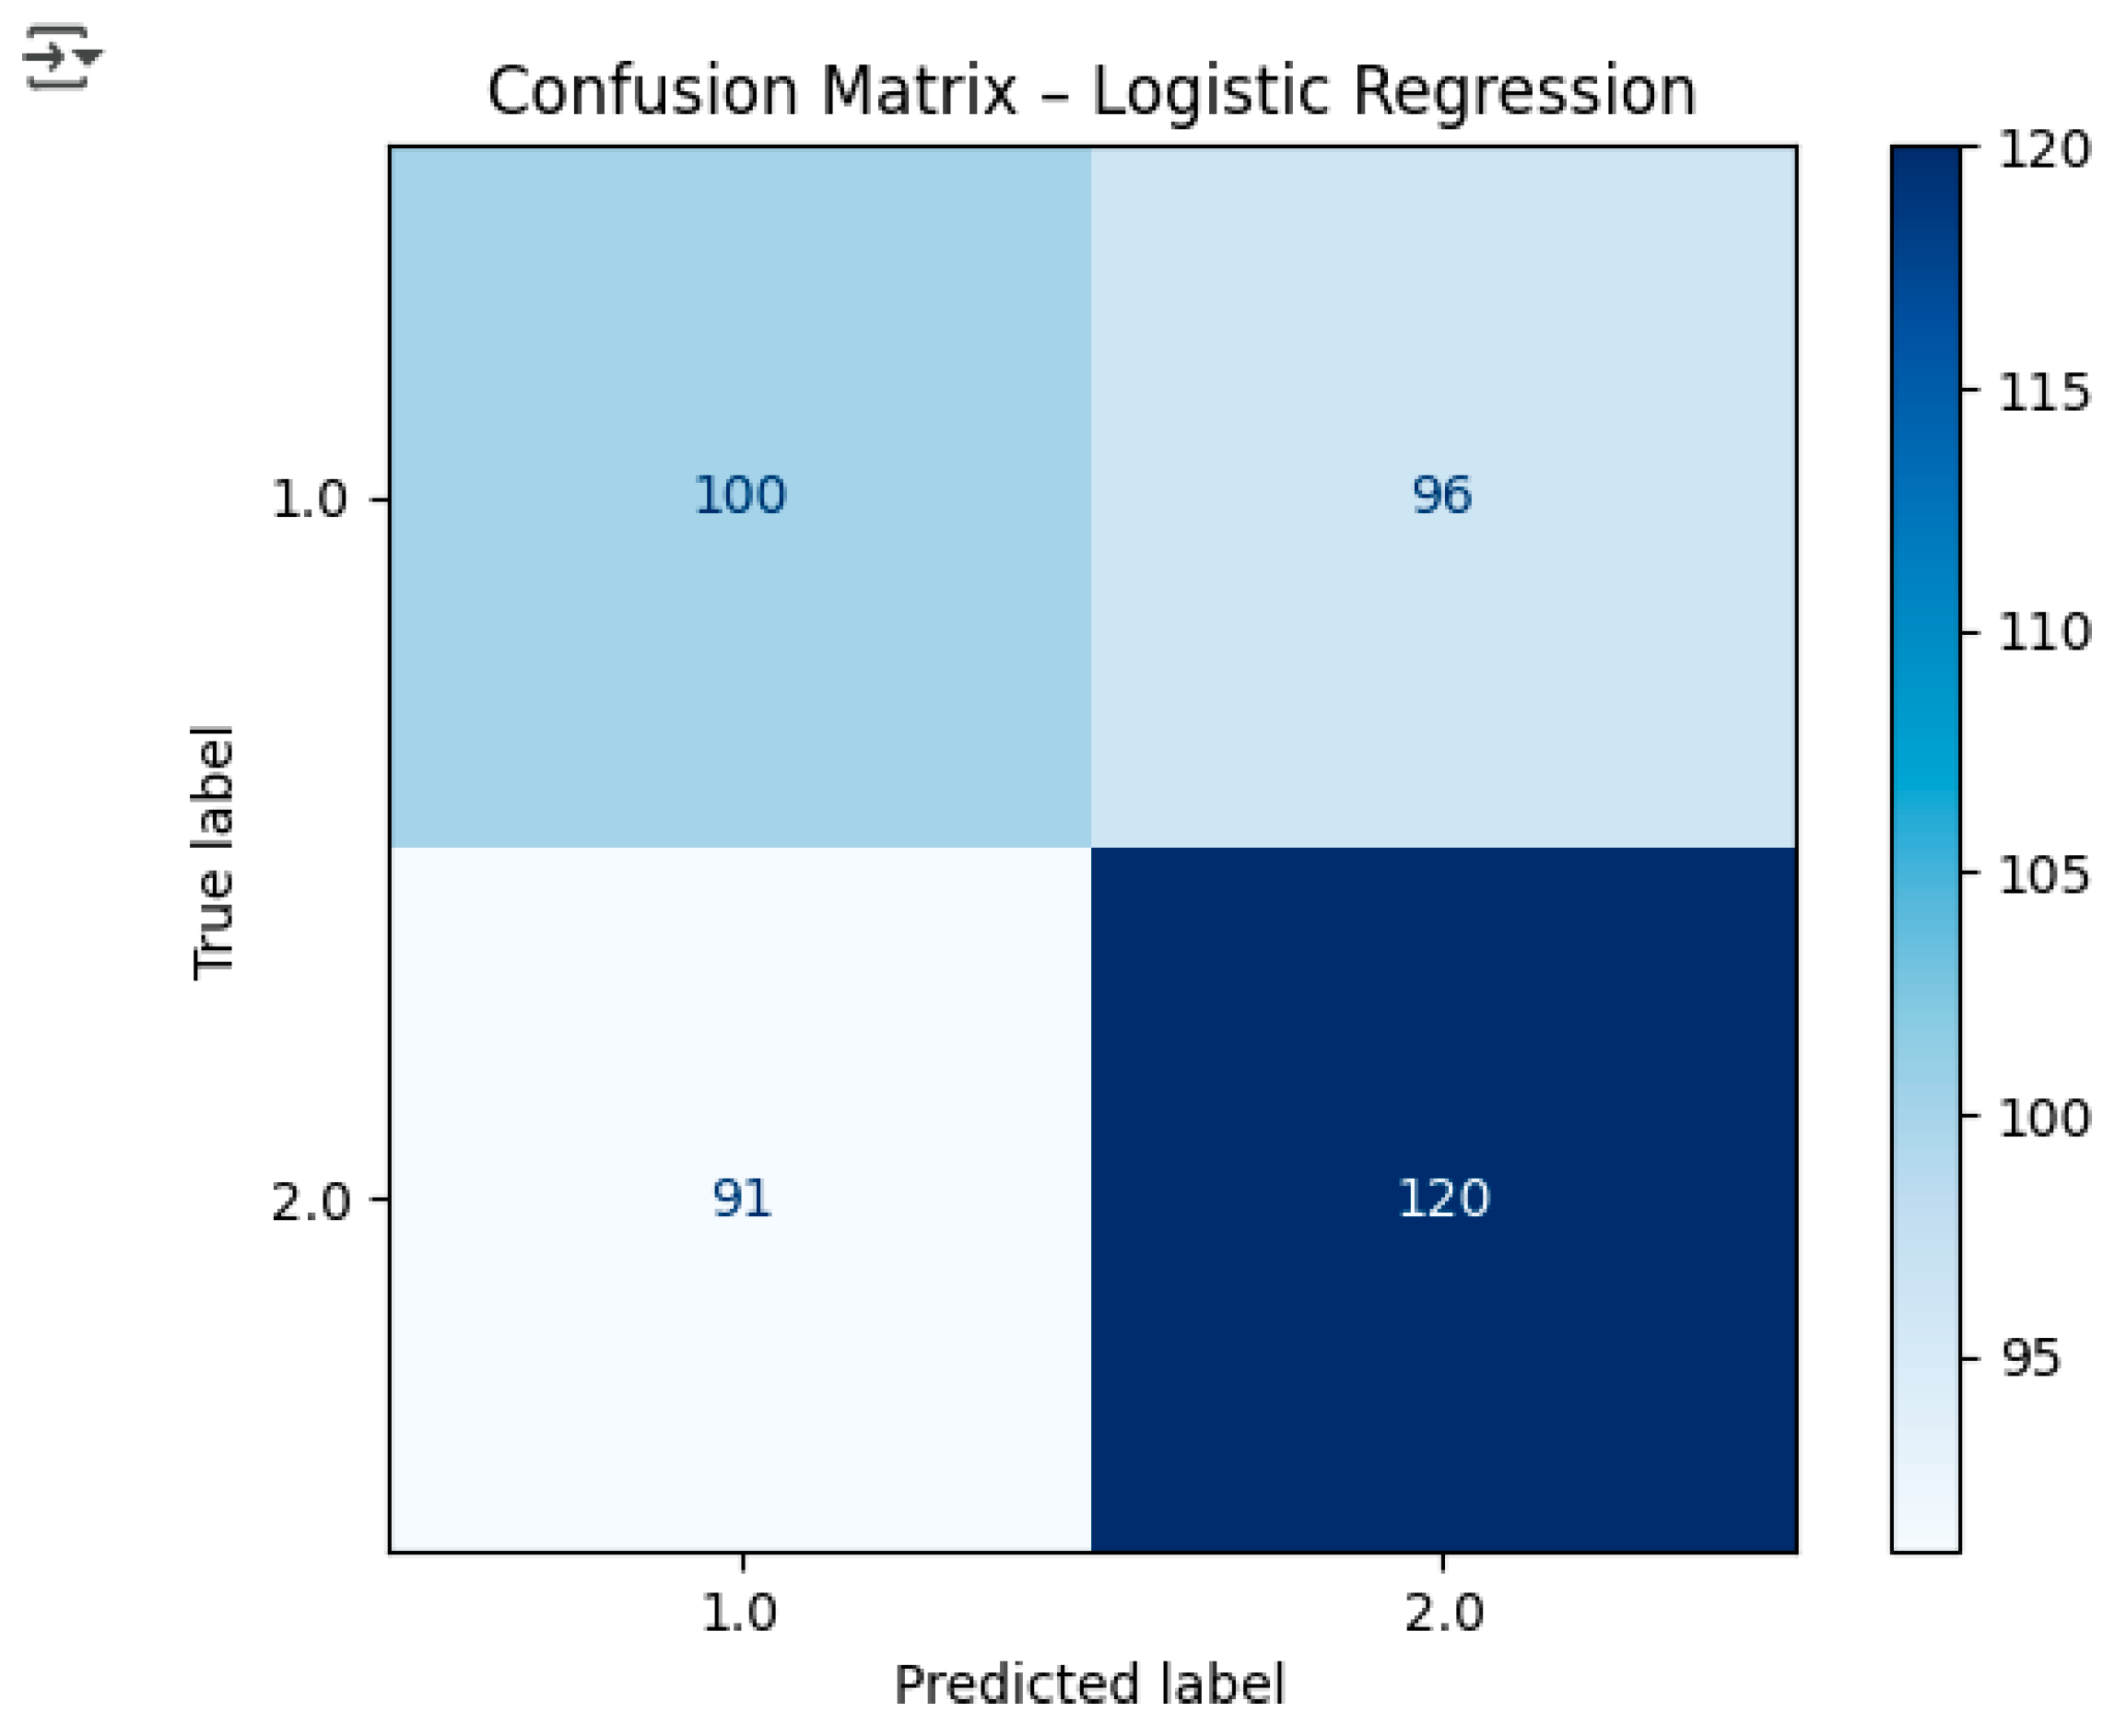
Interpretation:
- True Positives (TP): 121 late-stage cases correctly predicted.
- True Negatives (TN): 103 early-stage cases correctly predicted.
- False Positives (FP): 93 early-stage cases incorrectly predicted as late-stage.
- False Negatives (FN): 90 late-stage cases incorrectly predicted as early-stage.
4.4. ROC Curve
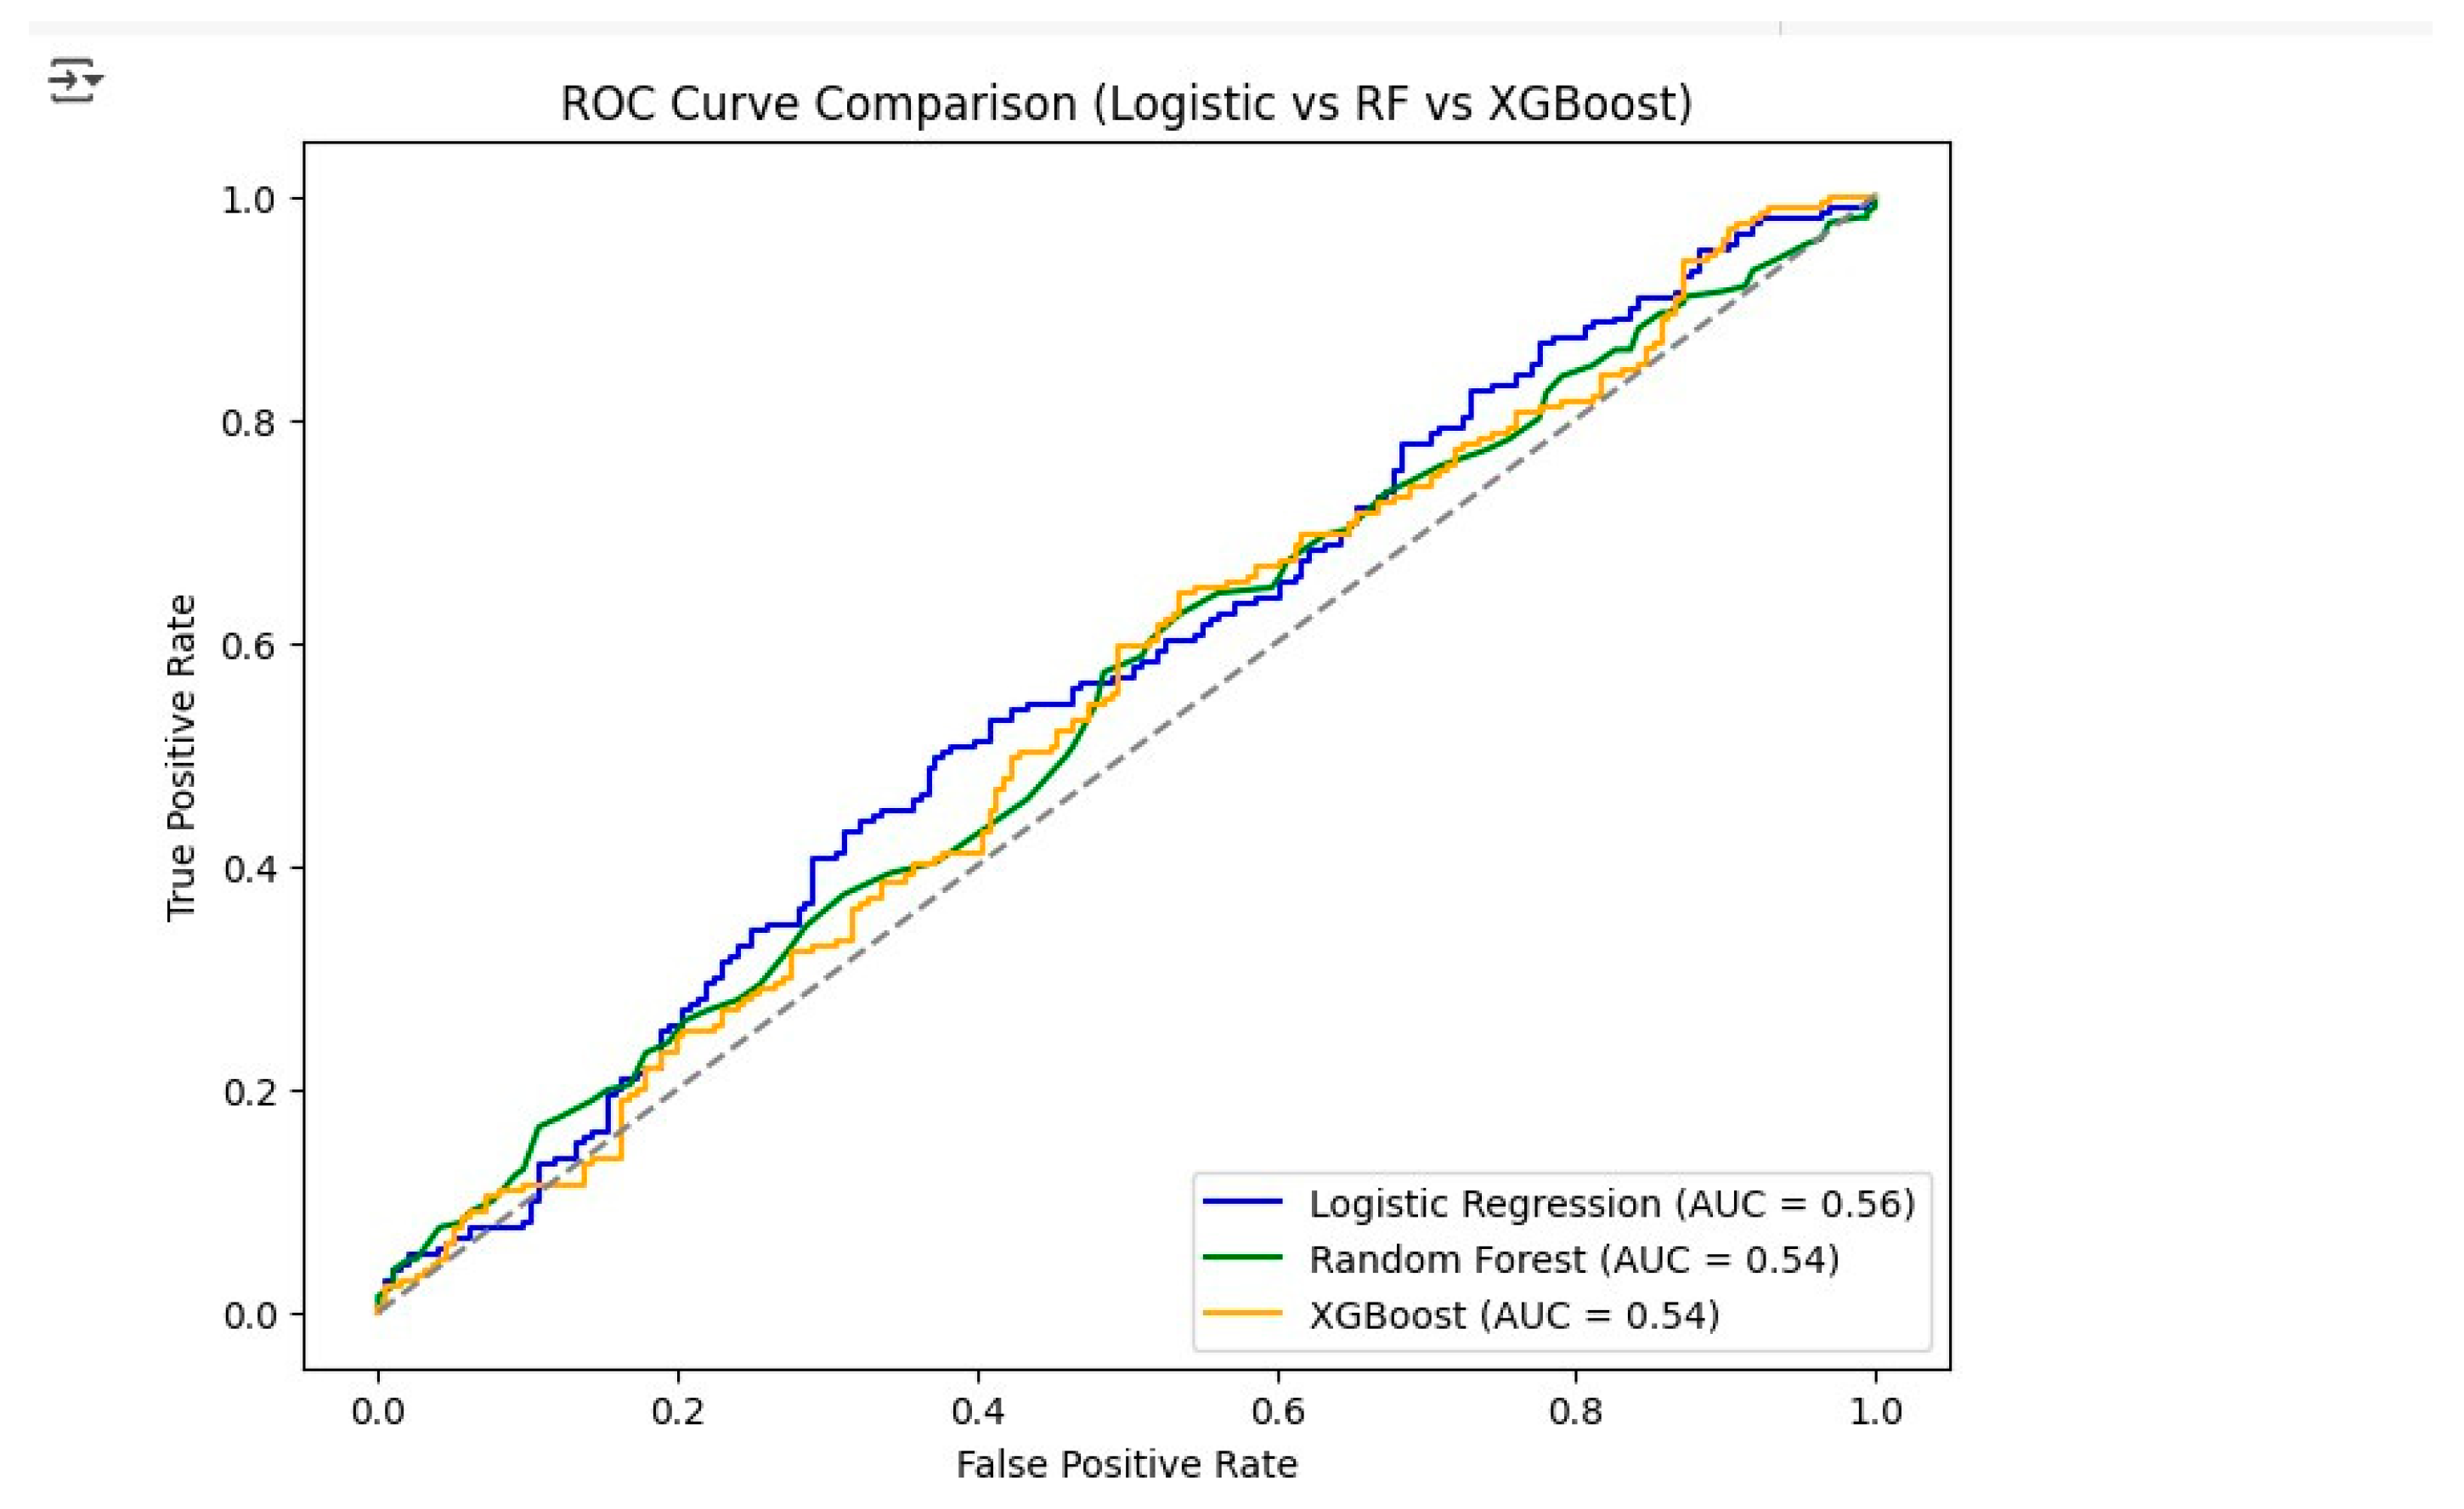
The ROC Curve for Logistic Regression showed an AUC (Area Under Curve) score of 0.58, indicating slightly better than random classification.
Figure 6.
4.5. Random Forest Confusion Matrix
The accuracy of the Random Forest model was evaluated by means of its confusion matrix, which depicts the correct classification of early and late lung cancer cases by the model. The confusion matrix in Figure 7 shows that the model has accurately classified 101 early-stage cancer (Class 1) and 121 late-stage cancer (Class 2) instances. Nevertheless, it misidentified 95 early-stage cases as late-stage, hence causing false positives, and erroneously predicted 90 late-stage cases as early-stage, thus contributing to false negatives. The obtained results reveal that the Random Forest model had a pretty much even capability to spot both cancer stages, notwithstanding the misclassification count that hints at the existence of overlapping patterns in the feature space. In general, the model was consistent in its output, however, its predictive power was slightly inferior to that of Logistic Regression, particularly regarding the F1-score, as shown in the comparative results.
4.6. XGBoost Confusion Matrix
The performance of the XGBoost model, depicted in Figure 8, can be seen through the confusion matrix. The model was able to accurately identify 101 instances as Class 0 (early-stage cancer) and 116 instances as Class 1 (advanced-stage cancer), respectively. It, however, committed an error by classifying 95 instances as Class 1 which were actually Class 0, causing false positives, and 95 instances as Class 0 which were actually Class 1, leading to false negatives. Although XGBoost has proven its ability to detect advanced-stage cancer with 116 true positives, the equal number of misclassifications for both classes shows that it is less precise than Logistic Regression and Random Forest. This finding correlates with the comparative results where XGBoost showed slightly lower precision and recall scores.
5. Model Performance Comparison & Best Model Conclusion
Through the use of key evaluation metrics, namely Accuracy, Precision, Recall, F1-Score, and AUC, this section provides a summary of the comparative performance of three machine learning models: Logistic Regression, Random Forest, and XGBoost.
5.1. Model Performance Summary Table
Table: Accuracy Precision Recall F1-Score AUC

| Logistic Regression | 0.56 | 0.56 | 0.57 | 0.57 | 0.58 |
| Random Forest | 0.54 | 0.54 | 0.55 | 0.55 | 0.54 |
| XGBoost | 0.54 | 0.54 | 0.56 | 0.55 | 0.54 |
5.2. Model Performance Comparison
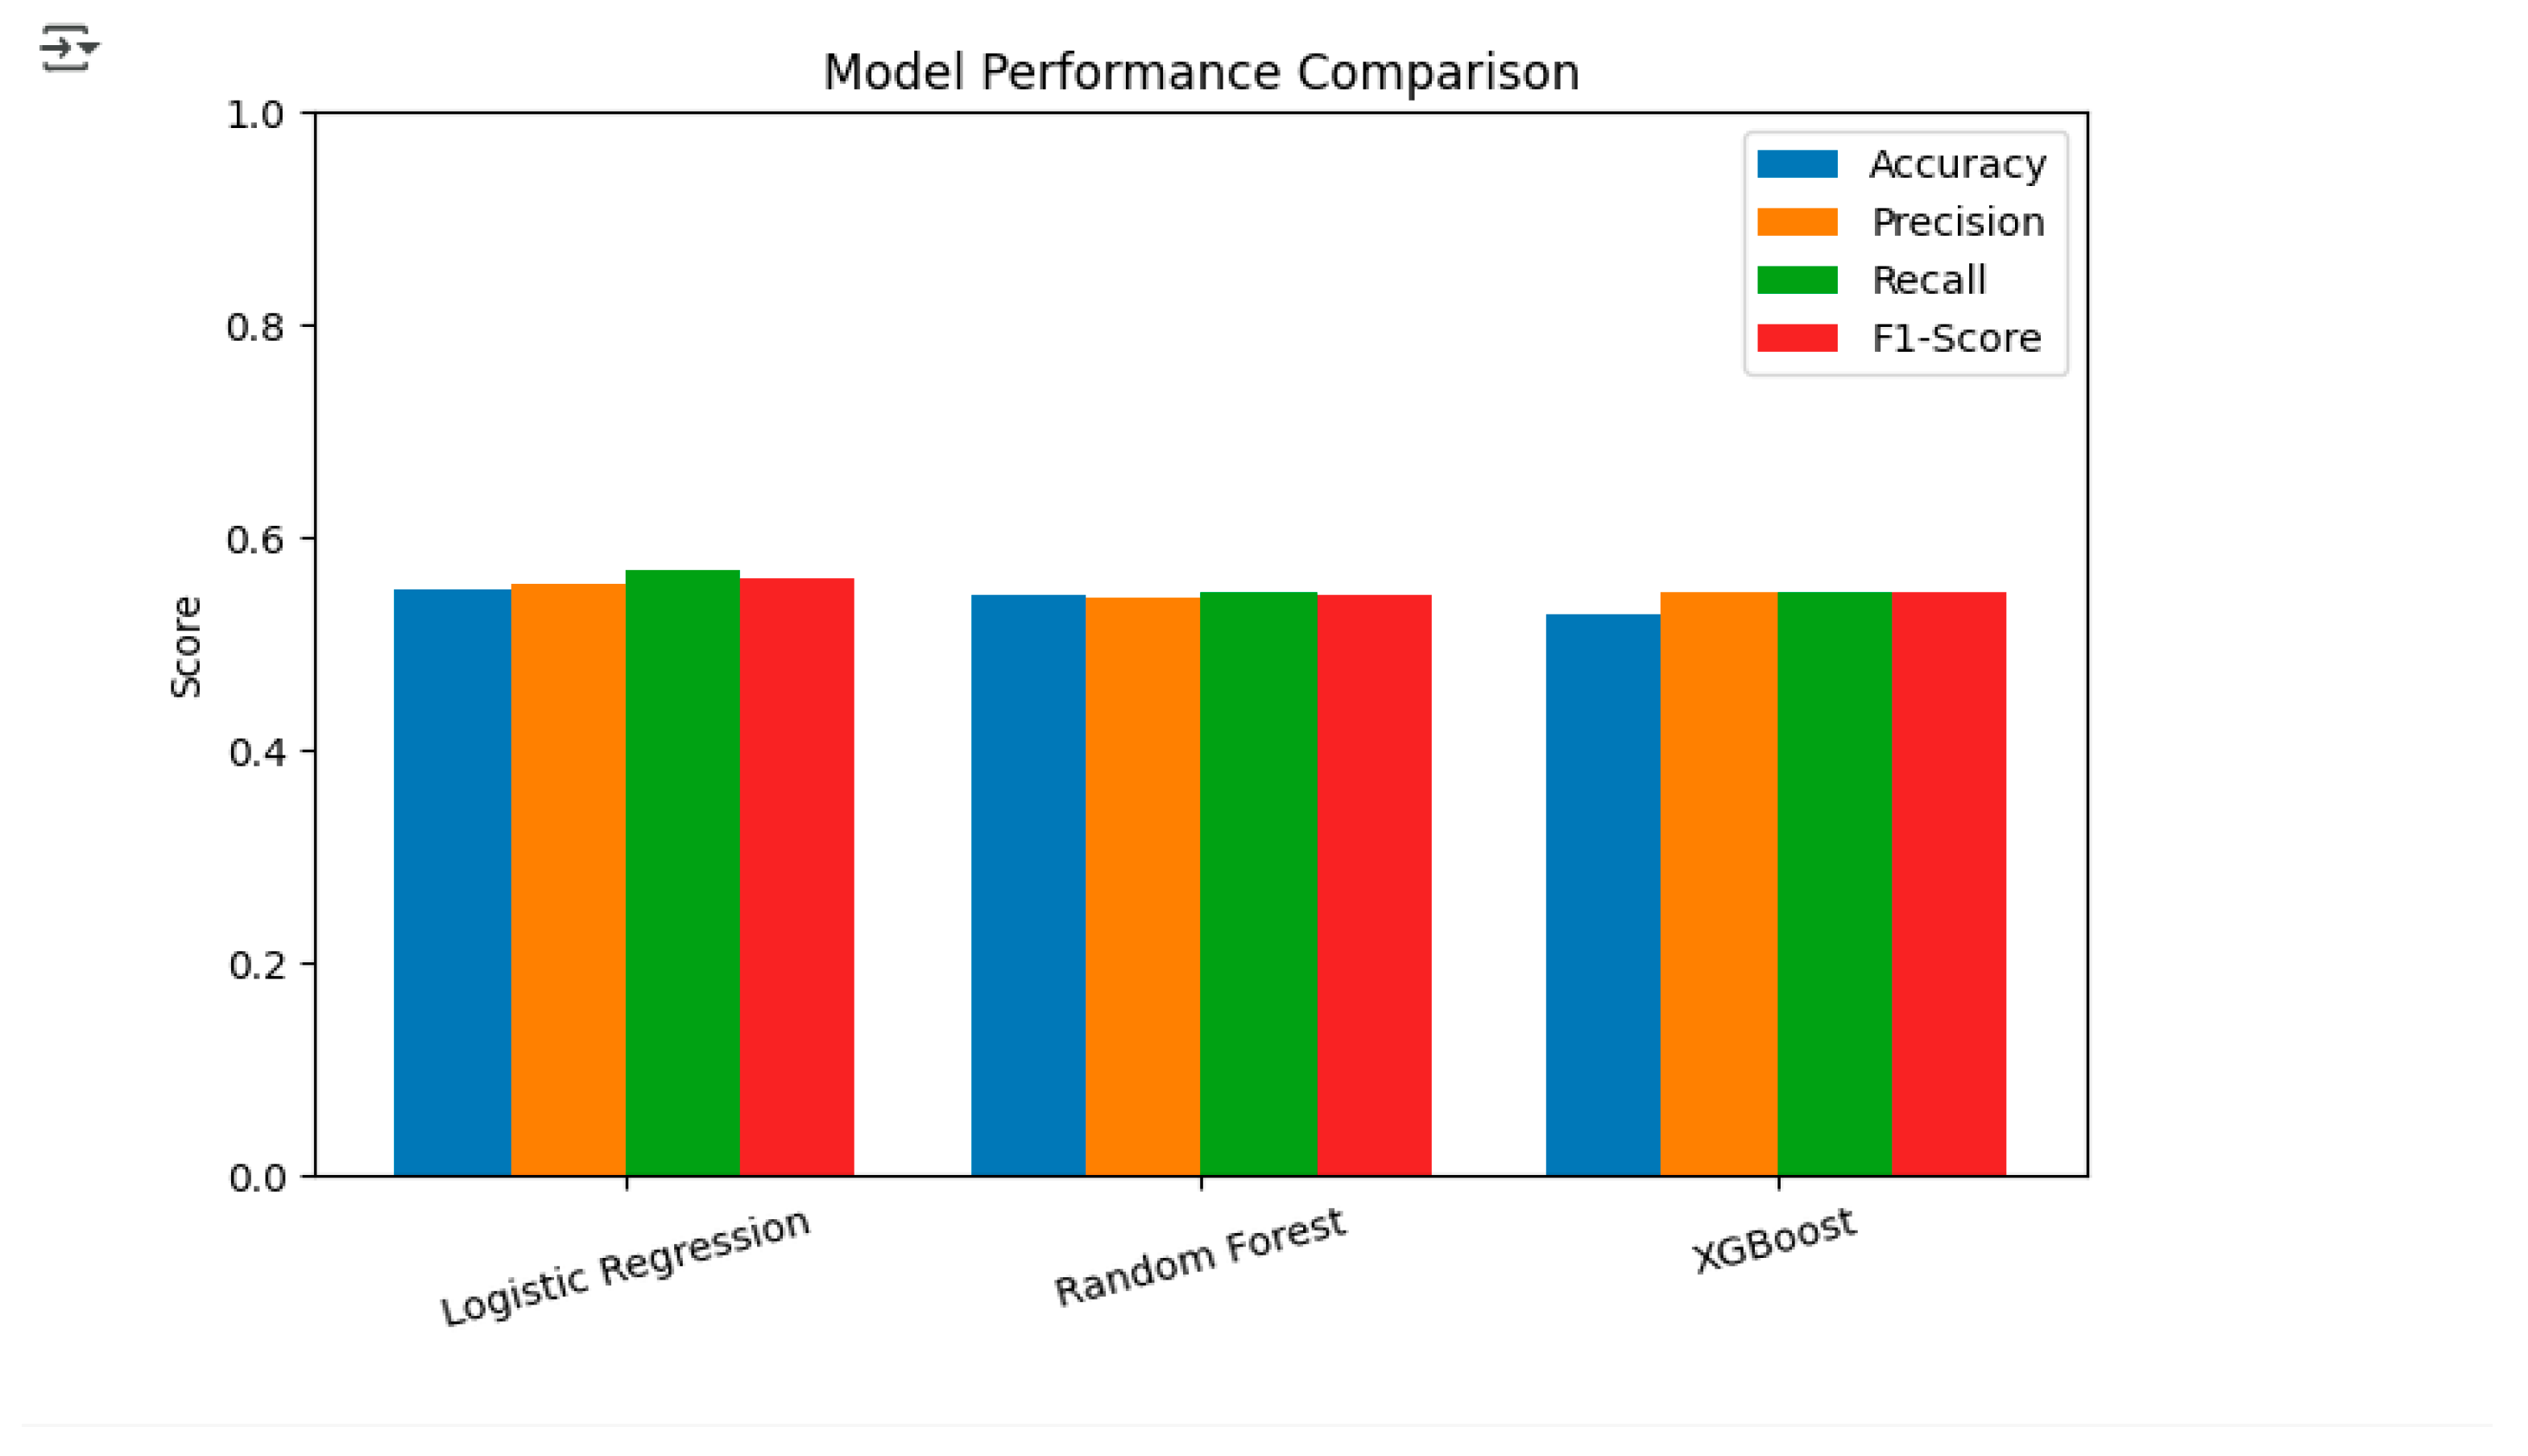
The ROC curve analysis (Figure 9) showed that Logistic Regression was the top performer with an AUC of 0.58, significantly surpassing both Random Forest and XGBoost which got AUCs of 0.54 each. This also means that Logistic Regression could be the method of choice for tumor staging in lung cancer. In a similar way, a bar graph showing Accuracy, Precision, Recall and F1-Score for all models (Figure 10) proved the case visually with Logistic Regression always winning the battle against the other two models in terms of most performance metrics.
From the combined evaluation of quantitative metrics and visual analysis, it can be concluded that Logistic Regression is the best-performing model with an Accuracy of 0.56, a Precision of 0.56, a Recall of 0.57, an F1-Score of 0.57, and an AUC of 0.58. These findings indicate that Logistic Regression is the most trustworthy model for predicting lung cancer stages in this dataset, thus, it is the most ideal model for potential deployment or further improvement.
- Conclusion and Recommendations
The analysis conducted through data mining aimed at classifying lung cancer stages with the help of demographic and clinical features and three machine learning models: Logistic Regression, Random Forest, and XGBoost. The main aim was to detect the most accurate model for predicting lung cancer stages, which in turn, would allow early detection and guidance for the intervention strategies.
6. Conclusion
The model evaluation process has brought forth various insights, the most significant of which has been the similarity in the performance of all models. Among them, the Logistic Regression scored the best for its model performance, with Accuracy 0.56, Precision 0.57, Recall 0.57, and F1-Score 0.57. Random Forest was slightly lower in performance, with Accuracy 0.55 and F1-Score 0.55, while XGBoost was the same as Random Forest but a little lower than both, with Accuracy 0.54 and F1-Score 0.55. The ROC-AUC analysis further supported the performance of Logistic Regression, which was given an AUC score of 0.56, while Random Forest and XGBoost received AUC scores of 0.54. The analysis of the confusion matrices indicated that Logistic Regression was better at identifying true positives in advanced cancer stages compared to other models; however, all three models shared the same difficulty in differentiating between some cancer stages, which could imply data imbalances or overlapping feature distributions. The quality of the data played a secondary role in the process, as the original dataset was heavily populated with missing values, particularly in the days_to_cancer and stage_of_cancer variables. Data cleaning and imputation were the necessary procedures to transform the dataset into a modeling-ready state, although some bias due to the imputed values may still exist.
7. Recommendations
Improvements in Model Accuracy: Studies conducted in the future should endeavor to the methods of hyperparameter tuning and feature extraction in the quest for better predictive performance. Besides, Grid Search and Random Search are some of the possible ways to take the Random Forest and XGBoost models even further in their optimization. Handling Imbalanced Classes: Oversampling techniques such as SMOTE, or under sampling may produce better classification results with the less prevalent cancer stages being the major recipients.
Feature Development: The addition of new clinical variables possibly including genetic data or lifestyle factors would most likely result in a significant increase in the predictive power of the models. Deployment Scenarios: Logistic Regression, which is clear and quick in terms of computation, is the ideal partner for real-world medical decision-support systems. In addition, the use of ensemble methods that combine different models has the potential to further enhance generalizability. Increased Validation: It is recommended to perform cross-validation on the models with larger and more diverse datasets in order to verify their superiority and reliability prior to their deployment in clinical settings. The above structured conclusion and recommendations provide a simple pathway for the enhancement of lung cancer stage prediction and the delivery of results to practical healthcare applications.
References
- Abdu-Aljabar, R. D. A., & Awad, O. A. (2021, February). A comparative analysis study of lung cancer detection and relapse prediction using XGBoost classifier. In IOP conference series: materials science and engineering (Vol. 1076, No. 1, p. 012048). IOP Publishing.
- Srivastav, R. R., Bhoite, S., Ansari, G. A., & Magar, V. J. (2023, October). A Comparative Analysis of Lung Cancer Prediction Using Machine Learning Techniques. In International Conference on Sustainable and Innovative Solutions for Current Challenges in Engineering & Technology (pp. 457-476). Singapore: Springer Nature Singapore.
- Sweet, M. M. R., Ahmed, M. P., Mozumder, M. A. S., Arif, M., Chowdhury, M. S., Bhuiyan, R. J., ... & Mamun, M. A. I. (2024). Comparative analysis of machine learning techniques for accurate lung cancer prediction. The American Journal of Engineering and Technology, 6(09), 92-103.
- Kurniawan, M. H., & Misinem, M. (2025). A Comparative Evaluation of Predictive Models for Lung Cancer: Insights from Logistic Regression, Naive Bayes, and Random Forest. International Journal of Advances in Artificial Intelligence and Machine Learning, 2(1), 10-17. [CrossRef]
- Tu, H., Zhao, Y., Cui, J., Lu, W., Sun, G., Xu, X., ... & Wu, X. (2025). Improving Lung Cancer Risk Prediction Using Machine Learning: A Comparative Analysis of Stacking Models and Traditional Approaches. Cancers, 17(10), 1651. [CrossRef]
- Dutta, B. (2025). Comparative Analysis of Machine Learning and Deep Learning Models for Lung Cancer Prediction Based on Symptomatic and Lifestyle Features. Applied Sciences, 15(8), 4507. [CrossRef]
- Ilani, M. A., & Kavei, A. (2024). A comparative analysis of machine learning models for lung cancer prediction: From traditional algorithms to deep learning approaches.
- Yuan, Y., Wang, R., Luo, M., Zhang, Y., Guo, F., Bai, G., ... & JingZhao. (2022). A machine learning approach using XGBoost predicts lung metastasis in patients with ovarian cancer. BioMed Research International, 2022(1), 8501819. [CrossRef]
- Mamun, M., Farjana, A., Al Mamun, M., & Ahammed, M. S. (2022, June). Lung cancer prediction model using ensemble learning techniques and a systematic review analysis. In 2022 IEEE World AI IoT Congress (AIIoT) (pp. 187-193). IEEE.
- Dalai, S. S., Sahu, B. J. R., Friday, I. K., Nayak, S. K., & Tripathy, N. (2025). Enhanced Lung Cancer Classification Using SMOTE and Soft Voting Ensemble of Decision Tree, XGBoost, and Logistic Regression. In Artificial Intelligence in Oncology: Cancer Diagnosis and Treatment, Medical Imaging, and Personalized Medicine (pp. 221-231). Cham: Springer Nature Switzerland.
- Huang, S., Arpaci, I., Al-Emran, M., Kılıçarslan, S., & Al-Sharafi, M. A. (2023). A comparative analysis of classical machine learning and deep learning techniques for predicting lung cancer survivability. Multimedia Tools and Applications, 82(22), 34183-34198. [CrossRef]
- Daeli, B. B. F., & Sanjaya, U. P. (2025). Comparative Analysis of Logistic Regression, Random Forest, and SVM for Asthma Risk Prediction Using Demographic, Clinical, and Environmental Features. Journal of Applied Informatics and Computing, 9(5), 2187-2194. [CrossRef]
Figure 1.
Distribution of Cancer Stages (1 = Early, 2 = Late).
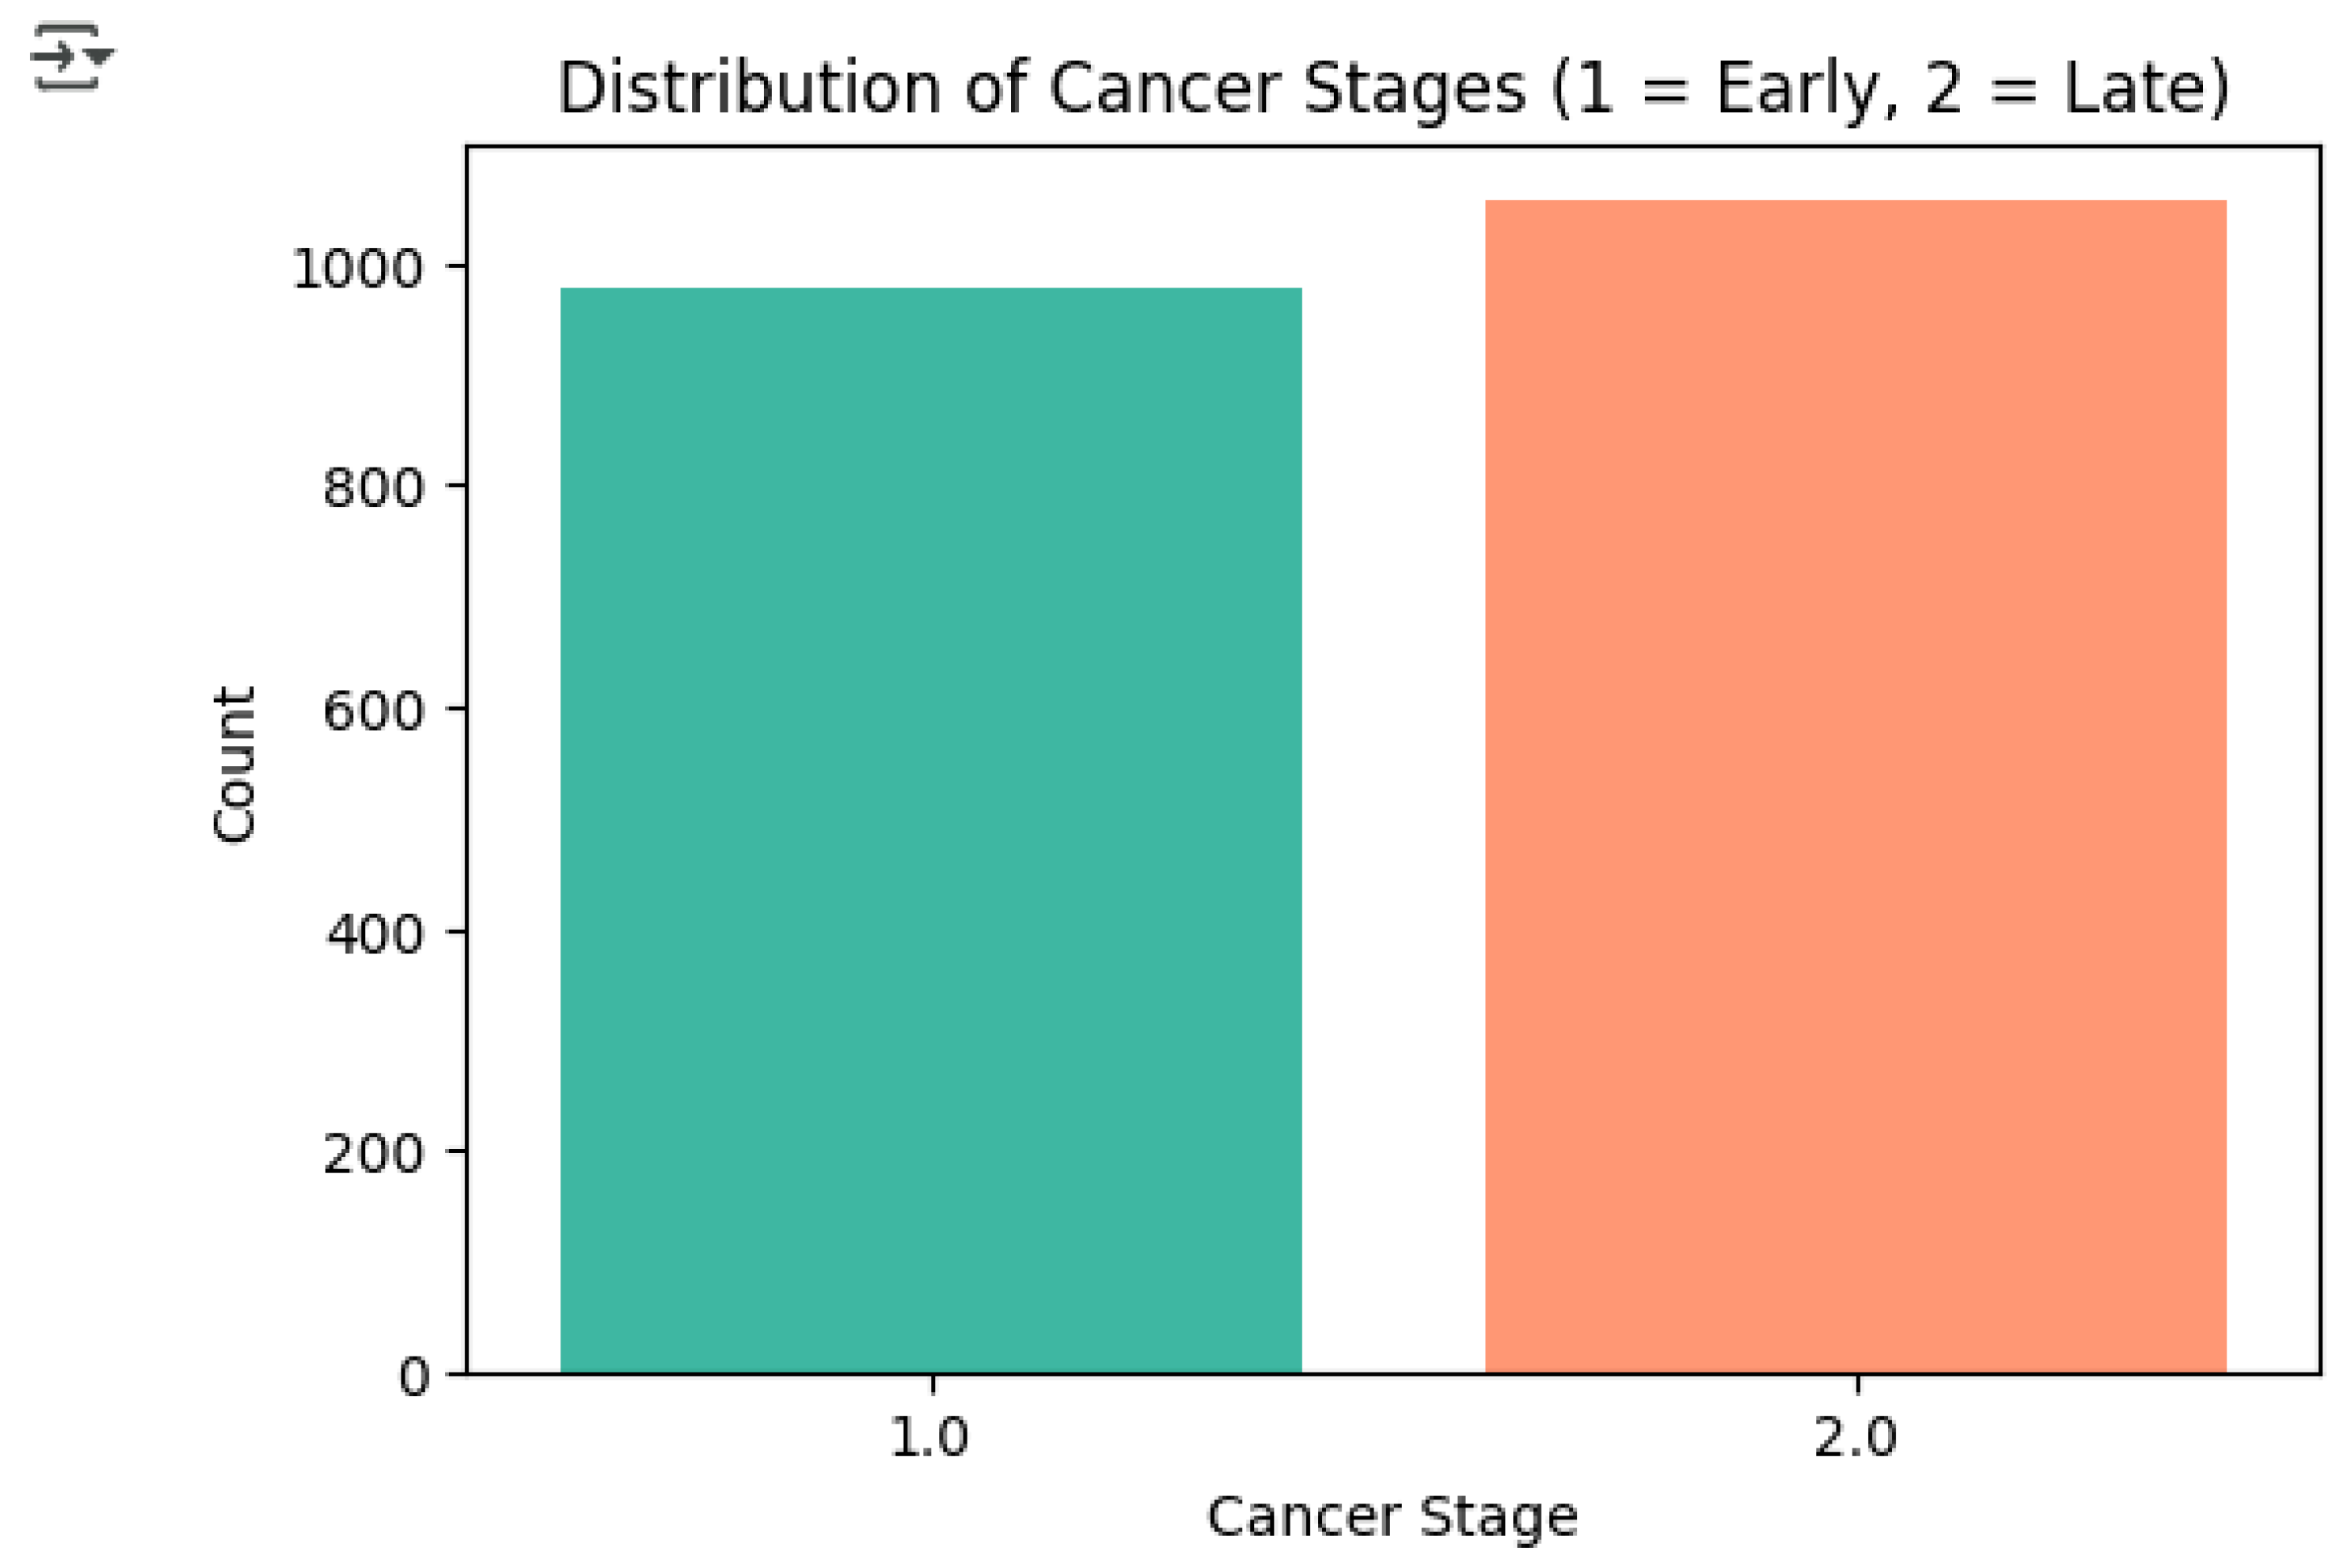
Figure 2.
Smoker Status vs Cancer Stage.
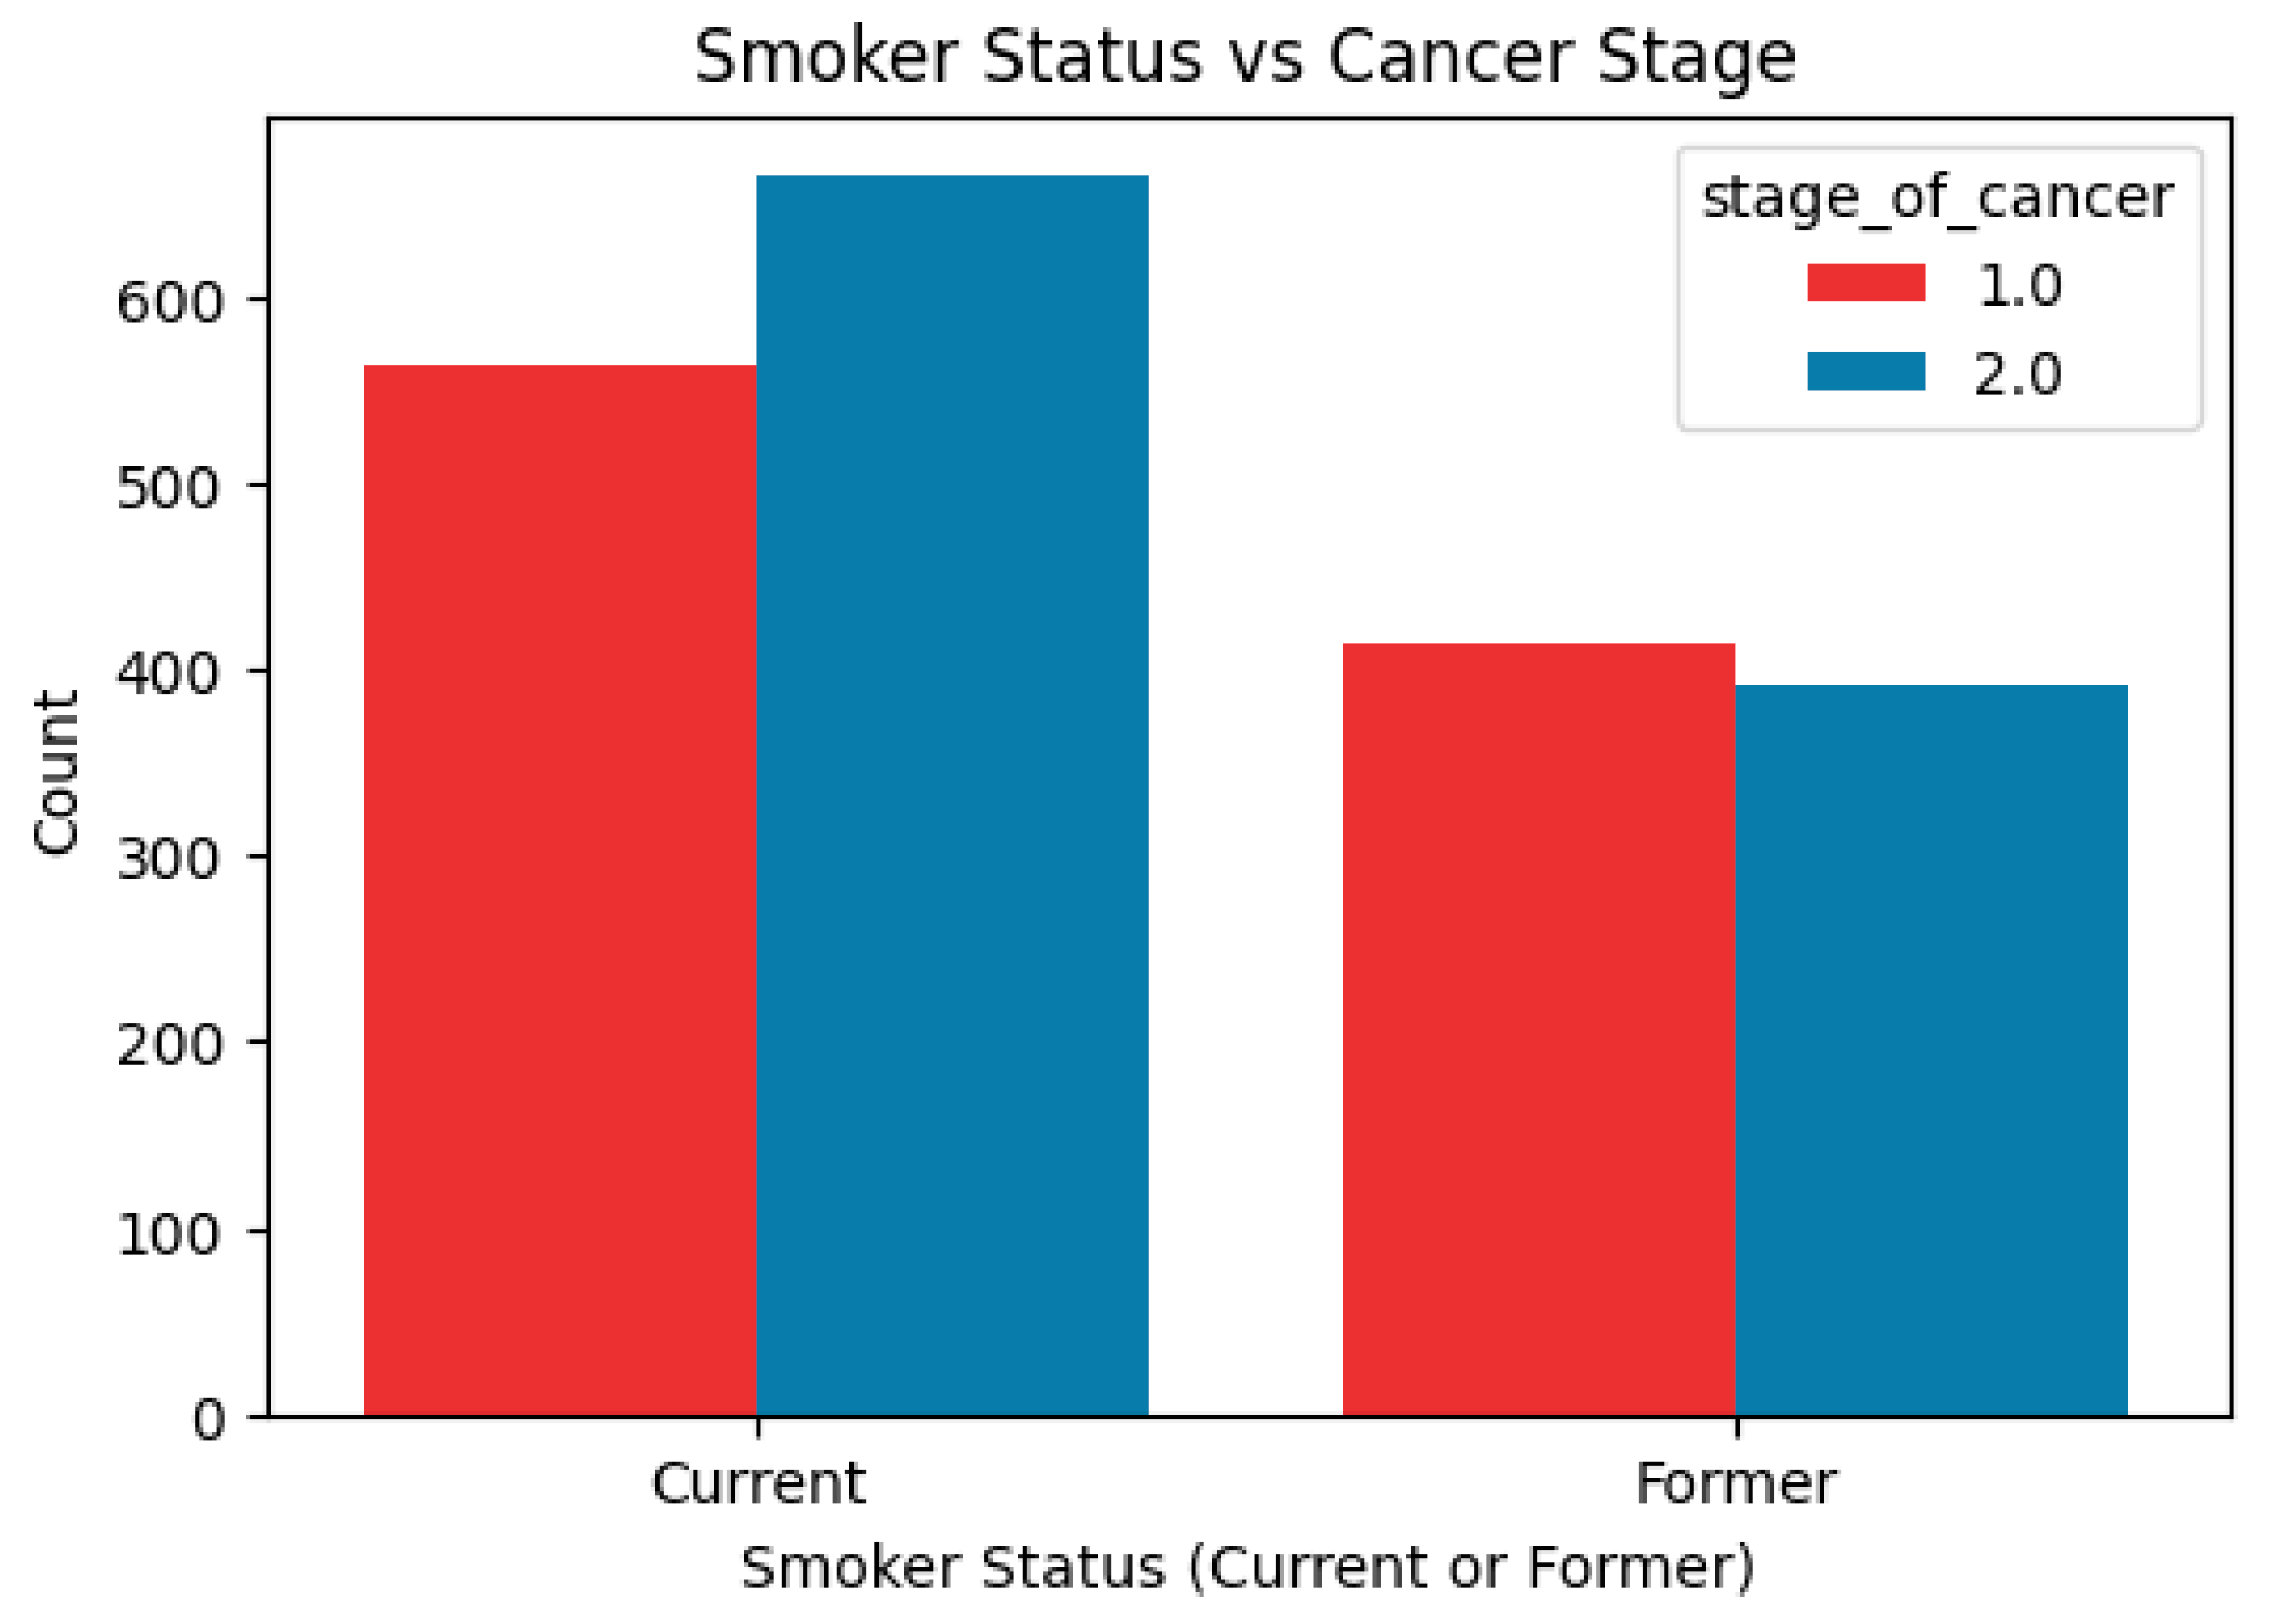
Figure 3.
Missing Data.
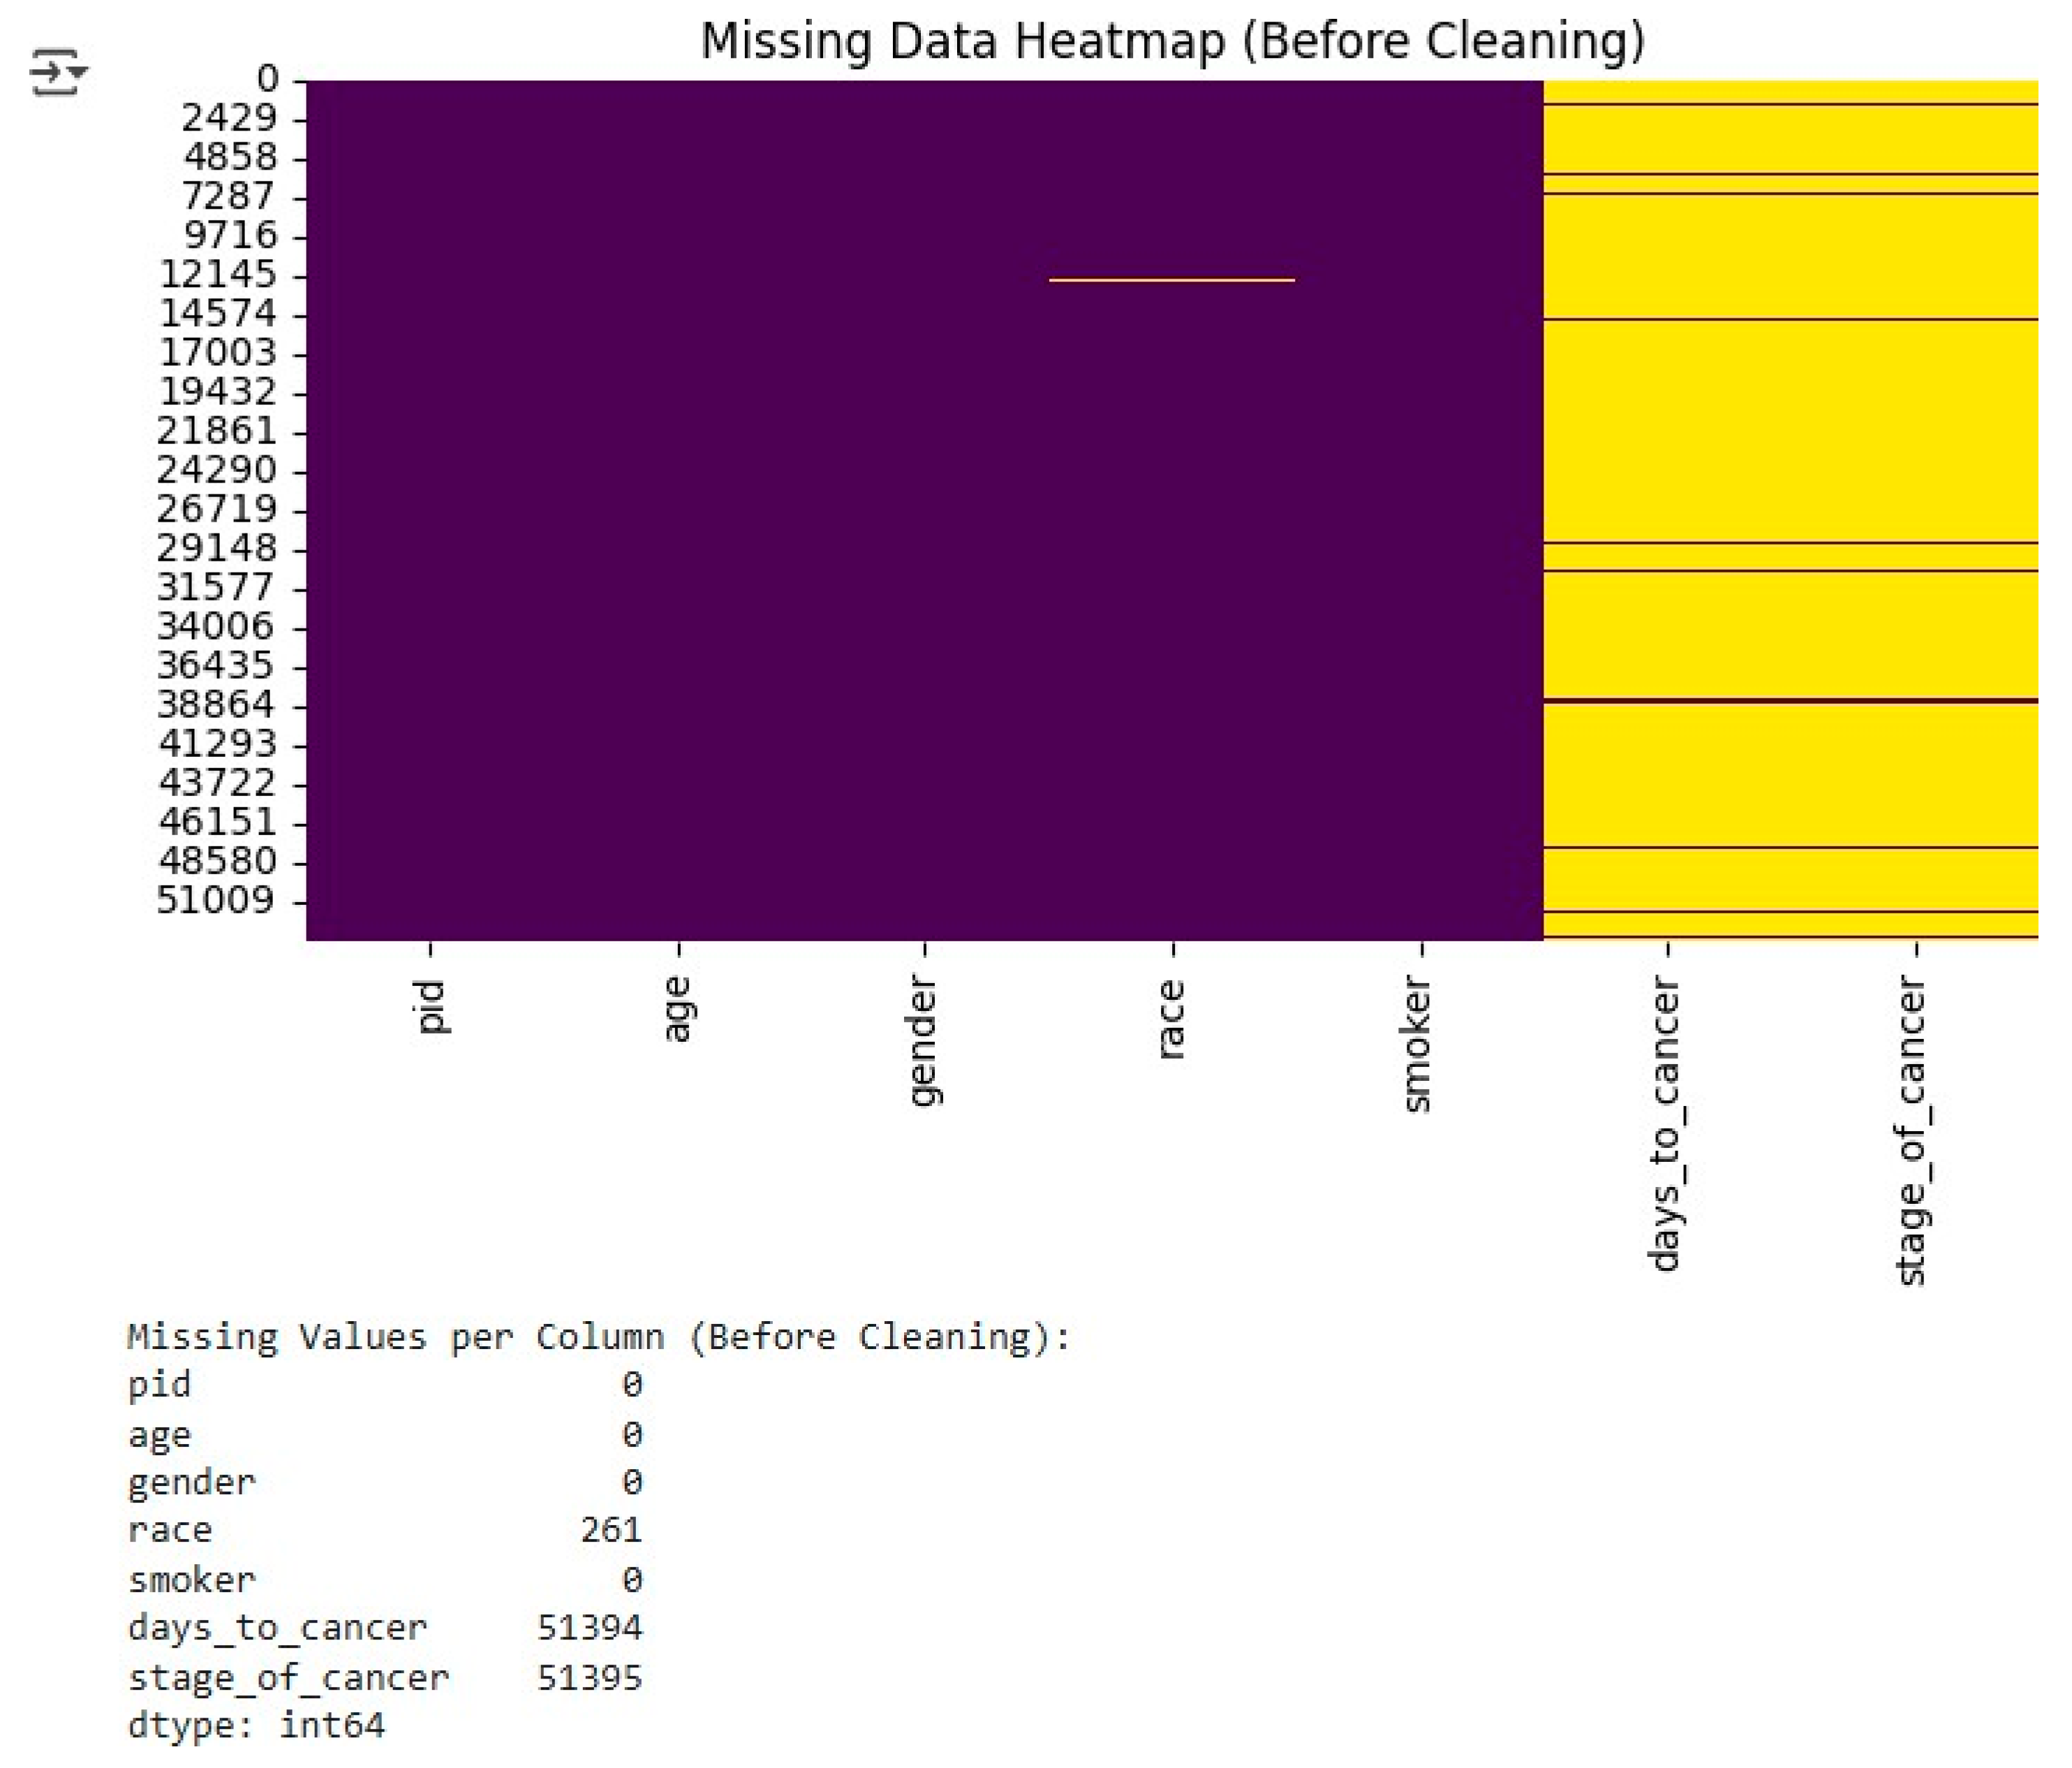
Figure 7.
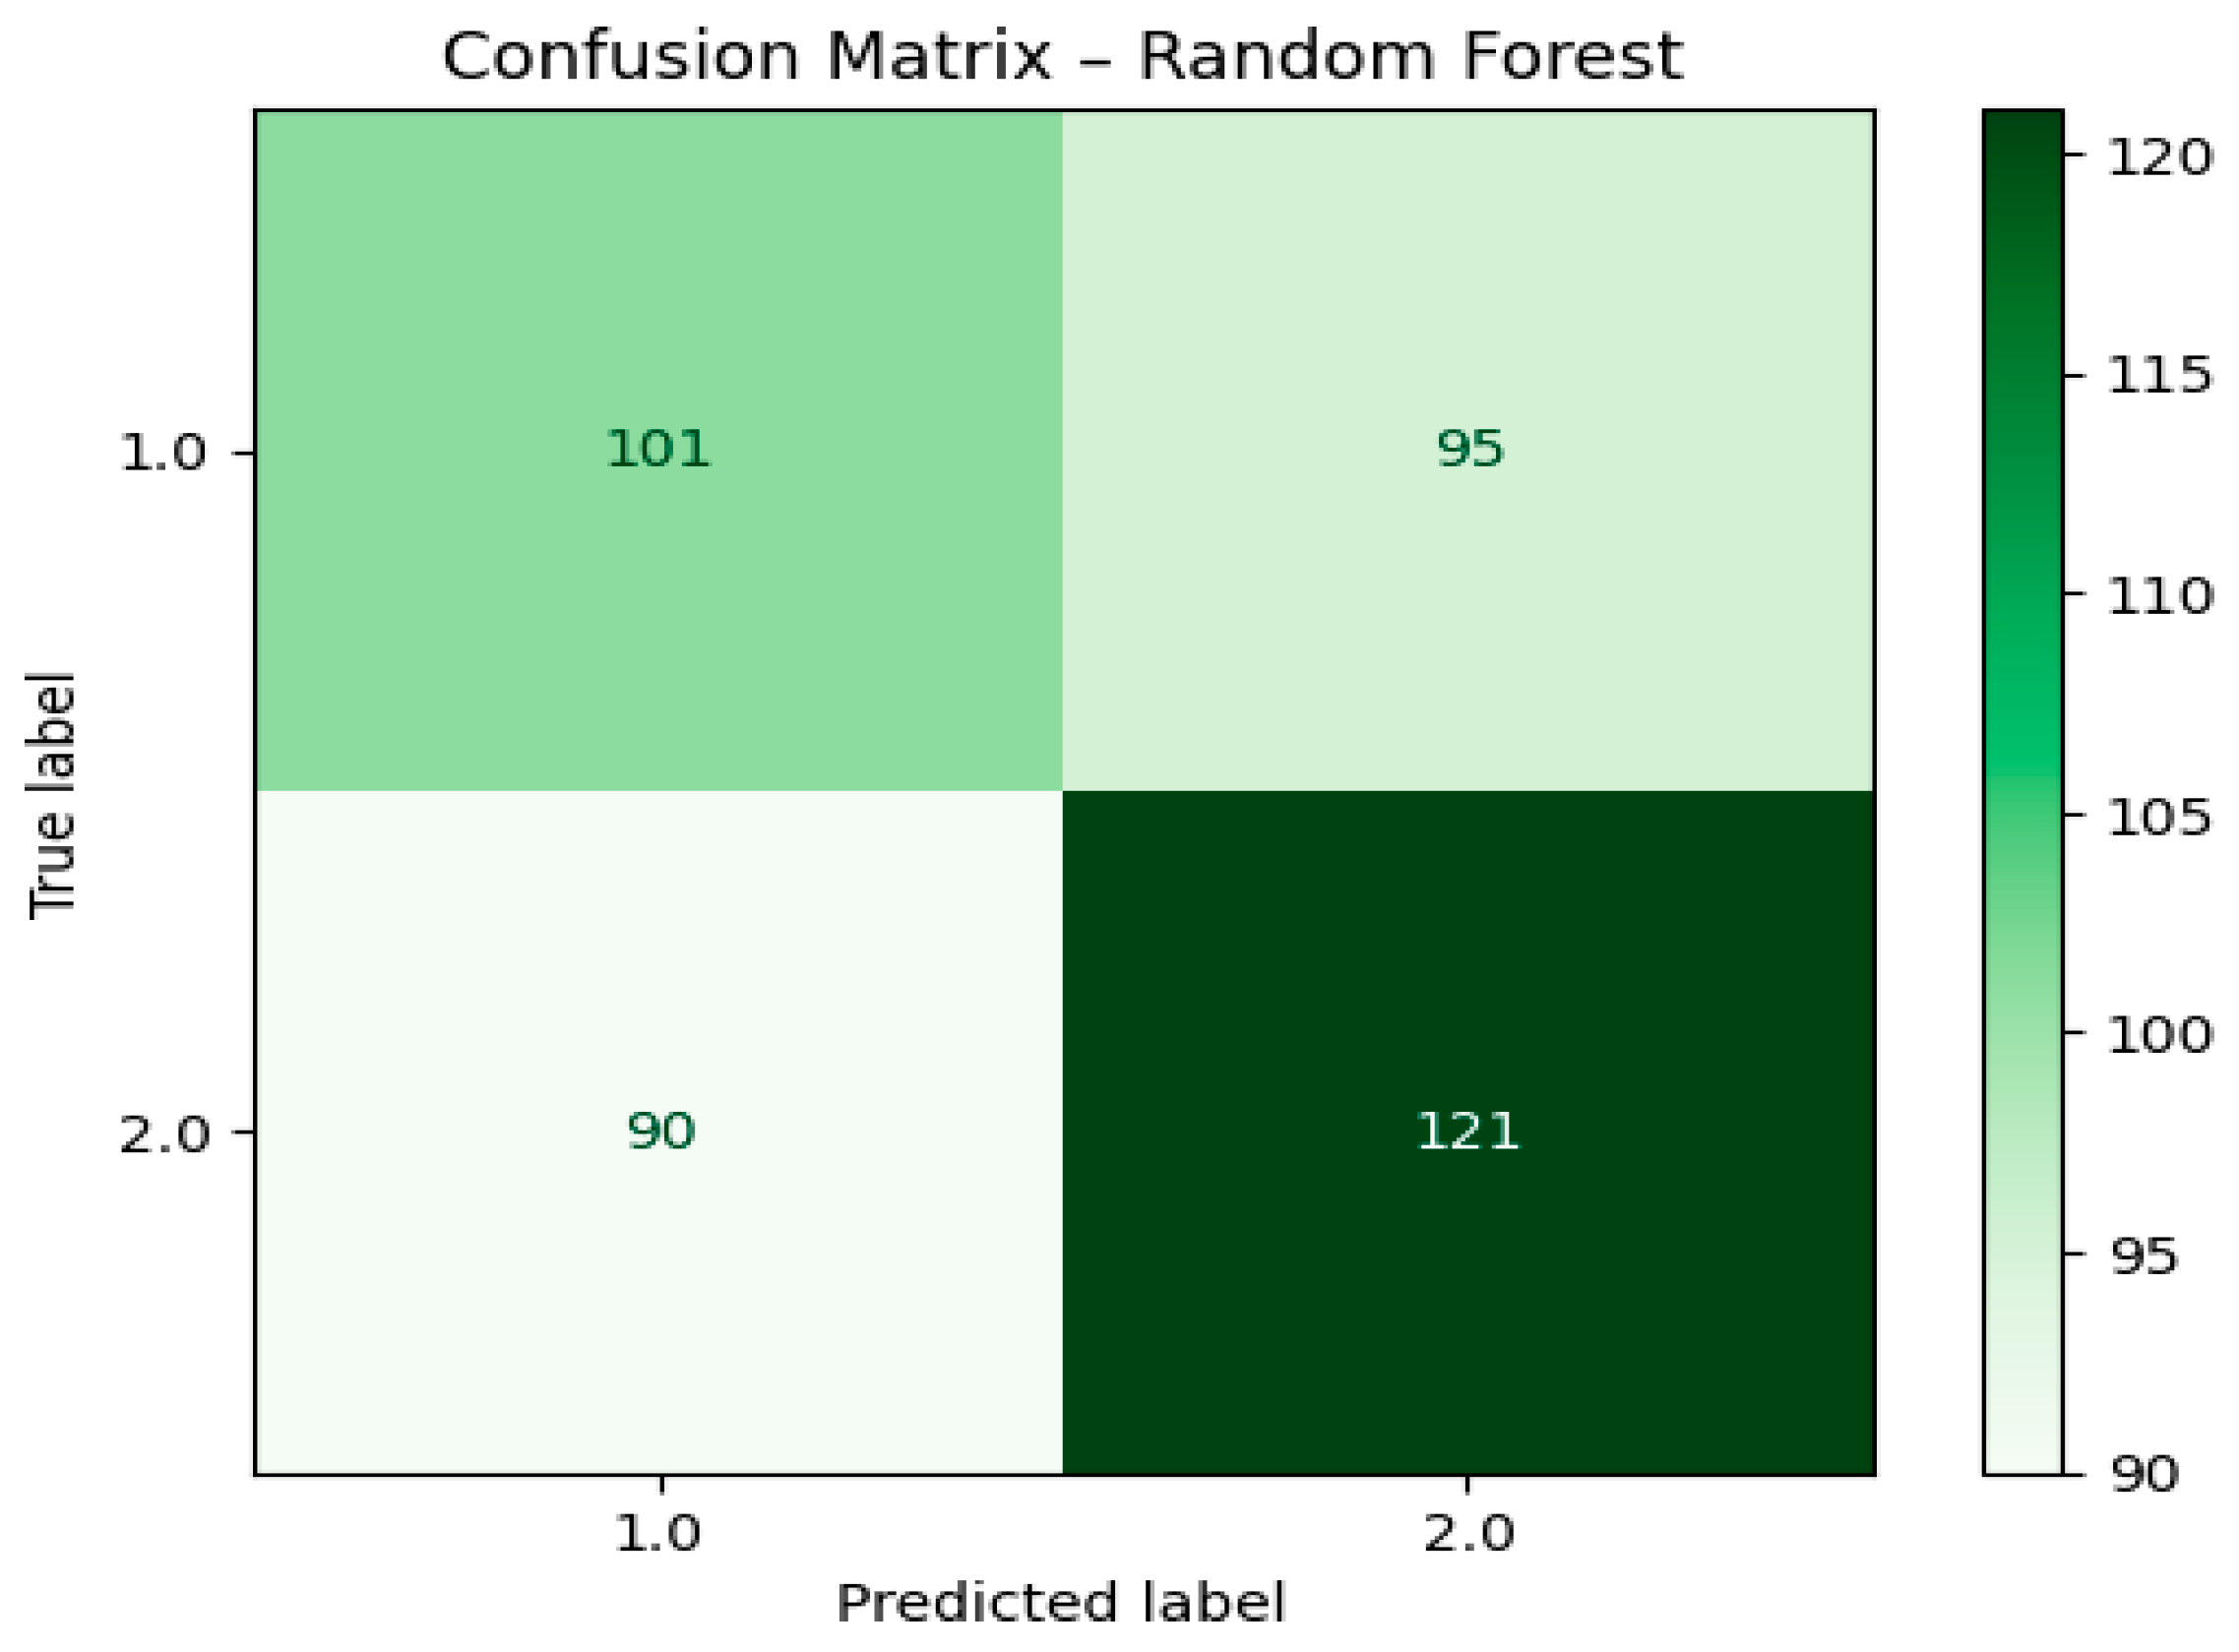
Figure 8.
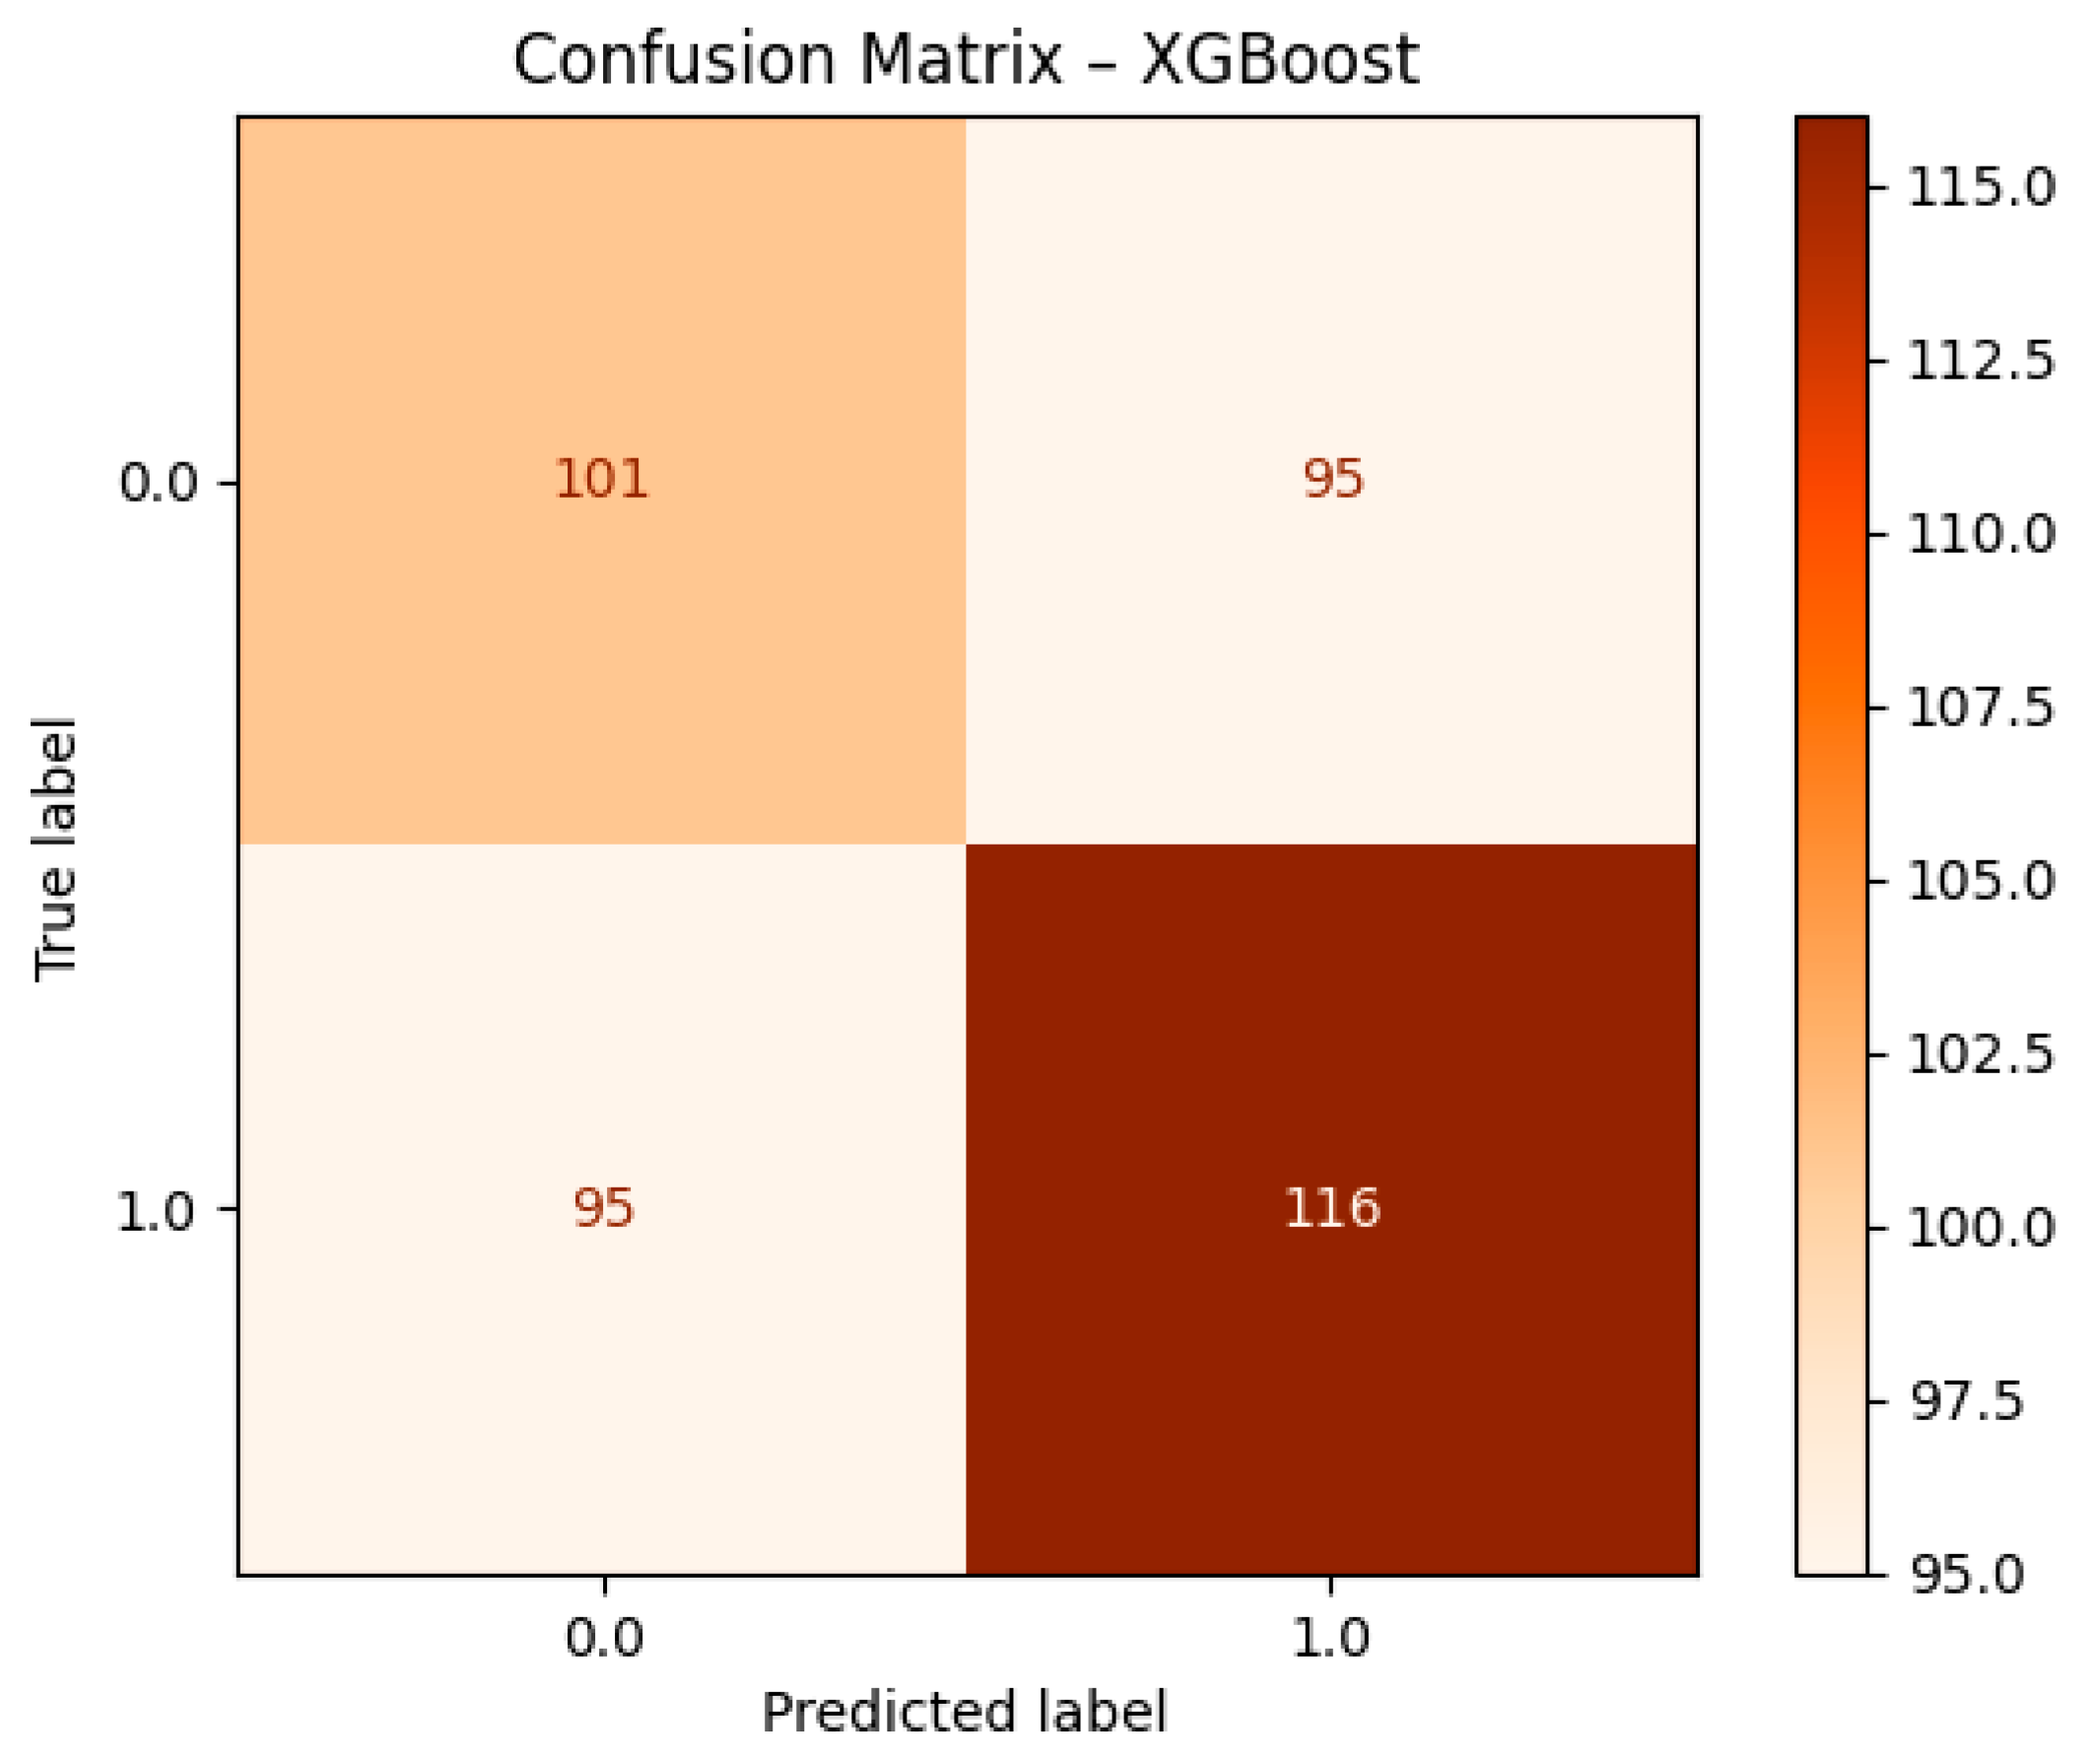
Figure 9.
ROC Curve Comparison.
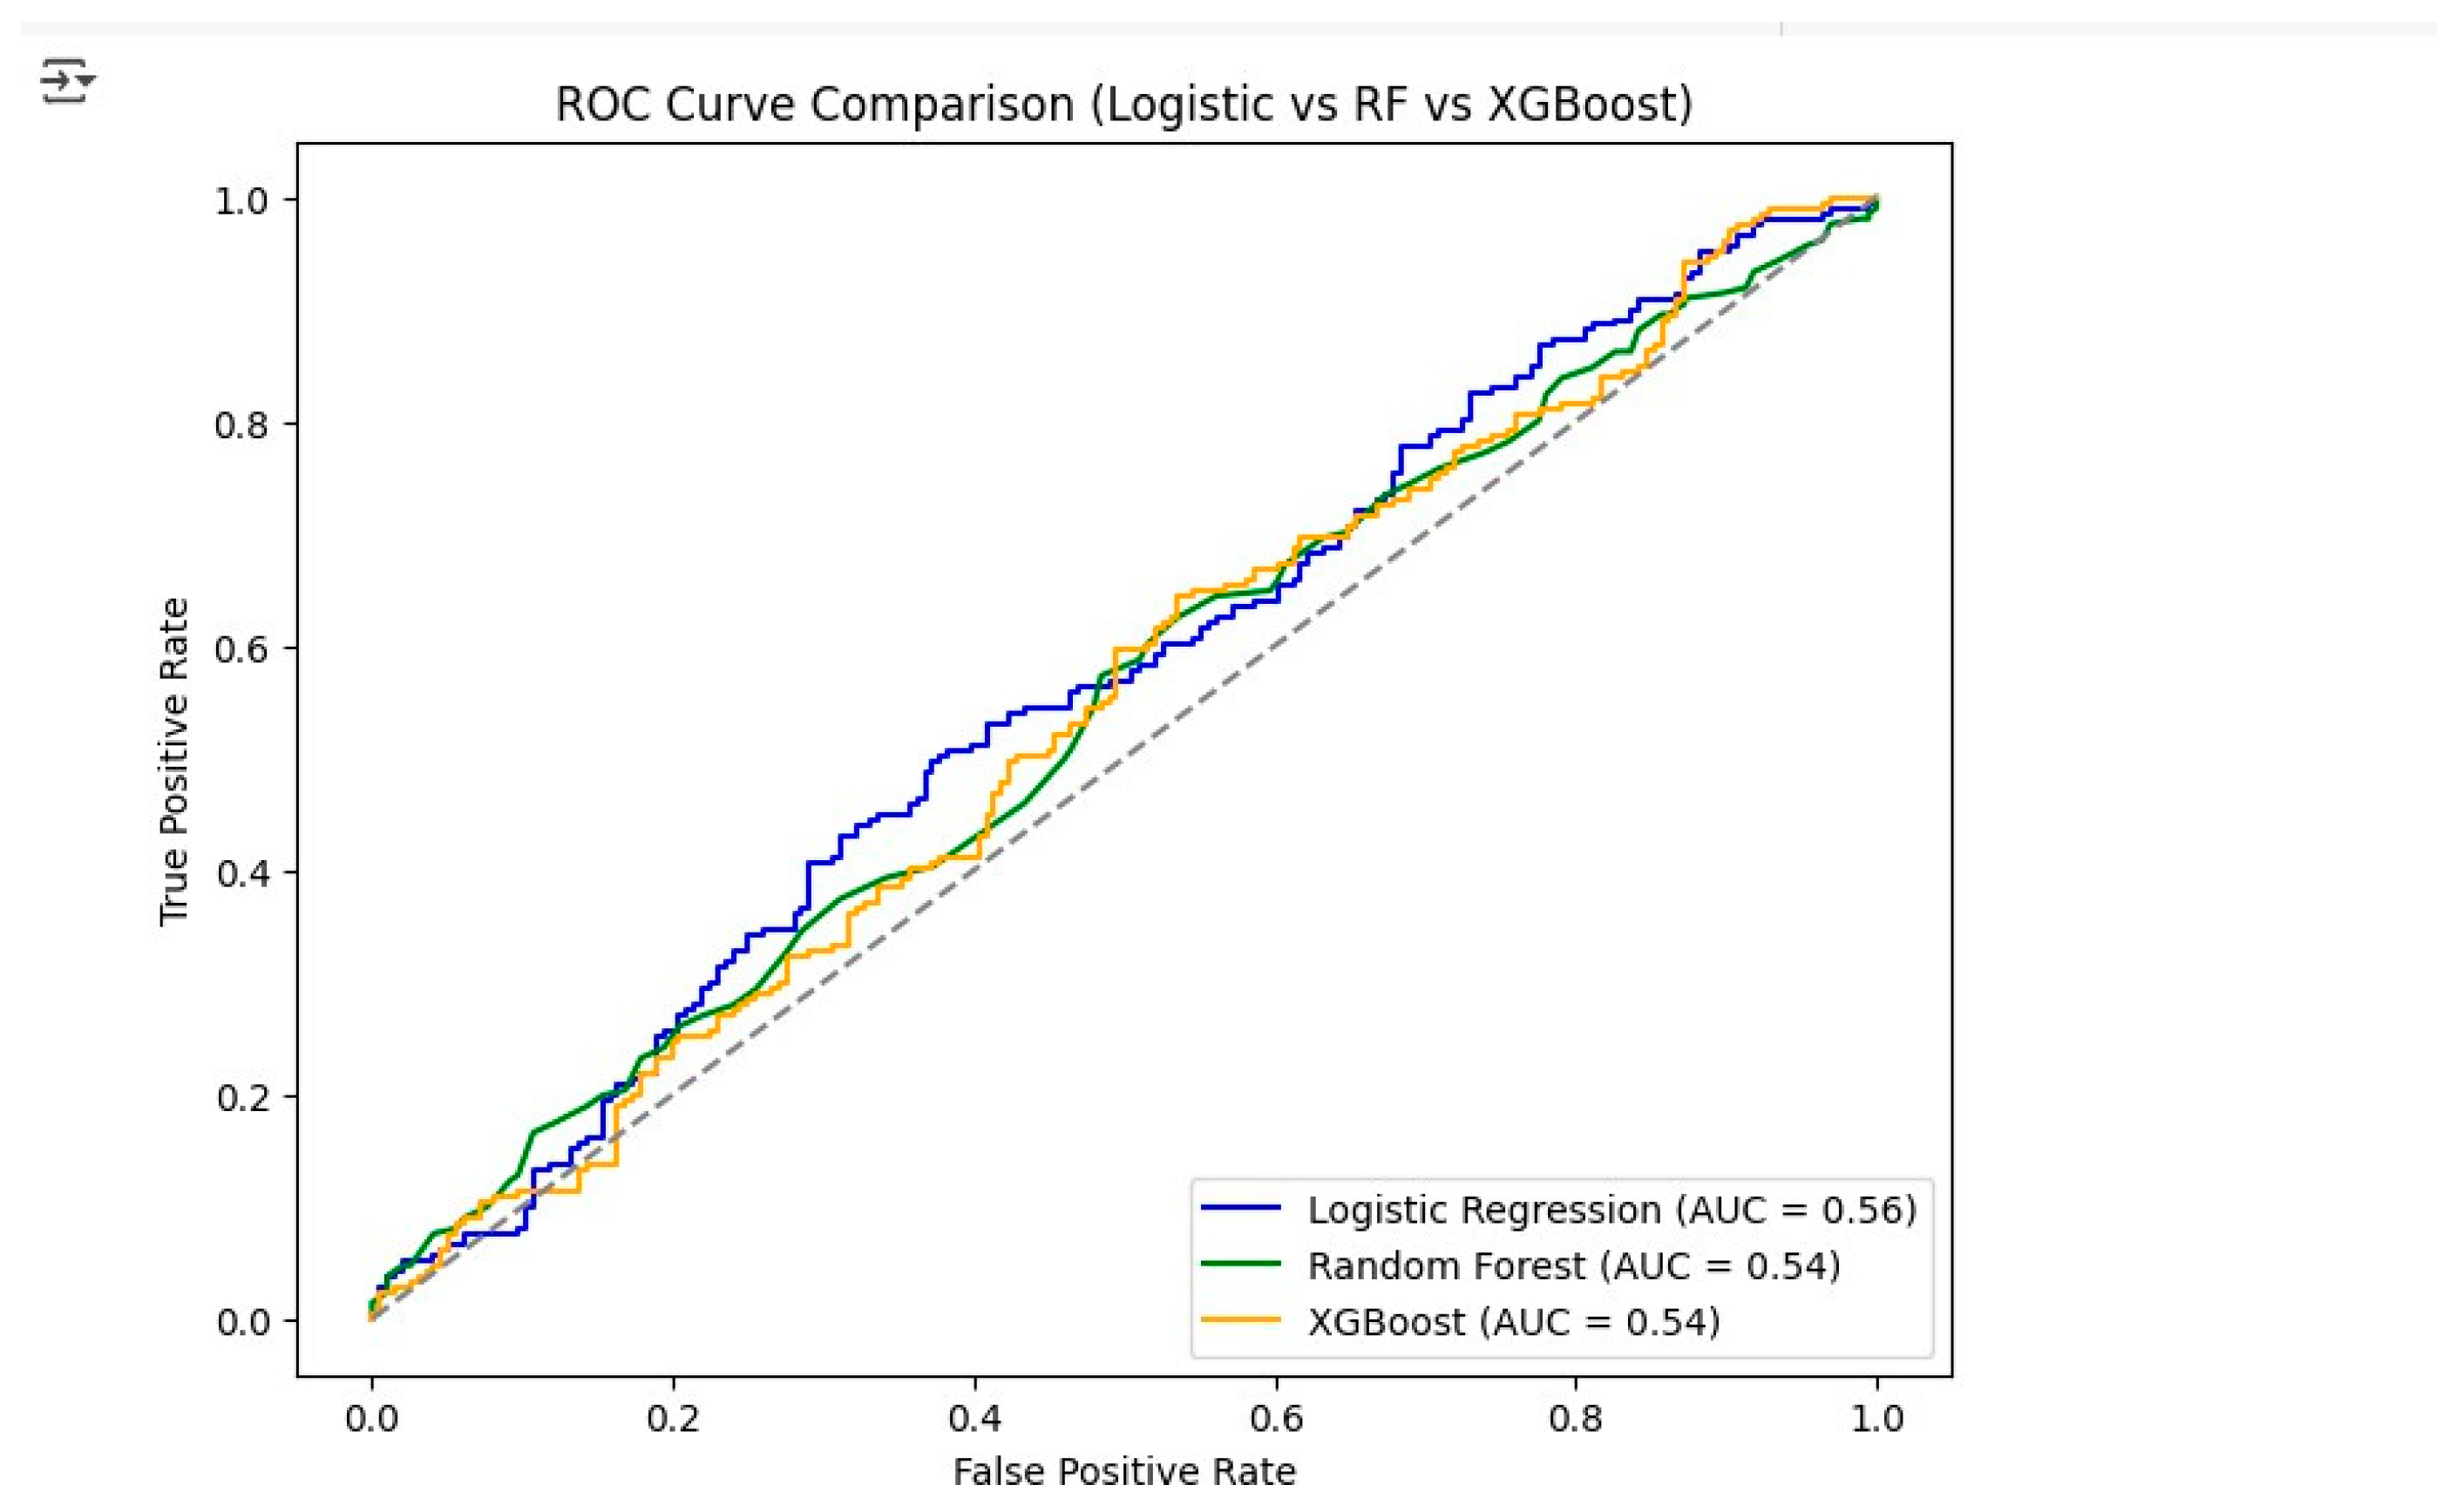
Figure 10.
Model Performance Bar Chart.
Disclaimer/Publisher’s Note: The statements, opinions and data contained in all publications are solely those of the individual author(s) and contributor(s) and not of MDPI and/or the editor(s). MDPI and/or the editor(s) disclaim responsibility for any injury to people or property resulting from any ideas, methods, instructions or products referred to in the content. |
© 2025 by the authors. Licensee MDPI, Basel, Switzerland. This article is an open access article distributed under the terms and conditions of the Creative Commons Attribution (CC BY) license (http://creativecommons.org/licenses/by/4.0/).
Copyright: This open access article is published under a Creative Commons CC BY 4.0 license, which permit the free download, distribution, and reuse, provided that the author and preprint are cited in any reuse.


