Submitted:
23 November 2025
Posted:
25 November 2025
You are already at the latest version
Abstract
Understanding the temporal clustering of heavy precipitation is important for flood risk assessment in Europe, but current climate models show limited skill in reproducing these events. This study evaluates ten CMIP6 models against the E-OBS dataset for the period 1981–2020, focusing on consecutive days of extreme rainfall defined above the 95th percentile. Cluster features were measured using mean cluster length and maximum consecutive wet days, and model skill was assessed with correlation, mean absolute error, and Nash–Sutcliffe Efficiency. The results show that models capture large-scale spatial patterns but underestimate persistence by 15–30% in Mediterranean and Alpine regions. In contrast, performance is better in maritime climates, where correlations reach 0.55–0.65 and mean absolute error is close to one day. Sensitivity tests indicate that thresholds and linking rules strongly affect cluster metrics. Spatial analysis further highlights systematic underestimation of persistence in southern Europe. These results point to the need for better representation of persistence, convective rainfall, and orographic effects in climate models. Although the analysis is limited by the coarse resolution of observations and the small set of models, it provides useful evidence for improving model evaluation and supports more reliable flood risk management under climate change.
Keywords:
precipitation clustering
; climate models
; extreme rainfall
; Europe
; temporal distribution
; flood risk
; model evaluation
1. Introduction
Heavy precipitation is one of the most damaging climate hazards in Europe, causing serious impacts on infrastructure, agriculture, and human safety [1]. Beyond the magnitude of individual events, the temporal clustering of heavy rainfall—defined as multiple intense precipitation days occurring within short intervals—can greatly amplify flood risk because soil moisture remains high and infiltration capacity cannot recover between storms, leading to rapid runoff and river response [2]. Therefore, understanding the temporal organization of extremes is increasingly recognized as a critical component of flood risk assessment and water-resource management. Recent advances in global climate models (GCMs), particularly those participating in CMIP6, have improved the representation of large-scale precipitation patterns and extreme rainfall statistics [3]. Many models reasonably reproduce seasonal cycles and the spatial distribution of extreme events over Europe [4]. However, their ability to simulate short-duration extremes remains limited because such events are strongly influenced by mesoscale weather systems and convection, which remain unresolved in coarse grids [5]. Regional analyses further indicate that GCMs tend to underestimate consecutive wet days and underestimate the occurrence of temporally organized extreme events, especially in coastal and mountainous regions such as the Alps and the Mediterranean [6].
Model resolution is a key factor affecting performance. Coarse-resolution GCMs often fail to capture convective systems and underestimate storm duration in central Europe [7], whereas high-resolution simulations better reproduce storm structure, spatial organization, and clustered heavy precipitation [8]. Nevertheless, most work has concentrated on traditional intensity- or frequency-based indices (e.g., annual maxima, percentile thresholds), while the temporal order of extremes has been evaluated only sparsely [9]. A notable example is an early evaluation of CMIP GCMs, which showed clear regional dependence and large inter-model spread in simulating clustering behavior and emphasized that temporal structure may be more challenging than intensity alone [10]. Observational uncertainty also contributes to model–data discrepancies. Continental-scale gridded datasets such as E-OBS provide long records but can smooth local heavy rainfall due to sparse station density in several European regions, particularly southeastern Europe, limiting their ability to represent short-range variability and cluster metrics derived from daily fields [11,12]. Moreover, existing studies often focus on individual countries or limited time spans, making it difficult to form consistent conclusions at the pan-European scale. Only a few studies have systematically assessed clustering in GCMs across Europe. One key contribution evaluated the ability of GCMs to capture temporal clustering of heavy precipitation and found substantial underestimation of cluster persistence and large spatial variability in model performance [13]. However, this assessment was limited to a smaller model ensemble and lacked detailed analysis at climate-zone scales. There is still a need for systematic evaluation using the full CMIP6 dataset and consistent cluster metrics.
Given these limitations, this study examines how CMIP6 GCMs simulate temporal clustering of heavy precipitation across Europe. Using observational datasets as reference, we evaluate model skill in reproducing key cluster indices, including maximum consecutive wet days and mean cluster length. Spatial patterns, inter-model variability, and performance differences among major European climate zones are also assessed. By shifting the focus from isolated extreme events to their temporal structure, this work provides a more realistic perspective on GCM capability for compounding precipitation hazards. The results highlight remaining challenges in simulating organized storm systems and underscore the need for improved representation of convection, with implications for future flood-risk projections and adaptation planning.
2. Materials and Methods
2.1. Study Region and Data Sample
The study area covered the European continent, ranging from 35°N to 70°N and 10°W to 30°E. Daily precipitation data from 1981 to 2020 were collected. Observations were based on the E-OBS v25.0e gridded dataset at 0.1° resolution, supported by more than 2,000 ground stations. For model evaluation, ten global climate models (GCMs) from CMIP6 were selected, each downscaled to the same spatial grid. Heavy precipitation was defined as daily rainfall exceeding the 95th percentile at each grid cell, which produced more than 12,000 extreme events for analysis.
2.2. Experimental Framework and Control Groups
The evaluation framework used GCM simulations as the experimental groups and the E-OBS dataset as the control. Both were processed under the same thresholds and clustering definitions to ensure comparability. The analysis was structured across three spatial domains: northern Europe, central Europe, and southern Europe. This design tested whether models captured differences between maritime, continental, and Mediterranean climates. Temporal clustering was quantified for both observed and simulated series to compare their consistency.
2.3. Measurement Techniques and Data Quality Control
Observed data were checked for completeness before use. Records with more than 5% missing values were excluded. Short gaps were filled using linear interpolation, and suspicious outliers were flagged when exceeding four standard deviations from the local mean. To align with model data, all observations were aggregated to a daily scale. The GCM outputs were interpolated to the same grid using conservative remapping. These procedures reduced inconsistencies and minimized potential bias in comparisons.
2.4. Data Processing and Statistical Formulations
The temporal clustering of heavy precipitation was assessed by grouping consecutive days above the percentile threshold. Two indices were calculated: the mean cluster length (MCL) and the maximum consecutive wet days (CWD). For model–observation comparisons, a regression approach was used [14]:
where and are the observed and modeled mean cluster lengths, and is the residual. Model skill was also evaluated using the Nash–Sutcliffe Efficiency (NSE) [15]:
where and are observed and modeled values, and is the mean of observations.
2.5. Statistical Testing and Analysis Tools
Statistical differences between modeled and observed indices were tested using paired t-tests at the 95% confidence level. Robustness was examined through bootstrap resampling with 1,000 iterations. In addition, spatial variations in clustering metrics were summarized by regional averages and standard deviations. All analyses were conducted using R version 4.3.1 and Python 3.11, ensuring reproducibility of results.
3. Results and Discussion
3.1. Overall Performance and Temporal Consistency
Across European regions, the models reproduced broad patterns of extreme precipitation but underestimated the persistence of clustered events. In maritime and northern Europe, correlations between observed and simulated mean cluster length reached 0.55–0.65, with mean absolute error close to 1 day. In Mediterranean and Alpine areas, the underestimation was stronger, with modeled sequences shorter by 15–30 %. This indicates that while the models capture the spatial occurrence of extremes, they often split multi-day events into shorter segments [16]. Figure 1 illustrates this behavior through a Taylor-diagram comparison of modeled and observed precipitation statistics.
3.2. Sensitivity to Threshold and Event Definition
Changing the definition of clustering had a marked effect on results. Using a higher threshold (99th percentile instead of 95th) reduced the number of clusters by about one-third and increased average cluster length by ~0.5 days. Adjusting the linking window from two days to one day shortened clusters by 0.4–0.6 days, particularly in coastal regions. These shifts show that the choice of thresholds and linking rules strongly influences clustering outcomes. Similar sensitivities were also reported in regional studies of precipitation persistence, underlining the need for standardized definitions when comparing models [17,18].
3.3. Spatial Patterns and Regional Transferability
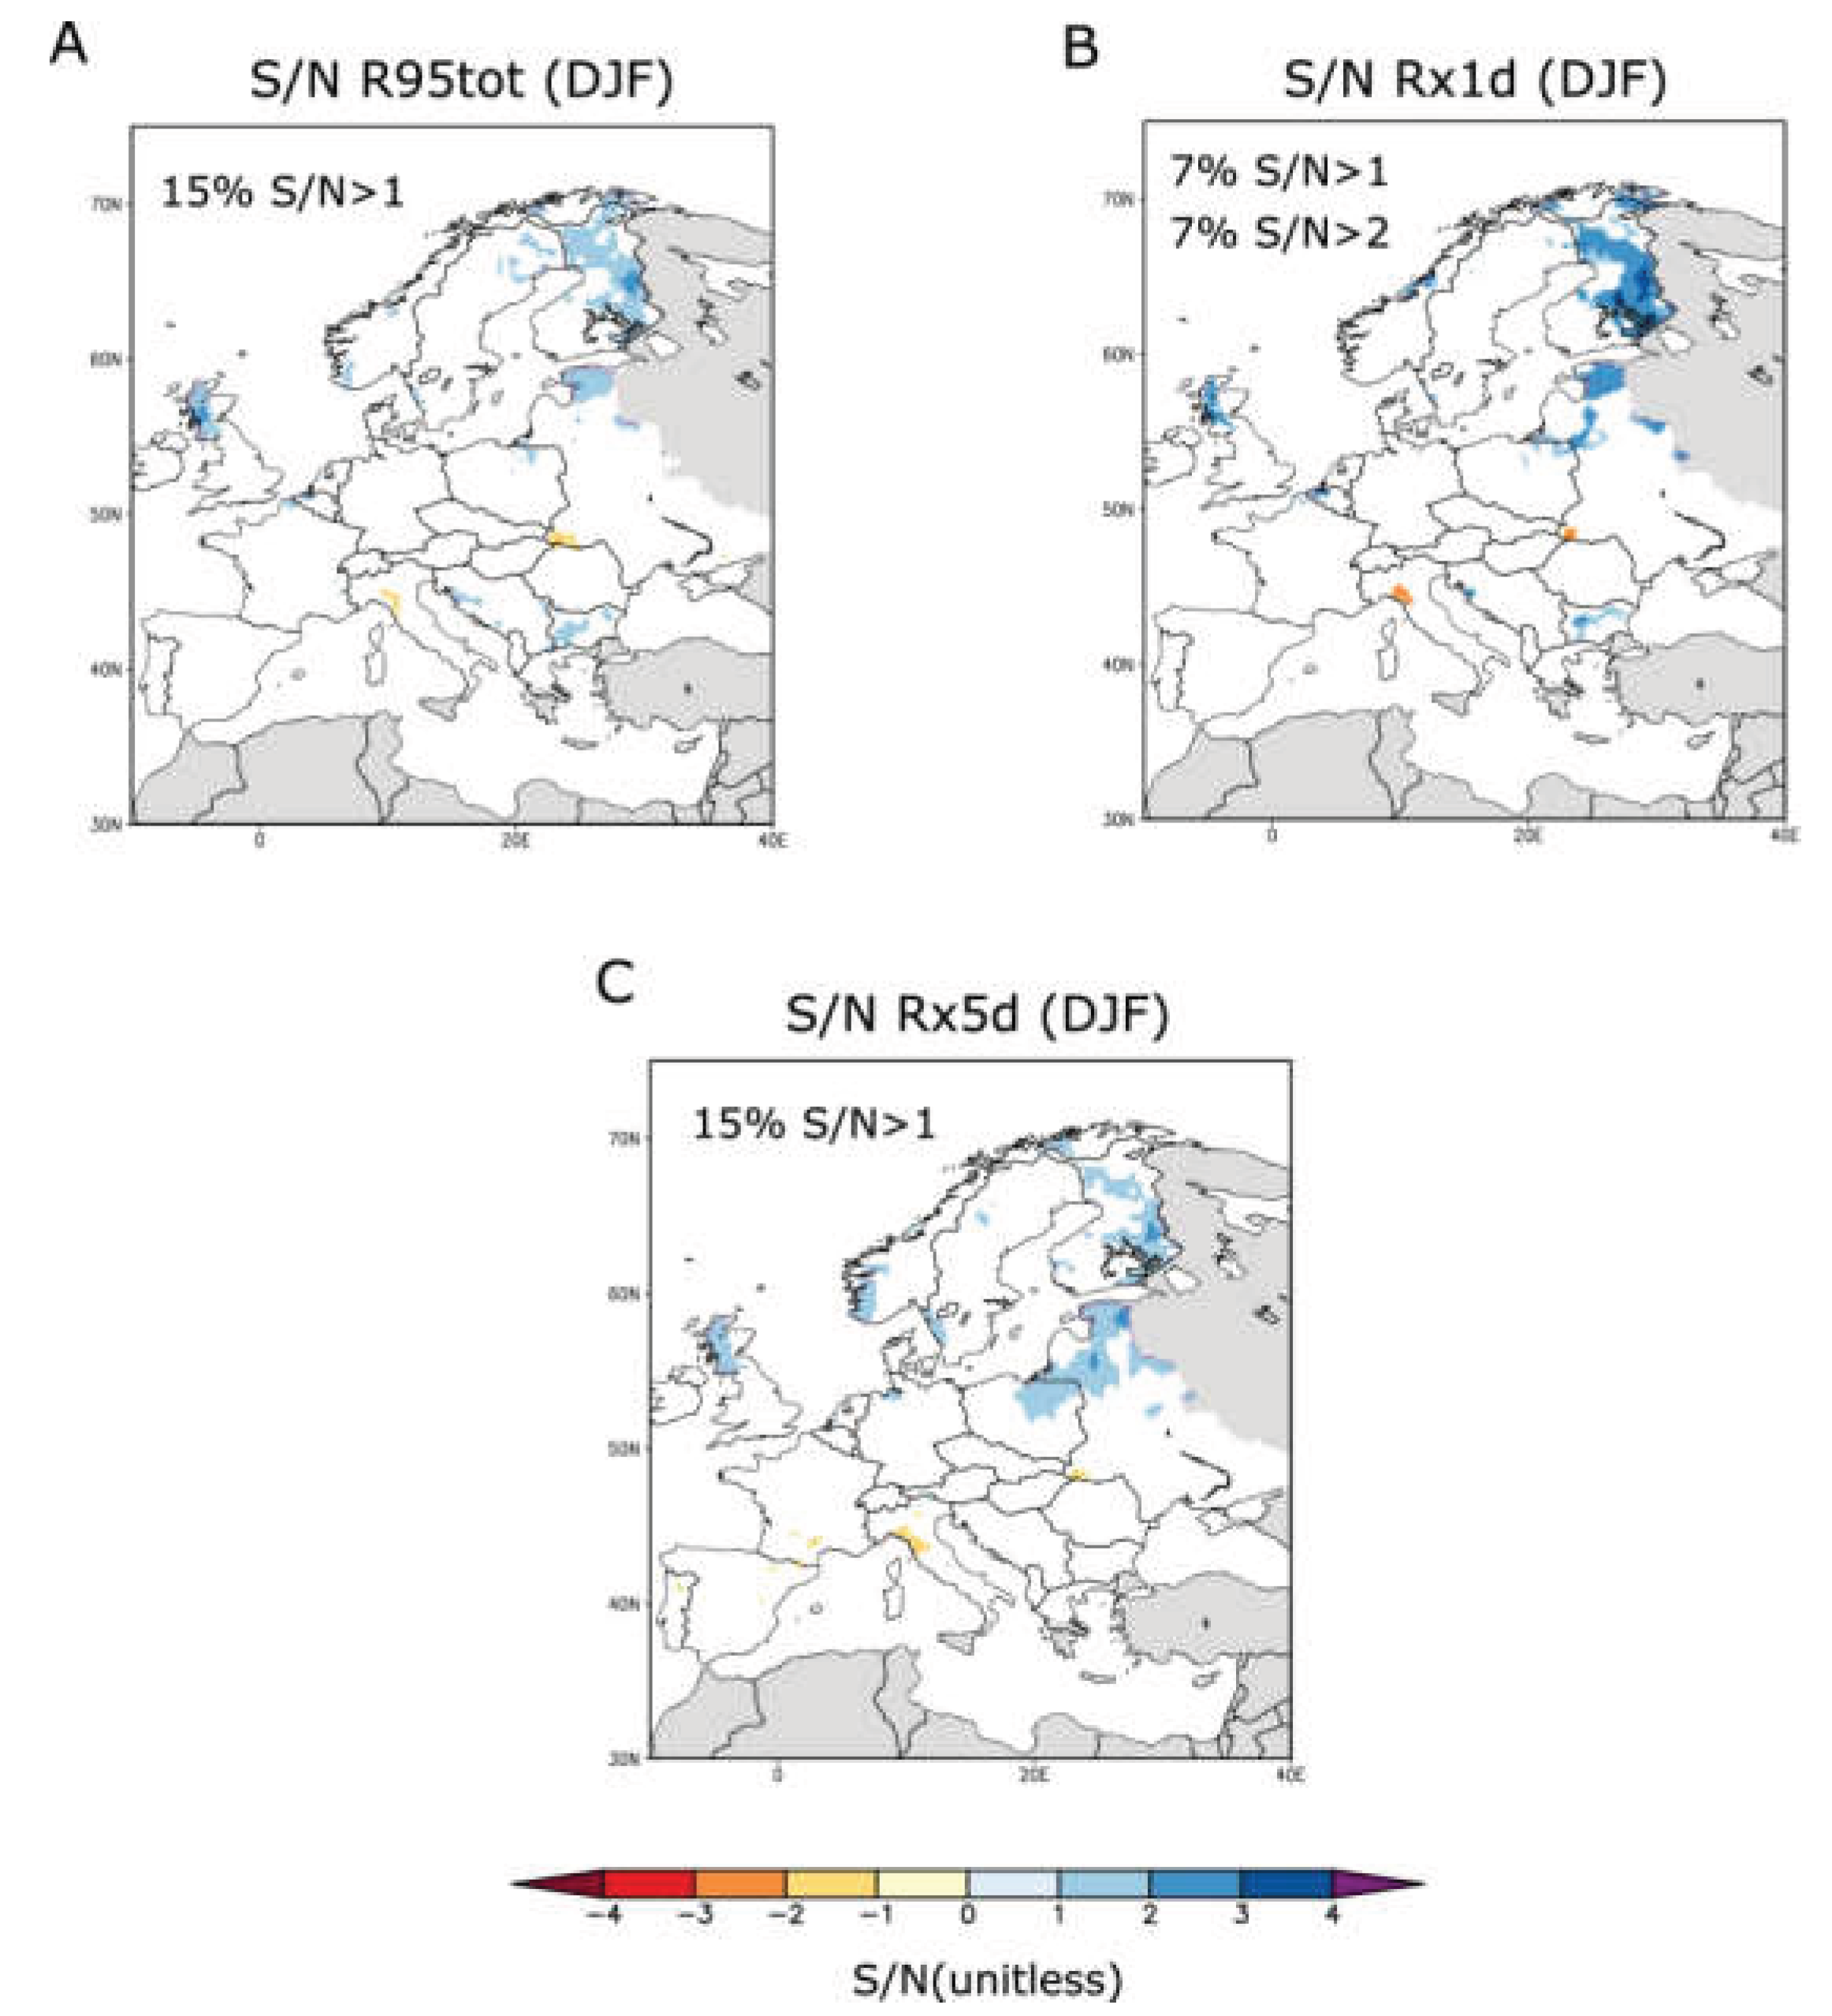
Bias patterns were not uniform across Europe. Over Atlantic and North Sea regions, clustering differences stayed within ±10 %, but in southern and mountainous areas, underestimation exceeded 20 %. Models calibrated for maritime climates lost accuracy when applied to Mediterranean basins, suggesting that storm dynamics and terrain play a key role in clustering skill. Figure 2 shows spatial distributions of maximum consecutive wet days for one representative model, highlighting underestimation in southern Europe and some overestimation in northern coastal areas [19,20].
3.4. Comparison with Existing Work and Study Limitations
Our findings are consistent with earlier analyses showing that climate models often reproduce total rainfall and single-day extremes more reliably than multi-day persistence. Barton et al. (2022) also reported underestimation of cluster duration in European datasets, while Tuel et al. (2022) emphasized that clustered events have stronger hydrological consequences than isolated ones. The present work adds to this by showing how sensitivity to thresholds and regional transfer explains part of the model spread. Limitations include reliance on gridded observations that may smooth local extremes, the evaluation of only a subset of global models, and the unresolved nature of convection in coarse model grids. Future research should include convection-permitting models, denser observational networks, and more consistent cluster metrics.
4. Conclusions
The evaluation of European climate models shows that they reproduce the general occurrence of extreme precipitation but underestimate the persistence of multi-day clusters, especially in Mediterranean and Alpine regions. Using standardized clustering metrics and sensitivity tests on event definitions, this study finds that the way clusters are defined has a strong impact on model performance and explains part of the differences between models. The focus on temporal clustering rather than single events underlines its importance for flood risk assessment and hydrological impacts. The results suggest that models need better representation of persistence and transition probabilities, particularly for convective and orographic processes. The study is limited by the coarse resolution of gridded observations and the restricted number of models evaluated, but it provides a useful basis for assessing clustering skill across different European climates. Future work should include convection-permitting simulations, denser observational networks, and harmonized clustering definitions to improve the reliability of projections and to support flood risk management under climate change.
References
- Nissen, K. M., & Ulbrich, U. (2017). Increasing frequencies and changing characteristics of heavy precipitation events threatening infrastructure in Europe under climate change. Natural Hazards and Earth System Sciences, 17(7), 1177-1190.
- Saco, P. M. , McDonough, K. R., Rodriguez, J. F., Rivera-Zayas, J., & Sandi, S. G. (2021). The role of soils in the regulation of hazards and extreme events. Philosophical Transactions of the Royal Society B, 376(1834), 20200178.Sun, X., Meng, K., Wang, W., & Wang, Q. (2025, March). Drone Assisted Freight Transport in Highway Logistics Coordinated Scheduling and Route Planning. In 2025 4th International Symposium on Computer Applications and Information Technology (ISCAIT) (pp. 1254-1257). IEEE.
- Wang, Y. , Shen, M., Wang, L., Wen, Y., & Cai, H. (2024). Comparative Modulation of Immune Responses and Inflammation by n-6 and n-3 Polyunsaturated Fatty Acids in Oxylipin-Mediated Pathways.
- Whitmore, J., Mehra, P., Yang, J., & Linford, E. (2025). Privacy Preserving Risk Modeling Across Financial Institutions via Federated Learning with Adaptive Optimization. Frontiers in Artificial Intelligence Research, 2(1), 35-43.
- Frei, C., Davies, H. C., Gurtz, J., & Schär, C. (2000). Climate dynamics and extreme precipitation and flood events in Central Europe. Integrated Assessment, 1(4), 281-300. 4).
- Müller, S. K. , Pichelli, E., Coppola, E., Berthou, S., Brienen, S., Caillaud, C.,... & de Vries, H. (2024). The climate change response of alpine-mediterranean heavy precipitation events. Climate Dynamics, 62(1), 165-186.
- Demory, M. E. , Berthou, S., Fernández, J., Sørland, S. L., Brogli, R., Roberts, M. J.,... & Vautard, R. (2020). European daily precipitation according to EURO-CORDEX regional climate models (RCMs) and high-resolution global climate models (GCMs) from the High-Resolution Model Intercomparison Project (HighResMIP). Geoscientific Model Development, 13(11), 5485-5506.
- Zick, S. E. (2020). Quantifying extreme precipitation forecasting skill in high-resolution models using spatial patterns: A case study of the 2016 and 2018 Ellicott City floods. Atmosphere, 11(2), 136.
- Schär, C., Ban, N., Fischer, E. M., Rajczak, J., Schmidli, J., Frei, C., ... & Zwiers, F. W. (2016). Percentile indices for assessing changes in heavy precipitation events. Climatic Change, 137(1), 201-216.
- Kumar, D., Kodra, E., & Ganguly, A. R. (2014). Regional and seasonal intercomparison of CMIP3 and CMIP5 climate model ensembles for temperature and precipitation. Climate dynamics, 43(9), 2491-2518.
- Prein, A. F., & Gobiet, A. (2017). Impacts of uncertainties in European gridded precipitation observations on regional climate analysis. International Journal of Climatology, 37(1), 305-327.
- Gudmundsson, L. , & Seneviratne, S. I. (2016). Observation-based gridded runoff estimates for Europe (E-RUN version 1.1). Earth System Science Data, 8(2), 279-295.
- Yang, Z. , DeFlorio, M. J., Sengupta, A., Wang, J., Castellano, C. M., Gershunov, A.,... & Ralph, F. M. (2024). Seasonality and climate modes influence the temporal clustering of unique atmospheric rivers in the Western US. Communications Earth & Environment, 5(1), 734.
- Wang, C., & Chakrapani, V. (2023). Environmental Factors Controlling the Electronic Properties and Oxidative Activities of Birnessite Minerals. ACS Earth and Space Chemistry, 7(4), 774-787.
- Al Shafian, S. , He, C., & Hu, D. (2025). DamageScope: An Integrated Pipeline for Building Damage Segmentation, Geospatial Mapping, and Interactive Web-Based Visualization. Remote Sensing, 17(13), 2267.
- Tye, M. R. , Blenkinsop, S., Fowler, H. J., Stephenson, D. B., & Kilsby, C. G. (2016). Simulating multimodal seasonality in extreme daily precipitation occurrence. Journal of Hydrology, 537, 117-129.
- Xu, K., Lu, Y., Hou, S., Liu, K., Du, Y., Huang, M., ... & Sun, X. (2024). Detecting anomalous anatomic regions in spatial transcriptomics with STANDS. Nature Communications, 15(1), 8223.
- Schaller, N. , Mahlstein, I., Cermak, J., & Knutti, R. (2011). Analyzing precipitation projections: A comparison of different approaches to climate model evaluation. Journal of Geophysical Research: Atmospheres, 116(D10).
- Tsimplis, M. N. , Woolf, D. K., Osborn, T. J., Wakelin, S., Wolf, J., Flather, R.,... & Jevrejeva, S. (2005). Towards a vulnerability assessment of the UK and northern European coasts: the role of regional climate variability. Philosophical Transactions of the Royal Society A: Mathematical, Physical and Engineering Sciences, 363(1831), 1329-1358.
- Cid, A. , Castanedo, S., Abascal, A. J., Menéndez, M., & Medina, R. (2014). A high resolution hindcast of the meteorological sea level component for Southern Europe: the GOS dataset. Climate dynamics, 43(7), 2167-2184.
Figure 1.
Taylor diagram comparing modeled and observed precipitation clustering over the Czech Republic.
Figure 1.
Taylor diagram comparing modeled and observed precipitation clustering over the Czech Republic.
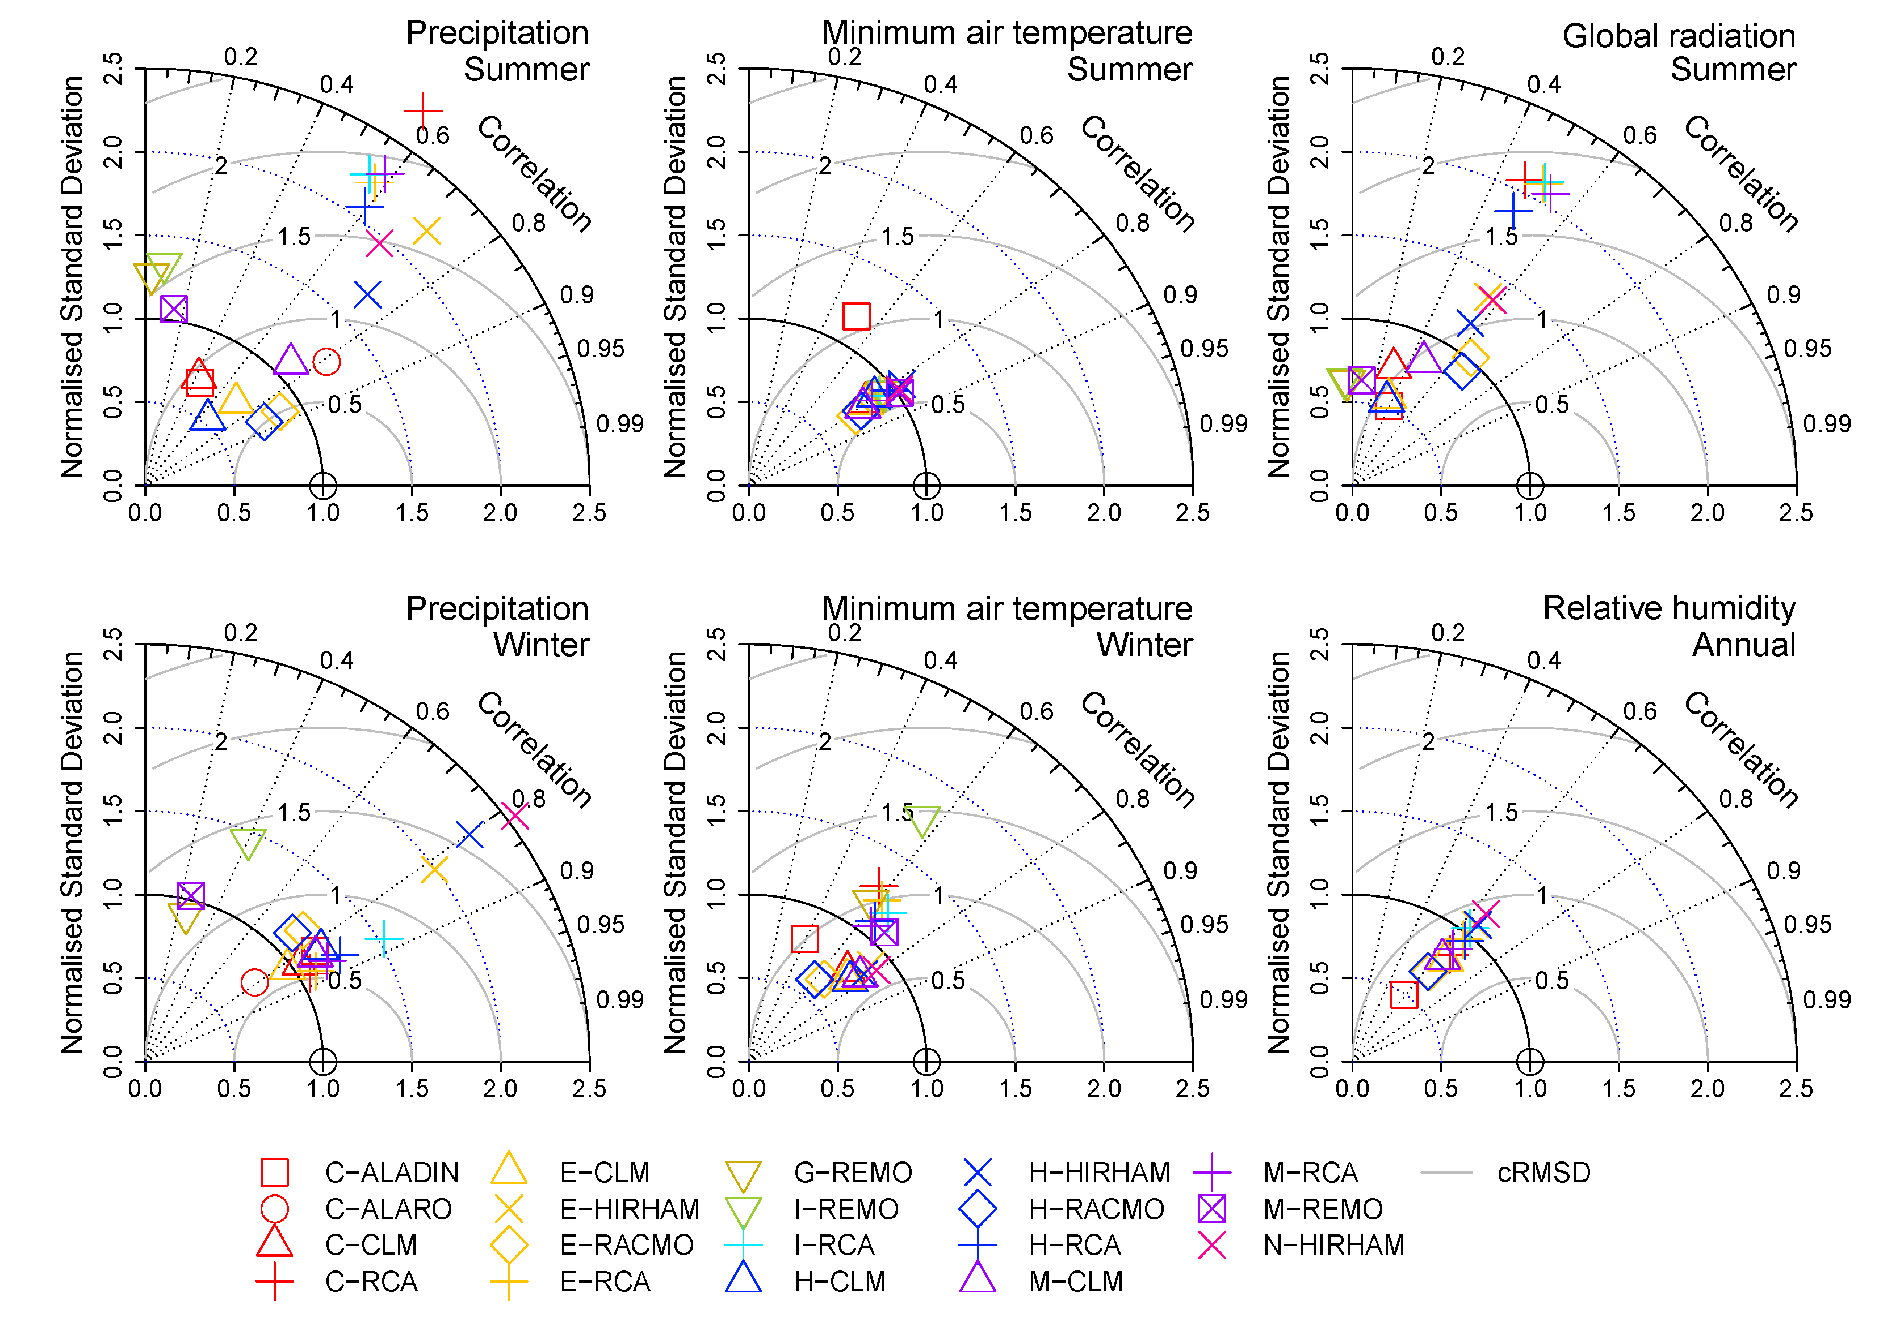
Figure 2.
Map of winter signal-to-noise ratios for extreme precipitation indices across Europe.
Disclaimer/Publisher’s Note: The statements, opinions and data contained in all publications are solely those of the individual author(s) and contributor(s) and not of MDPI and/or the editor(s). MDPI and/or the editor(s) disclaim responsibility for any injury to people or property resulting from any ideas, methods, instructions or products referred to in the content. |
© 2025 by the authors. Licensee MDPI, Basel, Switzerland. This article is an open access article distributed under the terms and conditions of the Creative Commons Attribution (CC BY) license (http://creativecommons.org/licenses/by/4.0/).
Copyright: This open access article is published under a Creative Commons CC BY 4.0 license, which permit the free download, distribution, and reuse, provided that the author and preprint are cited in any reuse.


