
Submitted:
24 November 2025
Posted:
25 November 2025
You are already at the latest version
Abstract
Background Stage B heart failure (SBHF) increases the risk of symptomatic HF. Current guideline criteria for SBHF lack sex and ethnic thresholding and cardiac magnetic resonance (CMR) imaging cut-offs. We aimed to assess the prevalence of SBHF in a large cohort of people with T2D and healthy controls, and propose a refined CMR definition for SBHF.
Methods Sex and ethnic specific thresholds for imaging criteria were derived from 373 healthy controls, who underwent CMR cine imaging. The current definition for SBHF and refined criteria were applied to our prospectively recruited and intensively phenotyped cohort of asymptomatic people with T2D and no evidence of cardiovascular disease. The prevalence of SBHF by different definitions was calculated and patient characteristics, including exercise capacity, were compared between those classified as Stage A vs. B HF. Finally, the refined criteria were also applied to two historical cohorts with symptomatic cardiovascular disease: severe aortic stenosis (AS n=70) and HF with preserved Ejection Fraction (HFpEF n=136).
Results A total of 423 people with T2D and a subset of 102 healthy controls who underwent echocardiography were prospectively recruited. Current guideline criteria classified 91% of those with T2D and 69% of the healthy controls as SBHF, suggesting a lack of specificity. Applying derived sex and ethnicity specific thresholds, combining echo and CMR measures, the prevalence of SBHF was reduced to 30% in those with T2D. Those with Stage B HF in the refined definition had lower exercise capacity than those with Stage A HF (percentage predicted maximal oxygen consumption 81 ± 16% vs 91 ± 20%, p< 0.001). Applying the refined definition to symptomatic AS and HFpEF participants classified 89% and 85% with abnormal cardiac remodelling.
Conclusion Current guideline criteria for SBHF are non-specific and likely of limited value in clinical practice. Refining these criteria with sex- and ethnic-specific thresholds may improve identification of those at risk of developing symptomatic disease. Further research is required to validate these criteria.
Keywords:
type 2 diabetes
; stage B heart failure
; sex and ethnicity stratified thresholds
1. Background
Heart failure (HF) is a global health challenge associated with substantial individual suffering and socioeconomic burden, with prevalence expected to rise.[1] UK national data has reported 80% of people with HF are diagnosed in hospital,[2] which confers a poorer prognosis than those diagnosed in primary care.[3] Therefore, it is imperative that patients at highest risk of symptomatic HF are identified early, to implement preventative therapies, reduce the subsequent risk of HF and improve prognosis. The American College of Cardiology (ACC)/American Heart Association (AHA)/Heart Failure Society of America (HFSA) have proposed a four-stage classification system for HF, ranging from those at risk of HF due to existing conditions such as type 2 diabetes (T2D) up to those with severe, symptomatic and refractory disease, stages A to D.[4] Stage B heart failure (SBHF) refers to patients who remain asymptomatic yet have evidence of cardiovascular structural and functional abnormalities,[4] and is associated with elevated risk of progressing to symptomatic HF.[5] The Olmsted County heart function study reported 20% of the 826 participants with subclinical disease, stage A or B HF, progressed in HF stage over four years.[6] However, imperatively 39% of those with SBHF at baseline regressed during the study period,[6] underpinning the potential benefits of early diagnosis.
Among people with T2D, HF is the leading cause of hospitalisation[7] and when all other risk factors are controlled the risk of HF in T2D persists.[8] Exercise capacity is a powerful prognostic marker of incident and advancing HF,[9,10] and has consistently been shown to be reduced in people with T2D who have no known cardiovascular disease.[11,12] To date the true prevalence of SBHF in T2D remains unknown, although previous work, employing different definitions, has reported a prevalence of subclinical disease between 48-58% in asymptomatic diabetes cohorts.(13-15) A single, unified definition for SBHF is required to allow us to identify those at elevated risk of overt HF, quantify prevalence, assess response to interventions and allow comparisons between studies. The most recent ACC/AHA/HFSA guidelines on the management of HF give suggested criteria and thresholds to diagnose SBHF. These criteria are based on brain natriuretic peptides (BNP or NT-proBNP) and echocardiography, the first line imaging modality. No criteria are proposed for cardiac magnetic resonance imaging (CMR), despite this being the gold standard non-invasive technique for quantification of cardiac volumes, mass, function and tissue characterisation.[16] Furthermore, SBHF criteria are not sex or ethnic specific despite known differences in cardiac geometry and function, which may lead to reduced sensitivity and/or specificity.[17]
The aims of this study were to; 1) assess the prevalence of SBHF using echocardiographic criteria in T2D and healthy controls, 2) refine the definition to include CMR measures, with sex and ethnic thresholding anddetermine the relationship of SBHF, as classified by each definition, with aerobic exercise capacity, and 3) apply the proposed definition to a cohort of people with known symptomatic cardiovascular disease.
2. Methods
2.1. Study Design and Participants
This study included prospectively recruited participants grouped in to three categories: 1) asymptomatic people with T2D, 2) healthy controls and 3) participants with known cardiovascular disease (severe, symptomatic aortic stenosis (AS) or heart failure with preserved ejection fraction (HFpEF)) (Figure 1).
Participants with asymptomatic T2D were recruited from two studies at our centre: 1) a prospective, cross-sectional observational study the “Prevalence and Determinants of Subclinical Cardiovascular Dysfunction in Adults With Type 2 Diabetes Mellitus (PREDICT)” (NCT03132129) and 2) the baseline data from a blinded end-point randomised controlled trial “Diabetes Interventional Assessment of Slimming or Training to Lessen Inconspicuous Cardiovascular Dysfunction (DIASTOLIC)” (NCT02590822). Participants with T2D were aged 18-75 years with a clinical diagnosis of T2D without signs or symptoms of cardiovascular disease. Exclusion criteria have been published previously.[18]
The healthy control group were pooled from several studies using CMR cine imaging, and had no symptoms or evidence of cardiovascular disease, hypertension, diabetes or obesity.(17-23) A subset of this cohort also underwent serum natriuretic peptides, echocardiography and cardiopulmonary exercise testing (CPET).
Finally, 2 cohorts of patients who demonstrate cardiac remodelling, typically with preserved ejection fraction: severe, symptomatic AS[19,24] and HFpEF.[20] The AS cohort were 18-85 years with severe, isolated aortic valve disease; participants who had previous valve surgery or who were unable to exercise were excluded. The HFpEF cohort were aged >18 years, with radiological or clinical evidence of HF and an LV ejection fraction (EF) >50%; participants with an alternative cardiac diagnosis (recent myocardial infarction, severe valve disease, cardiomyopathy, constrictive pericarditis), severe lung disease or a non-cardiovascular life expectancy of <6 months were excluded.
All studies were conducted in accordance with the declaration of Helsinki and good clinical practice. Ethical approval was provided by the UK Health Research Authority Research Ethics Committee for each study and all participants provided written informed consent.
2.2. Assessments
Demographics, medical history, anthropometric measurements and serum for HbA1c, kidney function and natriuretic peptides were taken and analysed according to standard operating procedures in accredited University Hospitals of Leicester National Health Service Trust laboratories.
Cardiovascular Magnetic Resonance (CMR)
A comprehensive CMR scan was performed on a 1.5- or 3-Tesla scanner (Siemens Skyra, Vida or Aera scanner, Erlangen, Germany) using a standardised protocol. In brief, following cardiac localisers, standard balanced steady-state free precession cine images in 4-, 3- and 2-chamber long-axis positions and short-axis slices, covering the whole left ventricle (LV), were taken.[25] Following the administration of a gadolinium-based contrast agent (0.15 mmol/kg Gadoteric acid, Dotarem, Guerbet, France), long and short axis late gadolinium enhancement (LGE) images were acquired using segmented phase-sensitive inversion recovery, free-breathing motion corrected LGE techniques[26] or single shot acquisitions, optimising individual participant image quality.
Echocardiography
Transthoracic echocardiography was performed by one of two accredited operators, using an iE33b system with an S5-1 transducer (Philips Medical Systems, Best, Netherlands) or vivid E95 system with an 4Vc-D probe (GE Healthcare, Chicago, Illinois). Images were acquired and reported as per the American Society of Echocardiography guidelines[27,28] and sonographers achieved excellent interobserver correlation.
Cardiopulmonary Exercise Testing (CPET)
Exercise capacity was assessed in a temperature-controlled room using an incremental symptom-limited CPET (CASE Exercise Testing System, GE HealthCare) with a bicycle ergometer (eBike Comfort, GE HealthCare). Calibration was performed prior to each assessment. A one-minute ramp protocol was used with workload increments calculated based on participant age, sex, weight and height.[29] Gas analysis was performed using a Ganshorn Powercube and appropriate post processing software (Ganshorn LF8) using a 30-second rolling mean of breath-by-breath data. Percentage predicted workload and maximal aerobic exercise capacity (peak VO2) were calculated using Wasserman-Hansen equations.[30,31]
Image analysis
All CMR images were batch-analysed offline in a single-centre by blinded observers (ACC, JY, KP and GSG) who completed interobserver assessment and evaluation by an expert reader (GPM), using cvi42 5.10 (Circle Cardiovascular Imaging, Calgary, Canada). Image quality was assessed prior to data analysis. Cardiac volumes were assessed in a semi-automated manner with manual correction as required; trabeculations and papillary muscles were included in the LV chamber volume, and excluded from LV mass. Tissue tracking was used to quantify LV myocardial strain by contouring the endocardial and epicardial borders in the short- and long-axis cine images at end-diastole, presented as absolute values. LGE sequences were analysed qualitatively by an expert reader (GPM).
Echocardiography measurements were recorded if image quality enabled accurate quantification. If Simpson’s biplane LV EF was not quantifiable a visual range was provided, with the median value of the range used for threshold application. Global longitudinal strain was measured using speckle tracking, analysis was semi-automated with manual correction, following the myocardium throughout the cardiac cycle (Philips Xcelera Qlab 9.0).
2.3. Statistical Analysis
Data distribution was visually assessed using histograms and Q-Q plots. Continuous data were presented as mean (± standard deviation) where normally distributed, or median (25th to 75th percentile) as appropriate. Categorical variables were presented as count (percentage). Key clinical characteristics were described by diabetes status and imaging parameters were indexed to height.
To determine if the clinical characteristics differed by HF definition, comparisons between those classified as stages A and B HF were made using independent T-test or Mann-Whitney U test as appropriate and Chi-squared test for categorical variables. The relative difference in each criterion between stage A and B HF for each definition were calculated (relative difference = (stage B mean - stage A mean)/stage A mean). Finally, predicted exercise capacity was compared between stage A and B HF by each definition, with adjustment for smoking status using analysis of covariance.
Statistical analysis was performed using StataCorp. 2023. Stata 18 Statistical Software. College Station, TX: StataCorp LLC.[32].
Derivation of SBHF thresholds
The sex and ethnic thresholds for CMR were derived from the combined healthy control cohort. The cohort was split by sex and ethnicity giving rise to four groups (white males, non-white males, white females and non-white females). Each group had a sample size of greater than n=40, the smallest sample size permitting the calculation of reference ranges using a parametric method for data with a Gaussian distribution[33]. For each quantitative CMR parameter the threshold for abnormal was calculated as the mean plus or minus twice the standard deviation per group, depending on the direction of ‘disease’. The thresholds for echocardiographic parameters were guideline driven.(4, 27, 28)
Refining the definition of Stage B HF
Three definitions were applied to the cohort.
Definition 1: Current ACC/AHA/HFSA guideline for classification of SBHF[4]. Utilises echocardiography and serum natriuretic peptide levels (Appendix table 1). Briefly, these criteria include four domains covering: cardiac morphology, LV systolic dysfunction, LV diastolic dysfunction and brain natriuretic peptide; a total of 12 components. To classify as SBHF an individual must satisfy a single criterion across any domain. In this study estimated pulmonary artery systolic pressure was not collected therefore 11 components were included.
Definition 2: Current ACC/AHA/HFSA guideline criteria but required to satisfy ≥2 criterion.
Definition 3: Echocardiography measures for systolic function and cardiac remodelling were replaced with CMR criteria (Figure 2), with the inclusion of sex and ethnic thresholds (Figure 3). Exploiting the advantages of CMR for tissue characterisation, late gadolinium enhancement was included to identify patients with focal fibrosis. In this definition values were indexed to height, rather than body surface area, which underestimates the prevalence of LV hypertrophy in obesity. For the classification of SBHF an individual was required to meet at least two criteria, with the caveat of HF with reduced EF ≤40% considered SBHF. To counter that more than one parameter was linked to measures of systolic function and LV hypertrophy an ‘or’ function was applied to these parameters. Finally, the highly non-specific e’ was excluded and the current evidence-base was reviewed to confirm the association of final components to symptomatic HF.
Definitions 1 and 2 were applied to the asymptomatic T2D and the sub-set of healthy controls who had echocardiography. Definition 3 (including CMR criteria) was applied to the asymptomatic T2D and symptomatic cardiovascular disease groups, it was not applied to the healthy controls given they were included in the derivation cohort for sex and ethnic thresholding.
3. Results
3.1. Study Cohorts
Clinical characteristics of the subset of healthy controls who had echocardiography (n=102), the asymptomatic T2D (n=423), severe, symptomatic AS (n=70) and HFpEF (n=136) cohorts are provided in Table 1. Half of the HFpEF cohort and 29% of the severe, symptomatic AS cohort also had diabetes.
In the pooled healthy control group (n=373) for thresholding CMR criteria with sex and ethnic stratification; the smallest group was non-white females, then non-white males, followed by white females, with the largest group being white males (n=58, 91, 95 and 129, respectively). The cohort were middle-aged (57 ± 10 years). Anthropometric measures included: BMI 24.6 ± 2.7kg/m2, systolic blood pressure (BP) 125 ± 14mmHg and heart rate 66 ± 10bpm.
3.2. Prevalence of Stage B Heart Failure by Definition
Definition 1 classified 91% (n=386) of asymptomatic T2D and 69% (n=70/102) of healthy controls with SBHF (Figure 4). In particular, high proportions of septal e’, lateral e’ and relative wall thickness were classed as abnormal in both cohorts (Appendix table 2).
Definition 2 reduced the number classified as SBHF in both T2D and healthy control cohorts (76% (n=322) and 48% (n=49), respectively).
Definition 3 classified 30% (n=128) of asymptomatic T2D with SBHF, 89% (n=62) of severe, symptomatic AS and 85% (n=116) of HFpEF as having abnormal cardiac remodelling.
3.3. Comparison of Characteristics Between Stage A and B Heart Failure in the Type 2 Diabetes Cohort
Applying definitions 1 and 2, those classified as SBHF were more likely to be older adults, whereas the SBHF group using the CMR approach (definition 3) were significantly younger. Sex and glycosylated haemoglobin did not differ between stages A and B HF across definitions. BMI and systolic BP were higher in SBHF for all definitions. Those classified as SBHF using Definition 3 were more likely to have a history of smoking and be of non-white ethnicity (Table 2).
Applying definition 1, percentage predicted workload was significantly greater in the SBHF group, compared to the group classified as stage A HF (p=0.015), there was no difference in percentage predicted peak VO2 (Table 2). Applying definition 2, exercise capacity parameters did not differ between stage A and B HF. Finally, applying definition 3 showed significantly lower exercise capacity in the SBHF group. Percentage predicted workload and percentage predicted peak VO2 (exercise metrics that account for age, sex, height and weight), were both lower in the SBHF group, independent of smoking status (p<0.001 for both).
The relative difference between stage B vs. stage A HF for each criterion by definition are provided in Appendix table 3. For each definition, where a relative difference was observed between stage A and B HF for a given criterion it was almost exclusively in the direction of ‘disease’. For mass and volumes, the relative difference was greatest between stage A and B HF when applying definition 3 (indexed values for left atrial volume (relative difference using definition 1, definition 2, definition 3; 0.08, 0.00, 0.47), LV end-diastolic volume (0.06, 0.00, 0.33) and LV mass (0.09, 0.07, 0.32)).
4. Discussion
In this prospective cohort study over 90% of asymptomatic participants with T2D were classified as having SBHF by the current ACC/AHA/HFSA guideline criteria; however, when the same criteria were applied to our cohort of asymptomatic healthy volunteers, without risk factors for cardiovascular disease, over two thirds were also classified as SBHF. These findings suggest the current proposed criteria for defining SBHF are non-specific and likely to be of little value if used in routine clinical practice. Indeed, our findings suggest that a large proportion of people would be incorrectly assigned to SBHF and may undergo unnecessary investigations and treatment. Due to a lack of longitudinal data, the definition was applied to our cohorts with established cardiovascular disease where it correctly classified 89% of people with severe, symptomatic AS and 85% of those with HFpEF as having abnormal cardiac remodelling.
Previous criteria applied in research to identify SBHF has been heterogenous (Appendix table 4).[13,14,15,34] The only universal similarity between criteria that have been applied is the inclusion of a measure of LV hypertrophy, although thresholds differ between publications. In addition, there is a theme of combining measures that assess systolic and diastolic dysfunction alongside structural changes. Only one previous publication included raised biomarkers as part of the criteria to diagnose SBHF,[34] despite the known association of raised natriuretic peptides to incident HF in disease-free individuals.[35] In addition, all previous attempts to identify SBHF have exclusively used echocardiography for imaging parameters, rather than the non-invasive reference standard for quantification of cardiac volumes and ejection fraction, CMR imaging.[16]
Moreover, the thresholds used to delineate abnormal measurements in previous studies are diverse and frequently lack an appreciation of the known differences in cardiac structure between ages, sexes[36] and ethnicities[17]. This is similar to guideline criteria where just one parameter is stratified by sex; furthermore, the origin of thresholds in these criteria is not elucidated, including those values that are not commonplace in clinical practice.[4] When reviewing the CMR literature for thresholds to apply to our cohort we found data that were generally specific to a single ethnicity,[36] reported confidence intervals rather than prediction intervals,[37] demonstrated large between study heterogeneity where meta-analyses were performed[37] or included participants with hypertension, diabetes and obesity in their cohorts.[38] Therefore, the application of these cut-offs for refining the current clinical definition would have been inappropriate in this context, and appreciating sex and ethnic differences in these measurements is a foremost strength of this work. The components from the ACC/AHA/HFSA guideline criteria that were included in the revised criteria (definition 3) were selected based on their known association to incident HF,[35,39,40,41,42,43,44] HF hospitalisation[45,46] and raised filling pressures.[28]
Increasing age is associated with an increased risk of HF[35]. Whilst it is important to acknowledge this, it is also important to ensure criteria are not simply differentiating those at greatest risk based on age by utilising age-dependent measures such as e’,[28,47] which was subsequently removed from definition 3 due to the high prevalence it displayed in the cohort. Additionally, cardiac function and morphology changes with increasing age.[36] Age-specific CMR thresholds were considered in definition 3 initially, however, minimal differences were observed between the deciles in our cohort and therefore these were removed in favour of larger, more statistically robust sex and ethnic groups.
When comparing clinical characteristics between stage A and B HF across each definition, BP and BMI were consistently greater in the SBHF groups, this is not surprising given the known association of hypertension and obesity to incident HF[48]. Definition 3 shows the greatest absolute difference in BMI between stage A and B HF, and the greatest relative difference in gold-standard CMR measures of mass and volume. CMR indices were purposely indexed to height rather than body surface area, which is widely used for echocardiography, to avoid falsely normalising measurements in overweight/obese individuals and reducing the sensitivity of thresholds[49], which is particularly poignant in a cohort of people with T2D.
Although definition 3 uses components from two imaging modalities, it is the only definition to differentiate stages A and B HF by percentage predicted workload and percentage predicted peak VO2, an important prognostic marker in HF[9,10]. This finding is likely to reflect the added value of sex and ethnic thresholding, indexing to height where applicable and to the imaging accuracy of CMR, in this largely overweight and obese cohort. Furthermore, where the focus of classifying SBHF is to identify those most at risk of symptomatic disease, the difference in exercise capacity between stage A and B HF observed in definition 3, is suggestive of a greater prognostic ability of this definition.
Strengths of this work include the systematic, methodical approach, that centred around current guidance and evidence. Furthermore, the definitions were applied to a large, multi-ethnic cohort, that underwent a high degree of unified phenotyping and is representative of the local population. Sex and ethnicity are known modifiers of cardiac measurements[17,50], accounting for these demographics is essential to prevent misclassification, and builds on current guidelines where these differences are only considered for one of the 12 criteria. The components included in the refined definition are all associated with symptomatic HF and it provides a multifaceted evaluation of HF. Finally, the use of gold-standard CMR imaging provides a robust and reproducible assessment of cardiovascular structure and function.
This work is limited by its cross-sectional nature and lack of outcome data. Applying this refined definition to a cohort with incident HF outcome data would enable comprehensive external validation, and determine if its classification of SBHF correctly identifies those at increased risk of developing symptomatic disease. There is potential merit in applying the refined definition to other cohorts at risk of HF, i.e. obese or hypertensive, previous literature has not explored the prevalence of SBHF in these groups and more widespread application may provide insight into the definitions generalisability. Furthermore, whilst we derived sex- and ethnicity-specific reference ranges, we could only divide our cohort into white and non-white groups, which lacks the ethnic granularity that is important in larger more ethnically diverse cohorts.
5. Conclusion
When applying current ACC/AHA/HFSA stage B HF criteria, almost all asymptomatic people with T2D and over two thirds of healthy volunteers with no cardiovascular risk factors are classed as having stage B HF. These findings suggest that the current criteria, and particularly echocardiographic e’, are non-specific and need improvement. Refining these criteria with sex- and ethnic-specific thresholds may improve identification of those at risk of symptomatic disease, but further work is required to validate this work.
Supplementary Materials
The following supporting information can be downloaded at the website of this paper posted on Preprints.org.
Author Contributions
ACC – drafting, data acquisition and analysis; AD – data acquisition; JY – data acquisition and analysis; AM – data acquisition and analysis; MS – data acquisition and analysis; KP – analysis; JW - data acquisition; AS – data acquisition; CPN – design of the work and interpretation of data; GSG - data acquisition and analysis; GPM – analysis, design of the work, interpretation of data and critical review; EMB – design of the work, interpretation of data and critical review.
Acknowledgments and funding: AC, JLY, EMB, and GPM received funding from the National Institute for Health and Care Research (NIHR) United Kingdom through a Research Professorship award (RP-2017-08-ST2-007). AD received funding from the British Heart Foundation (BHF) through a Clinical Research Training Fellowship (FS/CRTF/20/24069). GSG is funded by the NIHR, through an Academic Clinical Lectureship. AS is funded by an NIHR advanced fellowship (NIHR300867). CPN is funded by the NIHR Leicester Biomedical Research Centre. GPM receives support from the BHF Leicester Centre of Research Excellence. All testing was performed in the NIHR Leicester Clinical Research Facility and supported by the NIHR Leicester Biomedical Research Centre.
Conflicts of interest
The authors declare no conflict of interest.
Abbreviations
| ACC | American College of Cardiology |
| AHA | American Heart Association |
| AS | Aortic stenosis |
| BMI | Body mass index |
| BP | Blood pressure |
| CMR | Cardiac magnetic resonance |
| CPET | Cardiopulmonary exercise testing |
| EF | Ejection fraction |
| eGFR | estimated glomerular filtration rate |
| HC | Healthy controls |
| HF | Heart failure |
| HFpEF | Heart failure with preserved ejection fraction |
| HFSA | Heart failure society of America |
| LGE | Late gadolinium enhancement |
| LV | Left ventricular |
| SBHF | Stage B heart failure |
| T2D | Type 2 diabetes |
References
- Savarese G, Becher PM, Lund LH, Seferovic P, Rosano GMC, Coats AJS. Global burden of heart failure: a comprehensive and updated review of epidemiology. Cardiovascular Research. 2023;118(17):3272-87. [CrossRef]
- Foundation, BH. Heart Statistics: British Heart Foundation; 2024 [Available from: https://www.bhf.org.uk/what-we-do/our-research/heart-statistics.
- Wang H, Gao C, Guignard-Duff M, Cole C, Hall C, Baruah R, et al. Inpatient versus outpatient diagnosis of heart failure across the spectrum of ejection fraction: a population cohort study. Heart. 2025;111(11):523-31. [CrossRef]
- Heidenreich PA, Bozkurt B, Aguilar D, Allen LA, Byun JJ, Colvin MM, et al. 2022 AHA/ACC/HFSA Guideline for the Management of Heart Failure: A Report of the American College of Cardiology/American Heart Association Joint Committee on Clinical Practice Guidelines. Circulation. 2022;145(18):e895-e1032.
- Wang TJ, Evans JC, Benjamin EJ, Levy D, Leroy EC, Vasan RS. Natural History of Asymptomatic Left Ventricular Systolic Dysfunction in the Community. Circulation. 2003;108(8):977-82. [CrossRef]
- Young KA, Scott CG, Rodeheffer RJ, Chen HH. Progression of Preclinical Heart Failure: A Description of Stage A and B Heart Failure in a Community Population. Circulation: Cardiovascular Quality and Outcomes. 2021;14(5).
- HSCI, C. Are diabetes services in England and Wales Measuring up? National Diabetes Audit 2011-12. In: HSCI C, editor. 2011-2012.
- Rawshani A, Rawshani A, Franzén S, Sattar N, Eliasson B, Svensson A-M, et al. Risk Factors, Mortality, and Cardiovascular Outcomes in Patients with Type 2 Diabetes. New England Journal of Medicine. 2018;379(7):633-44. [CrossRef]
- Khan H, Kunutsor S, Rauramaa R, Savonen K, Kalogeropoulos AP, Georgiopoulou VV, et al. Cardiorespiratory fitness and risk of heart failure: a population-based follow-up study. European Journal of Heart Failure. 2014;16(2):180-8.
- Sarullo FM, Fazio G, Brusca I, Fasullo S, Paterna S, Licata P, et al. Cardiopulmonary Exercise Testing in Patients with Chronic Heart Failure: Prognostic Comparison from Peak VO2 and VE/VCO2 Slope. The Open Cardiovascular Medicine Journal. 2010;4(1):127-34.
- Gürdal A, Kasikcioglu E, Yakal S, Bugra Z. Impact of diabetes and diastolic dysfunction on exercise capacity in normotensive patients without coronary artery disease. Diab Vasc Dis Res. 2015;12(3):181-8.
- Segerström Å B, Elgzyri T, Eriksson KF, Groop L, Thorsson O, Wollmer P. Exercise capacity in relation to body fat distribution and muscle fibre distribution in elderly male subjects with impaired glucose tolerance, type 2 diabetes and matched controls. Diabetes Res Clin Pract. 2011;94(1):57-63. [CrossRef]
- Kiencke S, Handschin R, von Dahlen R, Muser J, Brunner-Larocca HP, Schumann J, et al. Pre-clinical diabetic cardiomyopathy: prevalence, screening, and outcome. Eur J Heart Fail. 2010;12(9):951-7.
- Wang Y, Yang H, Huynh Q, Nolan M, Negishi K, Marwick TH. Diagnosis of Nonischemic Stage B Heart Failure in Type 2 Diabetes Mellitus: Optimal Parameters for Prediction of Heart Failure. JACC Cardiovasc Imaging. 2018;11(10):1390-400.
- Oo MM, Tan Chung Zhen I, Ng KS, Tan KL, Tan ATB, Vethakkan SR, et al. Observational study investigating the prevalence of asymptomatic stage B heart failure in patients with type 2 diabetes who are not known to have coronary artery disease. BMJ Open. 2021;11(1):e039869.
- Ferreira VM, Schulz-Menger J, Holmvang G, Kramer CM, Carbone I, Sechtem U, et al. Cardiovascular Magnetic Resonance in Nonischemic Myocardial Inflammation: Expert Recommendations. J Am Coll Cardiol. 2018;72(24):3158-76.
- Parke KS, Brady EM, Alfuhied A, Motiwale RS, Razieh CS, Singh A, et al. Ethnic differences in cardiac structure and function assessed by MRI in healthy South Asian and White European people: A UK Biobank Study. Journal of cardiovascular magnetic resonance : official journal of the Society for Cardiovascular Magnetic Resonance. 2024;26(1):100001.
- Yeo JL, Dattani A, Bilak JM, Wood AL, Athithan L, Deshpande A, et al. Sex differences and determinants of coronary microvascular function in asymptomatic adults with type 2 diabetes. Journal of Cardiovascular Magnetic Resonance. 2025;27(1):101132. [CrossRef]
- Singh A, Greenwood JP, Berry C, Dawson DK, Hogrefe K, Kelly DJ, et al. Comparison of exercise testing and CMR measured myocardial perfusion reserve for predicting outcome in asymptomatic aortic stenosis: the PRognostic Importance of MIcrovascular Dysfunction in Aortic Stenosis (PRIMID AS) Study. European Heart Journal. 2017;38(16):1222-9.
- Kanagala P, Arnold JR, Singh A, Khan JN, Gulsin GS, Gupta P, et al. Prevalence of right ventricular dysfunction and prognostic significance in heart failure with preserved ejection fraction. Int J Cardiovasc Imaging. 2021;37(1):255-66.
- Gulsin GS, Swarbrick DJ, Athithan L, Brady EM, Henson J, Baldry E, et al. Effects of Low-Energy Diet or Exercise on Cardiovascular Function in Working-Age Adults With Type 2 Diabetes: A Prospective, Randomized, Open-Label, Blinded End Point Trial. Diabetes Care. 2020;43(6):1300-10. [CrossRef]
- Spontaneous coronary artery dissection (SCAD) study ISRCTN registry2019 [updated 22/07/2025. Available from: https://www.isrctn.com/ISRCTN42661582.
- Ayton SL, Alfuhied A, Gulsin GS, Parke KS, Wormleighton JV, Arnold JR, et al. The Interfield Strength Agreement of Left Ventricular Strain Measurements at 1.5 T and 3 T Using Cardiac MRI Feature Tracking. J Magn Reson Imaging. 2023;57(4):1250-61.
- Steadman CD, Jerosch-Herold M, Grundy B, Rafelt S, Ng LL, Squire IB, et al. Determinants and functional significance of myocardial perfusion reserve in severe aortic stenosis. JACC Cardiovasc Imaging. 2012;5(2):182-9.
- Yeo JL, Gulsin GS, Dattani A, Ayton SL, Bilak JM, Parke KS, et al. Unmasking early diastolic dysfunction in type 2 diabetes using the peak early-to-late diastolic strain rate ratio by cardiac MRI feature tracking. European Heart Journal. 2022;43(Supplement_2). [CrossRef]
- Captur G, Lobascio I, Ye Y, Culotta V, Boubertakh R, Xue H, et al. Motion-corrected free-breathing LGE delivers high quality imaging and reduces scan time by half: an independent validation study. The International Journal of Cardiovascular Imaging. 2019;35(10):1893-901.
- Lang RM, Badano LP, Mor-Avi V, Afilalo J, Armstrong A, Ernande L, et al. Recommendations for Cardiac Chamber Quantification by Echocardiography in Adults: An Update from the American Society of Echocardiography and the European Association of Cardiovascular Imaging. Journal of the American Society of Echocardiography. 2015;28(1):1-39.e14.
- Nagueh SF, Smiseth OA, Appleton CP, Byrd BF, Dokainish H, Edvardsen T, et al. Recommendations for the Evaluation of Left Ventricular Diastolic Function by Echocardiography: An Update from the American Society of Echocardiography and the European Association of Cardiovascular Imaging. Journal of the American Society of Echocardiography. 2016;29(4):277-314.
- Wasserman K, Hansen J, Sue DY, Stringer W, Sietsema K, Sun X-G, Whipp BJ. Principles of exercise testing and interpretation: Including pathophysiology and clinical applications: Fifth edition2011. 1-592 p.
- Sietsema KE, Stringer WW, Sue DY, Ward S. Wasserman & Whipp's: principles of exercise testing and interpretation: including pathophysiology and clinical applications: Lippincott Williams & Wilkins; 2020.
- Wasserman, K. Principles of Exercise Testing and Interpretation: Including Pathophysiology and Clinical Applications: Lippincott Williams & Wilkins; 2005.
- StataCorp. Stata Statistical Software: Release 18. College Station: TX: StataCorp LLC; 2023.
- Horowitz, GL. Estimating reference intervals. Am J Clin Pathol. 2010;133(2):175-7.
- Mohebi R, Wang D, Lau ES, Parekh JK, Allen N, Psaty BM, et al. Effect of 2022 ACC/AHA/HFSA Criteria on Stages of Heart Failure in a Pooled Community Cohort. J Am Coll Cardiol. 2023;81(23):2231-42.
- Chahal H, Bluemke DA, Wu CO, McClelland R, Liu K, Shea SJ, et al. Heart failure risk prediction in the Multi-Ethnic Study of Atherosclerosis. Heart. 2015;101(1):58-64.
- Petersen SE, Aung N, Sanghvi MM, Zemrak F, Fung K, Paiva JM, et al. Reference ranges for cardiac structure and function using cardiovascular magnetic resonance (CMR) in Caucasians from the UK Biobank population cohort. Journal of Cardiovascular Magnetic Resonance. 2016;19(1):18.
- Yang W, Xu J, Zhu L, Zhang Q, Wang Y, Zhao S, Lu M. Myocardial Strain Measurements Derived From MR Feature-Tracking. JACC: Cardiovascular Imaging. 2024;17(4):364-79.
- Raisi-Estabragh Z, Szabo L, McCracken C, Bülow R, Aquaro GD, Andre F, et al. Cardiovascular Magnetic Resonance Reference Ranges From the Healthy Hearts Consortium. JACC: Cardiovascular Imaging. 2024;17(7):746-62. [CrossRef]
- Gottdiener JS, Kitzman DW, Aurigemma GP, Arnold AM, Manolio TA. Left Atrial Volume, Geometry, and Function in Systolic and Diastolic Heart Failure of Persons ≥65 Years of Age (The Cardiovascular Health Study). The American Journal of Cardiology. 2006;97(1):83-9.
- Reimer Jensen AM, Zierath R, Claggett B, Skali H, Solomon SD, Matsushita K, et al. Association of Left Ventricular Systolic Function With Incident Heart Failure in Late Life. JAMA Cardiol. 2021;6(5):509-20.
- Subramanian V, Keshvani N, Segar MW, Kondamudi NJ, Chandra A, Maddineni B, et al. Association of global longitudinal strain by feature tracking cardiac magnetic resonance imaging with adverse outcomes among community-dwelling adults without cardiovascular disease: The Dallas Heart Study. Eur J Heart Fail. 2024;26(2):208-15.
- Velagaleti RS, Gona P, Pencina MJ, Aragam J, Wang TJ, Levy D, et al. Left Ventricular Hypertrophy Patterns and Incidence of Heart Failure With Preserved Versus Reduced Ejection Fraction. The American Journal of Cardiology. 2014;113(1):117-22. [CrossRef]
- Taqueti VR, Solomon SD, Shah AM, Desai AS, Groarke JD, Osborne MT, et al. Coronary microvascular dysfunction and future risk of heart failure with preserved ejection fraction. Eur Heart J. 2018;39(10):840-9.
- Marques MD, Weinberg R, Kapoor S, Ostovaneh MR, Kato Y, Liu CY, et al. Myocardial fibrosis by T1 mapping magnetic resonance imaging predicts incident cardiovascular events and all-cause mortality: the Multi-Ethnic Study of Atherosclerosis. European Heart Journal - Cardiovascular Imaging. 2022;23(10):1407-16.
- Shah AM, Claggett B, Sweitzer NK, Shah SJ, Anand IS, O’Meara E, et al. Cardiac Structure and Function and Prognosis in Heart Failure With Preserved Ejection Fraction. Circulation: Heart Failure. 2014;7(5):740-51.
- Shahim A, Hourqueig M, Donal E, Oger E, Venkateshvaran A, Daubert JC, et al. Predictors of long-term outcome in heart failure with preserved ejection fraction: a follow-up from the KaRen study. ESC Heart Failure. 2021;8(5):4243-54. [CrossRef]
- Gerstenblith G, Frederiksen J, Yin FC, Fortuin NJ, Lakatta EG, Weisfeldt ML. Echocardiographic assessment of a normal adult aging population. Circulation. 1977;56(2):273-8.
- Lee DS, Massaro JM, Wang TJ, Kannel WB, Benjamin EJ, Kenchaiah S, et al. Antecedent Blood Pressure, Body Mass Index, and the Risk of Incident Heart Failure in Later Life. Hypertension. 2007;50(5):869-76.
- Davis EF, Crousillat DR, He W, Andrews CT, Hung JW, Danik JS. Indexing Left Atrial Volumes: Alternative Indexing Methods Better Predict Outcomes in Overweight and Obese Populations. JACC Cardiovasc Imaging. 2022;15(6):989-97.
- Caballero L, Kou S, Dulgheru R, Gonjilashvili N, Athanassopoulos GD, Barone D, et al. Echocardiographic reference ranges for normal cardiac Doppler data: results from the NORRE Study. European Heart Journal - Cardiovascular Imaging. 2015. [CrossRef]
Figure 1.
Study cohort grouped by disease status, describing exclusion criteria and study investigations analysed in each group.
Figure 1.
Study cohort grouped by disease status, describing exclusion criteria and study investigations analysed in each group.
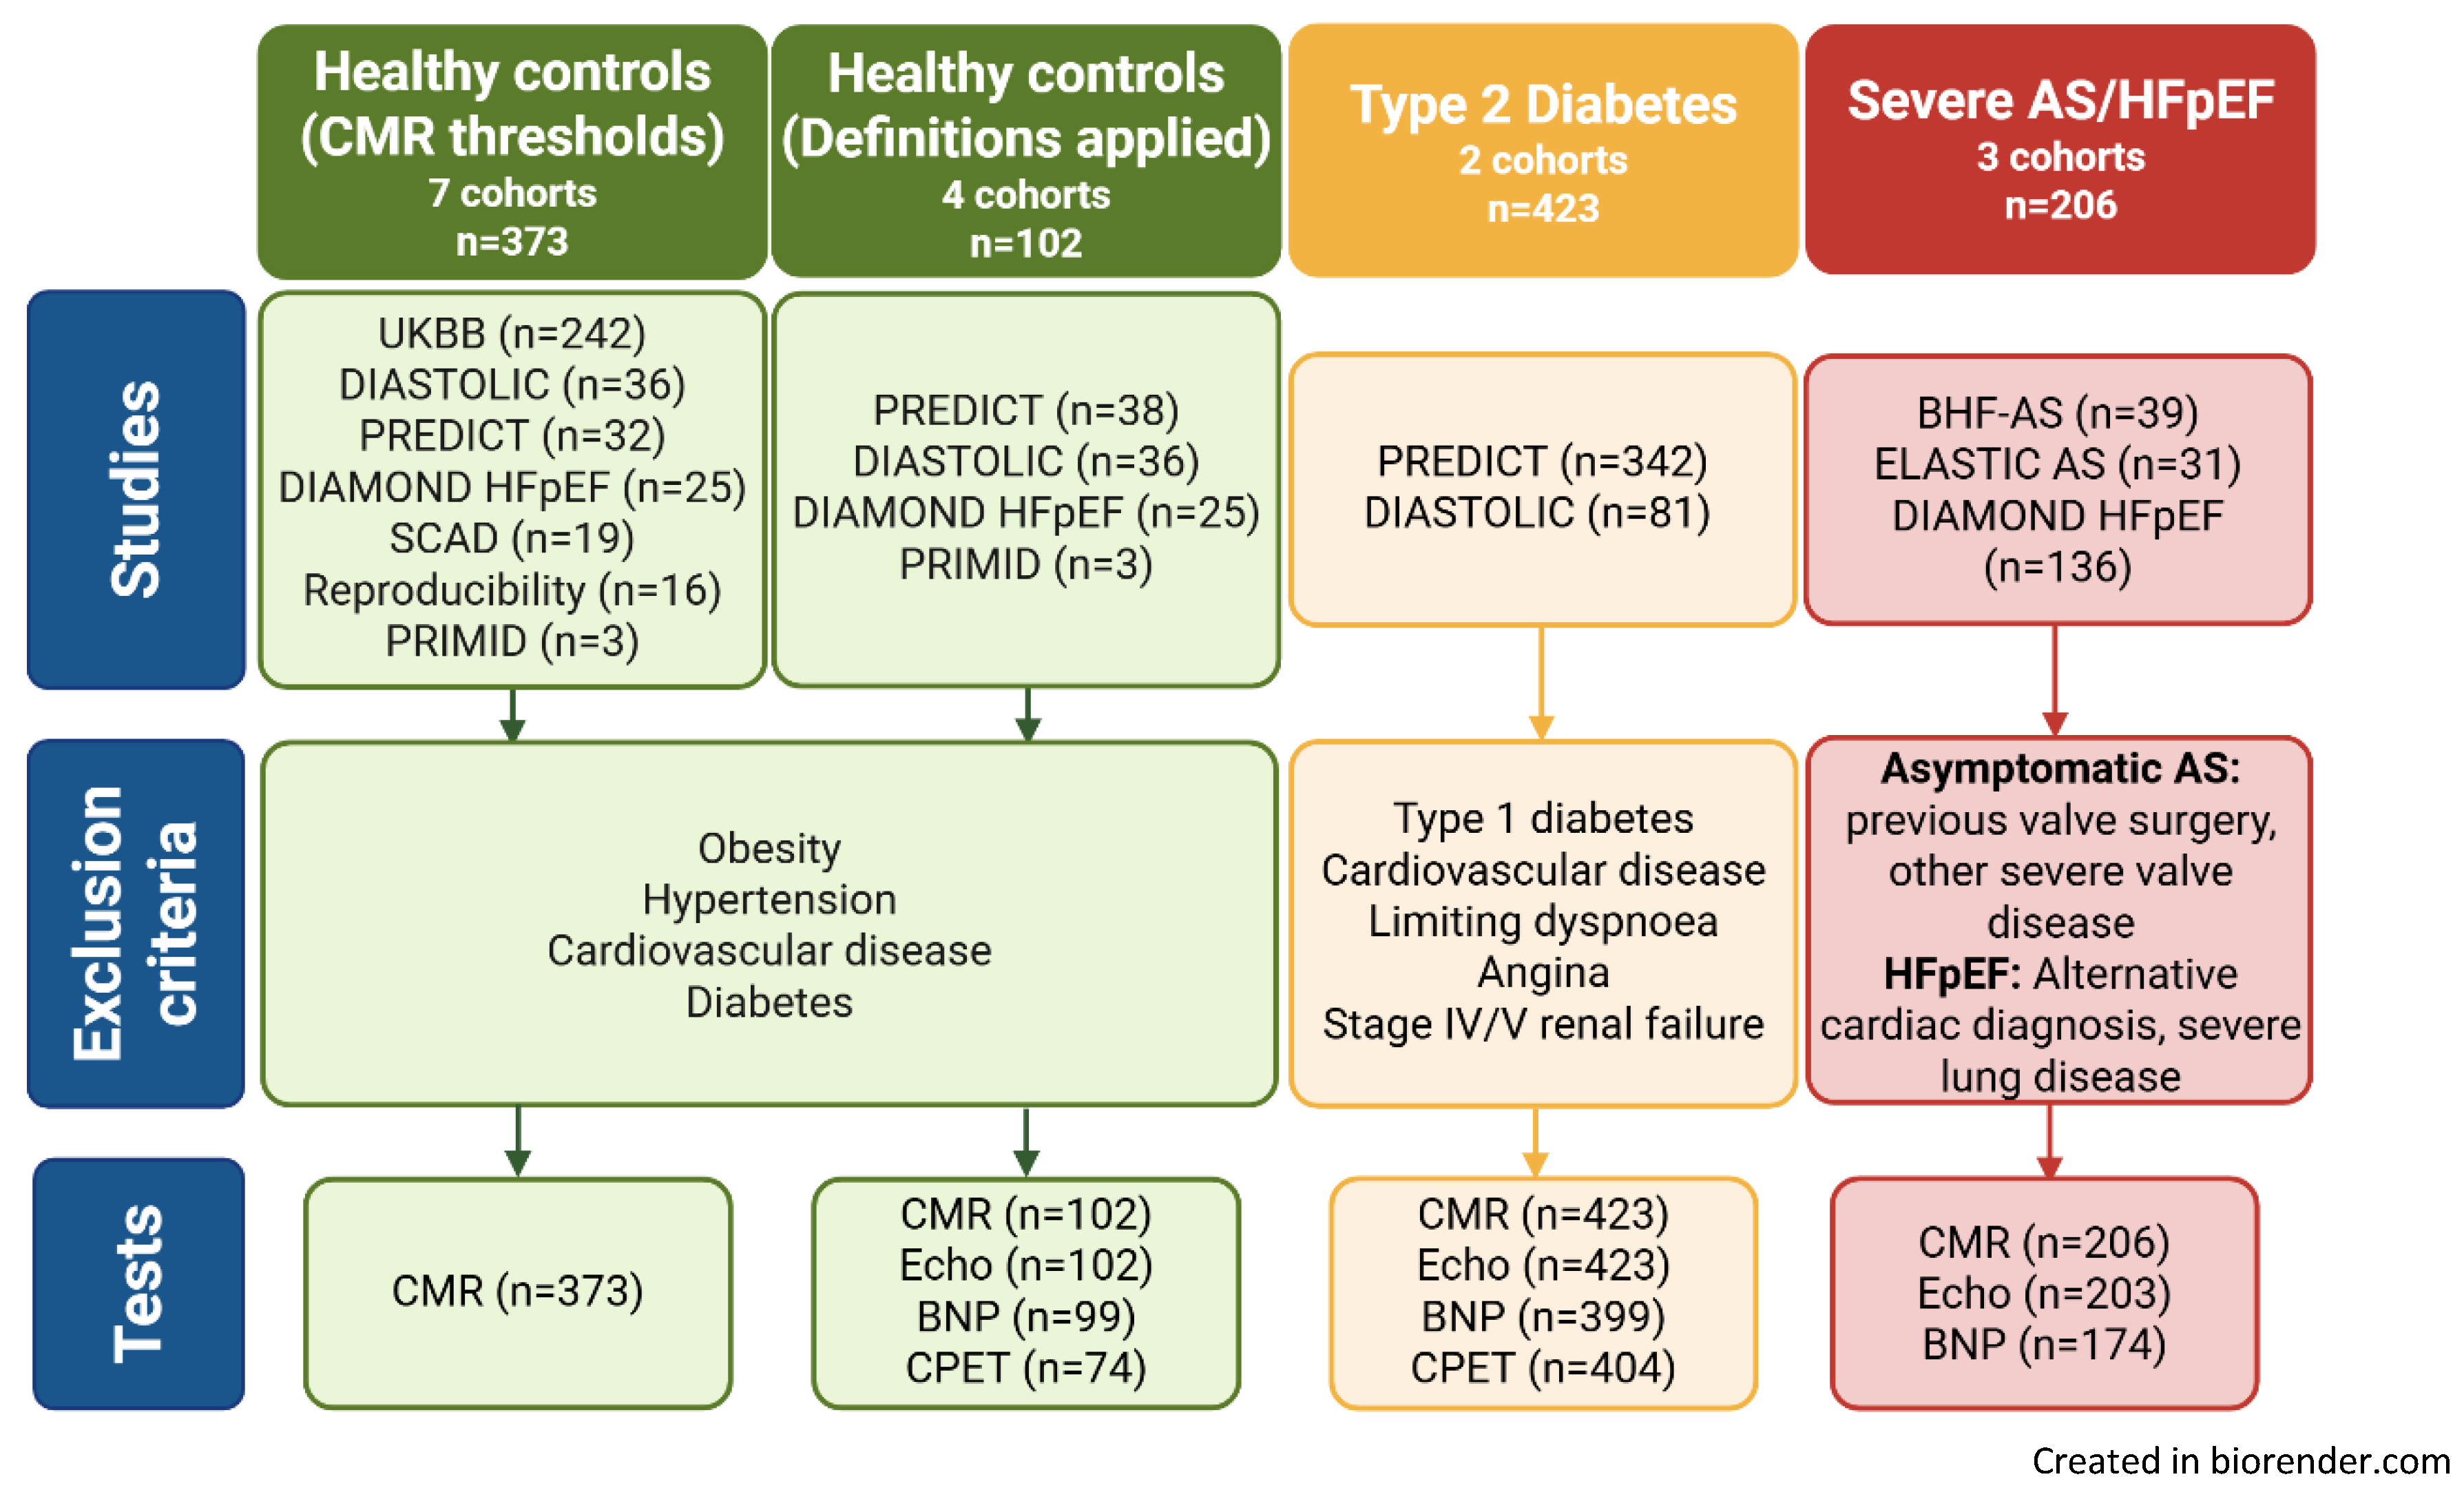
Figure 2.
Definition 3 - stage B heart failure criteria using refined guideline components and sex and ethnicity specific cardiac magnetic resonance thresholds.
Figure 2.
Definition 3 - stage B heart failure criteria using refined guideline components and sex and ethnicity specific cardiac magnetic resonance thresholds.
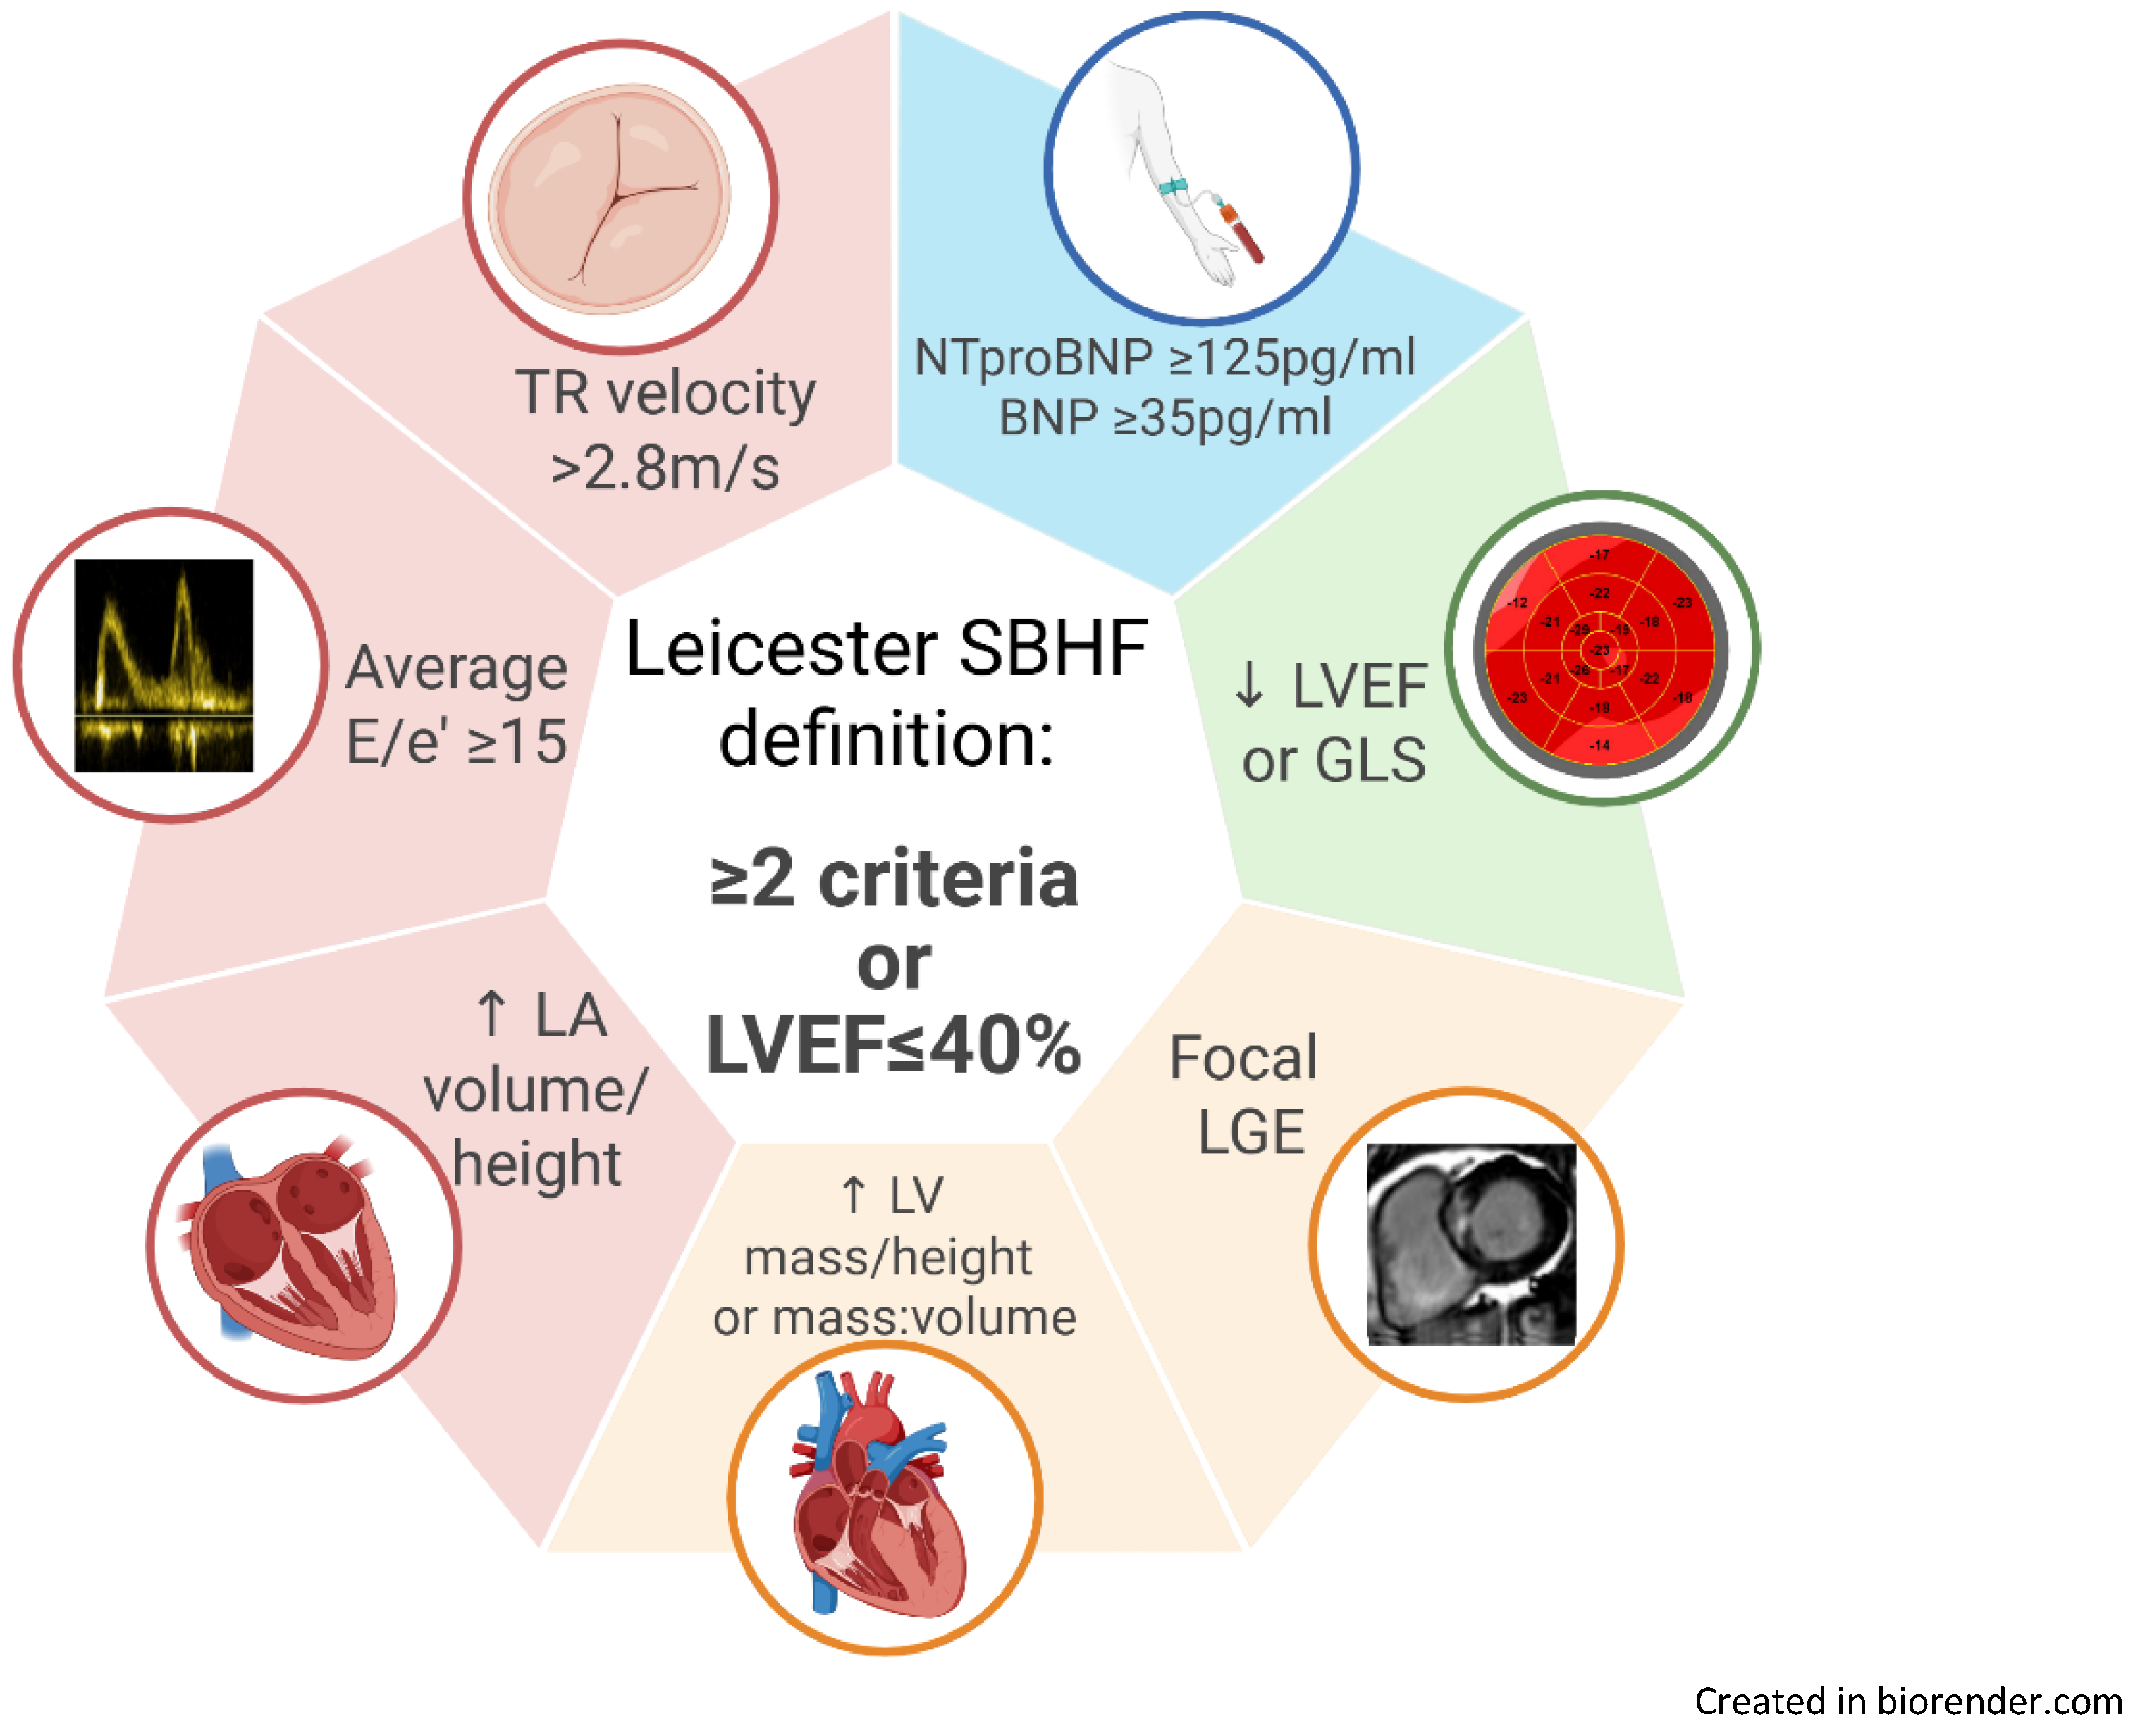
Figure 3.
Thresholds for definition 3 stage B heart failure, including sex and ethnicity specific cardiac magnetic resonance measures.
Figure 3.
Thresholds for definition 3 stage B heart failure, including sex and ethnicity specific cardiac magnetic resonance measures.
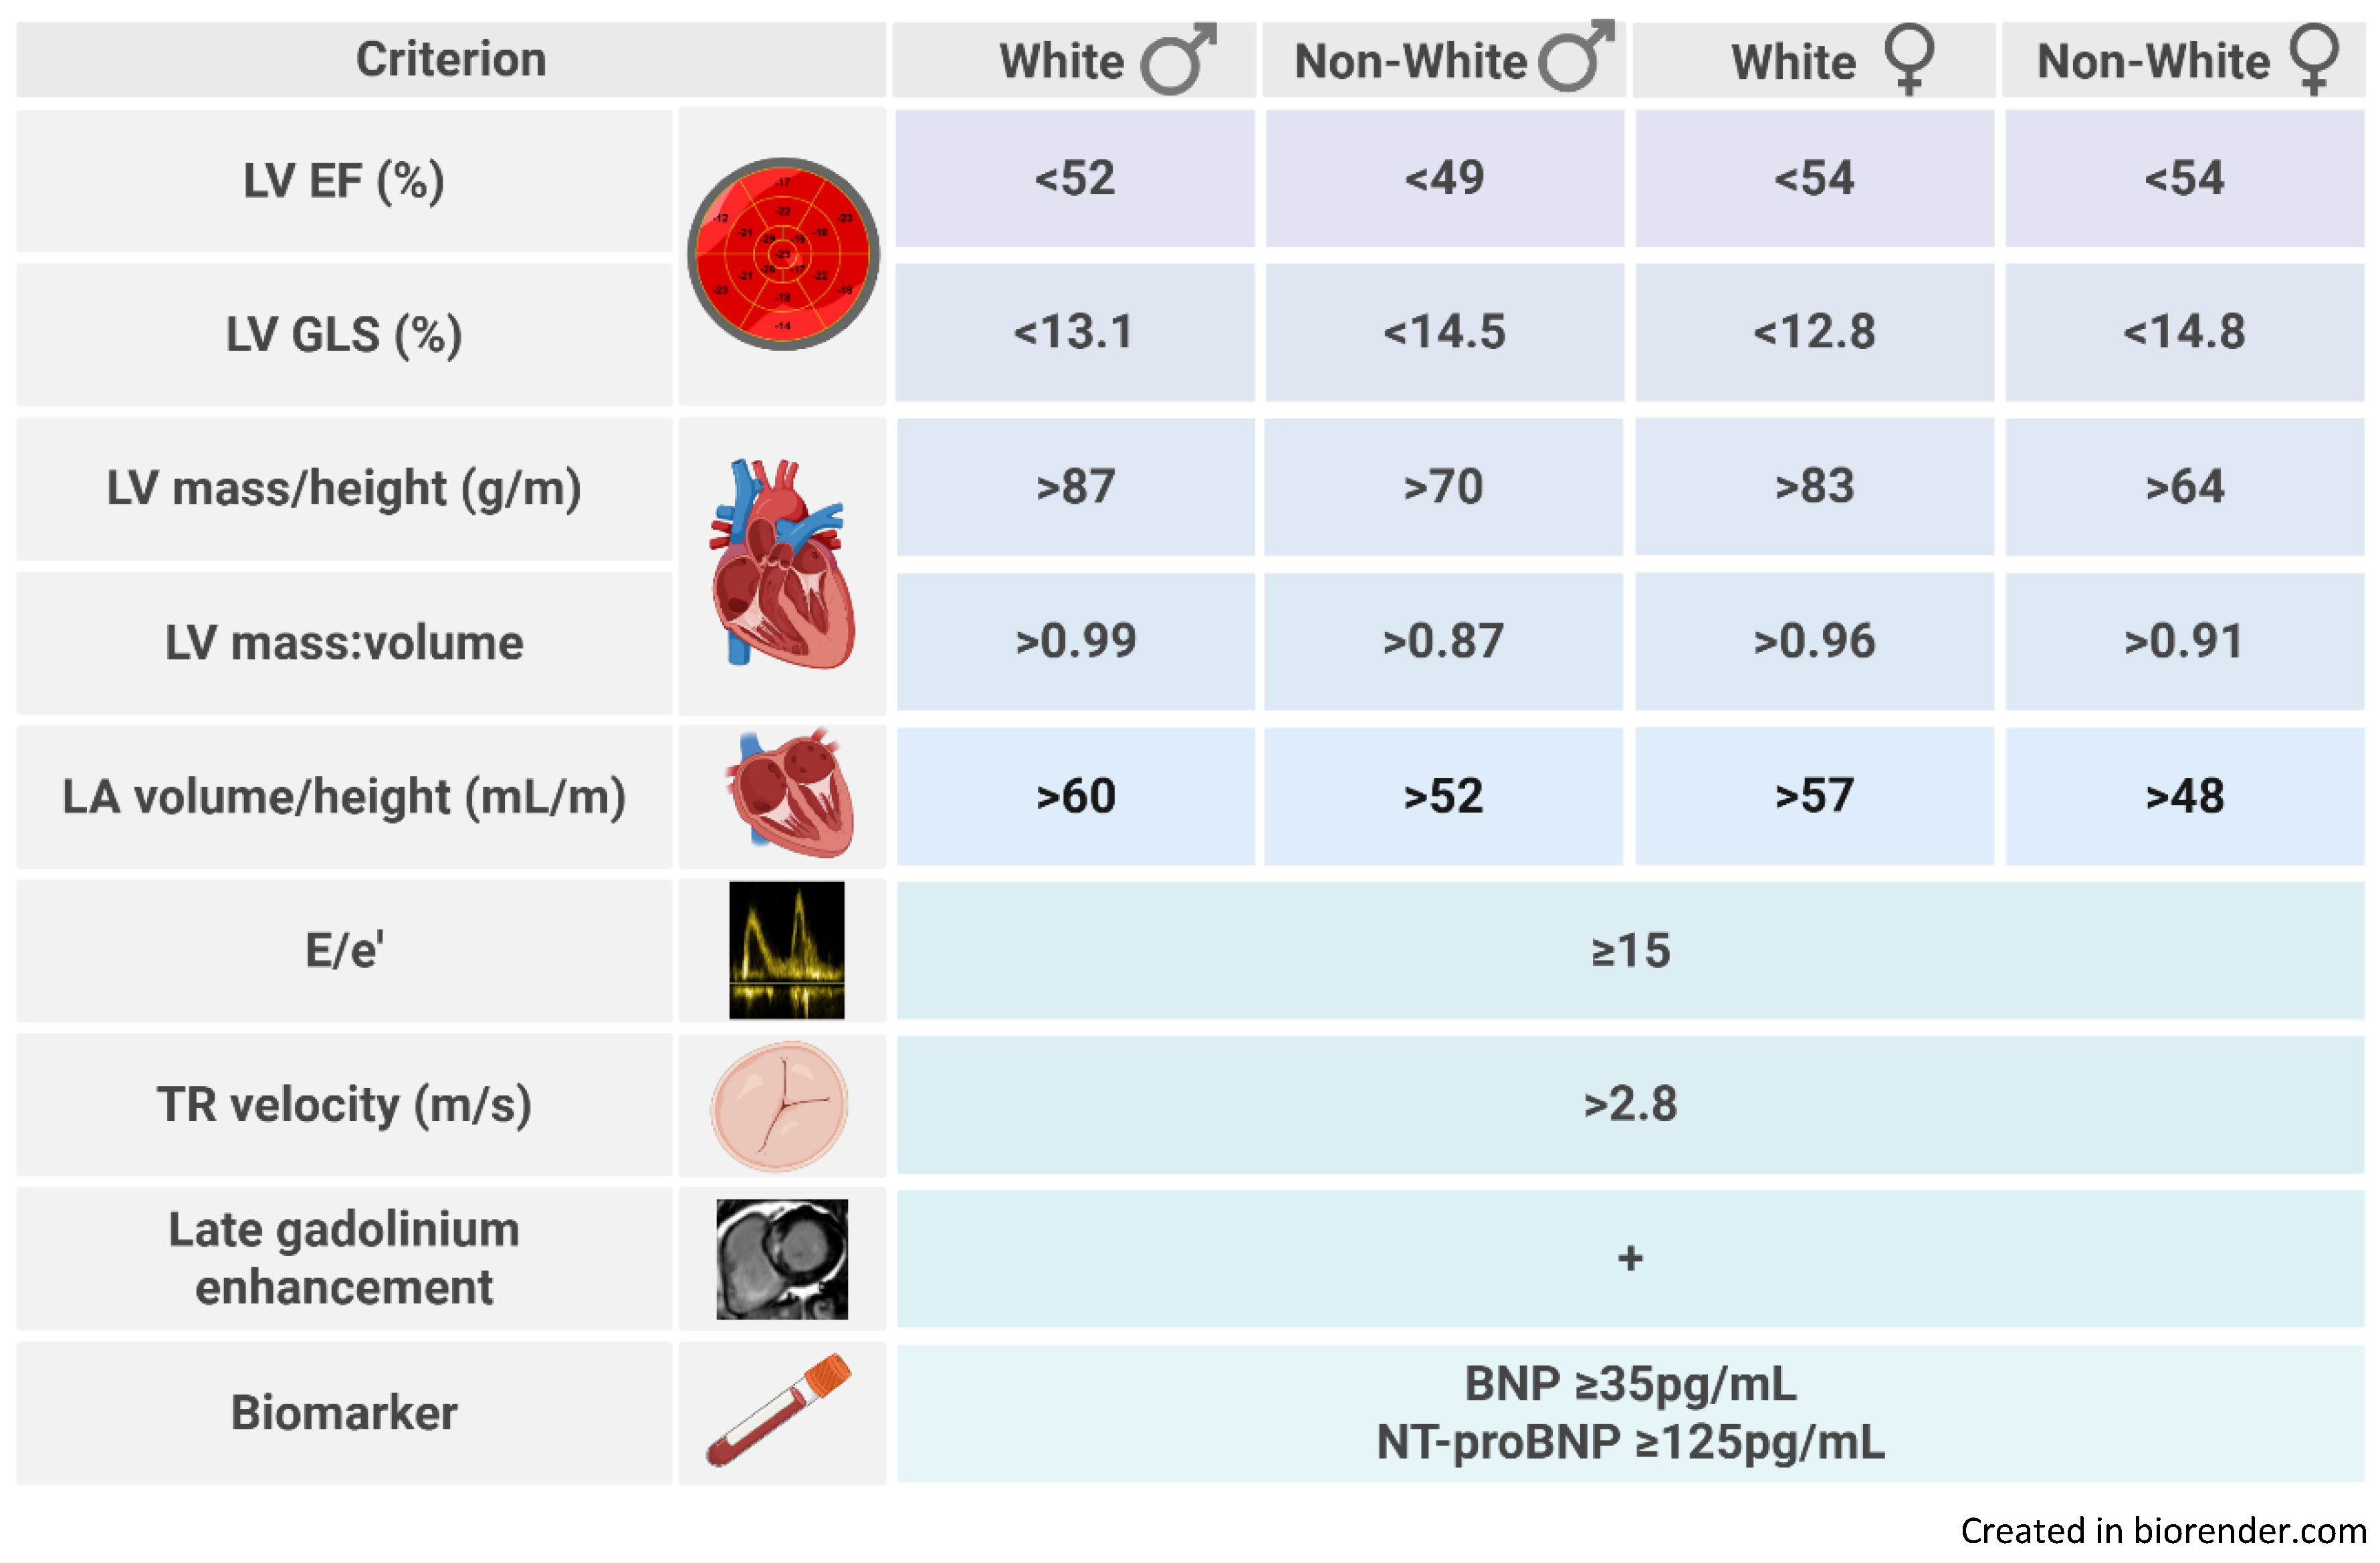
Figure 4.
Prevalence of stage B heart failure by each definition.
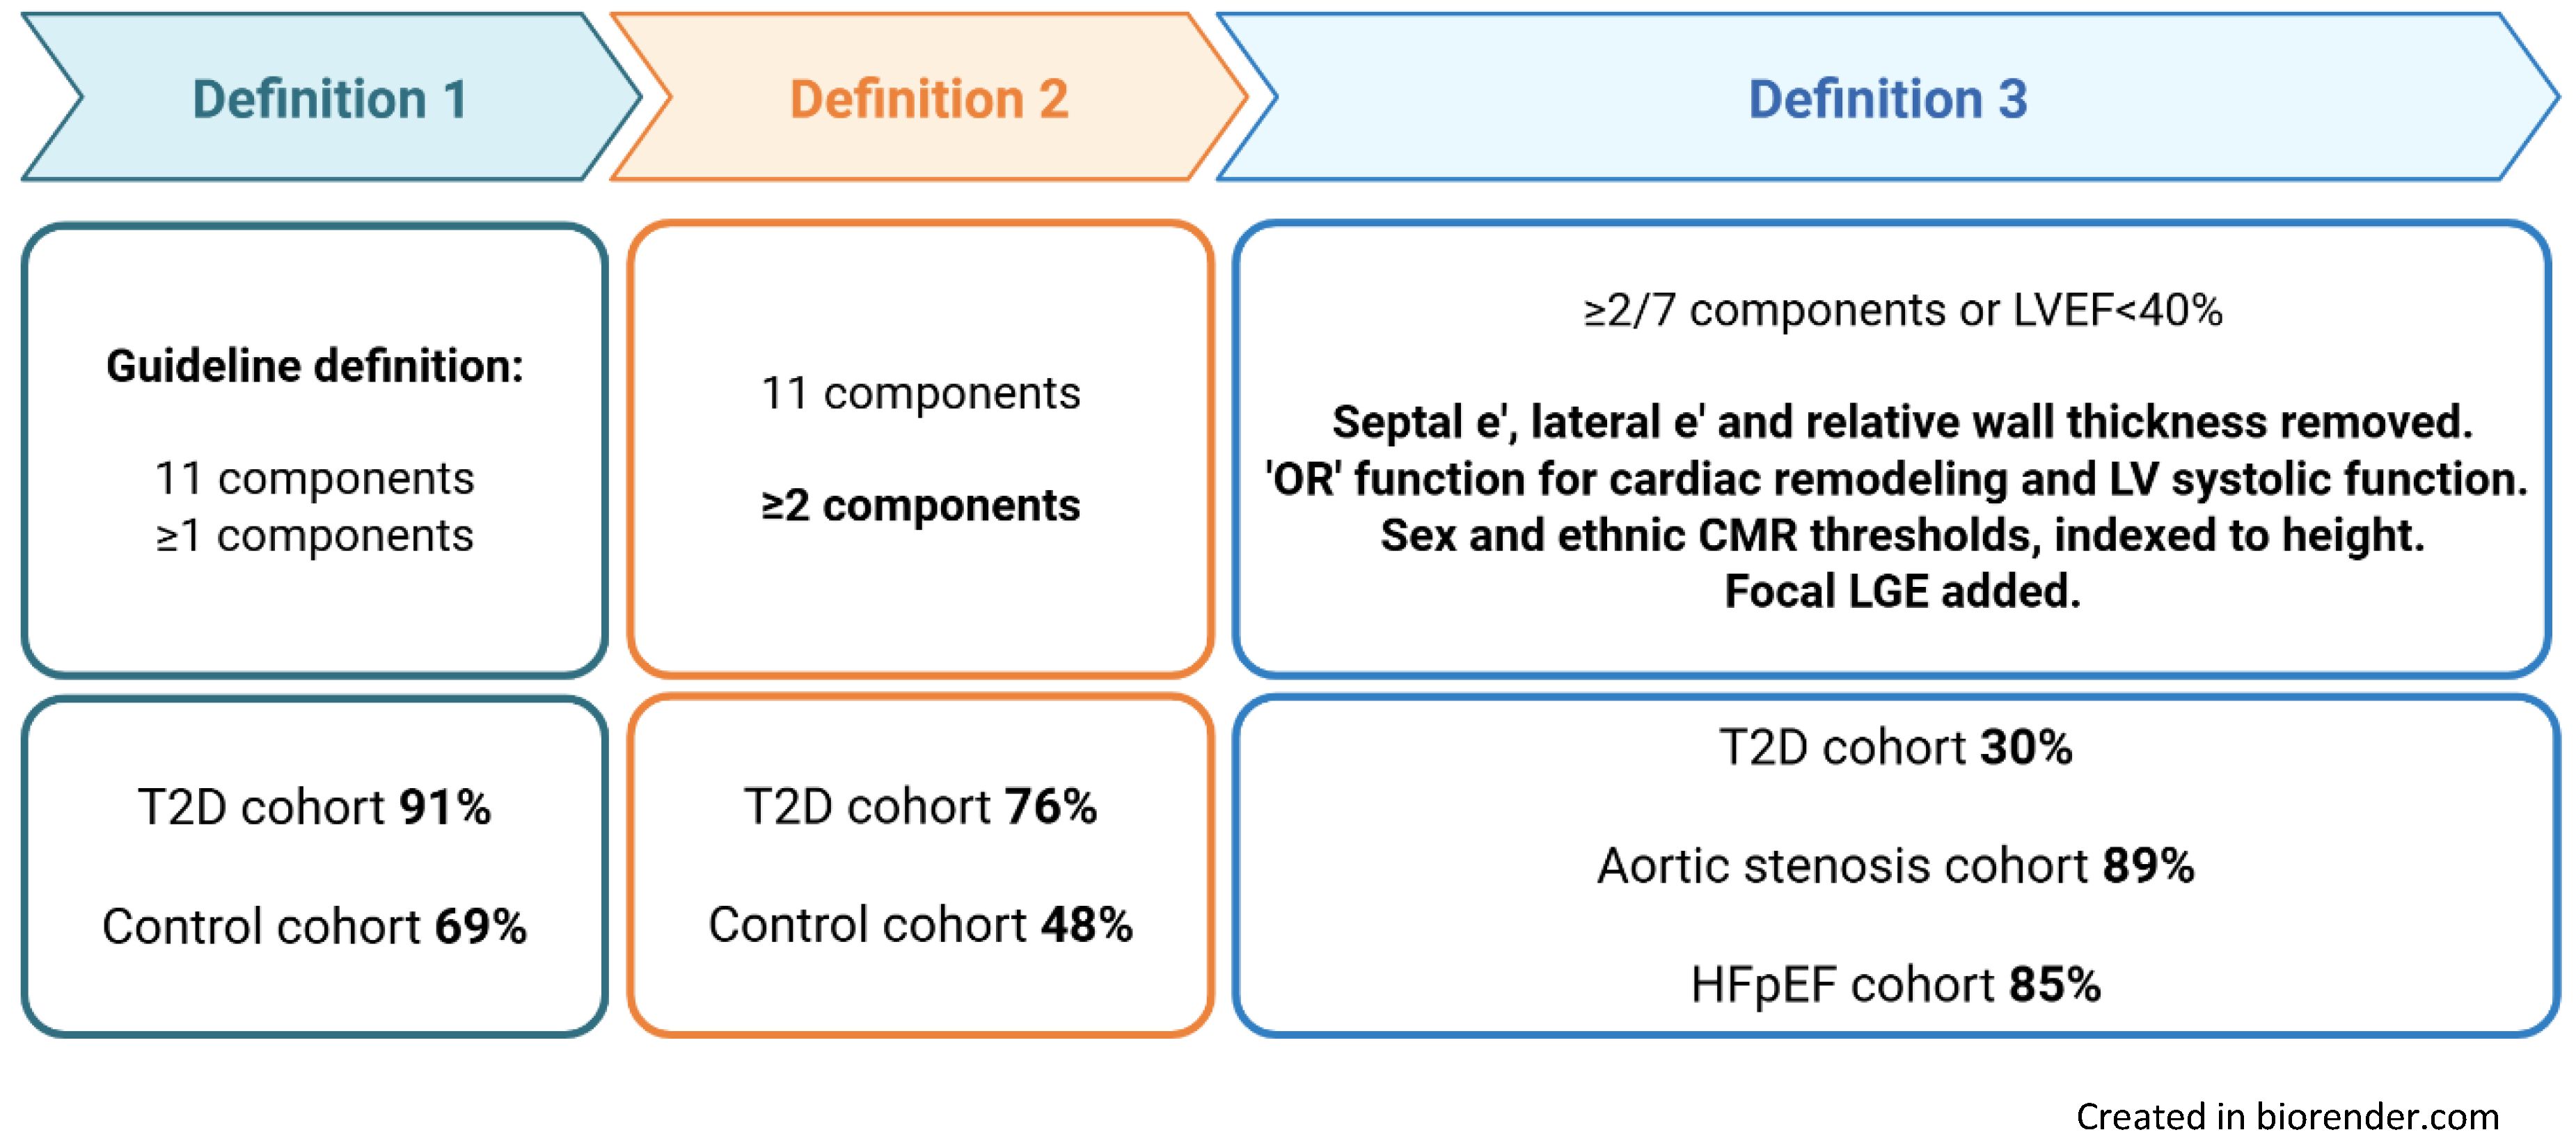

Table 1.
Clinical characteristics of study cohorts.
| Clinical characteristics | Healthy controls (n=102) |
Type 2 diabetes (n=423) |
Aortic stenosis (n=70) |
HFpEF (n=136) |
|---|---|---|---|---|
| Age, years | 59 ± 11 | 61 ± 9 | 70 (62, 74) | 74 (67, 78) |
| Male sex | 49 (48%) | 258 (61%) | 53 (76%) | 67 (49%) |
| White ethnicity | 75 (74%) | 311 (74%) | 64 (91%) | 114 (84%) |
| Current or ex-smoker | 27 (26%) | 187 (44%) | 44 (63%) | 72 (53%) |
| Hypertensive | - | 240 (57%) | 47 (67%) | 123 (90%) |
| T2D duration (years) | - | 10 (5, 21) | - | - |
| Statin | 12 (12%) | 292 (69%) | 49 (72%) | 86 (63%) |
| Body mass index (kg/m2) | 24.5 ± 2.2 | 31.5 ± 6.2 | 29.9 ± 5.3 | 33.8 ± 7.0 |
| Clinic systolic blood pressure (mmHg) | 133 ± 22 | 137 ± 17 | 136 ± 22 | 145 ± 25 |
| Heart rate (bpm) | 65 ± 10 | 76 ± 12 | 67 ± 14 | 67 ± 14 |
| Glycosylated haemoglobin (%) | - | 7.3 ± 1.2 | - | 6.2 (5.7, 7.3) |
| eGFR (ml/min/1.732) | 87 ± 12 | 87 ± 15 | 75 ± 17 | 64 ± 21 |
| Maximum workload (W)* | 142 (100, 200) | 115 (87, 150) | - | - |
| Peak VO2 (mL/Kg/min)* | 25.5 ± 7.6 | 19.0 ± 5.2 | - | - |
| % predicted workload* | 124 ± 32 | 100 ± 25 | - | - |
| % predicted VO2 Max* | 97 ± 21 | 88 ± 20 | - | - |
eGFR, estimated glomerular filtration rate; T2D, type 2 diabetes. *n=74 in healthy control cohort for cardiopulmonary exercise testing measures.
Table 2.
Clinical characteristics of the T2D cohort by SBHF definition.
| Definition 1 Current ACC/AHA/HFSA |
Definition 2 ≥2 ACC/AHA/HFSA criteria |
Definition 3 ≥2 criteria or LVEF ≤40% |
|||||||||
|---|---|---|---|---|---|---|---|---|---|---|---|
|
Stage A n=37 |
Stage B n=386 |
P |
Stage A n=101 |
Stage B n=322 |
P |
Stage A n=295 |
Stage B n=128 |
P | |||
| Age, years | 58 ± 7 | 61 ± 9 | 0.028 | 58 ± 9 | 62 ± 8 | <0.001 | 62 ± 8 | 59 ± 10 | 0.002 | ||
| Male sex | 25 (68%) | 233 (60%) | 0.391 | 59 (58%) | 199 (62%) | 0.543 | 172 (58%) | 86 (67%) | 0.085 | ||
| White ethnicity | 27 (73%) | 284 (74%) | 0.937 | 77 (76%) | 234 (73%) | 0.478 | 227 (77%) | 84 (66%) | 0.015 | ||
| Current/ex-smoker | 15 (41%) | 172 (45%) | 0.638 | 38 (38%) | 149 (46%) | 0.127 | 119 (40%) | 68 (53%) | 0.015 | ||
| Hypertensive | 20 (54%) | 220 (57%) | 0.730 | 52 (51%) | 188 (58%) | 0.222 | 161 (55%) | 79 (62%) | 0.173 | ||
| T2D duration, years | 6 (3, 11) | 8 (5, 12) | 0.274 | 5 (3, 10) | 8 (5, 13) | 0.002 | 8 (5, 13) | 6 (4, 11) | 0.067 | ||
| BMI, Kg/m2 | 29.5 ± 5.6 | 31.7 ± 6.2 | 0.036 | 30.3 ± 6.5 | 31.9 ± 6.0 | 0.019 | 30.3 ± 5.5 | 34.2 ± 6.9 | <0.001 | ||
| Average SBP, mmHg | 130 ± 13 | 137 ± 17 | 0.013 | 131 (15) | 138 (17) | <0.001 | 134 (15) | 143 ± 18 | <0.001 | ||
| HbA1c, % | 7.5 ± 1.4 | 7.3 ± 1.1 | 0.242 | 7.2 ± 1.2 | 7.4 ± 1.1 | 0.211 | 7.3 ± 1.2 | 7.2 ± 1.1 | 0.360 | ||
| Exercise capacity | |||||||||||
| % predicted workload* | 91 ± 19 | 101 ± 25 | 0.015 | 98 ± 25 | 101 ± 25 | 0.297 | 104 ± 26 | 93 ± 21 | <0.001 | ||
| % predicted VO2 Max* | 83 ± 17 | 88 ± 20 | 0.102 | 88 ± 19 | 88 ± 20 | 0.794 | 91 ± 20 | 81 ± 16 | <0.001 | ||
T2D, type 2 diabetes; SBP, systolic blood pressure; HbA1c, glycosylated haemoglobin. *P values adjusted for smoking history.
Disclaimer/Publisher’s Note: The statements, opinions and data contained in all publications are solely those of the individual author(s) and contributor(s) and not of MDPI and/or the editor(s). MDPI and/or the editor(s) disclaim responsibility for any injury to people or property resulting from any ideas, methods, instructions or products referred to in the content. |
© 2025 by the authors. Licensee MDPI, Basel, Switzerland. This article is an open access article distributed under the terms and conditions of the Creative Commons Attribution (CC BY) license (http://creativecommons.org/licenses/by/4.0/).
Copyright: This open access article is published under a Creative Commons CC BY 4.0 license, which permit the free download, distribution, and reuse, provided that the author and preprint are cited in any reuse.


