Submitted:
23 November 2025
Posted:
24 November 2025
You are already at the latest version
Abstract
This paper presents a simple hybrid framework that joins a Variational Autoencoder (VAE) with LightGBM to improve financial market volatility prediction. Using daily CSI 300 Index data from 2015 to 2023, the VAE compresses 45 market features into a few key latent factors that keep the main nonlinear patterns in the data. These factors are then used by LightGBM for regression forecasting. The model reduced mean absolute error (MAE) by 12.1% compared with the PCA–LightGBM baseline and showed steady performance in volatile periods such as 2018 and 2020. The findings show that nonlinear feature encoding can uncover hidden risk patterns that simple linear reduction methods often miss. The proposed model offers a clear and efficient framework for daily risk forecasting and can be further tested on higher-frequency data and multiple markets to check its wider use.
Keywords:
volatility prediction
; variational autoencoder
; LightGBM
; feature reduction
; financial risk
; latent factors
; hybrid modeling
1. Introduction
Volatility forecasting is a core topic in quantitative finance because it affects derivative pricing, portfolio allocation, margin setting, and intraday risk control [1]. Classical econometric models such as GARCH and its variants are capable of modeling conditional variance; however, they rely on a restricted set of manually crafted factors and struggle when market information becomes high-dimensional, nonlinear, and noisy [2]. With the expansion of high-frequency trading, cross-asset flows, and alternative information sources, modern financial datasets now contain far more variables than traditional models can efficiently process. As a result, machine learning approaches—such as random forests, gradient boosting, and deep neural networks—have been increasingly adopted to improve the mapping from diverse market features to future volatility or return risk [3]. Nevertheless, when input representations fail to capture true market drivers, even sophisticated models cannot produce stable forecasts, making feature representation a fundamental bottleneck [4]. Dimensionality reduction is a common strategy to address this limitation. Principal component analysis (PCA) has been widely used in volatility surface modeling, factor investing, and term-structure analysis because it is computationally simple and interpretable [5]. However, PCA assumes linear structure and orthogonality, which may not hold in real markets characterized by time-varying correlations, asymmetric tail risks, and nonlinear dynamics associated with order-book imbalance, liquidity shocks, and option-implied signals [6]. Empirical studies also show that PCA-based features may fail to encode regime-specific structures and cannot adequately distinguish rare but impactful events from normal periods [5]. These limitations have motivated the adoption of representation learning techniques that capture latent structure directly from data.
Variational autoencoders (VAEs) offer a principled approach to nonlinear representation learning by mapping high-dimensional inputs into a structured latent space governed by a probabilistic prior [6]. Compared with PCA, VAEs capture nonlinear dependence, preserve heavy-tail characteristics, and produce smooth latent structures that retain information about stress conditions [7]. Existing work has applied autoencoders to denoise limit-order-book signals, construct stress indicators, and generate synthetic market states, achieving performance improvements relative to raw variables in downstream tasks [8]. However, most current applications either pair latent codes with simple regression models or use them only for clustering, leaving the full predictive potential of VAE representations underexplored [9]. Gradient boosting decision trees—especially LightGBM—provide an effective predictive mechanism because they can handle mixed feature types, nonlinear interactions, and moderate-sized datasets without extensive hyperparameter tuning [10]. LightGBM has demonstrated favorable performance in volatility prediction when feature spaces are informative rather than extremely large [11]. Moreover, studies employing LightGBM for volatility forecasting have shown that boosting techniques can outperform traditional econometric baselines, highlighting their ability to leverage heterogeneous features [12]. Notably, recent work has adopted LightGBM-based schemes for short-term volatility modeling and obtained competitive performance under hybrid feature settings [13], making it a natural candidate for integrating learned latent factors. Despite these promising directions, only limited research has examined whether nonlinear latent factors can systematically outperform PCA in equity volatility modeling, and whether boosting methods can fully exploit these representations under structural regime changes. Most existing studies remain focused on developed markets, leaving open the question of whether nonlinear representation learning offers similar benefits in emerging markets such as China, where market microstructure, liquidity, and policy cycles differ substantially [14].
This study develops a VAE–LightGBM hybrid framework for volatility prediction in the CSI 300 equity market. A VAE is first trained on raw market inputs—including price-based indicators, turnover, and market-level variables—to produce low-dimensional latent factors that encode nonlinear risk structures, which are subsequently fed into LightGBM for supervised forecasting. Empirical results show that the proposed framework reduces MAE by 12.1% relative to a PCA–LightGBM baseline, indicating that nonlinear latent factors contain richer predictive information than linear components. The primary contributions include introducing a VAE-based latent factor extractor tailored to high-dimensional Chinese equity data, demonstrating that tree-based boosting can effectively leverage nonlinear representations, and providing systematic evidence that nonlinear representation learning enhances volatility modeling beyond PCA under regime shifts and mixed-frequency market signals. Overall, the findings highlight the advantage of combining deep generative representation with boosting for robust volatility forecasting and underscore its value in risk monitoring, asset allocation, and derivative pricing in rapidly evolving markets .
2. Materials and Methods
2.1. Sample Description and Data Sources
This study used daily trading data from the CSI 300 Index between January 2015 and December 2023. The dataset contained 2,250 trading days and included 300 listed companies. Each record had 45 variables such as price, trading volume, volatility index, and liquidity ratio. All data were taken from the Wind Financial Terminal and the China Stock Market & Accounting Research (CSMAR) database. Missing or extreme values were carefully checked and replaced using linear interpolation or previous-value filling to keep data continuity and accuracy.
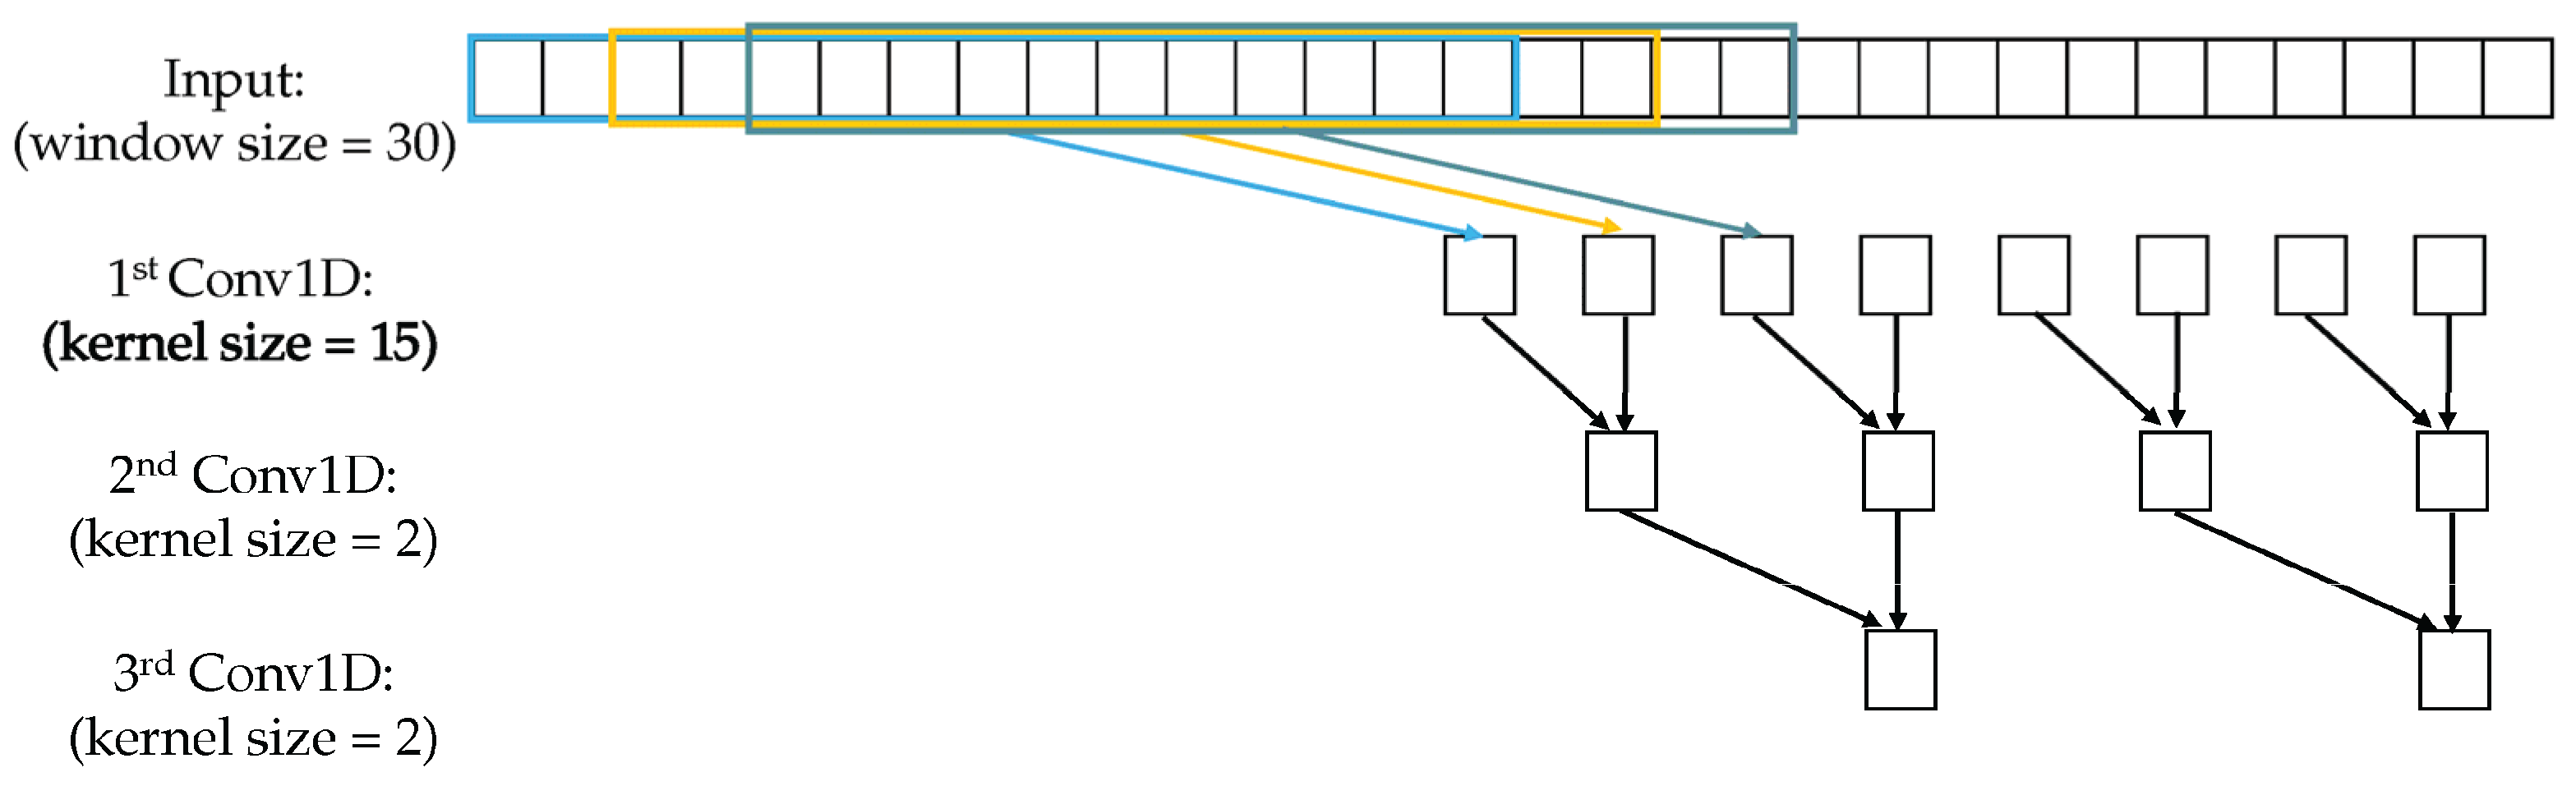
2.2. Experimental Design and Baseline Models
A hybrid model combining a Variational Autoencoder (VAE) and LightGBM was built to predict daily volatility. The PCA–LightGBM model served as a baseline for comparison because PCA is commonly used for feature compression in finance. Both models used the same input variables and one-day-ahead forecasting window. The dataset was divided chronologically into training (70%), validation (15%), and test (15%) sets. The VAE used two encoder layers with 64 and 32 units and one latent layer of size 8. The Adam optimizer was applied with a learning rate of 0.001. LightGBM hyperparameters were tuned by fivefold cross-validation to reduce overfitting and improve stability.
2.3. Measurement Methods and Quality Control
The realized volatility () of the CSI 300 Index was calculated using 5-minute intraday returns. Before modeling, all features were standardized using z-score normalization, and variables with very low variance (below ) were removed. The model’s predictive performance was assessed by three common indicators: mean absolute error (MAE), root mean square error (RMSE), and the coefficient of determination (). Each test was repeated ten times, and average values were reported to ensure consistency. Statistical tests including the Shapiro–Wilk and Ljung–Box tests were used to verify that model residuals met the assumptions of normality and independence.
2.4. Data Processing and Model Equations
The VAE compressed the input vector into a smaller latent variable through a stochastic mapping [15]:
The training objective of the VAE combined a reconstruction term and a regularization term [16]:
where is the Kullback–Leibler divergence, and is the balance coefficient. The latent vectors produced by the VAE were then used as input features for the LightGBM regressor, whose goal was to minimize the following loss [17]:
where measures the complexity of each decision tree, and controls the regularization weight.
2.5. Statistical Analysis and Model Validation
The significance of performance improvement over the baseline was tested using paired t-tests at a 5% confidence level. LightGBM’s feature importance scores were used to evaluate the contribution of each latent factor. The learned latent space was visualized with t-distributed stochastic neighbor embedding (t-SNE) to confirm that the VAE captured key patterns in financial features. All experiments were conducted in Python 3.11 using TensorFlow 2.15 and LightGBM 4.3 on a workstation equipped with an NVIDIA RTX A6000 GPU.
3. Results and Discussion
3.1. Model Accuracy and Feature Contribution
The proposed VAE–LightGBM model achieved clear performance improvements over both PCA–LightGBM and standard LightGBM models. On the CSI 300 dataset, the mean absolute error (MAE) decreased by 12.1%, showing that nonlinear latent factors from the VAE contained more meaningful information than linearly reduced components. This finding aligns with reports that deep latent models can enhance financial risk estimation when the original variables are noisy or correlated [18].
Figure 1.
Forecast accuracy comparison between the PCA–LightGBM and VAE–LightGBM models.
3.2. Comparison with Linear Dimensional Reduction
When using PCA, most data variance was concentrated in a few components, which limited its ability to describe nonlinear patterns during market turbulence. The VAE–LightGBM model handled these variations better, particularly in periods with sharp volatility jumps. The nonlinear compression used here retained hidden relationships between macroeconomic variables and stock volatility, which reduced overfitting and improved model generalization [19].
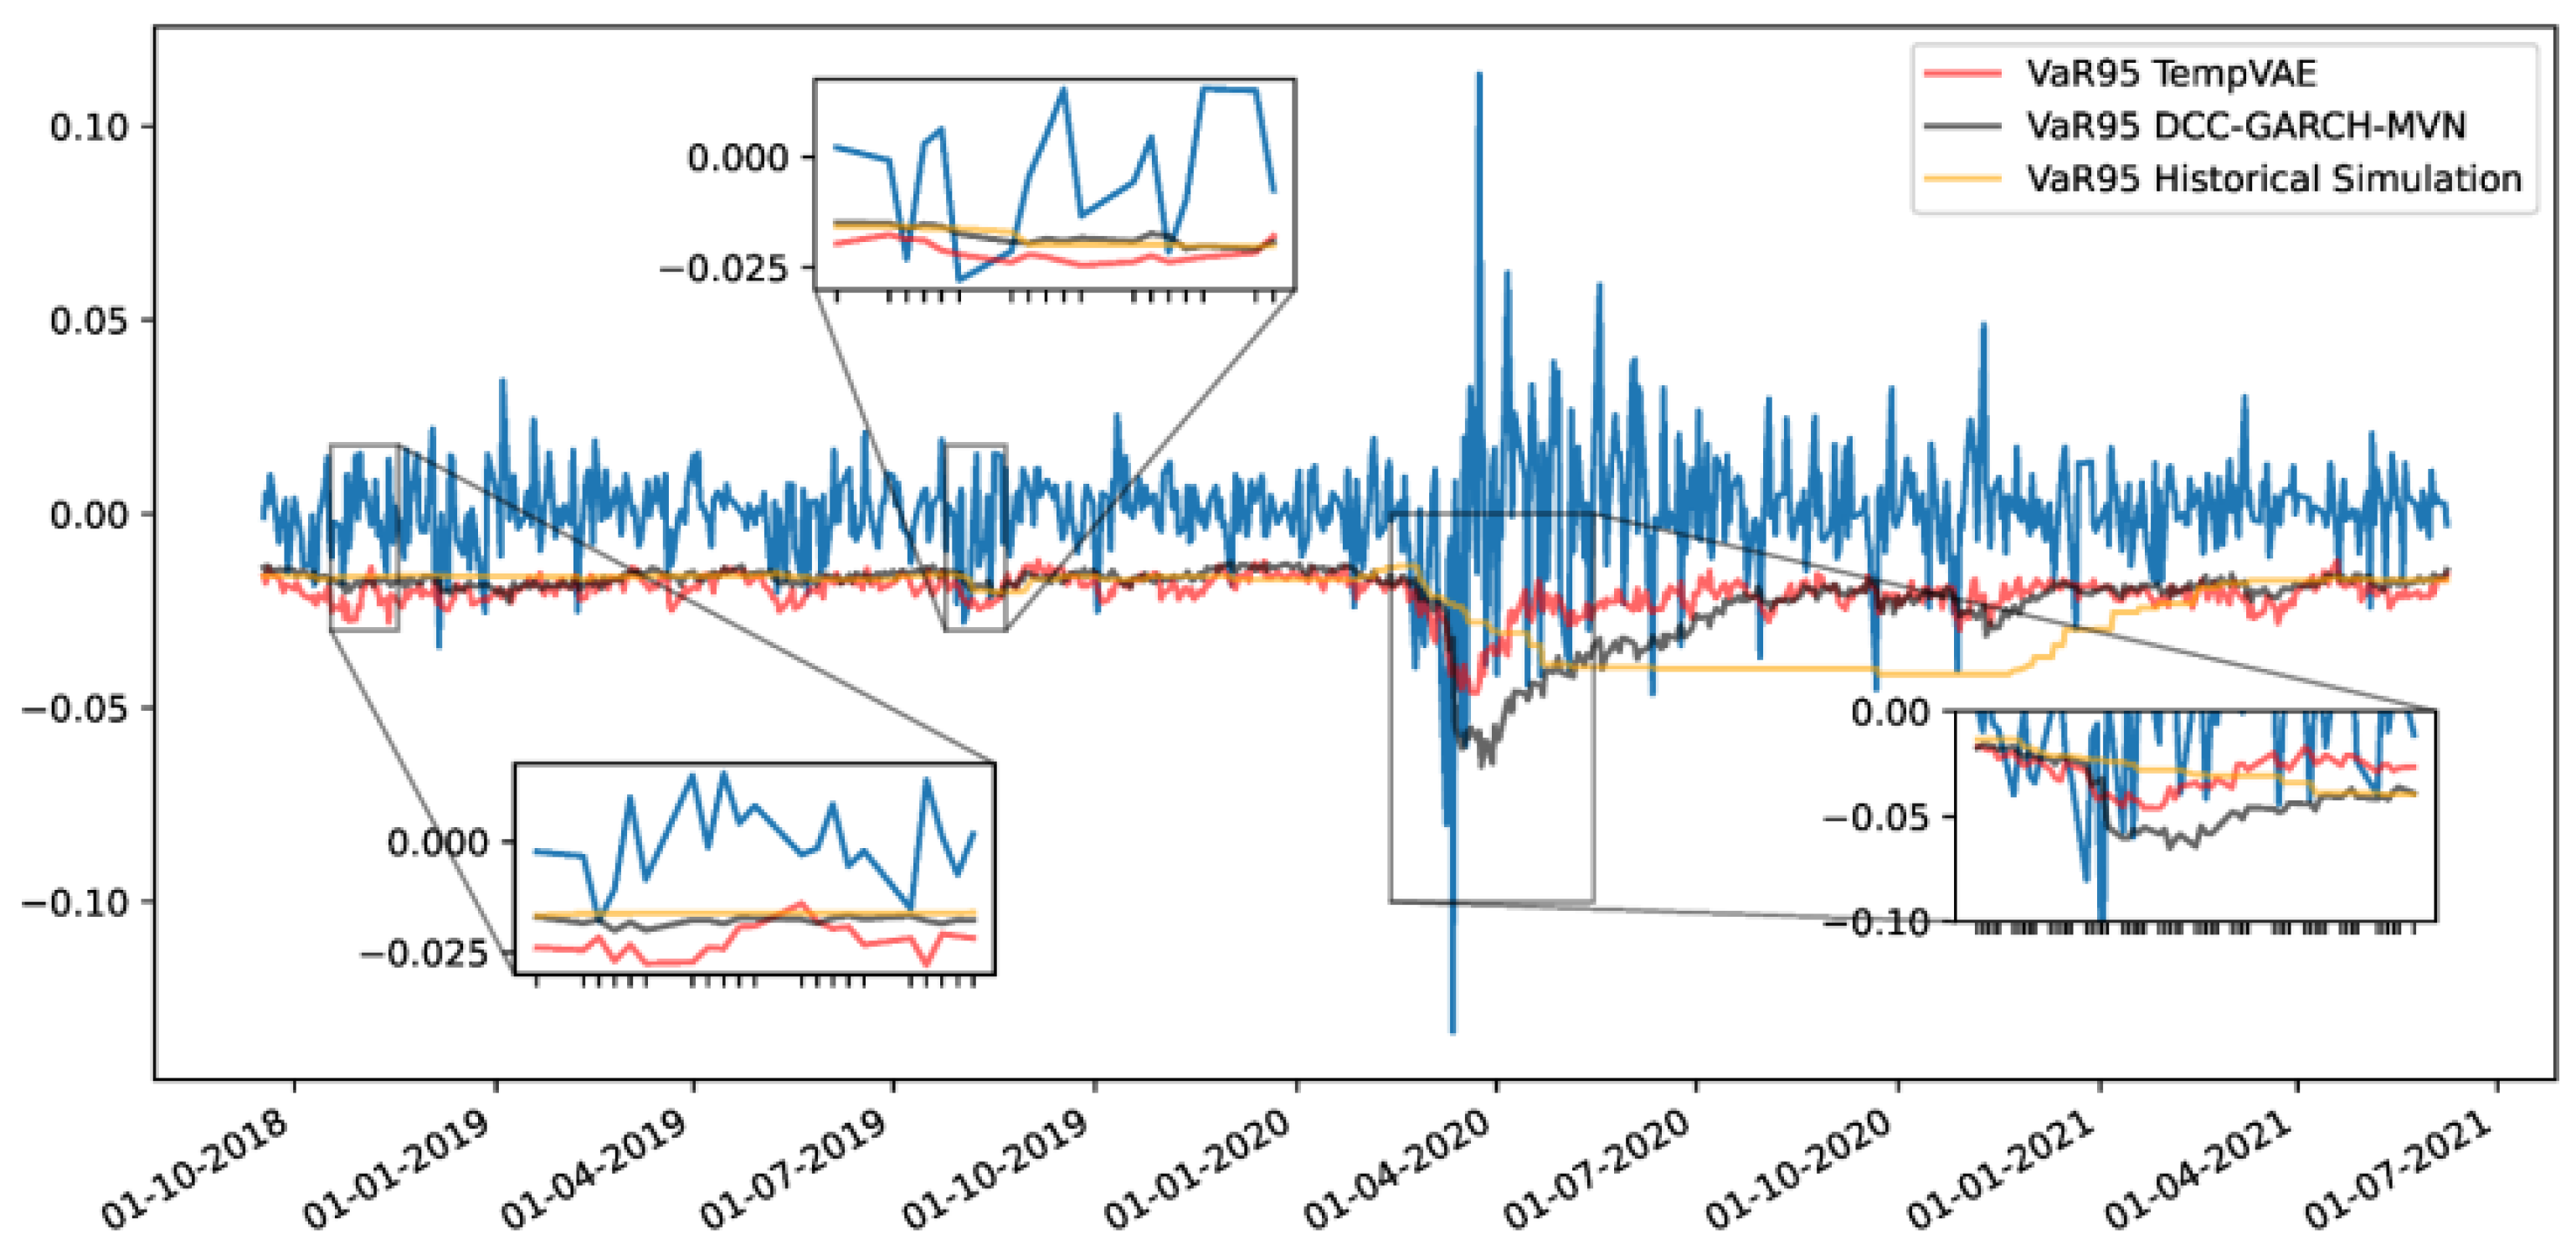
Figure 2.
Performance stability of the VAE–LightGBM model during changing market conditions.
3.3. Robustness Under Market Shifts
A rolling-window evaluation showed that the VAE–LightGBM model maintained stable prediction accuracy during the 2018 trade tension and 2020 pandemic periods, while the PCA–LightGBM model had large deviations in the same windows. The probabilistic representation in the VAE helped capture rare but important market states, ensuring robust forecasts even when volatility surged [20].
3.4. Comparison with Other Hybrid Prediction Methods
Compared with other hybrid or boosting-based financial forecasting systems, It required fewer input variables and reduced computational complexity, making it more suitable for real-time market applications [21]. Unlike sequence-based neural networks that depend on long input series, the current approach separated unsupervised feature extraction from supervised prediction, simplifying deployment. However, the model still relied on daily data; integrating higher-frequency features may further improve short-term accuracy in future work.
4. Conclusions
The VAE–LightGBM model successfully joined nonlinear feature extraction with an efficient boosting method to improve financial volatility prediction. By compressing market data into simple latent factors, the model reduced MAE by 12.1% compared with PCA–LightGBM and showed stable results even in high-uncertainty periods. These outcomes confirm that variational encoding helps capture hidden market patterns that linear methods may miss. The model’s clear structure also makes it suitable for daily trading and risk control because it balances accuracy and computing speed. Still, this study was limited to daily CSI 300 data. Future research should use higher-frequency datasets, add cross-market testing, and include adaptive learning to improve short-term prediction and model flexibility.
References
- Purnomo, E.; Alfiansyah, R. A Dynamic Nexus: Integrating Big Data Analytics and Distributed Computing for Real-Time Risk Management of Derivatives Portfolios. Int. J. Intell. Data Mach. Learn. 2025, 2, 37–44. [Google Scholar]
- Behera, I.; Nanda, P.; Mitra, S.; Kumari, S. Machine Learning Approaches for Forecasting Financial Market Volatility. Mach. Learn. Approaches Financ. Anal. 2024, 431–451. [Google Scholar]
- Yang, J.; Li, Y.; Harper, D.; Clarke, I.; Li, J. Macro Financial Prediction of Cross Border Real Estate Returns Using XGBoost LSTM Models. J. Artif. Intell. Inf. 2025, 2, 113–118. [Google Scholar]
- Kim, J.; Kim, H.; Kim, H.; Lee, D.; Yoon, S. A Comprehensive Survey of Deep Learning for Time Series Forecasting: Architectural Diversity and Open Challenges. arXiv 2024, arXiv:2411.05793. [Google Scholar] [CrossRef]
- Whitmore, J.; Mehra, P.; Yang, J.; Linford, E. Privacy Preserving Risk Modeling Across Financial Institutions via Federated Learning with Adaptive Optimization. Front. Artif. Intell. Res. 2025, 2, 35–43. [Google Scholar] [CrossRef]
- Elias, M. E. (2025). Barbells in Hilbert Space: Nonlinear Risk, Quantum Inference, and the Collapse of Classical Finance. Toward a Post-Gaussian, Non-Ergodic Framework for Risk Management.
- Zhu, W. , & Yang, J. (2025). Causal Assessment of Cross-Border Project Risk Governance and Financial Compliance: A Hierarchical Panel and Survival Analysis Approach Based on H Company's Overseas Projects.
- Stamatopoulos, I. (2025). Extracting market events from limit order book data: a data-driven approach to financial feature engineering (Master's thesis, Πανεπιστήμιο Πειραιώς).
- Wang, J. , & Xiao, Y. (2025). Assessing the Spillover Effects of Marketing Promotions on Credit Risk in Consumer Finance: An Empirical Study Based on AB Testing and Causal Inference.
- Hollmann, N.; Müller, S.; Purucker, L.; Krishnakumar, A.; Körfer, M.; Bin Hoo, S.; Schirrmeister, R.T.; Hutter, F. Accurate predictions on small data with a tabular foundation model. Nature 2025, 637, 319–326. [Google Scholar] [CrossRef] [PubMed]
- Ai, M. (2023, December). Enhancing Realized Volatility Prediction: An Exploration into LightGBM Baseline Models. In International Conference on 3D Imaging Technologies (pp. 179-189). Singapore: Springer Nature Singapore.
- Liu, Z. (2022, January). Stock volatility prediction using LightGBM based algorithm. In 2022 International Conference on Big Data, Information and Computer Network (BDICN) (pp. 283-286). IEEE.
- Alarbi, A.; Khalifa, W.; Alzubi, A. A Hybrid AI Framework for Enhanced Stock Movement Prediction: Integrating ARIMA, RNN, and LightGBM Models. Systems 2025, 13, 162. [Google Scholar] [CrossRef]
- Hu, Q. , Li, X., Li, Z., & Zhang, Y. (2025). Generative AI of Pinecone Vector Retrieval and Retrieval-Augmented Generation Architecture: Financial Data-Driven Intelligent Customer Recommendation System.
- Sultana, N.; Shoha, S.; Dolon, S.A.; Al Shiam, S.A.; Zakaria, R.M.; Shimanto, A.H.; Arefeen, S.M.S.; Abir, S.I. Machine Learning Solutions for Predicting Stock Trends in BRICS amid Global Economic Shifts and Decoding Market Dynamics. J. Econ. Finance Account. Stud. 2024, 6, 84–101. [Google Scholar] [CrossRef]
- Li, S. Momentum, volume and investor sentiment study for u.s. technology sector stocks—A hidden markov model based principal component analysis. PLOS ONE 2025, 20, e0331658. [Google Scholar] [CrossRef] [PubMed]
- Li, T. , Liu, S., Hong, E., & Xia, J. (2025). Human Resource Optimization in the Hospitality Industry Big Data Forecasting and Cross-Cultural Engagement.
- Kubiak, S., Weyde, T., Galkin, O., Philps, D., & Gopal, R. (2024, November). Denoising Diffusion Probabilistic Model for Realistic Financial Correlation Matrices. In Proceedings of the 5th ACM International Conference on AI in Finance (pp. 1-9).
- Kim, H.H.; Swanson, N.R. Forecasting financial and macroeconomic variables using data reduction methods: New empirical evidence. J. Econ. 2014, 178, 352–367. [Google Scholar] [CrossRef]
- Koochali, A.; Tahaei, E.; Dengel, A.; Ahmed, S. VAEneu: a new avenue for VAE application on probabilistic forecasting. Appl. Intell. 2025, 55, 1–23. [Google Scholar] [CrossRef]
- Stuart-Smith, R. , Studebaker, R., Yuan, M., Houser, N., & Liao, J. (2022). Viscera/L: Speculations on an Embodied, Additive and Subtractive Manufactured Architecture. Traits of Postdigital Neobaroque: Pre-Proceedings (PDNB), edited by Marjan Colletti and Laura Winterberg. Innsbruck: Universitat Innsbruck.
Disclaimer/Publisher’s Note: The statements, opinions and data contained in all publications are solely those of the individual author(s) and contributor(s) and not of MDPI and/or the editor(s). MDPI and/or the editor(s) disclaim responsibility for any injury to people or property resulting from any ideas, methods, instructions or products referred to in the content. |
© 2025 by the authors. Licensee MDPI, Basel, Switzerland. This article is an open access article distributed under the terms and conditions of the Creative Commons Attribution (CC BY) license (http://creativecommons.org/licenses/by/4.0/).
Copyright: This open access article is published under a Creative Commons CC BY 4.0 license, which permit the free download, distribution, and reuse, provided that the author and preprint are cited in any reuse.


