
Submitted:
22 November 2025
Posted:
25 November 2025
You are already at the latest version
Abstract
Bridges are critical components of transportation networks, yet limited budgets and aging infrastructure make it challenging for agencies to prioritize inspections and maintenance. This study investigates whether machine learning models trained on publicly available inspection data can reliably predict bridge condition ratings and support data-driven asset management. Using the Federal Highway Administration’s (FHWA) National Bridge Inventory (NBI), we compiled a dataset of bridges in Washington, D.C. from 2019 to 2024 and defined the Lowest Condition Rating (range 3-8) as the target variable, representing the minimum of deck, superstructure, substructure, and culvert ratings. A compact, interpretable feature set was derived from NBI fields, including bridge age, current and projected average daily traffic, structural type, and scour criticality. After data cleaning, normalization, and removal of incomplete records, we trained Random Forest and XGBoost classifiers under a 60/20/20 train-validation-test split repeated across 10 random seeds, with hyperparameters optimized via Optuna. Both models achieved strong and stable performance, but XGBoost consistently outperformed Random Forest, with a mean F1-score of 0.733 and ROC-AUC values for all condition classes exceeded 0.98, indicating near-perfect discriminative ability. Confusion matrices showed that misclassifications were mostly between adjacent rating levels, and XGBoost produced fewer errors for the most deteriorated bridges. Feature importance analysis highlighted bridge age, scour criticality, and traffic loading as the dominant predictors, aligning with established deterioration mechanisms. These results demonstrate that ensemble learning applied to standard NBI data can provide interpretable, high-performing models that help agencies identify vulnerable structures, prioritize inspections, and move toward more proactive bridge management.
Keywords:
national bridge inventory (NBI)
; bridge deterioration modeling
; machine learning
; bridge asset management
; bridge inspection
; XGBoost
; random forest
; optuna optimization
Bridges play a critical role in the transportation network by connecting cities, supporting commerce, and providing essential access across rivers, valleys, and highways. As the bridge infrastructure in the United States continues to age, maintaining these structures has become increasingly difficult and expensive. Out of approximately 623,000 bridges nationwide, 45% have exceeded their planned design life of 50 years and keeping them safe and functional requires constant monitoring and investment (ASCE, 2025). Traditional inspection methods, while necessary, are time-consuming and resource-intensive. This has led researchers and transportation agencies to explore new ways to use data and technology to make inspection and maintenance more efficient and proactive.
Publicly available databases such as the Federal Highway Administration’s National Bridge Inventory contain a wealth of structured data, including bridge age, material type, design characteristics, traffic volumes, and inspection ratings (FHWA, 2023). These data present an opportunity to develop machine learning (ML) models that estimate bridge condition and support more informed decision-making. Maintaining and inspecting bridges is costly: a single comprehensive inspection can cost thousands of dollars, and emergency repairs following unexpected deterioration often require significantly higher expenditures. While bridge failures are relatively rare, their consequences can be severe, resulting in loss of life, economic disruption, and urgent infrastructure replacement, as seen in the 2007 I-35W bridge collapse in Minneapolis. These costs and risks underscore the importance of predictive tools that can help transportation agencies focus limited resources on the structures most likely to deteriorate and prevent costly emergency interventions.
Previous studies have shown that ML can be used to classify damage, detect anomalies, and forecast condition indices for bridge components and systems (Martinez et al., 2020; Sun et al., 2020). However, the quality and consistency of inspection data can vary, and many ML models are difficult for engineers and decision-makers to interpret (Liu & El-Gohary, 2017). Even when models are accurate, their usefulness depends on transparency and practicality for real-world use, particularly in public agencies that must justify investment decisions.
If accurate and reliable predictive models can be built using standard public datasets, they could help agencies prioritize which bridges need repairs first, schedule inspections more efficiently, and avoid costly emergency maintenance. Such models could also support a shift from a reactive approach, where action is taken only after deterioration becomes obvious, to a more predictive approach guided by patterns in the data. This is especially valuable in a context where budgets are constrained, and infrastructure continues to age.
This study focuses on developing and evaluating machine learning models that predict the Lowest Condition Rating of a bridge using only publicly available NBI inspection data. The Lowest Condition Rating is defined as the minimum of the deck, superstructure, substructure, and (where applicable) culvert ratings, restricted here to the range 3-8. The analysis concentrates on two tree-based ensemble algorithms Random Forest and Extreme Gradient Boosting (XGBoost) applied to bridges in Washington, D.C., using a compact set of age, traffic, structural, and scour-related variables. The goals are to (1) assess how accurately these models can classify bridge condition, (2) evaluate their stability across multiple train-test splits, and (3) examine whether the most important predictors identified by the models align with established engineering understanding of bridge deterioration. Through this work, the study contributes to ongoing efforts to integrate interpretable, data-driven tools into everyday bridge maintenance and infrastructure planning.
Literature Review
Bridge deterioration prediction has long been a priority for researchers and agencies responsible for infrastructure management. Over the years, both statistical models and machine learning (ML) approaches have been developed to estimate the condition ratings of critical bridge components such as decks, superstructures, and substructures, as well as overall bridge health. Table 1 summarizes prior research that have used these methods.
Traditional statistical models, including Markov chains, semi-Markov processes, and Weibull-based time-to-failure models, have formed the backbone of early deterioration prediction efforts (Manafpour et al., 2018; Chang et al., 2019; Ilbeigi & Ebrahimi Meimand, 2020;). Markov chains are widely used because they are relatively simple to apply and can efficiently model state transitions where future conditions depend solely on current states. However, their reliance on high-quality data for transition probability matrices and assumptions of constant deterioration rates limits their use in many contexts. Semi-Markov models and Weibull distributions account for variable deterioration rates, but they can become increasingly complex as additional condition states or influencing factors are introduced (Fang & Sun, 2019). Petri nets were also explored for their flexibility, though typically in narrower contexts such as railway bridges (Le & Andrews, 2017).
In recent years, machine learning techniques have gained traction in bridge deterioration modeling. ML approaches offer advantages in handling large datasets and capturing nonlinear relationships that traditional models might miss (Assaad & El-adaway, 2020; Martinez et al., 2020). Both single-model algorithms (e.g., decision trees, k-nearest neighbors, logistic regression, support vector machines, artificial neural networks) and ensemble models (e.g., random forest, gradient boosting, XGBoost) have been applied (Li & Song, 2022; Rajkumar et al., 2023; Rashidi Nasab & Elzarka, 2023). Ensemble methods generally achieve higher accuracy and better handle complex or imbalanced data, while single models are valued for their simplicity and interpretability. Research has shown promise: Li and Song (2022) demonstrated that ensemble models like random forests and XGBoost are effective for predicting bridge deck defects, Rashidi Nasab and Elzarka (2023) found ensemble methods outperformed single models for deck deterioration, and Martinez et al. (2020) showed decision trees outperformed other models for predicting bridge condition indices.
Despite significant progress in bridge deterioration modeling, both statistical and machine learning approaches face limitations. Many existing studies focus on individual components most commonly bridge decks, rather than on an overall measure that combines decks, superstructures, substructures, and culverts using publicly available data such as the NBI. In addition, although feature selection has been explored, much of the work either relies on a large number of input variables or produces models that function as “black boxes,” offering limited insight into how predictions are generated. This lack of transparency can hinder adoption in practice, where engineers and decision-makers must understand and justify why certain bridges are flagged as higher risk.
Feature selection and engineering have emerged as key strategies for improving both predictive performance and model interpretability. The NBI dataset contains more than 130 fields per bridge, yet only a fraction is typically used in modeling. Prior studies have applied techniques such as XGBoost feature importance (Rashidi Nasab & Elzarka, 2023), the Boruta algorithm (Assaad & El-adaway, 2020), heatmap-based selection (Srikanth & Arockiasamy, 2020), and autoencoder-based feature learning (Rajkumar et al., 2023). However, relatively few studies have examined how far a compact, interpretable subset of NBI variables centered on age, traffic exposure, structural type, and scour vulnerability can go in predicting overall bridge condition ratings.
This study addresses that gap by developing and evaluating ensemble machine learning models that predict a composite Lowest Condition Rating for bridges in Washington, D.C. using a small set of NBI-derived features that are already familiar to practitioners. Instead of introducing extensive engineered variables or external environmental datasets, the analysis deliberately focuses on a parsimonious feature set to assess whether high predictive performance and meaningful feature importance can be achieved with information that is readily available and easy to interpret. The results provide a baseline for future work that may incorporate richer environmental and time-dependent features while retaining an emphasis on transparency and practical applicability for bridge asset management.
Methodology
Data Source
The dataset used in this study was taken from the Federal Highway Administration’s (FHWA) National Bridge Inventory (NBI), focusing exclusively on bridges located within Washington, D.C. for inspection years 2019 through 2024. The NBI is a standardized, nationwide repository that includes detailed records for publicly owned bridges, encompassing geometric characteristics, structural properties, traffic information, and various condition ratings assessed during routine inspections.
For the purposes of this research, the NBI provides a consistent and readily accessible basis for examining bridge performance over time in an urban environment with relatively high traffic demands and aging infrastructure. The raw NBI records contain hundreds of variables per bridge, many of which are administrative or redundant for predictive modeling. Consequently, this study focused on a targeted subset of attributes deemed most relevant to structural aging, service demand, and observed condition ratings, as described in the following subsections.
Variable Selection
The primary objective of this study is to predict the Lowest Condition Rating for each bridge, defined as the minimum of the deck, superstructure, substructure, and, where applicable, culvert condition ratings assigned during inspections. These ratings follow the standard NBI condition scale, but for this analysis the target variable was restricted to the range 3-8, thereby excluding bridges in extremely poor or failed condition that are less frequently observed and may be governed by different deterioration dynamics. The resulting variable is treated as a multi-class outcome representing gradations of structural health.
A set of explanatory variables was selected to capture both structural characteristics and operational demands on the bridge. The independent variables included in the modeling are:
- BRIDGE_AGE: computed as the difference between the inspection year and the reconstructed year (or original construction year, if reconstruction year is missing). Formally, “BRIDGE_AGE”=“CURRENT_YEAR”-”YEAR_RECONSTRUCTED_106” where YEAR_RECONSTRUCTED_106 is replaced by YEAR_BUILT_027 when the reconstruction year is not reported.
- ADT_029 (Average Daily Traffic): average number of vehicles crossing the bridge per day, representing current traffic demand.
- FUTURE_ADT_114: projected average daily traffic, which reflects anticipated future loading and potential growth in demand.
- SCOUR_CRITICAL_113: categorical indicator describing the vulnerability of the bridge foundation to scour. This variable captures an important environmental and hydraulic risk factor that can accelerate deterioration.
These variables were selected because they collectively represent a balance of age-related deterioration, demand (traffic loading), and structural configuration, while remaining parsimonious enough to reduce overfitting risk, given the relatively modest sample size for a single jurisdiction.
Data Preprocessing
Prior to model development, the NBI records underwent several preprocessing steps to improve data quality and suitability for machine learning. First, missing values in the reconstruction year field (YEAR_RECONSTRUCTED_106) were imputed using the original construction year (YEAR_BUILT_027). This approach assumes that bridges with no recorded reconstruction have only experienced their original construction, which is consistent with NBI reporting practices. This imputation allowed BRIDGE_AGE to be defined for all bridges in the dataset.
Second, outliers in traffic-related variables (ADT_029 and FUTURE_ADT_114) were identified and treated using the interquartile range (IQR) method. For each traffic variable, the first and third quartiles (Q1 and Q3) were computed, and values lying beyond 1.5 × IQR from these quartiles were considered potential outliers. Extreme outliers that were likely data entry errors were removed from the dataset. Observations with high traffic volumes that were plausible given the urban context were retained, as these may correspond to important, heavily used structures.
Third, the numerical predictors were normalized to reduce skewness and place variables on a comparable scale. Normalization was particularly relevant for BRIDGE_AGE and traffic variables, which operate on substantially different ranges. Normalizing the inputs can help gradient-based optimization and tree-based methods alike by preventing a single variable from dominating due to scale alone.
Fourth, bridges with incomplete or inconsistent inspection records (e.g., missing condition ratings, invalid codes for key structural fields) were removed. This filtering step ensured that the final modeling dataset contained bridges with reliable observations for both the target and predictor variables, reducing noise and potential bias from misreported data.
Fifth, missing values in SCOUR_CRITICAL_113 were imputed as 0, under the assumption that no scour-critical waterway or river was present beneath the substructure.
Experimental Design and Data Partitioning
To evaluate model performance in a manner that mimics real-world predictive use, the cleaned dataset was split into training, validation, and test subsets in a 60/20/20 ratio. The training set was used to fit model parameters, the validation set to guide hyperparameter tuning and model selection, and the held-out test set to provide an unbiased estimate of generalization performance.
Because model performance can be sensitive to the particular random partition of the data, especially in relatively small samples or under class imbalance, this study repeated the partitioning process using 10 different random seeds. For each seed, a new 60/20/20 split was generated while preserving the overall class distribution as much as possible. Models were trained and tuned separately for each seed, and performance metrics were averaged across seeds to obtain more stable estimates and reduce the influence of any single random split.
Model Development
Two tree-based ensemble algorithms were selected for this study: a Random Forest classifier and an Extreme Gradient Boosting (XGBoost) classifier. Both methods are well-suited to tabular engineering data and have been widely used in infrastructure condition assessment and related domains.
The Random Forest algorithm constructs an ensemble of decision trees; each trained on a bootstrap sample of the training data with a random subset of features considered at each split. Individual trees are grown to capture diverse patterns in the data, and predictions are aggregated using majority voting for classification. This strategy typically improves predictive accuracy and reduces variance compared to a single decision tree, while maintaining robustness to overfitting and noise.
The XGBoost classifier is a gradient boosting method that builds an ensemble of trees sequentially. Each new tree is trained to approximate the negative gradient of the loss function with respect to the current model predictions, effectively focusing on the observations that previous trees misclassified. XGBoost incorporates regularization (e.g., penalties on tree complexity and leaf weights) and offers advanced capabilities such as shrinkage (learning rate), subsampling of observations and features, and efficient parallelization. These features often yield strong performance on structured datasets, particularly when hyperparameters are carefully tuned.
Both the Random Forest and XGBoost models were implemented in Python using widely adopted open-source libraries. The same set of features and target variable were used across models to ensure a fair comparison of their predictive capabilities.
Hyperparameter Optimization
Model performance in ensemble methods is strongly influenced by hyperparameter choices, such as tree depth, number of trees, and sampling rates. To systematically explore the hyperparameter space, this study employed Optuna, an open-source, Bayesian optimization framework designed for automated hyperparameter tuning.
For the XGBoost classifier, the tunable hyperparameters included:
- max_depth: maximum depth of individual trees, controlling model complexity
- learning_rate: step size shrinkage used in boosting
- n_estimators: number of boosting rounds (trees)
- subsample: fraction of training instances randomly sampled for each tree
- colsample_bytree: fraction of features randomly sampled for each tree
- reg_lambda: L2 regularization term on leaf weights
For the Random Forest classifier, the optimized hyperparameters were:
- n_estimators: number of trees in the forest
- max_depth: maximum depth of each tree
- min_samples_split: minimum number of samples required to split an internal node
- min_samples_leaf: minimum number of samples required to be at a leaf node
- bootstrap: whether bootstrap sampling is used when building trees
For each model and each random seed, Optuna conducted between 25 and 50 trials, where each trial corresponded to a specific combination of hyperparameters sampled from predefined ranges. The objective function for Optuna was defined as the validation classification accuracy, computed on the 20% validation subset. At the end of the tuning process for a given seed, the hyperparameter configuration that produced the highest validation accuracy was selected, and the corresponding model was then evaluated on the held-out test set. Averaging performance across seeds yielded the final reported metrics.
Evaluation Metrics
Because the distribution of condition ratings is imbalanced, some ratings are more frequent than others and accuracy alone was insufficient to evaluate model performance. A model that simply favors the majority class could obtain a high accuracy without offering meaningful predictive value for less frequent, but practically important, conditions. Therefore, in addition to overall accuracy, this study reports the following metrics:
- Precision: the proportion of predicted positive instances that are truly positive, indicating how often the model’s positive predictions are correct.
- Recall (or sensitivity): the proportion of actual positive instances that the model correctly identifies, capturing the model’s ability to detect bridges in each condition category.
- F1-score: the harmonic mean of precision and recall, which balances the trade-off between false positives and false negatives and is particularly useful under class imbalance.
- Receiver Operating Characteristic-Area Under the Curve (ROC-AUC): for multi-class settings, macro- or micro-averaged ROC-AUC scores were computed to assess the model’s ability to distinguish between condition categories. Values closer to 1.0 indicate stronger discriminative capability.
By considering this set of complementary metrics, the evaluation framework provides a more nuanced view of model performance, emphasizing not only overall correctness but also the model’s effectiveness in identifying bridges across the range of condition states. This is particularly important for supporting maintenance decision-making, where misclassifying deteriorated bridges can have significant safety and cost implications.
Results
Descriptive Statistics and Class Distribution
The final dataset consisted of bridges in Washington, D.C. with complete records for the selected predictors and the Lowest Condition Rating target (restricted to the range 3-8). As described in the methodology, BRIDGE_AGE, ADT_029, and FUTURE_ADT_114 exhibited substantial variation, reflecting differences in age and traffic demand across the network. Older bridges and those carrying higher daily and projected traffic volumes are well represented, which is consistent with the urban context. The frequency distribution of the Lowest Condition Rating is uneven, with mid-range ratings occurring more frequently than very low or very high ratings. This imbalance reinforces the need to look beyond accuracy alone and to consider F1-scores and ROC-AUC when evaluating classification performance.
Model Performance
Both the Random Forest and XGBoost classifiers were evaluated across 10 different random train-validation-test splits, using the experimental design outlined in Methodology section. For each split, hyperparameters were tuned using Optuna, and the best-performing configuration was then assessed on the held-out test set.
Table 2 summarizes the mean F1-score, mean accuracy, and standard deviation of the F1-score across the 10 seeds for each model. The XGBoost classifier achieved a mean F1-score of 0.733 and a mean accuracy of 0.861, with a standard deviation of 0.057 on the F1-score. In comparison, the Random Forest classifier obtained a mean F1-score of 0.678 and a mean accuracy of 0.848, with a standard deviation of 0.050 on the F1-score.
These results indicate that XGBoost consistently outperformed Random Forest in both overall accuracy and F1-score, suggesting better generalization across condition rating classes. The relatively small standard deviations for both models show that performance is stable with respect to the random train-test partitioning and not overly sensitive to a particular split of the data.
ROC-AUC and Class-Wise Discrimination
To further assess the ability of the models to distinguish between condition categories, one-vs-rest ROC-AUC values were computed for each rating level from 3 to 8. The results are summarized in Table 3.
Figure 1.
One-vs-rest ROC curves for both models for each Condition Rating.
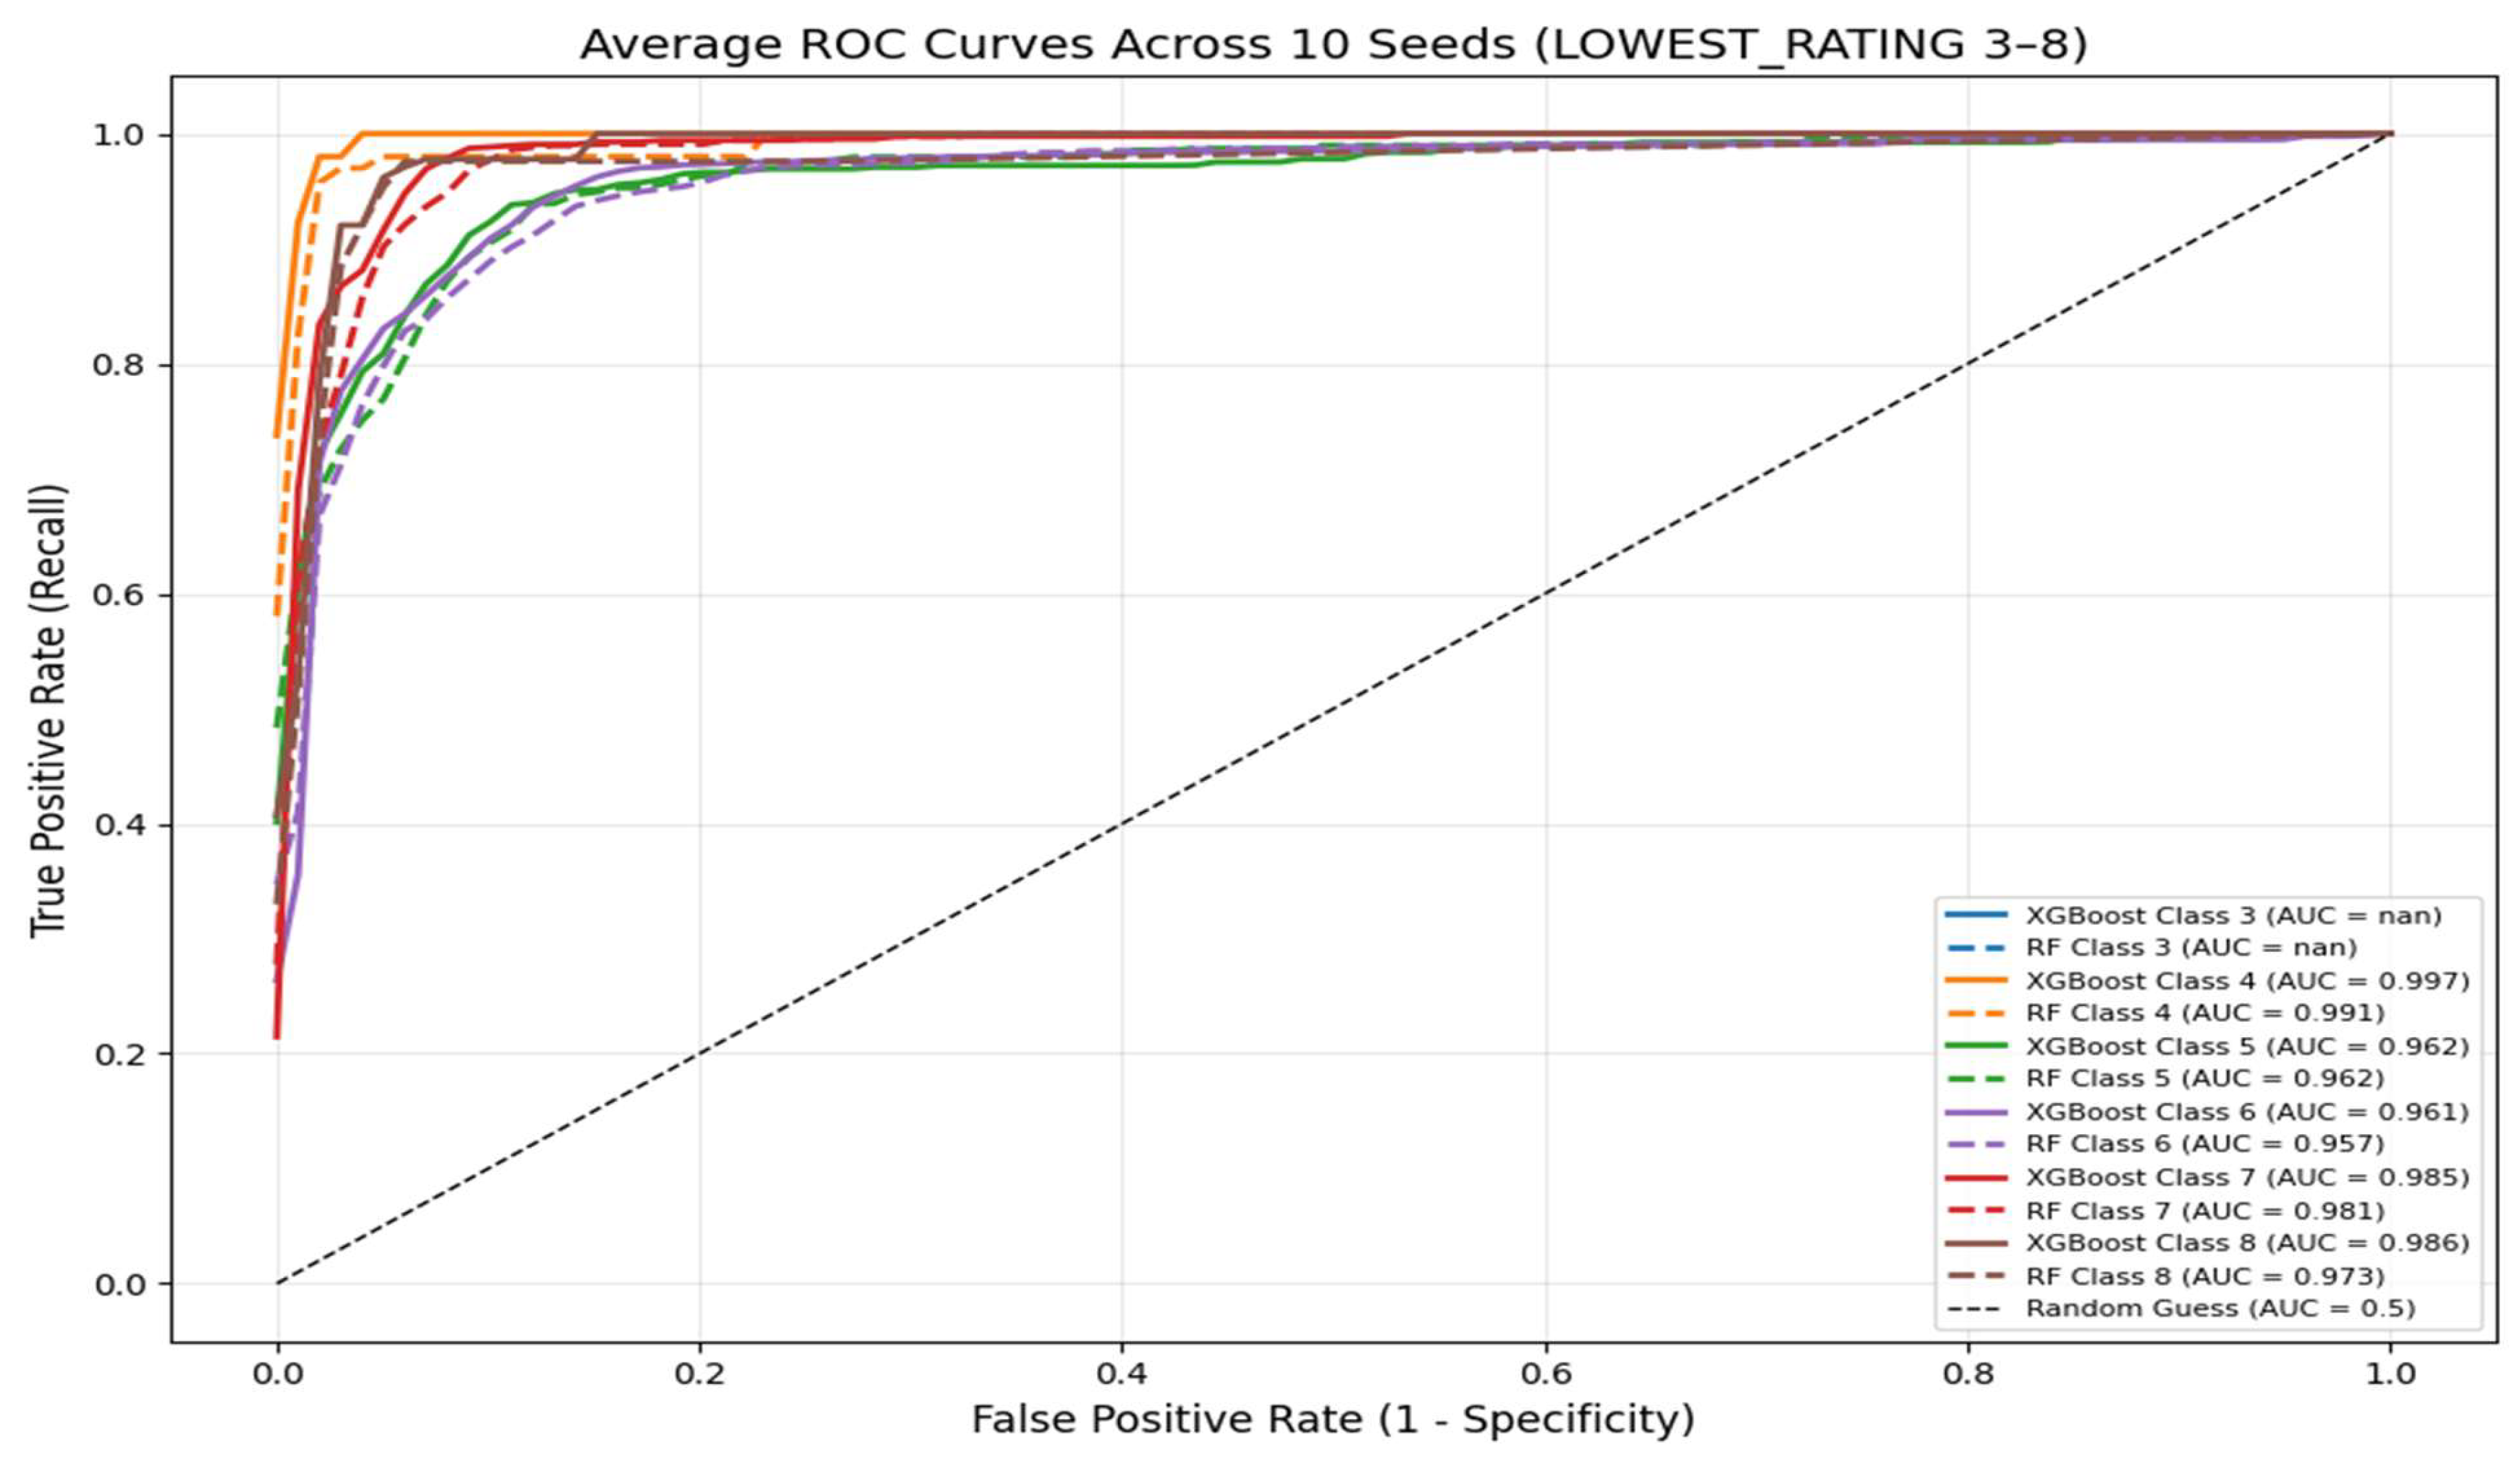
For the XGBoost classifier, the one-vs-rest ROC–AUC values ranged from 0.961 to 0.997 across the five condition categories with reported AUCs (ratings 4–8), as shown in Table 3. Condition rating 3 is extremely rare in the Washington, D.C. dataset, and several test splits contained no bridges with this rating; therefore, the one-vs-rest ROC–AUC for class 3 is undefined and is not reported. The Random Forest model produced very similar values, with ROC–AUCs between 0.957 and 0.991. Importantly, all reported AUC values exceeded 0.96 for both models, as illustrated in Figure X, indicating that each classifier has near-perfect discriminative ability in the one-vs-rest framework.
Although the differences are numerically small, XGBoost maintained a consistent edge over Random Forest across all rating categories, with slightly higher AUC values for every class. This pattern reinforces the conclusion that XGBoost provides marginally stronger class separation while preserving overall stability.
Confusion Matrix Analysis
Confusion matrices were generated for both models and averaged across the 10 test splits to better understand error patterns. In both cases, the matrices exhibited a strong diagonal structure, indicating that the majority of predictions fell on the correct condition rating class.
When misclassifications occurred, they were primarily between adjacent rating levels, such as predicting a 5 instead of a 6, rather than between widely separated classes. This behavior is consistent with the ordinal nature of condition ratings and suggests that the models capture the general deterioration gradient even when they do not always identify the exact level.
The XGBoost classifier showed fewer misclassifications among the more extreme condition ratings, particularly at the lower end of the scale as shown in Figure 2. This suggests slightly better calibration in distinguishing bridges at the tails of the condition distribution, which is valuable from a management perspective, as misclassifying the most deteriorated bridges can have the greatest safety implications.
Feature Importance and Interpretability
Feature importance was examined using the XGBoost model, which achieved the best overall performance. As illustrated in Figure 3 the four most influential predictors and their normalized importance values were: Bridge Age - 0.34; Current Average Daily Traffic (ADT_029) - 0.26; Future Average Daily Traffic (FUTURE_ADT_114) - 0.25; Scour Criticality (SCOUR_CRITICAL_113) - 0.15
These rankings indicate that BRIDGE_AGE is the dominant factor in predicting the Lowest Condition Rating, followed by variables capturing traffic loading, both current and projected. and environmental vulnerability (scour). The relative importance of these features is highly consistent with engineering expectations: older bridges, those exposed to higher traffic volumes, and those with greater susceptibility to scour are more likely to experience deterioration and receive lower condition ratings.
The fact that the model’s most influential features align with well-understood deterioration drivers enhances the interpretability and credibility of the results. Rather than relying on obscure or unintuitive predictors, the model emphasizes variables that transportation agencies already monitor and use in decision-making, which supports the potential integration of such models into existing asset management workflows.
Summary of Findings
In summary, the experimental results show that both Random Forest and XGBoost can effectively classify bridge condition ratings using a compact set of NBI-derived features. XGBoost consistently provided higher mean F1-scores and accuracy, along with slightly superior ROC-AUC performance across all condition categories and fewer misclassifications of extreme ratings. Feature importance analysis further demonstrated that the models rely on age, traffic exposure, and scour criticality—factors that are both intuitively and practically meaningful for bridge management. These findings provide a solid empirical foundation for the subsequent discussion of how such models can complement existing inspection practices and inform maintenance prioritization.
Discussion
The results of this study confirm that ensemble learning is an effective approach for bridge condition prediction using a compact set of NBI-derived variables. Both Random Forest and XGBoost achieved strong and stable performance across 10 random seeds, with XGBoost consistently outperforming Random Forest in terms of mean F1-score, accuracy, and ROC-AUC. The XGBoost classifier reached a mean F1-score of 0.733 and accuracy of 0.861, compared to 0.678 and 0.848 for Random Forest, respectively. In addition, both models achieved ROC-AUC values above 0.98 for all condition categories, indicating near-perfect class separability in a one-vs-rest setting.
From a methodological perspective, XGBoost’s advantage is consistent with its underlying design. Its gradient boosting process builds trees sequentially, allowing each new tree to focus on correcting the residual errors of previous trees. This often results in smoother probability estimates and more refined decision boundaries than those produced by bagging-based methods. Furthermore, XGBoost’s regularization mechanisms (e.g., penalties on tree complexity, learning rate control, subsampling) help mitigate overfitting, which likely explains the model’s slightly superior generalization compared to Random Forest, even under repeated train-test splits.
The confusion matrix analysis provides additional insight into the nature of these improvements. Both models displayed strong diagonal patterns, confirming that most bridges were assigned to their correct condition rating. Misclassifications were typically between adjacent rating levels (e.g., 5 predicted as 6), rather than between distant classes. This behavior aligns with the ordinal structure of the target variable and indicates that the models capture the underlying deterioration gradient even when they do not always predict the exact rating. Notably, XGBoost misclassified fewer extreme cases, particularly at the low end of the condition spectrum, suggesting better calibration for identifying bridges that may warrant closer scrutiny from a safety or maintenance perspective.
From a practical standpoint, these findings suggest that integrating machine learning models into infrastructure asset management could streamline maintenance planning and prioritization. A model that can reliably distinguish between different condition states and highlight bridges at higher risk of deterioration can support proactive interventions, potentially reducing lifecycle costs and the likelihood of unexpected failures. Rather than replacing traditional inspections, such models can serve as a screening tool, helping agencies allocate limited inspection and rehabilitation resources more efficiently.
Model interpretability further enhances their potential value for practice. The feature importance analysis for XGBoost revealed that the most influential predictors were bridge age, traffic-related variables (current and future ADT), and scour. This ranking is entirely consistent with well-established deterioration mechanisms: older bridges and those exposed to heavier traffic and adverse hydraulic conditions are more likely to exhibit distress and receive lower condition ratings. In this sense, the models do not simply learn statistical patterns in isolation; they recover relationships that align with engineering understanding of long-term wear, fatigue, and environmental stress. This consistency between data-driven results and domain knowledge increases the likelihood that practitioners will trust and adopt such models in real-world decision-making.
Limitations
Despite the encouraging results, several limitations of this study should be acknowledged. First, the dataset is limited to bridges in Washington, D.C., a single urban jurisdiction. As a result, the models may not fully capture the geographic or climatic variability present in other regions, such as freeze-thaw cycles, coastal environments, or rural networks with different traffic patterns. Extending the analysis to multiple states or climate zones would be necessary to assess generalizability.
Second, although age, traffic, and scour variables were included, several environmental factors such as exposure to de-icing chemicals, temperature fluctuations, humidity, or corrosive marine environments were not explicitly modeled due to data unavailability. These factors are known to influence deterioration and could help explain additional variance in condition ratings if reliable data were available.
Third, bridge inspection ratings inherently contain a degree of human subjectivity and variability. Differences in inspector judgment, experience, and interpretation of rating guidelines can introduce noise into the target variable, potentially limiting the maximum achievable model performance. While ensemble methods are relatively robust to noisy labels, this remains an underlying constraint.
Finally, the models developed in this study predict current condition ratings based on snapshot data but do not directly estimate future deterioration rates or remaining service life. As such, the models are best viewed as tools for assessing present condition and risk, rather than full deterioration forecasting tools. Addressing temporal dynamics would require time-series or panel data models that explicitly capture changes in condition over multiple inspection cycles.
Conclusion and Future Work
This study demonstrated that ensemble machine learning methods specifically Random Forest and XGBoost can effectively predict the Lowest Condition Rating of bridges in Washington, D.C. using a small, interpretable set of NBI-derived features related to age, traffic, structural type, and scour vulnerability. After systematic preprocessing, repeated train-validation-test partitioning, and hyperparameter optimization with Optuna, both models exhibited high and stable performance.
The XGBoost classifier emerged as the best-performing model, achieving higher mean F1-score and accuracy than Random Forest, while both models exhibited ROC-AUC values above 0.98 across all condition classes. Confusion matrix analysis showed that most errors involved misclassifying bridges into neighboring rating levels, and XGBoost misclassified fewer extreme cases, suggesting better calibration for identifying bridges at the tails of the condition distribution. Feature importance results highlighted bridge age, traffic variables and scour criticality as the dominant predictors, reinforcing established deterioration mechanisms and lending strong interpretability to the model’s behavior.
Taken together, these results indicate that ensemble learning, and XGBoost in particular, offers a promising data-driven framework for supporting bridge condition assessment at the network level. By leveraging existing NBI data, such models can help transportation agencies identify potentially vulnerable structures, prioritize inspections, and plan maintenance activities more proactively, all while remaining grounded in familiar engineering concepts.
Future Work
Building on the findings and limitations of this study, several directions for future research are recommended:
- Broader Spatial and Environmental Coverage: Future work should extend the analysis to multiple states and diverse climate zones, incorporating environmental exposure variables such as de-icing practices, temperature extremes, precipitation, and corrosion-related factors where available. This would help determine whether the patterns observed in Washington, D.C. hold across different contexts and improve model robustness.
- Time-Dependent Deterioration Modeling: The current models predict a single, current condition rating. A natural extension is to develop time-dependent models that forecast future ratings or deterioration trajectories. Approaches could include recurrent neural networks (RNNs), temporal gradient boosting models, or hybrid machine learning-survival analysis frameworks that exploit repeated inspection records over time.
- Explainable AI for Complex Interactions: While feature importance offers a global view, future studies could explore more advanced explainable AI (XAI) techniques such as SHAP values or partial dependence plots, to better understand complex feature interactions and local explanations for individual predictions. This would provide deeper insights into why specific bridges are flagged as higher risk and further support practitioner confidence.
- Integration with Bridge Management Systems: Finally, successful deployment will require collaboration with civil engineers and agency staff to integrate model outputs into existing bridge management workflows. Future work should investigate user-friendly interfaces, reporting formats, and decision rules for using model predictions to trigger inspections or rehabilitation actions. Pilot implementations with feedback from practitioners would be especially valuable for refining the models and aligning them with policy and operational constraints.
In summary, this study provides an initial, focused demonstration that ensemble machine learning models, trained on a compact and interpretable feature set, can meaningfully support bridge condition assessment. Expanding the spatial scope, enriching the feature space, modeling deterioration over time, and embedding these tools in practice-oriented systems represent promising pathways for future research and application.
References
- AASHTO. (2018). The manual for bridge evaluation (3rd ed.). American Association of State Highway and Transportation Officials.
- Aktan, A. E., Farhey, D. N., Brown, D. L., Dalal, V., Helmicki, A. J., Hunt, V. J., & Shelley, S. J. (1996). Condition assessment for bridge management. Journal of Infrastructure Systems, 2(3), 108-117. [CrossRef]
- American Society of Civil Engineers. (2025). 2025 report card for America’s infrastructure: Bridges. Available online: https://infrastructurereportcard.org/cat-item/bridges/.
- Assaad, R., & El-adaway, I. H. (2020). Bridge infrastructure asset management system: Comparative computational machine learning approach for evaluating and predicting deck deterioration conditions. Journal of Infrastructure Systems, 26(3), 04020032. [CrossRef]
- Chang, M., Maguire, M., & Sun, Y. (2019). Stochastic modeling of bridge deterioration using classification tree and logistic regression. Journal of Infrastructure Systems, 25(1), 04018041. [CrossRef]
- Fang, J., Hu, J., Elzarka, H., Zhao, H., & Gao, C. (2023). An improved inspection process and machine-learning-assisted bridge condition prediction model. Buildings, 13(10), 2459. [CrossRef]
- Fang, Y., & Sun, L. (2019). Developing a semi-Markov process model for bridge deterioration prediction in Shanghai. Sustainability, 11(19), 5524. [CrossRef]
- Federal Highway Administration. National Bridge Inventory data. U.S. Department of Transportation. Available online: https://www.fhwa.dot.gov/bridge/nbi.cfm.
- Ilbeigi, M., & Meimand, M. E. (2020). Statistical forecasting of bridge deterioration conditions. Journal of Performance of Constructed Facilities, 34(1), 04019104. [CrossRef]
- Le, B., Andrews, J., & Fecarotti, C. (2017). A Petri net model for railway bridge maintenance. Proceedings of the Institution of Mechanical Engineers, Part O: Journal of Risk and Reliability, 231(3), 306-323. [CrossRef]
- Li, Q., & Song, Z. (2022). Ensemble-learning-based prediction of steel bridge deck defect condition. Applied Sciences, 12(11), 5442. [CrossRef]
- Liu, K. , & El-Gohary, N. (2017). Ontology-based semi-supervised conditional random fields for automated information extraction from bridge inspection reports. Automation in Construction, 81, 313-327. [CrossRef]
- Manafpour, A., Guler, I., Radlińska, A., Rajabipour, F., & Warn, G. (2018). Stochastic analysis and time-based modeling of concrete bridge deck deterioration. Journal of Bridge Engineering, 23(9), 04018066. [CrossRef]
- Martinez, P., Mohamed, E., Mohsen, O., & Mohamed, Y. (2020). Comparative study of data mining models for prediction of bridge future conditions. Journal of Performance of Constructed Facilities, 34(1), 04019108. [CrossRef]
- Mia, M. M., & Kameshwar, S. (2023). Machine learning approach for predicting bridge components’ condition ratings. Frontiers in Built Environment, 9, 1254269. [CrossRef]
- Nguyen, T. T., & Dinh, K. (2019). Prediction of bridge deck condition rating based on artificial neural networks. Journal of Science and Technology in Civil Engineering (JSTCE) - HUCE, 13(3), 15-25. [CrossRef]
- Omar, A., & Moselhi, O. (2022). Hybrid feature selection framework for predicting bridge deck conditions. Journal of Information Technology in Construction, 27, 901-923. [CrossRef]
- Rajkumar, M., Nagarajan, S., & Arockiasamy, M. (2023). Bridge infrastructure management system: Autoencoder approach for predicting bridge condition ratings. Journal of Infrastructure Systems, 29(1), 04022042. [CrossRef]
- Rashidi Nasab, A., & Elzarka, H. (2023). Optimizing machine learning algorithms for improving prediction of bridge deck deterioration: A case study of Ohio bridges. Buildings, 13(6), 1517. [CrossRef]
- Shahrivar, F., Sidiq, A., Mahmoodian, M., Jayasinghe, S., & Sun, Z. (2025). AI-based bridge maintenance management: A comprehensive review. Artificial Intelligence Review, 58, Article 135. [CrossRef]
- Sowemimo, A. D., Chorzepa, M. G., & Birgisson, B. (2024). Recurrent neural network for quantitative time series predictions of bridge condition ratings. Infrastructures, 9(12), 221. [CrossRef]
- Srikanth, I., & Arockiasamy, M. (2020). Deterioration models for prediction of remaining useful life of timber and concrete bridges: A review. Journal of Traffic and Transportation Engineering (English Edition), 7(2), 152-173. [CrossRef]
- Sun, L., Shang, Z., Xia, Y., Bhowmick, S., & Nagarajaiah, S. (2020). Review of bridge structural health monitoring aided by big data and artificial intelligence: From condition assessment to damage detection. Journal of Structural Engineering, 146(5), 04020073. [CrossRef]
Figure 2.
Confusion matrices for the XGBoost and Random Forest classifiers.
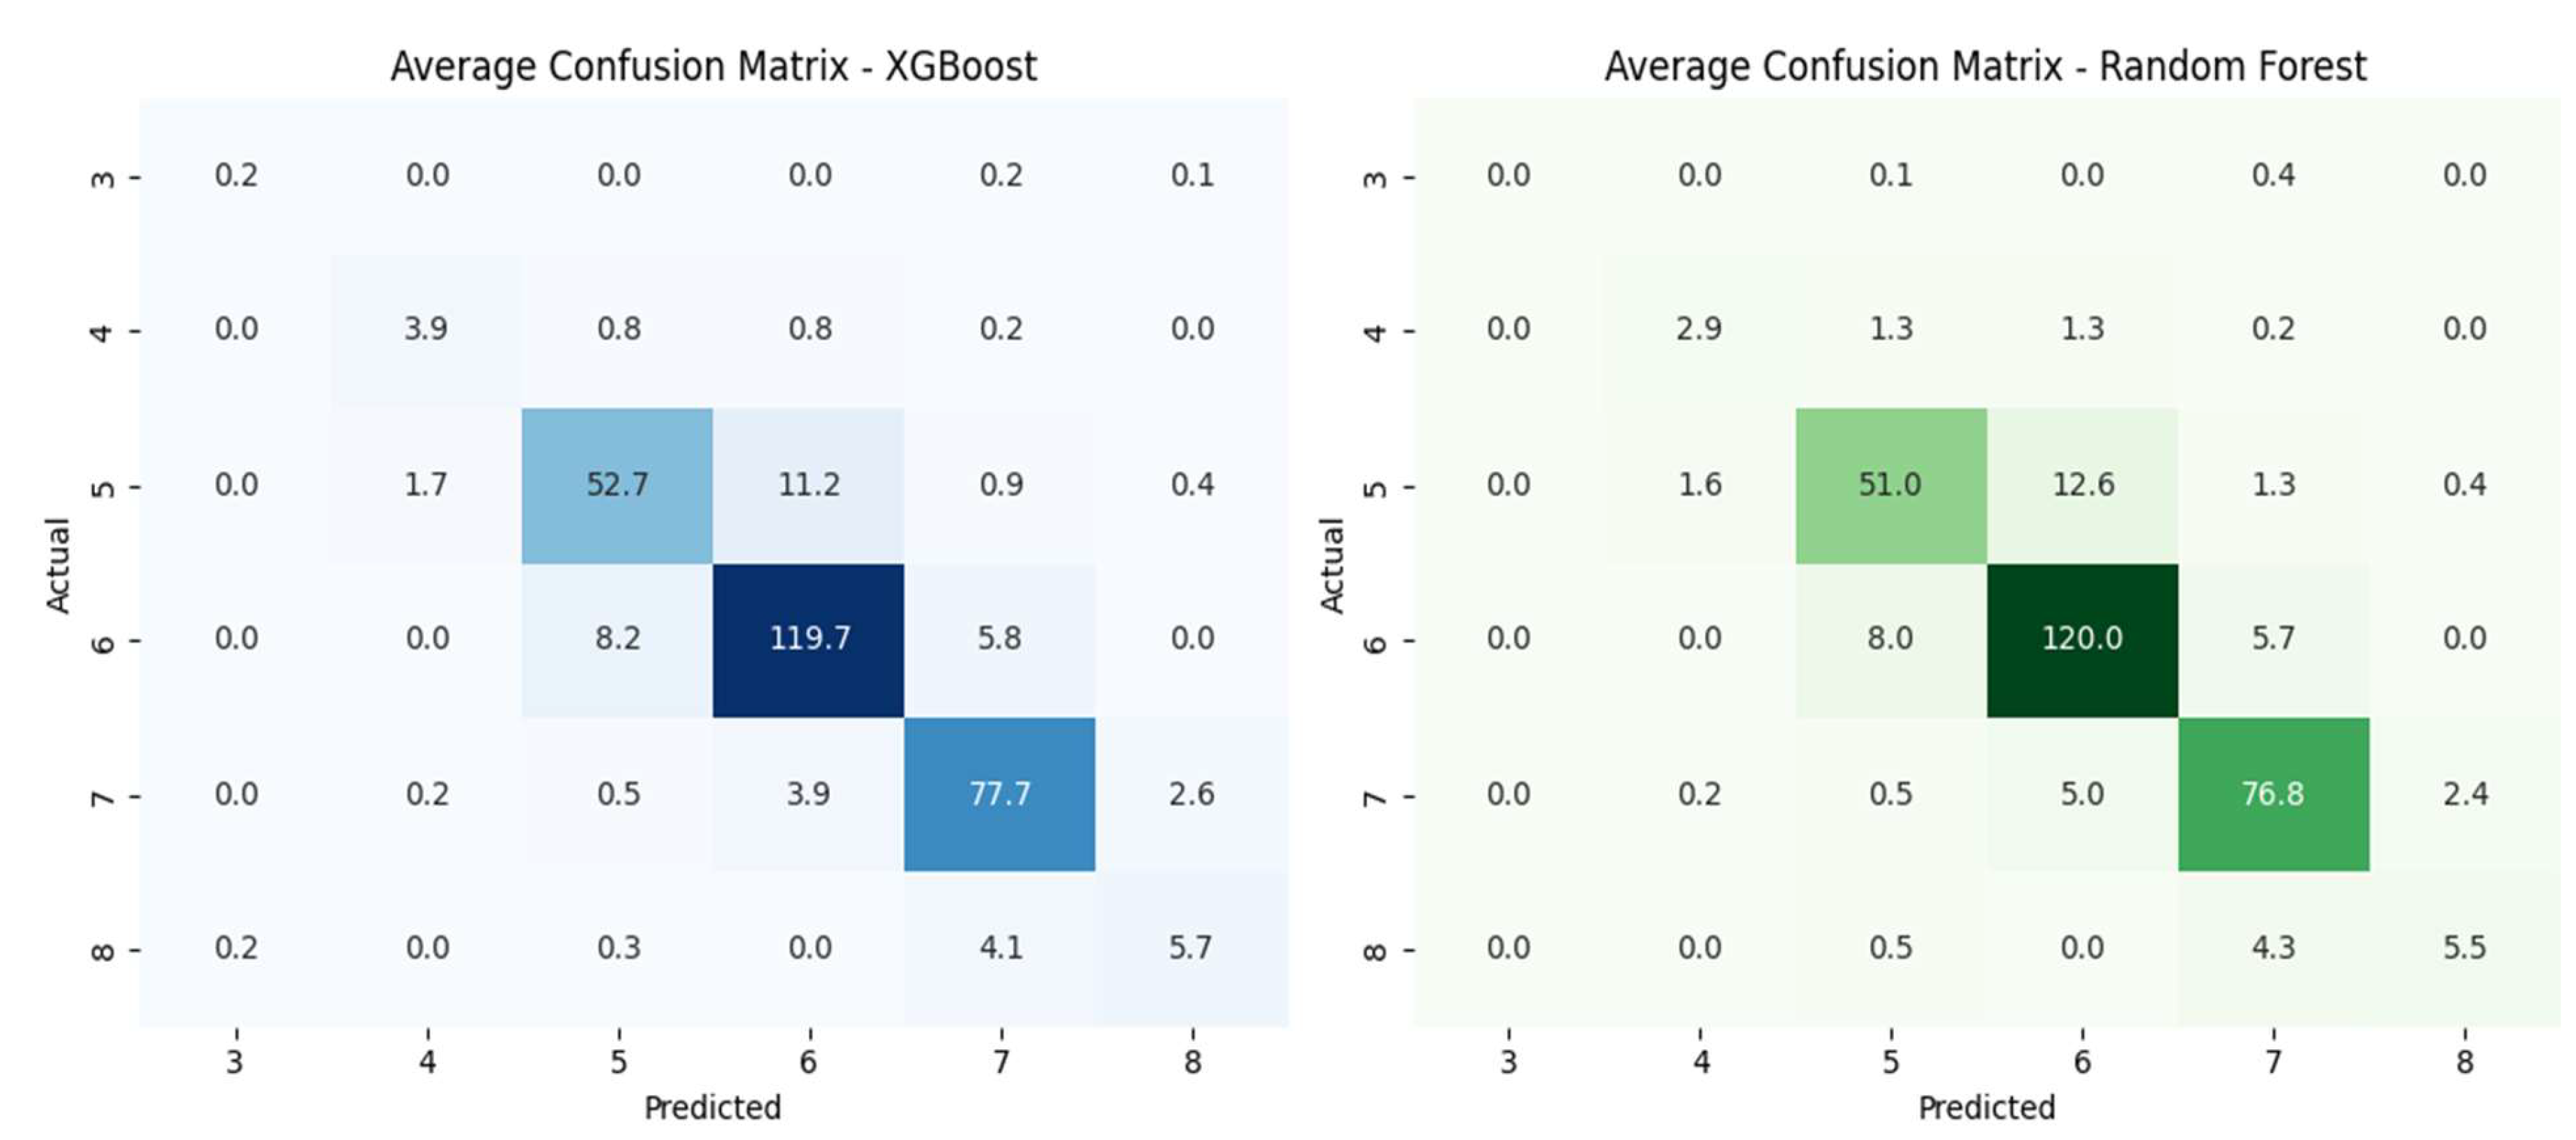
Figure 3.
Feature Importance scores for the XGBoost and Random Forest model.
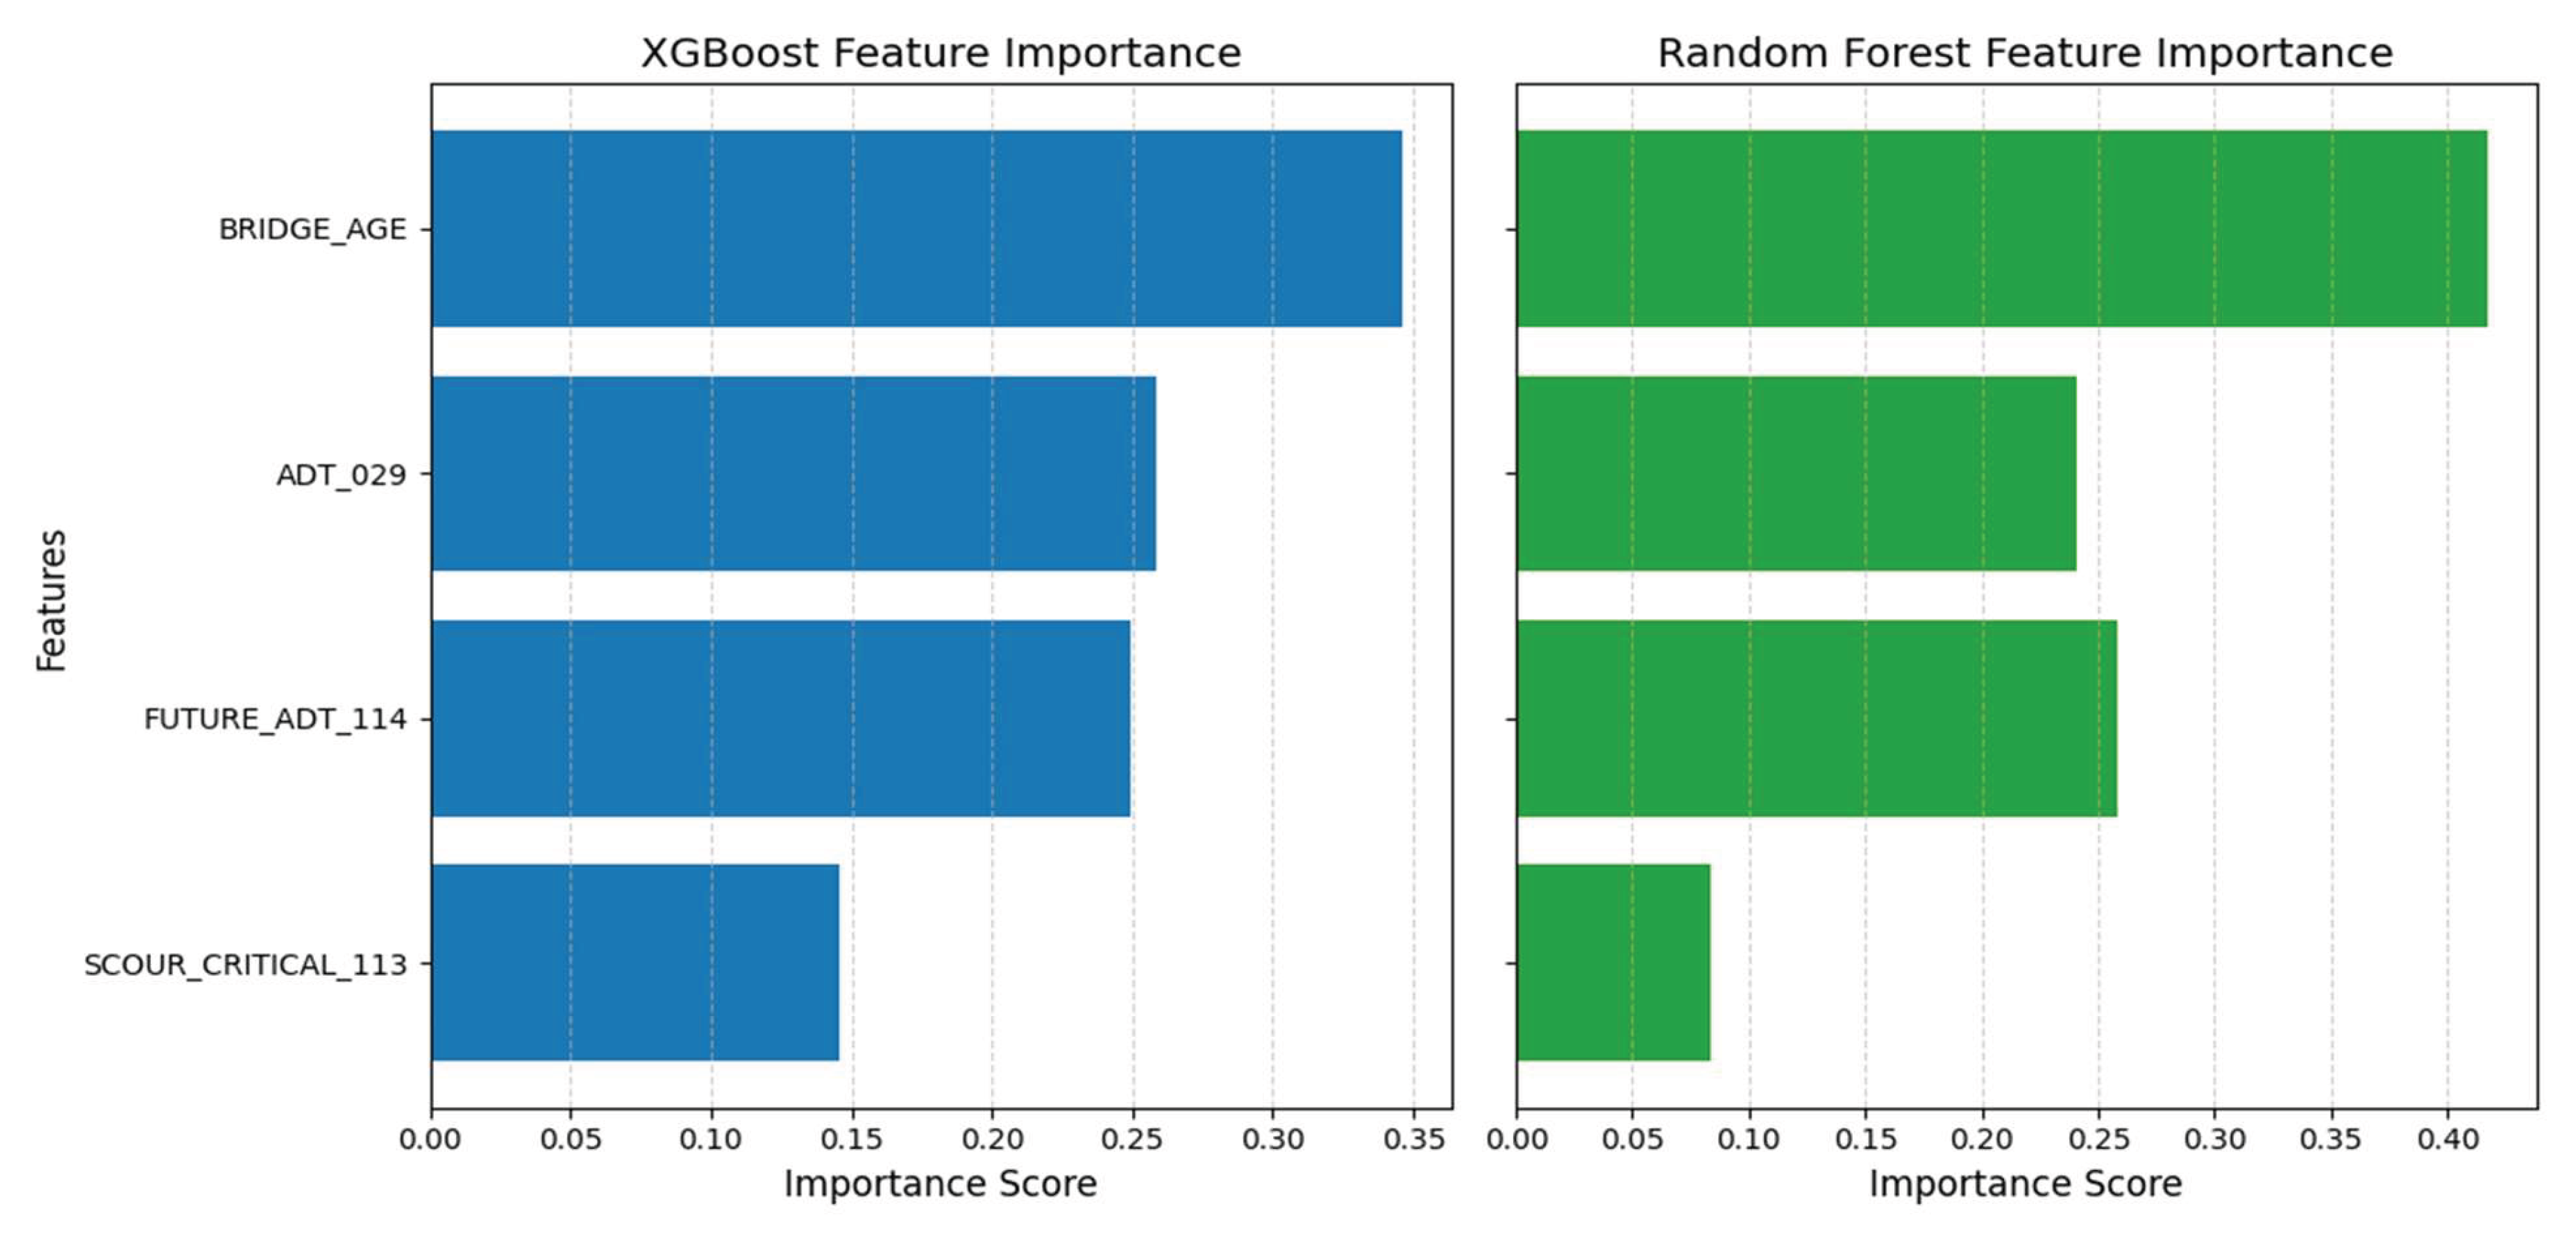

Table 1.
Summary of selected studies on bridge condition modeling.
| Author | Year | ML-Based | Statistical | Focus |
| Manafpour et al. | 2018 | X | Concrete deck deterioration | |
| Chang et al. | 2018 | X | Bridge deterioration modeling | |
| Srikanth & Arockiasamy | 2019 | X | Remaining life prediction | |
| Nguyen & Dinh | 2019 | X | Predict deck conditions | |
| Fang & Sun | 2019 | X | Time-dependent transition probabilities | |
| Ilbeigi et al. | 2020 | X | Predict deterioration | |
| Martinez et al. | 2020 | X | Predict future conditions | |
| Assaad & El-adaway | 2020 | X | Predict deck deterioration | |
| Li & Song | 2022 | X | Predict deck defects | |
| Rajkumar et al. | 2023 | X | Predict multiple components | |
| Rashidi Nasab & Elzarka | 2023 | X | Predict deck deterioration |
Table 2.
Average test performance of Random Forest and XGBoost across 10 random seeds.
| Model | Mean F1-score | Mean Accuracy | SD F1-score |
| XGBoost | 0.733 | 0.861 | 0.057 |
| Random Forest | 0.678 | 0.848 | 0.050 |
Table 3.
One-vs-rest ROC-AUC values for each Condition rating (3-8).
| Condition Rating | XGBoost ROC-AUC | Random Forest ROC-AUC |
| 3 | nan | nan |
| 4 | 0.997 | 0.991 |
| 5 | 0.962 | 0.962 |
| 6 | 0.961 | 0.957 |
| 7 | 0.985 | 0.981 |
| 8 | 0.986 | 0.973 |
Disclaimer/Publisher’s Note: The statements, opinions and data contained in all publications are solely those of the individual author(s) and contributor(s) and not of MDPI and/or the editor(s). MDPI and/or the editor(s) disclaim responsibility for any injury to people or property resulting from any ideas, methods, instructions or products referred to in the content. |
© 2025 by the authors. Licensee MDPI, Basel, Switzerland. This article is an open access article distributed under the terms and conditions of the Creative Commons Attribution (CC BY) license (http://creativecommons.org/licenses/by/4.0/).
Copyright: This open access article is published under a Creative Commons CC BY 4.0 license, which permit the free download, distribution, and reuse, provided that the author and preprint are cited in any reuse.


