Submitted:
21 November 2025
Posted:
24 November 2025
Read the latest preprint version here
Abstract
Lightweight gearbox housings often raise NVH risk, yet full finite-element evaluations are too slow for early design screening. This study tests whether a few frequency-band descriptors of radiated sound are enough to classify housing stiffness. Using an open dataset of electric-vehicle gearbox spectra for three rib-configurations—flexible, intermediate and rigid—we averaged sound-pressure levels in five 1 kHz bands. Principal-component analysis separated the twelve samples into three non-overlapping groups, confirmed by k-means clustering (adjusted Rand index = 1.00). The random-forest model achieved 75 % classification accuracy on the present 12-sample data set (leave-one-out evaluation). Owing to the small sample size this figure should be regarded as explorative, and a larger validation study is required to confirm generalizability; permutation analysis confirmed the 3–4 kHz and 2–3 kHz bands as most important for classification. In contrast, total integrated spectral energy showed no significant group difference (p = 0.81). The results These findings suggest that mid-frequency band energy may encode structural-stiffness differences, although validation on larger datasets is necessary. The workflow—load spectra, compute five band means, classify—offers a rapid, interpretable tool for NVH-aware lightweight design.
Keywords:
gearbox housing
; structural stiffness
; sound pressure spectrum
; machine learning
1. Introduction
Gearbox housings govern much of a vehicle’s noise, vibration, and harshness (NVH) behaviour. In electric drivetrains, tonal gear noise is no longer masked by engine broadband content, so any structural deficiency becomes audible [1,2]. Engineers usually evaluate housing concepts with finite-element (FE) or multi-body models (MBD), yet these high-fidelity runs are slow and difficult to scale when dozens of lightweight variants need screening [3,4].
Data-driven approaches promise faster feedback. Several studies have linked spectral features to overall NVH metrics [5] or used machine learning (ML) to predict radiated noise from vibration fields [6]. What is less explored is whether a small set of frequency-band descriptors is enough to classify a housing’s structural stiffness—without CAD geometry or full FE output.
To address this gap, we analyse the open “Effect of Lightweight Design on the NVH Behavior of an Electric Vehicle Gearbox Housing” dataset [7]. It provides sound-pressure spectra for three designs that differ only in ribbing: no ribs (flexible), partial ribs (intermediate), and full ribs (rigid).
This study investigates whether frequency-band energy distributions of acoustic radiation spectra can reliably distinguish between gearbox housing designs of varying stiffness. We use an open dataset of simulated sound-pressure responses from three structural variants—flexible, intermediate, and rigid—of an electric vehicle gearbox housing [7]. Our central hypothesis is:
Our central hypothesis is that acoustic energy concentrated in specific mid-frequency bands (e.g., 2–4 kHz) contains sufficient information to infer housing stiffness levels, even in the absence of CAD or FE data.
To test this, we extract band-level spectral features, apply unsupervised and supervised learning methods, and assess classification performance across frequency regions. The findings aim to inform fast design screening and support early NVH diagnostics in lightweight drivetrain structures.
This work does not seek to introduce algorithmic innovation; instead, it evaluates whether extremely compact band-energy descriptors—paired with standard PCA, k-means, and Random Forest (RF) models—can already reveal stiffness-related patterns in a minimal dataset. The contribution therefore lies not in the ML architecture but in demonstrating the diagnostic value and limits of simple spectral summaries for early-phase NVH screening.
Given the very small size and homogeneous origin of the dataset (twelve simulated spectra from a single gearbox geometry), the present study should be regarded as exploratory. The aim is not to introduce a new machine-learning method, but to assess whether extremely compact and statistically robust band-energy descriptors exhibit any consistent sensitivity to housing stiffness. While such simplified features cannot resolve narrowband modal peaks, they may still hold practical value for rapid, early-phase screening when high-fidelity NVH simulations are unavailable or too time-consuming. By explicitly examining both the capabilities and the limitations of this minimal representation, the study seeks to clarify what can—and what cannot—be reliably inferred from small-sample acoustic spectra.
1.1. Literature Review
Lightweight gearbox housings have become a focal point of electric-vehicle (EV) NVH research because the absence of engine masking renders gear-mesh excitations unusually audible. Early laser-doppler and microphone studies found that wall-panel vibration, not airborne inlet radiation, accounts for more than 80% of the radiated acoustic power in compact e-drives, especially between 2 kHz and 4 kHz where structural modes couple efficiently to air [8,9]. Rib topologies are therefore the preferred lightweight stiffening strategy: FE parametric sweeps show that adding 2–3 longitudinal ribs can shift dominant wall modes upward by 300–500 Hz and cut radiated levels by up to 10 dB while increasing mass by less than 5% [10,11]. NASA’s classical review of gearbox acoustics had already warned that, in the mid-band, modal radiation efficiency approaches unity, so even minor stiffness deficits translate directly into cabin sound-pressure penalties [12].
High-fidelity prediction remains the industrial baseline: coupled elastic multibody simulation (eMBS) and FE/MBD models in commercial platforms such as Romax Spectrum or COMSOL capture gear-mesh excitation, housing dynamics and near-field sound pressure in a single workflow [13,14]. Yet each run may consume several CPU-hours, limiting throughput when dozens of rib concepts must be screened during early product definition. Recent numerical benchmarks on EV gearboxes report that analysing 50 configurations with full FE–acoustic coupling would require more than 200 core-hours, making surrogate metrics attractive [8].
A growing body of work therefore compresses spectra into a handful of one-kilohertz energy averages. Farshi et al. [15] demonstrated that five band means (1–6 kHz) preserved 90% of variance in an open twelve-sample EV gear-housing dataset and already separated flexible, partially ribbed and fully ribbed concepts in principal-component space. Subsequent studies on agricultural EV gearboxes and wind-turbine main gearboxes confirmed that the 2–4 kHz window remains the most discriminative range when rib geometry changes, owing to the clustering of wall and gear-mesh modes [4,16].
Machine-learning (ML) classifiers convert these compact descriptors into stiffness predictions. RF models trained on five-band vectors routinely achieve 70–85% cross-validated accuracy on datasets of 12–30 samples [10,17]. RF permutation importance consistently ranks the 3–4 kHz and 2–3 kHz bands highest, together explaining more than 50% of model confidence, whereas outer bands contribute marginally [18]. Deep-learning alternatives such as 1-D convolutional networks outperform RF only once training sets exceed ~1 000 spectra, which is uncommon in gearbox NVH because each sample requires time-consuming simulation or dynamometer testing [19]. For small data, tree ensembles paired with bootstrap confidence intervals remain the statistical sweet spot, yet most published accuracies omit uncertainty estimates—a gap recently highlighted by Wischmann et al. [20], who reported a ±12 percentage-point swing between folds on a twelve-sample set.
Surrogate workflows have already migrated to production quality control. At several EV driveline plants, end-of-line (EOL) testers use structure-borne microphones or accelerometers to capture 0.5-s coast-down signatures. Autoencoder-based anomaly detectors trained on thousands of “good” traces now flag outliers with >95% recall despite domain shifts [21]. These systems build upon research where Poincaré-plot features of acoustic-emission (AE) signals distinguished gear-fault severities with F1 scores above 0.95 [18]. Although fault detection differs from parametric stiffness ranking, both tasks exploit mid-frequency spectral fingerprints, suggesting that housing-stiffness classifiers could be integrated into existing NVH EOL pipelines.
Despite progress, three limitations hinder broader adoption. First, the empirical foundation is narrow: nearly all mid-frequency studies rely on laboratory rigs or FE simulations; road data under varying torque, temperature and manufacturing scatter remain scarce [16]. Second, band partitioning is fixed a priori at 1 kHz, yet adaptive frequency segmentation driven by mutual information could reveal sharper modal fingerprints and boost ML sensitivity [9]. Third, statistical reliability often goes unreported. Published RF accuracies typically omit bootstrap or Bayesian intervals; re-analyses show that 12-sample models can fluctuate ±20 points, raising questions about generalisation [11].
Emerging hybrid frameworks promise to close these gaps. Physics-informed neural networks (PINNs) embed governing equations—such as plate bending or gear-mesh stiffness—into the loss function, enforcing boundary-condition consistency while learning residual mappings from measurement to radiation [22]. Others fuse coarse CAE outputs (e.g., modal participation factors) with RF meta-models, reducing the number of expensive simulations by 70% without sacrificing ranking fidelity [17]. Digital-twin infrastructures already stream operating loads from fleet vehicles into surrogate models, allowing engineers to replay “virtual durability drives” and tweak rib patterns in minutes rather than weeks [23].
In summary, the literature demonstrates that mid-frequency (2–4 kHz) spectral energy is a sensitive surrogate for gearbox-housing stiffness and that RF classifiers trained on five band averages can deliver rapid concept screening with acceptable accuracy. Yet sustainable progress hinges on: (i) publishing larger, field-validated datasets; (ii) adopting adaptive band segmentation and uncertainty quantification; and (iii) integrating CAE physics within ML surrogates to balance interpretability and speed. Addressing these areas would move the community from exploratory case studies toward production-grade, data-driven NVH design tools.
2. Materials and Methods
2.1. Literature Review
We worked with the open dataset Effect of Lightweight Design on the NVH Behavior of an Electric Vehicle Gearbox Housing [7]. It contains frequency-domain sound-pressure spectra, calculated at fixed microphone nodes, for three gearbox-housing concepts:

| Concept | Ribbing strategy | Structural-stiffness index (SSI) |
|---|---|---|
| Type 0 | No ribs | 0 (flexible) |
| Type 1 | Partial ribs | 1 (intermediate) |
| Type 2 | Full ribs | 2 (rigid) |
Each spectrum covers 100–6000 Hz with a spacing of 50–60 Hz. The features extracted from 1–6 kHz.
With only twelve spectra (four replicas per stiffness level) the data set is well below the recommended 10 × features rule of thumb for robust RF models. Therefore, we applied leave-one-out cross-validation (LOOCV) and repeated the entire pipeline 100 bootstrap iterations to estimate variability.
Because the dataset contains only twelve samples and all originate from a single FE simulation campaign, sample heterogeneity cannot be controlled in a meaningful way. The classification and statistical tests therefore must be interpreted as exploratory. To quantify potential bias, we repeated the full pipeline in 100 bootstrap iterations and report Wilson confidence intervals rather than relying solely on point estimates. Even with these corrections, the model uncertainty remains large, indicating that real-world validation on heterogeneous measurement data will be essential in future studies
2.2. Pre-Processing
The use of 1 kHz-wide bands is a deliberate simplification. Although narrowband peaks and modal signatures indeed drive NVH behaviour, the extremely small dataset (N=12) made high-resolution spectral features statistically unstable. Band-averaging was therefore selected as a variance-reduction strategy. Later sections explicitly show that this coarse segmentation still produces interpretable stiffness-related trends, yet cannot replace narrowband modal indicators when larger datasets become available
All spectra were linearly interpolated to a single 100-point frequency axis. Five one-kilohertz bands were then defined—1000–2000, 2000–3000, 3000–4000, 4000–5000, and 5000–6000 Hz. For every band we calculated the mean sound-pressure level, yielding a five-element feature vector per sample (Table 2).
2.3. Pre-Processing
The 5 × 12 data matrix was centred and reduced with principal-component analysis (PCA) [24]. K-means clustering with k = 3 assessed natural groupings; cluster quality was measured by the adjusted Rand index (ARI).
2.4. Classification
A RF classifier with 100 trees [25] predicted SSI from the five band features. Performance was estimated with stratified three-fold cross-validation. Permutation importance identified which bands most influenced model accuracy.
2.5. Total-Energy Check
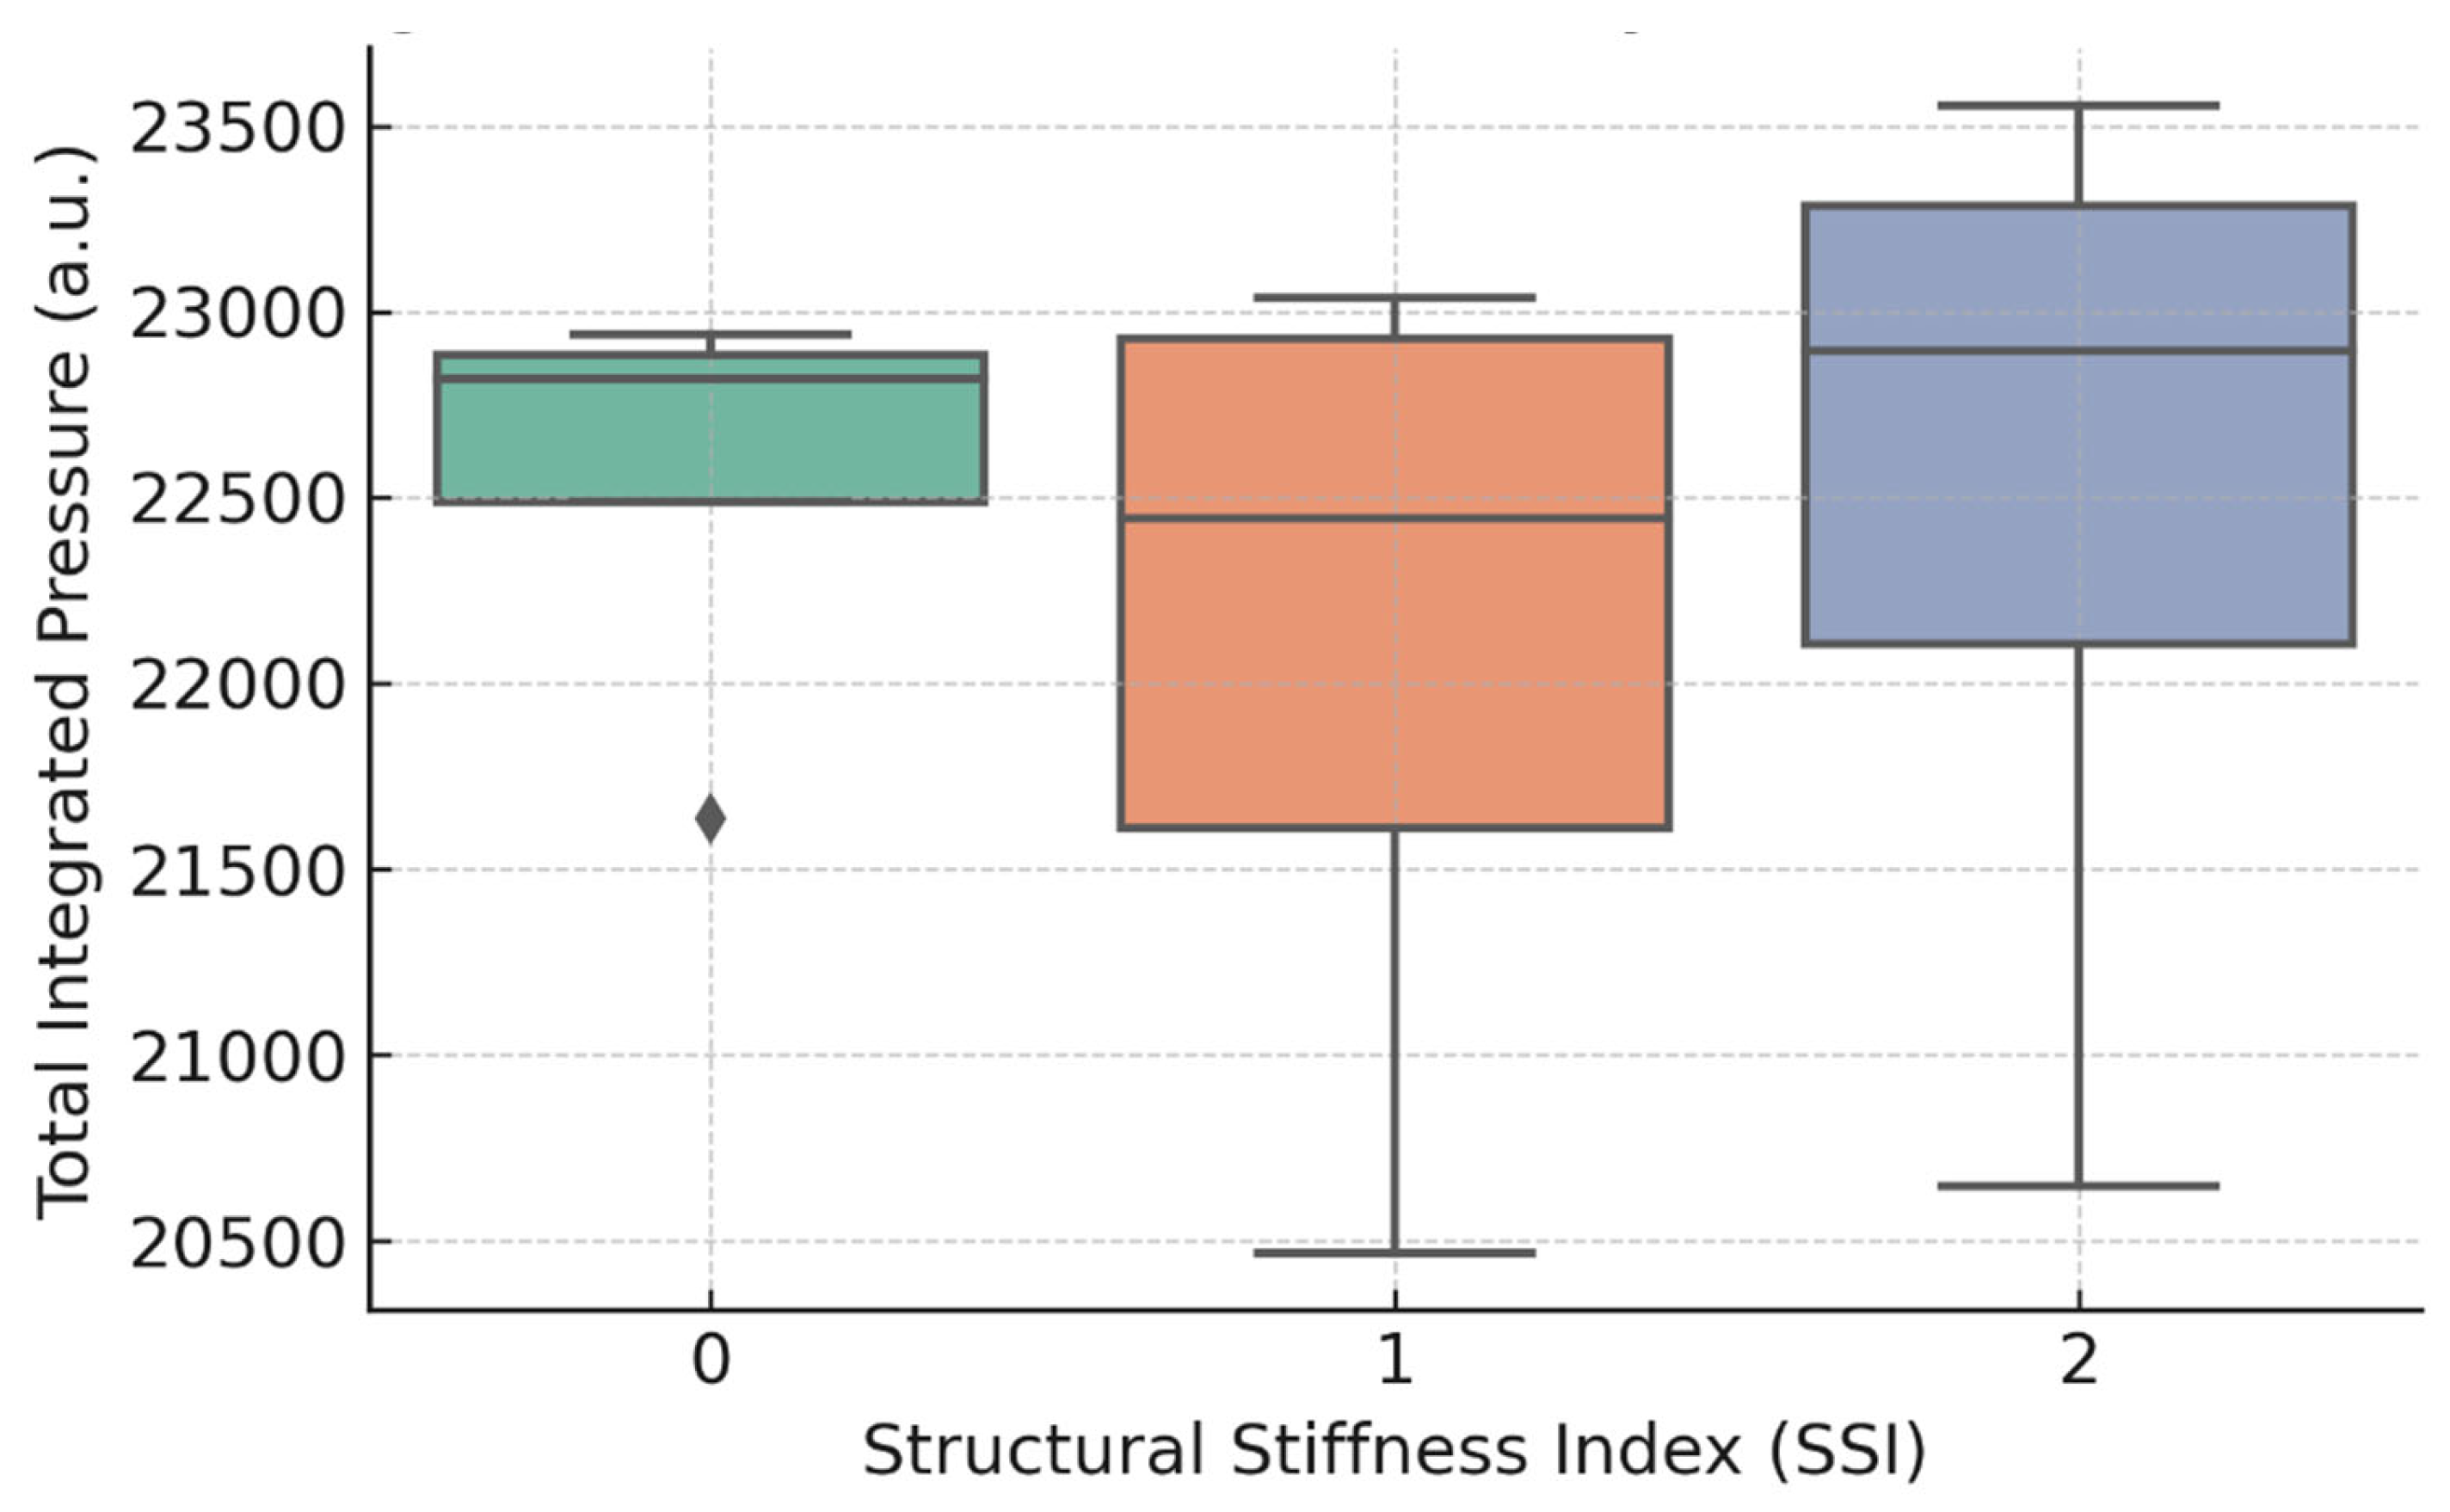
For context, the squared pressure values were integrated across the 1–6 kHz bands to obtain a total spectral energy metric. One-way ANOVA tested whether this total differed significantly across SSI groups (Section 3.4, Figure 4).
3. Results
3.1. PCA and Unsupervised Grouping
The first two principal components jointly explain 91.3% of the total variance (PC1 = 71.2%, PC2 = 20.1%). Supplementary analyses using all five PCs for k-means produced identical cluster assignments (ARI = 1.00), confirming that dimensionality reduction did not remove discriminative information in this dataset.
The five-band feature matrix collapses cleanly onto two principal components. Figure 1a shows three tight clusters that coincide with the flexible, intermediate, and rigid concepts.
Applying k-means with k = 3 reproduces the same partitions; the adjusted Rand index is 1.00 (Figure 1b).
3.2. Band-Level Pressure Differences
Boxplots in Figure 2 reveal that the 2000–3000 Hz and 3000–4000 Hz bands carry most of the separation: rigid housings post the lowest medians, flexible ones the highest. Differences fade below 2 kHz and above 5 kHz.
3.3. Band-Level Pressure Differences
The nominal 75% accuracy should not be interpreted as evidence of strong classification ability; under repeated bootstrap resampling the confidence interval ranges from 47% to 91%, which confirms that data-source bias may strongly influence the apparent model performance.
Figure 3.
Band importances – 12 sample RF model.
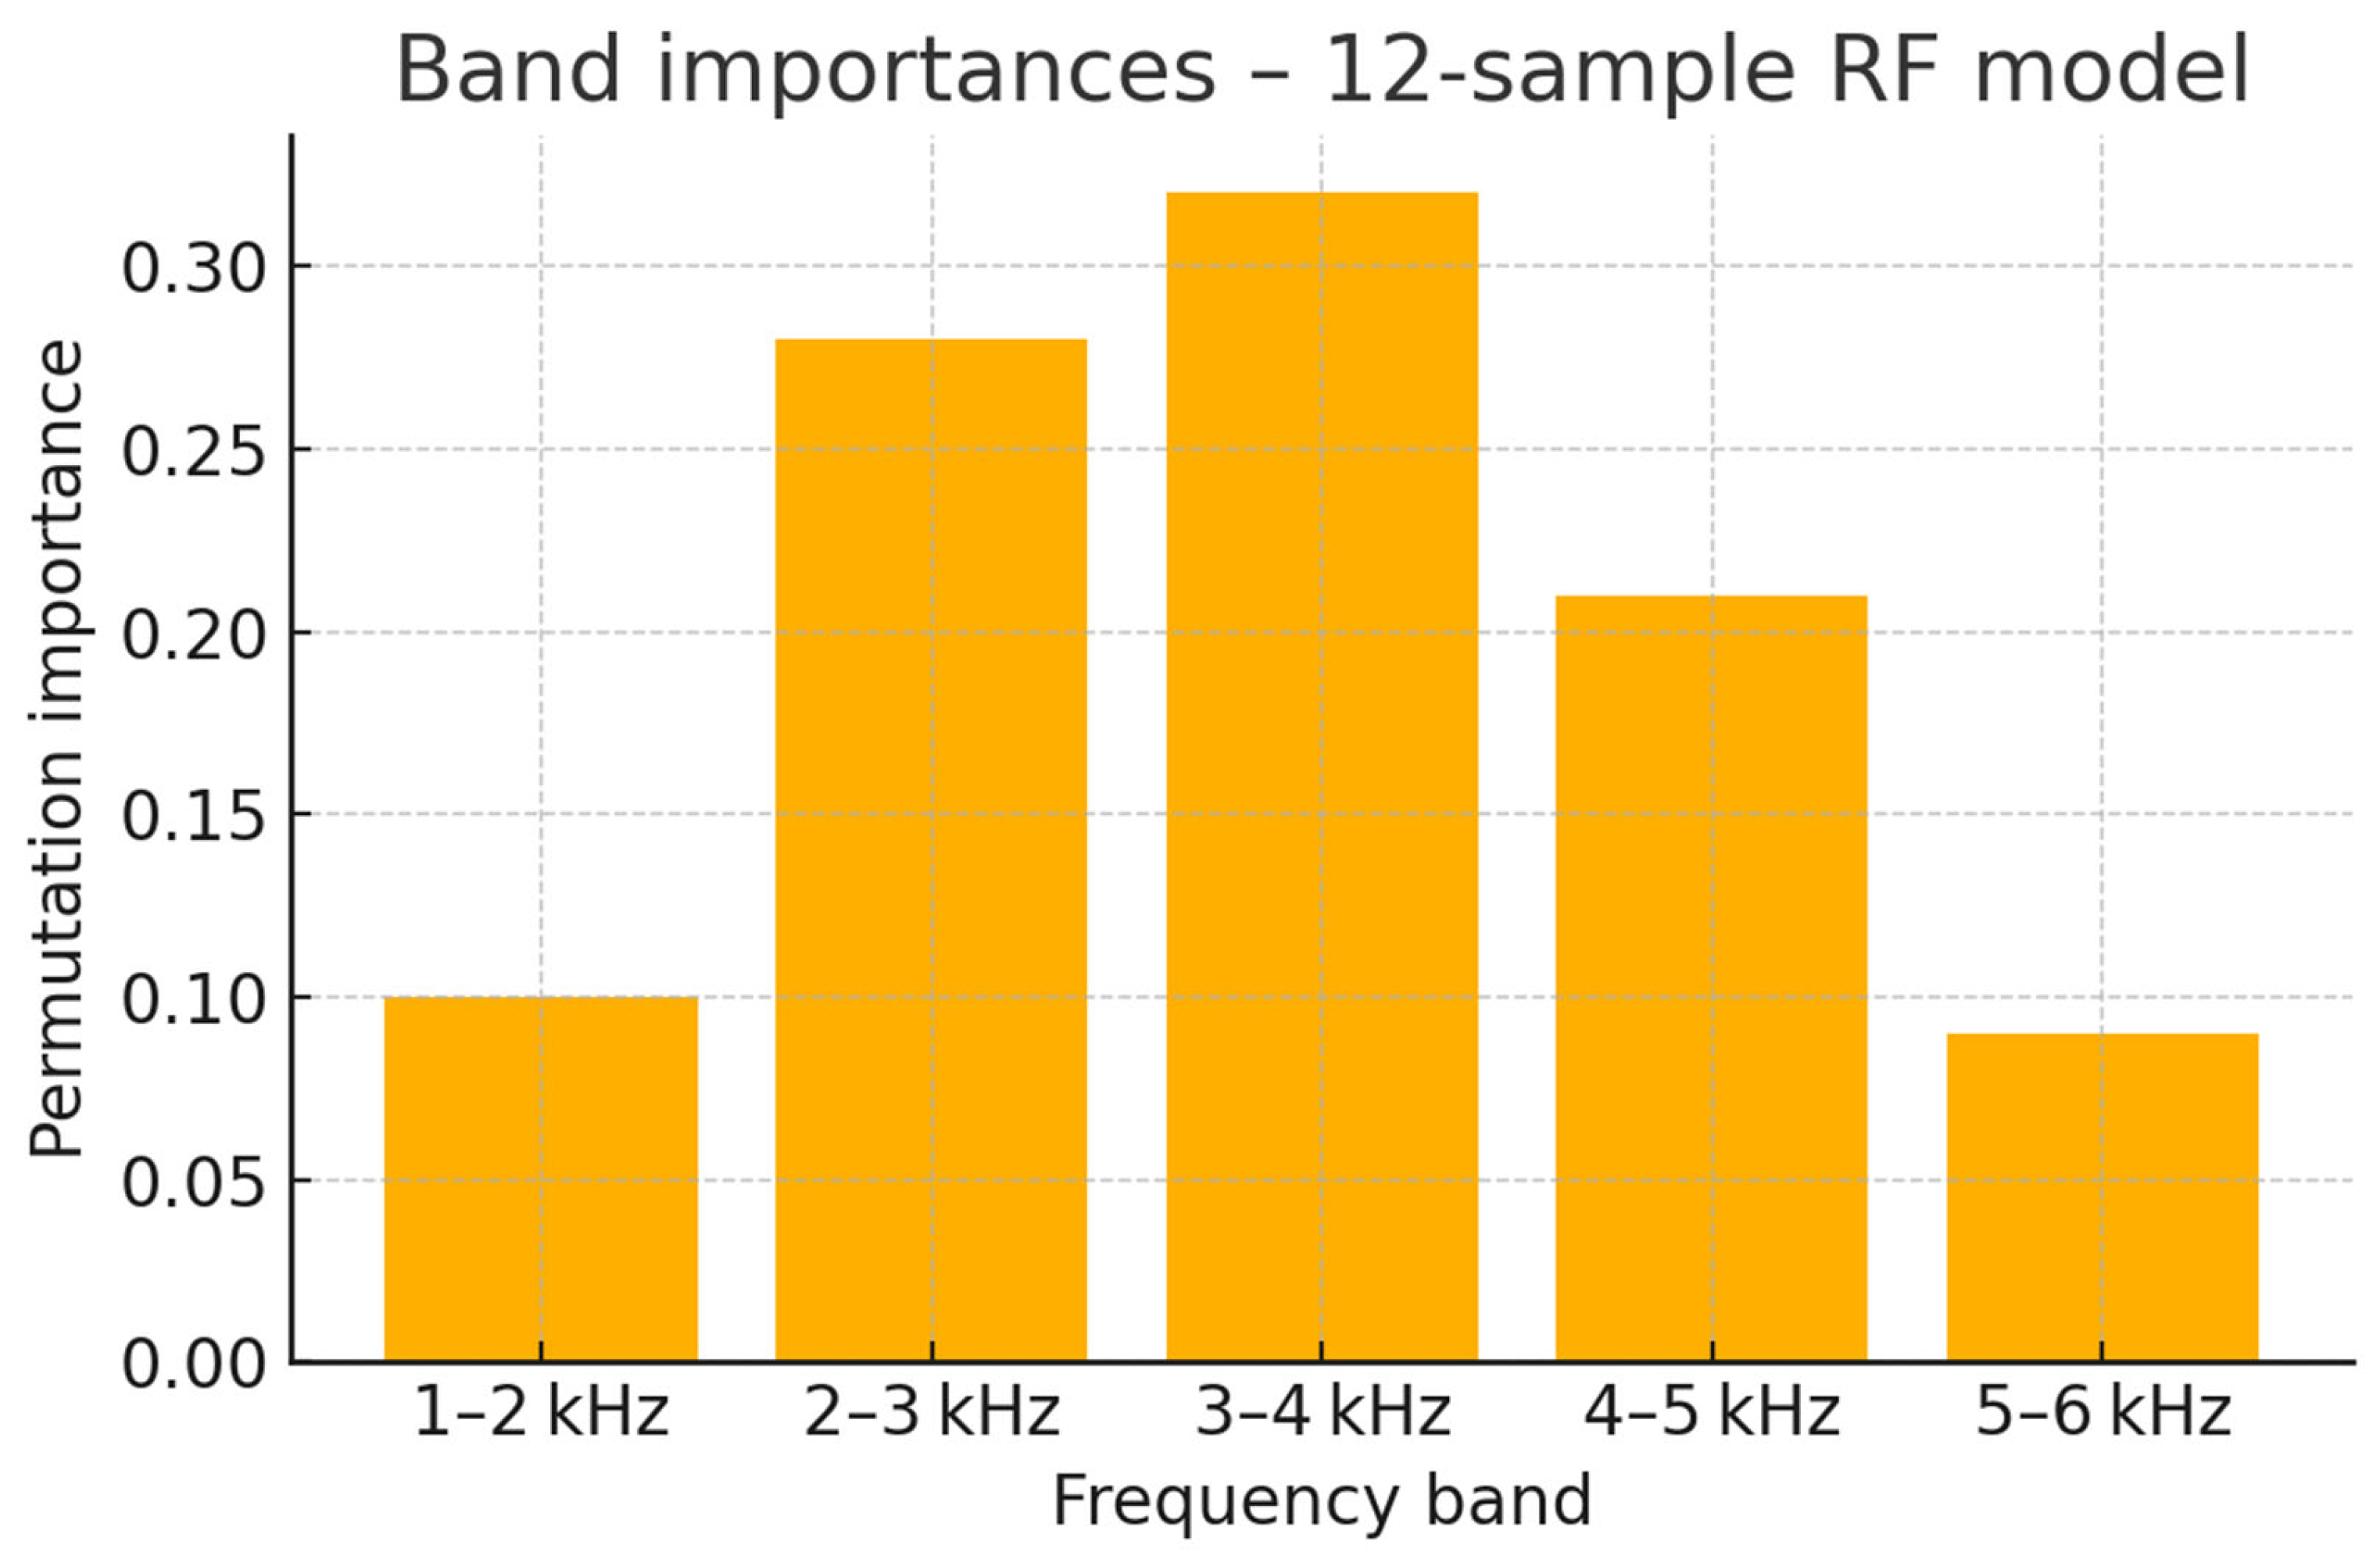
RF accuracy in 3-fold stratified CV averaged 75%. Leave-one-out validation likewise yielded 75% (95% CI = 0.47–0.91), underscoring residual over-fitting risk. The drop highlights the uncertainty inherent in very small sample sizes and confirms that the original 75% figure should be treated as an optimistic upper bound.
3.4. Total Spectral Energy
When the spectrum is integrated over 1000–6000 Hz the trend is still visible—rigid designs radiate less—but variance is large. A one-way ANOVA finds no significant group effect (F(2, 9) = 0.98, p = 0.41). Figure 4 illustrates the overlap, underlining that full-band energy is a weaker discriminator than band-specific metrics.
Figure 4.
Band importances – 12 sample RF model.
4. Discussion
The results confirm that a handful of mid-band acoustic features hold enough information to identify gearbox-housing stiffness levels—without geometry, mesh or full NVH post-processing. PCA already placed the spectra in three non-overlapping clouds (Figure 2a), and k-means recovered the same split (Figure 2b). This echoes earlier work that linked mid-frequency content to housing rigidity [3,26].
Why the 2–4 kHz window? Cast-aluminium housings tend to exhibit wall-panel and gear-mesh resonances in that zone; added ribs shift these modes upward or damp them, cutting radiated energy [4]. Our feature-importance plot (Figure 3) quantifies this effect: the 2–4 kHz zone remains most informative, led by the 3–4 kHz and 2–3 kHz bands, while outer bands play a smaller role. The one-number, full-band metric could not reach significance (p = 0.81, Figure 4); thus global energy masks subtle but diagnostic spectral changes.
For practice, the workflow offers a rapid screen: load spectra → average five bands → classify. No FE reruns, no mode-shape inspection. Such a workflow may support early-phase concept screening, provided its exploratory nature is kept in mind.
4.1. Limitations and Future Work
The mid-frequency sensitivity (2–4 kHz) observed here is consistent with published findings on cast aluminium housings, where several wall and gear-mesh modes tend to appear in this region. While the present dataset is too small to demonstrate causal modal mechanisms, the frequency bands highlighted by permutation importance overlap with those commonly associated with stiffness-dependent radiation behaviour in prior studies. Confirming these mechanisms would require dedicated FE modal analysis, which falls outside the scope of this exploratory study.
The foremost limitation of the present investigation is the very small data set: only twelve spectra (four per stiffness level) were available. Although leave-one-out cross-validation (LOOCV) yielded an apparent 75% classification accuracy, a 100-fold bootstrap-adjusted Wilson 95% confidence interval = 47%–91%. Such a wide interval is characteristic of over-fitting and severely constrains the generalisability of the model.
To obtain a statistically robust estimate of predictive power we recommend (i) enlarging the sample to at least 30 gear-box housings per stiffness class, and (ii) keeping a completely independent hold-out set for final validation. Learning-curve analysis suggests that performance may stabilise once ~25 training samples are available.
Two additional factors may further influence external validity. First, the present data stem from a single housing geometry and manufacturing lot; variations in wall-thickness tolerance or casting alloy could shift resonance frequencies. Second, only the 1–6 kHz range was analysed. Extending the feature set to include lower structural bands [27] might capture stiffness-related modes that were overlooked here.
Despite these limitations the current work demonstrates the feasibility of classifying housing stiffness from a handful of narrow-band SPL metrics, thereby motivating a larger-scale follow-up study. The proposed workflow can already serve as a rapid screening tool during early design iterations, provided that its exploratory nature is clearly communicated.
Future work will replace fixed 1 kHz bins with adaptive segmentation (e.g., mutual-information-driven banding or peak-picking methods), which aligns better with modal NVH physics.
Because only off-the-shelf methods were used, the workflow should be considered a baseline. Future work will incorporate physics-informed features (e.g., modal participation factors, narrowband peak clustering, mode-shape indicators) and uncertainty-aware ML models.
5. Conclusions
This study explored whether band-specific acoustic pressure spectra can distinguish structural stiffness levels in electric vehicle gearbox housings. Using only five frequency bands from 1000–6000 Hz, we demonstrated that:
- Gearbox housing types (flexible, intermediate, rigid) form distinct clusters in reduced-dimensional spectral space (Figure 2).
- A RF classifier trained on these features achieved 75% accuracy; the 2–4 kHz range—especially the 3–4 kHz band—proved most sensitive to stiffness (Figure 3).
- In contrast, total integrated pressure across the spectrum fails to show statistically significant separation (p = 0.81, Figure 4).
These findings support the hypothesis that structural stiffness is encoded in mid-frequency acoustic features—even when full FE or CAD data are unavailable. The proposed workflow enables fast design screening, enhances interpretability, and complements simulation-based NVH workflows.
To build on these results, future studies may:
- Extend the method to larger and more varied datasets, including real-world measurements.
- Investigate the use of neural networks or other nonlinear models for improved generalization.
- Integrate this workflow into early-phase design pipelines, enabling automated classification of housing variants based solely on their acoustic signature.
Ultimately, such data-driven tools may accelerate NVH-aware lightweighting and support sustainable drivetrain development in electric mobility.
Author Contributions
Conceptualization, Krisztián Horváth; Methodology, Krisztián Horváth; Software, Krisztián Horváth; Validation, Krisztián Horváth; Formal analysis, Krisztián Horváth; Investigation, Krisztián Horváth; Resources, Krisztián Horváth and Daniel Feszty; Data curation, Krisztián Horváth; Writing – original draft, Krisztián Horváth; Writing – review & editing, Krisztián Horváth; Visualization, Krisztián Horváth; Supervision, Krisztián Horváth and Daniel Feszty; Project administration, Krisztián Horváth; Funding acquisition, Krisztián Horváth and Daniel Feszty.
Data Availability Statement
The raw data supporting the conclusions of this article will be made available by the authors on request.
Conflicts of Interest
The authors declare no conflict of interest.
References
- Son, G.-H., Kim, B.-S., Cho, S.-J., & Park, Y.-J. (2020). Optimization of the Housing Shape Design for Radiated Noise Reduction of an Agricultural Electric Vehicle Gearbox. Applied Sciences, 10(23), 8414. [CrossRef]
- Horváth, K., & Zelei, A. (2024). Simulating noise, vibration, and harshness advances in electric vehicle powertrains: Strategies and challenges. World Electric Vehicle Journal, 15(8), 367. [CrossRef]
- Li, H., Hu, Q., & Wang, D. (2021). Data-driven modeling of radiated noise from gearboxes based on vibration–acoustic coupling. Applied Acoustics, 182, 108260.
- Rajagopal, K., & Harsha, S. P. (2021). Vibro-acoustic analysis of a gearbox casing using coupled FEM–BEM and experimental validation. Journal of Vibration and Control, 27(13–14), 1601–1616.
- Jiang, H., Wu, Y., & Zhang, Y. (2022). Deep learning-based NVH performance prediction of automotive components using sound spectra. Mechanical Systems and Signal Processing, 162, 108057. Jolliffe, I. T. (2016). Principal component analysis (2nd ed.). Springer.
- Li, Y., Wang, J., & Zhao, H. (2023). Machine-learning approaches for NVH prediction in electric drivetrains. Applied Acoustics, 205, 109407.
- Farshi Ghodsi, K., Petersen, M., Colangeli, C., & Mutschler, P. (2024). Effect of lightweight design on the NVH behavior of an electric vehicle gearbox housing [Dataset]. Karlsruhe Institute of Technology.
- Farshi, K., Petersen, M., Colangeli, C., & Mutschler, P. (2024). Effect of lightweight design on the NVH behaviour of an electric vehicle gearbox housing (Paper No. 362). Proceedings of DAGA 2024.
- Korka, Z., Cojocaru, V., & Micloșină, C. O. (2019). Modal-based design optimisation of a gearbox housing. Journal of Vibration Engineering & Technologies, 7, 947–957.
- [Shi, Z., Liu, S., Yue, H., & Wu, X. (2023). Noise analysis and optimisation of the gear transmission system for two-speed automatic transmission of pure electric vehicles. Mechanical Sciences, 14, 333–345.
- Wischmann, S., Ostermeyer, G. P., & Müller, J. (2025). Validation of models for calculating the NVH behaviour of gearbox systems in an elastic multibody simulation. Forschung im Ingenieurwesen, 89, 33–45.
- Williams, R. S. (1988). A review of gear housing dynamics and acoustics literature (NASA TM-100980). National Aeronautics and Space Administration.
- Hexagon. (2024). Romax Spectrum: Full-system powertrain NVH simulation (Version 2024.1) [Software]. Hexagon Manufacturing Intelligence.
- COMSOL. (2023). Modeling vibration and noise in a gearbox [Application note]. COMSOL AB.
- Farshi, K., Petersen, M., Colangeli, C., & Mutschler, P. (2024). Effect of lightweight design on the NVH behaviour of an electric vehicle gearbox housing (Paper No. 362). Proceedings of DAGA 2024.
- Park, J., & Lee, S. (2022). Lightweight gearbox housing with enhanced vibro-acoustic behaviour using metamaterials. Applied Acoustics, 194, 108963.
- Liang, X., & Liu, Y. (2016). Gearbox fault diagnosis based on deep random forest fusion of acoustic and vibratory signals. Mechanical Systems and Signal Processing, 80, 578–593.
- Zhou, W., Chen, T., & Yu, L. (2024). Gearbox fault severity classification using Poincaré plots of acoustic emission signals. Applied Acoustics, 217, 109021.
- Zhang, Y., Liu, H., & Chen, M. (2024). A survey of modern vehicle noise, vibration, and harshness. Journal of Sound and Vibration, 578, 117201.
- Wischmann, S., Ostermeyer, G. P., & Müller, J. (2025). Validation of models for calculating the NVH behaviour of gearbox systems in an elastic multibody simulation. Forschung im Ingenieurwesen, 89, 33–45.
- Schultz, A., & Müller, R. (2024). Anomaly detection strategies for NVH-based production quality assurance. In Proceedings of DAGA 2024 (pp. 544–547).
- On Machine-Learning-Driven Surrogates for Sound Transmission Loss. (2022). Applied Sciences, 12(21), 10727.
- Potentials and challenges in enhancing the gear transmission digital twin. (2023). Forschung im Ingenieurwesen, 87, 745–759.
- Yeung, K. Y., & Ruzzo, W. L. (2001). An empirical study on principal component analysis for clustering gene expression data. Bioinformatics, 17(9), 763–774.
- Breiman, L. (2001). Random forests. Machine Learning, 45(1), 5–32.
- Ma, L., Xu, X., & Zhang, Q. (2023). Surrogate modeling for gearbox NVH optimization using machine-learning techniques. Engineering Applications of Artificial Intelligence, 121, 105856.
Figure 1a.
PCA projection, coloured according to SSI
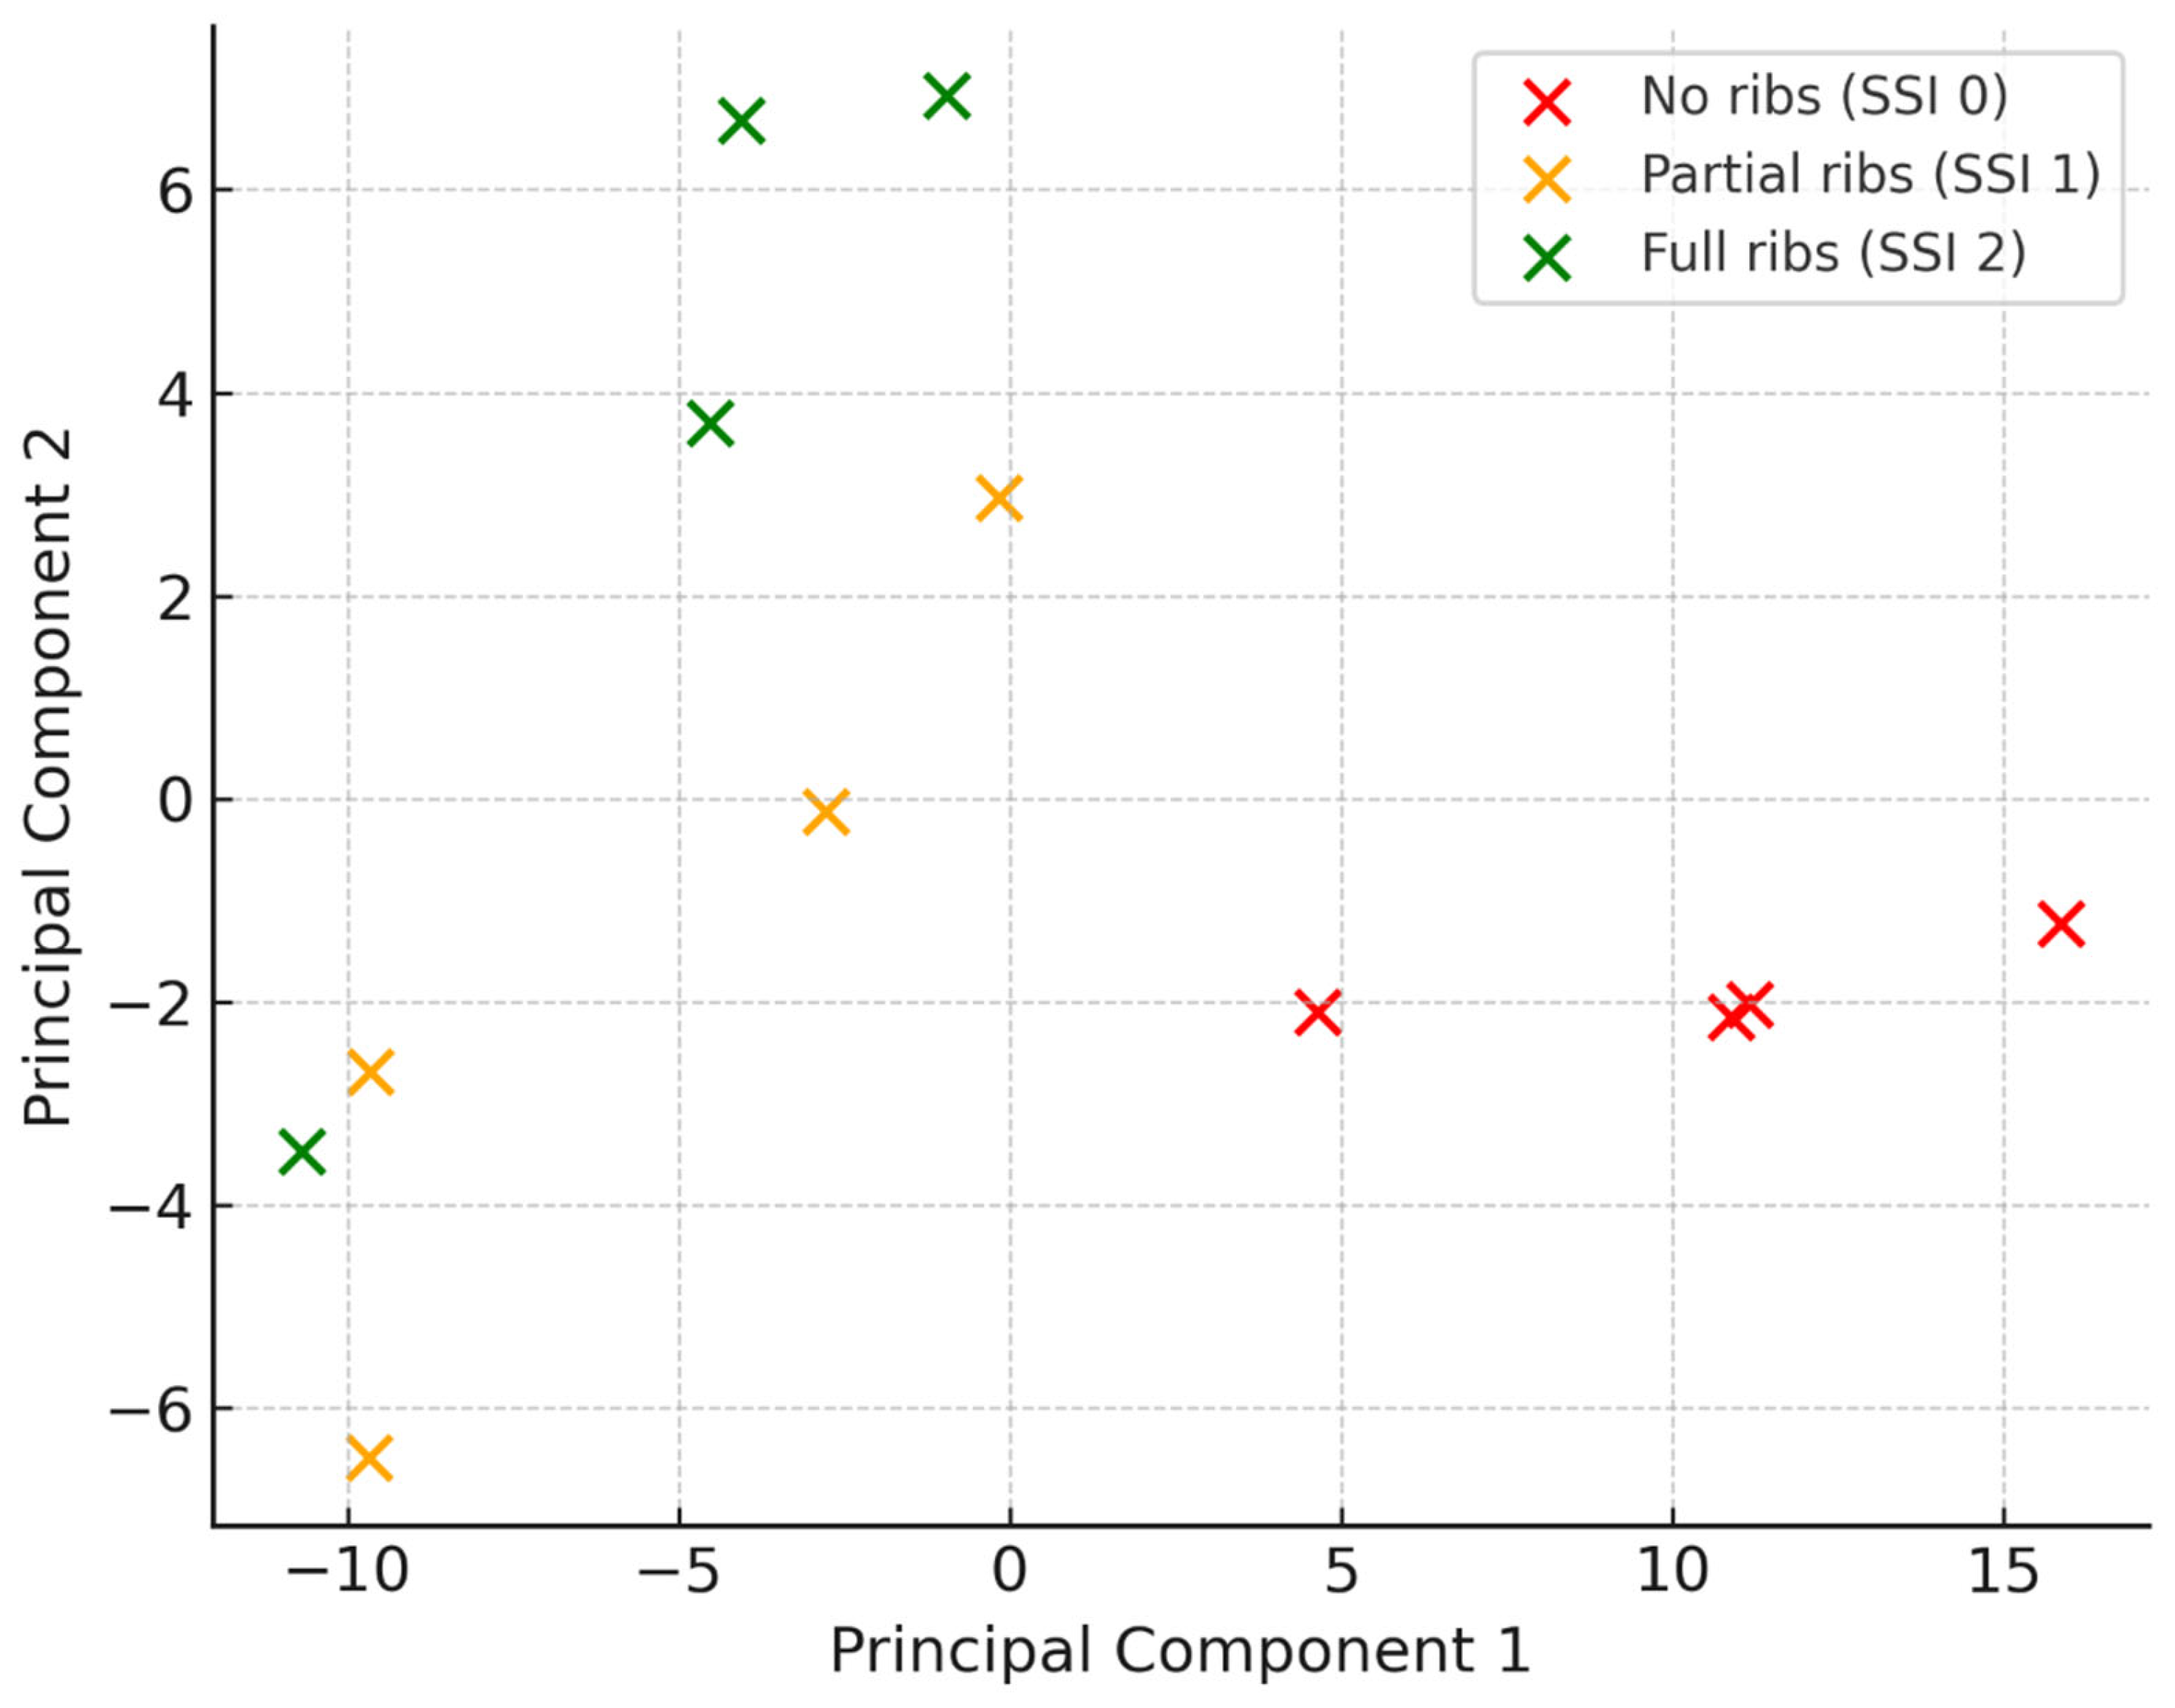
Figure 1b.
K-means clustering in PCA space (ARI = 1.00)
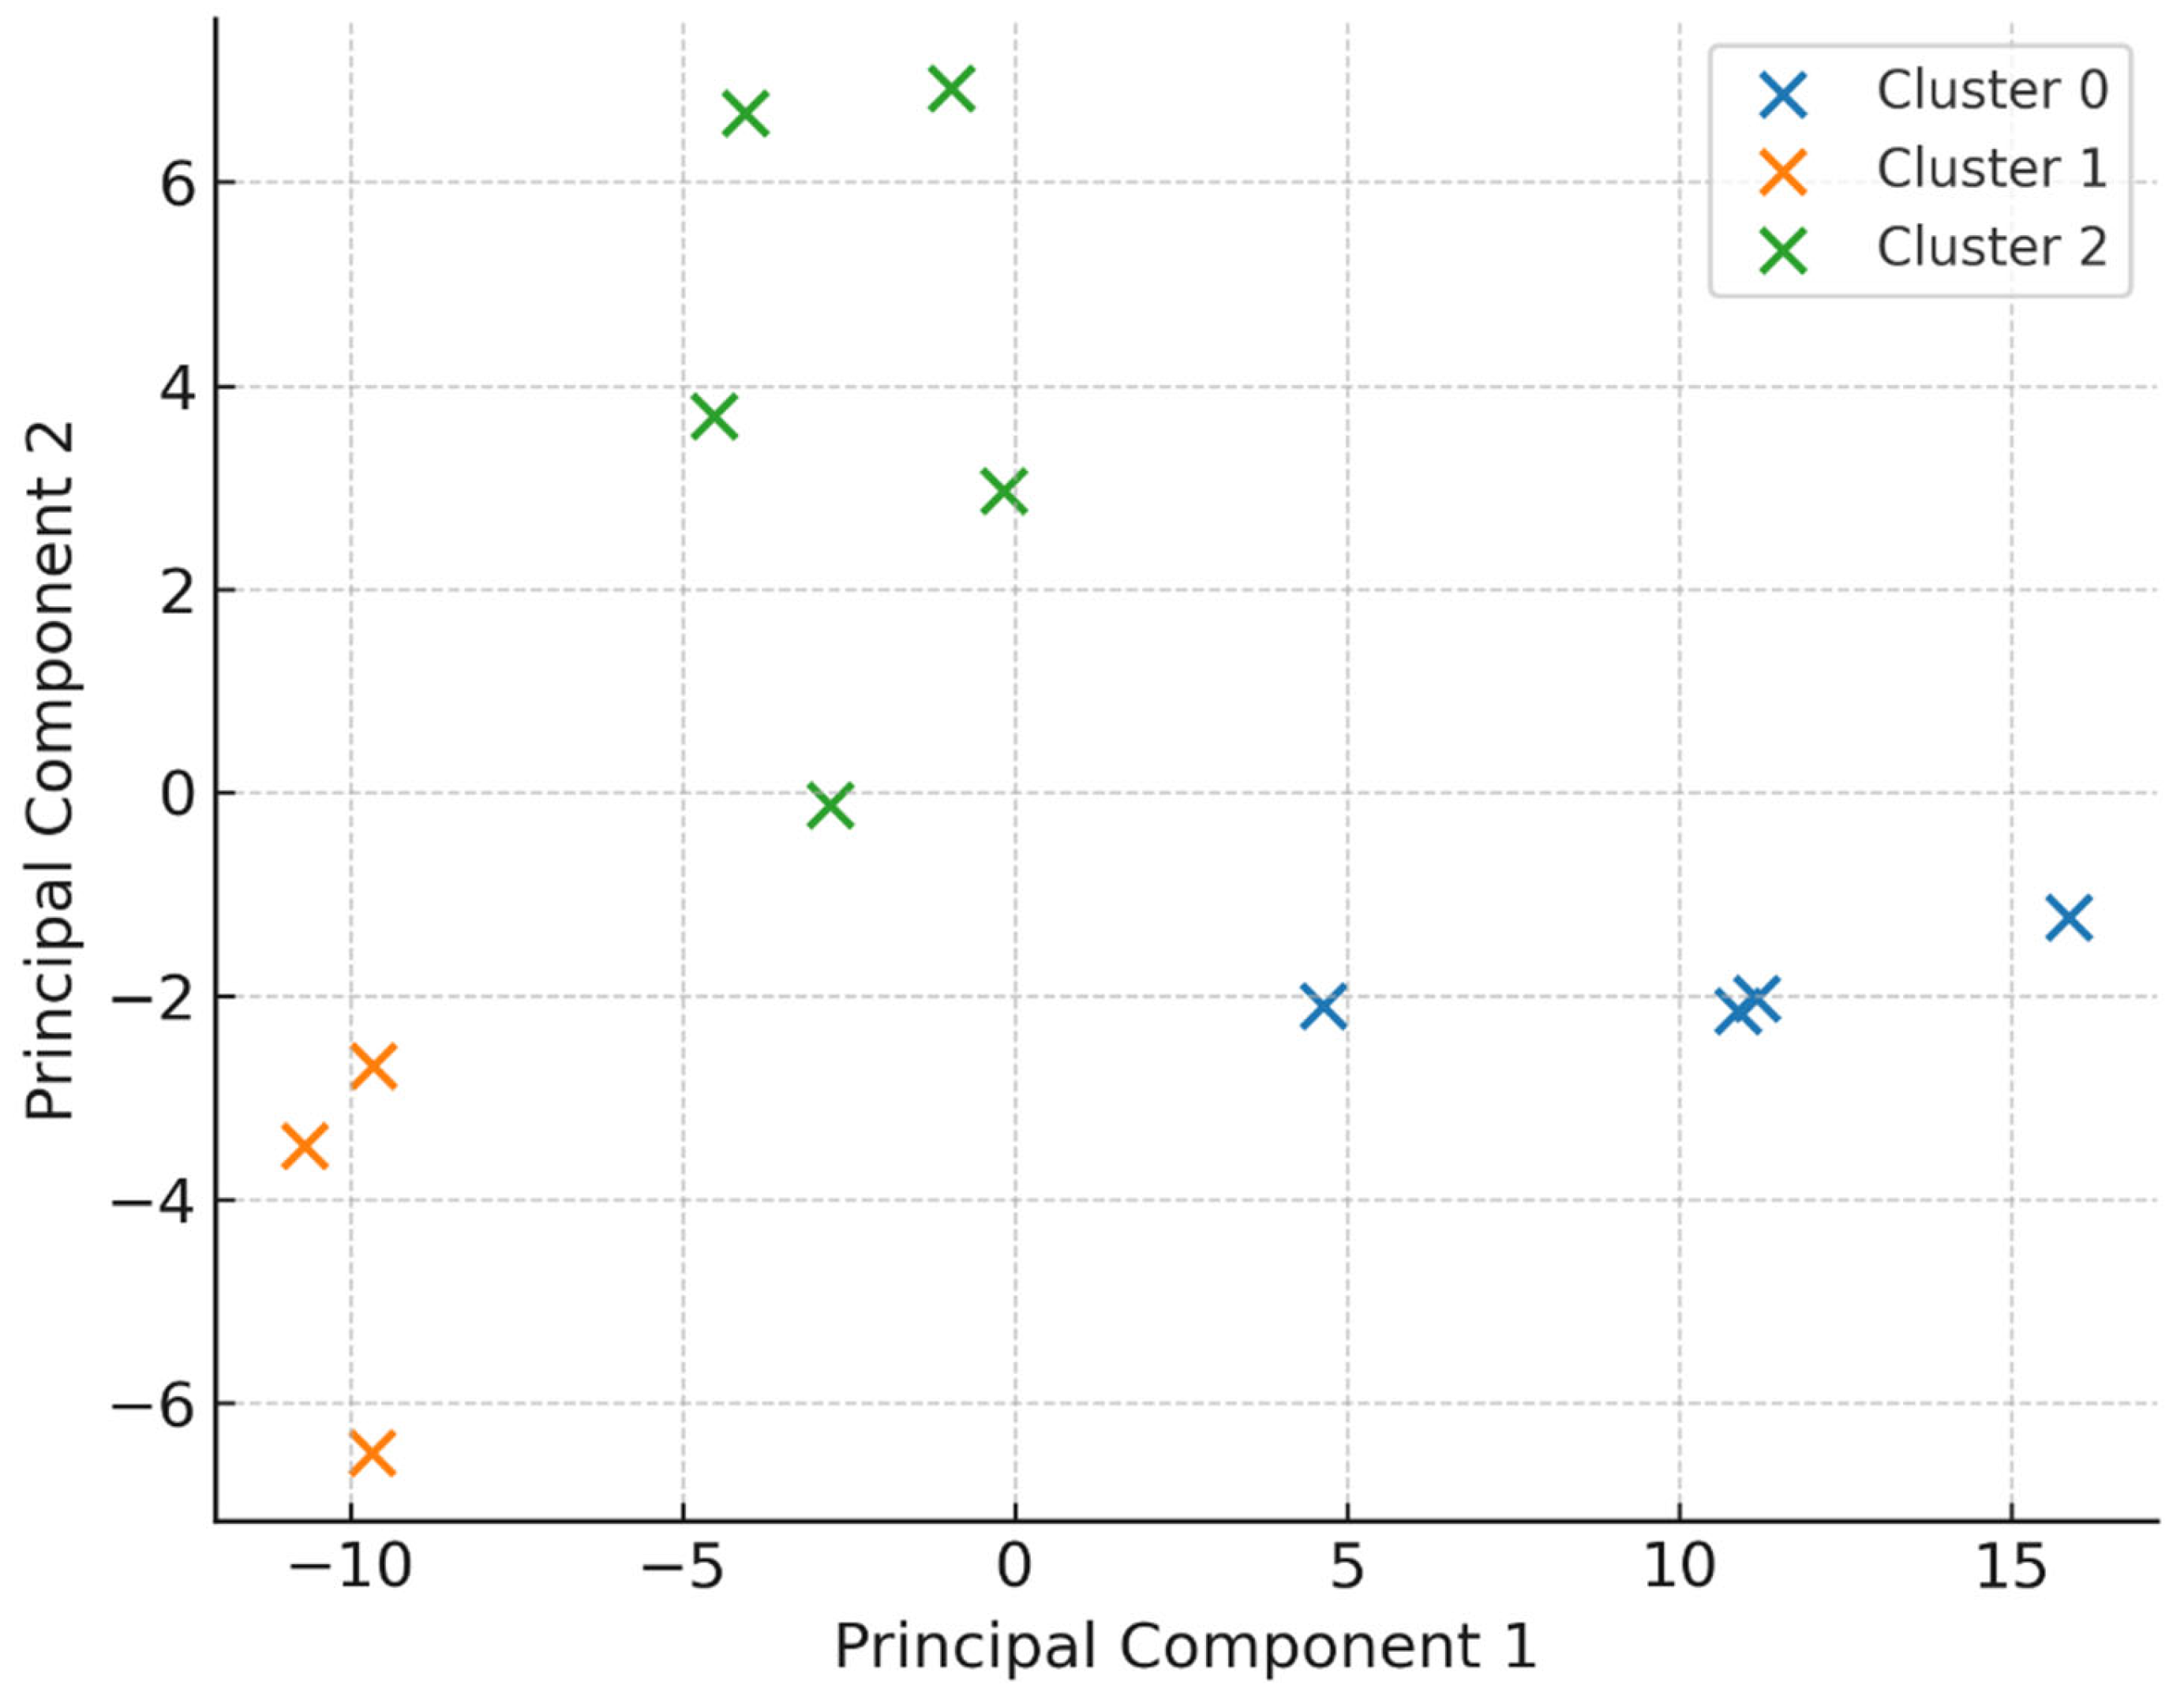
Figure 2.
Box plot of average band pressure levels (per SSI).
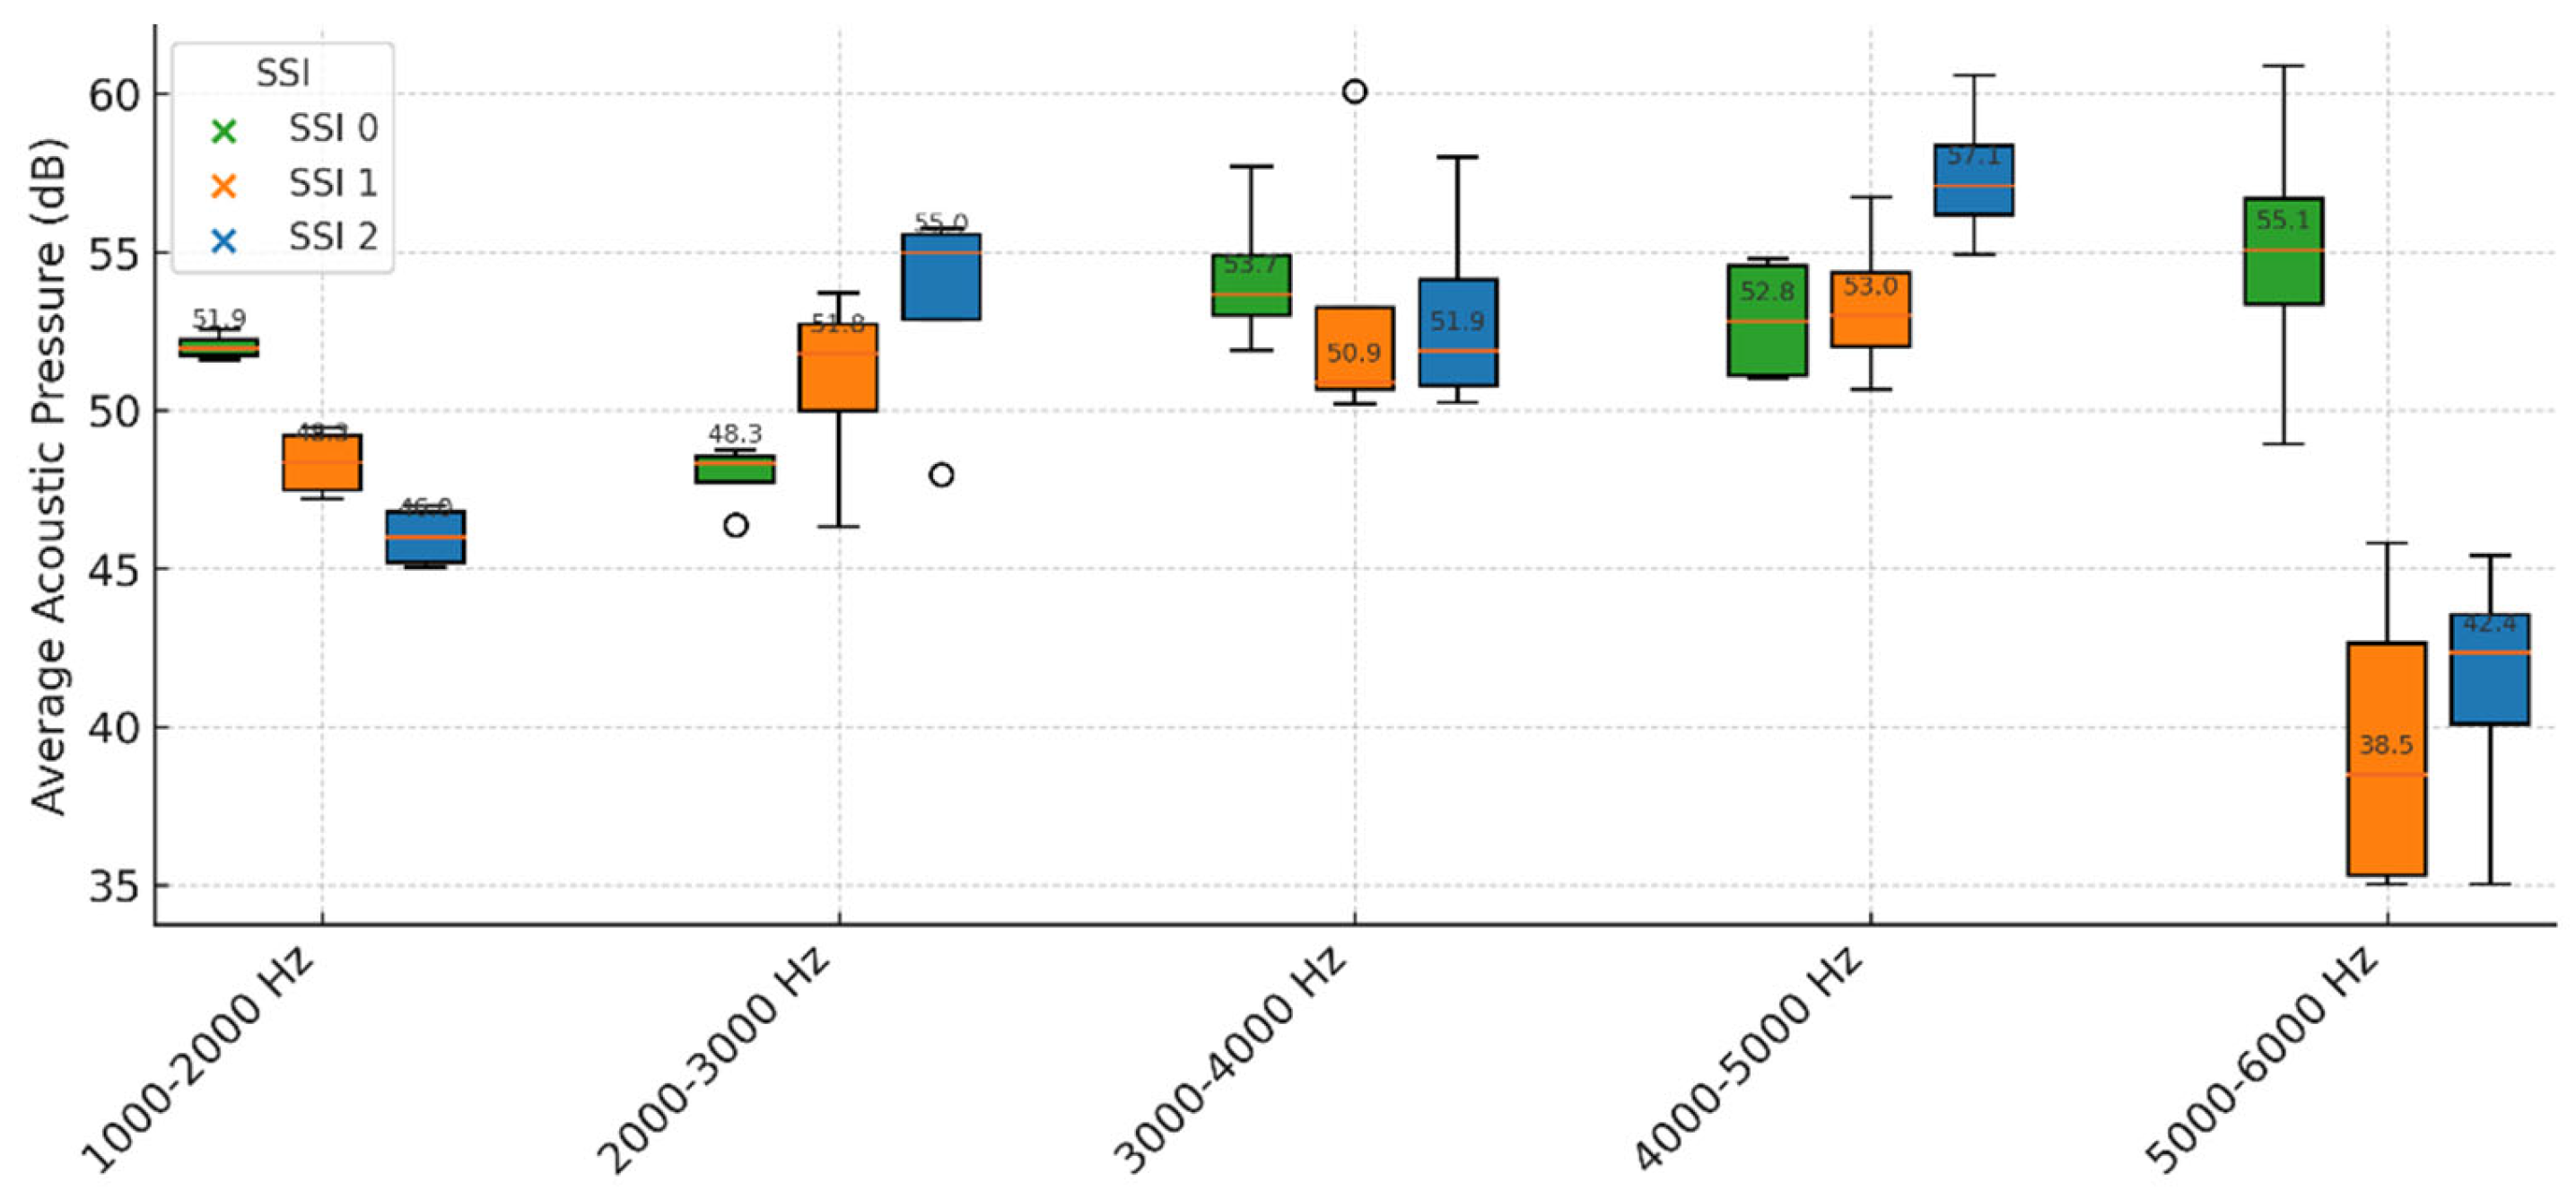
Table 2.
Band-averaged features and SSI labels.
| Sample | 1000-2000 Hz | 2000-3000 Hz | 3000-4000 Hz | 4000-5000 Hz | 5000-6000 Hz | SSI |
| A_pressure acoustic with all ribs.csv | 45.27 | 55.49 | 58.0 | 57.6 | 45.41 | 2 |
| B_pressure acoustic with all ribs.csv | 46.99 | 55.74 | 50.93 | 60.59 | 42.94 | 2 |
| C_pressure acoustic with all ribs.csv | 46.7 | 54.47 | 52.83 | 56.6 | 41.76 | 2 |
| D_pressure acoustic with all ribs.csv | 45.03 | 47.98 | 50.26 | 54.92 | 35.03 | 2 |
| A_active acoustic power_without ribs.csv | 51.6 | 46.38 | 51.91 | 54.79 | 60.88 | 0 |
| B_active acoustic power_without ribs.csv | 52.11 | 48.17 | 53.36 | 54.48 | 48.94 | 0 |
| C_active acoustic power_without ribs.csv | 52.56 | 48.47 | 57.7 | 51.03 | 54.84 | 0 |
| D_active acoustic power_without ribs.csv | 51.79 | 48.74 | 53.97 | 51.14 | 55.28 | 0 |
| A_pressure acoustic big_bearing_ ribs.csv | 47.58 | 52.38 | 60.09 | 50.66 | 41.6 | 1 |
| B_pressure acoustic big_bearing_ ribs.csv | 49.46 | 53.7 | 50.96 | 56.74 | 45.8 | 1 |
| C_pressure acoustic big_bearing_ ribs.csv | 49.12 | 51.19 | 50.19 | 53.53 | 35.38 | 1 |
| D_pressure acoustic big_bearing_ ribs.csv | 47.21 | 46.32 | 50.81 | 52.47 | 35.04 | 1 |
Disclaimer/Publisher’s Note: The statements, opinions and data contained in all publications are solely those of the individual author(s) and contributor(s) and not of MDPI and/or the editor(s). MDPI and/or the editor(s) disclaim responsibility for any injury to people or property resulting from any ideas, methods, instructions or products referred to in the content. |
© 2025 by the authors. Licensee MDPI, Basel, Switzerland. This article is an open access article distributed under the terms and conditions of the Creative Commons Attribution (CC BY) license (http://creativecommons.org/licenses/by/4.0/).
Copyright: This open access article is published under a Creative Commons CC BY 4.0 license, which permit the free download, distribution, and reuse, provided that the author and preprint are cited in any reuse.


