Preprint
Article

This version is not peer-reviewed.

Identification of Regulators for Antigen-Specific CD8⁺ T Cells in African Swine Fever Virus-Restored Pigs

A peer-reviewed article of this preprint also exists.

Submitted:

20 November 2025

Posted:

27 November 2025

You are already at the latest version

Abstract

Background: Individual differences in immune responses to African Swine Fever Virus (ASFV), whether induced by vaccination or natural infection, may be linked to genetic variation in genes involved in antigen presentation. Methods: A total of nine pigs from the 112-population were selected for RNA-seq analysis. To pinpoint key transcription factors (TF) regulating gene expression in the lymph nodes, Weighted Kendall's Tau rank correlation analysis was to link the TF binding potential with the extent of differential expression of target genes. Results: CD8+ T cells expressing a specific epitope of the ASFV p72 protein (ACD8+) accounted for 41% of the total CD8+ T cells in peripheral blood. A total of 2,062 transcripts were identified as differentially expressed across the nine pigs (q-value < 1E-8). Differential expression levels of the target genes for MECP2, ETS1, ZBTB33, ELK4, and E2F4 were significantly correlated with their TF binding potential (P < 0.05). Six SNPs were identified in the promoter region of ELK4. Analysis of the 112-pig population revealed that SNPs at S.-404A>G and S.-668C>T loci were significantly associated with ACD8+ levels (q-value < 0.01). Individuals with the AA genotype at S.-404A>G had significantly higher ACD8+ counts compared to those with AG and GG genotypes (q-value < 0.05). At the S.-668C>T locus, ACD8+ levels were highest in the CC genotype, followed by CT and TT genotypes, with CC showing notably higher ACD8+ counts (q-value < 0.05). Notably, the S.-404A>G site overlaps with potential binding sites for TFs FOXA2, GATAs, and TRPS1, while the S.-668C>T site lies within the binding regions for NR1H3, RARA, VDR, and NR1I3. Conclusion: These mutations may disrupt TFs binding to the ELK4 promoter, potentially reducing ELK4 expression and impairing antigen processing and presentation.

Keywords: 
;  ;  ;  

1. Introduction

African swine fever virus (ASFV) was first identified in Kenya, Africa, in 1921, and it is currently prevalent in several African countries or regions [1]. The disease spread to China in 2018 [2]. By 2024, the Ministry of Agriculture of China reported over 190 outbreaks of ASFV, leading to the culling of more than 1.2 million pigs. This has resulted in a significant decline in the pig inventory and a notable increase in pork prices. ASFV poses serious challenges to the development of China's pig industry and stability of pork supply.
At present, the development of ASFV vaccines remains a major challenge. The immunogenicity of inactivated vaccines, subunit and gene deletion vaccines is not fully understood. These vaccines may fail to provide comprehensive protective after vaccination [3,4,5]. Research has demonstrated that key structural proteins of ASFV, such as the p72 protein on the capsid surface, and the CD2v protein on the envelope, are important for eliciting a humoral immune response [6]. Both CD2v and p72 are involved in the adsorption of ASFV to erythrocytes and macrophages. These proteins play a role in inducing neutralizing antibodies, thereby preventing ASFV from binding to target cells. These proteins are commonly used as key markers for ASFV serological diagnosis and vaccine development [7,8,9]. However, substantial individual variations in immune response to ASFV inactivated, subunit, and gene deletion vaccines have been observed. Sandra Blome et al. found that approximately 60% of the pigs vaccinated with the inactivated ASFV vaccine exhibited acute and fatal symptoms after ASFV challenge [10,11,12]. Similarly, Jankovic et al. demonstrated that the subunit vaccine provided protection in up to 60% of the pigs [13,14,15,16]. The protective effect of the gene deletion vaccine is uncertain at present [5], and the immunogenicity of ASFV is reduced to 66% due to the deletion of some virulence genes [17]. Huaji Qiu, Chungen Pan, and others reviewed of the latest research progress and concluded that a significant gap remains between the development of the ASFV vaccine and its practical application. Ogweng Bisimwa et al. further highlighted that differences in immune responses to ASFV among individuals might be related to genetic variations within the pigs [18,19].
A pivotal aspect of developing novel control strategies lies in understanding the intricate virus-host interplay. ASFV, with its relatively compact genome, is heavily reliant on hijacking the host's cellular machinery to facilitate its own replication. Therefore, identifying key host transcriptional factors, such as ELK4 and MECP2, that are cooped by the virus is particularly valuable. These regulators represent critical cellular dependencies that ASFV must exploit to successfully establish infection. Targeting these host factors therapeutically could potentially restrict viral replication without directly targeting the virus itself, thereby circumventing the challenge of viral mutation and offering a promising avenue for the development of broad-spectrum antiviral interventions.
Identifying the TFs and molecular markers associated with the ASFV cellular immune response can be achieved by screening individuals with strong anti-ASFV capabilities, collecting samples with varying levels of cellular immune responses, and integrating pig genome sequencing with bioinformatics analysis. This approach is critical for advancing ASFV research, vaccine development, and the creation of ASFV-resistant pig breeds. In animals, cellular and humoral immunity play vital roles in resistance to viral infection [20]. Antigen presentation bridges cellular and humoral immune responses within adaptive immunity [21]. The Activation of T and B cells is dependent on antigen presentation in ASFV-infected pigs [2,22]. Antigen-presenting cells (APCs), which include dendritic cells, macrophages, and B cells, capture foreign antigens through phagocytosis, endocytosis, or receptor-mediated internalization. These cells then process the antigens into short peptide fragments using lysosomes or proteasomes. Subsequently, these antigenic peptide fragments bind to major histocompatibility complex (MHC) class I or II molecules, forming antigenic peptide-MHC complexes. These complexes are then presented on the cell surface for recognition [23]. APC migrates to the secondary lymphoid organs where they activate CD8+ T cells or CD4+ Th cells through the specific recognition of MHC-antigenic peptide-T cell receptor (TCR) ternary complex. This, in turn, results in the further activation of both cellular and humoral immunity [21]. In cellular immunity activation, the efficiency and accuracy of antigen presentation directly determine the intensity and quality of subsequent CD8+ T and CD4+ Th cell responses [24].
In this study, we first identified the potential antigenic epitopes of the ASFV p72 protein by MHC tetramers staining and antigen-specific CD8+ T cell flow cytometry. We then compared the transcriptomes of submandibular lymph nodes with different antigen-specific CD8+ T cells (ACD8+) levels by RNA-seq. A weighted Kendall's Tau rank correlation test of extent of differential expression and potential of TF binding as employed to identify TFs that regulate the ACD8+. ELK4 was identified as a key candidate gene in this analysis. Finally, we analyzed the role of ELK4 in regulating CD8+ T cell abundance using SNP-scanning, MHC-I tetramer-specific T cell flow cytometry, and association analysis.

2. Materials and Methods

2.1. Experimental Materials

The peripheral blood samples of the Landrace × Large White × Duroc pigs (4 weeks of age) in this study were obtained from the ASFV-infected pig farm in Jingzhou, Hubei Province, where ASFV infection was first detected in August 2019. Following the implementation of Real-time PCR detection and precision depopulation measures, the pig farm successfully curtailed the ASFV outbreak and achieved re-population in September 2022. In this experiment, the 112 animals were negative for ASFV based on Real-time PCR assay and exhibited no symptoms of infection. However, 57 (51%) animals were positive for ASFV p72 antibody. Peripheral blood samples were collected from the animals, diluted with an equal volume of RPMI, and then, PBMCs were isolated using Ficoll-Hypaque density gradient centrifugation and cryopreserved.
The collection of samples in this study was conducted in accordance with the Regulations for the Administration of Experimental Animals issued by the Science and Technology Commission of China (NO. 2006-398). All procedures involving animals were approved by the Animal Ethics Commission of Yangtze University (Jingzhou, Hubei, China). The piglets were first sedated via intramuscular injection of a combination of tiletamine-zolazepam (5 mg/kg) and xylazine (2 mg/kg). Following the induction of loss of consciousness, complete euthanasia was achieved by the administration of an intravenous overdose of sodium pentobarbital (100 mg/kg). Death was confirmed by the absence of a corneal reflex and the cessation of both respiration and heartbeat. Immediately, submandibular lymph node samples were meticulously collected using sterile surgical instruments. Each sample was divided into aliquots, snap-frozen in liquid nitrogen, and stored at -80°C for subsequent molecular analysis.
The MHC tetramers were generated following the method outlined by Pedersen [25,26,27]. First, transfer 30 µL of fixed peptide monomer into a 1.5 mL Eppendorf tube. Subsequently, 3.3 µL of FITC-conjugated streptavidin (Cell Signaling, 34524) was added, and the mixed vigorously. Incubate the mixture on ice in the dark for 30 minutes. Prepare the blocking solution by adding 1.6 µL of 50 mM D-Biotin and 6 µL of 10% (w/v) NaN3 to 192.4 µL of PBS and mixing by vertexing. After the incubation, add 2.4 µL of blocking solution to the mixture to stop the reaction. Incubate the tubes at 4°C overnight.

2.2. Testing the abundance of CD8+ T cells specific for ASFV p72 protein peptide

The flow cytometry assay was performed in accordance with the following protocol. First, the assembled tetramers were centrifugated in tubes at 2500 x g for 5 minutes at 4°C. Subsequently, the solution was kept on ice in the dark. Add 2 x 10⁶ cells to a 96-well U-bottom plate, then adjust the volume of the solution to 200 µL with Cell Staining Buffer. Add 2 µL of the previously prepared tetramers. Mix and incubate on ice in the dark for 30 minutes. Prepare the PE-conjugated CD8+ surface marker antibody (ThermoFisher, 76-2-11) and incubate for 30 minutes on ice in the dark. Wash the cells with staining buffer twice. Resuspend cells with staining buffer. The acquisition of samples on a flow cytometer, with the appropriate settings within two hours. Live cells were gated based on FSC-A and SSC-A characteristics to exclude debris. Live cells were subsequently gated using PE-conjugated CD8+ versus FITC-conjugated streptavidin signal to identify ACD8+ cells.

2.3. High Throughput Sequencing

From the 112 animals assayed for the ACD8+, three animals for each group were selected for antigen-specific CD8+ T cell abundance at 5% (low), 50% (medium), and 95% (high) of all the samples (six females and three castrated males). Tissue samples were mixed with 1 mL of Trizol reagent and snap frozen in liquid nitrogen. Subsequently, the samples were transferred to the designated DNA facility with dry ice for RNA-seq analysis. The samples for RIN scores > 0.9 were selected for the following analysis. The sequencing library preparation was carried out following the protocol stipulated by the Illumina TruSeq RNA sample preparation kit (Illumina Inc., USA). Approximately 10 μg of total RNA from each sample was utilized for library construction and RNA sequencing. The Sequencing was performed on an Illumina HiSeq 2500 sequencer (Illumina Inc., USA) using a single-read sequencing method (50bp). Subsequently, a data filtration process was implemented to obtain high-quality, clean reads, and to remove low-quality reads present in the raw reads, and the quality of the raw sequencing reads was assessed as recommended by the manufacturer. The Hisat2 [28] software was employed to map clean reads to the reference genome (Sus Scrofa 11.1), which was extracted from the NCBI genome database [29]. The calculated reads count per gene was estimated by Htseq-count [30] and used to compare the difference in gene expression among samples. The library was normalized using median of ratios method and the DEseq2 R package [31] was utilized for the identification of differentially expressed genes with an FDR (false discovery rate) of ≤ 0.05 and an FC (fold change) of ≥ 1.5 or ≤ 0.67. The differentially expressed genes were annotated using DAVID annotation tool. All data relevant to this study have been deposited in the NCBI GEO database under accession number GSEXXXXX (Data temporarily available at https://t3.znas.cn/g6ujwMnbv63, will be deposited in GEO after NCBI services are recovered.).

2.4. Identification of key transcription factors

The identification of the key TFs that regulate the differentially expressed genes was achieved through a multifaceted approach. Initially, the gene sets, comprising genes targeted by a specific TF, and the gene list, containing the differentially expressed genes, were constructed. Subsequently, correlation analysis was implemented on these lists to elucidate the regulatory mechanisms. The TFBS data utilized in this study were obtained from the prediction results of GRIT-2.0. GRIT-2.0 utilized a mixed Student's t-test approach to predict TFBS, incorporating both the binding score of binding sites, denoted as Jindex (Equation 1), and the conservation characteristics of binding sites across species [32]
J i n d e x = M a x s ln k = 1 w q k ,     L k p L k w ;         1 s l w + 1
As demonstrated by Huang et al. [33] the Jindex quantifies the maximum of repeated averaging of log likelihood ratios (LLRs), which are an indicative factor of the potential presence of a motif at a specific location in a sequence. The correlation analysis was executed using the FLAVER software package. The present study employed the strategy developed by Yao [34], which was achieved by testing the significance of the correlation between the order of genes in the gene set and the corresponding order in the gene list. The analysis accentuates genes with larger weights while diminishing the emphasis on genes with smaller weights. As Shieh's research indicates, the weighted Kendall's τ assumes the form of Equation (2). The limiting distribution (LD) can be derived from Equation (3). As the value of n approaches infinity, the LD value approaches N(0, 1), and thus, the value of the p-value can be estimated.
τ w = 2 / i n v i 2 i n v i 2 · i > j n v i v j s g n i j s g n R i R j
If X <, =, or > 0, then sgn (X) = -1, 0, or 1. The vi denotes the weighting function, which is bounded by [1, n] and ranges from 0 to 1.
L D = n τ w 3 lim n n 1 x n v x 2 lim n n 1 x n v x 2
The weighting function vx employed in the test is delineated in equation (4), where x ranges from 1 to n. The vxs and vxl are the gene weights of genes in the gene set and the gene list, respectively.
v x = ( 1 v x s max v s ) · ( 1 v x l max v l ) 0.5
Figure 1. A schematic summary of the experimental workflow.
Preprints 186032 g001

2.5. Genotyping of single-nucleotide polymorphisms (SNPs) based on Sanger sequencing

The primers were designed according to the flanking sequence of the SNP sites, covering approximately 900 base pairs (bp) of the upstream region of the transcription start site (FW: 5'-AGTGCTTTTCAGATATTTCGTGT-3', RV: 5'-AGACATTCAGTCGTAGCTCCA-3'). Peripheral blood genomic DNA was extracted and utilized as a template, and the target DNA fragment was amplified by PCR (40 cycles of 95°C for 15s, 56°C for 20s, and 72°C for 15s). The amplified product is then purified to remove any residual primer and nucleotide and sent to the DNA facility. The Sanger sequencing was performed using the BigDye Terminator v3.1 kit on an ABI 3730 sequencer. The sequencing results were analyzed using DNASTAR Lasergene software. The SNP association analysis was performed using the ANOVA method in R software package. Since the 112 pigs were from a field population and the population stratification information is unknown thus confounding is not considered. We controlled the false discovery rate (FDR) using the Benjamini-Hochberg procedure for all statistical analysis in this study. A schematic summary of the experimental workflow was provided as Fig. 1. Animal information, SNP genotypes, and ACD8+ for each animal were provided in Supplemental Data 1.

3. Results

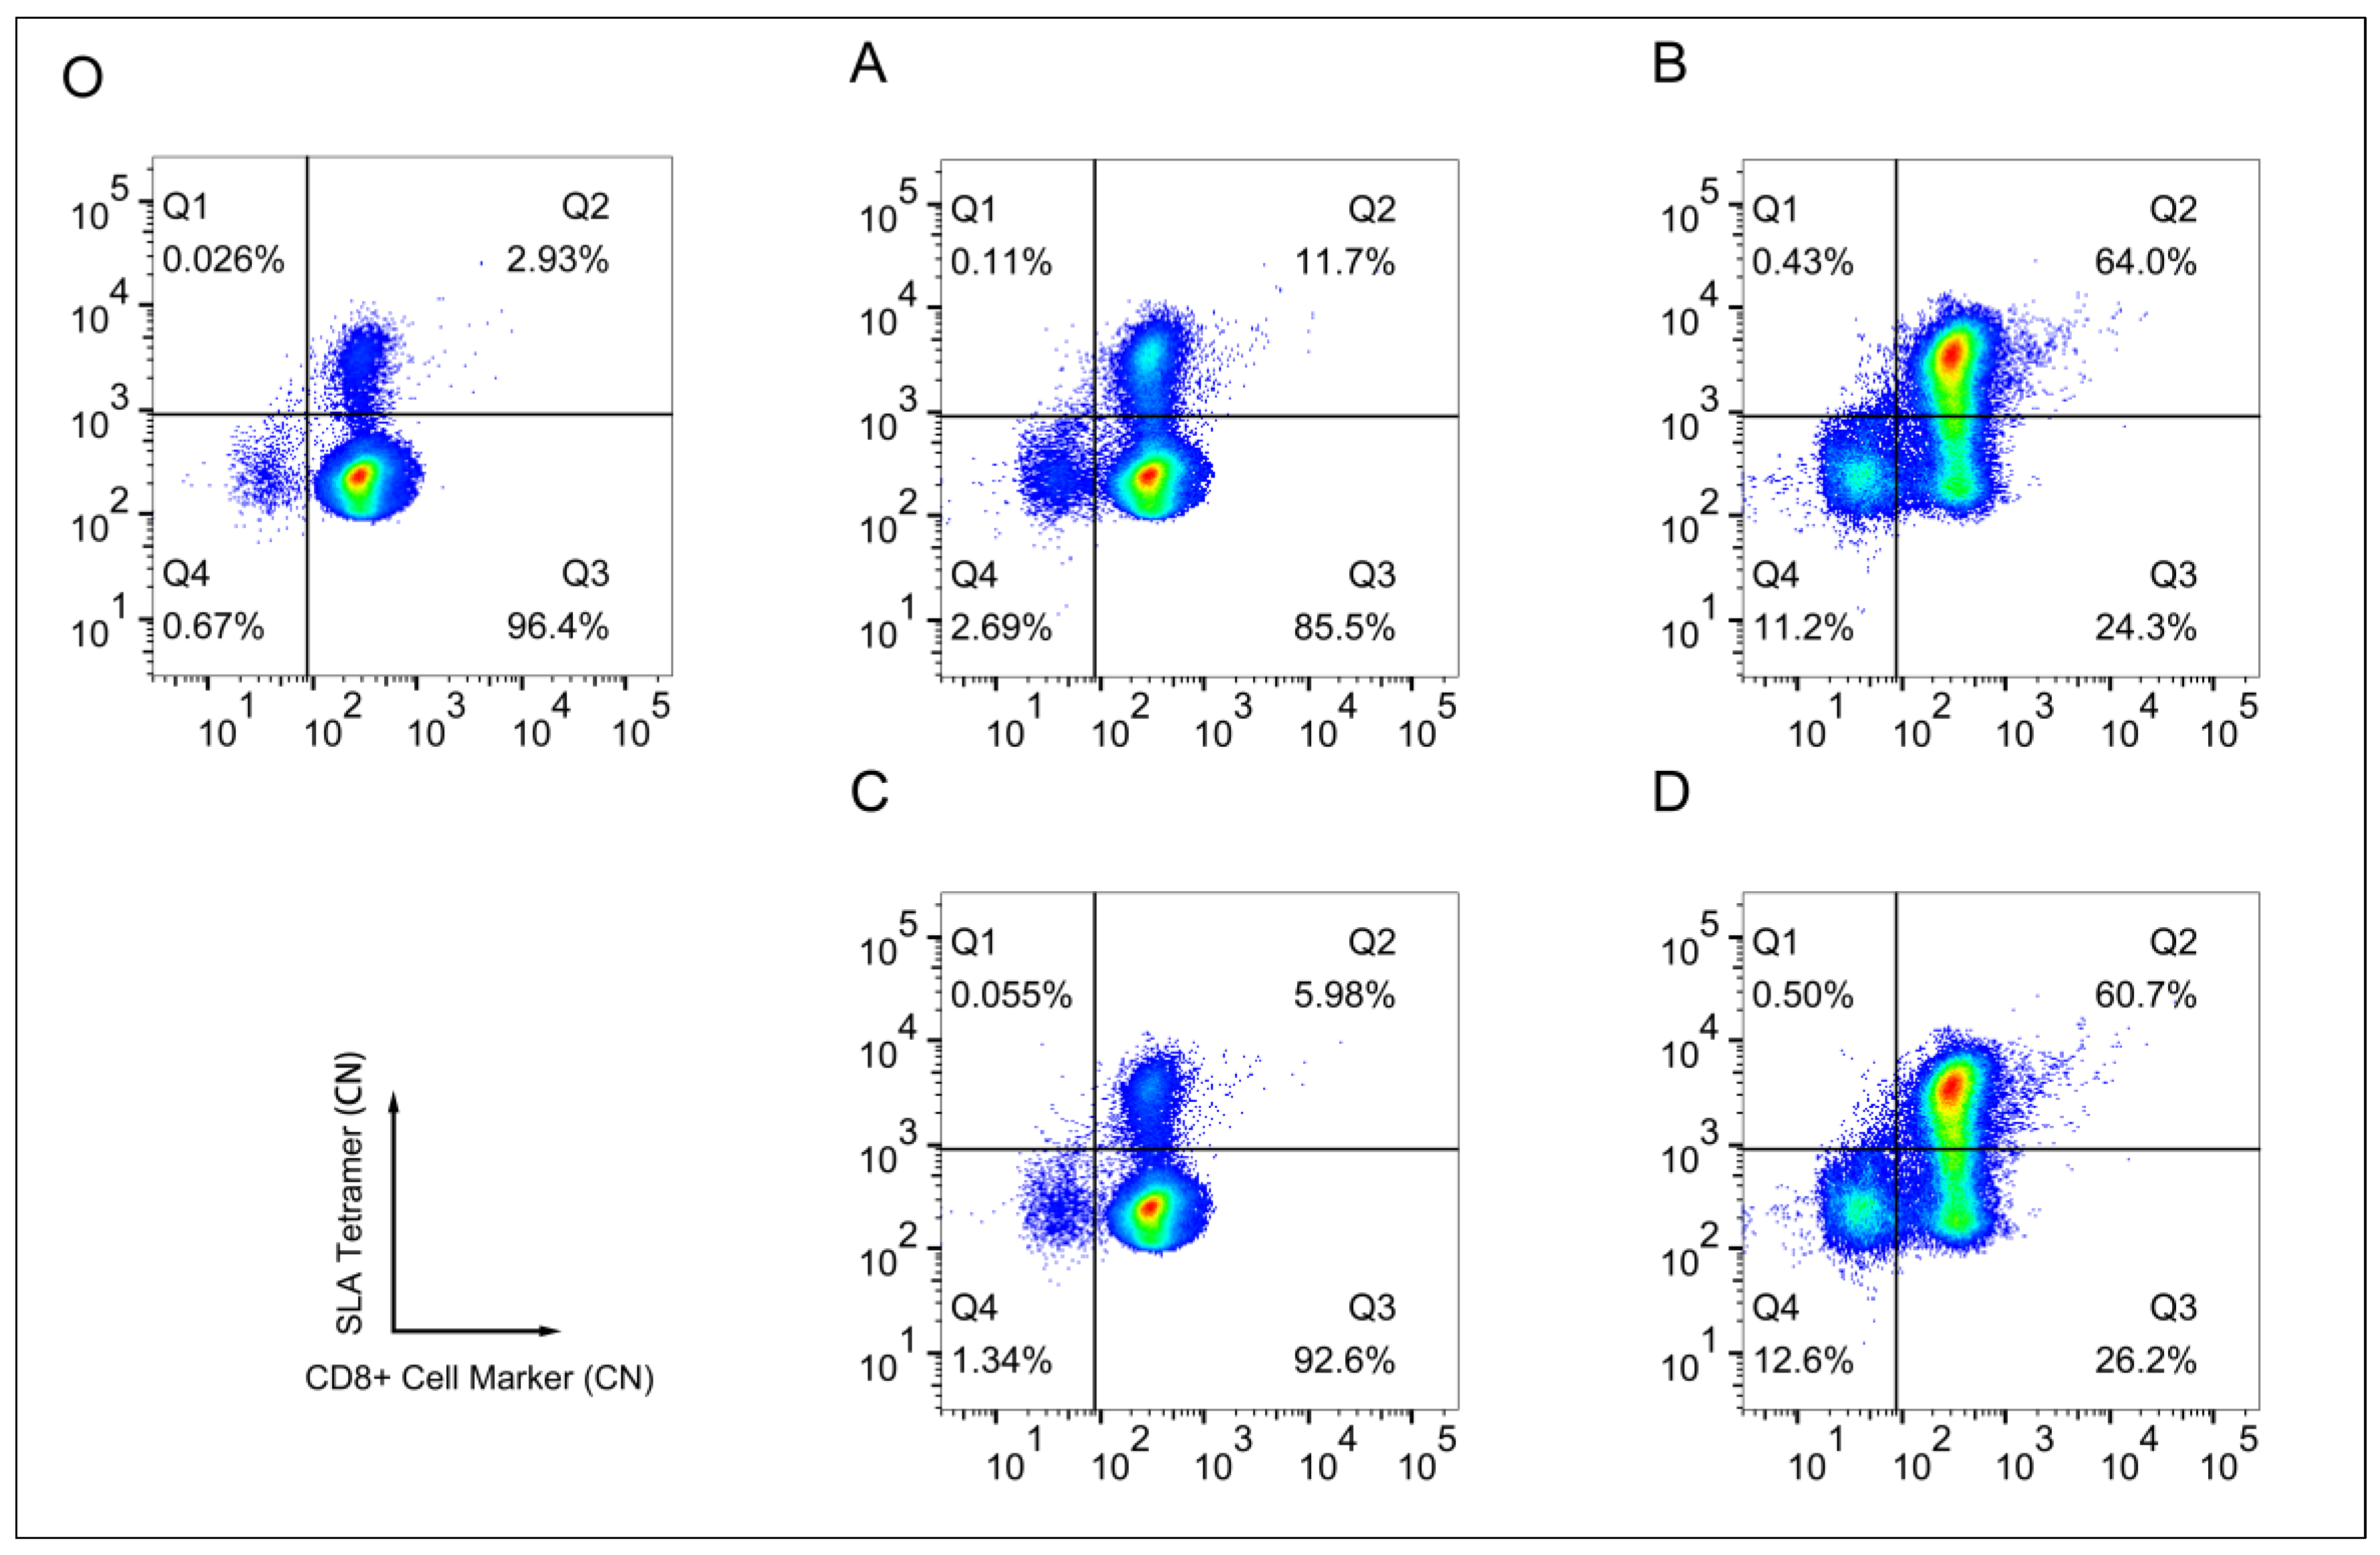
3.1. Specificity of the SLA-Peptide Tetramer Complex

The FITC-labeled tetrameric complexes of SLA-1 (HET-1) folded with the SQIEETHLV peptide from the ASFV p72 protein, and FITC-labeled tetrameric complexes of SLA-1 (HET-2) folded with the FVTPEIHNL peptide from the ASFV p72 protein, were prepared. The flow cytometry analysis obtained over 106 events for each sample. The results demonstrated that HET-1-stained specific T cells from ASFV p72 antibody-positive individuals (Figure 2B) but not from other ASFV p72 antibody-negative individuals (Figure 2A). This finding thus confirmed the specificity of tetramer staining. Similarly testing the specificity of HET-2 found that the tetramer could stain CD8+ T cells from p72 antibody-positive individuals, but not CD8+ T cells from other p72 antibody-negative individuals (Figure 1C and D). Given that HET-1 exhibits a marginally higher degree of sensitivity compared to HET-2, the HET-1 was utilized in the subsequent experimental phase to investigate the ACD8+.

3.2. Lymph node transcriptome analysis of individuals with varying levels of antigen specific CD8+ T cells

A total of 112 animals were assayed for the ACD8+, the results of which are shown in Fig. 3. From this data set, three animals for each group were selected for antigen-specific CD8+ T cell abundance at 5% (low), 50% (medium), and 95% (high) of all the samples. No criteria were set for including and excluding animals, and confounders were not controlled. Subsequently, RNA-seq sequencing of submandibular lymph node tissue was performed in three animals per group. The RNA-seq sequencing results demonstrated an average of 32 million sequences per sample. A total of 22,301 transcripts has been identified, with an average 21 million reads per sample were obtained. The analysis revealed that 2,049 transcripts exhibited significant differential expression (FDR < 1E-8) between the groups with high and low ACD8+ levels. The top 30 differentially expressed genes are listed in Table 1. A total of 1,017 transcripts were found to be significantly differentially expressed (FDR < 1E-8) between the medium and low ACD8+ level groups. The top 30 differentially expressed genes are listed in Table 2. A total of 196 transcripts were significantly differentially expressed (FDR < 0.05) between the high and medium levels of antigen-specific CD8+ T cells. For a comprehensive list of the differential genes compared in each group, refer to Supplemental Data 2. Four genes, ELK4, ETS1, MECP2, and ZBTB33, were selected for Real-time PCR validation, and the Real-time PCR results are consistent with the RNA-seq results (Fig. 4, primer sequences shown in Supplemental Document 1).
ASFV has been shown to cause host transcriptome remodeling by regulating inflammatory response, interferon response, apoptosis, autophagy, antigen presentation, and adaptive immunity [35,36]. Comparing the animals exhibited high and low levels of ACD8+ revealed the presence of 61 inflammation-related genes, including IL33, FASN, TGFB1, DAGLA, and PSMA1, which showed significant upregulation. This upregulation was associated with the characteristic symptoms of ASF, including high fever and systemic inflammation, which are the primary causes of mortality. A significant number of proteins encoded by ASFV, including I329L, A528R, and EP402R (CD2v), can effectively inhibit the production and signal transduction of interferon within the host organism, thus enabling evasion of the innate immune response [37,38,39]. In this study, 14 interferon-production-related genes, such as ZFPM1, BCL3, SCRIB, RARA, and RBX1, exhibited significant differential expressions between high and low ACD8+ cells. In certain instances, the virus has been observed to inhibit early apoptosis, thereby promoting its replication. Conversely, in other instances, the virus has been found to trigger late apoptosis, thus facilitating viral release [40,41,42]. In this study, we observed four apoptosis-related genes (BOK, TAOK1, CASP8, CASP3) and 51 autophagy-related genes (SEC16A, USP20, RAB1A, PLEKHF1, ATG2A) that exhibited significant differential expressions between high and low levels of ACD8+ cells. Most importantly, ASFV inhibits the expression of major histocompatibility complex (MHC) class Ⅰ and Ⅱ molecules. This results in a direct impairment of T-cell recognition and activation, consequently leading to a failure of the adaptive immune response. This phenomenon, among others, has led to the observation that some pigs that have recovered from infection often exhibit weak immunity, which complicates the development of vaccines [43,44,45]. In the present study, seven MHC I-associated genes and six MHC II genes (i.e., MARCHF1, CIITA, IDE, CTSS, TAF7) were observed to be differentially expressed. In addition, ten adaptive immune response genes (i.e., CTSS, CREG1, JCHAIN, AKIRIN2, and CSK) were identified as differentially expressed. ASFV has been observed to regulate the antigen presentation process in the host by altering the expression pattern of these genes.
Figure 3. The 112 pigs’ population exhibited different abundances of antigen specific CD8+ T cells. Bar height is a quantitative metric representing the proportion of antigen-specific CD8+ T-positive cells as determined by flow cytometry. The yellow bars represent the samples selected for RNA-seq sequencing, with the selection criteria delineated as follows: animals at 5% (low), 50% (medium), and 95% (high).
Preprints 186032 g003
Figure 4. Real-time PCR validation of representative differentially expressed genes. Plot A to D shows results for ELK4, ETS1, MECP2, ZBTB33, respectively. The height of the bars shows relative expression levels which is normalized with the house keeping gene GAPDH.
Preprints 186032 g004

3.3. Identification of key transcription factors for antigen-specific CD8+ T cell's abundance

The FLAVER analysis identified 95 TFs as significant regulators in the correlation test between the differentially expressed gene list identified in the high and low ACD8+ cell groups (FDR < 1E-7, top 30 listed in Table 3). A total of 77 TFs were identified as significant regulators for the genes in the differentially expressed gene list between the medium and low ACD8+ cell groups (FDR < 1E-7, top 30 listed in Table 4). Among the groups, the most significant TFs included G4204_MECP2, MA0098.3_ETS1, G56805_ZBTB33, G2002_ELK1, MA0076.2_ELK4, MA1564.1_SP9, and G104394_E2f4. A correlation graph for a representative TF, ELK4, was shown on Fig. 5. MECP2 itself was down-regulated 5.19-fold (q-value < 1E-11) between the high and low groups and 3.14-fold (q-value < 1E-5) between the medium and low groups. The transcription levels of ETS1 and E2f4 did not significantly differ between the high/low and medium/low groups. ZBTB33 demonstrated a 9.79-fold increase (q-value < 1E-9) between the high and low groups and a 7.48-fold increase (q-value < 1E-6) between the medium and low groups. The transcription levels of ELK1 and SP9 in submandibular lymph nodes were below 10 copies. ELK4 expression was found to be significantly elevated in both the high- and medium-low groups, with a 10.05-fold increase (P-value < 1E-24) and a 9.25-fold increase (P-value < 1E-18), respectively. These results suggest that ASFV may achieve immune evasion by altering the transcription levels of MECP2, ZBTB33, and ELK4 in the host. Given the absence of a substantial difference in the transcription levels of ETS1 and E2F4 among the high/low and t medium/low groups, it was hypothesized that ASFV might exert its function by modulating their product at post-transcriptional or protein levels. Functional annotation found that 18 of the 44 genes comprising the class Ⅰ MHC mediated antigen processing presentation signaling pathway have ELK4 binding sites in their promoters as predicted by GRIT software package (Table 5). ELK4 may be an important target molecule responsible for the differences in the ACD8+ between groups.
Figure 5. The correlation graph for target genes for ELK4 transcription factor. Plot A and B illustrated the genes have or have not ELK4 binding site. The x axis represented the rank values of the extent of deferential expression. Bar height is a quantitative metric representing the potential of binding with ELK4. Bars highlighted with green represented the antigen processing and representation genes.
Preprints 186032 g005

3.4. SNP genotyping and association analysis with the abundance of antigen-specific T cells

DNA sequencing revealed six DNA mutations in the promoter region of ELK4. Although ELK4 is a TF, it does not have enzymatic activity itself but plays a pivotal role in the regulation of genes function in selective protein degradation within cells. This process is critical for various biological functions, including the cell proliferation cycle, stress response, and immune response. The proteasome degradation pathway facilitates this regulatory function of ELK4. Polypeptides formed by the degradation of foreign proteins by ELK4’s targets are utilized for MHC class I antigen presentation, thereby inducing specific cellular immune responses. Furthermore, ELK4’s targets genes have been identified as being closely associated with antigen presentation. The S.-404A>G mutation of the ELK4 gene formulated three distinct genotypes among the 112 pigs examined. The observed genotype frequencies were AA: 0.05, AG: 0.21, and GG: 0.74, which is significantly deviated from the Hardy-Weinberg equilibrium. The frequency of allele A and G was determined to be 0.15 and 0.85 respectively. The ACD8+ in the samples of 112 pigs with GG, AG, and AA genotypes was 0.21 ± 0.102, 0.28 ± 0.077, and 0.39 ± 0.075, respectively. This indicated a trend of GG < AG < AA. A statistically significant discrepancy was observed between AA and AG, GG genotype (q-value < 0.05). Three genotypes of the ELK4 gene were formulated in the study of 112 pigs through the S.-668C>T mutation. The observed genotype frequencies were CC: 0.02, CT: 0.3, and TT: 0.68, which is significantly deviated from the Hardy-Weinberg equilibrium. The frequency of allele C and T was 0.17 and 0.83, respectively. The ACD8+ in samples of 112 pigs with the CC genotype was 0.41 ± 0.067, the CT genotype was 0.27 ± 0.061, and the TT genotype was 0.19 ± 0.079. The ACD8+ exhibited a descending trend, with TT ranking at the highest, CT and CC ranking at the lowest. The CC genotype exhibited a significantly higher ACD8+ than that CT and TT genotypes (q-value < 0.05). ACD8+ was not significant between genotypes of other mutation sites. Further analysis indicated that the sex factor does not associate with ACD8+.
Table 6. Antigen-specific CD8+ T Cell Abundance and the Genetic Variation of Single-Nucleotide Polymorphisms (SNP) in Individuals.
SNP ID Antigen-specific CD8+ Cell Abundance for Genotype Overlap with Transcription Factor Binding Site
XX Xx xx
S.-291C>T 0.36±0.1a 0.34±0.1a 0.31±0.11a G7566_ZNF18
S.-404A>G 0.39±0.08a 0.28±0.08b 0.21±0.1b G15376_Foxa2, MA0036.3_GATA2, MA0037.4_Gata3, MA0482.2_GATA4, MA1104.2_GATA6, MA1970.1_TRPS1
S.-463A>C 0.36±0.09a 0.35±0.1a 0.34±0.09a G20852_Stat6
S.-604C>T 0.36±0.1a 0.35±0.08a 0.36±0.11a G4772_NFATC1
S.-668C>T 0.41±0.07a 0.27±0.06b 0.19±0.08b G10062_NR1H3, G12355_Nr1i3, G22337_Vdr, G5914_RARA, G7421_VDR, G9970_NR1I3
S.-808G>A 0.36±0.09a 0.35±0.11a 0.42±0.1a MA0102.4_CEBPA
Note: S.-291C > T indicates a C to T mutation at base 291, located upstream of the transcription start site. This nomenclature is universally applied to analogous sites. XX represents the dominant homozygote genotype, Xx represents the heterozygote genotype, and xx represents the recessive homozygote genotype.

4. Discussion

Antigen-specific T cells are a critical component of the adaptive immune response. These cells specifically recognize antigenic peptides presented by major histocompatibility complex (MHC) molecules through their T cell receptors (TCRs), and they play a pivotal role in anti-infection, anti-tumor, and immune regulation [46]. The Activation of these cells requires a dual signal: a primary signal derived from the MHC-peptide-TCR trimolecular complex, and a secondary signal provided by a costimulatory molecule such as CD28/B7. This process ultimately results in the differentiation of effector T cells, including CD8+ cytotoxic T cells, CD4+ helper T cells, and memory T cells [47]. Research has demonstrated that the clonal expansion, functional polarization, and memory formation of antigen-specific T cells directly impact the strength and durability of the immune response [48].
This study examined the ACD8+ abundance variations (ASFV p70 protein) in a small population of ASFV restored pig farms. We combined this with transcriptome sequencing to identify the key TFs regulating ASFV ACD8+ abundance. In this study, we sought to quantify and characterize ASFV antigen-specific CD8+ T cells directly. To this end, we prepared tetrameric complexes of SLA-1 folded with the SQIEETHLV epitope of the ASFV p72 protein and the FVTPEIHNL epitope, respectively. Preliminary studies have demonstrated that the tetrameric complex stains ACD8+ from individuals who are positive for p72 antibody, but not from individuals who are negative for p72 antibody. Subsequently, the tetramer was employed to investigate the ACD8+ abundance within the experimental population. The method provides a reliable quantitative measure for the antigen presentation process in ASFV infection. The present study also employed correlation analysis, which was implemented in the FLAVER software package developed by Yao et al. [32,33,34] to test the significance of the correlation between the order of genes in the gene set and the corresponding order in the gene list. The FLAVER is a software package that has been developed to identify the key TFs from data derived from transcriptomes.
Among the key TFs identified by transcriptome sequencing, MECP2 has been shown to recognize and bind methylated cytosine (5mC) on DNA, and to recruit other protein complexes (such as histone deacetylase HDACs, Sin3A, etc.) to modify chromatin structure [49]. MECP2 has been reported to suppress the expression of antigen presentation–related molecules. In macrophages, MECP2 has been observed to bind to the promoter region of the CIITA (an MHC-Ⅱ trans-activator) gene, thereby negatively regulating the expression level of MHC-Ⅱ molecules [50]. Antigen-presenting cells (APCs) lacking functional MECP2 may therefore display elevated levels of antigen presentation. ETS1 has been demonstrated to play an active and positive regulatory role in antigen presentation. This agent enhances the function of APCs, such as dendritic cells, by directly binding to and activating genes encoding key antigen-presenting elements. This, in turn, promotes the activation of T cells and the initiation of adaptive immune responses [51]. The ETS1 protein has been observed to bind directly to the promoter region of the CIITA gene. ETS1 is also play roles in regulating genes involved in antigen processing, such as CD74 [52], a molecule that plays a key role in the assembly and peptide loading of MHC-Ⅱ molecules. E2F4 can bind directly to the promoter region of the CIITA gene. This binding may result in the regulation of MHC-Ⅱ related genes. In contrast, the roles of ZBTB33, ELK1, and SP9 in antigen presentation have received less attention from the research community.
Previous research has shown that the knockout of ELK4 impairs cell proliferation and disrupts the cell cycle in bone marrow-derived mast cells (BMMCs), which is associated by reduced transcription of cell cycle related genes [53]. Furthermore, the study observed a decrease in the transcriptional activation of cytokines and chemokines, accompanied by an increase in mast cell degranulation, in ELK4 knockout BMMCs [53]. Studies showed that the repression of ELK4 results in the augmentation of macrophage markers, including CD86 and iNOS, as well as p38/JNK phosphorylation. Concurrently, this process fosters the expression of mesenchymal markers, such as N-cadherin and Vimentin, while concomitantly inhibiting E-cadherin [54]. The reduced expression of ELK4 activates the p38 and ERK signaling pathways in the MAPK signaling pathway, promoting the polarization of macrophages toward the M1 phenotype [54]. In mice lacking ELK4 and ELK1, higher level of innate-like αβ CD8+ T cells develop, which populate the periphery [55]. Further studies have indicated that SRF utilizes MKL1/2 to fulfill steady-state cellular functions, including cytoskeletal organization, and utilizes ELK4 to facilitate acute responses to external infection [56].
In this study, ELK4 regulated several important genes in CLASS I MHC mediated antigen processing presentation signaling pathways. Furthermore, ELK4 expression was significantly overexpressed in high antigen-specific CD8+ T cells. It is hypothesized that the increase in ELK4 expression level may promote the expression of antigen-presenting genes in MHC-I, which could result in a shift in the ACD8+ among groups. The reduced expression level of ELK4 in the mutant group relative to the wild-type group may be attributable to the S.-404A>G and S.-668C>T mutations in the promoter region. These mutations appear to disrupt the binding of TFs FOXA2, GATAs, TRPS1, NR1H3, RARA, VDR, and NR1I3, thereby reducing the transcription level of ELK4. A key limitation of this study is the relatively small sample size (n=9). The statistical power to detect differentially expressed genes (DEGs) is constrained. This increases the likelihood of both Type II errors (false negatives), where true differential expression is missed, and complicates the reliable estimation of gene expression variance. Consequently, our findings should be interpreted as highlighting the most robust transcriptional changes. While our transcriptome data provides strong correlation evidence for the transcription factors and the target genes, this study does not include functional validation to establish a direct causal relationship. To address this, future in vivo assays and animal models research is recommended to elucidate the underlying mechanism and strengthen our conclusions.

Supplementary Materials

Supplementary Data 1, Animal Information, SNP Genotypes, and ACD8+ for Each Animal; Supplementary Data 2, Full Tables of Differentially Expressed Genes; Supplemental Document 1, PCR primer sequences.

Author Contributions

Conceptualization, THH, JWW, MY, and GPL; Methodology, FHZ, SQN, AAF, and BAA; Software, THH; Writing – Original Draft Preparation, THH; Writing – Review & Editing, FHZ, SQN, JWW; Supervision, THH; Funding Acquisition, THH and MY.

Funding

This project was funded by the Science and Technology Project for Regional Innovation of Hubei Province [Grant No. 2024EHA010], National Natural Science Foundation of China [NSFC Grant No. 31902231], the College Students' Innovation and Entrepreneurship Training Program of Yangtze University [Grant No. Yz2025090].

Institutional Review Board Statement

The collection of samples in this study was conducted in accordance with the Regulations for the Administration of Experimental Animals issued by the Science and Technology Commission of China (NO. 2006-398). All procedures involving animals were approved by the Animal Ethics Commission of Yangtze University (Jingzhou, Hubei, China).

Data Availability Statement

All data relevant to this study have been deposited in the NCBI GEO database under accession number GSEXXXXX. (Data temporarily available at https://t3.znas.cn/g6ujwMnbv63, will be deposited in GEO after NCBI services are recovered.)

Acknowledgments

We thank Editage for proofreading the manuscript

Conflicts of Interest

The authors declare no conflict of interest.

References

  1. Eustace Montgomery, R. On A Form of Swine Fever Occurring in British East Africa (Kenya Colony). Journal of Comparative Pathology and Therapeutics 1921, 34, 159–191. [Google Scholar] [CrossRef]
  2. Dixon, L.K.; Islam, M.; Nash, R.; Reis, A.L. African swine fever virus evasion of host defences. Virus Res 2019, 266, 25–33. [Google Scholar] [CrossRef]
  3. Cadenas-Fernández, E.; Sánchez-Vizcaíno, J.M.; van den Born, E.; Kosowska, A.; van Kilsdonk, E.; Fernández-Pacheco, P.; Gallardo, C.; Arias, M.; Barasona, J.A. High Doses of Inactivated African Swine Fever Virus Are Safe, but Do Not Confer Protection against a Virulent Challenge. Vaccines (Basel) 2021, 9, 242. [Google Scholar] [CrossRef] [PubMed]
  4. Arias, M.; de la Torre, A.; Dixon, L.; Gallardo, C.; Jori, F.; Laddomada, A.; Martins, C.; Parkhouse, R.M.; Revilla, Y.; Rodriguez, F.A.J. Approaches and Perspectives for Development of African Swine Fever Virus Vaccines. Vaccines (Basel) 2017, 5, 35. [Google Scholar] [CrossRef] [PubMed]
  5. Fan, J.; Yu, H.; Miao, F.; Ke, J.; Hu, R. Attenuated African swine fever viruses and the live vaccine candidates: a comprehensive review. Microbiol Spectr 2024, 12, e0319923. [Google Scholar] [CrossRef]
  6. Muñoz, A.L.; Tabarés, E. Characteristics of the major structural proteins of African swine fever virus: Role as antigens in the induction of neutralizing antibodies. A review. Virology 2022, 571, 46–51. [Google Scholar] [CrossRef]
  7. Liu, S.; Ding, P.; Du, Y.; Ren, D.; Chen, Y.; Li, M.; Sun, X.; Wang, S.; Chang, Z.; Li, R.; et al. Development and characterization of monoclonal antibodies against the extracellular domain of African swine fever virus structural protein, CD2v. Front Microbiol 2022, 13, 1056117. [Google Scholar] [CrossRef]
  8. Yin, D.; Geng, R.; Shao, H.; Ye, J.; Qian, K.; Chen, H.; Qin, A. Identification of novel linear epitopes in P72 protein of African swine fever virus recognized by monoclonal antibodies. Front Microbiol 2022, 13, 1055820. [Google Scholar] [CrossRef]
  9. Yin, D.; Shi, B.; Geng, R.; Liu, Y.; Gong, L.; Shao, H.; Qian, K.; Chen, H.; Qin, A. Function investigation of p11.5 in ASFV infection. Virol Sin 2024, 39, 469–477. [Google Scholar] [CrossRef]
  10. Forman, A.J.; Wardley, R.C.; Wilkinson, P.J. The immunological response of pigs and guinea pigs to antigens of African swine fever virus. Arch Virol 1982, 74, 91–100. [Google Scholar] [CrossRef]
  11. Mebus, C.A. African swine fever. Adv Virus Res 1988, 35, 251–269. [Google Scholar] [CrossRef]
  12. Blome, S.; Gabriel, C.; Beer, M. Modern adjuvants do not enhance the efficacy of an inactivated African swine fever virus vaccine preparation. Vaccine 2014, 32, 3879–3882. [Google Scholar] [CrossRef]
  13. Sunwoo, S.Y.; Pérez-Núñez, D.; Morozov, I.; Sánchez, E.G.; Gaudreault, N.N.; Trujillo, J.D.; Mur, L.; Nogal, M.; Madden, D.; Urbaniak, K.; et al. DNA-Protein Vaccination Strategy Does Not Protect from Challenge with African Swine Fever Virus Armenia 2007 Strain. Vaccines (Basel) 2019, 7, 12. [Google Scholar] [CrossRef]
  14. Jancovich, J.K.; Chapman, D.; Hansen, D.T.; Robida, M.D.; Loskutov, A.; Craciunescu, F.; Borovkov, A.; Kibler, K.; Goatley, L.; King, K.; et al. Immunization of Pigs by DNA Prime and Recombinant Vaccinia Virus Boost To Identify and Rank African Swine Fever Virus Immunogenic and Protective Proteins. J Virol 2018, 92. [Google Scholar] [CrossRef]
  15. Lopera-Madrid, J.; Osorio, J.E.; He, Y.; Xiang, Z.; Adams, L.G.; Laughlin, R.C.; Mwangi, W.; Subramanya, S.; Neilan, J.; Brake, D.; et al. Safety and immunogenicity of mammalian cell derived and Modified Vaccinia Ankara vectored African swine fever subunit antigens in swine. Vet Immunol Immunopathol 2017, 185, 20–33. [Google Scholar] [CrossRef]
  16. Argilaguet, J.M.; Pérez-Martín, E.; Nofrarías, M.; Gallardo, C.; Accensi, F.; Lacasta, A.; Mora, M.; Ballester, M.; Galindo-Cardiel, I.; López-Soria, S.; et al. DNA vaccination partially protects against African swine fever virus lethal challenge in the absence of antibodies. PLoS One 2012, 7, e40942. [Google Scholar] [CrossRef]
  17. Abrams, C.C.; Goatley, L.; Fishbourne, E.; Chapman, D.; Cooke, L.; Oura, C.A.; Netherton, C.L.; Takamatsu, H.H.; Dixon, L.K. Deletion of virulence associated genes from attenuated African swine fever virus isolate OUR T88/3 decreases its ability to protect against challenge with virulent virus. Virology 2013, 443, 99–105. [Google Scholar] [CrossRef]
  18. Ogweng, P.; Bowden, C.F.; Smyser, T.J.; Muwanika, V.B.; Piaggio, A.J.; Masembe, C. Ancestry and genome-wide association study of domestic pigs that survive African swine fever in Uganda. Trop Anim Health Prod 2024, 56, 366. [Google Scholar] [CrossRef]
  19. Bisimwa, P.N.; Ongus, J.R.; Tonui, R.; Bisimwa, E.B.; Steinaa, L. Resistance to African swine fever virus among African domestic pigs appears to be associated with a distinct polymorphic signature in the RelA gene and upregulation of RelA transcription. Virol J 2024, 21, 93. [Google Scholar] [CrossRef] [PubMed]
  20. Doherty, P.C.; Zinkernagel, R.M. T-cell-mediated immunopathology in viral infections. Transplant Rev 1974, 19, 89–120. [Google Scholar] [CrossRef]
  21. Banchereau, J.; Steinman, R.M. Dendritic cells and the control of immunity. Nature 1998, 392, 245–252. [Google Scholar] [CrossRef]
  22. Salguero, F.J. Comparative Pathology and Pathogenesis of African Swine Fever Infection in Swine. Front Vet Sci 2020, 7, 282. [Google Scholar] [CrossRef] [PubMed]
  23. Wolf, P.R.; Ploegh, H.L. How MHC class II molecules acquire peptide cargo: biosynthesis and trafficking through the endocytic pathway. Annu Rev Cell Dev Biol 1995, 11, 267–306. [Google Scholar] [CrossRef] [PubMed]
  24. Davis, S.J.; van der Merwe, P.A. The kinetic-segregation model: TCR triggering and beyond. Nat Immunol 2006, 7, 803–809. [Google Scholar] [CrossRef]
  25. Pedersen, L.E.; Harndahl, M.; Rasmussen, M.; Lamberth, K.; Golde, W.T.; Lund, O.; Nielsen, M.; Buus, S. Porcine major histocompatibility complex (MHC) class I molecules and analysis of their peptide-binding specificities. Immunogenetics 2011, 63, 821–834. [Google Scholar] [CrossRef]
  26. Pedersen, L.E.; Jungersen, G.; Sorensen, M.R.; Ho, C.S.; Vadekær, D.F. Swine Leukocyte Antigen (SLA) class I allele typing of Danish swine herds and identification of commonly occurring haplotypes using sequence specific low and high resolution primers. Vet Immunol Immunopathol 2014, 162, 108–116. [Google Scholar] [CrossRef]
  27. Patch, J.R.; Pedersen, L.E.; Toka, F.N.; Moraes, M.; Grubman, M.J.; Nielsen, M.; Jungersen, G.; Buus, S.; Golde, W.T. Induction of foot-and-mouth disease virus-specific cytotoxic T cell killing by vaccination. Clin Vaccine Immunol 2011, 18, 280–288. [Google Scholar] [CrossRef]
  28. Kim, D.; Paggi, J.M.; Park, C.; Bennett, C.; Salzberg, S.L. Graph-based genome alignment and genotyping with HISAT2 and HISAT-genotype. Nat Biotechnol 2019, 37, 907–915. [Google Scholar] [CrossRef]
  29. O'Leary, N.A.; Cox, E.; Holmes, J.B.; Anderson, W.R.; Falk, R.; Hem, V.; Tsuchiya, M.T.N.; Schuler, G.D.; Zhang, X.; Torcivia, J.; et al. Exploring and retrieving sequence and metadata for species across the tree of life with NCBI Datasets. Sci Data 2024, 11, 732. [Google Scholar] [CrossRef]
  30. Putri, G.H.; Anders, S.; Pyl, P.T.; Pimanda, J.E.; Zanini, F. Analysing high-throughput sequencing data in Python with HTSeq 2.0. Bioinformatics 2022, 38, 2943–2945. [Google Scholar] [CrossRef]
  31. Love, M.I.; Huber, W.; Anders, S. Moderated estimation of fold change and dispersion for RNA-seq data with DESeq2. Genome Biol 2014, 15, 550. [Google Scholar] [CrossRef] [PubMed]
  32. Huang, T.; Xiao, H.; Tian, Q.; He, Z.; Yuan, C.; Lin, Z.; Gao, X.; Yao, M. Identification of upstream transcription factor binding sites in orthologous genes using mixed Student's t-test statistics. PLoS Comput Biol 2022, 18, e1009773. [Google Scholar] [CrossRef]
  33. Huang, T.; Niu, S.; Zhang, F.; Wang, B.; Wang, J.; Liu, G.; Yao, M. Correlating gene expression levels with transcription factor binding sites facilitates identification of key transcription factors from transcriptome data. Front Genet 2024, 15, 1511456. [Google Scholar] [CrossRef]
  34. Yao, M.; He, H.; Wang, B.; Huang, X.; Zheng, S.; Wang, J.; Gao, X.; Huang, T. Testing the Significance of Ranked Gene Sets in Genome-wide Transcriptome Profiling Data Using Weighted Rank Correlation Statistics. Curr Genomics 2024, 25, 202–211. [Google Scholar] [CrossRef]
  35. Zhu, J.J.; Ramanathan, P.; Bishop, E.A.; O'Donnell, V.; Gladue, D.P.; Borca, M.V. Mechanisms of African swine fever virus pathogenesis and immune evasion inferred from gene expression changes in infected swine macrophages. PLoS One 2019, 14, e0223955. [Google Scholar] [CrossRef]
  36. Zheng, X.; Nie, S.; Feng, W.H. Regulation of antiviral immune response by African swine fever virus (ASFV). Virol Sin 2022, 37, 157–167. [Google Scholar] [CrossRef]
  37. Dobbs, N.; Burnaevskiy, N.; Chen, D.; Gonugunta, V.K.; Alto, N.M.; Yan, N. STING Activation by Translocation from the ER Is Associated with Infection and Autoinflammatory Disease. Cell Host Microbe 2015, 18, 157–168. [Google Scholar] [CrossRef]
  38. Liu, X.; Ao, D.; Jiang, S.; Xia, N.; Xu, Y.; Shao, Q.; Luo, J.; Wang, H.; Zheng, W.; Chen, N.; et al. African Swine Fever Virus A528R Inhibits TLR8 Mediated NF-κB Activity by Targeting p65 Activation and Nuclear Translocation. Viruses 2021, 13, 2046. [Google Scholar] [CrossRef]
  39. Huang, L.; Chen, W.; Liu, H.; Xue, M.; Dong, S.; Liu, X.; Feng, C.; Cao, S.; Ye, G.; Zhou, Q.; et al. African Swine Fever Virus HLJ/18 CD2v Suppresses Type I IFN Production and IFN-Stimulated Genes Expression through Negatively Regulating cGMP-AMP Synthase-STING and IFN Signaling Pathways. J Immunol 2023, 210, 1338–1350. [Google Scholar] [CrossRef] [PubMed]
  40. Nogal, M.L.; González de Buitrago, G.; Rodríguez, C.; Cubelos, B.; Carrascosa, A.L.; Salas, M.L.; Revilla, Y. African swine fever virus IAP homologue inhibits caspase activation and promotes cell survival in mammalian cells. J Virol 2001, 75, 2535–2543. [Google Scholar] [CrossRef] [PubMed]
  41. Shi, J.; Liu, W.; Zhang, M.; Sun, J.; Xu, X. The A179L Gene of African Swine Fever Virus Suppresses Virus-Induced Apoptosis but Enhances Necroptosis. Viruses 2021, 13, 2490. [Google Scholar] [CrossRef]
  42. Dixon, L.K.; Sánchez-Cordón, P.J.; Galindo, I.; Alonso, C. Investigations of Pro- and Anti-Apoptotic Factors Affecting African Swine Fever Virus Replication and Pathogenesis. Viruses 2017, 9. [Google Scholar] [CrossRef]
  43. García-Belmonte, R.; Pérez-Núñez, D.; Pittau, M.; Richt, J.A.; Revilla, Y. African Swine Fever Virus Armenia/07 Virulent Strain Controls Interferon Beta Production through the cGAS-STING Pathway. J Virol 2019, 93. [Google Scholar] [CrossRef]
  44. Hurtado, C.; Bustos, M.J.; Granja, A.G.; de León, P.; Sabina, P.; López-Viñas, E.; Gómez-Puertas, P.; Revilla, Y.; Carrascosa, A.L. The African swine fever virus lectin EP153R modulates the surface membrane expression of MHC class I antigens. Arch Virol 2011, 156, 219–234. [Google Scholar] [CrossRef]
  45. Pannhorst, K.; Carlson, J.; Hölper, J.E.; Grey, F.; Baillie, J.K.; Höper, D.; Wöhnke, E.; Franzke, K.; Karger, A.; Fuchs, W.; et al. The non-classical major histocompatibility complex II protein SLA-DM is crucial for African swine fever virus replication. Sci Rep 2023, 13, 10342. [Google Scholar] [CrossRef] [PubMed]
  46. Zinkernagel, R.M.; Doherty, P.C. Restriction of in vitro T cell-mediated cytotoxicity in lymphocytic choriomeningitis within a syngeneic or semiallogeneic system. Nature 1974, 248, 701–702. [Google Scholar] [CrossRef] [PubMed]
  47. Sallusto, F.; Lenig, D.; Förster, R.; Lipp, M.; Lanzavecchia, A. Two subsets of memory T lymphocytes with distinct homing potentials and effector functions. Nature 1999, 401, 708–712. [Google Scholar] [CrossRef] [PubMed]
  48. Zhang, N.; Bevan, M.J. CD8(+) T cells: foot soldiers of the immune system. Immunity 2011, 35, 161–168. [Google Scholar] [CrossRef]
  49. Lyst, M.J.; Bird, A. Rett syndrome: a complex disorder with simple roots. Nat Rev Genet 2015, 16, 261–275. [Google Scholar] [CrossRef]
  50. Li, C.; Jiang, S.; Liu, S.Q.; Lykken, E.; Zhao, L.T.; Sevilla, J.; Zhu, B.; Li, Q.J. MeCP2 enforces Foxp3 expression to promote regulatory T cells' resilience to inflammation. Proc Natl Acad Sci U S A 2014, 111, E2807–E2816. [Google Scholar] [CrossRef]
  51. Yang, Y.; Han, X.; Sun, L.; Shao, F.; Yin, Y.; Zhang, W. ETS Transcription Factors in Immune Cells and Immune-Related Diseases. Int J Mol Sci 2024, 25. [Google Scholar] [CrossRef] [PubMed]
  52. Wei, C.; Ma, Y.; Wang, F.; Chen, Y.; Liao, Y.; Zhao, B.; Zhao, Q.; Tang, D. Machine learning and single-cell sequencing reveal the potential regulatory factors of mitochondrial autophagy in the progression of gastric cancer. J Cancer Res Clin Oncol 2023, 149, 15561–15572. [Google Scholar] [CrossRef] [PubMed]
  53. Huang, Y.; Zhu, Z.; Li, W.; Ge, Y.; Li, Y.; Wang, J.; Peng, X.; Lin, L.; Li, J.; Liu, C.Y.; et al. ELK4 exerts opposite roles in cytokine/chemokine production and degranulation in activated mast cells. Front Immunol 2023, 14, 1171380. [Google Scholar] [CrossRef]
  54. Zheng, Y.; Fan, G.; Xiao, Y.; Peng, Y.; Hu, M.; Shen, S.; Liu, S.; Meng, Z.; Zhang, R. The role of ELK4 up-regulation in macrophage polarization and its mechanism in connective tissue disease-associated interstitial lung disease. Int Immunopharmacol 2025, 163, 115226. [Google Scholar] [CrossRef]
  55. Maurice, D.; Costello, P.; Sargent, M.; Treisman, R. ERK Signaling Controls Innate-like CD8(+) T Cell Differentiation via the ELK4 (SAP-1) and ELK1 Transcription Factors. J Immunol 2018, 201, 1681–1691. [Google Scholar] [CrossRef]
  56. Xie, L. MKL1/2 and ELK4 co-regulate distinct serum response factor (SRF) transcription programs in macrophages. BMC Genomics 2014, 15, 301. [Google Scholar] [CrossRef]
Figure 2. The specificity of tetrameric complexes was assessed through the flow cytometry assay. The X-axis represents the CD8+ T cell-specific surface molecular marker, while the Y-axis corresponds to the tetrameric complex. Plots A and B illustrated the results of the flow cytometry detection of antigen specific CD8+ T cells from SLA-1–SQIEETHLV tetramer complex (HET-1)-stained PBMCs isolated from ASFV p72 antibody negative individuals and antigen specific CD8+ T cells from positive individuals, respectively. Plots C and D illustrated the results of flow cytometric detection of antigen specific CD8+ T cells from SLA-1–FVTPEIHNL tetramer complex (HET-2)-stained PBMCs collected from ASFV p72 antibody negative individuals and antigen specific CD8+ T cells from positive individuals, respectively. Plot O illustrated representative results of health control animals, a blank sample without tetrameric labeling.
Preprints 186032 g002
Table 1. Highly differentially expressed transcripts (top 30) in lymph nodes comparing low and high antigen-specific CD8+ T cell abundance.
Gene Symbol Averaged Expression Level (logg2) Fold Change P-value P-value Adjusted
ANKRD11 11.1479 -2.6274 1.36E-22 1.58E-18
RAI1 9.0294 -2.9162 3.82E-21 2.22E-17
TNRC18 10.2425 -2.5437 3.43E-16 1.33E-12
GSE1 9.4431 -2.3632 1.18E-15 3.44E-12
SCAF1 8.9799 -2.0116 3.29E-15 7.68E-12
ZC3H18 9.6552 -1.8883 2.89E-14 5.62E-11
EHBP1L1 10.9143 -1.7063 2.86E-13 4.76E-10
MAD1L1 8.5019 -1.8961 5.03E-13 7.33E-10
SART1 8.7391 -1.9650 5.89E-12 7.63E-09
SOD3 6.7259 -2.5104 2.05E-11 2.38E-08
ZNF865 6.0999 -2.4209 5.90E-10 6.25E-07
TRAPPC12 9.1359 -1.6968 9.63E-10 9.36E-07
5_8S_rRNA 5.2200 -7.1821 1.31E-09 1.17E-06
CRAMP1 8.9867 -1.7361 1.70E-09 1.42E-06
PLEC 12.1363 -1.4223 4.38E-09 3.40E-06
MYCT1 9.8294 -2.5476 4.69E-09 3.42E-06
HIC1 8.5407 -1.9721 1.03E-08 7.09E-06
HDGF 9.8249 -1.3268 1.45E-08 9.38E-06
HTATSF1 9.5369 -1.5280 1.93E-08 1.12E-05
PRR11 8.8894 -2.5128 1.92E-08 1.12E-05
MAPK7 8.2983 -1.8414 2.68E-08 1.49E-05
CAMSAP1 9.1223 -1.4343 3.39E-08 1.80E-05
CCDC88C 9.4835 -1.3329 4.81E-08 2.44E-05
ZNF579 5.8989 -2.1196 6.21E-08 3.02E-05
C17orf78 5.2230 -3.7325 7.80E-08 3.56E-05
COL6A1 11.9465 -1.9199 7.93E-08 3.56E-05
PPARGC1B 7.3056 -1.8476 1.03E-07 4.46E-05
BAHCC1 7.3152 -1.8492 1.19E-07 4.78E-05
SYNPO 6.9863 -2.0361 1.17E-07 4.78E-05
CACNA1F 5.4370 -2.3937 1.79E-07 6.74E-05
Table 2. Highly differentially expressed transcripts (top 30) in lymph nodes comparing low and medium antigen-specific CD8+ T cell abundance.
Gene symbol Averaged expression level (logg2) Fold change P-value P-value adjusted
RPS27 11.5508 4.1664 3.62E-41 4.31E-37
SERINC1 9.6209 4.8169 3.46E-39 2.06E-35
DDX3X 11.3334 3.9483 2.52E-37 1.00E-33
IFIT5 10.3411 5.7359 2.91E-36 8.68E-33
IL33 9.4154 3.9776 3.83E-35 9.13E-32
CHMP5 8.7612 5.1705 2.09E-33 4.15E-30
COX7C 8.9350 4.3618 3.55E-33 6.04E-30
TMEM33 8.7260 4.2521 1.54E-32 2.30E-29
IFI44L 10.8402 5.0269 2.05E-31 2.71E-28
CYTIP 10.1038 3.9767 7.62E-31 9.09E-28
SNRPE 8.1885 5.0955 1.08E-30 1.17E-27
SLC38A2 10.2469 3.8788 2.41E-30 2.40E-27
RESF1 10.1303 3.4245 1.42E-29 1.30E-26
BLTP1 10.3354 3.7263 2.51E-29 2.14E-26
PSMA1 9.0348 4.8175 3.18E-29 2.53E-26
CNOT7 8.5011 5.2794 4.25E-29 3.17E-26
STT3B 9.4294 3.6171 1.90E-28 1.33E-25
TMED2 8.5665 4.8602 2.92E-28 1.94E-25
CLIC2 8.4517 4.7903 3.98E-28 2.50E-25
HSPE1 9.1219 4.8445 1.07E-27 6.40E-25
USP34 9.8910 3.5871 1.28E-27 7.26E-25
BCL2A1 8.2664 4.9111 3.86E-27 2.09E-24
CCNT2 8.6709 4.4719 6.15E-27 3.19E-24
TRPM7 9.7825 3.8772 7.35E-27 3.65E-24
JCHAIN 11.5718 3.6999 1.50E-26 7.16E-24
ZFYVE16 8.9988 4.3539 1.57E-26 7.20E-24
RICTOR 9.3228 3.2834 3.18E-26 1.40E-23
RPL26 9.1549 4.2806 8.87E-26 3.78E-23
COPB2 8.8352 3.3305 1.23E-25 5.07E-23
CHORDC1 9.2806 3.8059 1.28E-25 5.10E-23
Table 3. Most significant transcription factors (top 30) regulating the genes in the differential expressed gene list in lymph nodes between high and low antigen-specific CD8+ T cell abundance.
Transcription factor Number of target genes Correlation direction Kendall's Tau P-value FDR
G4204_MECP2 2990 + 0.1202 4.36E-20 3.18E-17
G17257_Mecp2 2990 + 0.1202 4.30E-20 6.29E-17
MA0098.3_ETS1 2154 + 0.1359 2.44E-18 5.10E-16
G56805_Zbtb33 1986 + 0.1403 2.44E-18 5.95E-16
G2002_ELK1 2630 + 0.1242 1.33E-18 6.48E-16
G10009_ZBTB33 1986 + 0.1404 2.38E-18 6.95E-16
MA0076.2_ELK4 1472 + 0.1655 2.12E-18 7.76E-16
G104394_E2f4 3124 + 0.1094 1.67E-17 3.06E-15
MA1949.1_FLI1::DRGX 1302 + 0.1672 3.04E-17 4.93E-15
MA1959.1_KLF7 3034 + 0.1068 2.68E-16 3.92E-14
MA1483.2_ELF2 1522 + 0.1507 8.91E-16 1.18E-13
MA0760.1_ERF 1978 + 0.1305 1.10E-15 1.35E-13
MA1931.1_ELK1::HOXA1 710 + 0.2193 1.31E-15 1.47E-13
MA0666.2_MSX1 2092 + 0.1253 2.65E-15 2.77E-13
MA0764.3_ETV4 2486 + 0.1154 2.85E-15 2.78E-13
G6668_SP2 2986 + 0.1037 3.75E-15 3.23E-13
G78912_Sp2 2986 + 0.1037 3.75E-15 3.43E-13
MA0889.1_GBX1 1914 + 0.1292 5.11E-15 4.15E-13
MA1651.1_ZFP42 798 + 0.2009 8.44E-15 6.50E-13
MA0475.2_FLI1 1288 + 0.1564 1.67E-14 1.22E-12
MA1564.1_SP9 2842 + 0.1028 3.55E-14 2.47E-12
G7022_TFAP2C 2680 - -0.1051 4.35E-14 2.89E-12
MA1548.1_PLAGL2 1094 - -0.1659 4.73E-14 3.01E-12
MA0654.1_ISX 2196 + 0.1138 1.34E-13 8.18E-12
MA0641.1_ELF4 674 + 0.2074 2.69E-13 1.57E-11
MA1940.1_ETV2::DRGX 644 + 0.2093 3.29E-13 1.85E-11
G2005_ELK4 2536 + 0.1049 4.14E-13 2.24E-11
MA0862.1_GMEB2 2154 + 0.1128 4.81E-13 2.51E-11
MA0604.1_Atf1 1572 + 0.1317 9.44E-13 4.76E-11
MA0723.2_VAX2 1906 - -0.1189 9.82E-13 4.79E-11
Table 4. Most significant transcription factors (top 30) regulating the genes in the differential expressed gene list in lymph nodes between medium and low antigen-specific CD8+ T cell abundance.
Transcription factor Number of target genes Correlation direction Kendall's Tau P-value FDR
G56805_Zbtb33 1790 + 0.1432 3.33E-17 2.44E-14
G10009_ZBTB33 1790 + 0.1432 3.25E-17 4.75E-14
MA1564.1_SP9 2532 + 0.1192 1.96E-16 5.72E-14
G4204_MECP2 2672 + 0.1159 1.81E-16 6.62E-14
G17257_Mecp2 2672 + 0.1159 1.81E-16 8.81E-14
MA0098.3_ETS1 1938 + 0.13 4.88E-15 1.19E-12
G104394_E2f4 2824 + 0.1061 9.10E-15 1.90E-12
MA0076.2_ELK4 1350 + 0.1515 3.95E-14 7.22E-12
MA0666.2_MSX1 1904 + 0.1223 2.40E-13 3.89E-11
MA1483.2_ELF2 1366 + 0.1441 3.93E-13 4.78E-11
MA0760.1_ERF 1772 + 0.1258 3.75E-13 4.98E-11
G21414_Tcf7 2034 - -0.1154 3.47E-13 5.07E-11
MA0747.1_SP8 2672 + 0.1002 1.03E-12 1.15E-10
G2002_ELK1 2362 + 0.106 1.93E-12 1.76E-10
G13712_Elk1 2592 + 0.1012 1.73E-12 1.81E-10
MA0764.3_ETV4 2224 + 0.1093 1.90E-12 1.85E-10
MA1944.1_ETV5::DRGX 1668 + 0.1237 3.48E-12 2.68E-10
MA1583.1_ZFP57 2028 + 0.1115 3.14E-12 2.70E-10
MA0765.3_ETV5 836 + 0.1793 3.37E-12 2.74E-10
MA0654.1_ISX 2002 + 0.1104 9.17E-12 6.70E-10
MA0517.1_STAT1::STAT2 744 + 0.1831 1.11E-11 7.74E-10
MA0763.1_ETV3 2136 + 0.1068 1.48E-11 9.84E-10
G2115_ETV1 2648 + 0.0953 1.74E-11 1.10E-09
MA0006.1_Ahr::Arnt 2702 + 0.0926 3.07E-11 1.87E-09
G1044_CDX1 1314 - -0.1303 3.67E-11 1.99E-09
G13555_E2f1 2976 + 0.0881 3.46E-11 2.02E-09
G12590_Cdx1 1314 - -0.1303 3.66E-11 2.06E-09
G14390_Gabpa 2092 + 0.1053 4.00E-11 2.09E-09
MA0151.1_Arid3a 2456 - -0.0949 4.26E-11 2.14E-09
MA0645.1_ETV6 2472 + 0.0961 5.75E-11 2.80E-09
Table 5. List of Antigen Presentation Signaling Pathway Genes Targeted by ELK4.
Gene symbol Averaged expression level (logg2) Fold change P-value P-value adjusted
ASB3 7.73 3.82 5.01E-07 1.97E-06
CDC16 8.35 3.83 1.42E-07 6.16E-07
CDC27 9.09 12.71 8.89E-23 4.63E-21
FBXO30 8.05 4.76 6.35E-07 2.46E-06
KLHL20 7.53 6.88 2.09E-11 1.72E-10
LNPEP 11.04 12.55 5.36E-22 2.49E-20
LTN1 9.28 5.52 5.65E-14 7.18E-13
PIK3R4 8.51 5.09 6.76E-08 3.06E-07
PJA2 9.96 10.78 4.50E-15 6.79E-14
PSMB1 9.13 9.05 2.22E-03 4.53E-03
PSMB4 9.82 7.30 3.11E-15 4.83E-14
PSMC2 9.16 7.49 1.75E-12 1.72E-11
PSMD12 8.04 4.42 7.87E-09 4.12E-08
PSMD8 8.62 5.45 1.81E-09 1.06E-08
PSME4 9.56 4.95 3.32E-16 6.02E-15
PSMF1 8.47 2.74 5.40E-04 1.24E-03
RLIM 8.03 13.27 1.70E-03 3.53E-03
TLR4 8.39 6.12 4.79E-06 1.58E-05
Disclaimer/Publisher’s Note: The statements, opinions and data contained in all publications are solely those of the individual author(s) and contributor(s) and not of MDPI and/or the editor(s). MDPI and/or the editor(s) disclaim responsibility for any injury to people or property resulting from any ideas, methods, instructions or products referred to in the content.
Copyright: This open access article is published under a Creative Commons CC BY 4.0 license, which permit the free download, distribution, and reuse, provided that the author and preprint are cited in any reuse.
Prerpints.org logo

Preprints.org is a free preprint server supported by MDPI in Basel, Switzerland.

Subscribe

Disclaimer

Terms of Use

Privacy Policy

Privacy Settings

© 2025 MDPI (Basel, Switzerland) unless otherwise stated