
Submitted:
21 November 2025
Posted:
24 November 2025
You are already at the latest version
Abstract
Background/Objectives: Pigment migration is a key biomarker of progression in age-related macular degeneration (AMD). This study assessed the diagnostic performance of ring aperture Retro mode (RAR) imaging for detecting pigment migration and compared its performance with established multimodal imaging techniques.
Methods: This retrospective study included 80 eyes from 61 consecutive patients with AMD who underwent multimodal imaging with color fundus images (CFI), fundus autofluorescence (FAF), RAR imaging (Mirante, NIDEK), and en face optical coherence tomography (OCT) with B-scans (Cirrus HD-OCT 5000, Zeiss). Two independent retina specialists graded AMD stage and the presence of pigment migration across modalities. Sensitivity and positive predictive value (PPV) of RAR were calculated using en face OCT as the reference standard.
Results: RAR demonstrated high diagnostic performance, with a sensitivity of 94.7% and a PPV of 93.4% relative to en face OCT. RAR frequently identified pigment migration that was not visible on CFI or FAF, particularly in early AMD and in eyes with media opacity. Distinct morphologic patterns—including hyperreflective foci, thickened retinal pigment epithelium, refractile drusen, and cuticular drusen—were consistently identifiable on RAR. In four eyes with geographic atrophy, RAR detected perifoveal pigment redistribution at least six months before foveal involvement was confirmed by OCT and FAF.
Conclusions: RAR imaging is a rapid, sensitive, and clinically practical technique for detecting pigment migration in AMD. By complementing en face OCT and enhancing visualization in cases where standard imaging is limited, RAR may strengthen early disease surveillance, support prognostic assessment, and improve multimodal diagnostic workflows in routine practice.
Keywords:
age-related macular degeneration
; geographic atrophy
; retinal imaging
; diagnostic performance
; en face OCT
; retro mode imaging
; pigment migration
; hyperreflective foci
; thickened RPE
; refractile drusen
1. Introduction
Pigment migration in age-related macular degeneration (AMD) is an important clinical finding, reflecting retinal pigment epithelium (RPE) dysfunction and signaling risk of progression toward geographic atrophy (GA) and vision loss [1]. Along with drusen, pigmentary changes are central criteria for upgrading disease classification from early to intermediate AMD (iAMD) [1]. According to the Beckman/AREDS2 consensus classification, iAMD is defined by the presence of large drusen (>125 µm) and/or any AMD-related pigmentary abnormalities in the absence of GA or neovascularization [2].
Pigmentary abnormalities encompass both hyperpigmentation—reflecting RPE migration, hyperreflective foci (HRF), or thickened RPE (tRPE)—and hypopigmentation, which may correspond to early RPE attenuation, nascent GA, or emerging transmission defects on OCT [3]. These changes occur within the tightly coupled RPE–photoreceptor unit. Although RPE dysfunction can compromise photoreceptor survival [4,5], recent OCT-based analyses of AMD progression indicate that photoreceptor alterations with ellipsoid-zone attenuation may also extend beyond or precede detectable RPE loss in early GA, highlighting a bidirectional and stage-dependent relationship between these layers [6].
Multimodal imaging has improved detection of pigment migration. Color fundus images (CFIs) may reveal visible pigment clumping, while structural and en face OCT localize abnormalities as HRF or tRPE [3]. Hyporeflective clumps (HRC) are another lesion detectable with adaptive optics [7,8]. These abnormalities may occur over drusen, at atrophic margins, or on the surface of pigment epithelial detachments (PED). En face OCT can further delineate pigment migration associated with refractile drusen or cuticular drusen [9,10,11].
Fundus autofluorescence (FAF) demonstrates pigment redistribution through characteristic patterns [12], the main signal sources for FAF being RPE lipofuscin and melanolipofuscin [13]. Because the relative contribution of these fluorophores depends on excitation wavelength, conventional visible-light FAF predominantly reflects lipofuscin. Melanolipofuscin, however, exhibits broader emission properties and can generate near-infrared autofluorescence under long-wavelength excitation [14].
Infrared retroillumination (“Retro mode”) was first introduced on the NIDEK F-10 platform and later integrated into the Mirante® multimodal device [15,16]. The system offers three illumination apertures: deviated left (DL), deviated right (DR), and ring aperture (RA). DL and DR configurations create pseudo–three-dimensional shading that accentuates drusen contours, pigment epithelial detachments, and atrophic margins, making them widely used for structural assessment in AMD [17,18,19,20].
In contrast, the ring aperture configuration (RAR) eliminates lateral shadowing and produces a “dark-field” transillumination pattern. Although less visually striking than DL/DR imaging, RAR preferentially highlights small variations in pigment density. When acquisition parameters—particularly flash intensity—are carefully optimized, RAR may reveal subtle pigment redistribution that is difficult to detect on CFIs or FAF, especially near the fovea where macular pigment absorption complicates interpretation.
Despite this potential, the diagnostic value of RAR for detecting pigment migration in AMD has not, to the best of our knowledge, been systematically evaluated. The present study aimed to assess the performance of RAR for detecting pigment migration across different AMD stages and to compare its yield with that of color fundus imaging, FAF, and en face OCT in a real-world, high-volume clinical setting.
2. Materials and Methods
2.1. Study Design
This retrospective observational study was conducted at the Centre de Rétine Médicale, a tertiary referral center for retinal diseases. The study complied with the principles of the Declaration of Helsinki. Written informed consent was obtained from all participants, authorizing the use of their clinical data for research purposes. Ethical approval was obtained from the ethical committee of the French Society of Ophthalmology (SFO).
2.2. Patients
We included consecutive patients examined between May 2023 and February 2025 with a diagnosis of AMD and pigment migration detected on at least one imaging modality by two retina specialists (TD, GL-G). Exclusion criteria were insufficient image quality or the absence of one or more imaging modalities. Based on multimodal imaging characteristics, eyes were categorized as intermediate AMD (iAMD), geographic atrophy (GA), or neovascular AMD (nAMD). Eyes with both GA and nAMD were classified into the nAMD group.
Visual acuity was recorded to provide clinical context but was not used as an outcome measure because pigment migration is not always directly correlated with central visual function, particularly in the presence of GA or media opacity. Refraction was not used analytically because mild ametropia does not affect detection of pigment migration; however, refractive status is reported in the Results section for completeness. The purpose of this study was to evaluate imaging detectability rather than functional impact.
2.3. Imaging Protocol
All imaging data were anonymized before analysis. Examinations were performed after pharmacologic pupil dilation. All images were acquired by a retina specialist (TD), ensuring consistent optimization of acquisition parameters across modalities.
Multimodal imaging included color fundus images (CFIs), fundus autofluorescence (FAF), and Retro mode imaging (DL, DR, and RA) acquired with the Mirante® platform (NIDEK, Japan; 89° field of view), and spectral-domain OCT using the Cirrus HD-OCT 5000 (Carl Zeiss Meditec, USA; axial resolution ~5 µm; acquisition speed 27,000 A-scans/second).
CFIs were obtained with carefully adjusted flash intensity to avoid overexposure, particularly in eyes with GA. Retro mode imaging included DL, DR, and RA scans; however, only RA (RAR) images were analyzed in this study. Flash intensity was progressively reduced to balance contrast and allow visualization of both choroidal vessels and pigment migration. FAF was performed using green excitation (532 nm), minimizing glare and reducing macular pigment absorption.
2.4. En face OCT Acquisition
En face OCT data were derived from 6 × 6 mm scans centered on the fovea. Two Cirrus preset slabs were analyzed:
1 - Retinal IS/OS slab
Used to detect intraretinal hyperreflective foci (HRF), which appear as bright focal dots at the photoreceptor integrity line.
2 - Sub-RPE/choroidal slab
Located beneath the RPE/Bruch’s complex, used to evaluate transmission defects.
- Hypotransmission defects (hypoTD): dark foci caused by signal blockage from thickened RPE (tRPE) or large HRF.
- Hypertransmission defects (hyperTD): bright patches corresponding to RPE attenuation or early atrophy.
For all en face abnormalities, the corresponding B-scans were reviewed to determine whether the lesion represented HRF, tRPE, or RPE loss. This approach follows established en face slab–dependent behavior described in the literature [3,11].
These two slabs were used consistently across all eyes.
2.5. Image Analysis
All images were independently reviewed by two retina specialists (TD and GL-G). Both graders were masked to each other’s findings. After independent assessment, discrepancies were resolved by consensus. For each eye, graders classified AMD stage (iAMD, nAMD, or GA) and scored the presence of pigment migration in each imaging modality as “0” (absent) or “1” (present).
2.5. Statistical Analysis
Intergrader agreement for binary variables (presence of pigment migration on each imaging modality) was assessed using Cohen’s κ coefficient. Agreement for AMD stage classification (iAMD, nAMD, GA) was evaluated using weighted κ. Kappa values were interpreted using Landis and Koch criteria (κ < 0.20: slight; 0.21–0.40: fair; 0.41–0.60: moderate; 0.61–0.80: substantial; >0.80: almost perfect agreement).
To compare diagnostic performance across imaging modalities, en face OCT was used as the reference standard. For CFIs, FAF, and RAR, the following metrics were calculated from 2×2 contingency tables:
- Sensitivity = TP / (TP + FN)
- Specificity = TN / (TN + FP)
- Positive predictive value (PPV) = TP / (TP + FP)
- Negative predictive value (NPV) = TN / (TN + FN), when applicable
- F1 score, defined as the harmonic mean of sensitivity and PPV:F1 = 2 × (Sensitivity × PPV) / (Sensitivity + PPV)
The F1 score was included because it provides a balanced measure of detection performance, particularly when false positives and false negatives have different implications across modalities.
Continuous variables (e.g., visual acuity) are reported as mean ± standard deviation. Categorical variables are presented as counts and percentages. All statistical analyses were performed using Microsoft Excel 365, which is appropriate for agreement coefficients and contingency-based diagnostic performance metrics in retrospective observational studies. A two-sided significance threshold of p < 0.05 was used..
3. Results
A total of 80 eyes from 61 patients were included. The mean age was 79.1 ± 9.8 years, and 39 patients were women. Based on multimodal imaging, 36 eyes were classified as iAMD, 23 as GA, and 21 as nAMD. Eyes with both GA and nAMD were grouped under nAMD. The mean best-corrected visual acuity (BCVA) was 0.59 ± 0.26 decimal units (approximately 20/34 Snellen; mean logMAR 0.28 ± 0.24). Available refraction data indicated mild ametropia, with spherical equivalent values approximately between –3.00D and +2.00D; no high myopia or high hyperopia were present. As expected in a cohort including both iAMD and GA, visual acuity showed variability and was not used as an outcome measure.
In all eyes, en face OCT findings were interpreted by correlating lesions on both slabs with the corresponding B-scans to differentiate HRF from tRPE and to confirm the nature of transmission defects.
Intergrader agreement was high for both AMD stage classification (weighted κ = 0.93) and for the detection of pigment migration across modalities: CFIs (κ = 0.924), FAF (κ = 0.825), en face OCT (κ = 0.902), and RAR (κ = 1.000). RAR demonstrated performance comparable to en face OCT and frequently outperformed CFIs and FAF. Agreement between RAR and en face OCT was high (κ = 0.71), corresponding to a sensitivity of 94.7% and a positive predictive value of 93.4%. Because en face OCT identified pigment migration in most eyes, true negatives were infrequent, resulting in low calculated specificity (true negative in Table 1). In contrast, agreement between RAR and CFIs was moderate (κ = 0.56), with a sensitivity of 91.5% but a lower positive predictive value of 56.6%. These comparisons are summarized in Table 1 and Table 2.
Distinct morphologic patterns of pigment migration were identified on RAR when compared with OCT (Table 3).
On RAR imaging, pigment migration corresponding to HRF on B-scan OCT appeared as thin dark contrast dots or mid-sized dark contrast halos (Figure 1 and Figure 2). Areas of thickened RPE (tRPE) were visualized as broader dark contrast halos on RAR (Figure 3). Refractile drusen, which showed a pyramidal contour with a central hypertransmission core on OCT B-scans, appeared on RAR as ring-shaped dark contrast halos with a bright central core (Figure 4). Cuticular drusen were visible on RAR as small clustered lesions with central dark halos and peripheral light rings (Figure 5).
Compared with CFIs and FAF, RAR frequently provided clearer and more detailed visualization of pigment migration. Pigment clumps tended to appear more extensive and granular, sometimes with a dust-like distribution that was far less apparent on CFIs (Figure 1 and Figure 5). Media opacities commonly reduced the reliability of CFIs and FAF; in contrast, RAR and en face OCT generally preserved diagnostic utility. Most eyes with nAMD had previously received anti-VEGF therapy and showed no active exudation. In two eyes with persistent shallow serous detachments, pigmentary changes were masked on CFIs and FAF but remained visible on RAR and OCT.
In four eyes with GA, subtle pigment migration detected on RAR preceded subsequent foveal involvement by at least six months, later confirmed by en face OCT and FAF (Figure 5). This raises the possibility that RAR may help identify early pigment redistribution with potential prognostic relevance. In one eye with iAMD and cuticular drusen, FAF provided superior visualization of pigment changes compared with RAR, CFIs, or OCT, underscoring the complementary value of multimodal imaging in selected cases.
Top row (September 2022), VA 20/100:
(A) CFI, (B) FAF, (C) RAR, and (D) en face OCT (retinal IS/OS slab) with enlarged corresponding B-scan show early subfoveal pigment migration, including a refractile drusen.In panel (C), white arrowheads indicate thin pigment migration that was detectable on RAR in 2022. In addition to soft drusen, cuticular drusen at the temporal posterior pole appear on RAR as small clusters with central dark halos and peripheral light rings (blue arrowheads in C).The white dotted square in (C) marks the region shown in the en face OCT slab and B-scan in (D).
Bottom row (September 2024), VA 20/250:
(E–H) demonstrate progression to central geographic atrophy. The pigment migration previously highlighted by white arrowheads in panel (C) preceded subsequent foveal atrophy. In addition to soft drusen, cuticular drusen at the temporal posterior pole appear on RAR as small clusters with central dark halos and peripheral light rings (blue arrowheads in C). The white dotted square in (G) again indicates the area displayed in the en face OCT slab and B-scan in (H).
Abbreviations: CFI, color fundus image; FAF, fundus autofluorescence; GA, geographic atrophy; OCT, optical coherence tomography; RAR, ring aperture Retro mode; VA, visual acuity.
4. Discussion
In this retrospective study, RAR imaging proved to be a valuable modality for detecting pigment migration across different stages of AMD. Its sensitivity was comparable to en face OCT, the current reference method, and greater than that of CFIs or FAF, particularly for early pigmentary changes. The ability to achieve rapid acquisition and straightforward interpretation supports its integration into multimodal imaging protocols, especially in high-volume clinical settings.
Pigmentary changes are recognized biomarkers of AMD progression, reflecting RPE dysfunction and an increased risk of conversion to GA or neovascular disease [1,4,5]. These lesions are often subtle and difficult to detect on CFIs or FAF, particularly in the fovea where macular pigment can obscure abnormalities [23]. Although green autofluorescence can reduce the influence of macular pigment absorption [13,24], our findings indicate that Retro mode is more sensitive for detecting pigment migration near the fovea. One likely explanation is that FAF signals in GA arise from multiple mechanisms beyond lipofuscin and melanolipofuscin accumulation [13,24], whereas Retro mode relies primarily on pigment density, with infrared illumination bypassing macular pigment interference. As a result, RAR consistently revealed pigment migration that was underestimated or missed by these modalities. Figure 1 and Figure 5 illustrate how RAR highlights thin or granular pigment patterns not visible on CFIs, and Table 1 and Table 2 demonstrate the superior diagnostic performance of RAR relative to CFIs and FAF. This advantage was particularly evident in eyes with media opacities, where image quality was degraded for other modalities.
Morphologic patterns identified with RAR provide additional insights into the underlying pathophysiology. HRF, well-established OCT biomarkers of progression [25,26,27], appeared on RAR as thin dark contrast dots or mid-sized dark contrast halos (Figure 1 and Figure 2). Thickened RPE, associated with GA progression and basal laminar deposits [3,28,29,30], appeared as broader dark contrast halos (Figure 3). Refractile drusen, typically pyramidal on OCT with central hypertransmission [10,11], were seen on RAR as ring-shaped dark contrast halos with a bright central core (Figure 4). Cuticular drusen displayed small clustered lesions with central dark halos and peripheral light rings (Figure 5), consistent with prior multimodal imaging reports [9,11]. These findings, summarized in Table 3, align with histopathologic and imaging studies highlighting the complexity of RPE–photoreceptor interactions [4,10,31,32].
RAR also provided clinically meaningful information during follow-up. In four eyes with GA, pigment migration detected on RAR preceded foveal involvement by at least six months, later confirmed by OCT and FAF (Figure 5). These findings raise the possibility that RAR may help identify early pigment redistribution with potential prognostic relevance for central atrophy progression. Similarly, in two cases of nAMD with persistent shallow subretinal detachment, pigment migration was obscured on CFIs and FAF but remained visible on both RAR and OCT. Chronic subretinal fluid in nAMD can produce hyperautofluorescent deposits that mask pigment redistribution on FAF [33], whereas RAR retained diagnostic value in this setting.
Cuticular drusen exhibited heterogeneous features across modalities. FAF most often displayed a ring-like pattern, whereas RAR and OCT revealed distinct ring configurations that may correspond to different stages of pigment dispersion or drusen remodeling. These observations underscore the complementary value of multimodal imaging and suggest that RAR may reveal aspects of lesion morphology not fully captured by other techniques.
This study has limitations, including the modest sample size and retrospective design. Although graders were not masked to clinical diagnosis, image interpretation was performed independently and masked to the other grader’s results, with high inter-grader agreement supporting reliability. RAR also requires stable fixation and is susceptible to motion artifacts. Furthermore, although we identified distinct morphologic patterns, the study was not designed to validate whether RAR can reliably differentiate HRF, tRPE, and other lesion subtypes. While RAR provides rapid and intuitive visualization of pigment migration, en face OCT interpretation requires the systematic evaluation of multiple B-scans and slabs, increasing reading complexity. This difference may partly explain the higher ease of use reported with RAR, although OCT remains the reference standard. Despite these limitations, the consistency of findings across modalities supports the clinical utility of RAR as part of a streamlined multimodal approach for AMD.
In conclusion, RAR imaging offers a rapid, practical, and sensitive method for detecting pigment migration in AMD. By complementing OCT and other established modalities, it enhances early recognition of pigmentary changes, supports prognostic assessment, and may provide added value in routine follow-up
5. Conclusions
Ring aperture Retro mode imaging provides sensitivity comparable to optical coherence tomography and superior detection compared with fundus photography and autofluorescence, offering a practical adjunct for early monitoring of pigment migration in age-related macular degeneration.
Author Contributions
Conceptualization: T.D., G.L.-G. and M.P.; Image acquisition: T.D.; Figures captions: T.D.; Writing—original draft preparation: T.D. and G.L.-G.; Review and editing, M.P. All authors have read and agreed to the published version of the manuscript.
Funding
This research received no external funding. The article processing charges (APC) are covered by the Association Septentrionale d’Ophtalmologie.
Institutional Review Board Statement
This study was conducted in accordance with the Declaration of Helsinki and was approved by the local ethics committee (Comité d’Éthique du Centre de Rétine Médicale, Marquette-Lez-Lille, France) on May 5, 2025 (reference CRM-2025-05). It was subsequently approved by the Ethics Committee of the French Society of Ophthalmology (IRB 00008855 Société Française d’Ophtalmologie IRB#1) on September 18, 2025.
Informed Consent Statement
Written informed consent for the use of anonymized data and images was obtained from all patients.
Data Availability Statement
Due to privacy concerns, the data presented in this study are available from the corresponding author upon request.
Acknowledgments
The authors thank Prof. Martin A. Mainster (University of Kansas School of Medicine) for his advice during the course of this study and Ms. Zoubida Kheloufi for assistance with statistical analysis.
Conflicts of Interest
The authors declare no conflicts of interest.
References
- Agron, E.; Domalpally, A.; Chen, Q.; Lu, Z.; Chew, E.Y.; Keenan, T.D.L. ; Areds; Groups, A. R. An Updated Simplified Severity Scale for Age-Related Macular Degeneration Incorporating Reticular Pseudodrusen: Age-Related Eye Disease Study Report Number 42. Ophthalmology 2024, 131, 1164–1174. [Google Scholar] [CrossRef]
- Ferris, F.L., 3rd; Wilkinson, C.P.; Bird, A.; Chakravarthy, U.; Chew, E.; Csaky, K.; Sadda, S.R. ; Beckman Initiative for Macular Research Classification, C. Clinical classification of age-related macular degeneration. Ophthalmology 2013, 120, 844–851. [Google Scholar] [CrossRef]
- Laiginhas, R.; Liu, J.; Shen, M.; Shi, Y.; Trivizki, O.; Waheed, N.K.; Gregori, G.; Rosenfeld, P.J. Multimodal Imaging, OCT B-Scan Localization, and En Face OCT Detection of Macular Hyperpigmentation in Eyes with Intermediate Age-Related Macular Degeneration. Ophthalmology science 2022, 2, 100116. [Google Scholar] [CrossRef]
- Curcio, C.A.; Zanzottera, E.C.; Ach, T.; Balaratnasingam, C.; Freund, K.B. Activated Retinal Pigment Epithelium, an Optical Coherence Tomography Biomarker for Progression in Age-Related Macular Degeneration. Investigative ophthalmology & visual science 2017, 58, BIO211–BIO226. [Google Scholar] [CrossRef]
- Wubben, T.J.; Weh, E.; Besirli, C.G. Photoreceptor Degeneration: More Than a Bystander in Age-Related Macular Degeneration. Advances in experimental medicine and biology 2025, 1468, 27–31. [Google Scholar] [CrossRef]
- Schmidt-Erfurth, U.; Mai, J.; Reiter, G.S.; Riedl, S.; Vogl, W.D.; Sadeghipour, A.; McKeown, A.; Foos, E.; Scheibler, L.; Bogunovic, H. Disease Activity and Therapeutic Response to Pegcetacoplan for Geographic Atrophy Identified by Deep Learning-Based Analysis of OCT. Ophthalmology 2025, 132, 181–193. [Google Scholar] [CrossRef]
- Borella, Y.; Danielsen, N.; Markle, E.M.; Snyder, V.C.; Lee, D.M.W.; Zhang, M.; Eller, A.W.; Chhablani, J.; Paques, M.; Rossi, E.A. Are the Hypo-Reflective Clumps Associated With Age-Related Macular Degeneration in Adaptive Optics Ophthalmoscopy Autofluorescent? Investigative ophthalmology & visual science 2024, 65, 28. [Google Scholar] [CrossRef]
- Gocho, K.; Sarda, V.; Falah, S.; Sahel, J.A.; Sennlaub, F.; Benchaboune, M.; Ullern, M.; Paques, M. Adaptive optics imaging of geographic atrophy. Investigative ophthalmology & visual science 2013, 54, 3673–3680. [Google Scholar] [CrossRef]
- Balaratnasingam, C.; Cherepanoff, S.; Dolz-Marco, R.; Killingsworth, M.; Chen, F.K.; Mendis, R.; Mrejen, S.; Too, L.K.; Gal-Or, O.; Curcio, C.A.; et al. Cuticular Drusen: Clinical Phenotypes and Natural History Defined Using Multimodal Imaging. Ophthalmology 2018, 125, 100–118. [Google Scholar] [CrossRef] [PubMed]
- Suzuki, M.; Curcio, C.A.; Mullins, R.F.; Spaide, R.F. Refractile drusen: Clinical Imaging and Candidate Histology. Retina 2015, 35, 859–865. [Google Scholar] [CrossRef]
- Voichanski, S.; Bousquet, E.; Abraham, N.; Mafi, M.; Santina, A.; Fossataro, C.; Fossataro, F.; He, Y.; Sadda, S.; Sarraf, D. En Face OCT and the Phenotype Characterization of Drusen. Investigative ophthalmology & visual science 2025, 66, 52. [Google Scholar] [CrossRef]
- Holz, F.G.; Bellmann, C.; Margaritidis, M.; Schutt, F.; Otto, T.P.; Volcker, H.E. Patterns of increased in vivo fundus autofluorescence in the junctional zone of geographic atrophy of the retinal pigment epithelium associated with age-related macular degeneration. Graefe's archive for clinical and experimental ophthalmology = Albrecht von Graefes Archiv fur klinische und experimentelle Ophthalmologie 1999, 237, 145–152. [Google Scholar] [CrossRef]
- Curcio, C.A.; Messinger, J.D.; Berlin, A.; Sloan, K.R.; McLeod, D.S.; Edwards, M.M.; Bijon, J.; Freund, K.B. Fundus Autofluorescence Variation in Geographic Atrophy of Age-Related Macular Degeneration: A Clinicopathologic Correlation. Investigative ophthalmology & visual science 2025, 66, 49. [Google Scholar] [CrossRef]
- Grieve, K.; Gofas-Salas, E.; Ferguson, R.D.; Sahel, J.A.; Paques, M.; Rossi, E.A. In vivo near-infrared autofluorescence imaging of retinal pigment epithelial cells with 757 nm excitation. Biomedical optics express 2018, 9, 5946–5961. [Google Scholar] [CrossRef]
- Elsner, A.E.; Burns, S.A.; Weiter, J.J.; Delori, F.C. Infrared imaging of sub-retinal structures in the human ocular fundus. Vision research 1996, 36, 191–205. [Google Scholar] [CrossRef]
- Tanaka, Y.; Shimada, N.; Ohno-Matsui, K.; Hayashi, W.; Hayashi, K.; Moriyama, M.; Yoshida, T.; Tokoro, T.; Mochizuki, M. Retromode retinal imaging of macular retinoschisis in highly myopic eyes. American journal of ophthalmology 2010, 149, 635–640. [Google Scholar] [CrossRef] [PubMed]
- Corradetti, G.; Corvi, F.; Sadda, S.R. Subretinal Drusenoid Deposits Revealed by Color SLO and Retro-Mode Imaging. Ophthalmology 2021, 128, 409. [Google Scholar] [CrossRef] [PubMed]
- Diniz, B.; Ribeiro, R.M.; Rodger, D.C.; Maia, M.; Sadda, S. Drusen detection by confocal aperture-modulated infrared scanning laser ophthalmoscopy. The British journal of ophthalmology 2013, 97, 285–290. [Google Scholar] [CrossRef] [PubMed]
- Mainster, M.A.; Desmettre, T.; Querques, G.; Turner, P.L.; Ledesma-Gil, G. Scanning laser ophthalmoscopy retroillumination: applications and illusions. International journal of retina and vitreous 2022, 8, 71. [Google Scholar] [CrossRef]
- Sassmannshausen, M.; Sautbaeva, L.; von der Emde, L.A.; Vaisband, M.; Sloan, K.R.; Hasenauer, J.; Holz, F.G.; Ach, T. Retro Mode Imaging for Detection and Quantification of Sub-RPE Drusen and Subretinal Drusenoid Deposits in Age-Related Macular Degeneration. Journal of clinical medicine 2024, 13, 4131. [Google Scholar] [CrossRef]
- Cozzi, M.; Monteduro, D.; Parrulli, S.; Corvi, F.; Zicarelli, F.; Corradetti, G.; Sadda, S.R.; Staurenghi, G. Sensitivity and Specificity of Multimodal Imaging in Characterizing Drusen. Ophthalmology. Retina 2020, 4, 987–995. [Google Scholar] [CrossRef] [PubMed]
- Zeng, R.; Zhang, X.; Su, Y.; Li, M.; Wu, K.; Wen, F. The noninvasive retro-mode imaging modality of confocal scanning laser ophthalmoscopy in polypoidal choroidal vasculopathy: a preliminary application. PloS one 2013, 8, e75711. [Google Scholar] [CrossRef] [PubMed]
- Schmitz-Valckenberg, S.; Fleckenstein, M.; Helb, H.M.; Charbel Issa, P.; Scholl, H.P.; Holz, F.G. In vivo imaging of foveal sparing in geographic atrophy secondary to age-related macular degeneration. Investigative ophthalmology & visual science 2009, 50, 3915–3921. [Google Scholar] [CrossRef]
- Ranetti, A.E.; Stanca, H.T.; Munteanu, M.; Bievel Radulescu, R.; Stanca, S. Blue Light and Green Light Fundus Autofluorescence, Complementary to Optical Coherence Tomography, in Age-Related Macular Degeneration Evaluation. Diagnostics 2025, 15, 1688. [Google Scholar] [CrossRef]
- Hirabayashi, K.; Yu, H.J.; Wakatsuki, Y.; Marion, K.M.; Wykoff, C.C.; Sadda, S.R. OCT Risk Factors for Development of Atrophy in Eyes with Intermediate Age-Related Macular Degeneration. Ophthalmology. Retina 2023, 7, 253–260. [Google Scholar] [CrossRef]
- Hsia, Y.; Yang, C.H.; Hsieh, Y.T.; Yang, C.M.; Ho, T.C.; Lai, T.T. Hyperreflective foci in predicting the treatment outcome of antivascular endothelial growth factor in neovascular age-related macular degeneration. Graefe's archive for clinical and experimental ophthalmology = Albrecht von Graefes Archiv fur klinische und experimentelle Ophthalmologie 2020, 258, 273–280. [Google Scholar] [CrossRef]
- Nassisi, M.; Lei, J.; Abdelfattah, N.S.; Karamat, A.; Balasubramanian, S.; Fan, W.; Uji, A.; Marion, K.M.; Baker, K.; Huang, X.; et al. OCT Risk Factors for Development of Late Age-Related Macular Degeneration in the Fellow Eyes of Patients Enrolled in the HARBOR Study. Ophthalmology 2019, 126, 1667–1674. [Google Scholar] [CrossRef]
- Daniel, S.; Ortega, A.J.; Hulleman, J.D. RPE Basal Lamina Biology and Pathophysiology Related to Age-Related Macular Degeneration. Advances in experimental medicine and biology 2025, 1468, 15–19. [Google Scholar] [CrossRef]
- Paques, M.; Norberg, N.; Chaumette, C.; Sennlaub, F.; Rossi, E.; Borella, Y.; Grieve, K. Long Term Time-Lapse Imaging of Geographic Atrophy: A Pilot Study. Frontiers in medicine 2022, 9, 868163. [Google Scholar] [CrossRef]
- Sura, A.A.; Chen, L.; Messinger, J.D.; Swain, T.A.; McGwin, G., Jr.; Freund, K.B.; Curcio, C.A. Measuring the Contributions of Basal Laminar Deposit and Bruch's Membrane in Age-Related Macular Degeneration. Investigative ophthalmology & visual science 2020, 61, 19. [Google Scholar] [CrossRef]
- Balaratnasingam, C.; Yannuzzi, L.A.; Curcio, C.A.; Morgan, W.H.; Querques, G.; Capuano, V.; Souied, E.; Jung, J.; Freund, K.B. Associations Between Retinal Pigment Epithelium and Drusen Volume Changes During the Lifecycle of Large Drusenoid Pigment Epithelial Detachments. Investigative ophthalmology & visual science 2016, 57, 5479–5489. [Google Scholar] [CrossRef]
- Ho, J.; Witkin, A.J.; Liu, J.; Chen, Y.; Fujimoto, J.G.; Schuman, J.S.; Duker, J.S. Documentation of intraretinal retinal pigment epithelium migration via high-speed ultrahigh-resolution optical coherence tomography. Ophthalmology 2011, 118, 687–693. [Google Scholar] [CrossRef] [PubMed]
- Chen, L.; Messinger, J.D.; Ferrara, D.; Freund, K.B.; Curcio, C.A. Fundus Autofluorescence in Neovascular Age-Related Macular Degeneration: A Clinicopathologic Correlation Relevant to Macular Atrophy. Ophthalmology. Retina 2021, 5, 1085–1096. [Google Scholar] [CrossRef] [PubMed]
Figure 1.
51-year-old female with a family history of AMD, VA 20/20. (A) CFI shows barely visible pigment migration. (B) RAR demonstrates thin dark contrast dots (blue arrow), consistent with small pigment clumps. (C) FAF shows no obvious changes in autofluorescence. (D) En face OCT (retinal IS/OS slab) and corresponding B-scan showing a thin hypotransmission defect beneath the lesion (blue arrows). Abbreviations: AMD, age-related macular degeneration; CFI, color fundus image; FAF, fundus autofluorescence; OCT, optical coherence tomography; RAR, ring aperture Retro mode; VA, visual acuity.
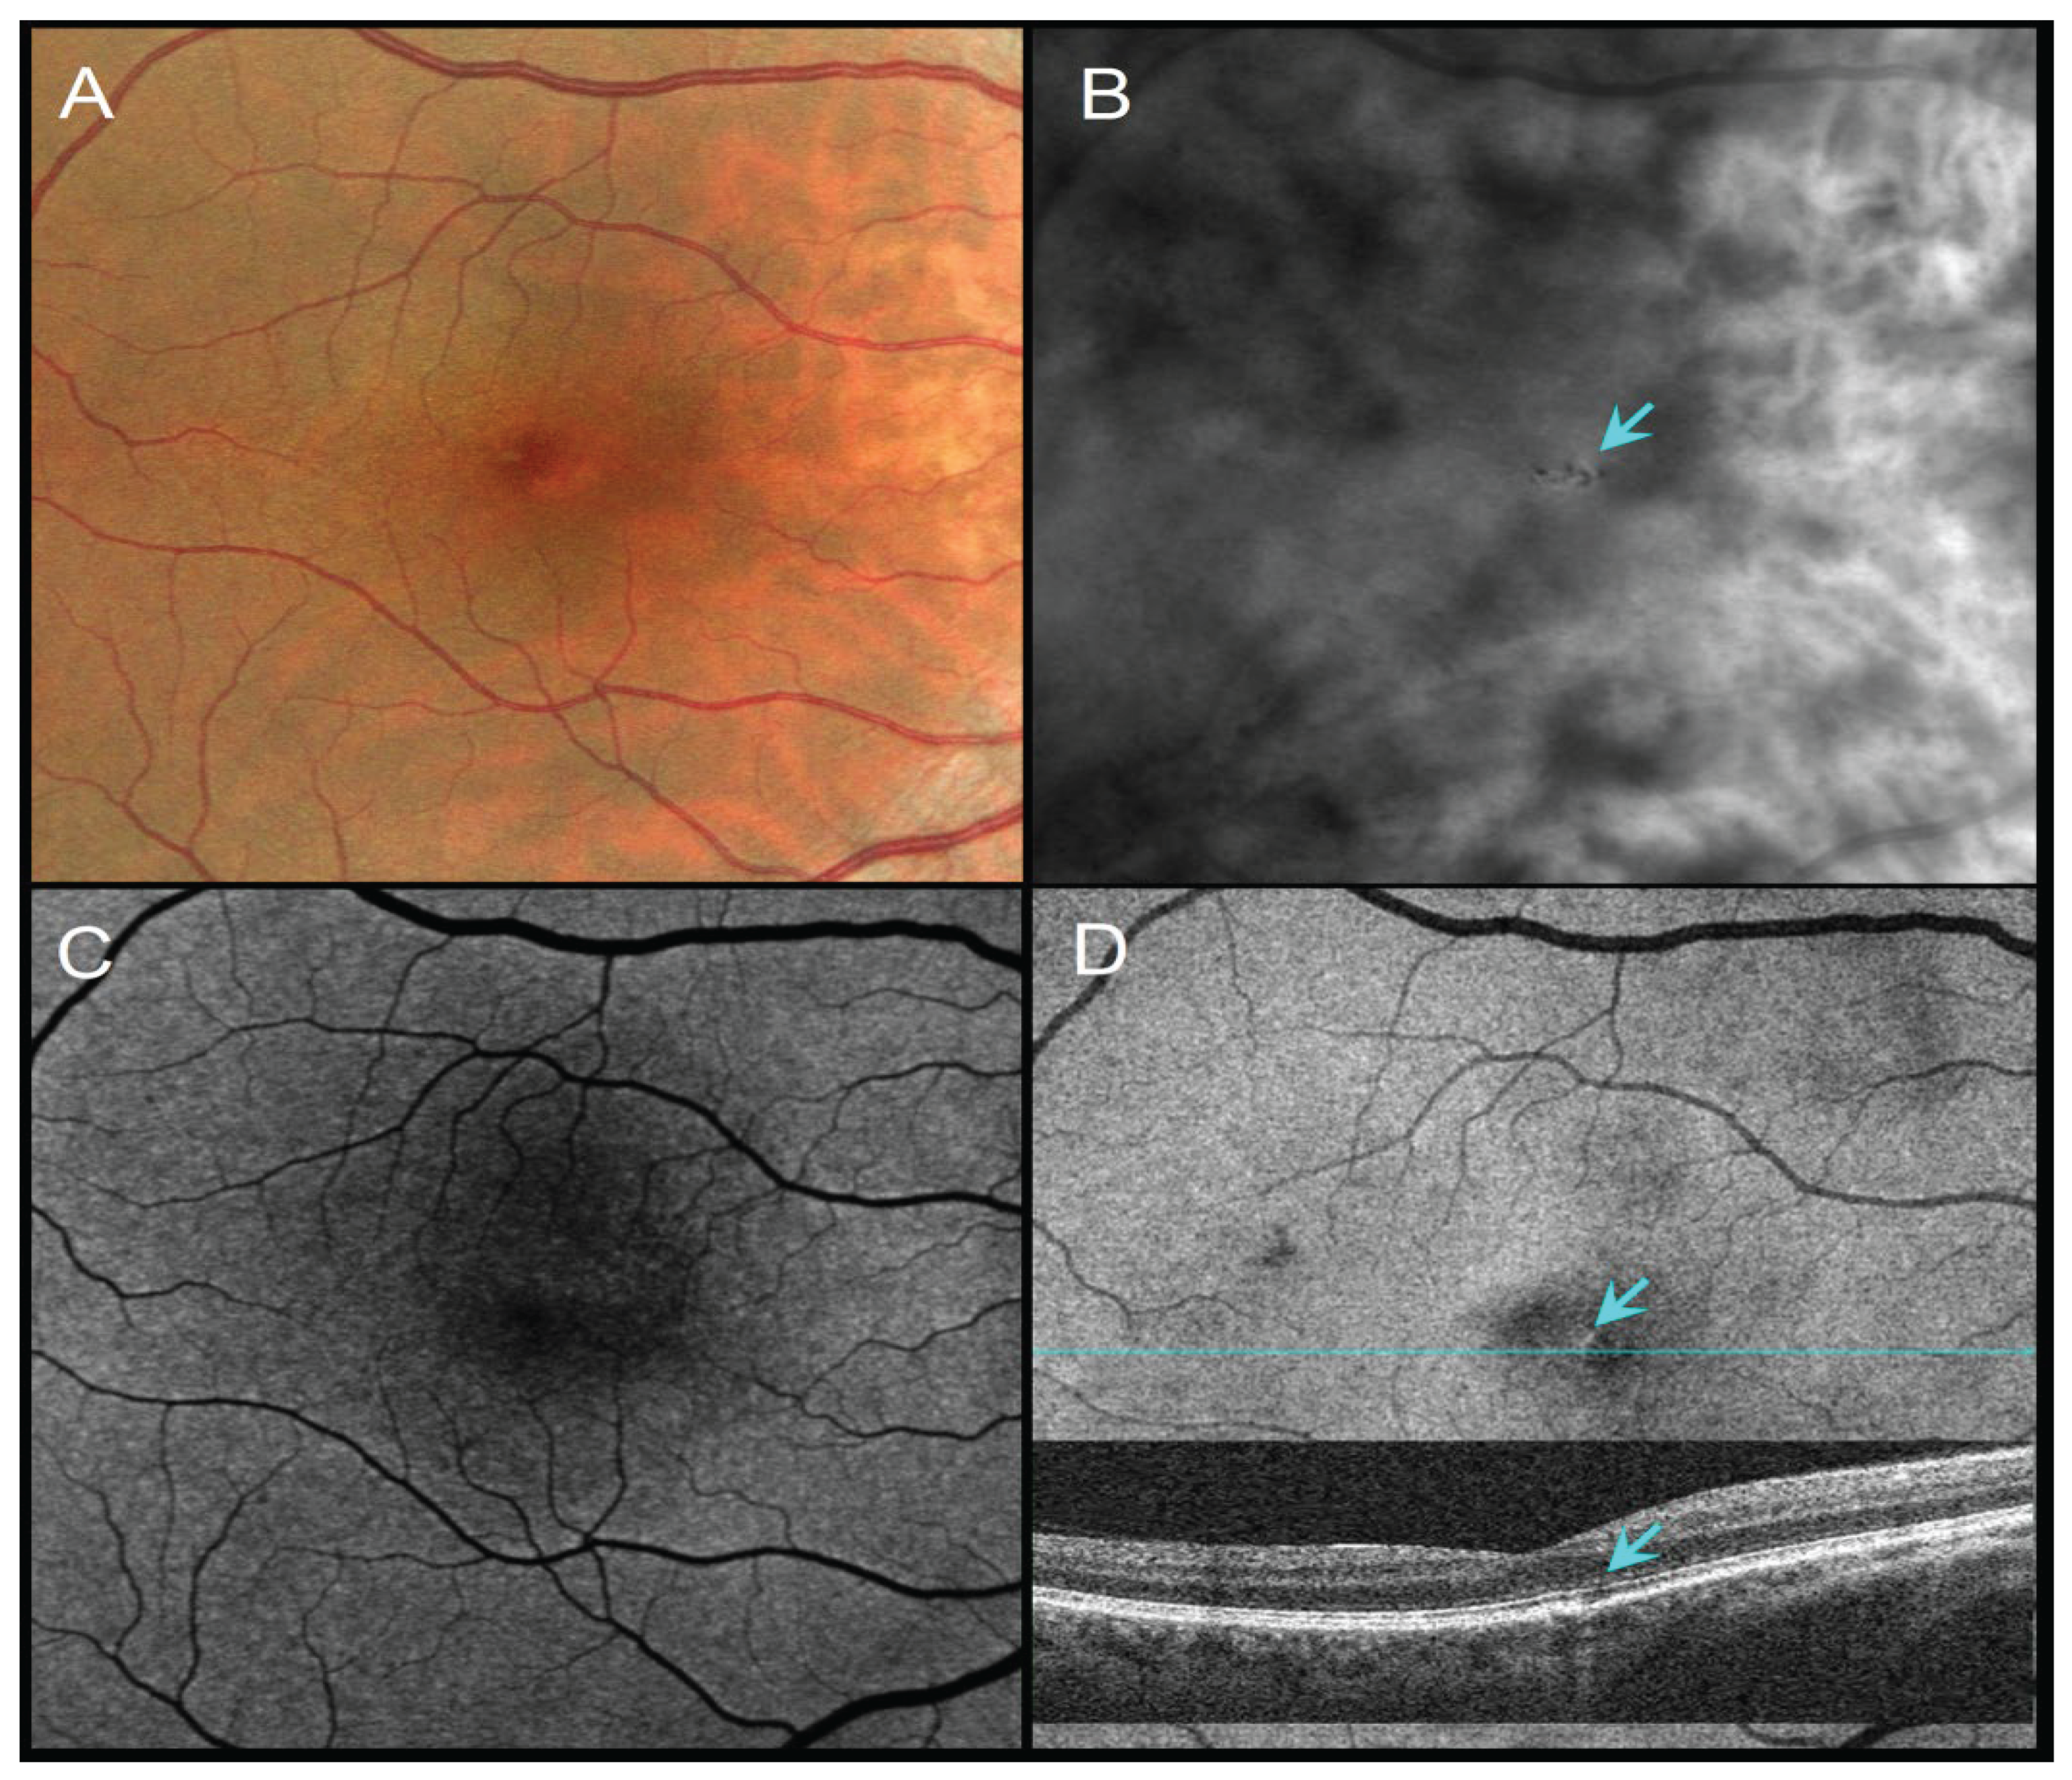
Figure 2.
86-year-old female with pigment migration over a drusenoid PED, VA 20/63. (A) CFI shows pigment migration (dotted circle). (B) RAR reveals several mid-sized dark contrast halos corresponding to pigment clumps (dotted circle). (C) FAF shows a faint signal change partially obscured by macular pigment. (D) En face OCT (retinal IS/OS slab) and corresponding B-scan (blue line on panel B) show intraretinal HRF overlying the drusenoid PED (dotted circle and blue arrow). Abbreviations: CFI, color fundus image; FAF, fundus autofluorescence; HRF, hyperreflective foci; OCT, optical coherence tomography; PED, pigment epithelial detachment; RAR, ring aperture Retro mode; VA, visual acuity.
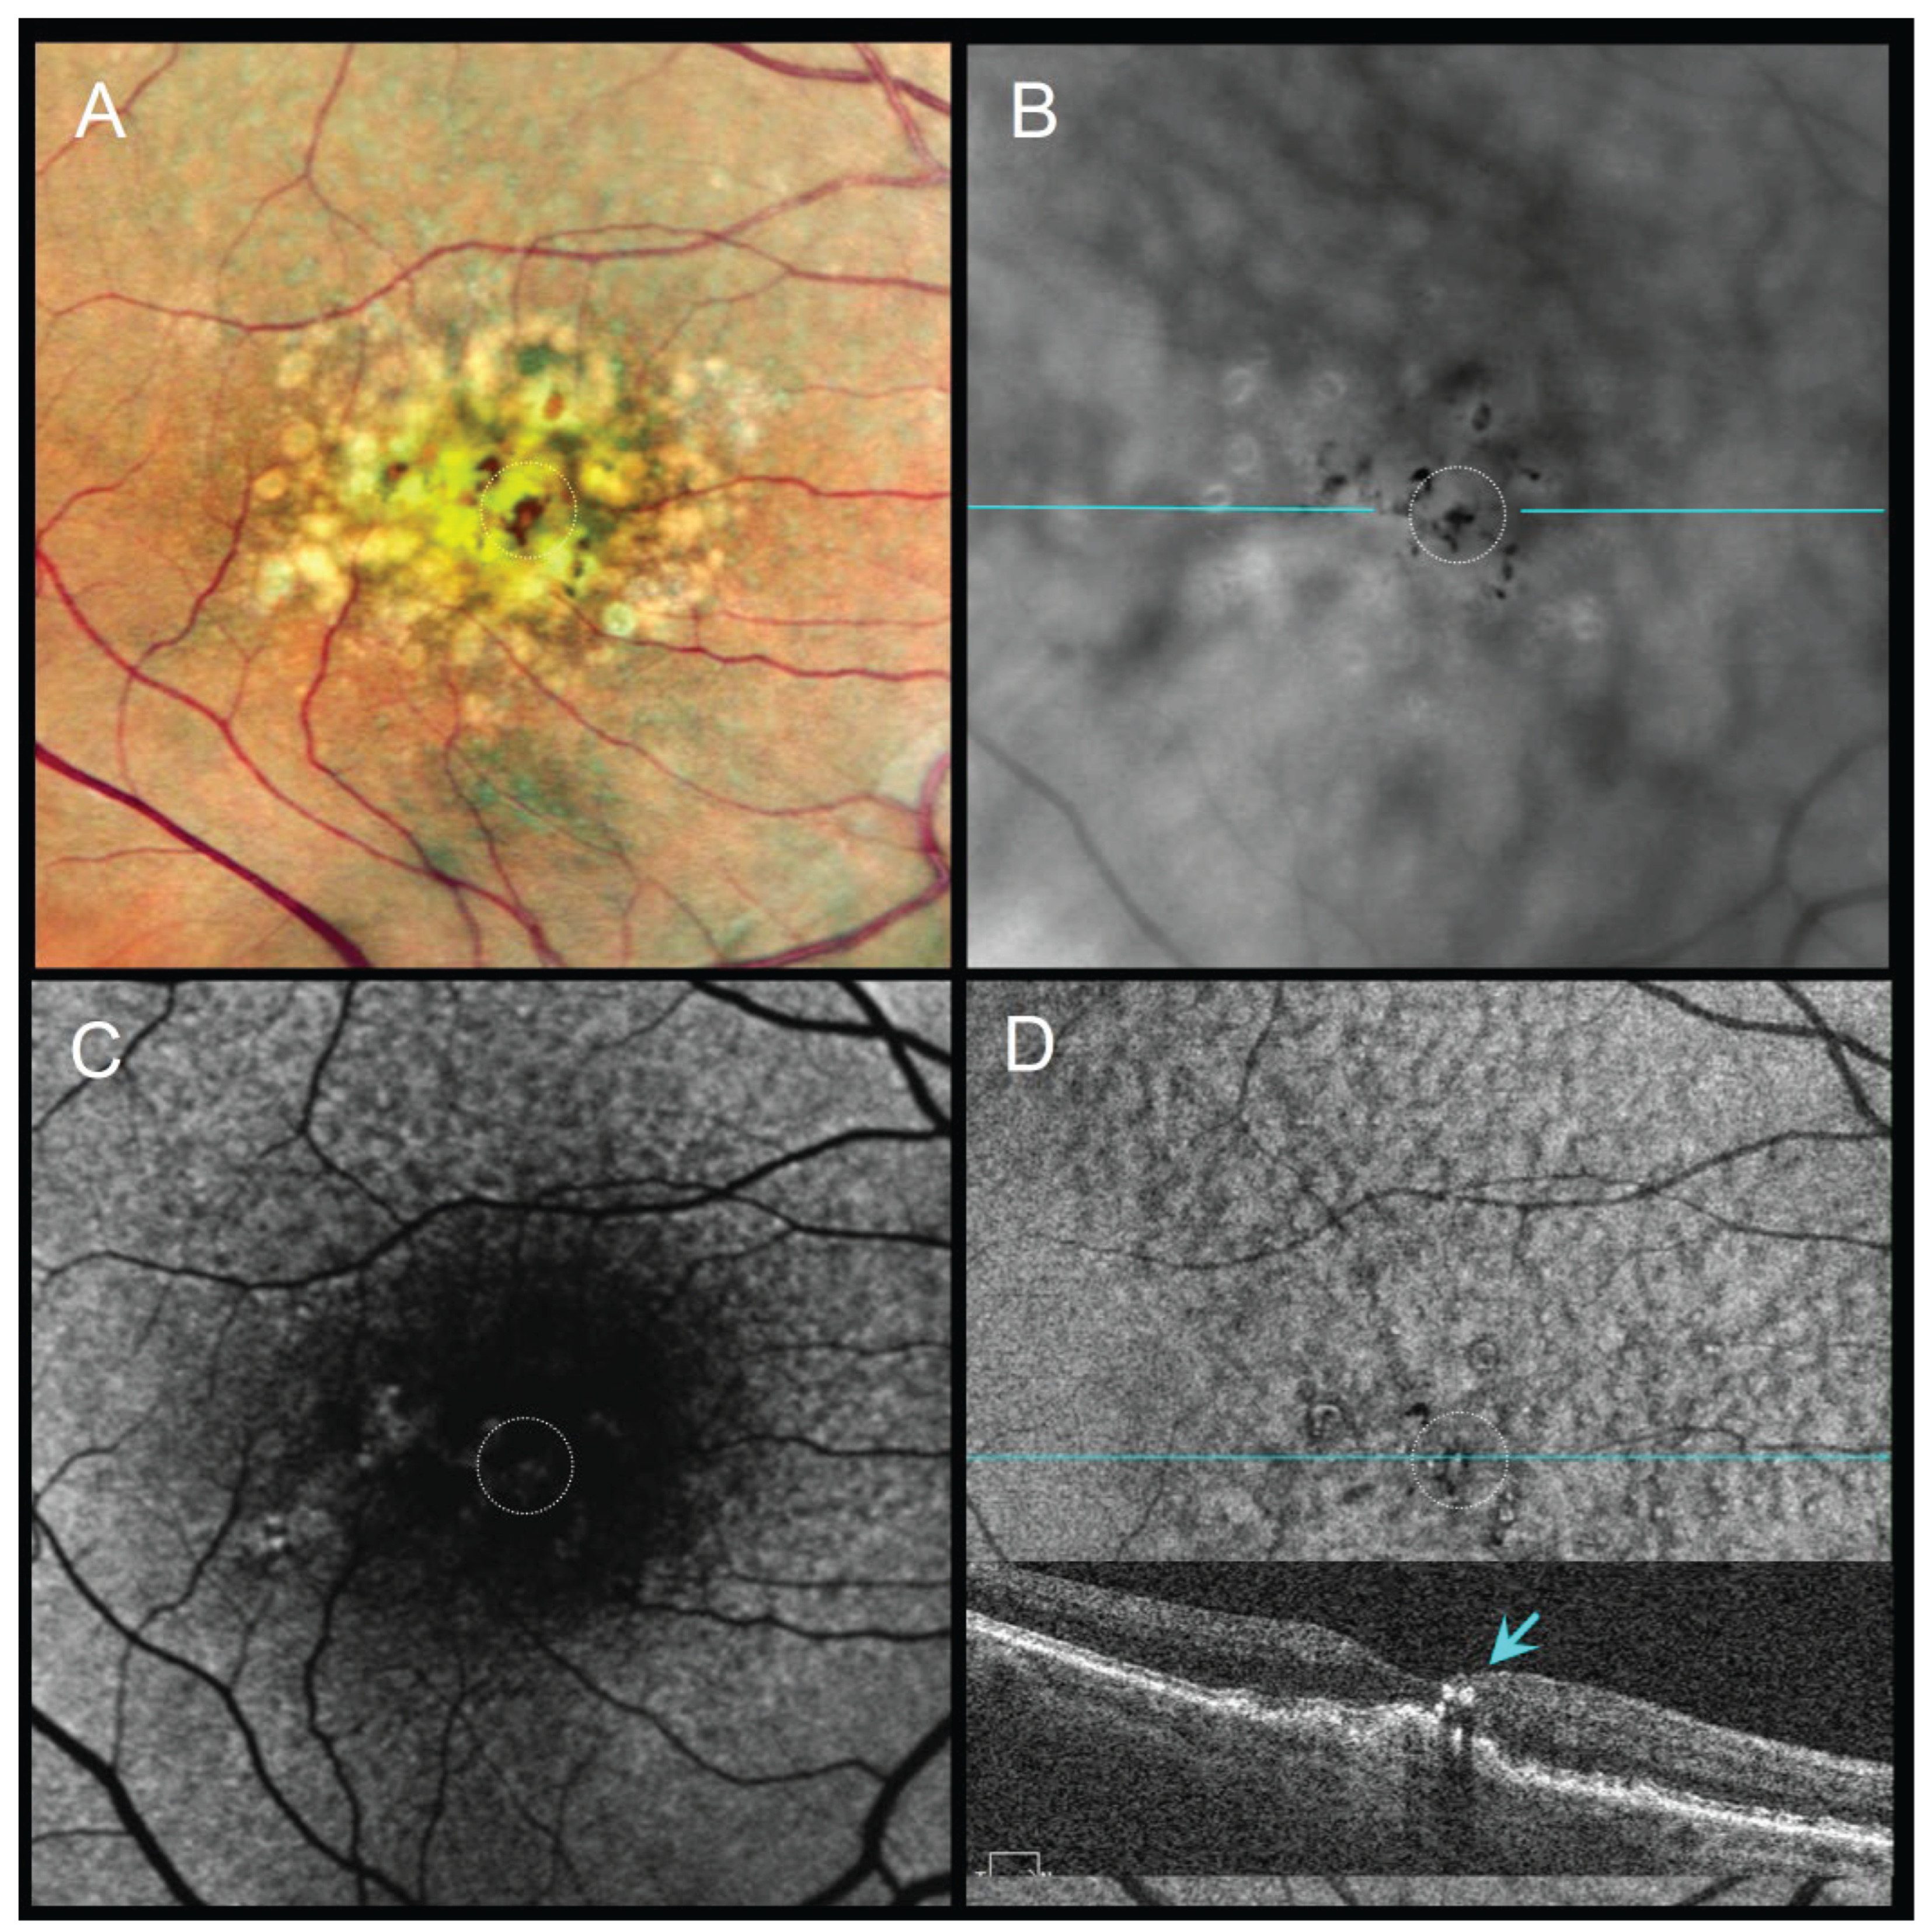
Figure 3.
85-year-old male with subretinal drusenoid deposits and perifoveal pigment migration sparing the fovea, VA 20/40. (A) CFI shows coarse dark lines/dots corresponding to perifoveal pigment migration. (B) RAR highlights broad perifoveal dark contrast halos consistent with pigment accumulation. (C) FAF displays subtle changes in autofluorescence. (D) En face OCT (retinal IS/OS slab) and corresponding B-scan (scan line indicated in panel B) show thickened RPE (tRPE) beneath areas of pigment migration. Abbreviations: CFI, color fundus image; FAF, fundus autofluorescence; OCT, optical coherence tomography; RAR, ring aperture Retro mode; tRPE, thickened retinal pigment epithelium; VA, visual acuity.
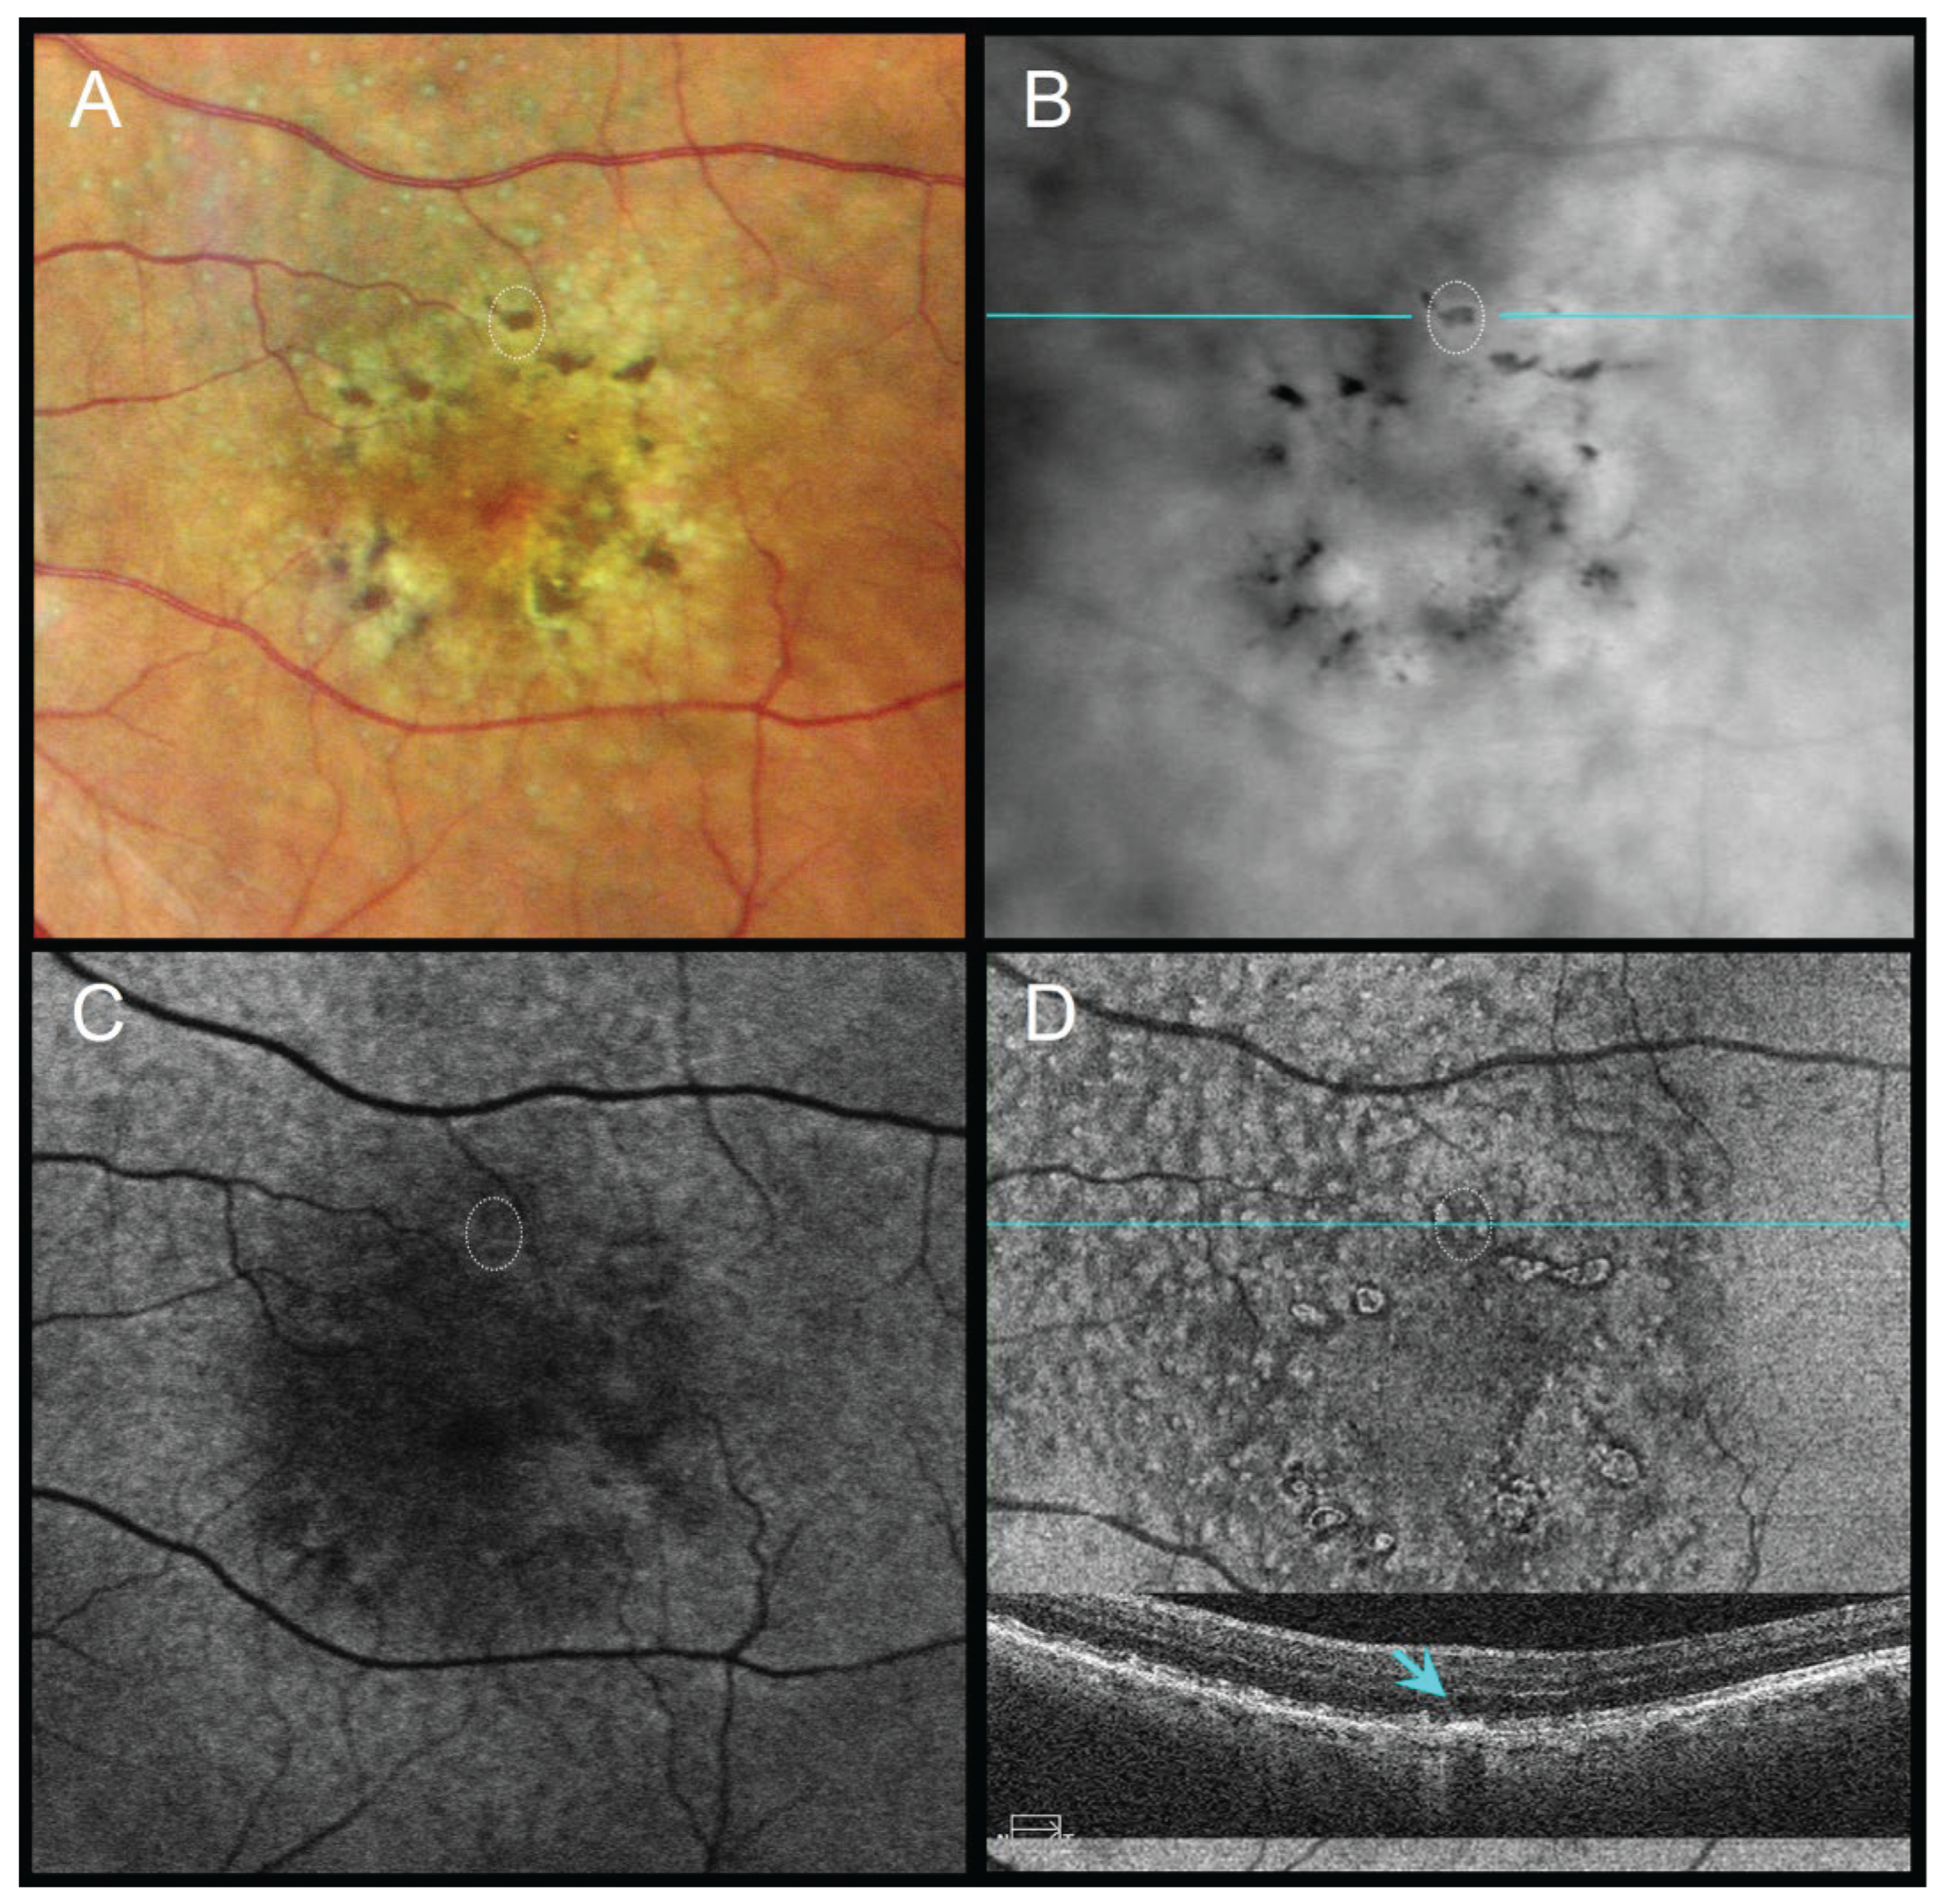
Figure 4.
79-year-old female with pseudodrusen, geographic atrophy (GA), and a refractile drusen at the superior atrophy margin, VA 20/100. (A) CFI shows subtle pigment migration (dotted circle). (B) RAR displays a ring-shaped dark contrast halo with a bright central core (dotted circle), consistent with a refractile drusen. (C) FAF shows localized signal alterations partially masked by macular pigment. (D) En face OCT (retinal IS/OS slab) and corresponding B-scan (scan line indicated in panel B) demonstrate a hyperreflective ring with a central hypertransmission (blue arrow), compatible with a refractile drusen adjacent to GA. Abbreviations: CFI, color fundus image; FAF, fundus autofluorescence; GA, geographic atrophy; OCT, optical coherence tomography; RAR, ring aperture Retro mode; VA, visual acuity.
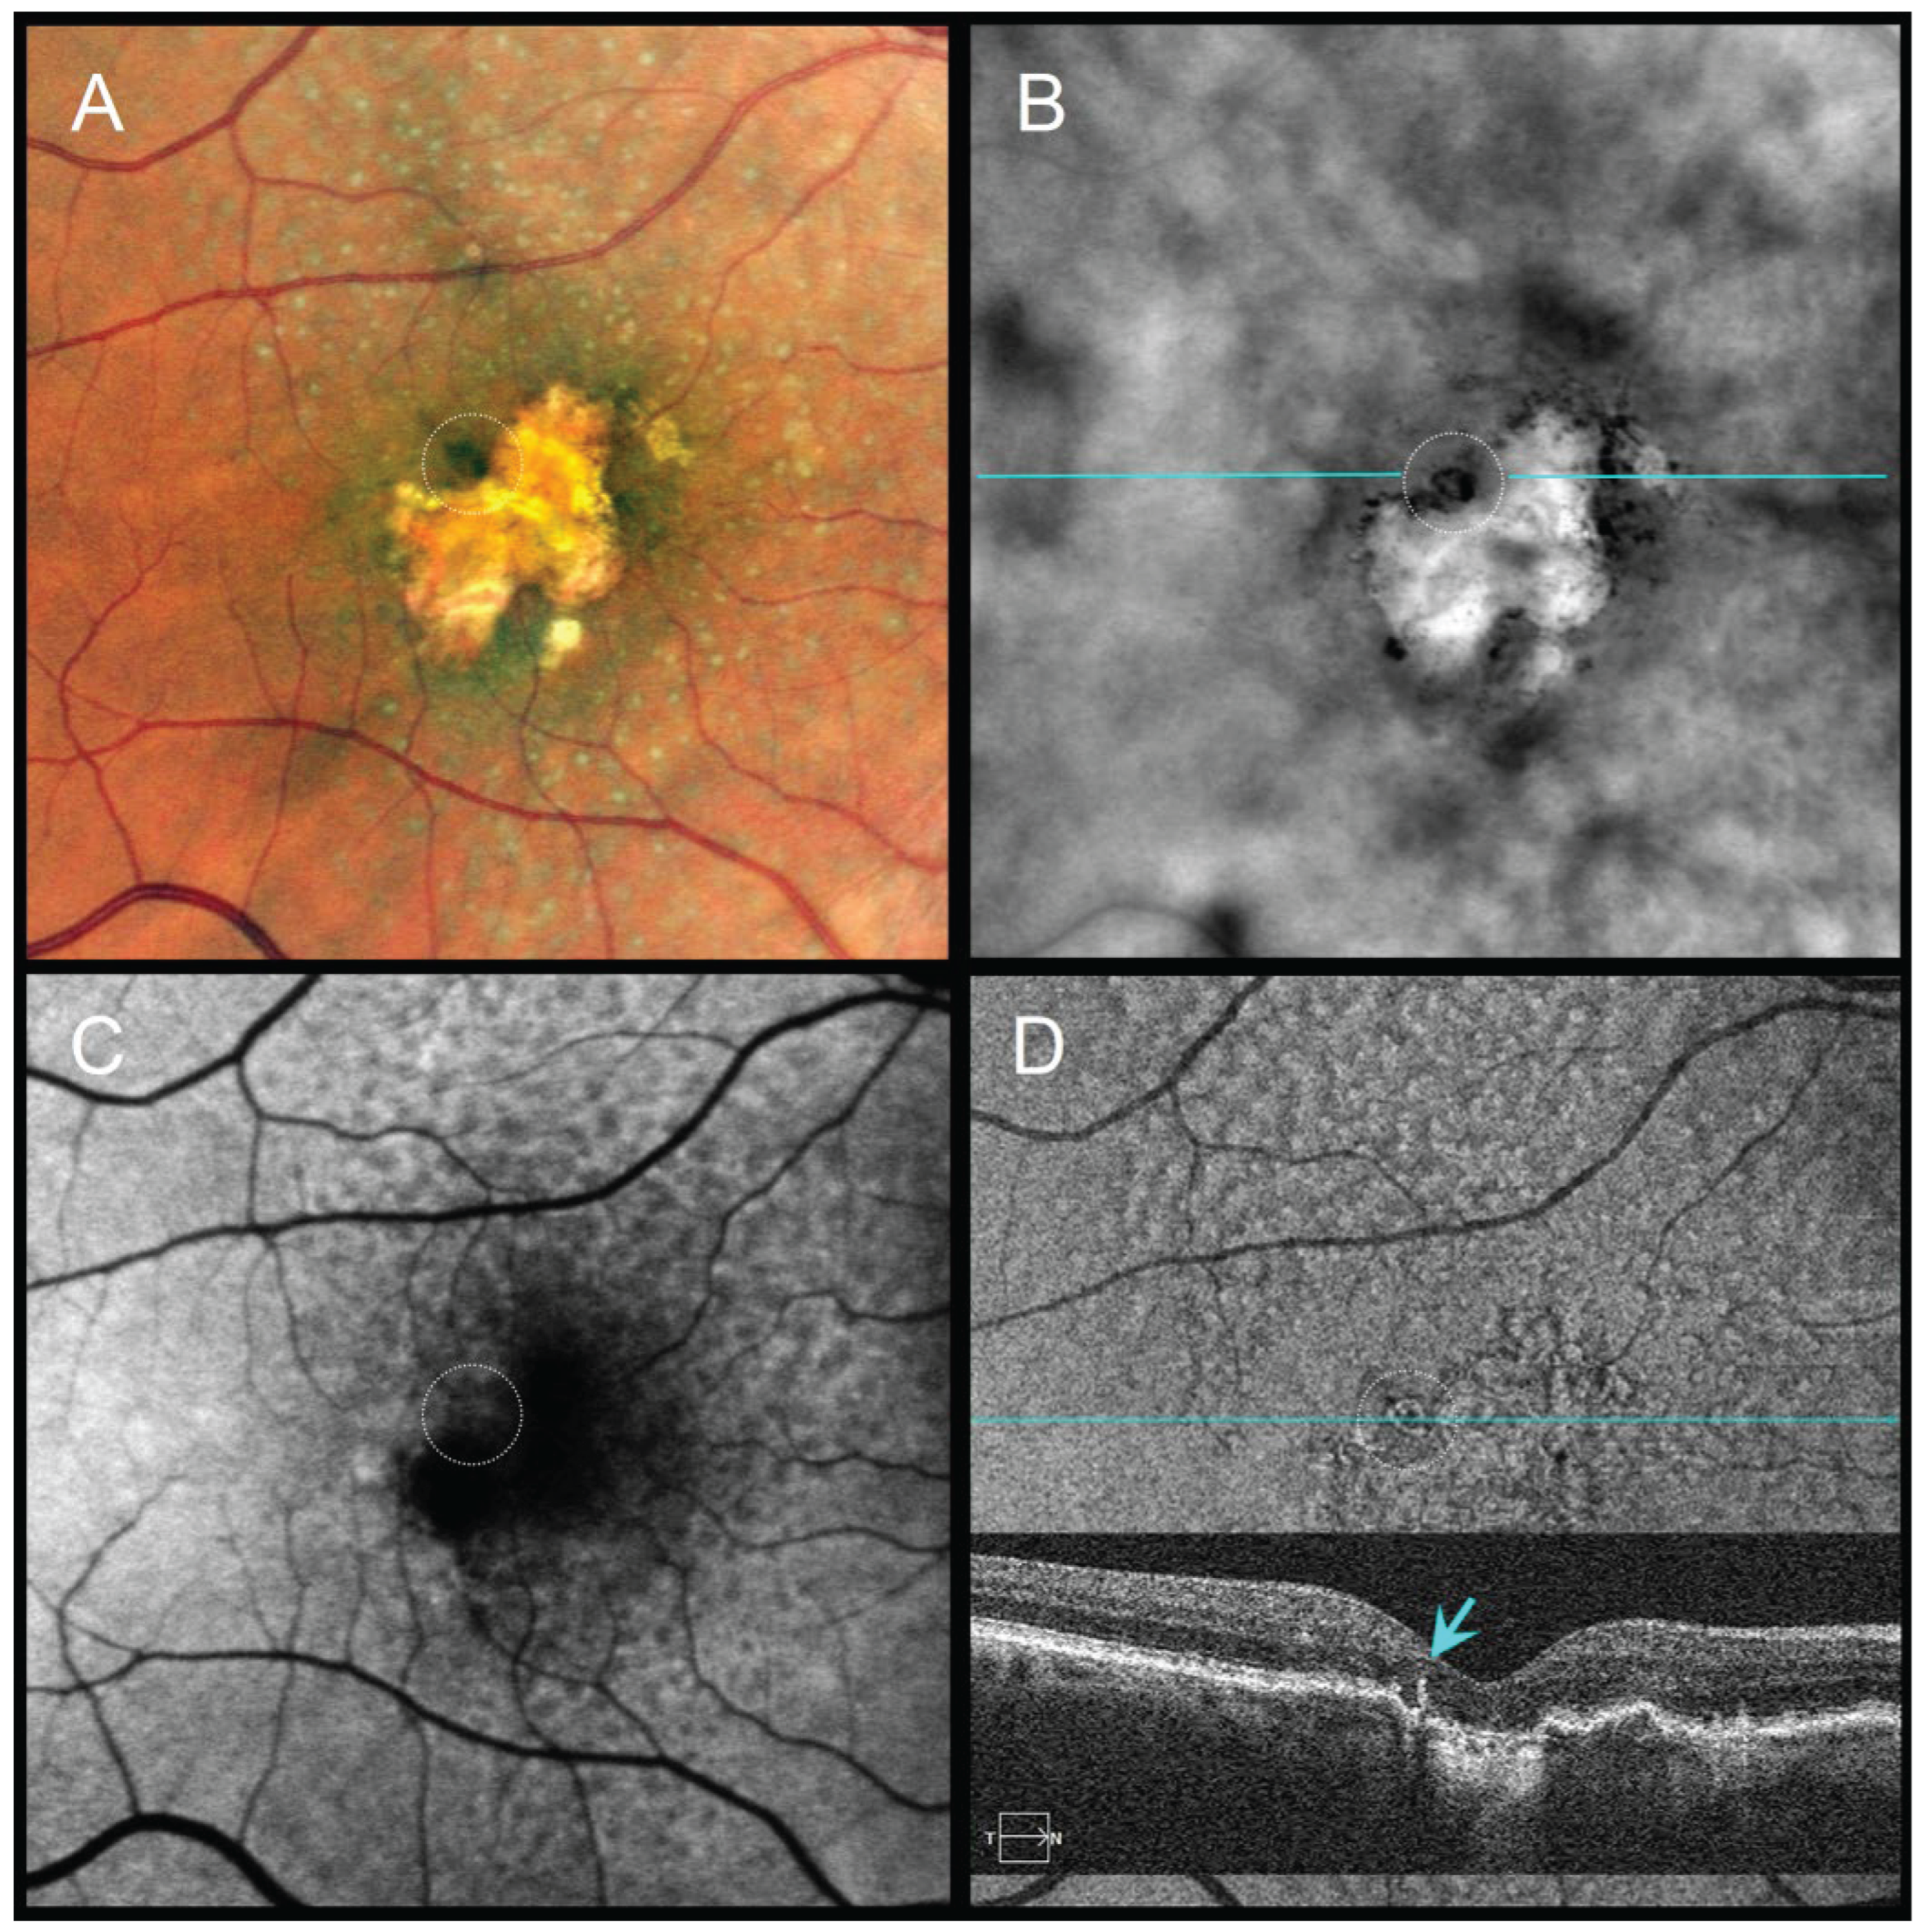
Figure 5.
Longitudinal multimodal imaging of a 66-year-old male (2022–2024).


Table 1.
Contingency tables comparing RAR with en face OCT (reference standard) and with CFIs for the detection of pigment migration in 80 eyes (Abbreviations: CFI, color fundus image; OCT, optical coherence tomography; RAR, ring aperture Retro mode).
Table 1.
Contingency tables comparing RAR with en face OCT (reference standard) and with CFIs for the detection of pigment migration in 80 eyes (Abbreviations: CFI, color fundus image; OCT, optical coherence tomography; RAR, ring aperture Retro mode).
| En face OCT (Reference) | CFIs | |
|---|---|---|
| True positives (TP) | 71 | 43 |
| False negatives (FN) | 4 | 4 |
| False positives (FP) | 5 | 33 |
| True negatives (TN) | 0 | 0 |
| Total | 80 | 80 |
Table 2.
Performance metrics of RAR compared with en face OCT and CFIs, including sensitivity, specificity, positive predictive value (PPV), accuracy, and F1 score (abbreviations: CFI, color fundus image; OCT, optical coherence tomography; RAR, ring aperture Retro mode).
Table 2.
Performance metrics of RAR compared with en face OCT and CFIs, including sensitivity, specificity, positive predictive value (PPV), accuracy, and F1 score (abbreviations: CFI, color fundus image; OCT, optical coherence tomography; RAR, ring aperture Retro mode).
| Metric | vs en face OCT | vs CFIs |
|---|---|---|
| Sensitivity (%) | 94.7 | 91.5 |
| Specificity (%) | 0.0 | 0.0 |
| Positive predictive value (%) | 93.4 | 56.6 |
| Accuracy (%) | 88.8 | 53.8 |
| F1 score (%) | 94.0 | 69.9 |
Table 3.
Characteristic morphologic patterns of pigment migration displayed on color fundus images (CFI), en face OCT, B-scan OCT, and ring-aperture Retro mode (RAR) imaging. In RAR, dark halos denote hyporeflectivity and bright halos denote hyperreflectivity, consistent with its indirect transillumination principle. As lesion appearance on en face OCT is known to vary with the depth and thickness of the selected slab, the descriptions provided here reflect the features observed using the two standard Cirrus preset slabs applied in our study; customized slabs may yield different patterns, as previously reported. Imaging characteristics were adapted from established descriptions in the literature [3,11,17,18,21,22].
| Lesion type | CFI | En face OCT | B-scan OCT | RAR |
|---|---|---|---|---|
| Pigment migration / HRF | Small dark clumps or spicules; clustered | Bright focal dots [3]; Dark foci with shadowing [3] |
Hyperreflective intraretinal foci [3] | Granular hyperreflective dots [18,22] |
| tRPE | Thick irregular dark areas | Edge signals; HypoTD [3] | Thickened/irregular RPE; reduced transmission [3] | Plateau-like dark halos [21,22] |
| Early atrophy / nascent GA | Pale areas | Loss of normal pattern; HyperTD patches [3] |
RPE attenuation + increased choroidal signal | Light homogeneous patches [17] |
| Refractile drusen | Crystalline shiny points | Bright ring/dot; HyperTD [11] | Calcified drusen with reflective core [11] | Ring-like hyperreflectivity (bright halos) [17,18,21] |
| Cuticular drusen | Multiple small yellow spots | Clustered bright dots; small ring-like HypoTD [11] | Small dome-shaped RPE elevations | Small clustered hyperreflective dots [17,21] |
Disclaimer/Publisher’s Note: The statements, opinions and data contained in all publications are solely those of the individual author(s) and contributor(s) and not of MDPI and/or the editor(s). MDPI and/or the editor(s) disclaim responsibility for any injury to people or property resulting from any ideas, methods, instructions or products referred to in the content. |
© 2025 by the authors. Licensee MDPI, Basel, Switzerland. This article is an open access article distributed under the terms and conditions of the Creative Commons Attribution (CC BY) license (http://creativecommons.org/licenses/by/4.0/).
Copyright: This open access article is published under a Creative Commons CC BY 4.0 license, which permit the free download, distribution, and reuse, provided that the author and preprint are cited in any reuse.


