Submitted:
20 November 2025
Posted:
21 November 2025
You are already at the latest version
Abstract
Detailed geochemical modelling of the potential groundwater impacts of CO2 geo-sequestration requires site-specific knowledge of how mobile elements are hosted within rocks. We present a simple sequential extraction procedure analogous to pH conditions produced by different partial pressures of carbon dioxide (CO2) in contact with water. The procedure consists of three sequential steps: Water at pH 7; acetic acid–ammonium acetate at pH 5 and then at pH 3, with the amounts of specific elements extracted by each step considered with respect to whole-rock total element abundance. Our purpose in developing this procedure is three-fold: 1) identify readily mobilised suites of elements for groundwater baseline and monitor bore studies; 2) provide insights regarding the mode/s of occurrence of easily extracted elements within rock samples; and 3) suggest possible mechanisms for the mobilisation of rock-sourced elements into groundwater under neutral to moderately acidic pH that can inform reactive transport modelling of carbon storage sites. In our case study, the second step extracted most of the main mobile elements of interest.
Keywords:
element mobility
; weak acid
; sandstone
; carbon storage reservoir
1. Introduction
The atmospheric emission of greenhouse gases can potentially have a profound effect on global climate and geological storage of CO2 emissions is one method of mitigating this [1,2]. CO2 dissolved in groundwater initially forms carbonic acid, and the gradational pH reduction radiating out away from the CO2 plume may induce element mobilisation via desorption/cation exchange and mineral dissolution reactions. One way to explore such reactions is via incrementally sampled benchtop experiments involving CO2, water, and rock at in-situ temperature and pressure conditions, with changes in water chemistry over time curve-fitted by modelling software such as The Geochemist’s Workbench© [3,4,5,6,7,8] that is then fed into reactive transport models such as TOUGHREACT [6,7,8]. However, this requires specialist equipment and is time consuming. Supplementing resource intensive CO2 batch reactor experiments with quicker and cheaper ‘test tube’ type extractions using an analogous weak acid is a way to both increase the scale of investigation of relevant fluid-rock interactions, as well as help identify which mobile elements are likely worth labour-intensive computer modelling. Dilute acetic acid is a roughly analogous weak acid more suitable than carbonic acid for pH-controlled benchtop experiments.
Sequential extraction experiments utilizing reagents with progressively more acidic pH is one way of evaluating how mobile elements are hosted within reservoir rocks. Both single- and multiple-step extractions are commonly used to investigate the bio- or environmental-availability of elements and their modes of occurrence within substrates such as soils, sediments, and mine wastes [9,10]. Experiments using powdered and homogenised substrate materials produce more consistent and comparable results than extractions of ’as received’ samples, and multiple-step ‘sequential extractions’ provide more useful element behaviour/occurrence data than single-step extractions.
The pH range of the initial steps of several sequential extraction procedures (neutral to moderately acidic) is applicable to impacted groundwater during CO2 geo-sequestration. For example, the first step of the Community Bureau of Reference (BCR) three-step sequential extraction procedure (and variants) reacts acetic acid with 1 g of soil or sediment [11,12], at an initial pH of 3 that is relevant to CO2 sequestration. A similar common reagent for extraction of metals from carbonates is the 1 M sodium acetate-acetic acid buffer at pH 5 [13], which also promotes extraction of adsorbed elements [9]. The acetate anion may extract some metals via complexation [14]; or at least help to keep them in solution once extracted from host materials, as do exchangeable cations of reagents that may limit sorption of metals to “active” sites that may be present within sedimentary materials [15].
The broad range of potential hosts from which buffered weak acids may extract elements present in substrates can make interpretation of extraction results challenging. Elements hosted in water-soluble chemical species, adsorption and exchange sites, weak acid reactive minerals (including carbonates and some aluminosilicates) as well as some amorphous compounds of manganese and iron (that may also have provided adsorption sites for other elements/compounds) are all dilute acetic acid-extractable [14,15,16,17]. Thus, whilst broadly following the initial step of BCR-style procedures and utilising acetic acid buffered with ammonium acetate, we have added an additional two steps: Water soluble and weakly exchangeable fraction at pH 7, and weak acid extraction at pH 5 prior to extraction at pH 3; to further discriminate element behaviour under neutral to moderately acidic conditions.
The later steps of other sequential extraction procedures such as BCR, that employ harsher reagents at lower pH than would be experienced during geo-sequestration are not considered by our work. Instead, fractions of the same powders used for sequential extractions have undergone separate fusion, loss on ignition, and multi-acid total digestion procedures to obtain quantitative total rock concentration data for up to 52 elements plus the adsorbed moisture content of samples. This enables more accurate assessment of the proportions of elements extracted during each sequential step than could be obtained by attempting to recover and assay the solid residues that remain after this sequential extraction procedure.
This procedure was developed during ANLEC R&D projects 7-1115-0236 [7] and 7-0320-C323 [8]. The current work considers data from a subset (n = 36) of curated Precipice Sandstone core samples from five wells drilled in the Surat Basin, Queensland, Australia (Figure 1): Chinchilla 4, Tipton 153, West Moonie 1, West Wandoan 1, and Woleebee Creek GW4 [18,19,20,21,22]. Most of the samples are sandstones but six are siltstone with varying proportions and thicknesses of sandstone interbeds. The Precipice Sandstone was chosen as a target for potential demonstration of CO2 injection for a variety of reasons [20,21]. It is the deepest unit of the Surat Basin (Figure 1), has good porosity and permeability, and is isolated from both shallower coal seam gas units and aquifers more commonly accessed by farmers and industry. Additionally, the Moonie Oil Field adjacent to the West Moonie 1 site extracts oil from both the Precipice Sandstone and a unit called the Boxvale Sandstone within the overlying Evergreen Formation.
2. Materials and Methods
Several samples (n = 22) had thin sections prepared for SEM-EDS spot element analyses and automated mineral assays such as QEMSCAN and MLA (similar techniques). Representative rock powders of all core samples were prepared via clean crushing techniques using agate to limit contamination and reduce element concentration backgrounds. Splits of the same homogenized rock powders of given samples were utilized in parallel for XRD mineralogy, total element assays, and sequential extractions via a combination of methods.
Semi-quantitative XRD analysis of all rock powders (n = 36) was performed utilising a Bruker D8 Advance powder XRD at the UQ Centre for Microscopy and Microanalysis (CMM). The copper radiation source was set to 40 kV and 40 mA, with 15 rpm rotation continuous scanning using a 0.06°/sec step size from 2° to 70° (2Θ) scanning angle. The raw data was manually processed using DIFFRAC.EVA with the latest PDF-2 reference database, with quartz used to normalize the x-axis peak shifts of the sample mineral patterns.
Standard gravimetric analytical techniques (Inductively Coupled Plasma Optical Emission Spectroscopy (ICP-OES) and Inductively Coupled Plasma Mass Spectrometry (ICP-MS) were utilised at the Centre for Geoanalytical Mass Spectrometry (CGMS) within the UQ School of the Environment. Concentration data were obtained for fifty-two elements including Rare Earth Elements (REE) within splits of the rock sample powders. Lithium metaborate fusion 5 %v/v nitric acid digest ICP-OES, coupled with weighing powdered rock samples before and after both oven drying and furnace ignition (Loss on Ignition - LOI), determined major elements, moisture, and other volatiles content of the samples. An in-house Teflon beaker acid digestion method involving sequential hydrofluoric acid, hydrochloric acid, aqua regia, and nitric acid reactions was used to determine predominately minor and trace elements via ICP-OES and ICP-MS assays of aliquots diluted to 2 %v/v nitric acid. Some major element assays were cross-comparable between the fusions and hotplate digestion techniques; however, silicon could only be assayed via fusions and elements such as sulfur are more accurately determined via capped Teflon beaker digests. Data QC involved checks of element recoveries for Certified Reference Materials subjected to the same treatment and procedures as our samples, and for fusions the total mass of major and minor elements plus moisture and LOI converted to oxide wt.% needed to equal ~ 100 %.
We have attempted to separate the fractions of elements that are: 1) water soluble (e.g., salts), weakly adsorbed and exchangeable at pH 7; 2) strongly adsorbed or bound to minerals that dissolve at pH 5; and 3) bound to or hosted in minerals that continue (or begin) to react with weak acids at pH 3. To do this, we have generally followed the overall methodology of a modified BCR Procedure [12] in terms of sample powder mass, extraction fluid volume and hence fluid-rock ratio, reaction time, tube rotation rate, laboratory temperature, centrifugation/filtering, and inter-step cleaning procedures. Each of the sequential extraction steps utilised generally the same methodology with only the extraction solution composition varying. Sediment resuspension following centrifugation compaction is essential at the commencement of each subsequent extraction step, to ensure comparable reactive surface areas [27]. Washing of well-shaken sample powders within tubes with 20 ml of pure water took place between each sequential extraction step, with this being discarded via pipetting following centrifugation.
In detail: Experiments extracting elements from 1 g of rock sample powder took place in 50 ml falcon tubes. Each tube (plus powder) had 40 ml of reagent solution added to it. In sequence, these were water with trace ammonium acetate (0.11 M) at pH 7, acetic acid (1 M) buffered with ammonium acetate at pH 5 and again at pH 3. For the acid steps (2 and 3), tubes were initially left uncapped for about 30 minutes. This was to allow for escape of any CO2 gas generated by reaction with carbonate minerals that (if abundant) may otherwise cause over-pressure leakage from tube lid threads. Once any visible bubbling had ceased, tubes were tightly capped and then wrapped with paraffin film to further limit the potential for leakage during experiments. Tubes were rotated end-over-end at 30 rpm for 16 hours. After gentle internal washing and tapping to remove fine solids stuck to the sides or the inside of the lid, tubes underwent centrifugation at ~ 4000 rpm for 40 minutes to help settle fine solids floating in the fluid. Clean 5 ml pipette tips were then used to carefully remove as much fluid as practical (without disturbing solids) from each tube. Aliquots were immediately syringe filtered (0.11 μm) and 10:1 diluted with 2 %v/v nitric acid prior to analyses of major, minor, and trace elements via ICP-OES and ICP-MS.
3. Results
We have investigated relationships between elements as well as their mobility at ambient temperature and pressure and neutral to moderately acidic pH, with inferences made about rock sample hosts of mobile elements. Because our intention is to demonstrate the utility of the procedure rather than focus on individual sample element behaviors, and for ease of reading, this section considers average rock mineralogy (Table 1) and median element data (Table 2 and Table 3) for the total chosen sample set (n = 36). Averaging the mineralogy (Table 1) causes the perception of some minerals particularly carbonates being significantly less abundant than they were in some samples (Figure 2), and the different mineral assay techniques are complimentary rather than directly comparable. Full data tables are available in Appendix A and B.
The amounts of elements mobilized from samples have been normalized to mass of powder used for the extractions, with median element extraction expressed as mass of element (mg) per mass of powder (kg) in Table 2, that also lists the whole rock total element concentrations in the same units of measurement (rock ppm) for ease of reference. Dividing mass of element extracted per total mass of element in the rock and multiplying x100 gives percentage element extraction from samples; median proportions of elements extracted are presented in Table 3. Please note that the entire sample set (Appendix B.1 and B.2) was used to calculate data in Table 3 rather than just the medians of Table 2. Elements with median extraction greater than 1 mg per kg of rock or exceeding 5 % of the median total originally present within the homogenized rock powders are highlighted, as well as summarized in Table 4 that details the most significantly extracted elements.
Alkali and alkaline earth metals, mainly potassium, sodium, calcium, and magnesium, plus sulfur contribute most to bulk water chemistry changes during the Step 1 ‘water leach’ at pH 7. What is extracted during Step 1 is most likely water-soluble salts plus some cation exchangeable and weakly adsorbed ions. Most of the potassium and sulfur water-extracted from West Wandoan 1 sandstones (Figure 3) was probably drilling salt contamination, given that a substantial amount of potassium sulfate was added to the drilling mud whilst penetrating parts of the Precipice Sandstone at that site [21]. At least some of the extracted barium, calcium, magnesium, sodium, and strontium could have come from cation exchange sites within trace smectite (Table 1, Figure 2) [28]. The cobalt, nickel, and thallium may have been desorbed from clay surfaces, with thallium known to be mobile at neutral pH [29,30,31].
Aluminium, iron, and magnesium had the highest median extraction during the pH 5 acid step (Table 1), with silicon extraction tracking these for individual samples (Appendix B.1). The below detection median silicon extraction is likely an artefact of relatively high detection limits for silicon during ICP-OES analysis compared with most other assayed elements. Dissolution of an iron-rich chlorite is a likely major source of these elements [32] although some of the iron and magnesium possibly came from trace carbonates that probably also reacted (Table 1, Figure 2). Additional elements with relatively high median extraction include barium, calcium, copper, lead, and zinc. Other mobile metals and metalloids include antimony, arsenic, beryllium, bismuth, cobalt, and nickel (Table 2). Whilst several of the metals could have been hosted within carbonates [33,34], it is conceivable that at least some of particularly the base metals and metalloids may have been desorbed from mineral surfaces or been hosted within weak acid-reactive sulfides and other minerals. Notably, the concentrations of acid-extracted as well as whole-rock cobalt and nickel appear correlated (Figure 4), with sampled intervals containing siltstone interbeds having the most abundant and mobile fractions of these elements.
Weak acid reactive aluminosilicate minerals probably continued to react at pH 3, as well as magnesian- and iron-rich trace carbonates unlikely to have fully reacted at pH 5 (Table 1). However, no element experienced more than 3 % median extraction relative to whole-rock concentrations in this step. It is possible that trace amounts of a potassium-bearing aluminosilicate did react given the linear relationship between thallium and rubidium [35] for both this step and the whole rock element data (Figure 5). This is despite acid-extracted potassium generally being below detection that may have been an artifact of very high detection limits for ICP-OES analysis of potassium relative to most assayed elements.
4. Discussion
The purpose for developing and utilizing this procedure was to identify which elements were readily mobilised over a pH range of 7 to 3 and use that data in combination with sample mineralogy to suggest modes of occur of those elements within the rocks, and mechanism by which they may have been released from the rocks into solution. The majority of acid-mobilisation of elements occurred at pH 5 rather than pH 3, and the water step removed significant amounts of salts as well as potentially some exchangeable and adsorbed ions (Table 2, Table 3 and Table 4). This is significant, given that similar sequential extraction procedures tend to jump straight to pH 3 and may not include a water-leach step at all [11,12]. When considering the results, it is important to remember that powdered samples have significantly greater mineral surface area exposed to fluid than would generally occur in nature, and the fluid-rock ratios of the experiments are very high, which results in faster and more complete mass transfer of susceptible elements into the fluid phase.
Modelling of potential Precipice Sandstone groundwater impacts should focus upon the potential sources and mobility of copper, lead, and zinc. This is due to their relatively high median extraction both in terms of proportions and absolute amounts at pH 5 (Table 4), particularly copper and lead that had 40 % and 31 % median extraction from the rocks, respectively, during the second step. Other elements with appreciable proportions mobilised included potentially problematic arsenic, cobalt, and nickel, so although the median extracted mass of these elements was significantly less than that of copper and lead, they should be considered by geochemical modelers too. In this context, water chemistry during batch reactor experiments with Precipice Sandstone core at in-situ temperature and pressure conditions demonstrated that metals and metalloids were released from carbonate-cemented sandstones and mudstones [36,37], which confirms the value of sequential extraction experiments for identifying elements likely readily mobilised by water-CO2-rock interaction in carbon storage reservoirs.
Potentially, the third extraction step (pH 3) could be omitted in future given the relatively minimal proportions of elements extracted during that, or else the extraction experiment time for each step could be extended to allow for more dissolution of slowly reacting minerals to occur and thus be detectable. Regardless, the water-step should remain part of the procedure given the significant amounts of some salts dissolved from samples, and to help act as a baseline for the acid extraction step/s. Irrespective of how the elements were hosted within the rocks, geochemical modelling of the potential groundwater impacts of CO2 geo-sequestration should emphasise element behaviour at pH 5 rather than pH 3. This would also be more representative of CO2 plume-impacted groundwater anyway, given that previous reaction transport modelling has shown that low pH (< 5) is only likely to occur close to the point of injection into the subsurface [7,8,38,39].
Sequential extractions, whilst useful, do not replace the need for incrementally sampled CO2 batch reactor experiments with representative intact rock samples and simulated groundwater chemistry, at in-situ pressure and temperature conditions, that can be iteratively history matched by geochemical modelling software [3-6]. They do, however, help to provide context such as which mobile elements are most representative of overall rock formation behaviour under CO2 geo-sequestration conditions, provided that sufficient rock samples have been taken from throughout the vertical extent of the target formation. Sequential extraction data should not be used for standalone assessment of potential environmental impact upon groundwater quality, particularly given the high surface areas of rock powders and high fluid-rock ratio involved in the experiments that were designed to accelerate mass transfer. Therefore, the sequential extractions probably show the maximum possible mobilization of metals, whereas CO2 batch reaction experiments at in-situ temperature and pressure take account of geochemical processes that may immobilize metals in precipitates or by adsorption to Fe-oxide surfaces [36,37]. Thus, the sequential extraction data acts as a useful screening tool for assessing the potential longer-term groundwater impacts of geologic carbon storage as well as input to geochemical models with realistic rock and fluid properties [6,7,8].
Author Contributions
Conceptualization, D.K., G.K.W.D. and S.D.G.; methodology, D.K., G.K.W.D.; validation, G.K.W.D.; formal analysis, G.K.W.D.; investigation, G.K.W.D.; resources, S.D.G.; writing—original draft preparation, G.K.W.D.; writing—review and editing, D.K., J.K.P. and S.D.G.; visualization, G.K.W.D. and J.K.P.; supervision, S.D.G.; project administration, G.K.W.D. and S.D.G.; funding acquisition, S.D.G. All authors have read and agreed to the published version of the manuscript.
Funding
This research was funded by Australia National Low Emissions Coal Research and Development (ANLEC R&D) grant numbers 7-1115-0236 and 7-0320-C323.
Data Availability Statement
Acknowledgments
The authors acknowledge the facilities, and the scientific and technical assistance, of the Microscopy Australia Facility at the Centre for Microscopy and Microanalysis, as well as the Centre for Geoanalytical Mass Spectrometry in the School of the Environment at The University of Queensland. We also thank Frank Brink of the Centre for Advanced Microscopy at Australian National University for assistance with QEMSCAN. CTSCo Pty Ltd are thanked for access to core and data.
Conflicts of Interest
The authors declare no conflicts of interest. The funders had no role in the design of the study; in the collection, analyses, or interpretation of data; in the writing of the manuscript; or in the decision to publish the results.
Abbreviations
The following abbreviations are used in this manuscript:
| ANLEC R&D | Australian National Low Emissions Coal Research and Development |
| BCR | Community Bureau of Reference |
| CGMS | Centre for Geoanalytical Mass Spectrometry |
| CO2 | Carbon dioxide |
| ICP-MS | Inductively Coupled Plasma Mass Spectrometry |
| ICP-OES | Inductively Coupled Plasma Optical Emission Spectroscopy |
| LOI | Loss on Ignition |
| MLA | Mineral Liberation Analysis |
| QC | Quality Control |
| QEMSCAN | Quantitative Evaluation of Materials by Scanning Electron Microscopy |
| REE | Rare Earth Elements |
| SEM-EDS | Scanning Electron Microscope Energy Dispersive Spectrometry |
| UQ | The University of Queensland |
| WR | Whole rock |
| WW1 | West Wandoan 1 |
| XRD | X-ray Diffraction |
Appendix A
Appendix A.1 Rock Samples Lithology

Table A1.
Geological Descriptions of Sampled Rock Core Intervals.
| Well | Depth (mRT) | Description |
| Chinchilla 4 | 1215.47-1215.59 | Reddish brown moderately sorted coarse- to very coarse-grained quartzose SANDSTONE with minor siderite cement. |
| 1218.02-1218.10 | Interlaminated very fine-grained argillaceous SANDSTONE and micaceous dark grey SILTSTONE with coalified plant(?) fragments. | |
| Tipton 153 | 1032.35-1032.48 | Thinly cross bedded well sorted coarse- and very coarse-grained quartzose SANDSTONE layers. |
| 1033.88-1034.00 | Very fine-grained SANDSTONE with frequent wavey grey micaceous silty mud drapes (possibly bioturbated too - intertidal?). | |
| 1066.00-1066.24 | Grey micaceous SILTSTONE with coalified plant fragments and minor very fine-grained argillaceous SANDSTONE. | |
| 1067.92-1068.00 | Thinly cross bedded moderately sorted fine- to coarse-grained SANDSTONE layers with micaceous laminations and moderate siderite cement. | |
| 1093.00-1093.19 | Cross bedded granular to pebbly moderately sorted coarse- and very coarse-grained quartzose SANDSTONE layers. | |
| West Moonie 1 | 2263.61-2263.77 | Thinly interbedded moderately sorted medium- to very coarse-grained SANDSTONE and GRAINSTONE layers with trace calcite cement and micaceous laminations. |
| 2267.05-2267.23 | Poorly to moderately sorted medium- to very-coarse grained SANDSTONE. | |
| 2267.71-2267.84 | Interlaminated argillaceous very fine- to fine-grained SANDSTONE and dark grey micaceous SILTSTONE with coalified plant fossils. | |
| 2274.10-2274.18 | Interbedded moderately sorted coarse- to very coarse-grained and minor and medium-grained SANDSTONE with micaceous laminations and minor pebbles. | |
| 2281.82-2281.92 | Thinly interbedded moderately sorted medium- to coarse-grained and pebbly coarse- to very-coarse grained argillaceous SANDSTONE layers with micaceous laminations. | |
| 2284.13-2284.24 | Thinly interbedded medium- to very coarse-grained SANDSTONE and poorly sorted pebbly GRAINSTONE layers with micaceous laminations. | |
| 2288.49-2288.61 | Moderately sorted medium- to very coarse-grained SANDSTONE with minor micaceous laminations. | |
| 2294.83-2294.98 | Well sorted fine- to medium-grained quartzose SANDSTONE. | |
| 2297.19-2297.37 | Micaceous dark grey SILTSTONE interlaminated with argillaceous very fine-grained SANDSTONE. | |
| 2298.73-2298.82 | Well sorted fine-grained quartzose SANDSTONE with minor coarse-grained sandstone at base and trace micaceous laminations. | |
| 2303.99-2304.14 | Thinly cross bedded well sorted medium- and coarse-grained SANDSTONE layers. | |
| 2311.19-2311.25 | Moderately poorly sorted medium- to very coarse grained quartzose SANDSTONE. | |
| 2314.05-2314.17 | Thinly cross bedded well sorted coarse- and very coarse-grained SANDSTONE layers. | |
| 2319.26-2319.37 | Thinly cross bedded well sorted very coarse-grained SANDSTONE with minor coarse-grained sandstone layers. | |
| 2322.61-2322.73 | Thinly cross bedded moderately well sorted medium- and coarse-grained SANDSTONE layers. | |
| 2323.76-2323.95 | Moderately well sorted fine- to medium-grained SANDSTONE. | |
| 2325.88-2326.00 | Thinly cross bedded poorly sorted fine- to very coarse-grained SANDSTONE and GRAINSTONE. | |
| 2328.54-2328.59 | Thinly interlaminated (tuffaceous?) grey micaceous SILTSTONE and very fine-grained argillaceous SANDSTONE. | |
| 2330.41-2330.55 | Thinly interbedded well sorted fine- and coarse-grained SANDSTONE layers. | |
| 2333.23-2333.30 | Well sorted coarse-grained SANDSTONE with minor medium-grained sandstone. | |
| 2338.75-2338.85 | Interbedded poorly sorted fine- to very coarse-grained SANDSTONE and GRAINSTONE layers with trace micaceous laminations. | |
| West Wandoan 1 | 1165.57-1165.65 | Thinly cross bedded medium- to coarse-grained quartzose SANDSTONE layers with micaceous silty mud drapes. |
| 1174.24-1174.33 | Well sorted medium-grained quartzose SANDSTONE with trace micaceous laminations. | |
| 1197.76-1197.84 | Well sorted coarse-grained quartzose SANDSTONE with minor micaceous silty mud drapes. | |
| 1207.61-1207.68 | Interlaminated dark grey micaceous SILTSTONE and very fine-grained argillaceous SANDSTONE. | |
| 1225.70-1225.80 | Well sorted medium-grained quartzose SANDSTONE. | |
| 1229.43-1229.50 | Cross bedded moderately well sorted coarse- to very coarse-grained quartzose SANDSTONE. | |
| Woleebee Creek GWB 4 | 1552.63-1553.00 | Thinly cross bedded well to very well sorted medium- and coarse-grained quartzose SANDSTONE layers. |
| 1570.46-1570.52 | Interbedded moderately sorted coarse- to very coarse-grained SANDSTONE and GRAINSTONE layers with trace micaceous laminations. |
Appendix A.2 Rock Samples Mineralogy
Table A2.
Semi-Quantitative XRD Mineral Content (%) of Sampled Rock Core Intervals.
| Well | Depth (mRT) | Lithology | Tectosilicates | Phyllosilicates | Carbonates | Oxide | Sulfide | ||||||
| Quartz | K-Feldspar | Kaolin | Muscovite* | Chlorite | Siderite | Ankerite | Dolomite | Calcite | Rutile | Pyrite | |||
| Chinchilla 4 | 1215.47-1215.59 | Sandstone | 88.4 | 1.0 | 2.9 | 2.2 | 5.5 | ||||||
| 1218.02-1218.10 | Sandstone and Siltstone | 64.1 | 2.1 | 17.8 | 13.8 | 1.6 | 0.20 | 0.40 | |||||
| Tipton 153 | 1032.35-1032.48 | Sandstone | 95.4 | 2.8 | 1.9 | ||||||||
| 1033.88-1034.00 | Sandstone | 82.5 | 7.2 | 7.9 | 0.9 | 1.5 | 0.13 | ||||||
| 1066.00-1066.24 | Siltstone and Sandstone | 49.9 | 24.8 | 23.6 | 0.65 | 0.64 | 0.53 | ||||||
| 1067.92-1068.00 | Sandstone | 63.1 | 6.9 | 7.9 | 1.4 | 19.9 | 0.74 | ||||||
| 1093.00-1093.19 | Sandstone | 93.7 | 2.7 | 1.9 | 1.7 | ||||||||
| West Moonie 1 | 2263.61-2263.77 | Sandstone and Grainstone | 81.9 | 6.1 | 6.1 | 3.4 | 1.7 | 0.70 | |||||
| 2267.05-2267.23 | Sandstone | 81.8 | 3.0 | 7.5 | 3.4 | 3.7 | 0.70 | ||||||
| 2267.71-2267.84 | Sandstone and Siltstone | 57.3 | 9.4 | 20.7 | 12.6 | ||||||||
| 2274.10-2274.18 | Sandstone | 64.6 | 8.9 | 8.5 | 13.1 | 1.5 | 0.70 | 2.1 | 0.50 | ||||
| 2281.82-2281.92 | Sandstone | 64.0 | 4.0 | 16.0 | 13.5 | 1.3 | 0.70 | 0.50 | |||||
| 2284.13-2284.24 | Sandstone and Grainstone | 75.9 | 9.8 | 11.8 | 1.5 | 0.80 | 0.20 | ||||||
| 2288.49-2288.61 | Sandstone | 86.1 | 0.9 | 6.0 | 6.6 | 0.30 | 0.10 | ||||||
| 2294.83-2294.98 | Sandstone | 94.2 | 5.2 | 0.50 | |||||||||
| 2297.19-2297.37 | Siltstone and Sandstone | 40.3 | 24.5 | 35.2 | |||||||||
| 2298.73-2298.82 | Sandstone | 92.5 | 4.5 | 3.0 | |||||||||
| 2303.99-2304.14 | Sandstone | 88.5 | 6.2 | 1.4 | 3.7 | 0.20 | |||||||
| 2311.19-2311.25 | Sandstone | 96.9 | 3.1 | ||||||||||
| 2314.05-2314.17 | Sandstone | 97.5 | 2.5 | ||||||||||
| 2319.26-2319.37 | Sandstone | 97.8 | 2.2 | ||||||||||
| 2322.61-2322.73 | Sandstone | 93.7 | 0.70 | 1.7 | 2.5 | 0.80 | 0.20 | 0.20 | 0.20 | ||||
| 2323.76-2323.95 | Sandstone | 95.9 | 4.1 | ||||||||||
| 2325.88-2326.00 | Sandstone and Grainstone | 91.8 | 8.2 | ||||||||||
| 2328.54-2328.59 | Siltstone and Sandstone | 37.1 | 26.2 | 34.6 | 1.1 | 1.0 | |||||||
| 2330.41-2330.55 | Sandstone | 92.6 | 1.5 | 2.1 | 2.1 | 0.80 | 0.20 | 0.30 | 0.30 | ||||
| 2333.23-2333.30 | Sandstone | 98.9 | 1.1 | ||||||||||
| 2338.75-2338.85 | Sandstone and Grainstone | 89.2 | 5.7 | 3.4 | 1.0 | 0.40 | 0.40 | ||||||
| West Wandoan 1 | 1165.57-1165.65 | Sandstone | 86.3 | 1.9 | 9.7 | 1.7 | 0.50 | ||||||
| 1174.24-1174.33 | Sandstone | 91.1 | 1.8 | 4.4 | 2.1 | 0.40 | 0.30 | ||||||
| 1197.76-1197.84 | Sandstone | 86.9 | 2.5 | 7.5 | 2.6 | 0.40 | |||||||
| 1207.61-1207.68 | Siltstone and Sandstone | 59.4 | 26.0 | 12.3 | 1.4 | 0.90 | |||||||
| 1225.70-1225.80 | Sandstone | 94.9 | 3.0 | 2.0 | 0.10 | ||||||||
| 1229.43-1229.50 | Sandstone | 94.6 | 4.1 | 0.60 | 0.50 | 0.10 | 0.10 | ||||||
| Woleebee Creek GWB 4 | 1552.63-1553.00 | Sandstone | 94.6 | 1.4 | 2.0 | 2.1 | |||||||
| 1570.46-1570.52 | Sandstone and Grainstone | 88.5 | 5.2 | 4.8 | 1.6 | ||||||||
| Medians | All | 82.0 | 1.2 | 7.7 | 6.8 | 0.8 | 1.1 | 0.1 | 0.08 | 0.06 | 0.08 | 0.006 | |
| Sandstone (including Grainstone) | 88.1 | 1.1 | 4.5 | 3.7 | 1.0 | 1.3 | 0.1 | 0.02 | 0.06 | 0.07 | 0.007 | ||
| Interbedded Siltstone/Sandstone | 51.3 | 1.9 | 23.3 | 22.0 | 0.3 | 0.4 | 0.2 | 0.4 | 0.09 | 0.2 | |||
* Illite may also have been present but was masked by muscovite XRD peaks.
Table A3.
Semi-Quantitative QEMSCAN and MLA Mineral Content (%) of Sampled Rock Core Intervals.
| Tectosilicates | Phyllosilicates | Carbonate | Heavy Minerals | Other | |||||||||||||||
| Well | Depth (mRT) | Lithology | SEM Technique* | Quartz | K-Feldspar | Plagioclase | Kaolinite | Micas/Illite | Smectite | I/S | Chlorite | Siderite | Garnet | Ilmenite | Monazite | Pyrite | TiO2 | Zircon | |
| Chinchilla 4 | 1215.47-1215.59 | Sandstone | QEMSCAN | 81.7 | 0.05 | 0.08 | 2.1 | 0.4 | 0.8 | 0.1 | 0.2 | 14.0 | 0.2 | 0.3 | 0.02 | 0.07 | 0.01 | 0.01 | |
| 1218.02-1218.10 | Sandstone and Siltstone | QEMSCAN | 52.8 | 0.7 | 0.9 | 24.1 | 8.7 | 6.6 | 2.9 | 0.7 | 1.3 | 0.01 | 0.5 | 0.01 | 0.7 | 0.08 | 0.02 | ||
| Tipton 153 | 1032.35-1032.48 | Sandstone | QEMSCAN | 91.9 | 0.2 | 0.3 | 4.7 | 1.1 | 1.1 | 0.5 | 0.03 | 0.01 | 0.2 | 0.03 | 0.02 | ||||
| 1033.88-1034.00 | Sandstone | QEMSCAN | 65.7 | 0.7 | 0.8 | 20.0 | 3.4 | 4.6 | 2.2 | 0.04 | 0.7 | 0.05 | 0.05 | 1.4 | 0.5 | 0.04 | 0.04 | ||
| 1066.00-1066.24 | Siltstone and Sandstone | QEMSCAN | 28.4 | 1.0 | 1.3 | 36.9 | 9.5 | 10.1 | 9.5 | 0.01 | 2.7 | 0.01 | 0.5 | 0.05 | |||||
| 1067.92-1068.00 | Sandstone | QEMSCAN | 76.4 | 0.3 | 0.3 | 12.7 | 1.7 | 2.2 | 0.8 | 0.3 | 3.9 | 0.3 | 0.8 | 0.4 | 0.06 | 0.04 | |||
| 1093.00-1093.19 | Sandstone | QEMSCAN | 93.9 | 0.1 | 0.2 | 3.8 | 0.6 | 0.8 | 0.5 | 0.01 | 0.06 | 0.01 | 0.01 | ||||||
| West Moonie 1 | 2263.61-2263.77 | Sandstone and Grainstone | MLA | 80.7 | 6.7 | 0.3 | 6.2 | 2.7 | 3.3 | 0.03 | 0.05 | 0.001 | 0.0004 | 0.005 | 0.07 | 0.01 | 0.01 | ||
| 2274.10-2274.18 | Sandstone | MLA | 87.6 | 2.8 | 0.1 | 4.4 | 2.1 | 2.6 | 0.02 | 0.2 | 0.002 | 0.001 | 0.2 | 0.02 | 0.005 | 0.02 | |||
| 2284.13-2284.24 | Sandstone and Grainstone | MLA | 88.6 | 0.02 | 0.2 | 6.1 | 1.1 | 3.9 | 0.001 | 0.0004 | 0.0003 | 0.004 | 0.004 | 0.007 | 0.0009 | ||||
| 2288.49-2288.61 | Sandstone | MLA | 84.8 | 0.02 | 0.2 | 8.7 | 3.0 | 3.1 | 0.008 | 0.0001 | 0.0003 | 0.0002 | 0.008 | 0.1 | 0.01 | 0.002 | |||
| 2322.61-2322.73 | Sandstone | MLA | 95.9 | 0.008 | 0.2 | 1.6 | 0.9 | 1.1 | 0.01 | 0.02 | 0.0005 | 0.0005 | 0.002 | 0.1 | 0.02 | 0.01 | |||
| 2328.54-2328.59 | Siltstone and Sandstone | MLA | 18.7 | 0.006 | 0.7 | 44.8 | 26.2 | 9.0 | 0.02 | 0.002 | 0.01 | 0.00007 | 0.4 | 0.09 | 0.0008 | ||||
| 2330.41-2330.55 | Sandstone | MLA | 94.6 | 0.01 | 0.2 | 2.8 | 0.9 | 1.2 | 0.002 | 0.0002 | 0.0006 | 0.0003 | 0.0004 | 0.08 | 0.006 | 0.09 | |||
| West Wandoan 1 | 1165.57-1165.65 | Sandstone | QEMSCAN | 94.8 | 0.1 | 0.1 | 3.4 | 0.7 | 0.7 | 0.2 | 0.09 | 0.02 | 0.01 | ||||||
| 1174.24-1174.33 | Sandstone | QEMSCAN | 91.5 | 0.3 | 0.2 | 4.8 | 1.1 | 1.1 | 0.4 | 0.01 | 0.6 | 0.06 | 0.01 | ||||||
| 1197.76-1197.84 | Sandstone | QEMSCAN | 97.7 | 0.07 | 0.05 | 1.8 | 0.2 | 0.2 | 0.04 | 0.05 | 0.01 | 0.02 | |||||||
| 1207.61-1207.68 | Siltstone and Sandstone | MLA | 33.6 | 0.3 | 3.8 | 44.7 | 15.4 | 0.1 | 0.7 | 0.1 | 1.3 | ||||||||
| 1225.70-1225.80 | Sandstone | QEMSCAN | 97.0 | 0.05 | 0.06 | 2.1 | 0.3 | 0.4 | 0.1 | 0.03 | 0.05 | 0.01 | |||||||
| 1229.43-1229.50 | Sandstone | QEMSCAN | 98.0 | 0.06 | 0.06 | 1.2 | 0.2 | 0.2 | 0.06 | 0.02 | 0.2 | 0.03 | |||||||
| Woleebee Creek GWB 4 | 1552.63-1553.00 | Sandstone | QEMSCAN | 98.6 | 0.04 | 0.06 | 0.8 | 0.1 | 0.2 | 0.06 | 0.03 | 0.01 | 0.02 | ||||||
| 1570.46-1570.52 | Sandstone and Grainstone | QEMSCAN | 91.0 | 0.06 | 0.08 | 7.5 | 0.3 | 0.6 | 0.3 | 0.03 | 0.07 | 0.01 | 0.03 | ||||||
| Medians | All | n=22 | 79.3 | 79.3 | 0.6 | 0.5 | 11.1 | 3.7 | 2.4 | 0.8 | 0.06 | 0.9 | 0.01 | 0.05 | 0.2 | 0.01 | 0.2 | 0.03 | |
| Sandstone (including Grainstone) | n=18 | 89.5 | 89.5 | 0.6 | 0.2 | 5.2 | 1.2 | 1.6 | 0.3 | 0.03 | 1.0 | 0.02 | 0.03 | 0.1 | 0.02 | 0.1 | 0.02 | ||
| Interbedded Siltstone/Sandstone | n=4 | 33.4 | 33.4 | 0.5 | 1.7 | 37.6 | 15.0 | 6.4 | 3.1 | 0.2 | 0.3 | 0.005 | 0.1 | 0.7 | 0.005 | 0.6 | 0.08 | ||
*MLA is like QEMSCAN in principle. Sample analyses were done at different times and for different research projects that utilized whichever was available.
Appendix B
Appendix B.1 Element Concentration Data
Table B1.
Assayed Element Concentrations of Sampled Rock Core Intervals (mg element per kg rock).
| Well | Depth (mRT) | Al | As | Ba | Be | Bi | Ca | Co | Cr | Cs | Cu | Fe | Ga | Ge | Hf | K | Li | Mg | Mn | Mo | Na | Ni | P | Pb | Rb | REE | S | Sb | Sc | Si | Sn | Sr | Th | Ti | Tl | U | V | Y | Zn | Zr | H2O | LOI |
| Chinchilla 4 | 1215.47-1215.59 | 5,785 | 4.4 | 33 | <DL | 0.01 | 743 | 15 | 8.2 | 0.24 | 13 | 41,020 | 1.7 | 0.43 | 0.98 | <DL | 2.3 | 225 | 1,634 | 0.82 | 355 | <DL | 25 | 4.2 | 2.5 | 26 | 645 | 0.25 | 1.1 | 423,339 | 2.5 | 13 | 2.2 | 822 | 0.07 | 0.59 | 8.6 | 3.4 | 24 | 32 | 3,135 | 18,326 |
| 1218.02-1218.10 | 89,778 | 15 | 239 | 1.6 | 0.36 | 383 | 15 | 74 | 9.9 | 22 | 14,208 | 26 | 2.2 | 6.6 | 12,036 | 42 | 1,384 | 272 | 1.7 | 690 | 28 | 151 | 25 | 73 | 229 | 806 | 0.75 | 14 | 328,350 | 4.6 | 84 | 20 | 6,235 | 0.48 | 4.4 | 98 | 29 | 130 | 226 | 4,611 | 71,455 | |
| Tipton 153 | 1032.35-1032.48 | 9,319 | 2.6 | 28 | 0.05 | 0.02 | 295 | 1.8 | 3.9 | 0.23 | 19 | 628 | 2.0 | 0.17 | 0.70 | <DL | 3.8 | 93 | 6.8 | 0.15 | 165 | 9.3 | 80 | 4.9 | 3.2 | 20 | 50 | 0.17 | 0.76 | 451,433 | 4.0 | 14 | 1.9 | 574 | 0.06 | 0.46 | 5.3 | 2.5 | 5.0 | 23 | 1,248 | 7,485 |
| 1033.88-1034.00 | 58,865 | 7.0 | 122 | 0.58 | 0.20 | 266 | 6.5 | 40 | 4.3 | 9.5 | 8,289 | 15 | 1.1 | 4.9 | 7,588 | 16 | 843 | 63 | 0.51 | 658 | 16 | 91 | 15 | 39 | 125 | 305 | 0.41 | 6.9 | 379,421 | 2.9 | 49 | 11 | 4,008 | 0.28 | 2.5 | 49 | 16 | 68 | 157 | 3,908 | 46,151 | |
| 1066.00-1066.24 | 134,380 | 4.9 | 306 | 2.6 | 0.72 | 718 | 11 | 93 | 19 | 41 | 6,631 | 39 | 2.7 | 7.4 | 17,652 | 86 | 1,906 | 24 | 0.77 | 920 | 38 | 163 | 48 | 124 | 309 | 429 | 0.87 | 21 | 282,306 | 6.4 | 72 | 29 | 7,118 | 0.81 | 7.3 | 145 | 33 | 108 | 245 | 7,826 | 86,047 | |
| 1067.92-1068.00 | 29,765 | 1.3 | 71 | 0.26 | 0.09 | 323 | 2.5 | 16 | 1.5 | 6.7 | 42,326 | 9.1 | 0.77 | 2.6 | 3,160 | 18 | 1,171 | 909 | 0.15 | 366 | 25 | 47 | 9.9 | 17 | 71 | <DL | 0.12 | 9.0 | 388,006 | 1.6 | 21 | 6.8 | 1,940 | 0.10 | 1.4 | 40 | 8.9 | 30 | 91 | 1,329 | 41,965 | |
| 1093.00-1093.19 | 8,490 | 0.39 | 29 | <DL | 0.01 | 206 | 0.73 | 3.1 | 0.19 | 16 | 472 | 1.9 | 0.22 | 0.78 | <DL | 2.2 | 102 | 7.3 | 0.20 | <DL | <DL | 54 | 3.2 | 2.5 | 25 | <DL | 0.12 | 0.67 | 454,053 | 2.8 | 11 | 1.8 | 382 | 0.01 | 0.40 | 5.7 | 2.8 | 6.1 | 24 | 1,775 | 9,425 | |
| West Moonie 1 | 2263.61-2263.77 | 24,639 | 3.1 | 175 | 0.32 | 0.04 | <DL | 4.7 | 10 | 1.4 | 7.9 | 1,264 | 4.8 | 0.38 | 1.9 | 15,204 | 6.6 | 214 | 13 | 0.22 | 529 | 6.1 | 132 | 9.1 | 49 | 26 | 192 | 0.38 | 2.0 | 432,686 | 2.6 | 22 | 2.4 | 846 | 0.29 | 0.73 | 10 | 6.7 | 15 | 60 | 1,882 | 10,824 |
| 2267.05-2267.23 | 33,269 | 4.6 | 214 | 0.56 | 0.12 | 344 | 5.7 | 12 | 2.1 | 7.5 | 20,424 | 6.3 | 0.74 | 1.6 | 21,778 | 8.2 | 912 | 652 | <DL | 332 | 9.0 | <DL | 15 | 64 | 51 | 217 | 0.58 | 3.5 | 397,813 | 3.3 | 35 | 3.9 | 1,299 | 0.45 | 1.0 | 18 | 7.7 | 45 | 48 | 2,036 | 24,781 | |
| 2267.71-2267.84 | 108,726 | 5.0 | 390 | 6.5 | 1.0 | 394 | 40 | 56 | 16 | 20 | 5,360 | 30 | 2.6 | 6.0 | 19,036 | 84 | 1,467 | 26 | 3.4 | 1,113 | 81 | 184 | 34 | 117 | 199 | 510 | 0.73 | 16 | 300,851 | 7.2 | 63 | 19 | 5,968 | 0.70 | 4.7 | 112 | 34 | 108 | 203 | 13,029 | 93,145 | |
| 2274.10-2274.18 | 20,660 | 4.1 | 174 | 0.45 | 0.12 | <DL | 4.6 | 11 | 1.6 | 9.1 | 3,207 | 4.4 | 0.49 | 1.0 | 11,785 | 7.4 | 180 | 81 | 0.50 | 397 | 7.8 | 123 | 10 | 54 | 27 | 1,257 | 0.45 | 1.3 | 430,308 | 2.3 | 28 | 2.4 | 503 | 0.38 | 0.63 | 12 | 5.9 | 20 | 29 | <DL | 12,097 | |
| 2281.82-2281.92 | 55,756 | 3.8 | 245 | 1.8 | 0.21 | 84 | 13 | 52 | 4.5 | 15 | 2,479 | 15 | 1.5 | 4.9 | 15,560 | 20 | 680 | 10 | 0.81 | 686 | 21 | 232 | 15 | 75 | 143 | 336 | 0.61 | 8.3 | 384,448 | 3.6 | 53 | 9.2 | 3,683 | 0.49 | 2.6 | 64 | 34 | 54 | 170 | 2,713 | 33,721 | |
| 2284.13-2284.24 | 24,003 | 2.9 | 46 | 0.38 | 0.12 | <DL | 6.9 | 10 | 0.66 | 18 | 665 | 4.9 | 0.32 | 0.92 | 2,158 | 8.4 | 162 | 5.3 | 0.59 | 191 | 11 | 127 | 7.8 | 10 | 30 | 89 | 0.45 | 1.6 | 450,279 | 3.5 | 23 | 1.9 | 923 | 0.10 | 0.54 | 14 | 6.1 | 21 | 25 | 1,783 | 16,488 | |
| 2288.49-2288.61 | 19,603 | 0.88 | 38 | 0.36 | 0.07 | <DL | 1.9 | 12 | 0.75 | 7.2 | 556 | 5.2 | 0.31 | 1.0 | 1,995 | 7.5 | 209 | 5.2 | 0.13 | <DL | 6.9 | 111 | 7.7 | 11 | 32 | 81 | 0.22 | 1.8 | 404,376 | 2.0 | 14 | 3.0 | 736 | 0.07 | 0.81 | 12 | 4.5 | 9.5 | 33 | 1,422 | 16,121 | |
| 2294.83-2294.98 | 6,500 | 0.93 | 47 | 0.19 | 0.06 | <DL | 1.3 | 5.8 | 0.34 | 6.2 | <DL | 2.6 | 0.57 | 1.6 | 2,404 | 2.9 | 93 | 4.9 | <DL | <DL | 3.7 | <DL | 5.4 | 4.4 | 74 | 119 | 0.16 | 1.2 | 468,513 | 2.4 | 21 | 7.9 | 1,800 | 0.05 | 0.85 | 7.5 | 6.4 | 13 | 54 | 2,640 | 6,404 | |
| 2297.19-2297.37 | 146,610 | 14 | 369 | 8.9 | 0.73 | 281 | 38 | 113 | 27 | 44 | 7,342 | 38 | 2.4 | 6.7 | 23,696 | 109 | 2,110 | 23 | 2.8 | 924 | 78 | 495 | 47 | 138 | 337 | 1,020 | 2.4 | 22 | 267,978 | 6.8 | 121 | 29 | 7,971 | 0.93 | 6.9 | 152 | 28 | 318 | 235 | 7,911 | 124,443 | |
| 2298.73-2298.82 | 12,244 | 0.97 | 50 | 0.34 | 0.07 | <DL | 2.6 | 7.9 | 0.49 | 5.1 | <DL | 2.6 | 0.25 | 1.6 | 2,542 | 4.0 | 115 | 3.9 | <DL | <DL | 3.2 | <DL | 6.1 | 6.5 | 29 | 111 | 0.17 | 1.3 | 445,707 | 1.8 | 14 | 2.8 | 1,574 | 0.07 | 0.76 | 8.8 | 3.5 | 17 | 55 | 1,966 | 8,755 | |
| 2303.99-2304.14 | 5,709 | 0.59 | 36 | 0.16 | 0.05 | <DL | 1.2 | 2.9 | 0.31 | 12 | 3,061 | 1.9 | 0.33 | 0.98 | <DL | 3.0 | 177 | 179 | <DL | <DL | 4.4 | <DL | 3.8 | 3.1 | 38 | 60 | 0.10 | 1.1 | 452,839 | 3.3 | 10 | 3.4 | 322 | 0.03 | 0.45 | 4.6 | 2.4 | 8.7 | 30 | 1,196 | 8,425 | |
| 2311.19-2311.25 | 5,455 | 0.77 | 48 | 0.23 | <DL | <DL | 1.2 | 2.6 | 0.31 | 6.5 | 1,229 | 1.7 | 0.32 | 1.2 | <DL | 2.9 | 77 | 61 | <DL | <DL | 2.2 | <DL | 4.3 | 2.8 | 37 | <DL | 0.10 | 0.87 | 441,524 | 1.8 | 12 | 4.5 | 392 | <DL | 0.57 | 3.8 | 2.5 | 10 | 39 | 1,269 | 7,175 | |
| 2314.05-2314.17 | 1,878 | 1.2 | 41 | 0.17 | <DL | 251 | 6.9 | 1.8 | 0.26 | 21 | <DL | 0.93 | 0.14 | 0.63 | <DL | 2.2 | 44 | 7.5 | <DL | <DL | 4.8 | <DL | 3.6 | 1.8 | 18 | 135 | 0.12 | 0.34 | 456,999 | 4.9 | 8.9 | 1.1 | 170 | <DL | 0.35 | 2.2 | 1.6 | 11 | 19 | 1,228 | 4,404 | |
| 2319.26-2319.37 | 2,526 | 0.34 | 40 | 0.15 | <DL | <DL | 1.2 | 1.9 | 0.30 | 13 | <DL | 1.1 | 0.20 | 0.84 | <DL | 2.7 | 61 | 9.5 | <DL | <DL | 3.9 | <DL | 3.7 | 2.3 | 25 | <DL | <DL | 0.45 | 486,254 | 1.2 | 9.1 | 2.0 | 156 | 0.06 | 0.36 | 2.0 | 2.0 | 11 | 20 | 940 | 4,072 | |
| 2322.61-2322.73 | 6,283 | 0.47 | 57 | 0.11 | 0.06 | <DL | 0.76 | 8.2 | 0.46 | 14 | 613 | 2.0 | 0.23 | 1.9 | 1,288 | 2.7 | 102 | 10 | <DL | 165 | 2.3 | <DL | 3.9 | 4.4 | 28 | <DL | 0.12 | 1.2 | 438,658 | 3.0 | 13 | 2.6 | 789 | 0.03 | 0.68 | 6.0 | 3.9 | 6.5 | 63 | 1,493 | 5,473 | |
| 2323.76-2323.95 | 13,302 | 0.49 | 62 | 0.23 | 0.07 | <DL | 0.87 | 7.4 | 0.38 | 4.2 | 1,008 | 2.5 | 0.31 | 1.4 | 3,436 | 3.6 | 112 | 15 | <DL | <DL | 2.8 | <DL | 5.4 | 5.0 | 35 | 86 | 0.15 | 1.3 | 475,340 | 1.7 | 16 | 3.4 | 2,182 | 0.06 | 0.74 | 8.4 | 2.7 | 13 | 40 | 2,049 | 8,803 | |
| 2325.88-2326.00 | 13,843 | 0.99 | 72 | 0.30 | 0.30 | <DL | 1.3 | 15 | 0.52 | 5.0 | <DL | 5.2 | 1.1 | 6.8 | 1,753 | 4.9 | 124 | 19 | 0.99 | <DL | 2.8 | <DL | 42 | 6.1 | 153 | 66 | 0.21 | 3.2 | 469,270 | 4.2 | 21 | 19 | 3,080 | 0.05 | 2.3 | 15 | 10 | 20 | 243 | 983 | 10,172 | |
| 2328.54-2328.59 | 139,044 | 4.0 | 390 | 6.0 | 0.58 | 298 | 22 | 96 | 23 | 43 | 7,017 | 41 | 2.9 | 11 | 18,034 | 84 | 1,946 | 20 | 0.77 | 1,073 | 43 | 430 | 32 | 135 | 290 | 374 | 0.80 | 19 | 277,078 | 7.5 | 130 | 35 | 8,528 | 0.74 | 7.1 | 112 | 35 | 29 | 382 | 5,501 | 87,459 | |
| 2330.41-2330.55 | 7,717 | 0.41 | 66 | 0.17 | 0.06 | 180 | 0.98 | 4.3 | 0.38 | 19 | 403 | 1.8 | 0.20 | 0.97 | <DL | 3.2 | 51 | 2.8 | <DL | 234 | 1.8 | 84 | 5.1 | 3.9 | 21 | 48 | 0.13 | 0.95 | 435,519 | 3.9 | 9.9 | 2.0 | 626 | 0.03 | 0.53 | 6.1 | 2.7 | 6.5 | 31 | 900 | 6,751 | |
| 2333.23-2333.30 | 3,453 | 0.41 | 57 | 0.17 | <DL | <DL | 0.68 | 5.9 | 0.31 | 5.3 | <DL | 0.78 | 0.14 | 0.42 | <DL | 3.1 | 56 | 2.1 | <DL | <DL | 1.3 | <DL | 2.0 | 2.0 | 14 | <DL | 0.11 | 0.42 | 482,148 | 1.8 | 8.2 | 1.2 | 612 | <DL | 0.36 | 2.8 | 1.2 | 11 | 13 | 1,913 | 5,597 | |
| 2338.75-2338.85 | 14,094 | 0.70 | 52 | 0.32 | 0.08 | <DL | 1.5 | 9.7 | 0.52 | 11 | 527 | 3.7 | 0.49 | 1.0 | 1,521 | 5.1 | 147 | 3.2 | 0.10 | 192 | 3.1 | 37 | 5.4 | 6.6 | 42 | 31 | 0.19 | 1.5 | 439,557 | 2.2 | 17 | 2.8 | 1,113 | 0.07 | 0.56 | 12 | 3.9 | 8.6 | 33 | <DL | 8,929 | |
| West Wandoan 1 | 1165.57-1165.65 | 9,274 | <DL | 35 | <DL | <DL | 205 | 3.7 | 3.8 | 0.23 | 21 | 368 | 2.5 | 0.18 | 1.5 | 3,319 | <DL | <DL | 5.4 | 0.27 | 717 | 4.4 | <DL | 7.3 | 4.4 | 27 | 1,877 | 0.20 | 1.0 | 431,683 | 4.0 | 12 | 2.1 | 607 | 0.05 | 0.54 | 5.7 | 3.5 | 14 | 48 | 2,334 | 12,723 |
| 1174.24-1174.33 | 12,717 | <DL | 40 | <DL | <DL | 69 | 2.9 | 12 | 0.32 | 13 | 532 | 3.9 | 0.54 | 3.5 | 4,583 | <DL | 150 | 3.3 | 0.42 | 1,102 | 6.6 | <DL | 8.7 | 7.3 | 65 | 2,095 | 0.24 | 2.3 | 421,080 | 3.3 | 19 | 7.0 | 2,521 | 0.06 | 1.2 | 14 | 7.2 | 27 | 128 | 2,454 | 13,937 | |
| 1197.76-1197.84 | 7,715 | <DL | 51 | <DL | <DL | 98 | 5.3 | 3.8 | 0.15 | 24 | 415 | 1.9 | 0.17 | 0.85 | 6,243 | <DL | 213 | 11 | 0.54 | 936 | 7.8 | <DL | 6.1 | 2.5 | 25 | 3,104 | 0.21 | 0.64 | 424,087 | 5.1 | 11 | 2.4 | 371 | 0.05 | 0.51 | 5.3 | 2.4 | 15 | 28 | 1,577 | 13,961 | |
| 1207.61-1207.68 | 131,104 | 13 | 332 | 1.8 | 0.40 | 567 | 42 | 111 | 15 | 36 | 6,519 | 36 | 3.2 | 7.4 | 13,992 | 71 | 1,900 | 27 | 3.1 | 963 | 87 | 846 | 41 | 100 | 361 | 970 | 1.3 | 19 | 270,009 | 6.6 | 131 | 29 | 7,810 | 0.74 | 6.1 | 153 | 31 | 211 | 257 | 8,425 | 120,904 | |
| 1225.70-1225.80 | 5,570 | <DL | 23 | <DL | <DL | 104 | 2.1 | 4.0 | 0.11 | 16 | 419 | 1.4 | 0.19 | 0.84 | 1,975 | <DL | <DL | 8.9 | 0.39 | 636 | 5.4 | <DL | 4.1 | 1.9 | 25 | 769 | 1.3 | 0.74 | 442,271 | 3.0 | 11 | 2.1 | 732 | 0.05 | 0.49 | 4.7 | 4.2 | 15 | 31 | 677 | 7,418 | |
| 1229.43-1229.50 | 4,963 | <DL | 19 | <DL | <DL | 1,074 | 1.9 | 2.1 | 0.14 | 22 | 661 | 1.3 | 0.17 | 0.61 | 2,930 | <DL | <DL | 5.0 | 0.22 | 773 | 3.4 | <DL | 3.4 | 1.4 | 25 | 1,480 | 0.17 | 0.42 | 455,836 | 3.4 | 9.2 | 1.9 | 353 | 0.05 | 1.1 | 3.4 | 2.0 | 8.7 | 20 | 241 | 7,814 | |
| Woleebee Creek GWB 4 | 1552.63-1553.00 | 2,752 | 0.15 | 33 | <DL | 0.02 | 140 | 2.5 | 2.4 | 0.14 | 21 | 244 | 1.1 | 0.09 | 0.74 | <DL | 2.3 | 25 | 3.2 | <DL | 296 | <DL | 31 | 2.7 | 1.3 | 15 | 251 | 0.18 | 0.47 | 462,756 | 3.4 | 7.0 | 1.3 | 218 | 0.01 | 0.38 | 3.6 | 2.1 | 5.2 | 24 | 350 | 2,842 |
| 1570.46-1570.52 | 15,602 | 2.0 | 33 | <DL | 0.09 | 144 | 3.9 | 9.2 | 0.27 | 9.3 | 548 | 4.0 | 0.41 | 1.2 | <DL | 5.2 | 71 | 4.7 | 0.21 | 301 | <DL | 58 | 7.5 | 3.1 | 49 | 434 | 0.20 | 1.7 | 444,834 | 2.6 | 18 | 4.1 | 627 | 0.05 | 0.63 | 17 | 4.1 | 24 | 35 | 231 | 11,332 | |
| Medians | All | 13,009 | 1.3 | 52 | 0.3 | 0.09 | 273 | 2.7 | 8.7 | 0.4 | 13 | 1,118 | 3.2 | 0.4 | 1.3 | 4,583 | 5.1 | 162 | 10 | 0.5 | 636 | 6.3 | 117 | 6.7 | 5.5 | 33 | 320 | 0.2 | 1.3 | 437,088 | 3.3 | 16 | 2.9 | 834 | 0.07 | 0.7 | 10 | 4.1 | 15 | 40 | 1,832 | 11,078 |
| Sandstones | 9,296 | 1.0 | 48 | 0.3 | 0.07 | 205 | 2.3 | 7.6 | 0.3 | 12 | 644 | 2.5 | 0.3 | 1.0 | 3,160 | 3.8 | 124 | 8.2 | 0.3 | 366 | 4.6 | 82 | 5.4 | 4.4 | 28 | 205 | 0.2 | 1.2 | 441,897 | 3.0 | 14 | 2.5 | 734 | 0.06 | 0.6 | 7.9 | 3.7 | 14 | 33 | 1,535 | 9,177 | |
| Interbedded | 132,742 | 9.2 | 350 | 4.3 | 0.6 | 389 | 30 | 95 | 18 | 38 | 6,824 | 37 | 2.7 | 7.0 | 17,843 | 84 | 1,903 | 25 | 2.3 | 943 | 60 | 307 | 38 | 120 | 300 | 658 | 0.8 | 19 | 279,692 | 6.7 | 102 | 29 | 7,464 | 0.7 | 6.5 | 129 | 32 | 119 | 240 | 7,868 | 90,302 |
Table B2.
Step 1 pH 7 Extracted Element Concentrations (mg element per kg rock).
| Well | Depth (mRT) | Al | As | Ba | Be | Bi | Ca | Co | Cr | Cs | Cu | Fe | Ga | Ge | Hf | K | Li | Mg | Mn | Mo | Na | Ni | P | Pb | Rb | REE | S | Sb | Sc | Si | Sn | Sr | Th | Ti | Tl | U | V | Y | Zn | Zr |
| Chinchilla 4 | 1215.47-1215.59 | <DL | 0.003 | 2 | <DL | 74 | 0.07 | <DL | 0.03 | <DL | <DL | <DL | <DL | <DL | 0.2 | 39 | 5 | <DL | <DL | <DL | 0.001 | 0.3 | <DL | 137 | <DL | <DL | <DL | <DL | 2 | <DL | <DL | 0.02 | <DL | <DL | <DL | 0.05 | <DL | |||
| 1218.02-1218.10 | <DL | 0.006 | 6 | 0.0004 | <DL | 136 | 0.05 | <DL | 0.2 | <DL | <DL | <DL | <DL | <DL | <DL | 0.2 | 70 | 3 | <DL | <DL | 0.1 | <DL | 0.002 | 0.7 | 0.001 | 219 | <DL | <DL | <DL | 0.006 | 5 | <DL | <DL | 0.03 | <DL | <DL | <DL | 0.3 | <DL | |
| Tipton 153 | 1032.35-1032.48 | <DL | 0.004 | 0.8 | <DL | <DL | 45 | 0.006 | <DL | 0.02 | <DL | <DL | 0.002 | <DL | <DL | <DL | 7 | <DL | 0.004 | <DL | <DL | <DL | 0.004 | 0.2 | 0.002 | <DL | 0.009 | <DL | <DL | <DL | 2 | <DL | <DL | 0.007 | <DL | 0.006 | <DL | <DL | <DL | |
| 1033.88-1034.00 | <DL | 0.02 | 2 | <DL | <DL | 46 | 0.06 | <DL | 0.2 | <DL | <DL | <DL | <DL | <DL | 275 | 0.2 | 27 | <DL | 0.003 | 659 | 0.1 | <DL | 0.002 | 1 | <DL | 27 | 0.003 | <DL | <DL | <DL | 3 | <DL | <DL | 0.02 | <DL | 0.003 | <DL | 0.3 | <DL | |
| 1066.00-1066.24 | <DL | 0.01 | 4 | <DL | <DL | 167 | 0.3 | <DL | 0.3 | <DL | <DL | <DL | <DL | <DL | 198 | 0.4 | 29 | <DL | 0.04 | 332 | 0.3 | <DL | 0.01 | 2 | 0.0007 | 47 | 0.01 | <DL | <DL | <DL | 7 | <DL | <DL | 0.03 | <DL | 0.02 | <DL | 0.4 | <DL | |
| 1067.92-1068.00 | <DL | <DL | 0.8 | <DL | <DL | 27 | 0.001 | <DL | 0.04 | <DL | <DL | <DL | <DL | <DL | <DL | <DL | 33 | <DL | <DL | <DL | 0.08 | <DL | <DL | 0.2 | <DL | <DL | <DL | <DL | <DL | 0.8 | <DL | <DL | 0.003 | <DL | <DL | <DL | <DL | <DL | ||
| 1093.00-1093.19 | <DL | 0.008 | 5 | <DL | 53 | 0.002 | <DL | 0.01 | <DL | <DL | <DL | <DL | <DL | <DL | 11 | <DL | 0.002 | <DL | 0.001 | 0.2 | 0.0009 | 0.001 | <DL | <DL | <DL | 2 | <DL | <DL | 0.003 | <DL | 0.006 | <DL | 0.02 | <DL | ||||||
| West Moonie 1 | 2263.61-2263.77 | <DL | 0.01 | 2 | <DL | <DL | 1 | <DL | 0.02 | 0.8 | <DL | 0.0005 | 0.0004 | <DL | 193 | 0.03 | 4 | 1 | 0.005 | 63 | 2 | <DL | 0.06 | 0.2 | 0.001 | 44 | 0.005 | 0.0008 | <DL | <DL | 0.7 | <DL | <DL | 0.02 | <DL | 0.0003 | 0.0001 | 3 | <DL | |
| 2267.05-2267.23 | <DL | <DL | 2 | <DL | <DL | 19 | 0.5 | <DL | 0.03 | 0.2 | <DL | <DL | <DL | <DL | 285 | <DL | 8 | <DL | <DL | 0.7 | <DL | 0.2 | <DL | 31 | 0.008 | <DL | <DL | <DL | 0.7 | <DL | <DL | 0.02 | <DL | <DL | 0.0004 | 2 | 0.004 | |||
| 2267.71-2267.84 | <DL | 0.02 | 11 | <DL | <DL | 120 | 2 | <DL | 0.3 | <DL | <DL | <DL | 0.004 | 0.001 | 345 | 0.6 | 19 | <DL | 0.4 | 679 | 4 | <DL | <DL | 2 | 0.003 | <DL | 0.02 | <DL | <DL | <DL | 12 | 0.0002 | <DL | 0.02 | <DL | 0.01 | 0.0001 | <DL | 0.0004 | |
| 2274.10-2274.18 | <DL | 0.01 | 2 | 0.002 | <DL | 1 | <DL | 0.02 | 0.8 | <DL | 0.0004 | 0.0005 | <DL | 152 | 0.03 | 4 | 3 | 0.002 | <DL | 2 | <DL | 0.02 | 0.1 | 0.0008 | 42 | 0.01 | 0.0008 | <DL | <DL | 0.5 | <DL | <DL | 0.01 | <DL | <DL | <DL | 3 | <DL | ||
| 2281.82-2281.92 | <DL | 0.02 | 7 | 0.002 | <DL | 47 | 2 | 0.0008 | 0.1 | 0.05 | <DL | 0.0005 | 0.001 | <DL | 139 | 0.1 | 7 | <DL | 0.1 | 158 | 2 | <DL | 0.01 | 0.6 | 0.002 | 46 | 0.02 | 0.002 | 15 | <DL | 4 | <DL | <DL | 0.02 | <DL | 0.004 | <DL | 3 | <DL | |
| 2284.13-2284.24 | <DL | 0.04 | 3 | 0.0008 | <DL | 0.8 | <DL | 0.02 | 0.1 | <DL | 0.0006 | 0.0006 | <DL | 169 | 0.06 | 2 | <DL | 0.04 | 61 | 0.8 | <DL | 0.1 | 0.1 | 0.001 | 10 | 0.02 | 0.001 | 8 | <DL | 0.6 | <DL | <DL | 0.01 | <DL | 0.004 | <DL | 2 | <DL | ||
| 2288.49-2288.61 | <DL | 0.01 | 2 | <DL | <DL | 0.2 | <DL | 0.02 | 0.4 | <DL | 0.0006 | 0.0004 | <DL | 167 | 0.04 | 0.9 | <DL | 0.01 | 0.6 | <DL | 0.08 | 0.1 | 0.0006 | 7 | 0.008 | 0.0008 | <DL | <DL | 0.4 | <DL | <DL | 0.003 | <DL | 0.003 | <DL | 0.6 | <DL | |||
| 2294.83-2294.98 | 20 | 0.05 | 0.9 | <DL | <DL | 0.2 | 0.05 | 0.02 | 1 | 0.01 | <DL | <DL | 821 | <DL | 5 | <DL | 0.3 | 0.09 | 0.2 | 0.1 | <DL | 0.01 | <DL | <DL | 0.03 | 1 | 0.02 | <DL | 0.0003 | 0.01 | 0.08 | 0.006 | 0.2 | 0.03 | ||||||
| 2297.19-2297.37 | <DL | 0.06 | 7 | <DL | <DL | 123 | 5 | 0.01 | 0.4 | 0.02 | <DL | 0.002 | 0.005 | <DL | 487 | 3 | 28 | <DL | 0.2 | 493 | 5 | <DL | 0.006 | 3 | 0.0005 | 145 | 0.09 | <DL | <DL | <DL | 8 | <DL | <DL | 0.06 | 0.0007 | 0.02 | 0.02 | 3 | <DL | |
| 2298.73-2298.82 | 17 | 0.04 | 0.8 | <DL | <DL | 0.2 | 0.02 | 0.02 | 0.4 | 0.007 | <DL | <DL | 411 | <DL | 3 | <DL | 0.1 | 0.07 | 0.09 | 0.05 | <DL | 0.007 | <DL | <DL | <DL | 0.5 | 0.007 | <DL | 0.0007 | 0.004 | 0.06 | 0.004 | 0.4 | 0.02 | ||||||
| 2303.99-2304.14 | 8 | <DL | 1 | 0.0002 | <DL | 0.09 | 0.006 | 0.02 | 2 | <DL | 0.001 | <DL | <DL | <DL | 4 | <DL | 0.3 | 0.02 | 0.07 | 0.02 | <DL | <DL | <DL | <DL | 0.01 | 0.7 | 0.003 | <DL | <DL | 0.0007 | 0.01 | 0.002 | 0.3 | 0.009 | ||||||
| 2311.19-2311.25 | 4 | 0.03 | 1 | <DL | 0.1 | <DL | 0.02 | 0.8 | <DL | 0.001 | <DL | <DL | <DL | 4 | <DL | 0.1 | 0.02 | 0.09 | 0.02 | <DL | <DL | <DL | <DL | 0.7 | <DL | <DL | 0.001 | 0.02 | 0.001 | 0.2 | 0.007 | |||||||||
| 2314.05-2314.17 | 3 | 0.07 | 1 | <DL | 53 | 0.4 | 0.007 | 0.01 | 4 | <DL | <DL | <DL | <DL | 4 | <DL | 0.3 | 0.03 | 0.08 | 0.01 | <DL | 0.006 | <DL | <DL | 0.01 | 0.7 | <DL | <DL | 0.0007 | 0.01 | 0.0008 | 2 | 0.01 | ||||||||
| 2319.26-2319.37 | <DL | 0.02 | 2 | <DL | 0.06 | <DL | 0.01 | 1 | 0.0003 | <DL | <DL | <DL | 3 | <DL | 0.1 | 0.005 | 0.05 | 0.005 | <DL | <DL | <DL | 0.6 | <DL | <DL | <DL | 0.0004 | 0.008 | <DL | 0.7 | <DL | ||||||||||
| 2322.61-2322.73 | <DL | 0.02 | 3 | <DL | <DL | 0.2 | 0.02 | 0.01 | 2 | <DL | 0.004 | 0.001 | <DL | 417 | 0.03 | 3 | 0.3 | 106 | 0.1 | 0.05 | 0.1 | 0.07 | 0.005 | 0.004 | 15 | 0.02 | 0.9 | 0.009 | 0.8 | 0.001 | 0.002 | 0.03 | 0.004 | 0.4 | 0.03 | |||||
| 2323.76-2323.95 | 26 | 0.03 | 1 | <DL | <DL | 0.07 | 0.04 | 0.02 | 0.4 | <DL | 0.009 | <DL | <DL | 678 | <DL | 5 | <DL | 0.2 | 0.06 | 0.1 | 0.05 | <DL | 0.006 | <DL | <DL | 0.01 | 0.8 | 0.008 | <DL | <DL | 0.003 | 0.09 | 0.005 | 0.6 | 0.05 | |||||
| 2325.88-2326.00 | 13 | 0.02 | 2 | <DL | <DL | 0.2 | 0.03 | 0.02 | 0.3 | 0.005 | <DL | <DL | 286 | <DL | 3 | <DL | 0.2 | 0.2 | 0.2 | 0.09 | 0.04 | <DL | 0.02 | <DL | <DL | 0.02 | 0.5 | 0.01 | <DL | 0.005 | 0.002 | 0.07 | 0.003 | 0.6 | 0.03 | |||||
| 2328.54-2328.59 | <DL | 0.04 | 11 | 0.001 | <DL | 99 | 0.1 | <DL | 0.3 | 0.04 | <DL | 0.001 | 0.002 | <DL | 270 | 0.4 | 22 | <DL | 0.07 | 375 | 0.4 | <DL | 0.0007 | 2 | 0.003 | 22 | 0.06 | 0.007 | 45 | <DL | 8 | <DL | <DL | 0.02 | <DL | 0.02 | 0.0001 | <DL | <DL | |
| 2330.41-2330.55 | <DL | 0.02 | 3 | <DL | <DL | 16 | 0.2 | 0.004 | 0.007 | 4 | <DL | 0.002 | 0.0005 | <DL | 0.02 | 1 | <DL | 48 | 0.1 | <DL | 0.04 | 0.06 | 0.02 | 5 | 0.004 | 0.002 | 8 | 0.007 | 0.4 | 0.002 | <DL | 0.001 | 0.0006 | 0.02 | 0.001 | 0.2 | 0.01 | |||
| 2333.23-2333.30 | 11 | 0.02 | 2 | <DL | 0.07 | 0.02 | 0.01 | 2 | 0.005 | <DL | <DL | <DL | 5 | <DL | 0.1 | 0.05 | 0.1 | 0.03 | <DL | <DL | <DL | 0.02 | 0.9 | 0.005 | <DL | 0.002 | 0.05 | 0.002 | 0.5 | 0.02 | ||||||||||
| 2338.75-2338.85 | <DL | 0.005 | 3 | 0.0008 | <DL | 0.1 | 0.0002 | 0.02 | 1 | <DL | 0.0006 | 0.001 | <DL | 207 | 0.04 | 2 | <DL | 0.02 | 79 | 0.09 | <DL | 0.009 | 0.1 | 0.001 | 8 | 0.007 | 0.001 | <DL | <DL | 0.4 | <DL | <DL | 0.004 | <DL | 0.006 | <DL | 2 | <DL | ||
| West Wandoan 1 | 1165.57-1165.65 | <DL | 1 | 12 | 0.8 | <DL | 0.02 | 0.9 | <DL | 0.002 | <DL | <DL | 2,226 | <DL | 0.05 | 581 | 0.5 | 0.02 | 0.5 | 0.02 | 1,262 | 0.008 | <DL | <DL | 0.002 | 0.6 | <DL | <DL | 0.008 | 0.0006 | 0.02 | <DL | 0.5 | <DL | ||||||
| 1174.24-1174.33 | <DL | 0.9 | 15 | 0.08 | <DL | 0.03 | 0.09 | <DL | 0.002 | <DL | <DL | 2,811 | 13 | <DL | 0.07 | 641 | 0.2 | 0.009 | 1 | 0.05 | 1,780 | 0.007 | <DL | <DL | <DL | 0.9 | <DL | <DL | 0.006 | 0.003 | 0.03 | 0.002 | 0.05 | <DL | ||||||
| 1197.76-1197.84 | <DL | 0.5 | 44 | 0.8 | <DL | 0.01 | 1 | <DL | 0.002 | <DL | <DL | 4,978 | 13 | <DL | 0.2 | 732 | 0.6 | 0.001 | 0.7 | 0.001 | 2,746 | 0.02 | <DL | <DL | <DL | 1 | <DL | <DL | 0.02 | <DL | 0.01 | <DL | 0.7 | 0.001 | ||||||
| 1207.61-1207.68 | <DL | 0.01 | 4 | <DL | <DL | 201 | 17 | <DL | 0.2 | <DL | <DL | <DL | <DL | <DL | 157 | 0.3 | 72 | 3 | 0.05 | 351 | 18 | <DL | <DL | 1 | 0.0008 | 260 | 0.01 | <DL | <DL | <DL | 7 | <DL | <DL | 0.07 | <DL | 0.01 | <DL | 17 | <DL | |
| 1225.70-1225.80 | <DL | 0.5 | 6 | 0.2 | <DL | 0.007 | 2 | <DL | 0.002 | <DL | <DL | 1,236 | <DL | 0.1 | 323 | 0.4 | 0.001 | 0.2 | <DL | 763 | 0.2 | <DL | <DL | <DL | 0.6 | <DL | <DL | 0.02 | <DL | 0.01 | <DL | 0.3 | <DL | |||||||
| 1229.43-1229.50 | 4 | 0.4 | 20 | 0.2 | 0.008 | 0.007 | 3 | <DL | 0.003 | <DL | 0.001 | 2,018 | <DL | 0.05 | 439 | 0.5 | 0.02 | 0.3 | 0.05 | 1,342 | 0.02 | <DL | <DL | 0.009 | 0.5 | 0.005 | <DL | 0.01 | 0.001 | 0.02 | 0.002 | 0.3 | 0.01 | |||||||
| Woleebee Creek GWB 4 | 1552.63-1553.00 | <DL | 0.009 | 3 | <DL | 10 | 0.2 | <DL | 0.01 | 0.2 | <DL | 0.003 | <DL | <DL | <DL | 4 | <DL | 291 | <DL | 0.002 | 0.1 | <DL | 55 | 0.01 | 0.002 | <DL | 0.003 | 0.9 | <DL | <DL | 0.003 | <DL | 0.04 | <DL | 0.2 | <DL | ||||
| 1570.46-1570.52 | <DL | 0.02 | 3 | <DL | 9 | 0.8 | <DL | 0.01 | 0.08 | <DL | 0.002 | <DL | <DL | <DL | 3 | <DL | 0.04 | <DL | <DL | 0.003 | 0.09 | <DL | 111 | 0.009 | <DL | <DL | <DL | 0.6 | <DL | <DL | 0.009 | <DL | 0.01 | <DL | 3 | <DL | ||||
| Medians | All (n=36) | <DL | 0.01 | 2 | <DL | <DL | 13 | 0.2 | <DL | 0.02 | 0.3 | <DL | 0.001 | <DL | <DL | 181 | <DL | 4 | <DL | 0.003 | 24 | 0.2 | <DL | 0.01 | 0.2 | 0.001 | 16 | 0.008 | <DL | <DL | <DL | 0.8 | <DL | <DL | 0.007 | <DL | 0.01 | <DL | 0.4 | <DL |
| Sandstones (n=30) | <DL | 0.01 | 2 | <DL | <DL | 8 | 0.2 | <DL | 0.02 | 0.6 | <DL | 0.002 | <DL | <DL | 168 | <DL | 4 | <DL | 0.002 | <DL | 0.2 | <DL | 0.02 | 0.1 | 0.002 | 8 | 0.007 | <DL | <DL | <DL | 0.7 | <DL | <DL | 0.004 | <DL | 0.01 | <DL | 0.4 | <DL | |
| Interbedded (n=6) | <DL | 0.01 | 7 | <DL | <DL | 130 | 1 | <DL | 0.3 | <DL | <DL | <DL | 0.001 | <DL | 234 | 0.4 | 29 | <DL | 0.06 | 363 | 2 | <DL | 0.001 | 2 | 0.0009 | 96 | 0.01 | <DL | <DL | <DL | 8 | <DL | <DL | 0.03 | <DL | 0.01 | 0.00005 | 0.4 | <DL |
Shading indicates element was below detection limit in given rock samples.
Table B3.
Step 2 pH 5 Extracted Element Concentrations (mg element per kg rock).
| Well | Depth (mRT) | Al | As | Ba | Be | Bi | Ca | Co | Cr | Cs | Cu | Fe | Ga | Ge | Hf | K | Li | Mg | Mn | Mo | Na | Ni | P | Pb | Rb | REE | S | Sb | Sc | Si | Sn | Sr | Th | Ti | Tl | U | V | Y | Zn | Zr |
| Chinchilla 4 | 1215.47-1215.59 | 346 | 0.04 | 6 | <DL | 48 | 1 | 1 | 0.009 | 4 | 756 | 0.02 | 0.02 | <DL | <DL | 15 | 58 | 0.001 | <DL | <DL | 0.4 | 0.04 | 0.8 | 48 | 0.006 | 0.07 | 242 | 0.02 | 1 | 0.08 | <DL | 0.01 | 0.04 | 0.06 | 0.1 | 3 | 0.02 | |||
| 1218.02-1218.10 | 55 | 0.2 | 6 | 0.07 | 0.04 | 62 | 0.3 | 0.1 | 0.3 | 2 | 15 | 0.01 | 0.004 | 0.001 | <DL | <DL | 24 | 6 | 0.002 | <DL | 0.6 | <DL | 3 | 0.3 | 0.4 | 46 | 0.02 | 0.08 | <DL | 0.005 | 2 | 0.05 | <DL | 0.02 | 0.08 | 0.03 | 0.09 | 7 | 0.07 | |
| Tipton 153 | 1032.35-1032.48 | 552 | 0.9 | 3 | 0.007 | 0.001 | 49 | 0.6 | 0.2 | 0.004 | 6 | 74 | 0.03 | 0.002 | <DL | 0.1 | 9 | <DL | 0.01 | <DL | 0.9 | <DL | 2 | 0.02 | 0.3 | <DL | 0.02 | 0.04 | 171 | 0.09 | 1 | 0.03 | <DL | 0.005 | 0.01 | 0.3 | 0.05 | 2 | 0.02 | |
| 1033.88-1034.00 | 564 | 1 | 7 | 0.08 | 0.05 | 39 | 0.9 | 0.7 | 0.2 | 2 | 50 | 0.03 | 0.007 | <DL | <DL | 0.4 | 17 | <DL | 0.009 | <DL | 1 | <DL | 5 | 0.3 | 0.5 | <DL | 0.02 | 0.1 | 229 | 0.008 | 2 | 0.08 | <DL | 0.02 | 0.06 | 0.4 | 0.08 | 17 | 0.04 | |
| 1066.00-1066.24 | 314 | 0.6 | 9 | 0.2 | 0.2 | 190 | 3 | 0.2 | 0.6 | 12 | 18 | 0.02 | 0.002 | 0.0006 | <DL | 0.8 | 26 | <DL | 0.03 | <DL | 3 | <DL | 19 | 0.8 | 0.3 | <DL | 0.05 | 0.2 | 142 | 0.006 | 7 | 0.2 | <DL | 0.02 | 0.08 | 0.4 | 0.06 | 19 | 0.04 | |
| 1067.92-1068.00 | 85 | 0.02 | 0.7 | 0.01 | 0.01 | 19 | 0.04 | 0.07 | 0.01 | 0.6 | 174 | 0.007 | 0.002 | 0.0007 | <DL | <DL | 24 | 12 | 0.0002 | <DL | 1 | <DL | 0.9 | 0.02 | 0.05 | 0.002 | 0.1 | <DL | 0.008 | 0.3 | 0.01 | <DL | 0.0005 | 0.01 | 0.1 | 0.01 | 1 | 0.03 | ||
| 1093.00-1093.19 | 1,195 | 0.2 | 3 | 0.002 | 9 | 0.2 | 0.2 | 0.004 | 7 | 55 | 0.06 | 0.005 | 0.002 | <DL | 7 | <DL | 0.07 | <DL | 0.6 | 0.03 | 0.3 | 0.007 | 0.03 | 209 | 0.1 | 0.4 | 0.03 | <DL | 0.0007 | 0.01 | 0.4 | 0.05 | 1 | 0.05 | ||||||
| West Moonie 1 | 2263.61-2263.77 | 15 | 0.8 | 1 | 0.02 | 0.01 | 0.7 | 0.02 | 0.005 | 4 | 29 | 0.006 | 0.003 | <DL | <DL | 0.02 | <DL | <DL | <DL | <DL | 1 | <DL | 3 | 0.03 | 0.2 | <DL | 0.03 | 0.02 | <DL | 0.09 | 0.2 | 0.06 | <DL | 0.001 | 0.009 | 0.02 | 0.06 | 1 | <DL | |
| 2267.05-2267.23 | 16 | 0.9 | 1 | 0.03 | 0.03 | 28 | 0.7 | 0.02 | 0.01 | 2 | 1,139 | 0.004 | 0.005 | <DL | <DL | <DL | 29 | 30 | <DL | 1 | 2 | 0.02 | 0.1 | <DL | 0.03 | 0.06 | <DL | 0.1 | 0.2 | 0.04 | <DL | <DL | 0.005 | 0.04 | 0.03 | 3 | 0.009 | |||
| 2267.71-2267.84 | 331 | 0.6 | 21 | 0.7 | 0.4 | 87 | 15 | 0.2 | 0.2 | 3 | 46 | 0.01 | 0.005 | <DL | <DL | 0.1 | 5 | <DL | 0.05 | <DL | 30 | <DL | 14 | <DL | 0.2 | <DL | <DL | 0.2 | 142 | 0.004 | 6 | 0.1 | <DL | <DL | 0.04 | 0.2 | 0.09 | 7 | 0.03 | |
| 2274.10-2274.18 | 15 | 0.9 | 1 | 0.02 | 0.06 | 0.5 | 0.02 | 0.005 | 4 | 57 | 0.006 | 0.002 | <DL | <DL | 0.003 | <DL | <DL | <DL | <DL | 0.8 | <DL | 2 | 0.02 | 0.1 | 45 | 0.06 | <DL | <DL | 0.07 | 0.1 | 0.01 | <DL | 0.0002 | 0.007 | 0.02 | 0.04 | 1 | <DL | ||
| 2281.82-2281.92 | 36 | 1 | 5 | 0.2 | 0.1 | 23 | 4 | 0.05 | 0.06 | 3 | 15 | 0.005 | 0.003 | <DL | <DL | 0.1 | 3 | <DL | 0.05 | <DL | 7 | <DL | 6 | 0.1 | 0.1 | <DL | 0.07 | 0.03 | <DL | <DL | 2 | 0.01 | <DL | 0.005 | 0.03 | 0.08 | 0.04 | 10 | <DL | |
| 2284.13-2284.24 | 21 | 1 | 1 | 0.04 | 0.03 | 1 | 0.02 | 0.005 | 2 | 7 | 0.003 | 0.002 | <DL | <DL | 0.03 | <DL | <DL | 0.05 | <DL | 3 | <DL | 5 | 0.02 | 0.05 | <DL | 0.04 | <DL | <DL | 0.02 | 0.2 | <DL | <DL | <DL | 0.008 | 0.03 | 0.01 | 3 | <DL | ||
| 2288.49-2288.61 | 14 | 0.4 | 0.5 | 0.03 | 0.03 | 0.6 | 0.02 | 0.004 | 4 | 4 | 0.002 | 0.002 | <DL | <DL | 0.02 | <DL | <DL | <DL | 2 | <DL | 3 | 0.02 | 0.05 | <DL | 0.01 | <DL | <DL | 0.06 | 0.1 | <DL | <DL | <DL | 0.008 | 0.03 | 0.008 | 0.7 | <DL | |||
| 2294.83-2294.98 | 10 | 0.1 | 0.4 | 0.01 | 0.01 | 0.3 | 0.01 | <DL | 2 | 0.002 | <DL | <DL | <DL | <DL | <DL | <DL | 0.6 | 2 | 0.01 | 0.06 | <DL | 0.01 | 0.04 | <DL | 0.2 | 0.1 | 0.004 | <DL | <DL | 0.01 | 0.04 | 0.008 | 0.2 | 0.004 | ||||||
| 2297.19-2297.37 | 100 | 1 | 24 | 0.4 | 0.05 | <DL | 8 | 0.05 | 0.9 | 4 | 22 | 0.005 | 0.004 | <DL | <DL | 0.6 | 2 | <DL | 0.1 | <DL | 11 | <DL | 10 | 1 | 0.1 | <DL | 0.1 | 0.06 | <DL | <DL | 9 | 0.02 | <DL | 0.05 | 0.04 | 0.04 | 0.05 | 27 | <DL | |
| 2298.73-2298.82 | 10 | 0.2 | 0.5 | 0.008 | 0.01 | 0.4 | 0.01 | 0.01 | 2 | 0.003 | <DL | <DL | <DL | <DL | <DL | <DL | 0.5 | 2 | 0.007 | 0.04 | <DL | 0.006 | 0.05 | <DL | 0.2 | 0.08 | 0.002 | <DL | <DL | 0.009 | 0.04 | 0.007 | 0.8 | 0.005 | ||||||
| 2303.99-2304.14 | 9 | 0.1 | 0.5 | <DL | 0.01 | 0.6 | 0.04 | 0.01 | 7 | 975 | 0.002 | 0.005 | <DL | <DL | 21 | 38 | 1 | 1 | <DL | 0.07 | <DL | 0.007 | 0.08 | <DL | 0.8 | 0.09 | 0.004 | <DL | <DL | 0.002 | 0.07 | 0.01 | 0.5 | 0.004 | ||||||
| 2311.19-2311.25 | 9 | 0.07 | 0.2 | 0.003 | 0.1 | 0.01 | <DL | 1 | 339 | 0.0009 | <DL | <DL | <DL | 7 | 12 | 0.3 | 0.8 | 0.009 | 0.03 | 0.001 | 0.04 | <DL | 0.1 | 0.08 | 0.002 | <DL | 0.004 | 0.02 | 0.003 | 0.07 | 0.002 | |||||||||
| 2314.05-2314.17 | 10 | 0.3 | 0.7 | 0.003 | <DL | 1 | 0.02 | <DL | 11 | 0.002 | <DL | <DL | <DL | 1 | <DL | 1 | 0.9 | 0.006 | 0.09 | <DL | 0.01 | 0.06 | <DL | 1 | 0.09 | 0.004 | <DL | 0.003 | 0.02 | 0.01 | 2 | 0.003 | ||||||||
| 2319.26-2319.37 | 10 | 0.06 | 1 | 0.006 | 0.5 | 0.02 | <DL | 7 | 0.002 | <DL | <DL | <DL | 2 | <DL | 0.8 | 0.9 | <DL | 0.1 | 0.05 | <DL | 0.5 | 0.08 | 0.003 | <DL | <DL | 0.002 | 0.02 | 0.02 | 1 | 0.003 | ||||||||||
| 2322.61-2322.73 | 8 | 0.06 | 2 | 0.008 | 0.01 | 0.1 | 0.03 | 0.002 | 8 | 47 | 0.003 | 0.003 | <DL | <DL | 0.02 | 2 | <DL | <DL | 0.2 | 1 | 0.01 | 0.09 | 0.005 | <DL | <DL | 0.3 | 0.1 | 0.008 | <DL | <DL | 0.01 | 0.04 | 0.02 | 0.3 | <DL | |||||
| 2323.76-2323.95 | 9 | 0.09 | 0.6 | 0.009 | 0.01 | 0.2 | 0.02 | 0.01 | 2 | 85 | 0.002 | <DL | <DL | <DL | <DL | 2 | <DL | 0.5 | 2 | 0.006 | 0.04 | <DL | 0.004 | 0.06 | <DL | 0.1 | 0.1 | 0.003 | <DL | <DL | 0.01 | 0.06 | 0.006 | 0.9 | 0.003 | |||||
| 2325.88-2326.00 | 12 | 0.06 | 1 | 0.02 | 0.1 | 0.4 | 0.02 | 0.01 | 2 | 0.003 | 0.004 | <DL | <DL | <DL | 3 | 3 | 0.2 | 0.5 | 13 | 0.005 | 0.1 | <DL | 0.03 | 0.07 | <DL | 0.1 | 0.08 | 0.02 | <DL | <DL | 0.03 | 0.1 | 0.02 | 1 | 0.007 | |||||
| 2328.54-2328.59 | 185 | 0.5 | 29 | 0.6 | 0.3 | 108 | 5 | 0.2 | 0.8 | 11 | 33 | 0.01 | 0.007 | <DL | <DL | 1 | 22 | <DL | 0.007 | <DL | 9 | <DL | 8 | 1 | 0.2 | 20 | 0.1 | 0.1 | 180 | 0.01 | 10 | 0.05 | <DL | 0.03 | 0.08 | 0.1 | 0.05 | 2 | <DL | |
| 2330.41-2330.55 | 8 | 0.07 | 1 | 0.008 | 0.009 | 5 | 0.2 | 0.01 | 0.002 | 13 | <DL | 0.002 | 0.002 | <DL | 0.01 | <DL | <DL | <DL | 0.3 | <DL | 1 | 0.006 | 0.04 | <DL | 0.005 | <DL | <DL | 0.7 | 0.07 | <DL | <DL | <DL | 0.008 | 0.03 | 0.008 | 0.1 | <DL | |||
| 2333.23-2333.30 | 11 | 0.03 | 0.5 | 0.002 | 0.2 | <DL | <DL | 3 | 0.002 | <DL | <DL | <DL | <DL | <DL | 0.3 | 0.6 | 0.003 | 0.03 | <DL | 0.02 | <DL | 0.2 | 0.05 | 0.002 | <DL | 0.003 | 0.02 | 0.008 | 0.09 | <DL | ||||||||||
| 2338.75-2338.85 | 14 | 0.1 | 1 | 0.03 | 0.06 | 0.2 | 0.03 | 0.006 | 7 | <DL | 0.004 | 0.004 | <DL | <DL | 0.03 | <DL | <DL | <DL | <DL | 0.3 | <DL | 2 | 0.03 | 0.09 | <DL | 0.01 | <DL | <DL | 0.08 | 0.1 | 0.005 | <DL | <DL | 0.01 | 0.05 | 0.01 | 2 | <DL | ||
| West Wandoan 1 | 1165.57-1165.65 | 527 | 2 | 4 | 1 | 0.2 | 0.005 | 11 | 26 | 0.04 | 0.009 | <DL | <DL | <DL | 0.03 | <DL | 0.9 | 2 | 0.03 | 0.7 | 41 | 0.01 | 0.03 | 154 | 0.1 | 0.2 | 0.07 | <DL | 0.002 | 0.02 | 0.2 | 0.06 | 3 | 0.03 | ||||||
| 1174.24-1174.33 | 667 | 4 | 6 | 0.9 | 0.5 | 0.01 | 5 | 27 | 0.08 | 0.02 | <DL | <DL | 3 | <DL | 0.04 | <DL | 1 | 3 | 0.1 | 2 | 52 | 0.01 | 0.07 | 192 | 0.04 | 0.4 | 0.3 | <DL | 0.003 | 0.06 | 0.4 | 0.1 | 4 | 0.03 | ||||||
| 1197.76-1197.84 | 299 | 2 | 9 | 2 | 0.2 | 0.002 | 15 | 58 | 0.04 | 0.01 | <DL | <DL | 2 | <DL | 0.08 | <DL | 3 | 3 | 0.04 | 1 | 23 | 0.03 | 0.02 | 106 | 0.09 | 0.3 | 0.08 | <DL | 0.005 | 0.03 | 0.2 | 0.07 | 4 | 0.03 | ||||||
| 1207.61-1207.68 | 124 | 3 | 9 | 0.2 | 0.1 | 114 | 12 | 0.2 | 0.4 | 8 | 80 | 0.03 | 0.008 | 0.0006 | <DL | 0.1 | 30 | <DL | 0.1 | <DL | 17 | <DL | 7 | 0.5 | 0.6 | 41 | 0.05 | 0.2 | <DL | 0.006 | 4 | 0.07 | <DL | 0.05 | 0.2 | 1 | 0.2 | 45 | 0.02 | |
| 1225.70-1225.80 | 71 | 1 | 4 | 0.7 | 0.1 | <DL | 9 | 82 | 0.03 | 0.01 | <DL | <DL | <DL | 0.08 | <DL | 1 | 1 | <DL | 0.9 | <DL | 0.4 | 0.02 | <DL | 0.2 | 0.2 | 0.08 | <DL | 0.003 | 0.03 | 0.1 | 0.05 | 4 | 0.01 | |||||||
| 1229.43-1229.50 | 27 | 1 | 6 | 0.6 | 0.08 | <DL | 9 | 94 | 0.01 | 0.007 | <DL | <DL | <DL | 0.03 | <DL | 0.8 | 1 | 0.006 | 0.5 | <DL | 0.04 | 0.01 | <DL | 0.3 | 0.2 | 0.04 | <DL | 0.003 | 0.01 | 0.05 | 0.03 | 2 | 0.009 | |||||||
| Woleebee Creek GWB 4 | 1552.63-1553.00 | 206 | 0.09 | 5 | 0.007 | 6 | 1 | 0.2 | 0.002 | 9 | 27 | 0.02 | 0.005 | <DL | <DL | 2 | <DL | <DL | <DL | 0.9 | 0.006 | 0.7 | <DL | 0.01 | 0.02 | 97 | 0.1 | 0.3 | 0.06 | <DL | 0.0008 | 0.02 | 0.2 | 0.08 | 2 | 0.01 | ||||
| 1570.46-1570.52 | 65 | 0.7 | 2 | 0.04 | 4 | 1 | 0.1 | 0.003 | 2 | 25 | 0.01 | 0.003 | <DL | <DL | <DL | <DL | 0.03 | <DL | <DL | 2 | 0.007 | 0.4 | <DL | 0.02 | 0.03 | <DL | 0.04 | 0.1 | 0.02 | <DL | 0.002 | 0.01 | 0.2 | 0.04 | 8 | 0.01 | ||||
| Medians | All (n=36) | 31 | 0.2 | 1 | 0.009 | 0.01 | 4 | 0.6 | 0.05 | 0.005 | 4 | 28 | 0.006 | 0.004 | <DL | <DL | <DL | 2 | <DL | 0.001 | <DL | 0.9 | <DL | 2 | 0.02 | 0.1 | <DL | 0.01 | 0.04 | <DL | 0.09 | 0.2 | 0.02 | <DL | 0.0006 | 0.01 | 0.06 | 0.04 | 2 | 0.006 |
| Sandstones (n=30) | 16 | 0.1 | 1 | 0.007 | 0.01 | 2 | 0.6 | 0.03 | 0.004 | 4 | 28 | 0.005 | 0.003 | <DL | <DL | <DL | 2 | <DL | <DL | <DL | 0.8 | <DL | 2 | 0.01 | 0.1 | <DL | 0.01 | 0.03 | <DL | 0.1 | 0.1 | 0.01 | <DL | 0.0001 | 0.01 | 0.06 | 0.02 | 1 | 0.005 | |
| Interbedded (n=6) | 154 | 0.6 | 15 | 0.3 | 0.2 | 97 | 7 | 0.2 | 0.5 | 6 | 28 | 0.01 | 0.004 | 0.0003 | <DL | 0.4 | 23 | <DL | 0.04 | <DL | 10 | <DL | 9 | 0.7 | 0.3 | 10 | 0.05 | 0.2 | 71 | 0.006 | 7 | 0.06 | <DL | 0.02 | 0.08 | 0.1 | 0.08 | 13 | 0.03 |
Shading indicates element was below detection limit in given rock samples.
Table B4.
Step 3 pH 3 Extracted Element Concentrations (mg element per kg rock).
| Well | Depth (mRT) | Al | As | Ba | Be | Bi | Ca | Co | Cr | Cs | Cu | Fe | Ga | Ge | Hf | K | Li | Mg | Mn | Mo | Na | Ni | P | Pb | Rb | REE | S | Sb | Sc | Si | Sn | Sr | Th | Ti | Tl | U | V | Y | Zn | Zr |
| Chinchilla 4 | 1215.47-1215.59 | 411 | 0.009 | 0.8 | <DL | 23 | 1 | 1 | 0.004 | 2 | 3,130 | 0.04 | 0.05 | <DL | <DL | 14 | 140 | <DL | <DL | <DL | 0.3 | 0.04 | 0.6 | <DL | <DL | 0.05 | 205 | 0.003 | 0.2 | 0.05 | <DL | 0.003 | 0.02 | 0.1 | 0.08 | 2 | 0.004 | |||
| 1218.02-1218.10 | 35 | 0.02 | 0.3 | 0.04 | 0.01 | <DL | 0.1 | 0.06 | 0.04 | 0.6 | 45 | 0.01 | <DL | <DL | <DL | <DL | <DL | 4 | <DL | <DL | 0.2 | <DL | 0.8 | 0.07 | 0.08 | <DL | 0.002 | 0.04 | <DL | 0.002 | 0.1 | 0.02 | <DL | 0.004 | 0.02 | 0.04 | 0.02 | 3 | 0.003 | |
| Tipton 153 | 1032.35-1032.48 | 189 | 0.1 | 0.2 | 0.002 | <DL | 8 | 0.2 | 0.05 | <DL | 1 | 39 | 0.03 | 0.001 | <DL | <DL | 3 | <DL | 0.0008 | <DL | 0.5 | <DL | 0.3 | 0.02 | 0.06 | <DL | 0.004 | 0.009 | 54 | 0.008 | 0.1 | 0.004 | <DL | 0.001 | 0.004 | 0.1 | 0.01 | 0.4 | 0.0008 | |
| 1033.88-1034.00 | 485 | 0.1 | 0.5 | 0.05 | 0.02 | 23 | 0.3 | 0.3 | 0.04 | 0.6 | 201 | 0.06 | 0.009 | <DL | <DL | <DL | 10 | <DL | <DL | <DL | 0.6 | <DL | 1 | 0.2 | 0.3 | <DL | 0.003 | 0.06 | 156 | 0.002 | 0.2 | 0.03 | <DL | 0.007 | 0.02 | 0.5 | 0.04 | 4 | 0.001 | |
| 1066.00-1066.24 | 238 | 0.1 | 1 | 0.2 | 0.07 | 6 | 1 | 0.1 | 0.06 | 4 | 25 | 0.03 | 0.004 | <DL | <DL | 0.3 | 4 | <DL | <DL | <DL | 2 | <DL | 3 | 0.2 | 0.1 | <DL | 0.009 | 0.09 | 109 | 0.002 | 0.3 | 0.07 | <DL | 0.006 | 0.03 | 0.6 | 0.02 | 8 | 0.001 | |
| 1067.92-1068.00 | 64 | <DL | 0.2 | 0.01 | 0.005 | 36 | 0.1 | 0.3 | 0.007 | 0.2 | 3,211 | 0.02 | 0.05 | <DL | <DL | <DL | 73 | 70 | <DL | <DL | 1 | <DL | 0.6 | 0.03 | 0.05 | 0.001 | 0.4 | <DL | 0.002 | 0.09 | 0.01 | <DL | <DL | 0.004 | 1 | 0.02 | 1 | 0.005 | ||
| 1093.00-1093.19 | 278 | 0.03 | 0.3 | <DL | 7 | 0.08 | 0.05 | <DL | 2 | 28 | 0.05 | 0.002 | <DL | <DL | 3 | <DL | 0.004 | <DL | 0.1 | 0.02 | 0.02 | 0.002 | 0.003 | 66 | 0.01 | 0.08 | 0.002 | <DL | <DL | 0.004 | 0.1 | 0.004 | 0.5 | 0.001 | ||||||
| West Moonie 1 | 2263.61-2263.77 | 8 | 0.09 | 0.09 | <DL | <DL | 0.06 | 0.02 | <DL | 0.3 | 30 | 0.003 | 0.001 | <DL | <DL | <DL | 2 | <DL | <DL | <DL | 0.09 | <DL | 0.2 | 0.01 | 0.04 | <DL | 0.004 | 0.01 | <DL | 0.01 | 0.02 | 0.01 | <DL | <DL | 0.002 | 0.02 | 0.01 | 0.2 | <DL | |
| 2267.05-2267.23 | 8 | 0.2 | 0.1 | 0.01 | 0.01 | 10 | 0.2 | 0.06 | 0.01 | 0.3 | 213 | 0.008 | 0.01 | 0.0008 | <DL | <DL | 6 | 6 | <DL | 0.4 | 0.4 | 0.01 | 0.2 | <DL | 0.01 | 0.04 | <DL | 0.01 | 0.04 | 0.06 | <DL | 0.0002 | 0.003 | 0.1 | 0.05 | 0.5 | 0.0009 | |||
| 2267.71-2267.84 | 153 | 0.02 | 0.2 | 0.03 | 0.006 | <DL | 0.07 | 0.02 | 0.002 | 0.2 | 50 | 0.006 | 0.003 | <DL | <DL | <DL | 4 | <DL | 0.0004 | <DL | 0.1 | <DL | 0.2 | 0.008 | 0.1 | <DL | 0.003 | 0.02 | 126 | 0.002 | 0.05 | 0.01 | <DL | <DL | 0.01 | 0.08 | 0.04 | 0.2 | 0.0009 | |
| 2274.10-2274.18 | 7 | 0.09 | 0.1 | 0.009 | <DL | 0.05 | 0.01 | <DL | 0.3 | 50 | 0.004 | 0.001 | <DL | <DL | <DL | <DL | <DL | <DL | <DL | 0.06 | <DL | 0.3 | 0.009 | 0.04 | <DL | 0.006 | 0.004 | <DL | 0.009 | 0.02 | 0.009 | <DL | <DL | 0.003 | 0.02 | 0.02 | 0.2 | <DL | ||
| 2281.82-2281.92 | 10 | 0.07 | 0.1 | 0.09 | <DL | <DL | 0.3 | 0.03 | 0.004 | 0.2 | <DL | 0.004 | 0.001 | <DL | <DL | 0.08 | <DL | <DL | 0.005 | <DL | 0.5 | <DL | 0.2 | 0.03 | 0.01 | <DL | 0.002 | 0.009 | <DL | <DL | 0.03 | <DL | <DL | 0.0004 | 0.003 | 0.06 | 0.004 | 0.9 | <DL | |
| 2284.13-2284.24 | 7 | 0.07 | 0.04 | 0.01 | <DL | 0.1 | 0.01 | <DL | 0.1 | <DL | 0.004 | <DL | <DL | <DL | 0.08 | <DL | <DL | <DL | <DL | 0.2 | <DL | 0.1 | <DL | 0.007 | <DL | 0.005 | 0.004 | <DL | <DL | 0.01 | <DL | <DL | <DL | 0.001 | 0.01 | 0.002 | 0.3 | <DL | ||
| 2288.49-2288.61 | 5 | 0.03 | 0.03 | 0.009 | <DL | 0.05 | 0.01 | <DL | 0.2 | <DL | 0.002 | <DL | <DL | <DL | <DL | <DL | <DL | <DL | 0.2 | <DL | 0.1 | <DL | 0.005 | <DL | 0.002 | 0.003 | <DL | 0.01 | 0.009 | <DL | <DL | <DL | 0.0009 | 0.02 | 0.002 | 0.1 | <DL | |||
| 2294.83-2294.98 | 6 | 0.03 | 0.06 | 0.006 | <DL | 0.04 | 0.01 | <DL | 0.2 | 0.003 | <DL | <DL | <DL | <DL | <DL | <DL | 0.1 | 0.08 | <DL | 0.05 | <DL | 0.006 | <DL | <DL | 0.03 | 0.02 | 0.009 | <DL | <DL | 0.005 | 0.04 | 0.007 | 0.06 | <DL | ||||||
| 2297.19-2297.37 | 45 | 0.5 | 4 | 0.4 | 0.05 | 147 | 3 | 0.1 | 0.07 | 2 | <DL | 0.005 | 0.007 | <DL | <DL | 0.5 | 24 | <DL | 0.003 | <DL | 5 | <DL | 2 | 0.2 | 0.04 | 31 | 0.1 | 0.1 | <DL | <DL | 0.6 | 0.02 | <DL | 0.02 | 0.02 | 0.1 | 0.02 | 15 | <DL | |
| 2298.73-2298.82 | 11 | 0.03 | 0.06 | 0.005 | <DL | 0.05 | 0.005 | 0.01 | 0.2 | 0.004 | <DL | <DL | <DL | <DL | <DL | <DL | 0.09 | 0.1 | <DL | 0.03 | <DL | 0.004 | <DL | <DL | 0.02 | 0.008 | 0.003 | <DL | <DL | 0.003 | 0.03 | 0.005 | 0.07 | <DL | ||||||
| 2303.99-2304.14 | 4 | <DL | 0.04 | 0.006 | <DL | 0.04 | 0.1 | <DL | 0.3 | 296 | 0.003 | 0.009 | <DL | <DL | 7 | 11 | 0.4 | 0.07 | <DL | 0.04 | <DL | <DL | 0.06 | <DL | 0.08 | 0.02 | 0.002 | <DL | <DL | 0.001 | 0.2 | 0.007 | 0.2 | <DL | ||||||
| 2311.19-2311.25 | 3 | 0.02 | 0.05 | 0.007 | 0.04 | 0.04 | <DL | 0.2 | 130 | 0.004 | 0.005 | <DL | <DL | 3 | 5 | 0.2 | 0.08 | 0.005 | 0.04 | <DL | 0.003 | <DL | 0.04 | 0.02 | 0.001 | <DL | 0.002 | 0.07 | 0.007 | 0.09 | <DL | |||||||||
| 2314.05-2314.17 | 3 | 0.03 | 0.06 | 0.005 | 6 | 0.2 | 0.01 | <DL | 0.4 | 0.002 | <DL | <DL | <DL | 3 | <DL | 0.2 | 0.05 | 0.004 | 0.04 | <DL | 0.005 | <DL | <DL | 0.1 | 0.02 | 0.0008 | <DL | 0.001 | 0.01 | 0.007 | 0.2 | <DL | ||||||||
| 2319.26-2319.37 | 4 | 0.02 | 0.08 | 0.003 | 0.03 | 0.01 | <DL | 0.4 | 0.004 | <DL | <DL | <DL | 2 | <DL | 0.1 | 0.08 | <DL | 0.04 | <DL | <DL | 0.08 | 0.02 | 0.0004 | <DL | <DL | 0.001 | 0.01 | 0.006 | 0.4 | <DL | ||||||||||
| 2322.61-2322.73 | 5 | 0.007 | 0.06 | <DL | <DL | 0.01 | 0.02 | <DL | 0.2 | 23 | 0.003 | 0.001 | <DL | <DL | 0.06 | <DL | <DL | <DL | 0.04 | 0.04 | <DL | 0.02 | 0.002 | 0.002 | <DL | 0.04 | 0.01 | <DL | <DL | <DL | 0.002 | 0.02 | 0.006 | 0.1 | <DL | |||||
| 2323.76-2323.95 | 5 | <DL | 0.07 | 0.006 | <DL | 0.03 | 0.01 | 0.01 | 0.1 | 32 | 0.004 | <DL | <DL | <DL | <DL | <DL | <DL | 0.1 | 0.1 | 0.006 | 0.03 | <DL | 0.005 | <DL | <DL | 0.02 | 0.01 | 0.002 | <DL | <DL | 0.003 | 0.06 | 0.005 | 0.06 | <DL | |||||
| 2325.88-2326.00 | 7 | <DL | 0.09 | 0.006 | 0.02 | 0.04 | 0.03 | <DL | 0.2 | 0.004 | <DL | <DL | <DL | <DL | 1 | <DL | <DL | 0.1 | 3 | <DL | 0.05 | <DL | 0.009 | <DL | <DL | 0.02 | 0.02 | 0.02 | <DL | <DL | 0.006 | 0.1 | 0.01 | 0.08 | <DL | |||||
| 2328.54-2328.59 | 98 | 0.1 | 1 | 0.3 | 0.02 | 5 | 3 | 0.1 | 0.1 | 2 | 28 | 0.02 | 0.006 | <DL | <DL | 0.3 | 3 | <DL | <DL | <DL | 2 | <DL | 0.8 | 0.4 | 0.09 | <DL | 0.006 | 0.1 | 161 | <DL | 0.3 | 0.02 | <DL | 0.009 | 0.04 | 0.2 | 0.05 | 2 | <DL | |
| 2330.41-2330.55 | <DL | 0.007 | 0.04 | <DL | <DL | <DL | 0.02 | 0.007 | <DL | 0.3 | <DL | 0.002 | 0.0008 | <DL | <DL | <DL | <DL | <DL | 0.04 | <DL | 0.05 | <DL | 0.007 | <DL | 0.001 | 0.002 | <DL | 0.08 | 0.007 | <DL | <DL | <DL | 0.001 | 0.01 | 0.002 | 0.08 | <DL | |||
| 2333.23-2333.30 | 3 | <DL | 0.07 | 0.004 | 0.02 | 0.007 | <DL | 0.3 | 0.002 | <DL | <DL | <DL | <DL | <DL | 0.1 | 0.05 | <DL | 0.03 | <DL | <DL | <DL | 0.05 | 0.007 | 0.003 | <DL | 0.002 | 0.02 | 0.008 | 0.1 | <DL | ||||||||||
| 2338.75-2338.85 | 6 | 0.01 | 0.05 | 0.02 | <DL | 0.02 | 0.008 | <DL | 0.3 | <DL | 0.003 | 0.002 | <DL | <DL | 0.06 | <DL | <DL | <DL | <DL | 0.03 | <DL | 0.08 | 0.005 | 0.01 | <DL | 0.002 | 0.005 | <DL | 0.02 | 0.01 | <DL | <DL | <DL | 0.002 | 0.04 | 0.003 | 0.2 | <DL | ||
| West Wandoan 1 | 1165.57-1165.65 | 391 | 0.2 | <DL | 0.2 | 0.4 | 0.008 | 0.2 | 14 | 0.01 | 0.05 | <DL | <DL | <DL | <DL | <DL | 2 | 0.6 | 0.04 | 0.06 | <DL | <DL | 0.4 | 134 | 0.003 | 0.1 | 0.01 | <DL | <DL | 0.005 | 1 | 0.02 | 1 | 0.006 | ||||||
| 1174.24-1174.33 | 764 | 0.3 | <DL | 0.08 | 0.05 | <DL | 2 | 28 | 0.04 | 0.002 | <DL | <DL | 4 | <DL | 0.004 | <DL | 0.2 | 0.1 | 0.02 | 0.02 | <DL | 0.002 | 0.003 | 212 | 0.01 | 0.08 | 0.002 | <DL | <DL | 0.004 | 0.1 | 0.004 | 0.4 | 0.001 | ||||||
| 1197.76-1197.84 | 257 | 0.9 | <DL | 0.3 | 0.5 | 0.02 | 0.3 | 37 | 0.2 | 0.03 | <DL | <DL | 2 | <DL | 0.001 | <DL | 0.6 | 1 | 0.1 | 0.6 | <DL | 0.004 | 0.2 | 89 | 0.002 | 0.3 | 0.1 | <DL | 0.005 | 0.03 | 1 | 0.1 | 3 | 0.004 | ||||||
| 1207.61-1207.68 | 160 | 0.003 | 0.2 | 0.02 | <DL | <DL | 0.5 | 0.2 | 0.003 | 0.4 | 101 | 0.01 | 0.07 | <DL | <DL | <DL | 3 | <DL | <DL | <DL | 1 | <DL | 0.4 | 0.03 | 0.05 | <DL | 0.001 | 0.5 | 56 | 0.003 | 0.2 | 0.007 | <DL | 0.002 | 0.003 | 1 | 0.04 | 1 | 0.01 | |
| 1225.70-1225.80 | 74 | 0.2 | <DL | 0.2 | 0.05 | <DL | 1 | 23 | 0.03 | 0.002 | <DL | <DL | <DL | 0.0008 | <DL | 0.5 | 0.3 | 0.02 | 0.06 | <DL | 0.005 | 0.007 | <DL | 0.008 | 0.1 | 0.004 | <DL | 0.001 | 0.004 | 0.1 | 0.01 | 0.4 | 0.002 | |||||||
| 1229.43-1229.50 | 33 | 0.5 | <DL | 0.3 | 0.3 | 0.04 | 0.5 | 20 | 0.06 | 0.008 | <DL | <DL | <DL | <DL | <DL | 0.6 | 1 | 0.2 | 0.3 | <DL | 0.004 | 0.08 | <DL | 0.002 | 0.2 | 0.03 | <DL | 0.006 | 0.02 | 0.5 | 0.04 | 4 | 0.002 | |||||||
| Woleebee Creek GWB 4 | 1552.63-1553.00 | 115 | 0.01 | 0.2 | <DL | <DL | 0.2 | 0.05 | <DL | 2 | 12 | 0.02 | <DL | <DL | <DL | <DL | <DL | <DL | <DL | 0.1 | 0.007 | 0.09 | <DL | 0.004 | 0.003 | <DL | 0.009 | 0.03 | 0.01 | <DL | <DL | 0.004 | 0.07 | 0.02 | 0.3 | <DL | ||||
| 1570.46-1570.52 | 58 | 0.2 | 0.6 | 0.005 | <DL | 0.3 | 0.04 | <DL | 0.5 | 29 | 0.01 | 0.004 | <DL | <DL | <DL | <DL | 0.003 | <DL | <DL | 0.7 | 0.01 | 0.1 | <DL | 0.01 | 0.009 | <DL | 0.003 | 0.06 | 0.006 | <DL | 0.0007 | 0.004 | 0.2 | 0.01 | 1 | 0.0009 | ||||
| Medians | All (n=36) | 22 | 0.02 | 0.1 | 0.006 | <DL | <DL | 0.1 | 0.04 | <DL | 0.3 | 26 | 0.005 | 0.002 | <DL | <DL | <DL | 1 | <DL | <DL | <DL | 0.2 | <DL | 0.2 | 0.01 | 0.05 | <DL | 0.003 | 0.008 | <DL | 0.009 | 0.04 | 0.006 | <DL | <DL | 0.004 | 0.09 | 0.01 | 0.4 | <DL |
| Sandstones (n=30) | 8 | 0.01 | 0.1 | 0.004 | <DL | <DL | 0.08 | 0.04 | <DL | 0.3 | 23 | 0.004 | 0.001 | <DL | <DL | <DL | <DL | <DL | <DL | <DL | 0.2 | <DL | 0.1 | 0.008 | 0.04 | <DL | 0.003 | 0.004 | <DL | 0.01 | 0.02 | 0.003 | <DL | <DL | 0.003 | 0.07 | 0.008 | 0.3 | <DL | |
| Interbedded (n=6) | 125 | 0.06 | 0.7 | 0.1 | 0.02 | 2 | 0.9 | 0.1 | 0.05 | 1 | 36 | 0.01 | 0.005 | <DL | <DL | 0.1 | 3 | <DL | <DL | <DL | 2 | <DL | 0.8 | 0.1 | 0.08 | <DL | 0.005 | 0.1 | 83 | 0.002 | 0.2 | 0.02 | <DL | 0.005 | 0.02 | 0.2 | 0.03 | 2 | 0.001 |
Table B5.
Sum of Acid Steps Extracted Element Concentrations (mg element per kg rock).
| Well | Depth (mRT) | Al | As | Ba | Be | Bi | Ca | Co | Cr | Cs | Cu | Fe | Ga | Ge | Hf | K | Li | Mg | Mn | Mo | Na | Ni | P | Pb | Rb | REE | S | Sb | Sc | Si | Sn | Sr | Th | Ti | Tl | U | V | Y | Zn | Zr |
| Chinchilla 4 | 1215.47-1215.59 | 757 | 0.05 | 7 | <DL | 72 | 2 | 2 | 0.01 | 6 | 3,885 | 0.07 | 0.06 | <DL | <DL | 29 | 199 | 0.001 | <DL | <DL | 0.7 | 0.08 | 1 | 48 | 0.006 | 0.1 | 447 | 0.02 | 1 | 0.1 | <DL | 0.01 | 0.05 | 0.2 | 0.2 | 5 | 0.02 | |||
| 1218.02-1218.10 | 90 | 0.2 | 6 | 0.1 | 0.05 | 62 | 0.4 | 0.2 | 0.3 | 2 | 59 | 0.03 | 0.004 | 0.001 | <DL | <DL | 24 | 9 | 0.002 | <DL | 0.8 | <DL | 4 | 0.3 | 0.4 | 46 | 0.02 | 0.1 | <DL | 0.007 | 2 | 0.07 | <DL | 0.02 | 0.1 | 0.07 | 0.1 | 10 | 0.07 | |
| Tipton 153 | 1032.35-1032.48 | 741 | 1 | 3 | 0.009 | 0.001 | 58 | 0.8 | 0.3 | 0.004 | 8 | 112 | 0.06 | 0.003 | <DL | 0.1 | 11 | <DL | 0.01 | <DL | 1 | <DL | 2 | 0.04 | 0.3 | <DL | 0.02 | 0.04 | 226 | 0.1 | 1 | 0.03 | <DL | 0.007 | 0.02 | 0.4 | 0.06 | 2 | 0.02 | |
| 1033.88-1034.00 | 1,049 | 1 | 8 | 0.1 | 0.07 | 61 | 1 | 1 | 0.2 | 2 | 252 | 0.09 | 0.02 | <DL | <DL | 0.4 | 27 | <DL | 0.009 | <DL | 2 | <DL | 6 | 0.5 | 0.8 | <DL | 0.02 | 0.2 | 385 | 0.01 | 3 | 0.1 | <DL | 0.02 | 0.08 | 0.9 | 0.1 | 21 | 0.04 | |
| 1066.00-1066.24 | 552 | 0.7 | 10 | 0.3 | 0.3 | 195 | 4 | 0.4 | 0.7 | 15 | 43 | 0.05 | 0.005 | 0.0006 | <DL | 1 | 30 | <DL | 0.03 | <DL | 6 | <DL | 22 | 1 | 0.4 | <DL | 0.06 | 0.3 | 251 | 0.008 | 8 | 0.2 | <DL | 0.03 | 0.1 | 1 | 0.08 | 27 | 0.05 | |
| 1067.92-1068.00 | 149 | 0.02 | 0.9 | 0.02 | 0.02 | 55 | 0.2 | 0.4 | 0.02 | 0.7 | 3,385 | 0.02 | 0.05 | 0.0007 | <DL | <DL | 97 | 82 | 0.0002 | <DL | 2 | <DL | 1 | 0.05 | 0.1 | 0.003 | 0.5 | <DL | 0.01 | 0.4 | 0.02 | <DL | 0.0005 | 0.02 | 1 | 0.03 | 2 | 0.04 | ||
| 1093.00-1093.19 | 1,473 | 0.2 | 3 | 0.002 | 16 | 0.3 | 0.2 | 0.004 | 9 | 83 | 0.1 | 0.006 | 0.002 | <DL | 10 | <DL | 0.08 | <DL | 0.7 | 0.05 | 0.4 | 0.009 | 0.03 | 275 | 0.1 | 0.5 | 0.03 | <DL | 0.0007 | 0.02 | 0.5 | 0.05 | 2 | 0.05 | ||||||
| West Moonie 1 | 2263.61-2263.77 | 23 | 0.9 | 1 | 0.02 | 0.01 | 0.7 | 0.04 | 0.005 | 4 | 59 | 0.009 | 0.004 | <DL | <DL | 0.02 | 2 | <DL | <DL | <DL | 1 | <DL | 3 | 0.04 | 0.2 | <DL | 0.03 | 0.03 | <DL | 0.1 | 0.2 | 0.07 | <DL | 0.001 | 0.01 | 0.05 | 0.07 | 2 | <DL | |
| 2267.05-2267.23 | 25 | 1 | 1 | 0.04 | 0.04 | 38 | 0.8 | 0.08 | 0.03 | 2 | 1,352 | 0.01 | 0.02 | 0.0008 | <DL | <DL | 35 | 36 | <DL | 2 | 2 | 0.03 | 0.3 | <DL | 0.04 | 0.09 | <DL | 0.1 | 0.3 | 0.09 | <DL | 0.0002 | 0.008 | 0.2 | 0.07 | 3 | 0.009 | |||
| 2267.71-2267.84 | 484 | 0.6 | 22 | 0.7 | 0.4 | 87 | 15 | 0.2 | 0.2 | 4 | 96 | 0.02 | 0.007 | <DL | <DL | 0.1 | 9 | <DL | 0.05 | <DL | 30 | <DL | 14 | 0.008 | 0.4 | <DL | 0.003 | 0.2 | 268 | 0.006 | 6 | 0.1 | <DL | <DL | 0.05 | 0.3 | 0.1 | 7 | 0.03 | |
| 2274.10-2274.18 | 22 | 1 | 1 | 0.03 | 0.06 | 0.6 | 0.03 | 0.005 | 4 | 108 | 0.009 | 0.004 | <DL | <DL | 0.003 | <DL | <DL | <DL | <DL | 0.8 | <DL | 2 | 0.03 | 0.2 | 45 | 0.06 | 0.004 | <DL | 0.08 | 0.2 | 0.02 | <DL | 0.0002 | 0.01 | 0.04 | 0.06 | 1 | <DL | ||
| 2281.82-2281.92 | 46 | 1 | 6 | 0.3 | 0.1 | 23 | 4 | 0.07 | 0.07 | 3 | 15 | 0.009 | 0.004 | <DL | <DL | 0.2 | 3 | <DL | 0.06 | <DL | 8 | <DL | 6 | 0.1 | 0.1 | <DL | 0.07 | 0.04 | <DL | <DL | 2 | 0.01 | <DL | 0.005 | 0.03 | 0.1 | 0.05 | 11 | <DL | |
| 2284.13-2284.24 | 29 | 1 | 1 | 0.06 | 0.03 | 1 | 0.03 | 0.005 | 2 | 7 | 0.007 | 0.002 | <DL | <DL | 0.1 | <DL | <DL | 0.05 | <DL | 3 | <DL | 5 | 0.02 | 0.06 | <DL | 0.05 | 0.004 | <DL | 0.02 | 0.2 | <DL | <DL | <DL | 0.009 | 0.05 | 0.02 | 3 | <DL | ||
| 2288.49-2288.61 | 19 | 0.4 | 0.6 | 0.04 | 0.03 | 0.6 | 0.04 | 0.004 | 4 | 4 | 0.004 | 0.002 | <DL | <DL | 0.02 | <DL | <DL | <DL | 2 | <DL | 3 | 0.02 | 0.05 | <DL | 0.02 | 0.003 | <DL | 0.07 | 0.1 | <DL | <DL | <DL | 0.009 | 0.05 | 0.01 | 0.8 | <DL | |||
| 2294.83-2294.98 | 16 | 0.2 | 0.5 | 0.02 | 0.01 | 0.4 | 0.02 | <DL | 2 | 0.005 | <DL | <DL | <DL | <DL | <DL | <DL | 0.7 | 2 | 0.01 | 0.1 | <DL | 0.02 | 0.04 | <DL | 0.3 | 0.1 | 0.01 | <DL | <DL | 0.01 | 0.08 | 0.01 | 0.3 | 0.004 | ||||||
| 2297.19-2297.37 | 145 | 2 | 28 | 0.8 | 0.1 | 147 | 12 | 0.2 | 1 | 6 | 22 | 0.009 | 0.01 | <DL | <DL | 1 | 26 | <DL | 0.1 | <DL | 15 | <DL | 12 | 1 | 0.2 | 31 | 0.2 | 0.2 | <DL | <DL | 10 | 0.04 | <DL | 0.06 | 0.06 | 0.2 | 0.07 | 43 | <DL | |
| 2298.73-2298.82 | 21 | 0.2 | 0.5 | 0.01 | 0.01 | 0.4 | 0.02 | 0.02 | 2 | 0.006 | <DL | <DL | <DL | <DL | <DL | <DL | 0.6 | 2 | 0.007 | 0.06 | <DL | 0.01 | 0.05 | <DL | 0.2 | 0.09 | 0.005 | <DL | <DL | 0.01 | 0.06 | 0.01 | 0.9 | 0.005 | ||||||
| 2303.99-2304.14 | 13 | 0.1 | 0.6 | 0.006 | 0.01 | 0.6 | 0.1 | 0.01 | 8 | 1,271 | 0.005 | 0.01 | <DL | <DL | 27 | 49 | 2 | 1 | <DL | 0.1 | <DL | 0.007 | 0.1 | <DL | 0.9 | 0.1 | 0.006 | <DL | <DL | 0.003 | 0.2 | 0.02 | 0.7 | 0.004 | ||||||
| 2311.19-2311.25 | 12 | 0.09 | 0.2 | 0.009 | 0.2 | 0.05 | <DL | 1 | 469 | 0.005 | 0.005 | <DL | <DL | 10 | 17 | 0.5 | 0.9 | 0.01 | 0.07 | 0.001 | 0.05 | <DL | 0.1 | 0.1 | 0.003 | <DL | 0.006 | 0.09 | 0.01 | 0.2 | 0.002 | |||||||||
| 2314.05-2314.17 | 13 | 0.3 | 0.8 | 0.009 | 6 | 1 | 0.04 | <DL | 11 | 0.004 | <DL | <DL | <DL | 4 | <DL | 2 | 0.9 | 0.01 | 0.1 | <DL | 0.02 | 0.06 | <DL | 1 | 0.1 | 0.005 | <DL | 0.004 | 0.03 | 0.02 | 2 | 0.003 | ||||||||
| 2319.26-2319.37 | 14 | 0.07 | 1 | 0.009 | 0.5 | 0.03 | <DL | 7 | 0.005 | <DL | <DL | <DL | 4 | <DL | 1 | 1 | <DL | 0.1 | 0.05 | <DL | 0.6 | 0.09 | 0.003 | <DL | <DL | 0.003 | 0.03 | 0.02 | 1 | 0.003 | ||||||||||
| 2322.61-2322.73 | 13 | 0.07 | 2 | 0.008 | 0.01 | 0.2 | 0.05 | 0.002 | 8 | 70 | 0.006 | 0.004 | <DL | <DL | 0.07 | 2 | <DL | <DL | 0.2 | 1 | 0.01 | 0.1 | 0.007 | 0.002 | <DL | 0.3 | 0.1 | 0.008 | <DL | <DL | 0.01 | 0.05 | 0.02 | 0.5 | <DL | |||||
| 2323.76-2323.95 | 14 | 0.09 | 0.7 | 0.02 | 0.01 | 0.2 | 0.03 | 0.02 | 2 | 117 | 0.006 | <DL | <DL | <DL | <DL | 2 | <DL | 0.6 | 2 | 0.01 | 0.07 | <DL | 0.009 | 0.06 | <DL | 0.2 | 0.1 | 0.005 | <DL | <DL | 0.02 | 0.1 | 0.01 | 0.9 | 0.003 | |||||
| 2325.88-2326.00 | 19 | 0.06 | 1 | 0.02 | 0.1 | 0.4 | 0.05 | 0.01 | 2 | 0.007 | 0.004 | <DL | <DL | <DL | 4 | 3 | 0.2 | 0.7 | 16 | 0.005 | 0.2 | <DL | 0.04 | 0.07 | <DL | 0.2 | 0.1 | 0.04 | <DL | <DL | 0.03 | 0.3 | 0.03 | 1 | 0.007 | |||||
| 2328.54-2328.59 | 283 | 0.7 | 30 | 0.9 | 0.3 | 113 | 8 | 0.3 | 0.9 | 13 | 61 | 0.03 | 0.01 | <DL | <DL | 1 | 26 | <DL | 0.007 | <DL | 11 | <DL | 9 | 2 | 0.3 | 20 | 0.1 | 0.3 | 340 | 0.01 | 10 | 0.07 | <DL | 0.04 | 0.11 | 0.3 | 0.09 | 4 | <DL | |
| 2330.41-2330.55 | 8 | 0.08 | 1 | 0.008 | 0.009 | 5 | 0.2 | 0.02 | 0.002 | 13 | <DL | 0.004 | 0.002 | <DL | 0.01 | <DL | <DL | <DL | 0.4 | <DL | 1 | 0.006 | 0.05 | <DL | 0.006 | 0.002 | <DL | 0.8 | 0.08 | <DL | <DL | <DL | 0.009 | 0.04 | 0.01 | 0.2 | <DL | |||
| 2333.23-2333.30 | 13 | 0.03 | 0.6 | 0.006 | 0.3 | 0.007 | <DL | 3 | 0.004 | <DL | <DL | <DL | <DL | <DL | 0.4 | 0.7 | 0.003 | 0.07 | <DL | 0.02 | <DL | 0.3 | 0.05 | 0.004 | <DL | 0.005 | 0.04 | 0.02 | 0.2 | <DL | ||||||||||
| 2338.75-2338.85 | 19 | 0.1 | 1 | 0.04 | 0.06 | 0.3 | 0.03 | 0.006 | 7 | <DL | 0.007 | 0.005 | <DL | <DL | 0.09 | <DL | <DL | <DL | <DL | 0.4 | <DL | 2 | 0.03 | 0.1 | <DL | 0.01 | 0.005 | <DL | 0.1 | 0.2 | 0.005 | <DL | <DL | 0.02 | 0.09 | 0.02 | 2 | <DL | ||
| West Wandoan 1 | 1165.57-1165.65 | 918 | 3 | 4 | 1 | 0.6 | 0.01 | 11 | 40 | 0.05 | 0.06 | <DL | <DL | <DL | 0.03 | <DL | 3 | 3 | 0.07 | 0.8 | 41 | 0.01 | 0.4 | 287 | 0.1 | 0.3 | 0.08 | <DL | 0.002 | 0.03 | 1 | 0.08 | 4 | 0.03 | ||||||
| 1174.24-1174.33 | 1,431 | 4 | 6 | 0.9 | 0.5 | 0.01 | 8 | 55 | 0.1 | 0.02 | <DL | <DL | 7 | <DL | 0.05 | <DL | 2 | 3 | 0.1 | 2 | 52 | 0.01 | 0.07 | 404 | 0.05 | 0.5 | 0.3 | <DL | 0.003 | 0.07 | 0.6 | 0.1 | 5 | 0.03 | ||||||
| 1197.76-1197.84 | 556 | 3 | 9 | 2 | 0.8 | 0.02 | 16 | 95 | 0.2 | 0.04 | <DL | <DL | 4 | <DL | 0.08 | <DL | 4 | 4 | 0.1 | 2 | 23 | 0.04 | 0.2 | 195 | 0.09 | 0.6 | 0.2 | <DL | 0.01 | 0.05 | 1 | 0.2 | 8 | 0.03 | ||||||
| 1207.61-1207.68 | 284 | 3 | 9 | 0.3 | 0.1 | 114 | 12 | 0.5 | 0.4 | 8 | 180 | 0.04 | 0.08 | 0.0006 | <DL | 0.1 | 32 | <DL | 0.1 | <DL | 18 | <DL | 7 | 0.5 | 0.6 | 41 | 0.05 | 0.7 | 56 | 0.009 | 4 | 0.08 | <DL | 0.05 | 0.2 | 2 | 0.3 | 47 | 0.03 | |
| 1225.70-1225.80 | 145 | 1 | 4 | 0.9 | 0.2 | <DL | 10 | 105 | 0.06 | 0.01 | <DL | <DL | <DL | 0.08 | <DL | 2 | 2 | 0.02 | 1 | <DL | 0.4 | 0.02 | <DL | 0.2 | 0.3 | 0.08 | <DL | 0.005 | 0.03 | 0.2 | 0.07 | 4 | 0.02 | |||||||
| 1229.43-1229.50 | 60 | 1 | 6 | 0.9 | 0.4 | 0.04 | 9 | 113 | 0.07 | 0.01 | <DL | <DL | <DL | 0.03 | <DL | 1 | 2 | 0.2 | 0.7 | <DL | 0.05 | 0.09 | <DL | 0.3 | 0.4 | 0.07 | <DL | 0.009 | 0.03 | 0.5 | 0.07 | 6 | 0.01 | |||||||
| Woleebee Creek GWB 4 | 1552.63-1553.00 | 321 | 0.1 | 6 | 0.007 | 6 | 1 | 0.2 | 0.002 | 11 | 39 | 0.04 | 0.005 | <DL | <DL | 2 | <DL | <DL | <DL | 1 | 0.01 | 0.8 | <DL | 0.02 | 0.02 | 97 | 0.1 | 0.3 | 0.07 | <DL | 0.0008 | 0.02 | 0.3 | 0.1 | 2 | 0.01 | ||||
| 1570.46-1570.52 | 122 | 0.9 | 3 | 0.04 | 4 | 1 | 0.1 | 0.003 | 3 | 55 | 0.02 | 0.007 | <DL | <DL | <DL | <DL | 0.04 | <DL | <DL | 3 | 0.02 | 0.5 | <DL | 0.04 | 0.04 | <DL | 0.04 | 0.2 | 0.03 | <DL | 0.002 | 0.02 | 0.3 | 0.06 | 9 | 0.01 | ||||
| Medians | All (n=36) | 53 | 0.2 | 1 | 0.01 | 0.01 | 5 | 0.8 | 0.1 | 0.01 | 6 | 59 | 0.01 | 0.005 | <DL | <DL | <DL | 4 | <DL | 0.001 | <DL | 1 | <DL | 2 | 0.03 | 0.2 | <DL | 0.02 | 0.05 | <DL | 0.1 | 0.3 | 0.03 | <DL | 0.0006 | 0.02 | 0.2 | 0.06 | 2 | 0.006 |
| Sandstones (n=30) | 24 | 0.1 | 1 | 0.009 | 0.01 | 4 | 0.7 | 0.06 | 0.005 | 5 | 57 | 0.009 | 0.005 | <DL | <DL | <DL | 2 | <DL | <DL | <DL | 1 | <DL | 2 | 0.02 | 0.2 | <DL | 0.02 | 0.05 | <DL | 0.1 | 0.2 | 0.02 | <DL | 0.0002 | 0.02 | 0.2 | 0.04 | 2 | 0.005 | |
| Interbedded (n=6) | 283 | 0.7 | 16 | 0.5 | 0.2 | 113 | 10 | 0.3 | 0.6 | 7 | 60 | 0.03 | 0.009 | 0.0003 | <DL | 0.6 | 26 | <DL | 0.04 | <DL | 13 | <DL | 10 | 0.8 | 0.4 | 25 | 0.06 | 0.2 | 154 | 0.007 | 7 | 0.08 | <DL | 0.03 | 0.1 | 0.3 | 0.1 | 18 | 0.03 |
Shading indicates element was below detection limit in given rock samples.
Table B6.
Sum of All Three Steps Extracted Element Concentrations (mg element per kg rock).
| Well | Depth (mRT) | Al | As | Ba | Be | Bi | Ca | Co | Cr | Cs | Cu | Fe | Ga | Ge | Hf | K | Li | Mg | Mn | Mo | Na | Ni | P | Pb | Rb | REE | S | Sb | Sc | Si | Sn | Sr | Th | Ti | Tl | U | V | Y | Zn | Zr |
| Chinchilla 4 | 1215.47-1215.59 | 757 | 0.05 | 9 | <DL | 146 | 2 | 2 | 0.04 | 6 | 3,885 | 0.07 | 0.06 | <DL | 0.2 | 69 | 204 | 0.001 | <DL | <DL | 0.7 | 0.4 | 1 | 185 | 0.006 | 0.1 | 447 | 0.02 | 3 | 0.1 | <DL | 0.03 | 0.05 | 0.2 | 0.2 | 5 | 0.02 | |||
| 1218.02-1218.10 | 90 | 0.2 | 13 | 0.1 | 0.05 | 199 | 0.4 | 0.2 | 0.5 | 2 | 59 | 0.03 | 0.004 | 0.001 | <DL | 0.2 | 94 | 12 | 0.002 | <DL | 0.9 | <DL | 4 | 1 | 0.4 | 266 | 0.02 | 0.1 | <DL | 0.01 | 7 | 0.07 | <DL | 0.05 | 0.1 | 0.07 | 0.1 | 10 | 0.07 | |
| Tipton 153 | 1032.35-1032.48 | 741 | 1 | 4 | 0.009 | 0.001 | 103 | 0.8 | 0.3 | 0.02 | 8 | 112 | 0.06 | 0.003 | <DL | 0.1 | 18 | <DL | 0.02 | <DL | 1 | <DL | 2 | 0.3 | 0.3 | <DL | 0.03 | 0.04 | 226 | 0.1 | 4 | 0.03 | <DL | 0.01 | 0.02 | 0.4 | 0.06 | 2 | 0.02 | |
| 1033.88-1034.00 | 1,049 | 1 | 10 | 0.1 | 0.07 | 107 | 1 | 1 | 0.4 | 2 | 252 | 0.09 | 0.02 | <DL | 275 | 0.6 | 54 | <DL | 0.01 | 659 | 2 | <DL | 6 | 2 | 0.8 | 27 | 0.02 | 0.2 | 385 | 0.01 | 6 | 0.1 | <DL | 0.04 | 0.08 | 0.9 | 0.1 | 21 | 0.04 | |
| 1066.00-1066.24 | 552 | 0.7 | 14 | 0.3 | 0.3 | 362 | 4 | 0.4 | 1 | 15 | 43 | 0.05 | 0.005 | 0.0006 | 198 | 1 | 60 | <DL | 0.07 | 332 | 6 | <DL | 22 | 3 | 0.4 | 47 | 0.07 | 0.3 | 251 | 0.008 | 15 | 0.2 | <DL | 0.06 | 0.1 | 1 | 0.08 | 27 | 0.05 | |
| 1067.92-1068.00 | 149 | 0.02 | 2 | 0.02 | 0.02 | 83 | 0.2 | 0.4 | 0.06 | 0.7 | 3,385 | 0.02 | 0.05 | 0.0007 | <DL | <DL | 129 | 82 | 0.0002 | <DL | 3 | <DL | 1 | 0.2 | 0.1 | 0.003 | 0.5 | <DL | 0.01 | 1 | 0.02 | <DL | 0.003 | 0.02 | 1 | 0.03 | 2 | 0.04 | ||
| 1093.00-1093.19 | 1,473 | 0.2 | 7 | 0.002 | 69 | 0.3 | 0.2 | 0.02 | 9 | 83 | 0.1 | 0.006 | 0.002 | <DL | 21 | <DL | 0.08 | <DL | 0.7 | 0.3 | 0.4 | 0.01 | 0.03 | 275 | 0.1 | 2 | 0.03 | <DL | 0.004 | 0.02 | 0.5 | 0.05 | 2 | 0.05 | ||||||
| West Moonie 1 | 2263.61-2263.77 | 23 | 0.9 | 3 | 0.02 | 0.01 | 2 | 0.04 | 0.02 | 5 | 59 | 0.01 | 0.004 | <DL | 193 | 0.05 | 6 | 1 | 0.005 | 63 | 3 | <DL | 3 | 0.2 | 0.2 | 44 | 0.04 | 0.03 | <DL | 0.1 | 1 | 0.07 | <DL | 0.02 | 0.01 | 0.05 | 0.07 | 5 | <DL | |
| 2267.05-2267.23 | 25 | 1 | 3 | 0.04 | 0.04 | 57 | 1 | 0.08 | 0.05 | 3 | 1,352 | 0.01 | 0.02 | 0.0008 | 285 | <DL | 43 | 36 | <DL | 2 | 2 | 0.2 | 0.3 | 31 | 0.05 | 0.09 | <DL | 0.1 | 1 | 0.09 | <DL | 0.02 | 0.008 | 0.2 | 0.07 | 5 | 0.01 | |||
| 2267.71-2267.84 | 484 | 0.6 | 33 | 0.7 | 0.4 | 207 | 17 | 0.2 | 0.5 | 4 | 96 | 0.02 | 0.01 | 0.001 | 345 | 0.7 | 28 | <DL | 0.5 | 679 | 34 | <DL | 14 | 2 | 0.4 | <DL | 0.02 | 0.2 | 268 | 0.006 | 18 | 0.1 | <DL | 0.02 | 0.05 | 0.3 | 0.1 | 7 | 0.03 | |
| 2274.10-2274.18 | 22 | 1 | 3 | 0.03 | 0.06 | 2 | 0.03 | 0.02 | 5 | 108 | 0.01 | 0.004 | <DL | 152 | 0.03 | 4 | 3 | 0.002 | <DL | 2 | <DL | 2 | 0.2 | 0.2 | 87 | 0.07 | 0.004 | <DL | 0.08 | 0.7 | 0.02 | <DL | 0.01 | 0.01 | 0.04 | 0.06 | 4 | <DL | ||
| 2281.82-2281.92 | 46 | 1 | 12 | 0.3 | 0.1 | 70 | 6 | 0.08 | 0.2 | 3 | 15 | 0.01 | 0.005 | <DL | 139 | 0.3 | 10 | <DL | 0.2 | 158 | 10 | <DL | 6 | 0.8 | 0.1 | 46 | 0.09 | 0.04 | 15 | <DL | 6 | 0.01 | <DL | 0.02 | 0.03 | 0.1 | 0.05 | 13 | <DL | |
| 2284.13-2284.24 | 29 | 1 | 4 | 0.06 | 0.03 | 2 | 0.03 | 0.03 | 2 | 7 | 0.008 | 0.003 | <DL | 169 | 0.2 | 2 | <DL | 0.09 | 61 | 4 | <DL | 5 | 0.2 | 0.06 | 10 | 0.07 | 0.005 | 8 | 0.02 | 0.8 | <DL | <DL | 0.01 | 0.009 | 0.05 | 0.02 | 5 | <DL | ||
| 2288.49-2288.61 | 19 | 0.4 | 2 | 0.04 | 0.03 | 0.8 | 0.04 | 0.02 | 5 | 4 | 0.005 | 0.002 | <DL | 167 | 0.06 | 0.9 | <DL | 0.01 | 3 | <DL | 3 | 0.1 | 0.05 | 7 | 0.03 | 0.004 | <DL | 0.07 | 0.5 | <DL | <DL | 0.003 | 0.009 | 0.06 | 0.01 | 1 | <DL | |||
| 2294.83-2294.98 | 36 | 0.2 | 1 | 0.02 | 0.01 | 0.5 | 0.07 | 0.02 | 4 | 0.01 | <DL | <DL | 821 | <DL | 5 | <DL | 1 | 2 | 0.2 | 0.2 | <DL | 0.03 | 0.04 | <DL | 0.3 | 1 | 0.03 | <DL | 0.0003 | 0.03 | 0.2 | 0.02 | 0.5 | 0.04 | ||||||
| 2297.19-2297.37 | 145 | 2 | 35 | 0.8 | 0.1 | 270 | 16 | 0.2 | 1 | 6 | 22 | 0.01 | 0.02 | <DL | 487 | 4 | 54 | <DL | 0.3 | 493 | 20 | <DL | 12 | 4 | 0.2 | 176 | 0.3 | 0.2 | <DL | <DL | 18 | 0.04 | <DL | 0.1 | 0.06 | 0.2 | 0.09 | 46 | <DL | |
| 2298.73-2298.82 | 37 | 0.2 | 1 | 0.01 | 0.01 | 0.6 | 0.04 | 0.04 | 3 | 0.01 | <DL | <DL | 411 | <DL | 3 | <DL | 0.7 | 3 | 0.09 | 0.1 | <DL | 0.02 | 0.05 | <DL | 0.2 | 0.6 | 0.01 | <DL | 0.0007 | 0.02 | 0.1 | 0.02 | 1 | 0.03 | ||||||
| 2303.99-2304.14 | 20 | 0.1 | 2 | 0.006 | 0.01 | 0.7 | 0.1 | 0.03 | 9 | 1,271 | 0.006 | 0.01 | <DL | <DL | 31 | 49 | 2 | 1 | 0.07 | 0.1 | <DL | 0.007 | 0.1 | <DL | 0.9 | 0.8 | 0.01 | <DL | <DL | 0.004 | 0.3 | 0.02 | 1 | 0.01 | ||||||
| 2311.19-2311.25 | 16 | 0.1 | 2 | 0.009 | 0.3 | 0.05 | 0.02 | 2 | 469 | 0.007 | 0.005 | <DL | <DL | 15 | 17 | 0.6 | 0.9 | 0.1 | 0.09 | 0.001 | 0.05 | <DL | 0.1 | 0.8 | 0.003 | <DL | 0.007 | 0.1 | 0.01 | 0.4 | 0.009 | |||||||||
| 2314.05-2314.17 | 15 | 0.4 | 2 | 0.009 | 58 | 2 | 0.04 | 0.01 | 15 | 0.004 | <DL | <DL | <DL | 8 | <DL | 2 | 1 | 0.09 | 0.1 | <DL | 0.02 | 0.06 | <DL | 1 | 0.8 | 0.005 | <DL | 0.005 | 0.04 | 0.02 | 4 | 0.01 | ||||||||
| 2319.26-2319.37 | 14 | 0.09 | 3 | 0.009 | 0.6 | 0.03 | 0.01 | 8 | 0.006 | <DL | <DL | <DL | 7 | <DL | 1 | 1 | 0.05 | 0.1 | 0.05 | <DL | 0.6 | 0.7 | 0.003 | <DL | <DL | 0.003 | 0.04 | 0.02 | 2 | 0.003 | ||||||||||
| 2322.61-2322.73 | 13 | 0.09 | 5 | 0.008 | 0.01 | 0.4 | 0.06 | 0.01 | 10 | 70 | 0.01 | 0.006 | <DL | 417 | 0.1 | 5 | 0.3 | 106 | 0.3 | 1 | 0.2 | 0.2 | 0.01 | 0.006 | 15 | 0.3 | 1 | 0.02 | 0.8 | 0.001 | 0.01 | 0.08 | 0.03 | 0.9 | 0.03 | |||||
| 2323.76-2323.95 | 40 | 0.1 | 2 | 0.02 | 0.01 | 0.3 | 0.07 | 0.04 | 3 | 117 | 0.01 | <DL | <DL | 678 | <DL | 6 | <DL | 0.8 | 2 | 0.2 | 0.1 | <DL | 0.01 | 0.06 | <DL | 0.2 | 0.9 | 0.01 | <DL | <DL | 0.02 | 0.2 | 0.02 | 2 | 0.05 | |||||
| 2325.88-2326.00 | 32 | 0.08 | 3 | 0.02 | 0.1 | 0.6 | 0.08 | 0.03 | 3 | 0.01 | 0.004 | <DL | 286 | <DL | 7 | 3 | 0.4 | 0.8 | 16 | 0.09 | 0.2 | <DL | 0.06 | 0.07 | <DL | 0.2 | 0.6 | 0.05 | <DL | 0.005 | 0.04 | 0.3 | 0.03 | 2 | 0.03 | |||||
| 2328.54-2328.59 | 283 | 0.7 | 41 | 0.9 | 0.3 | 212 | 8 | 0.3 | 1 | 13 | 61 | 0.03 | 0.02 | <DL | 270 | 2 | 48 | <DL | 0.07 | 375 | 11 | <DL | 9 | 4 | 0.3 | 42 | 0.19 | 0.3 | 385 | 0.01 | 18 | 0.07 | <DL | 0.06 | 0.1 | 0.4 | 0.09 | 4 | <DL | |
| 2330.41-2330.55 | 8 | 0.1 | 4 | 0.008 | 0.009 | 21 | 0.4 | 0.02 | 0.009 | 18 | <DL | 0.006 | 0.003 | <DL | 0.03 | 1 | <DL | 48 | 0.5 | <DL | 1 | 0.07 | 0.07 | 5 | 0.01 | 0.004 | 8 | 0.8 | 0.5 | 0.002 | <DL | 0.001 | 0.009 | 0.06 | 0.01 | 0.4 | 0.01 | |||
| 2333.23-2333.30 | 25 | 0.05 | 2 | 0.006 | 0.3 | 0.03 | 0.01 | 5 | 0.008 | <DL | <DL | <DL | 5 | <DL | 0.5 | 0.7 | 0.1 | 0.09 | <DL | 0.02 | <DL | 0.3 | 0.9 | 0.009 | <DL | 0.007 | 0.09 | 0.02 | 0.7 | 0.02 | ||||||||||
| 2338.75-2338.85 | 19 | 0.1 | 4 | 0.04 | 0.06 | 0.4 | 0.03 | 0.02 | 8 | <DL | 0.007 | 0.006 | <DL | 207 | 0.1 | 2 | <DL | 0.02 | 79 | 0.4 | <DL | 2 | 0.2 | 0.1 | 8 | 0.02 | 0.006 | <DL | 0.1 | 0.6 | 0.005 | <DL | 0.004 | 0.02 | 0.1 | 0.02 | 4 | <DL | ||
| West Wandoan 1 | 1165.57-1165.65 | 918 | 4 | 16 | 2 | 0.6 | 0.03 | 12 | 40 | 0.05 | 0.06 | <DL | 2,226 | <DL | 0.08 | 581 | 3 | 3 | 0.6 | 0.8 | 1,303 | 0.02 | 0.4 | 287 | 0.1 | 0.9 | 0.08 | <DL | 0.01 | 0.03 | 1 | 0.08 | 4 | 0.03 | ||||||
| 1174.24-1174.33 | 1,431 | 5 | 20 | 1 | 0.5 | 0.04 | 8 | 55 | 0.1 | 0.02 | <DL | 2,811 | 20 | <DL | 0.1 | 641 | 2 | 3 | 2 | 2 | 1,832 | 0.02 | 0.07 | 404 | 0.05 | 1 | 0.3 | <DL | 0.01 | 0.07 | 0.6 | 0.1 | 5 | 0.03 | ||||||
| 1197.76-1197.84 | 556 | 3 | 53 | 3 | 0.8 | 0.03 | 17 | 95 | 0.2 | 0.04 | <DL | 4,978 | 17 | <DL | 0.2 | 732 | 4 | 4 | 0.8 | 2 | 2,770 | 0.06 | 0.2 | 195 | 0.09 | 2 | 0.2 | <DL | 0.03 | 0.05 | 1 | 0.2 | 8 | 0.03 | ||||||
| 1207.61-1207.68 | 284 | 3 | 13 | 0.3 | 0.1 | 315 | 30 | 0.5 | 0.7 | 8 | 180 | 0.04 | 0.08 | 0.0006 | 157 | 0.5 | 104 | 3 | 0.2 | 351 | 36 | <DL | 7 | 2 | 0.6 | 301 | 0.06 | 0.7 | 56 | 0.009 | 11 | 0.08 | <DL | 0.1 | 0.2 | 2 | 0.3 | 63 | 0.03 | |
| 1225.70-1225.80 | 145 | 2 | 10 | 1 | 0.2 | 0.007 | 12 | 105 | 0.06 | 0.01 | <DL | 1,236 | <DL | 0.2 | 323 | 2 | 2 | 0.2 | 1 | 763 | 0.56 | 0.02 | <DL | 0.2 | 0.9 | 0.08 | <DL | 0.02 | 0.03 | 0.2 | 0.07 | 5 | 0.02 | |||||||
| 1229.43-1229.50 | 63 | 2 | 26 | 1 | 0.4 | 0.05 | 12 | 113 | 0.07 | 0.01 | 0.001 | 2,018 | <DL | 0.08 | 439 | 2 | 2 | 0.5 | 0.8 | 1,342 | 0.07 | 0.09 | <DL | 0.3 | 0.9 | 0.07 | <DL | 0.02 | 0.03 | 0.6 | 0.07 | 7 | 0.02 | |||||||
| Woleebee Creek GWB 4 | 1552.63-1553.00 | 321 | 0.1 | 8 | 0.007 | 16 | 2 | 0.2 | 0.02 | 11 | 39 | 0.05 | 0.005 | <DL | <DL | 6 | <DL | 291 | <DL | 1 | 0.1 | 0.8 | 55 | 0.03 | 0.03 | 97 | 0.1 | 1 | 0.07 | <DL | 0.003 | 0.02 | 0.4 | 0.1 | 2 | 0.01 | ||||
| 1570.46-1570.52 | 122 | 0.9 | 6 | 0.04 | 14 | 2 | 0.1 | 0.01 | 3 | 55 | 0.03 | 0.007 | <DL | <DL | 3 | <DL | 0.07 | <DL | <DL | 3 | 0.1 | 0.5 | 111 | 0.04 | 0.04 | <DL | 0.04 | 0.8 | 0.03 | <DL | 0.01 | 0.02 | 0.4 | 0.06 | 12 | 0.01 | ||||
| Medians | All (n=36) | 55 | 0.2 | 4 | 0.01 | 0.01 | 18 | 1 | 0.1 | 0.03 | 6 | 59 | 0.01 | 0.006 | <DL | 181 | <DL | 7 | <DL | 0.01 | 24 | 2 | <DL | 2 | 0.2 | 0.2 | 19 | 0.02 | 0.05 | <DL | 0.1 | 1 | 0.03 | <DL | 0.01 | 0.02 | 0.2 | 0.06 | 4 | 0.02 |
| Sandstones (n=30) | 37 | 0.1 | 3 | 0.009 | 0.01 | 12 | 0.9 | 0.08 | 0.02 | 5 | 57 | 0.01 | 0.005 | <DL | 168 | <DL | 6 | <DL | 0.003 | <DL | 2 | <DL | 2 | 0.2 | 0.2 | 8 | 0.02 | 0.05 | <DL | 0.1 | 0.9 | 0.03 | <DL | 0.004 | 0.02 | 0.2 | 0.04 | 3 | 0.02 | |
| Interbedded (n=6) | 283 | 0.7 | 23 | 0.5 | 0.2 | 241 | 12 | 0.3 | 0.9 | 7 | 60 | 0.03 | 0.01 | 0.0006 | 234 | 1 | 57 | <DL | 0.1 | 363 | 16 | <DL | 10 | 2 | 0.4 | 111 | 0.07 | 0.2 | 154 | 0.008 | 16 | 0.08 | <DL | 0.06 | 0.1 | 0.3 | 0.1 | 19 | 0.03 |
Shading indicates element was below detection limit in given rock samples.
Appendix B.2 Proportions of Elements Extracted from Rocks
Table B7.
Step 1 pH 7 Element extraction (%) relative to whole rock element abundance.
| Well | Depth (mRT) | Al | As | Ba | Be | Bi | Ca | Co | Cr | Cs | Cu | Fe | Ga | Ge | Hf | K | Li | Mg | Mn | Mo | Na | Ni | P | Pb | Rb | REE | S | Sb | Sc | Si | Sn | Sr | Th | Ti | Tl | U | V | Y | Zn | Zr |
| Chinchilla 4 | 1215.47-1215.59 | <DL | 0.06 | 7 | <DL | 10 | 0.5 | <DL | 12 | <DL | <DL | <DL | <DL | <DL | 7 | 17 | 0.3 | <DL | <DL | <DL | 0.03 | 12 | <DL | 21 | <DL | <DL | <DL | <DL | 13 | <DL | <DL | 33 | <DL | <DL | <DL | 0.2 | <DL | |||
| 1218.02-1218.10 | <DL | 0.04 | 3 | 0.03 | <DL | 36 | 0.3 | <DL | 2 | <DL | <DL | <DL | <DL | <DL | <DL | 0.5 | 5 | 1 | <DL | <DL | 0.5 | <DL | 0.007 | 0.9 | <0.001 | 27 | <DL | <DL | <DL | 0.1 | 6 | <DL | <DL | 6 | <DL | <DL | <DL | 0.2 | <DL | |
| Tipton 153 | 1032.35-1032.48 | <DL | 0.2 | 3 | <DL | <DL | 15 | 0.3 | <DL | 7 | <DL | <DL | 0.09 | <DL | <DL | <DL | 7 | <DL | 3 | <DL | <DL | <DL | 0.08 | 8 | 0.008 | <DL | 5 | <DL | <DL | <DL | 16 | <DL | <DL | 12 | <DL | 0.1 | <DL | <DL | <DL | |
| 1033.88-1034.00 | <DL | 0.3 | 2 | <DL | <DL | 17 | 0.9 | <DL | 5 | <DL | <DL | <DL | <DL | <DL | 4 | 1 | 3 | <DL | 0.6 | 100 | 0.7 | <DL | 0.01 | 3 | <DL | 9 | 0.8 | <DL | <DL | <DL | 7 | <DL | <DL | 6 | <DL | 0.006 | <DL | 0.4 | <DL | |
| 1066.00-1066.24 | <DL | 0.2 | 1 | <DL | <DL | 23 | 2 | <DL | 2 | <DL | <DL | <DL | <DL | <DL | 1 | 0.5 | 2 | <DL | 6 | 36 | 0.8 | <DL | 0.02 | 1 | <0.001 | 11 | 1 | <DL | <DL | <DL | 10 | <DL | <DL | 4 | <DL | 0.01 | <DL | 0.4 | <DL | |
| 1067.92-1068.00 | <DL | <DL | 1 | <DL | <DL | 8 | 0.04 | <DL | 3 | <DL | <DL | <DL | <DL | <DL | <DL | <DL | 3 | <DL | <DL | <DL | 0.3 | <DL | <DL | 1 | <DL | <DL | <DL | <DL | <DL | 4 | <DL | <DL | 3 | <DL | <DL | <DL | <DL | <DL | ||
| 1093.00-1093.19 | <DL | 2 | 16 | <DL | 26 | 0.3 | <DL | 7 | <DL | <DL | <DL | <DL | <DL | <DL | 10 | <DL | 0.8 | <DL | 0.04 | 8 | 0.004 | 1 | <DL | <DL | <DL | 18 | <DL | <DL | 23 | <DL | 0.1 | <DL | 0.3 | <DL | ||||||
| West Moonie 1 | 2263.61-2263.77 | <DL | 0.3 | 1 | <DL | <DL | 25 | <DL | 1 | 10 | <DL | 0.01 | 0.1 | <DL | 1 | 0.5 | 2 | 7 | 2 | 12 | 31 | <DL | 0.6 | 0.3 | 0.004 | 23 | 1 | 0.04 | <DL | <DL | 3 | <DL | <DL | 6 | <DL | 0.003 | 0.002 | 20 | <DL | |
| 2267.05-2267.23 | <DL | <DL | 0.9 | <DL | <DL | 6 | 9 | <DL | 1 | 2 | <DL | <DL | <DL | <DL | 1 | <DL | 0.9 | <DL | <DL | 7 | <DL | 0.2 | <DL | 14 | 1 | <DL | <DL | <DL | 2 | <DL | <DL | 4 | <DL | <DL | 0.005 | 5 | 0.008 | |||
| 2267.71-2267.84 | <DL | 0.3 | 3 | <DL | <DL | 30 | 6 | <DL | 2 | <DL | <DL | <DL | 0.1 | 0.02 | 2 | 0.7 | 1 | <DL | 13 | 61 | 5 | <DL | <DL | 2 | 0.002 | <DL | 2 | <DL | <DL | <DL | 19 | <0.001 | <DL | 3 | <DL | 0.009 | <0.001 | <DL | <0.001 | |
| 2274.10-2274.18 | <DL | 0.2 | 1 | 0.3 | <DL | 23 | <DL | 1 | 9 | <DL | 0.01 | 0.1 | <DL | 1 | 0.4 | 2 | 4 | 0.4 | <DL | 21 | <DL | 0.2 | 0.3 | 0.003 | 3 | 2 | 0.06 | <DL | <DL | 2 | <DL | <DL | 3 | <DL | <DL | <DL | 14 | <DL | ||
| 2281.82-2281.92 | <DL | 0.5 | 3 | 0.1 | <DL | 56 | 16 | 0.002 | 2 | 0.3 | <DL | 0.003 | 0.07 | <DL | 0.9 | 0.7 | 1 | <DL | 14 | 23 | 11 | <DL | 0.09 | 0.8 | 0.002 | 14 | 2 | 0.03 | 0.004 | <DL | 8 | <DL | <DL | 4 | <DL | 0.006 | <DL | 5 | <DL | |
| 2284.13-2284.24 | <DL | 1 | 6 | 0.2 | <DL | 11 | <DL | 3 | 0.6 | <DL | 0.01 | 0.2 | <DL | 8 | 0.7 | 0.9 | <DL | 7 | 32 | 7 | <DL | 1 | 1 | 0.003 | 11 | 5 | 0.07 | 0.002 | <DL | 3 | <DL | <DL | 10 | <DL | 0.03 | <DL | 10 | <DL | ||
| 2288.49-2288.61 | <DL | 2 | 4 | <DL | <DL | 11 | <DL | 2 | 6 | <DL | 0.01 | 0.1 | <DL | 8 | 0.6 | 0.5 | <DL | 9 | 9 | <DL | 1 | 0.9 | 0.002 | 9 | 4 | 0.05 | <DL | <DL | 3 | <DL | <DL | 4 | <DL | 0.03 | <DL | 7 | <DL | |||
| 2294.83-2294.98 | 0.3 | 5 | 2 | <DL | <DL | 13 | 0.8 | 6 | 20 | 0.4 | <DL | <DL | 34 | <DL | 5 | <DL | 8 | 2 | 4 | 0.2 | <DL | 8 | <DL | <DL | 1 | 5 | 0.2 | <DL | 0.5 | 1 | 1 | 0.09 | 2 | 0.06 | ||||||
| 2297.19-2297.37 | <DL | 0.4 | 2 | <DL | <DL | 44 | 12 | 0.01 | 1 | 0.03 | <DL | 0.004 | 0.2 | <DL | 2 | 2 | 1 | <DL | 6 | 53 | 6 | <DL | 0.01 | 2 | <0.001 | 14 | 4 | <DL | <DL | <DL | 7 | <DL | <DL | 7 | 0.01 | 0.01 | 0.07 | 1 | <DL | |
| 2298.73-2298.82 | 0.1 | 4 | 2 | <DL | <DL | 7 | 0.3 | 4 | 8 | 0.3 | <DL | <DL | 16 | <DL | 2 | <DL | 4 | 1 | 1 | 0.2 | <DL | 4 | <DL | <DL | <DL | 3 | 0.2 | <DL | 1 | 0.5 | 0.6 | 0.1 | 2 | 0.04 | ||||||
| 2303.99-2304.14 | 0.1 | <DL | 3 | 0.2 | <DL | 7 | 0.2 | 5 | 13 | <DL | 0.06 | <DL | <DL | <DL | 2 | <DL | 6 | 0.4 | 2 | 0.06 | <DL | <DL | <DL | <DL | 0.4 | 7 | 0.1 | <DL | <DL | 0.1 | 0.3 | 0.07 | 4 | 0.03 | ||||||
| 2311.19-2311.25 | 0.07 | 3 | 3 | <DL | 8 | <DL | 5 | 12 | <DL | 0.08 | <DL | <DL | <DL | 6 | <DL | 6 | 0.4 | 3 | 0.05 | <DL | <DL | <DL | <DL | 5 | <DL | <DL | 0.2 | 0.4 | 0.06 | 2 | 0.02 | |||||||||
| 2314.05-2314.17 | 0.1 | 6 | 3 | <DL | 21 | 6 | 0.4 | 5 | 21 | <DL | <DL | <DL | <DL | 9 | <DL | 6 | 0.7 | 4 | 0.08 | <DL | 5 | <DL | <DL | 0.2 | 8 | <DL | <DL | 0.2 | 0.5 | 0.05 | 18 | 0.06 | ||||||||
| 2319.26-2319.37 | <DL | 6 | 4 | <DL | 5 | <DL | 4 | 11 | 0.03 | <DL | <DL | <DL | 5 | <DL | 3 | 0.1 | 2 | 0.02 | <DL | <DL | <DL | 6 | <DL | <DL | <DL | 0.1 | 0.4 | <DL | 6 | <DL | ||||||||||
| 2322.61-2322.73 | <DL | 5 | 6 | <DL | <DL | 32 | 0.2 | 3 | 14 | <DL | 0.2 | 0.6 | <DL | 32 | 0.9 | 3 | 3 | 64 | 4 | 1 | 3 | 0.3 | 4 | 0.4 | 0.004 | 0.6 | 7 | 0.3 | 0.1 | 4 | 0.3 | 0.5 | 0.1 | 7 | 0.05 | |||||
| 2323.76-2323.95 | 0.2 | 5 | 2 | <DL | <DL | 8 | 0.5 | 4 | 9 | <DL | 0.3 | <DL | <DL | 20 | <DL | 4 | <DL | 6 | 1 | 3 | 0.2 | <DL | 4 | <DL | <DL | 0.7 | 5 | 0.2 | <DL | <DL | 0.4 | 1 | 0.2 | 5 | 0.1 | |||||
| 2325.88-2326.00 | 0.09 | 2 | 3 | <DL | <DL | 14 | 0.2 | 4 | 5 | 0.1 | <DL | <DL | 16 | <DL | 2 | <DL | 19 | 6 | 0.6 | 1 | 0.03 | <DL | 9 | <DL | <DL | 0.4 | 2 | 0.05 | <DL | 9 | 0.1 | 0.4 | 0.03 | 3 | 0.01 | |||||
| 2328.54-2328.59 | <DL | 1 | 3 | 0.02 | <DL | 33 | 0.6 | <DL | 1 | 0.09 | <DL | 0.003 | 0.09 | <DL | 1 | 0.5 | 1 | <DL | 9 | 35 | 1 | <DL | 0.002 | 2 | 0.001 | 6 | 8 | 0.04 | 0.02 | <DL | 6 | <DL | <DL | 3 | <DL | 0.01 | <0.001 | <DL | <DL | |
| 2330.41-2330.55 | <DL | 4 | 4 | <DL | <DL | 9 | 20 | 0.08 | 2 | 23 | <DL | 0.09 | 0.2 | <DL | 0.6 | 2 | <DL | 21 | 7 | <DL | 0.8 | 2 | 0.09 | 11 | 3 | 0.2 | 0.002 | 0.2 | 4 | 0.09 | <DL | 4 | 0.1 | 0.4 | 0.04 | 3 | 0.04 | |||
| 2333.23-2333.30 | 0.3 | 5 | 3 | <DL | 10 | 0.4 | 4 | 38 | 0.6 | <DL | <DL | <DL | 8 | <DL | 9 | 3 | 6 | 0.2 | <DL | <DL | <DL | 1 | 10 | 0.4 | <DL | 0.5 | 2 | 0.2 | 5 | 0.1 | ||||||||||
| 2338.75-2338.85 | <DL | 0.8 | 5 | 0.2 | <DL | 10 | 0.002 | 3 | 9 | <DL | 0.02 | 0.2 | <DL | 14 | 0.7 | 1 | <DL | 16 | 41 | 3 | <DL | 0.2 | 2 | 0.002 | 27 | 4 | 0.06 | <DL | <DL | 3 | <DL | <DL | 6 | <DL | 0.05 | <DL | 23 | <DL | ||
| West Wandoan 1 | 1165.57-1165.65 | <DL | 3 | 6 | 22 | <DL | 8 | 5 | <DL | 0.08 | <DL | <DL | 67 | <DL | 19 | 81 | 11 | 0.3 | 12 | 0.07 | 67 | 4 | <DL | <DL | 0.04 | 5 | <DL | <DL | 15 | 0.1 | 0.3 | <DL | 3 | <DL | ||||||
| 1174.24-1174.33 | <DL | 2 | 21 | 3 | <DL | 8 | 0.7 | <DL | 0.05 | <DL | <DL | 61 | 9 | <DL | 17 | 58 | 3 | 0.1 | 19 | 0.08 | 85 | 3 | <DL | <DL | <DL | 5 | <DL | <DL | 11 | 0.2 | 0.2 | 0.02 | 0.2 | <DL | ||||||
| 1197.76-1197.84 | <DL | 0.9 | 45 | 16 | <DL | 8 | 4 | <DL | 0.1 | <DL | <DL | 80 | 6 | <DL | 30 | 78 | 7 | 0.02 | 27 | 0.004 | 88 | 10 | <DL | <DL | <DL | 9 | <DL | <DL | 32 | <DL | 0.2 | <DL | 5 | 0.005 | ||||||
| 1207.61-1207.68 | <DL | 0.08 | 1 | <DL | <DL | 35 | 41 | <DL | 1 | <DL | <DL | <DL | <DL | <DL | 1 | 0.4 | 4 | 12 | 2 | 36 | 20 | <DL | <DL | 1 | <0.001 | 27 | 0.9 | <DL | <DL | <DL | 5 | <DL | <DL | 10 | <DL | 0.008 | <DL | 8 | <DL | |
| 1225.70-1225.80 | <DL | 2 | 6 | 12 | <DL | 7 | 13 | <DL | 0.1 | <DL | <DL | 63 | <DL | 26 | 51 | 8 | 0.03 | 9 | <DL | 99 | 12 | <DL | <DL | <DL | 6 | <DL | <DL | 30 | <DL | 0.3 | <DL | 2 | <DL | |||||||
| 1229.43-1229.50 | 0.07 | 2 | 2 | 13 | 0.4 | 5 | 12 | <DL | 0.2 | <DL | 0.2 | 69 | <DL | 23 | 57 | 14 | 0.6 | 19 | 0.2 | 91 | 13 | <DL | <DL | 0.3 | 6 | 0.3 | <DL | 28 | 0.1 | 0.7 | 0.09 | 3 | 0.06 | |||||||
| Woleebee Creek GWB 4 | 1552.63-1553.00 | <DL | 6 | 8 | <DL | 7 | 9 | <DL | 9 | 0.8 | <DL | 0.3 | <DL | <DL | <DL | 16 | <DL | 99 | <DL | 0.08 | 10 | <DL | 22 | 5 | 0.3 | <DL | 0.09 | 13 | <DL | <DL | 28 | <DL | 1 | <DL | 3 | <DL | ||||
| 1570.46-1570.52 | <DL | 0.9 | 10 | <DL | 6 | 20 | <DL | 4 | 0.8 | <DL | 0.06 | <DL | <DL | <DL | 4 | <DL | 18 | <DL | <DL | 0.04 | 3 | <DL | 26 | 5 | <DL | <DL | <DL | 4 | <DL | <DL | 18 | <DL | 0.09 | <DL | 12 | <DL | ||||
| Medians | All (n=36) | <DL | 0.4 | 3 | <DL | <DL | 6 | 10 | <DL | 4 | 4 | <DL | 0.02 | <DL | <DL | 1 | <DL | 3 | <DL | 1 | 6 | 6 | <DL | 0.1 | 2 | 0.003 | 10 | 3 | <DL | <DL | <DL | 6 | <DL | <DL | 5 | <DL | 0.1 | <DL | 3 | <DL |
| Sandstones (n=30) | <DL | 0.8 | 3 | <DL | <DL | 4 | 10 | <DL | 4 | 7 | <DL | 0.06 | <DL | <DL | 1 | <DL | 3 | <DL | 0.5 | <DL | 6 | <DL | 0.2 | 3 | 0.006 | 9 | 4 | <DL | <DL | <DL | 5 | <DL | <DL | 5 | <DL | 0.2 | <DL | 4 | <DL | |
| Interbedded (n=6) | <DL | 0.3 | 2 | <DL | <DL | 34 | 4 | <DL | 2 | <DL | <DL | <DL | 0.04 | <DL | 1 | 0.5 | 1 | <DL | 6 | 36 | 3 | <DL | 0.005 | 2 | <0.001 | 13 | 2 | <DL | <DL | <DL | 7 | <DL | <DL | 5 | <DL | 0.01 | <0.001 | 0.3 | <DL |
Shading indicates element was below detection limit in given rock samples.
Table B8.
Step 2 pH 5 Element extraction (%) relative to whole rock element abundance.
| Well | Depth (mRT) | Al | As | Ba | Be | Bi | Ca | Co | Cr | Cs | Cu | Fe | Ga | Ge | Hf | K | Li | Mg | Mn | Mo | Na | Ni | P | Pb | Rb | REE | S | Sb | Sc | Si | Sn | Sr | Th | Ti | Tl | U | V | Y | Zn | Zr |
| Chinchilla 4 | 1215.47-1215.59 | 6 | 0.9 | 20 | <DL | 6 | 7 | 13 | 4 | 32 | 2 | 1 | 4 | <DL | <DL | 7 | 4 | 0.2 | <DL | <DL | 9 | 2 | 3 | 7 | 2 | 6 | 0.06 | 0.9 | 9 | 4 | <DL | 15 | 6 | 0.7 | 4 | 12 | 0.05 | |||
| 1218.02-1218.10 | 0.06 | 1 | 2 | 5 | 10 | 16 | 2 | 0.2 | 3 | 7 | 0.1 | 0.05 | 0.2 | 0.02 | <DL | <DL | 2 | 2 | 0.09 | <DL | 2 | <DL | 12 | 0.3 | 0.2 | 6 | 3 | 0.6 | <DL | 0.1 | 3 | 0.3 | <DL | 4 | 2 | 0.03 | 0.3 | 5 | 0.03 | |
| Tipton 153 | 1032.35-1032.48 | 6 | 36 | 10 | 15 | 7 | 17 | 31 | 6 | 2 | 33 | 12 | 2 | 1 | <DL | 3 | 10 | <DL | 7 | <DL | 10 | <DL | 33 | 0.8 | 1 | <DL | 12 | 5 | 0.04 | 2 | 10 | 2 | <DL | 10 | 2 | 6 | 2 | 31 | 0.09 | |
| 1033.88-1034.00 | 1 | 15 | 6 | 13 | 27 | 15 | 14 | 2 | 4 | 16 | 0.6 | 0.2 | 0.6 | <DL | <DL | 3 | 2 | <DL | 2 | <DL | 9 | <DL | 32 | 0.7 | 0.4 | <DL | 4 | 2 | 0.06 | 0.3 | 5 | 0.7 | <DL | 6 | 2 | 0.8 | 0.5 | 25 | 0.02 | |
| 1066.00-1066.24 | 0.2 | 12 | 3 | 7 | 26 | 26 | 25 | 0.3 | 3 | 28 | 0.3 | 0.04 | 0.06 | 0.008 | <DL | 0.9 | 1 | <DL | 4 | <DL | 8 | <DL | 40 | 0.7 | 0.1 | <DL | 6 | 0.8 | 0.05 | 0.1 | 10 | 0.6 | <DL | 2 | 1 | 0.3 | 0.2 | 18 | 0.02 | |
| 1067.92-1068.00 | 0.3 | 1 | 0.9 | 4 | 13 | 6 | 2 | 0.5 | 0.7 | 8 | 0.4 | 0.08 | 0.3 | 0.03 | <DL | <DL | 2 | 1 | 0.2 | <DL | 4 | <DL | 9 | 0.1 | 0.07 | 2 | 1 | <DL | 0.5 | 1 | 0.2 | <DL | 0.4 | 0.8 | 0.2 | 0.1 | 4 | 0.03 | ||
| 1093.00-1093.19 | 14 | 47 | 9 | 12 | 5 | 27 | 6 | 2 | 42 | 12 | 3 | 2 | 0.2 | <DL | 6 | <DL | 37 | <DL | 19 | 1 | 1 | 6 | 4 | 0.05 | 4 | 4 | 2 | <DL | 5 | 3 | 7 | 2 | 19 | 0.2 | ||||||
| West Moonie 1 | 2263.61-2263.77 | 0.06 | 26 | 0.6 | 8 | 32 | 15 | 0.2 | 0.3 | 45 | 2 | 0.1 | 0.7 | <DL | <DL | 0.3 | <DL | <DL | <DL | <DL | 16 | <DL | 32 | 0.06 | 0.8 | <DL | 8 | 0.9 | <DL | 3 | 0.9 | 2 | <DL | 0.3 | 1 | 0.2 | 0.9 | 10 | <DL | |
| 2267.05-2267.23 | 0.05 | 19 | 0.6 | 5 | 24 | 8 | 12 | 0.1 | 0.6 | 29 | 6 | 0.07 | 0.6 | <DL | <DL | <DL | 3 | 5 | <DL | 13 | 13 | 0.03 | 0.2 | <DL | 4 | 2 | <DL | 3 | 0.6 | 1 | <DL | <DL | 0.5 | 0.2 | 0.3 | 6 | 0.02 | |||
| 2267.71-2267.84 | 0.3 | 11 | 6 | 11 | 39 | 22 | 38 | 0.3 | 1 | 16 | 0.9 | 0.04 | 0.2 | <DL | <DL | 0.1 | 0.3 | <DL | 1 | <DL | 37 | <DL | 40 | <DL | 0.1 | <DL | <DL | 1 | 0.05 | 0.06 | 10 | 0.6 | <DL | <DL | 0.8 | 0.2 | 0.3 | 7 | 0.02 | |
| 2274.10-2274.18 | 0.07 | 21 | 0.6 | 5 | 54 | 12 | 0.2 | 0.3 | 40 | 2 | 0.1 | 0.5 | <DL | <DL | 0.04 | <DL | <DL | <DL | <DL | 10 | <DL | 19 | 0.05 | 0.4 | 4 | 12 | <DL | <DL | 3 | 1 | 0.6 | <DL | 0.06 | 1 | 0.2 | 0.8 | 7 | <DL | ||
| 2281.82-2281.92 | 0.07 | 25 | 2 | 12 | 48 | 27 | 31 | 0.09 | 1 | 21 | 0.6 | 0.04 | 0.2 | <DL | <DL | 0.5 | 0.5 | <DL | 6 | <DL | 34 | <DL | 37 | 0.2 | 0.07 | <DL | 12 | 0.4 | <DL | <DL | 4 | 0.1 | <DL | 1 | 1 | 0.1 | 0.1 | 18 | <DL | |
| 2284.13-2284.24 | 0.09 | 41 | 2 | 11 | 23 | 19 | 0.2 | 0.8 | 10 | 1 | 0.06 | 0.8 | <DL | <DL | 0.4 | <DL | <DL | 8 | <DL | 25 | <DL | 61 | 0.2 | 0.2 | <DL | 10 | <DL | <DL | 0.5 | 0.8 | <DL | <DL | <DL | 1 | 0.3 | 0.2 | 13 | <DL | ||
| 2288.49-2288.61 | 0.07 | 41 | 1 | 9 | 48 | 30 | 0.2 | 0.5 | 57 | 0.8 | 0.04 | 0.7 | <DL | <DL | 0.2 | <DL | <DL | <DL | 28 | <DL | 42 | 0.2 | 0.2 | <DL | 7 | <DL | <DL | 3 | 0.8 | <DL | <DL | <DL | 1 | 0.3 | 0.2 | 8 | <DL | |||
| 2294.83-2294.98 | 0.1 | 15 | 0.9 | 6 | 19 | 24 | 0.2 | <DL | 35 | 0.06 | <DL | <DL | <DL | <DL | <DL | <DL | 16 | 31 | 0.2 | 0.08 | <DL | 7 | 3 | <DL | 10 | 0.5 | 0.05 | <DL | <DL | 1 | 0.5 | 0.1 | 2 | 0.008 | ||||||
| 2297.19-2297.37 | 0.07 | 7 | 6 | 5 | 6 | <DL | 22 | 0.05 | 3 | 8 | 0.3 | 0.01 | 0.1 | <DL | <DL | 0.5 | 0.08 | <DL | 4 | <DL | 13 | <DL | 20 | 0.9 | 0.04 | <DL | 5 | 0.3 | <DL | <DL | 8 | 0.07 | <DL | 5 | 0.6 | 0.03 | 0.2 | 9 | <DL | |
| 2298.73-2298.82 | 0.08 | 17 | 0.9 | 2 | 20 | 15 | 0.1 | 2 | 41 | 0.1 | <DL | <DL | <DL | <DL | <DL | <DL | 15 | 38 | 0.1 | 0.1 | <DL | 4 | 4 | <DL | 9 | 0.6 | 0.08 | <DL | <DL | 1 | 0.4 | 0.2 | 5 | 0.01 | ||||||
| 2303.99-2304.14 | 0.2 | 19 | 1 | <DL | 19 | 49 | 2 | 4 | 60 | 32 | 0.1 | 2 | <DL | <DL | 12 | 21 | 27 | 27 | <DL | 0.2 | <DL | 7 | 7 | <DL | 24 | 0.9 | 0.1 | <DL | <DL | 0.5 | 1 | 0.6 | 6 | 0.01 | ||||||
| 2311.19-2311.25 | 0.2 | 9 | 0.4 | 1 | 12 | 0.5 | <DL | 17 | 28 | 0.05 | <DL | <DL | <DL | 9 | 20 | 12 | 19 | 0.3 | 0.08 | 1 | 5 | <DL | 6 | 0.7 | 0.04 | <DL | 0.7 | 0.4 | 0.1 | 0.7 | 0.005 | |||||||||
| 2314.05-2314.17 | 0.5 | 23 | 2 | 2 | <DL | 19 | 1 | <DL | 51 | 0.2 | <DL | <DL | <DL | 3 | <DL | 31 | 25 | 0.3 | 0.5 | <DL | 10 | 17 | <DL | 20 | 1 | 0.4 | <DL | 0.8 | 0.7 | 1 | 14 | 0.02 | ||||||||
| 2319.26-2319.37 | 0.4 | 17 | 2 | 4 | 41 | 1 | <DL | 52 | 0.1 | <DL | <DL | <DL | 3 | <DL | 22 | 23 | <DL | 0.4 | 11 | <DL | 46 | 0.8 | 0.2 | <DL | <DL | 0.5 | 0.9 | 0.9 | 9 | 0.01 | ||||||||||
| 2322.61-2322.73 | 0.1 | 13 | 3 | 7 | 16 | 19 | 0.4 | 0.5 | 59 | 8 | 0.2 | 1 | <DL | <DL | 0.6 | 2 | <DL | <DL | 8 | 31 | 0.2 | 0.3 | 4 | <DL | <DL | 10 | 1 | 0.3 | <DL | <DL | 2 | 0.6 | 0.4 | 5 | <DL | |||||
| 2323.76-2323.95 | 0.07 | 18 | 1 | 4 | 20 | 23 | 0.2 | 3 | 49 | 8 | 0.1 | <DL | <DL | <DL | <DL | 2 | <DL | 19 | 40 | 0.1 | 0.1 | <DL | 3 | 5 | <DL | 8 | 0.6 | 0.08 | <DL | <DL | 2 | 0.7 | 0.2 | 7 | 0.007 | |||||
| 2325.88-2326.00 | 0.09 | 6 | 1 | 6 | 36 | 28 | 0.1 | 2 | 42 | 0.06 | 0.4 | <DL | <DL | <DL | 2 | 14 | 22 | 19 | 31 | 0.09 | 0.07 | <DL | 14 | 2 | <DL | 3 | 0.4 | 0.09 | <DL | <DL | 1 | 0.9 | 0.2 | 5 | 0.003 | |||||
| 2328.54-2328.59 | 0.1 | 13 | 7 | 10 | 55 | 36 | 23 | 0.2 | 3 | 26 | 0.5 | 0.03 | 0.2 | <DL | <DL | 1 | 1 | <DL | 0.9 | <DL | 20 | <DL | 24 | 0.8 | 0.08 | 5 | 15 | 0.8 | 0.06 | 0.2 | 7 | 0.1 | <DL | 4 | 1 | 0.1 | 0.1 | 7 | <DL | |
| 2330.41-2330.55 | 0.1 | 17 | 2 | 5 | 17 | 3 | 16 | 0.3 | 0.4 | 68 | <DL | 0.1 | 0.8 | <DL | 0.4 | <DL | <DL | <DL | 20 | <DL | 24 | 0.2 | 0.2 | <DL | 4 | <DL | <DL | 17 | 0.7 | <DL | <DL | <DL | 1 | 0.4 | 0.3 | 2 | <DL | |||
| 2333.23-2333.30 | 0.3 | 6 | 0.9 | 1 | 37 | <DL | <DL | 50 | 0.3 | <DL | <DL | <DL | <DL | <DL | 21 | 32 | 0.1 | 0.2 | <DL | 5 | <DL | 14 | 0.6 | 0.1 | <DL | 0.8 | 0.6 | 0.6 | 0.8 | <DL | ||||||||||
| 2338.75-2338.85 | 0.1 | 18 | 2 | 9 | 71 | 16 | 0.3 | 1 | 66 | <DL | 0.1 | 0.7 | <DL | <DL | 0.7 | <DL | <DL | <DL | <DL | 10 | <DL | 37 | 0.4 | 0.2 | <DL | 7 | <DL | <DL | 4 | 0.9 | 0.2 | <DL | <DL | 3 | 0.5 | 0.4 | 22 | <DL | ||
| West Wandoan 1 | 1165.57-1165.65 | 6 | 7 | 2 | 29 | 7 | 2 | 52 | 7 | 2 | 5 | <DL | <DL | <DL | 11 | <DL | 21 | 32 | 0.8 | 3 | 2 | 7 | 3 | 0.04 | 3 | 1 | 3 | <DL | 4 | 4 | 4 | 2 | 19 | 0.06 | ||||||
| 1174.24-1174.33 | 5 | 9 | 8 | 30 | 4 | 3 | 42 | 5 | 2 | 4 | <DL | <DL | 2 | <DL | 10 | <DL | 21 | 34 | 2 | 3 | 3 | 5 | 3 | 0.05 | 1 | 2 | 4 | <DL | 6 | 5 | 3 | 2 | 15 | 0.02 | ||||||
| 1197.76-1197.84 | 4 | 4 | 9 | 39 | 6 | 2 | 63 | 14 | 2 | 7 | <DL | <DL | 1 | <DL | 15 | <DL | 41 | 42 | 2 | 4 | 0.7 | 15 | 4 | 0.03 | 2 | 3 | 4 | <DL | 9 | 5 | 3 | 3 | 30 | 0.1 | ||||||
| 1207.61-1207.68 | 0.09 | 19 | 3 | 13 | 33 | 20 | 28 | 0.2 | 3 | 22 | 1 | 0.07 | 0.3 | 0.009 | <DL | 0.2 | 2 | <DL | 4 | <DL | 20 | <DL | 16 | 0.5 | 0.2 | 4 | 4 | 1 | <DL | 0.09 | 3 | 0.2 | <DL | 7 | 2 | 0.6 | 0.7 | 22 | 0.009 | |
| 1225.70-1225.80 | 1 | 5 | 4 | 34 | 3 | <DL | 54 | 19 | 2 | 5 | <DL | <DL | <DL | 21 | <DL | 22 | 36 | <DL | 4 | <DL | 31 | 2 | <DL | 8 | 1 | 4 | <DL | 7 | 5 | 2 | 1 | 27 | 0.05 | |||||||
| 1229.43-1229.50 | 0.5 | 5 | 0.5 | 31 | 4 | <DL | 39 | 14 | 0.8 | 4 | <DL | <DL | <DL | 13 | <DL | 24 | 30 | 0.4 | 2 | <DL | 25 | 3 | <DL | 8 | 2 | 2 | <DL | 6 | 1 | 1 | 1 | 29 | 0.05 | |||||||
| Woleebee Creek GWB 4 | 1552.63-1553.00 | 7 | 63 | 16 | 37 | 4 | 41 | 8 | 2 | 45 | 11 | 2 | 6 | <DL | <DL | 7 | <DL | <DL | <DL | 31 | 0.5 | 5 | <DL | 7 | 4 | 0.02 | 4 | 4 | 4 | <DL | 9 | 4 | 7 | 4 | 34 | 0.05 | ||||
| 1570.46-1570.52 | 0.4 | 36 | 7 | 44 | 3 | 29 | 1 | 1 | 25 | 5 | 0.3 | 0.8 | <DL | <DL | <DL | <DL | 16 | <DL | <DL | 24 | 0.2 | 0.8 | <DL | 13 | 2 | <DL | 1 | 0.8 | 0.6 | <DL | 4 | 2 | 1 | 1 | 34 | 0.04 | ||||
| Medians | All (n=36) | 0.2 | 16 | 2 | 5 | 19 | 2 | 25 | 0.3 | 1 | 40 | 1 | 0.1 | 0.6 | <DL | <DL | <DL | 1 | <DL | 0.2 | <DL | 18 | <DL | 31 | 0.2 | 0.2 | <DL | 6 | 2 | <DL | 3 | 1 | 0.3 | <DL | 0.4 | 1 | 0.6 | 0.5 | 9 | 0.01 |
| Sandstones (n=30) | 0.2 | 17 | 2 | 4 | 18 | 0.3 | 26 | 0.5 | 0.9 | 42 | 2 | 0.1 | 0.7 | <DL | <DL | <DL | 1 | <DL | <DL | <DL | 18 | <DL | 31 | 0.2 | 0.4 | <DL | 7 | 3 | <DL | 4 | 0.9 | 0.3 | <DL | 0.03 | 1 | 0.7 | 0.6 | 11 | 0.01 | |
| Interbedded (n=6) | 0.1 | 11 | 4 | 9 | 30 | 21 | 24 | 0.2 | 3 | 19 | 0.4 | 0.04 | 0.2 | 0.004 | <DL | 0.4 | 1 | <DL | 3 | <DL | 17 | <DL | 22 | 0.6 | 0.1 | 2 | 5 | 0.8 | 0.02 | 0.09 | 8 | 0.2 | <DL | 4 | 1 | 0.1 | 0.2 | 8 | 0.01 |
Shading indicates element was below detection limit in given rock samples.
Table B9.
Step 3 pH 3 Element extraction (%) relative to whole rock element abundance.
| Well | Depth (mRT) | Al | As | Ba | Be | Bi | Ca | Co | Cr | Cs | Cu | Fe | Ga | Ge | Hf | K | Li | Mg | Mn | Mo | Na | Ni | P | Pb | Rb | REE | S | Sb | Sc | Si | Sn | Sr | Th | Ti | Tl | U | V | Y | Zn | Zr |
| Chinchilla 4 | 1215.47-1215.59 | 7 | 0.2 | 2 | <DL | 3 | 7 | 12 | 2 | 12 | 8 | 3 | 11 | <DL | <DL | 6 | 9 | <DL | <DL | <DL | 7 | 2 | 2 | <DL | <DL | 5 | 0.05 | 0.1 | 2 | 2 | <DL | 4 | 3 | 1 | 2 | 10 | 0.01 | |||
| 1218.02-1218.10 | 0.04 | 0.1 | 0.1 | 3 | 4 | <DL | 0.7 | 0.08 | 0.4 | 3 | 0.3 | 0.04 | <DL | <DL | <DL | <DL | <DL | 1 | <DL | <DL | 0.8 | <DL | 3 | 0.09 | 0.03 | <DL | 0.3 | 0.3 | <DL | 0.04 | 0.1 | 0.09 | <DL | 0.8 | 0.4 | 0.04 | 0.06 | 2 | 0.001 | |
| Tipton 153 | 1032.35-1032.48 | 2 | 6 | 0.7 | 4 | <DL | 3 | 11 | 1 | <DL | 8 | 6 | 2 | 0.7 | <DL | <DL | 3 | <DL | 0.5 | <DL | 5 | <DL | 6 | 0.5 | 0.3 | <DL | 3 | 1 | 0.01 | 0.2 | 0.7 | 0.2 | <DL | 2 | 0.9 | 2 | 0.5 | 9 | 0.003 | |
| 1033.88-1034.00 | 0.8 | 2 | 0.4 | 9 | 9 | 9 | 4 | 0.8 | 0.8 | 7 | 2 | 0.4 | 0.8 | <DL | <DL | <DL | 1 | <DL | <DL | <DL | 4 | <DL | 9 | 0.4 | 0.2 | <DL | 0.7 | 0.9 | 0.04 | 0.07 | 0.5 | 0.3 | <DL | 2 | 0.7 | 1 | 0.2 | 6 | <0.001 | |
| 1066.00-1066.24 | 0.2 | 2 | 0.3 | 6 | 10 | 0.8 | 13 | 0.1 | 0.3 | 9 | 0.4 | 0.07 | 0.1 | <DL | <DL | 0.4 | 0.2 | <DL | <DL | <DL | 6 | <DL | 6 | 0.2 | 0.04 | <DL | 1 | 0.4 | 0.04 | 0.03 | 0.4 | 0.2 | <DL | 0.7 | 0.3 | 0.4 | 0.06 | 7 | <0.001 | |
| 1067.92-1068.00 | 0.2 | <DL | 0.3 | 5 | 6 | 11 | 6 | 2 | 0.5 | 2 | 8 | 0.2 | 6 | <DL | <DL | <DL | 6 | 8 | <DL | <DL | 6 | <DL | 6 | 0.2 | 0.07 | 1 | 4 | <DL | 0.1 | 0.4 | 0.2 | <DL | <DL | 0.3 | 3 | 0.2 | 3 | 0.005 | ||
| 1093.00-1093.19 | 3 | 7 | 1 | <DL | 3 | 11 | 2 | <DL | 14 | 6 | 2 | 0.8 | <DL | <DL | 3 | <DL | 2 | <DL | 4 | 0.9 | 0.07 | 1 | 0.5 | 0.01 | 0.4 | 0.7 | 0.08 | <DL | <DL | 1 | 2 | 0.1 | 7 | 0.005 | ||||||
| West Moonie 1 | 2263.61-2263.77 | 0.03 | 3 | 0.05 | <DL | <DL | 1 | 0.2 | <DL | 3 | 2 | 0.07 | 0.4 | <DL | <DL | <DL | 0.7 | <DL | <DL | <DL | 1 | <DL | 3 | 0.02 | 0.2 | <DL | 1 | 0.5 | <DL | 0.4 | 0.1 | 0.6 | <DL | <DL | 0.3 | 0.2 | 0.2 | 1 | <DL | |
| 2267.05-2267.23 | 0.02 | 4 | 0.06 | 2 | 9 | 3 | 3 | 0.5 | 0.6 | 4 | 1 | 0.1 | 1 | 0.05 | <DL | <DL | 0.7 | 0.9 | <DL | 4 | 2 | 0.02 | 0.3 | <DL | 2 | 1 | <DL | 0.3 | 0.1 | 1 | <DL | 0.04 | 0.3 | 0.8 | 0.6 | 1 | 0.002 | |||
| 2267.71-2267.84 | 0.1 | 0.3 | 0.04 | 0.4 | 0.6 | <DL | 0.2 | 0.04 | 0.01 | 1 | 0.9 | 0.02 | 0.1 | <DL | <DL | <DL | 0.3 | <DL | 0.01 | <DL | 0.2 | <DL | 0.6 | 0.007 | 0.06 | <DL | 0.4 | 0.1 | 0.04 | 0.03 | 0.09 | 0.07 | <DL | <DL | 0.2 | 0.07 | 0.1 | 0.2 | <0.001 | |
| 2274.10-2274.18 | 0.03 | 2 | 0.06 | 2 | <DL | 1 | 0.1 | <DL | 3 | 2 | 0.09 | 0.2 | <DL | <DL | <DL | <DL | <DL | <DL | <DL | 0.8 | <DL | 3 | 0.02 | 0.2 | <DL | 1 | 0.3 | <DL | 0.4 | 0.08 | 0.4 | <DL | <DL | 0.4 | 0.1 | 0.3 | 0.8 | <DL | ||
| 2281.82-2281.92 | 0.02 | 2 | 0.05 | 5 | <DL | <DL | 3 | 0.05 | 0.08 | 1 | <DL | 0.03 | 0.07 | <DL | <DL | 0.4 | <DL | <DL | 0.6 | <DL | 2 | <DL | 1 | 0.04 | 0.01 | <DL | 0.4 | 0.1 | <DL | <DL | 0.06 | <DL | <DL | 0.09 | 0.1 | 0.1 | 0.01 | 2 | <DL | |
| 2284.13-2284.24 | 0.03 | 2 | 0.09 | 4 | <DL | 2 | 0.1 | <DL | 0.5 | <DL | 0.09 | <DL | <DL | <DL | 0.9 | <DL | <DL | <DL | <DL | 2 | <DL | 2 | <DL | 0.02 | <DL | 1 | 0.2 | <DL | <DL | 0.06 | <DL | <DL | <DL | 0.2 | 0.1 | 0.04 | 2 | <DL | ||
| 2288.49-2288.61 | 0.02 | 3 | 0.09 | 2 | <DL | 3 | 0.1 | <DL | 3 | <DL | 0.05 | <DL | <DL | <DL | <DL | <DL | <DL | <DL | 3 | <DL | 1 | <DL | 0.02 | <DL | 0.9 | 0.2 | <DL | 0.5 | 0.07 | <DL | <DL | <DL | 0.1 | 0.2 | 0.04 | 1 | <DL | |||
| 2294.83-2294.98 | 0.1 | 3 | 0.1 | 3 | <DL | 3 | 0.2 | <DL | 3 | 0.1 | <DL | <DL | <DL | <DL | <DL | <DL | 3 | 2 | <DL | 0.07 | <DL | 4 | <DL | <DL | 1 | 0.08 | 0.1 | <DL | <DL | 0.5 | 0.5 | 0.1 | 0.5 | <DL | ||||||
| 2297.19-2297.37 | 0.03 | 4 | 1 | 5 | 7 | 52 | 9 | 0.1 | 0.3 | 5 | <DL | 0.01 | 0.3 | <DL | <DL | 0.4 | 1 | <DL | 0.1 | <DL | 6 | <DL | 4 | 0.2 | 0.01 | 3 | 4 | 0.5 | <DL | <DL | 0.5 | 0.07 | <DL | 2 | 0.2 | 0.08 | 0.06 | 5 | <DL | |
| 2298.73-2298.82 | 0.09 | 3 | 0.1 | 2 | <DL | 2 | 0.06 | 2 | 3 | 0.1 | <DL | <DL | <DL | <DL | <DL | <DL | 3 | 2 | <DL | 0.09 | <DL | 3 | <DL | <DL | 1 | 0.06 | 0.09 | <DL | <DL | 0.5 | 0.3 | 0.1 | 0.4 | <DL | ||||||
| 2303.99-2304.14 | 0.07 | <DL | 0.1 | 4 | <DL | 3 | 3 | <DL | 3 | 10 | 0.1 | 3 | <DL | <DL | 4 | 6 | 9 | 2 | <DL | 0.1 | <DL | <DL | 6 | <DL | 3 | 0.2 | 0.06 | <DL | <DL | 0.2 | 4 | 0.3 | 3 | <DL | ||||||
| 2311.19-2311.25 | 0.05 | 3 | 0.1 | 3 | 4 | 1 | <DL | 3 | 11 | 0.2 | 1 | <DL | <DL | 4 | 8 | 9 | 2 | 0.2 | 0.1 | <DL | 0.4 | <DL | 2 | 0.1 | 0.03 | <DL | 0.4 | 2 | 0.3 | 0.9 | <DL | |||||||||
| 2314.05-2314.17 | 0.2 | 3 | 0.2 | 3 | 2 | 2 | 0.6 | <DL | 2 | 0.2 | <DL | <DL | <DL | 6 | <DL | 5 | 2 | 0.2 | 0.2 | <DL | 4 | <DL | <DL | 3 | 0.2 | 0.07 | <DL | 0.4 | 0.6 | 0.4 | 2 | <DL | ||||||||
| 2319.26-2319.37 | 0.1 | 5 | 0.2 | 2 | 2 | 0.7 | <DL | 3 | 0.3 | <DL | <DL | <DL | 4 | <DL | 4 | 2 | <DL | 0.2 | <DL | <DL | 7 | 0.2 | 0.02 | <DL | <DL | 0.3 | 0.7 | 0.3 | 4 | <DL | ||||||||||
| 2322.61-2322.73 | 0.08 | 2 | 0.1 | <DL | <DL | 2 | 0.2 | <DL | 1 | 4 | 0.1 | 0.6 | <DL | <DL | 2 | <DL | <DL | <DL | 2 | 1 | <DL | 0.07 | 2 | 0.2 | <DL | 1 | 0.08 | <DL | <DL | <DL | 0.3 | 0.3 | 0.1 | 2 | <DL | |||||
| 2323.76-2323.95 | 0.04 | <DL | 0.1 | 3 | <DL | 3 | 0.2 | 3 | 3 | 3 | 0.1 | <DL | <DL | <DL | <DL | <DL | <DL | 4 | 2 | 0.1 | 0.07 | <DL | 3 | <DL | <DL | 1 | 0.09 | 0.06 | <DL | <DL | 0.4 | 0.7 | 0.2 | 0.5 | <DL | |||||
| 2325.88-2326.00 | 0.05 | <DL | 0.1 | 2 | 5 | 3 | 0.2 | <DL | 4 | 0.08 | <DL | <DL | <DL | <DL | 1 | <DL | <DL | 5 | 6 | <DL | 0.04 | <DL | 4 | <DL | <DL | 0.4 | 0.08 | 0.1 | <DL | <DL | 0.3 | 0.7 | 0.1 | 0.4 | <DL | |||||
| 2328.54-2328.59 | 0.07 | 3 | 0.3 | 4 | 4 | 2 | 12 | 0.1 | 0.5 | 5 | 0.4 | 0.05 | 0.2 | <DL | <DL | 0.4 | 0.2 | <DL | <DL | <DL | 5 | <DL | 3 | 0.3 | 0.03 | <DL | 0.8 | 0.6 | 0.06 | <DL | 0.2 | 0.07 | <DL | 1 | 0.5 | 0.2 | 0.1 | 5 | <DL | |
| 2330.41-2330.55 | <DL | 2 | 0.06 | <DL | <DL | <DL | 2 | 0.2 | <DL | 2 | <DL | 0.1 | 0.4 | <DL | <DL | <DL | <DL | <DL | 2 | <DL | 0.9 | <DL | 0.03 | <DL | 1 | 0.2 | <DL | 2 | 0.07 | <DL | <DL | <DL | 0.2 | 0.2 | 0.07 | 1 | <DL | |||
| 2333.23-2333.30 | 0.08 | <DL | 0.1 | 2 | 3 | 0.1 | <DL | 6 | 0.2 | <DL | <DL | <DL | <DL | <DL | 8 | 2 | <DL | 0.2 | <DL | <DL | <DL | 3 | 0.08 | 0.2 | <DL | 0.6 | 0.7 | 0.6 | 0.9 | <DL | ||||||||||
| 2338.75-2338.85 | 0.04 | 1 | 0.1 | 5 | <DL | 2 | 0.08 | <DL | 3 | <DL | 0.09 | 0.4 | <DL | <DL | 1 | <DL | <DL | <DL | <DL | 1 | <DL | 2 | 0.07 | 0.03 | <DL | 1 | 0.3 | <DL | 0.8 | 0.06 | <DL | <DL | <DL | 0.3 | 0.4 | 0.09 | 2 | <DL | ||
| West Wandoan 1 | 1165.57-1165.65 | 4 | 0.7 | <DL | 4 | 9 | 4 | 0.9 | 4 | 0.5 | 26 | <DL | <DL | <DL | <DL | <DL | 38 | 8 | 0.9 | 0.2 | <DL | <DL | 39 | 0.03 | 0.06 | 0.9 | 0.6 | <DL | <DL | 1 | 20 | 0.6 | 8 | 0.01 | ||||||
| 1174.24-1174.33 | 6 | 0.8 | <DL | 3 | 0.4 | <DL | 17 | 5 | 1 | 0.3 | <DL | <DL | 3 | <DL | 0.9 | <DL | 3 | 1 | 0.2 | 0.02 | <DL | 0.7 | 0.1 | 0.05 | 0.3 | 0.4 | 0.02 | <DL | <DL | 0.3 | 1 | 0.05 | 1 | <0.001 | ||||||
| 1197.76-1197.84 | 3 | 2 | <DL | 6 | 14 | 10 | 1 | 9 | 8 | 15 | <DL | <DL | 0.8 | <DL | 0.2 | <DL | 8 | 17 | 4 | 2 | <DL | 2 | 30 | 0.02 | 0.04 | 2 | 4 | <DL | 10 | 5 | 18 | 6 | 22 | 0.01 | ||||||
| 1207.61-1207.68 | 0.1 | 0.02 | 0.07 | 0.9 | <DL | <DL | 1 | 0.2 | 0.02 | 1 | 2 | 0.03 | 2 | <DL | <DL | <DL | 0.1 | <DL | <DL | <DL | 1 | <DL | 1 | 0.03 | 0.02 | <DL | 0.1 | 3 | 0.02 | 0.05 | 0.1 | 0.02 | <DL | 0.3 | 0.06 | 0.6 | 0.1 | 0.7 | 0.004 | |
| 1225.70-1225.80 | 1 | 0.9 | <DL | 9 | 1 | <DL | 9 | 6 | 2 | 1 | <DL | <DL | <DL | 0.2 | <DL | 10 | 8 | 1 | 0.2 | <DL | 0.4 | 0.9 | <DL | 0.3 | 1 | 0.2 | <DL | 3 | 0.8 | 2 | 0.3 | 3 | 0.006 | |||||||
| 1229.43-1229.50 | 0.7 | 3 | <DL | 15 | 15 | 29 | 2 | 3 | 5 | 5 | <DL | <DL | <DL | <DL | <DL | 17 | 40 | 13 | 1 | <DL | 2 | 18 | <DL | 0.06 | 3 | 2 | <DL | 13 | 2 | 14 | 2 | 45 | 0.009 | |||||||
| Woleebee Creek GWB 4 | 1552.63-1553.00 | 4 | 8 | 0.6 | <DL | <DL | 10 | 2 | <DL | 8 | 5 | 2 | <DL | <DL | <DL | <DL | <DL | <DL | <DL | 4 | 0.6 | 0.6 | <DL | 2 | 0.7 | <DL | 0.3 | 0.4 | 0.7 | <DL | <DL | 1 | 2 | 0.9 | 6 | <DL | ||||
| 1570.46-1570.52 | 0.4 | 11 | 2 | 6 | <DL | 9 | 0.4 | <DL | 5 | 5 | 0.3 | 1 | <DL | <DL | <DL | <DL | 1 | <DL | <DL | 10 | 0.4 | 0.2 | <DL | 6 | 0.5 | <DL | 0.1 | 0.4 | 0.1 | <DL | 1 | 0.6 | 0.9 | 0.4 | 6 | 0.003 | ||||
| Medians | All (n=36) | 0.09 | 2 | 0.1 | 2 | <DL | <DL | 3 | 0.2 | <DL | 3 | 2 | 0.1 | 0.3 | <DL | <DL | <DL | 0.1 | <DL | <DL | <DL | 3 | <DL | 2 | 0.1 | 0.08 | <DL | 1 | 0.4 | <DL | 0.3 | 0.1 | 0.09 | <DL | <DL | 0.4 | 0.7 | 0.2 | 2 | <DL |
| Sandstones (n=30) | 0.09 | 2 | 0.1 | 2 | <DL | <DL | 3 | 0.5 | <DL | 3 | 3 | 0.2 | 0.4 | <DL | <DL | <DL | <DL | <DL | <DL | <DL | 3 | <DL | 2 | 0.1 | 0.1 | <DL | 1 | 0.3 | <DL | 0.4 | 0.1 | 0.1 | <DL | <DL | 0.4 | 0.8 | 0.3 | 2 | <DL | |
| Interbedded (n=6) | 0.1 | 1 | 0.2 | 4 | 4 | 0.4 | 5 | 0.1 | 0.3 | 4 | 0.4 | 0.04 | 0.2 | <DL | <DL | 0.2 | 0.2 | <DL | <DL | <DL | 3 | <DL | 3 | 0.1 | 0.03 | <DL | 0.6 | 0.4 | 0.03 | 0.03 | 0.2 | 0.07 | <DL | 0.8 | 0.3 | 0.1 | 0.08 | 4 | <0.001 |
Shading indicates element was below detection limit in given rock samples.
Table B10.
Sum of Acid Steps Element extraction (%) relative to whole rock element abundance.
| Well | Depth (mRT) | Al | As | Ba | Be | Bi | Ca | Co | Cr | Cs | Cu | Fe | Ga | Ge | Hf | K | Li | Mg | Mn | Mo | Na | Ni | P | Pb | Rb | REE | S | Sb | Sc | Si | Sn | Sr | Th | Ti | Tl | U | V | Y | Zn | Zr |
| Chinchilla 4 | 1215.47-1215.59 | 13 | 1 | 22 | <DL | 10 | 14 | 25 | 5 | 44 | 9 | 4 | 15 | <DL | <DL | 13 | 12 | 0.2 | <DL | <DL | 16 | 3 | 5 | 7 | 2 | 11 | 0.1 | 1 | 11 | 6 | <DL | 19 | 9 | 2 | 6 | 22 | 0.07 | |||
| 1218.02-1218.10 | 0.1 | 1 | 3 | 7 | 14 | 16 | 3 | 0.2 | 3 | 10 | 0.4 | 0.1 | 0.2 | 0.02 | <DL | <DL | 2 | 3 | 0.09 | <DL | 3 | <DL | 16 | 0.4 | 0.2 | 6 | 3 | 0.9 | <DL | 0.2 | 3 | 0.3 | <DL | 4 | 2 | 0.07 | 0.4 | 7 | 0.03 | |
| Tipton 153 | 1032.35-1032.48 | 8 | 41 | 10 | 19 | 7 | 20 | 43 | 7 | 2 | 41 | 18 | 3 | 2 | <DL | 3 | 12 | <DL | 8 | <DL | 15 | <DL | 39 | 1 | 2 | <DL | 14 | 6 | 0.05 | 2 | 10 | 2 | <DL | 12 | 3 | 8 | 2 | 39 | 0.09 | |
| 1033.88-1034.00 | 2 | 17 | 6 | 22 | 36 | 23 | 18 | 3 | 5 | 23 | 3 | 0.6 | 1 | <DL | <DL | 3 | 3 | <DL | 2 | <DL | 13 | <DL | 41 | 1 | 0.7 | <DL | 5 | 3 | 0.1 | 0.3 | 5 | 1 | <DL | 8 | 3 | 2 | 0.7 | 31 | 0.02 | |
| 1066.00-1066.24 | 0.4 | 14 | 3 | 13 | 37 | 27 | 38 | 0.4 | 4 | 38 | 0.6 | 0.1 | 0.2 | 0.008 | <DL | 1 | 2 | <DL | 4 | <DL | 15 | <DL | 46 | 0.9 | 0.1 | <DL | 7 | 1 | 0.09 | 0.1 | 11 | 0.8 | <DL | 3 | 1 | 0.7 | 0.2 | 25 | 0.02 | |
| 1067.92-1068.00 | 0.5 | 1 | 1 | 9 | 19 | 17 | 8 | 2 | 1 | 11 | 8 | 0.3 | 6 | 0.03 | <DL | <DL | 8 | 9 | 0.2 | <DL | 10 | <DL | 14 | 0.3 | 0.1 | 3 | 6 | <DL | 0.6 | 2 | 0.3 | <DL | 0.4 | 1 | 3 | 0.4 | 8 | 0.04 | ||
| 1093.00-1093.19 | 17 | 53 | 10 | 12 | 8 | 37 | 8 | 2 | 56 | 17 | 5 | 3 | 0.2 | <DL | 10 | <DL | 39 | <DL | 23 | 2 | 1 | 7 | 5 | 0.06 | 5 | 4 | 2 | <DL | 5 | 4 | 9 | 2 | 26 | 0.2 | ||||||
| West Moonie 1 | 2263.61-2263.77 | 0.09 | 29 | 0.6 | 8 | 32 | 16 | 0.4 | 0.3 | 48 | 5 | 0.2 | 1 | <DL | <DL | 0.3 | 0.7 | <DL | <DL | <DL | 18 | <DL | 35 | 0.08 | 0.9 | <DL | 9 | 1 | <DL | 4 | 1 | 3 | <DL | 0.3 | 2 | 0.5 | 1 | 11 | <DL | |
| 2267.05-2267.23 | 0.07 | 23 | 0.6 | 7 | 33 | 11 | 15 | 0.7 | 1 | 33 | 7 | 0.2 | 2 | 0.05 | <DL | <DL | 4 | 6 | <DL | 17 | 15 | 0.05 | 0.5 | <DL | 7 | 3 | <DL | 3 | 0.8 | 2 | <DL | 0.04 | 0.8 | 1 | 1 | 7 | 0.02 | |||
| 2267.71-2267.84 | 0.4 | 12 | 6 | 11 | 40 | 22 | 38 | 0.3 | 1 | 17 | 2 | 0.06 | 0.3 | <DL | <DL | 0.1 | 0.6 | <DL | 1 | <DL | 37 | <DL | 41 | 0.007 | 0.2 | <DL | 0.4 | 1 | 0.09 | 0.09 | 10 | 0.6 | <DL | <DL | 1 | 0.2 | 0.4 | 7 | 0.02 | |
| 2274.10-2274.18 | 0.1 | 23 | 0.6 | 7 | 54 | 13 | 0.3 | 0.3 | 43 | 3 | 0.2 | 0.7 | <DL | <DL | 0.04 | <DL | <DL | <DL | <DL | 11 | <DL | 22 | 0.06 | 0.6 | 4 | 14 | 0.3 | <DL | 3 | 0.6 | 1 | <DL | 0.06 | 2 | 0.3 | 1 | 7 | <DL | ||
| 2281.82-2281.92 | 0.08 | 27 | 2 | 17 | 48 | 27 | 34 | 0.1 | 1 | 22 | 0.6 | 0.06 | 0.3 | <DL | <DL | 0.9 | 0.5 | <DL | 7 | <DL | 36 | <DL | 38 | 0.2 | 0.08 | <DL | 12 | 0.5 | <DL | <DL | 4 | 0.1 | <DL | 1 | 1 | 0.2 | 0.1 | 20 | <DL | |
| 2284.13-2284.24 | 0.1 | 43 | 2 | 15 | 23 | 21 | 0.3 | 0.8 | 11 | 1 | 0.1 | 0.8 | <DL | <DL | 1 | <DL | <DL | 8 | <DL | 27 | <DL | 63 | 0.2 | 0.2 | <DL | 11 | 0.2 | <DL | 0.5 | 0.8 | <DL | <DL | <DL | 2 | 0.4 | 0.3 | 14 | <DL | ||
| 2288.49-2288.61 | 0.1 | 44 | 1 | 11 | 48 | 32 | 0.3 | 0.5 | 60 | 0.8 | 0.09 | 0.7 | <DL | <DL | 0.2 | <DL | <DL | <DL | 31 | <DL | 44 | 0.2 | 0.2 | <DL | 8 | 0.2 | <DL | 3 | 0.8 | <DL | <DL | <DL | 1 | 0.5 | 0.2 | 9 | <DL | |||
| 2294.83-2294.98 | 0.2 | 18 | 1 | 9 | 19 | 28 | 0.4 | <DL | 38 | 0.2 | <DL | <DL | <DL | <DL | <DL | <DL | 19 | 33 | 0.2 | 0.1 | <DL | 11 | 3 | <DL | 11 | 0.6 | 0.2 | <DL | <DL | 2 | 1 | 0.2 | 2 | 0.008 | ||||||
| 2297.19-2297.37 | 0.1 | 11 | 8 | 9 | 14 | 52 | 31 | 0.1 | 4 | 14 | 0.3 | 0.02 | 0.4 | <DL | <DL | 1 | 1 | <DL | 5 | <DL | 20 | <DL | 25 | 1 | 0.05 | 3 | 9 | 0.7 | <DL | <DL | 8 | 0.1 | <DL | 7 | 0.8 | 0.1 | 0.2 | 14 | <DL | |
| 2298.73-2298.82 | 0.2 | 20 | 1 | 4 | 20 | 16 | 0.2 | 4 | 44 | 0.2 | <DL | <DL | <DL | <DL | <DL | <DL | 17 | 40 | 0.1 | 0.2 | <DL | 6 | 4 | <DL | 10 | 0.6 | 0.2 | <DL | <DL | 2 | 0.7 | 0.3 | 5 | 0.01 | ||||||
| 2303.99-2304.14 | 0.2 | 19 | 2 | 4 | 19 | 52 | 5 | 4 | 62 | 42 | 0.3 | 4 | <DL | <DL | 15 | 27 | 36 | 29 | <DL | 0.3 | <DL | 7 | 13 | <DL | 26 | 1 | 0.2 | <DL | <DL | 0.7 | 5 | 0.9 | 8 | 0.01 | ||||||
| 2311.19-2311.25 | 0.2 | 12 | 0.5 | 4 | 16 | 2 | <DL | 19 | 38 | 0.3 | 1 | <DL | <DL | 14 | 28 | 21 | 21 | 0.5 | 0.2 | 1 | 5 | <DL | 8 | 0.8 | 0.07 | <DL | 1 | 2 | 0.4 | 2 | 0.005 | |||||||||
| 2314.05-2314.17 | 0.7 | 26 | 2 | 5 | 2 | 21 | 2 | <DL | 54 | 0.5 | <DL | <DL | <DL | 9 | <DL | 36 | 26 | 0.5 | 0.7 | <DL | 14 | 17 | <DL | 23 | 1 | 0.4 | <DL | 1 | 1 | 1 | 16 | 0.02 | ||||||||
| 2319.26-2319.37 | 0.5 | 22 | 3 | 6 | 43 | 2 | <DL | 55 | 0.5 | <DL | <DL | <DL | 7 | <DL | 25 | 26 | <DL | 0.6 | 11 | <DL | 53 | 1 | 0.2 | <DL | <DL | 0.8 | 2 | 1 | 12 | 0.01 | ||||||||||
| 2322.61-2322.73 | 0.2 | 15 | 3 | 7 | 16 | 20 | 0.6 | 0.5 | 61 | 11 | 0.3 | 2 | <DL | <DL | 3 | 2 | <DL | <DL | 10 | 32 | 0.2 | 0.4 | 6 | 0.2 | <DL | 11 | 1 | 0.3 | <DL | <DL | 2 | 0.9 | 0.6 | 7 | <DL | |||||
| 2323.76-2323.95 | 0.1 | 18 | 1 | 7 | 20 | 26 | 0.4 | 6 | 52 | 12 | 0.2 | <DL | <DL | <DL | <DL | 2 | <DL | 23 | 42 | 0.2 | 0.2 | <DL | 6 | 5 | <DL | 10 | 0.7 | 0.1 | <DL | <DL | 2 | 1 | 0.4 | 7 | 0.007 | |||||
| 2325.88-2326.00 | 0.1 | 6 | 2 | 8 | 41 | 32 | 0.4 | 2 | 45 | 0.1 | 0.4 | <DL | <DL | <DL | 3 | 14 | 22 | 24 | 38 | 0.09 | 0.1 | <DL | 18 | 2 | <DL | 4 | 0.5 | 0.2 | <DL | <DL | 1 | 2 | 0.3 | 5 | 0.003 | |||||
| 2328.54-2328.59 | 0.2 | 16 | 8 | 15 | 59 | 38 | 35 | 0.3 | 4 | 31 | 0.9 | 0.08 | 0.4 | <DL | <DL | 1 | 1 | <DL | 0.9 | <DL | 25 | <DL | 27 | 1 | 0.1 | 5 | 16 | 1 | 0.1 | 0.2 | 8 | 0.2 | <DL | 5 | 2 | 0.3 | 0.3 | 13 | <DL | |
| 2330.41-2330.55 | 0.1 | 19 | 2 | 5 | 17 | 3 | 17 | 0.5 | 0.4 | 69 | <DL | 0.2 | 1 | <DL | 0.4 | <DL | <DL | <DL | 22 | <DL | 25 | 0.2 | 0.2 | <DL | 5 | 0.2 | <DL | 19 | 0.8 | <DL | <DL | <DL | 2 | 0.6 | 0.4 | 3 | <DL | |||
| 2333.23-2333.30 | 0.4 | 6 | 1 | 3 | 40 | 0.1 | <DL | 56 | 0.5 | <DL | <DL | <DL | <DL | <DL | 29 | 34 | 0.1 | 0.5 | <DL | 5 | <DL | 17 | 0.7 | 0.3 | <DL | 1 | 1 | 1 | 2 | <DL | ||||||||||
| 2338.75-2338.85 | 0.1 | 19 | 2 | 14 | 71 | 17 | 0.3 | 1 | 69 | <DL | 0.2 | 1 | <DL | <DL | 2 | <DL | <DL | <DL | <DL | 11 | <DL | 39 | 0.5 | 0.3 | <DL | 8 | 0.3 | <DL | 5 | 0.9 | 0.2 | <DL | <DL | 3 | 0.8 | 0.4 | 24 | <DL | ||
| West Wandoan 1 | 1165.57-1165.65 | 10 | 7 | 2 | 33 | 16 | 6 | 52 | 11 | 2 | 31 | <DL | <DL | <DL | 11 | <DL | 58 | 40 | 2 | 3 | 2 | 7 | 42 | 0.07 | 3 | 2 | 4 | <DL | 4 | 5 | 24 | 2 | 27 | 0.07 | ||||||
| 1174.24-1174.33 | 11 | 10 | 8 | 33 | 4 | 3 | 60 | 10 | 3 | 4 | <DL | <DL | 4 | <DL | 11 | <DL | 24 | 36 | 2 | 3 | 3 | 6 | 3 | 0.1 | 1 | 3 | 4 | <DL | 6 | 5 | 4 | 2 | 17 | 0.02 | ||||||
| 1197.76-1197.84 | 7 | 6 | 9 | 45 | 20 | 12 | 64 | 23 | 10 | 22 | <DL | <DL | 2 | <DL | 15 | <DL | 48 | 59 | 6 | 7 | 0.7 | 17 | 33 | 0.05 | 2 | 5 | 8 | <DL | 19 | 11 | 21 | 9 | 51 | 0.1 | ||||||
| 1207.61-1207.68 | 0.2 | 19 | 3 | 14 | 33 | 20 | 29 | 0.4 | 3 | 24 | 3 | 0.1 | 2 | 0.009 | <DL | 0.2 | 2 | <DL | 4 | <DL | 21 | <DL | 17 | 0.5 | 0.2 | 4 | 4 | 4 | 0.02 | 0.1 | 3 | 0.3 | <DL | 7 | 3 | 1 | 0.8 | 22 | 0.01 | |
| 1225.70-1225.80 | 3 | 6 | 4 | 43 | 4 | <DL | 63 | 25 | 4 | 6 | <DL | <DL | <DL | 21 | <DL | 31 | 44 | 1 | 4 | <DL | 32 | 3 | <DL | 8 | 2 | 4 | <DL | 9 | 6 | 5 | 2 | 29 | 0.05 | |||||||
| 1229.43-1229.50 | 1 | 8 | 0.5 | 46 | 19 | 29 | 41 | 17 | 6 | 9 | <DL | <DL | <DL | 13 | <DL | 42 | 70 | 13 | 3 | <DL | 27 | 21 | <DL | 8 | 4 | 4 | <DL | 19 | 3 | 16 | 3 | 74 | 0.05 | |||||||
| Woleebee Creek GWB 4 | 1552.63-1553.00 | 12 | 71 | 17 | 37 | 4 | 50 | 10 | 2 | 53 | 16 | 4 | 6 | <DL | <DL | 7 | <DL | <DL | <DL | 36 | 1 | 5 | <DL | 9 | 5 | 0.02 | 4 | 5 | 5 | <DL | 9 | 5 | 9 | 5 | 40 | 0.05 | ||||
| 1570.46-1570.52 | 0.8 | 47 | 9 | 50 | 3 | 37 | 2 | 1 | 31 | 10 | 0.6 | 2 | <DL | <DL | <DL | <DL | 17 | <DL | <DL | 34 | 0.6 | 1 | <DL | 18 | 2 | <DL | 2 | 1 | 0.7 | <DL | 5 | 2 | 2 | 1 | 40 | 0.04 | ||||
| Medians | All (n=36) | 0.2 | 18 | 3 | 7 | 19 | 3 | 31 | 0.5 | 2 | 44 | 3 | 0.2 | 1 | <DL | <DL | <DL | 2 | <DL | 0.2 | <DL | 21 | <DL | 35 | 0.5 | 0.4 | <DL | 7 | 3 | <DL | 3 | 2 | 0.3 | <DL | 0.4 | 2 | 1 | 0.8 | 13 | 0.01 |
| Sandstones (n=30) | 0.3 | 19 | 2 | 5 | 19 | 1 | 30 | 2 | 1 | 50 | 7 | 0.3 | 1 | <DL | <DL | <DL | 2 | <DL | <DL | <DL | 21 | <DL | 35 | 0.3 | 0.6 | <DL | 8 | 4 | <DL | 4 | 1 | 0.4 | <DL | 0.05 | 2 | 2 | 1 | 13 | 0.01 | |
| Interbedded (n=6) | 0.2 | 13 | 4 | 12 | 35 | 25 | 33 | 0.3 | 3 | 20 | 0.8 | 0.09 | 0.4 | 0.004 | <DL | 0.6 | 1 | <DL | 3 | <DL | 20 | <DL | 26 | 0.7 | 0.2 | 4 | 6 | 1 | 0.05 | 0.1 | 8 | 0.3 | <DL | 5 | 2 | 0.3 | 0.3 | 13 | 0.01 |
Shading indicates element was below detection limit in given rock samples.
Table B11.
Sum of All Three Steps Element extraction (%) relative to whole rock element abundance.
| Well | Depth (mRT) | Al | As | Ba | Be | Bi | Ca | Co | Cr | Cs | Cu | Fe | Ga | Ge | Hf | K | Li | Mg | Mn | Mo | Na | Ni | P | Pb | Rb | REE | S | Sb | Sc | Si | Sn | Sr | Th | Ti | Tl | U | V | Y | Zn | Zr |
| Chinchilla 4 | 1215.47-1215.59 | 13 | 1 | 29 | <DL | 20 | 15 | 25 | 18 | 44 | 9 | 4 | 15 | <DL | 7 | 30 | 13 | 0.2 | <DL | <DL | 16 | 16 | 5 | 29 | 2 | 11 | 0.1 | 1 | 23 | 6 | <DL | 52 | 9 | 2 | 6 | 22 | 0.07 | |||
| 1218.02-1218.10 | 0.1 | 1 | 5 | 7 | 14 | 52 | 3 | 0.2 | 5 | 10 | 0.4 | 0.1 | 0.2 | 0.02 | <DL | 0.5 | 7 | 5 | 0.09 | <DL | 3 | <DL | 16 | 1 | 0.2 | 33 | 3 | 0.9 | <DL | 0.3 | 9 | 0.3 | <DL | 11 | 2 | 0.07 | 0.4 | 8 | 0.03 | |
| Tipton 153 | 1032.35-1032.48 | 8 | 41 | 13 | 19 | 7 | 35 | 43 | 7 | 9 | 41 | 18 | 3 | 2 | <DL | 3 | 19 | <DL | 10 | <DL | 15 | <DL | 39 | 9 | 2 | <DL | 19 | 6 | 0.05 | 2 | 26 | 2 | <DL | 24 | 3 | 8 | 2 | 39 | 0.09 | |
| 1033.88-1034.00 | 2 | 17 | 8 | 22 | 36 | 40 | 19 | 3 | 9 | 23 | 3 | 0.6 | 1 | <DL | 4 | 4 | 6 | <DL | 2 | 100 | 13 | <DL | 41 | 4 | 0.7 | 9 | 6 | 3 | 0.1 | 0.3 | 12 | 1 | <DL | 14 | 3 | 2 | 0.7 | 32 | 0.02 | |
| 1066.00-1066.24 | 0.4 | 14 | 4 | 13 | 37 | 50 | 40 | 0.4 | 5 | 38 | 0.6 | 0.1 | 0.2 | 0.008 | 1 | 2 | 3 | <DL | 10 | 36 | 16 | <DL | 46 | 2 | 0.1 | 11 | 8 | 1 | 0.09 | 0.1 | 20 | 0.8 | <DL | 7 | 1 | 0.7 | 0.2 | 25 | 0.02 | |
| 1067.92-1068.00 | 0.5 | 1 | 2 | 9 | 19 | 26 | 8 | 2 | 4 | 11 | 8 | 0.3 | 6 | 0.03 | <DL | <DL | 11 | 9 | 0.2 | <DL | 10 | <DL | 14 | 1 | 0.1 | 3 | 6 | <DL | 0.6 | 5 | 0.3 | <DL | 3 | 1 | 3 | 0.4 | 8 | 0.04 | ||
| 1093.00-1093.19 | 17 | 56 | 25 | 12 | 34 | 38 | 8 | 9 | 56 | 17 | 5 | 3 | 0.2 | <DL | 20 | <DL | 40 | <DL | 23 | 10 | 1 | 8 | 5 | 0.06 | 5 | 23 | 2 | <DL | 29 | 4 | 9 | 2 | 26 | 0.2 | ||||||
| West Moonie 1 | 2263.61-2263.77 | 0.09 | 29 | 2 | 8 | 32 | 41 | 0.4 | 2 | 59 | 5 | 0.2 | 1 | <DL | 1 | 0.8 | 3 | 7 | 2 | 12 | 49 | <DL | 36 | 0.4 | 0.9 | 23 | 10 | 1 | <DL | 4 | 4 | 3 | <DL | 6 | 2 | 0.5 | 1 | 31 | <DL | |
| 2267.05-2267.23 | 0.07 | 23 | 2 | 7 | 33 | 17 | 24 | 0.7 | 2 | 35 | 7 | 0.2 | 2 | 0.05 | 1 | <DL | 5 | 6 | <DL | 25 | 15 | 0.3 | 0.5 | 14 | 8 | 3 | <DL | 3 | 3 | 2 | <DL | 4 | 0.8 | 1 | 1 | 12 | 0.03 | |||
| 2267.71-2267.84 | 0.4 | 12 | 8 | 11 | 40 | 52 | 44 | 0.3 | 3 | 17 | 2 | 0.06 | 0.4 | 0.02 | 2 | 0.8 | 2 | <DL | 15 | 61 | 42 | <DL | 41 | 2 | 0.2 | <DL | 3 | 1 | 0.09 | 0.09 | 29 | 0.6 | <DL | 3 | 1 | 0.2 | 0.4 | 7 | 0.02 | |
| 2274.10-2274.18 | 0.1 | 23 | 2 | 8 | 54 | 36 | 0.3 | 1 | 52 | 3 | 0.2 | 0.8 | <DL | 1 | 0.4 | 2 | 4 | 0.4 | <DL | 32 | <DL | 22 | 0.3 | 0.6 | 7 | 16 | 0.3 | <DL | 3 | 2 | 1 | <DL | 3 | 2 | 0.3 | 1 | 21 | <DL | ||
| 2281.82-2281.92 | 0.08 | 28 | 5 | 17 | 48 | 83 | 50 | 0.1 | 4 | 23 | 0.6 | 0.06 | 0.4 | <DL | 0.9 | 2 | 2 | <DL | 21 | 23 | 47 | <DL | 38 | 1 | 0.08 | 14 | 14 | 0.5 | 0.004 | <DL | 12 | 0.1 | <DL | 5 | 1 | 0.2 | 0.1 | 25 | <DL | |
| 2284.13-2284.24 | 0.1 | 45 | 8 | 15 | 23 | 32 | 0.3 | 4 | 11 | 1 | 0.2 | 1 | <DL | 8 | 2 | 0.9 | <DL | 15 | 32 | 34 | <DL | 65 | 2 | 0.2 | 11 | 15 | 0.3 | 0.002 | 0.5 | 4 | <DL | <DL | 10 | 2 | 0.4 | 0.3 | 24 | <DL | ||
| 2288.49-2288.61 | 0.1 | 46 | 6 | 11 | 48 | 43 | 0.3 | 3 | 65 | 0.8 | 0.1 | 0.8 | <DL | 8 | 0.8 | 0.5 | <DL | 9 | 40 | <DL | 45 | 1 | 0.2 | 9 | 12 | 0.2 | <DL | 3 | 4 | <DL | <DL | 4 | 1 | 0.5 | 0.2 | 16 | <DL | |||
| 2294.83-2294.98 | 0.6 | 24 | 3 | 9 | 19 | 41 | 1 | 6 | 58 | 0.6 | <DL | <DL | 34 | <DL | 5 | <DL | 27 | 34 | 4 | 0.3 | <DL | 19 | 3 | <DL | 12 | 6 | 0.4 | <DL | 0.5 | 3 | 2 | 0.3 | 4 | 0.07 | ||||||
| 2297.19-2297.37 | 0.1 | 11 | 9 | 9 | 14 | 96 | 43 | 0.2 | 5 | 14 | 0.3 | 0.03 | 0.6 | <DL | 2 | 3 | 3 | <DL | 10 | 53 | 26 | <DL | 25 | 3 | 0.05 | 17 | 13 | 0.7 | <DL | <DL | 15 | 0.1 | <DL | 14 | 0.8 | 0.1 | 0.3 | 15 | <DL | |
| 2298.73-2298.82 | 0.3 | 24 | 3 | 4 | 20 | 23 | 0.5 | 8 | 53 | 0.5 | <DL | <DL | 16 | <DL | 2 | <DL | 22 | 41 | 1 | 0.4 | <DL | 10 | 4 | <DL | 10 | 4 | 0.4 | <DL | 1 | 2 | 1 | 0.4 | 7 | 0.05 | ||||||
| 2303.99-2304.14 | 0.4 | 19 | 4 | 4 | 19 | 60 | 5 | 9 | 75 | 42 | 0.3 | 4 | <DL | <DL | 18 | 27 | 41 | 29 | 2 | 0.4 | <DL | 7 | 13 | <DL | 27 | 8 | 0.3 | <DL | <DL | 0.9 | 6 | 0.9 | 12 | 0.04 | ||||||
| 2311.19-2311.25 | 0.3 | 15 | 3 | 4 | 24 | 2 | 5 | 31 | 38 | 0.4 | 1 | <DL | <DL | 19 | 28 | 27 | 22 | 4 | 0.2 | 1 | 5 | <DL | 8 | 6 | 0.07 | <DL | 1 | 3 | 0.5 | 4 | 0.02 | |||||||||
| 2314.05-2314.17 | 0.8 | 31 | 5 | 5 | 23 | 27 | 2 | 5 | 74 | 0.5 | <DL | <DL | <DL | 17 | <DL | 42 | 27 | 5 | 0.8 | <DL | 19 | 17 | <DL | 23 | 9 | 0.4 | <DL | 1 | 2 | 1 | 34 | 0.08 | ||||||||
| 2319.26-2319.37 | 0.5 | 27 | 7 | 6 | 48 | 2 | 4 | 66 | 0.5 | <DL | <DL | <DL | 12 | <DL | 29 | 26 | 2 | 0.6 | 11 | <DL | 53 | 7 | 0.2 | <DL | <DL | 0.9 | 2 | 1 | 19 | 0.01 | ||||||||||
| 2322.61-2322.73 | 0.2 | 20 | 9 | 7 | 16 | 52 | 0.8 | 3 | 74 | 11 | 0.5 | 2 | <DL | 32 | 4 | 5 | 3 | 64 | 14 | 34 | 4 | 0.7 | 10 | 0.5 | 0.004 | 11 | 8 | 0.7 | 0.1 | 4 | 2 | 1 | 0.7 | 14 | 0.05 | |||||
| 2323.76-2323.95 | 0.3 | 24 | 3 | 7 | 20 | 33 | 0.9 | 10 | 60 | 12 | 0.6 | <DL | <DL | 20 | <DL | 6 | <DL | 29 | 43 | 3 | 0.4 | <DL | 10 | 5 | <DL | 10 | 6 | 0.4 | <DL | <DL | 2 | 2 | 0.6 | 12 | 0.1 | |||||
| 2325.88-2326.00 | 0.2 | 8 | 4 | 8 | 41 | 46 | 0.5 | 6 | 51 | 0.2 | 0.4 | <DL | 16 | <DL | 6 | 14 | 40 | 31 | 38 | 1 | 0.1 | <DL | 27 | 2 | <DL | 4 | 3 | 0.3 | <DL | 9 | 2 | 2 | 0.3 | 8 | 0.01 | |||||
| 2328.54-2328.59 | 0.2 | 17 | 11 | 15 | 59 | 71 | 36 | 0.3 | 5 | 31 | 0.9 | 0.08 | 0.5 | <DL | 1 | 2 | 2 | <DL | 9 | 35 | 26 | <DL | 27 | 3 | 0.1 | 11 | 24 | 1 | 0.1 | 0.2 | 14 | 0.2 | <DL | 8 | 2 | 0.3 | 0.3 | 13 | <DL | |
| 2330.41-2330.55 | 0.1 | 23 | 6 | 5 | 17 | 12 | 37 | 0.5 | 2 | 93 | <DL | 0.3 | 1 | <DL | 1 | 2 | <DL | 21 | 29 | <DL | 26 | 2 | 0.3 | 11 | 8 | 0.4 | 0.002 | 20 | 5 | 0.09 | <DL | 4 | 2 | 1 | 0.4 | 6 | 0.04 | |||
| 2333.23-2333.30 | 0.7 | 12 | 4 | 3 | 50 | 0.5 | 4 | 94 | 1 | <DL | <DL | <DL | 8 | <DL | 38 | 37 | 6 | 0.7 | <DL | 5 | <DL | 18 | 11 | 0.7 | <DL | 2 | 3 | 1 | 6 | 0.1 | ||||||||||
| 2338.75-2338.85 | 0.1 | 20 | 7 | 14 | 71 | 28 | 0.3 | 5 | 78 | <DL | 0.2 | 1 | <DL | 14 | 2 | 1 | <DL | 16 | 41 | 14 | <DL | 39 | 3 | 0.3 | 27 | 11 | 0.4 | <DL | 5 | 4 | 0.2 | <DL | 6 | 3 | 0.9 | 0.4 | 47 | <DL | ||
| West Wandoan 1 | 1165.57-1165.65 | 10 | 10 | 8 | 56 | 16 | 14 | 57 | 11 | 2 | 31 | <DL | 67 | <DL | 30 | 81 | 70 | 40 | 14 | 3 | 69 | 11 | 42 | 0.07 | 3 | 7 | 4 | <DL | 19 | 6 | 24 | 2 | 30 | 0.07 | ||||||
| 1174.24-1174.33 | 11 | 12 | 30 | 36 | 4 | 11 | 61 | 10 | 3 | 4 | <DL | 61 | 13 | <DL | 28 | 58 | 27 | 36 | 21 | 3 | 87 | 9 | 3 | 0.1 | 1 | 8 | 4 | <DL | 17 | 6 | 4 | 2 | 17 | 0.02 | ||||||
| 1197.76-1197.84 | 7 | 7 | 54 | 60 | 20 | 20 | 68 | 23 | 10 | 22 | <DL | 80 | 8 | <DL | 45 | 78 | 56 | 59 | 33 | 7 | 89 | 27 | 33 | 0.05 | 2 | 14 | 8 | <DL | 51 | 11 | 22 | 9 | 56 | 0.1 | ||||||
| 1207.61-1207.68 | 0.2 | 19 | 4 | 14 | 33 | 55 | 70 | 0.4 | 4 | 24 | 3 | 0.1 | 2 | 0.009 | 1 | 0.6 | 5 | 12 | 6 | 36 | 41 | <DL | 17 | 2 | 0.2 | 31 | 5 | 4 | 0.02 | 0.1 | 8 | 0.3 | <DL | 17 | 3 | 1 | 0.8 | 30 | 0.01 | |
| 1225.70-1225.80 | 3 | 8 | 10 | 55 | 4 | 7 | 76 | 25 | 4 | 6 | <DL | 63 | <DL | 46 | 51 | 39 | 44 | 10 | 4 | 99 | 44 | 3 | <DL | 8 | 8 | 4 | <DL | 39 | 6 | 5 | 2 | 31 | 0.05 | |||||||
| 1229.43-1229.50 | 1 | 10 | 2 | 59 | 20 | 34 | 53 | 17 | 6 | 9 | 0.2 | 69 | <DL | 36 | 57 | 56 | 71 | 32 | 3 | 91 | 40 | 21 | <DL | 9 | 10 | 4 | <DL | 48 | 3 | 17 | 3 | 77 | 0.1 | |||||||
| Woleebee Creek GWB 4 | 1552.63-1553.00 | 12 | 77 | 25 | 37 | 11 | 59 | 10 | 11 | 54 | 16 | 4 | 6 | <DL | <DL | 24 | <DL | 99 | <DL | 36 | 11 | 5 | 22 | 15 | 5 | 0.02 | 4 | 17 | 5 | <DL | 37 | 5 | 10 | 5 | 43 | 0.05 | ||||
| 1570.46-1570.52 | 0.8 | 48 | 18 | 50 | 10 | 57 | 2 | 5 | 31 | 10 | 0.6 | 2 | <DL | <DL | 4 | <DL | 36 | <DL | <DL | 34 | 4 | 1 | 26 | 23 | 2 | <DL | 2 | 5 | 0.7 | <DL | 23 | 2 | 2 | 1 | 52 | 0.04 | ||||
| Medians | All (n=36) | 0.4 | 20 | 6 | 7 | 19 | 11 | 41 | 0.8 | 5 | 53 | 3 | 0.4 | 1 | <DL | 1 | <DL | 5 | <DL | 4 | 6 | 28 | <DL | 36 | 3 | 0.5 | 11 | 10 | 3 | <DL | 3 | 8 | 0.5 | <DL | 7 | 2 | 2 | 0.8 | 20 | 0.03 |
| Sandstones (n=30) | 0.5 | 23 | 6 | 5 | 19 | 5 | 41 | 2 | 6 | 57 | 7 | 0.5 | 1 | <DL | 1 | <DL | 6 | <DL | 1 | <DL | 29 | <DL | 36 | 4 | 0.6 | 9 | 11 | 4 | <DL | 4 | 7 | 0.7 | <DL | 5 | 2 | 2 | 1 | 22 | 0.04 | |
| Interbedded (n=6) | 0.2 | 13 | 7 | 12 | 35 | 54 | 42 | 0.3 | 5 | 20 | 0.8 | 0.09 | 0.5 | 0.008 | 1 | 1 | 3 | <DL | 10 | 36 | 26 | <DL | 26 | 2 | 0.2 | 14 | 7 | 1 | 0.05 | 0.1 | 15 | 0.3 | <DL | 9 | 2 | 0.3 | 0.3 | 14 | 0.01 |
Shading indicates element was below detection limit in given rock samples.
References
- Working Group III of the Intergovernmental Panel on Climate Change (IPCC). Special report on carbon dioxide capture and storage; Metz, B., Davidson, O., de Coninck, H., Loos, M., Meyer, L., Eds.; Cambridge University Press: New York, USA, 2005; 442 p.
- Bachu, S. CO2 storage in geological media: Role, means, status and barriers to deployment. Prog. Energy Combust. Sci. 2008, 34 (2), pp. 254–273. [CrossRef]
- Pearce, J. K., Kirste, D., Dawson, G. K. W., Farquhar, S. M., Biddle, D., Golding, S. D., Rudolph, V. SO2 impurity impacts on experimental and simulated CO2–water–reservoir rock reactions at carbon storage conditions. Chem. Geol. 2015, 399, pp. 65–86. [CrossRef]
- Pearce, J. K., Kirste, D., Dawson, G. K. W., Rudolph, V., Golding, S. D. Geochemical modelling of experimental O2–SO2–CO2 reactions of reservoir, cap-rock, and overlying cores. Appl. Geochem. 2019, 109, article 104400, pp. 1–19. [CrossRef]
- Pearce, J. K., Kirste, D., Dawson, G. K. W., Rudolph, V., Southam, G., Brink, F., Paterson, D. J., Hall, N., Sommacal, S., Golding, S. D. Pure CO2 and impure CO2-SO2-NO-O2 reactions with carbon storage site underlying seals: Coaly mudstones and carbonate cemented sandstones. Sci. Total Env. 2025, 963, article 178391, pp. 1–20. [CrossRef]
- Kirste, D., Pearce, J. K., Golding, S. D., Dawson, G. K. W. Trace element mobility during CO2 storage: application of reactive transport modelling. E3S Web Conf. 2019, 98, article 04007, pp. 1–5. [CrossRef]
- Golding, S. D., Pearce, J. K., Dawson, G. K. W., Kirste, D. M. (2019). ANLEC Project 7-1115-0236: Mobilisation and Fate of Heavy Metals Released by the GHG Stream, Final Report for ANLEC R&D, 160 p. https://espace.library.uq.edu.au/view/UQ:f6e01dd.
- Dawson, G. K. W., Kirste, D. M., Pearce, J. K., Golding, S. D. (2023). ANLEC Project 7-0320-C323: South Surat metal mobilisation and fate of heavy metals released, Final Report for ANLEC R&D, 158 p. https://espace.library.uq.edu.au/view/UQ:003c0d2.
- Filgueiras, A. V., Lavilla, I., Bendicho, C. Chemical sequential extraction for metal partitioning in environmental solid samples. J. Environ. Monit. 2002, 4, pp. 823–857. [CrossRef]
- Rao, C. R. M., Sahuquillo, A., Lopez Sanchez, J. F. A review of the different methods applied in environmental geochemistry for single and sequential extraction of trace elements in soils and related materials. Water Air Soil Pollut. 2008, 189, pp. 291–333. [CrossRef]
- Sahuquillo, A., López-Sánchez, J. F., Rubio, R., Rauret, G., Thomas, R.P., Davidson, C.M., Ure, A.M. Use of a certified reference material for extractable trace metals to assess sources of uncertainty in the BCR three-stage sequential extraction procedure. Anal. Chim. Acta 1999, 382, pp. 317–327. [CrossRef]
- Pueyo, M., Mateu, J., Rigol, A., Vidal, M., López-Sánchez, J. F., Rauret, G. Use of the modified BCR three-step sequential extraction procedure for the study of trace element dynamics in contaminated soils. Environ. Pollut. 2008, 152, pp. 330–341. [CrossRef]
- Xiangdong, L., Coles, B. J., Ramsey, M. H., Thronton, L. Sequential extraction of soils for multielement analysis by ICP-AES. Chem. Geol. 1995, 124 (1-2), pp. 109–123. [CrossRef]
- Tessier A., Campbell, P. G. C., Bisson, M. Sequential extraction procedure for the speciation of particulate trace metals. Anal. Chem. 1979, 51 (7), pp. 844–851. [CrossRef]
- Gupta, S., K., Chen, K. Y. Partitioning of trace metals in selective chemical fractions of nearshore sediments. Environ. Lett. 1975, 10 (2), pp. 129–158, DOI: 10.1080/00139307509435816.
- Rapin, F., Förstner, U. Sequential leaching techniques for particulate metal speciation: The selectivity of various extractants. In Proceedings of the 4th International Conference on Heavy Metals in the Environment, Heidelberg; CEP Consultants Ltd., Eds.; Edinburgh, UK, 1983; pp. 1074–1077.
- Ahnstrom, Z., S., Parker, D. R. Development and assessment of a sequential extraction procedure for the fractionation of soil cadmium. Soil Sci. Soc. Am. J. 1999, 63 (6), pp. 1650–1658. [CrossRef]
- Almond, C. A. GSQ Record 1985/34: GSQ Chinchilla 4, Preliminary Lithological Log and Composite Log, CR041858; GSQ Open Data Portal, Queensland Government, Brisbane, QLD, Australia, 1985. https://geoscience.data.qld.gov.au/data/report/cr041858.
- Nightingale, J. PL 198, AEL Tipton 153, Well Completion Report, CR070191; GSQ Open Data Portal, Queensland Government, Brisbane, QLD, Australia, 2012. https://geoscience.data.qld.gov.au/data/report/cr070191.
- Heath, R., Hall, N. EPQ10 - West Moonie-1 Well Completion Report, CR121956; Queensland, CR098874; GSQ Open Data Portal, Queensland Government, Brisbane, QLD, Australia, 2020. https://geoscience.data.qld.gov.au/data/report/cr121956.
- CTSCo. West Wandoan-1 Well Completion Report – EPQ 7, Queensland, CR098874; GSQ Open Data Portal, Queensland Government, Brisbane, QLD, Australia, 2020. https://geoscience.data.qld.gov.au/data/report/cr098874.
- Mountford, A. PL 276, QGC Woleebee Creek GW 4, Well Completion Report, CR103564; GSQ Open Data Portal, Queensland Government, Brisbane, QLD, Australia, 2017. https://geoscience.data.qld.gov.au/data/report/cr103564.
- Golding, S. D., Dawson, G. K. W., Pearce, J. K., Farrajota, F., Mernagh, T., Boreham, C. J., Hall, L. S., Palu, T. J., Sommacal, S. Great Artesian Basin Authigenic Carbonates as Natural Analogues for Mineralisation Trapping, CO2CRC Project 1.5.2, ANLEC Project 7-1011-0189, CO2CRC Report No: RPT16-5497, pp 1–234.
- File:Australia states blank.png. Available online: URL https://commons.wikimedia.org/wiki/File:Australia_states_blank.png (accessed on 12th November 2025).
- Australian Stratigraphic Units Database. Geoscience Australia. https://www.ga.gov.au/data-pubs/datastandards/stratigraphic-units.
- Wainman, C. C., McCabe, P. J., Crowley, J. L., Nicoll, R. S. U-Pb zircon age of the Walloon Coal Measures in the Surat Basin, southeast Queensland: implications for paleogeography and basin subsidence. Aust. J. Earth Sci 2015, 62, pp. 807–816. [CrossRef]
- Quevauviller, Ph., Rauret, G., Griepink, B. Single and Sequential Extraction in Sediments and Soils. Int. J. Anal. Chem. 1992, 51 (1–4), pp. 231–235. [CrossRef]
- Zeyen, N., Wang, B., Wilson, S., Paulo, C., Stubbs, A. R., Power, I. M., Steele-MacInnis, M., Lanzirotti, A., Newville, M., Paterson, D. J., Hamilton, J. L., Jones, T., R., Turvey, C. C., Dipple, G. M., Southam, G. Cation exchange in smectites as a new approach to mineral carbonation. Front. Clim. 2022, 4, article 913632, pp. 1–21. [CrossRef]
- Davies, M., Figueroa, L., Wildeman, T., Bucknam, C. The Oxidative Precipitation of Thallium at Alkaline pH for Treatment of Mining Influenced Water. Mine Water Environ. 2016, 35, pp. 77–85. [CrossRef]
- Migaszewski, Z. M., Gałuszka, A. Abundance and fate of thallium and its stable isotopes in the environment. Rev. Environ. Sci. Biotechnol. 2021, 20, pp. 5–30. [CrossRef]
- Xu, H., Luo, Y., Wang, P., Zhu, J., Yang, Z., Liu, Z. Removal of thallium in water/wastewater: A review. Water Res. 2019, 165, article 114981, pp. 1–26. [CrossRef]
- Dawson, G. K. W., Pearce, J. K., Biddle, D., Golding, S. D. Experimental mineral dissolution in Berea Sandstone reacted with CO2 or SO2 –CO2 in NaCl brine under CO2 sequestration conditions. Chem. Geol. 2015, 399, pp. 87–97. [CrossRef]
- Medlin, W. L. Thermoluminescent Properties of Calcite. J. Chem. Phys. 1959, 30, pp. 451–458. [CrossRef]
- Deer, W. A., Howie, R. A., Zussman, J. Carbonates. In Rock-forming minerals. Vol. 5 Non-Silicates, 5th ed.; Longmans, Green and Co. Ltd.: London, UK, 1967; pp. 226–227.
- Ahrens, L. H. The Unique Association of Thallium and Rubidium in Minerals. J. Geol. 1948, 56 (6), pp. 578–590. https://www.jstor.org/stable/30080849.
- Pearce, J. K., Dawson, G. W., Brink, F., Southam, G., Paterson, D., Hall, N., Heath, R., Greer, D., Kirste, D., Golding, S. D. Impure CO2 storage reactions of sandstone, mudstone and carbonate cemented cores: Experimental CO2SO2NOxO2 reaction metal mobilization and fate. Int. J. Coal Geol. 2023, 277, article 104352, pp. 1–21. [CrossRef]
- Pearce, J. K., Dawson, G. W., Turner, L., Southam, G., Brink, F., Paterson, D., Kirste, D., Golding, S. D. Metal mobilisation and fines migration in pure CO2 and impure CO2SO2NO reactions of carbon dioxide storage site core. Sci. Total Env. 2025, 958, article 177993, pp. 1–17. https:///doi.org/10.1016/j.scitotenv.2024.177993.
- Ellis, B.R., Crandell, L.E., Peters, C.A. Limitations for brine acidification due to SO2 co-injection in geologic carbon sequestration. Int. J. Greenh. Gas Control 2010, 40, pp. 575-582. [CrossRef]
- Spycher N. F., Llanos, E.M., Vu, H. P., Haese, R.R. Reservoir scale reactive-transport modeling of a buoyancy-controlled CO2 plume with impurities (SO2, NO2, O2). Int. J. Greenh. Gas Control 2019, 89, pp. 40-51. [CrossRef]
Figure 1.
(a) The locations of the five sampled cored wells in the Surat Basin, Queensland, Australia: Chinchilla 4, Tipton 153, West Moonie 1, West Wandoan 1, and Woleebee Creek GW4 [18,19,20,21,22]. NB: Only approximate positions of major structures are shown, and the boundary between the eastern margin and the time-equivalent Clarence-Moreton Basin is uncertain and likely gradational near Dalby. Map modified after [23,24]; (b) Stratigraphic column of common geological formations of the Surat Basin. The vertical scale of the geological formations is representative of the approximate relative thickness [20] rather than age that is more uncertain [25,26], and not all formations are present at the site of each well that has been drilled.
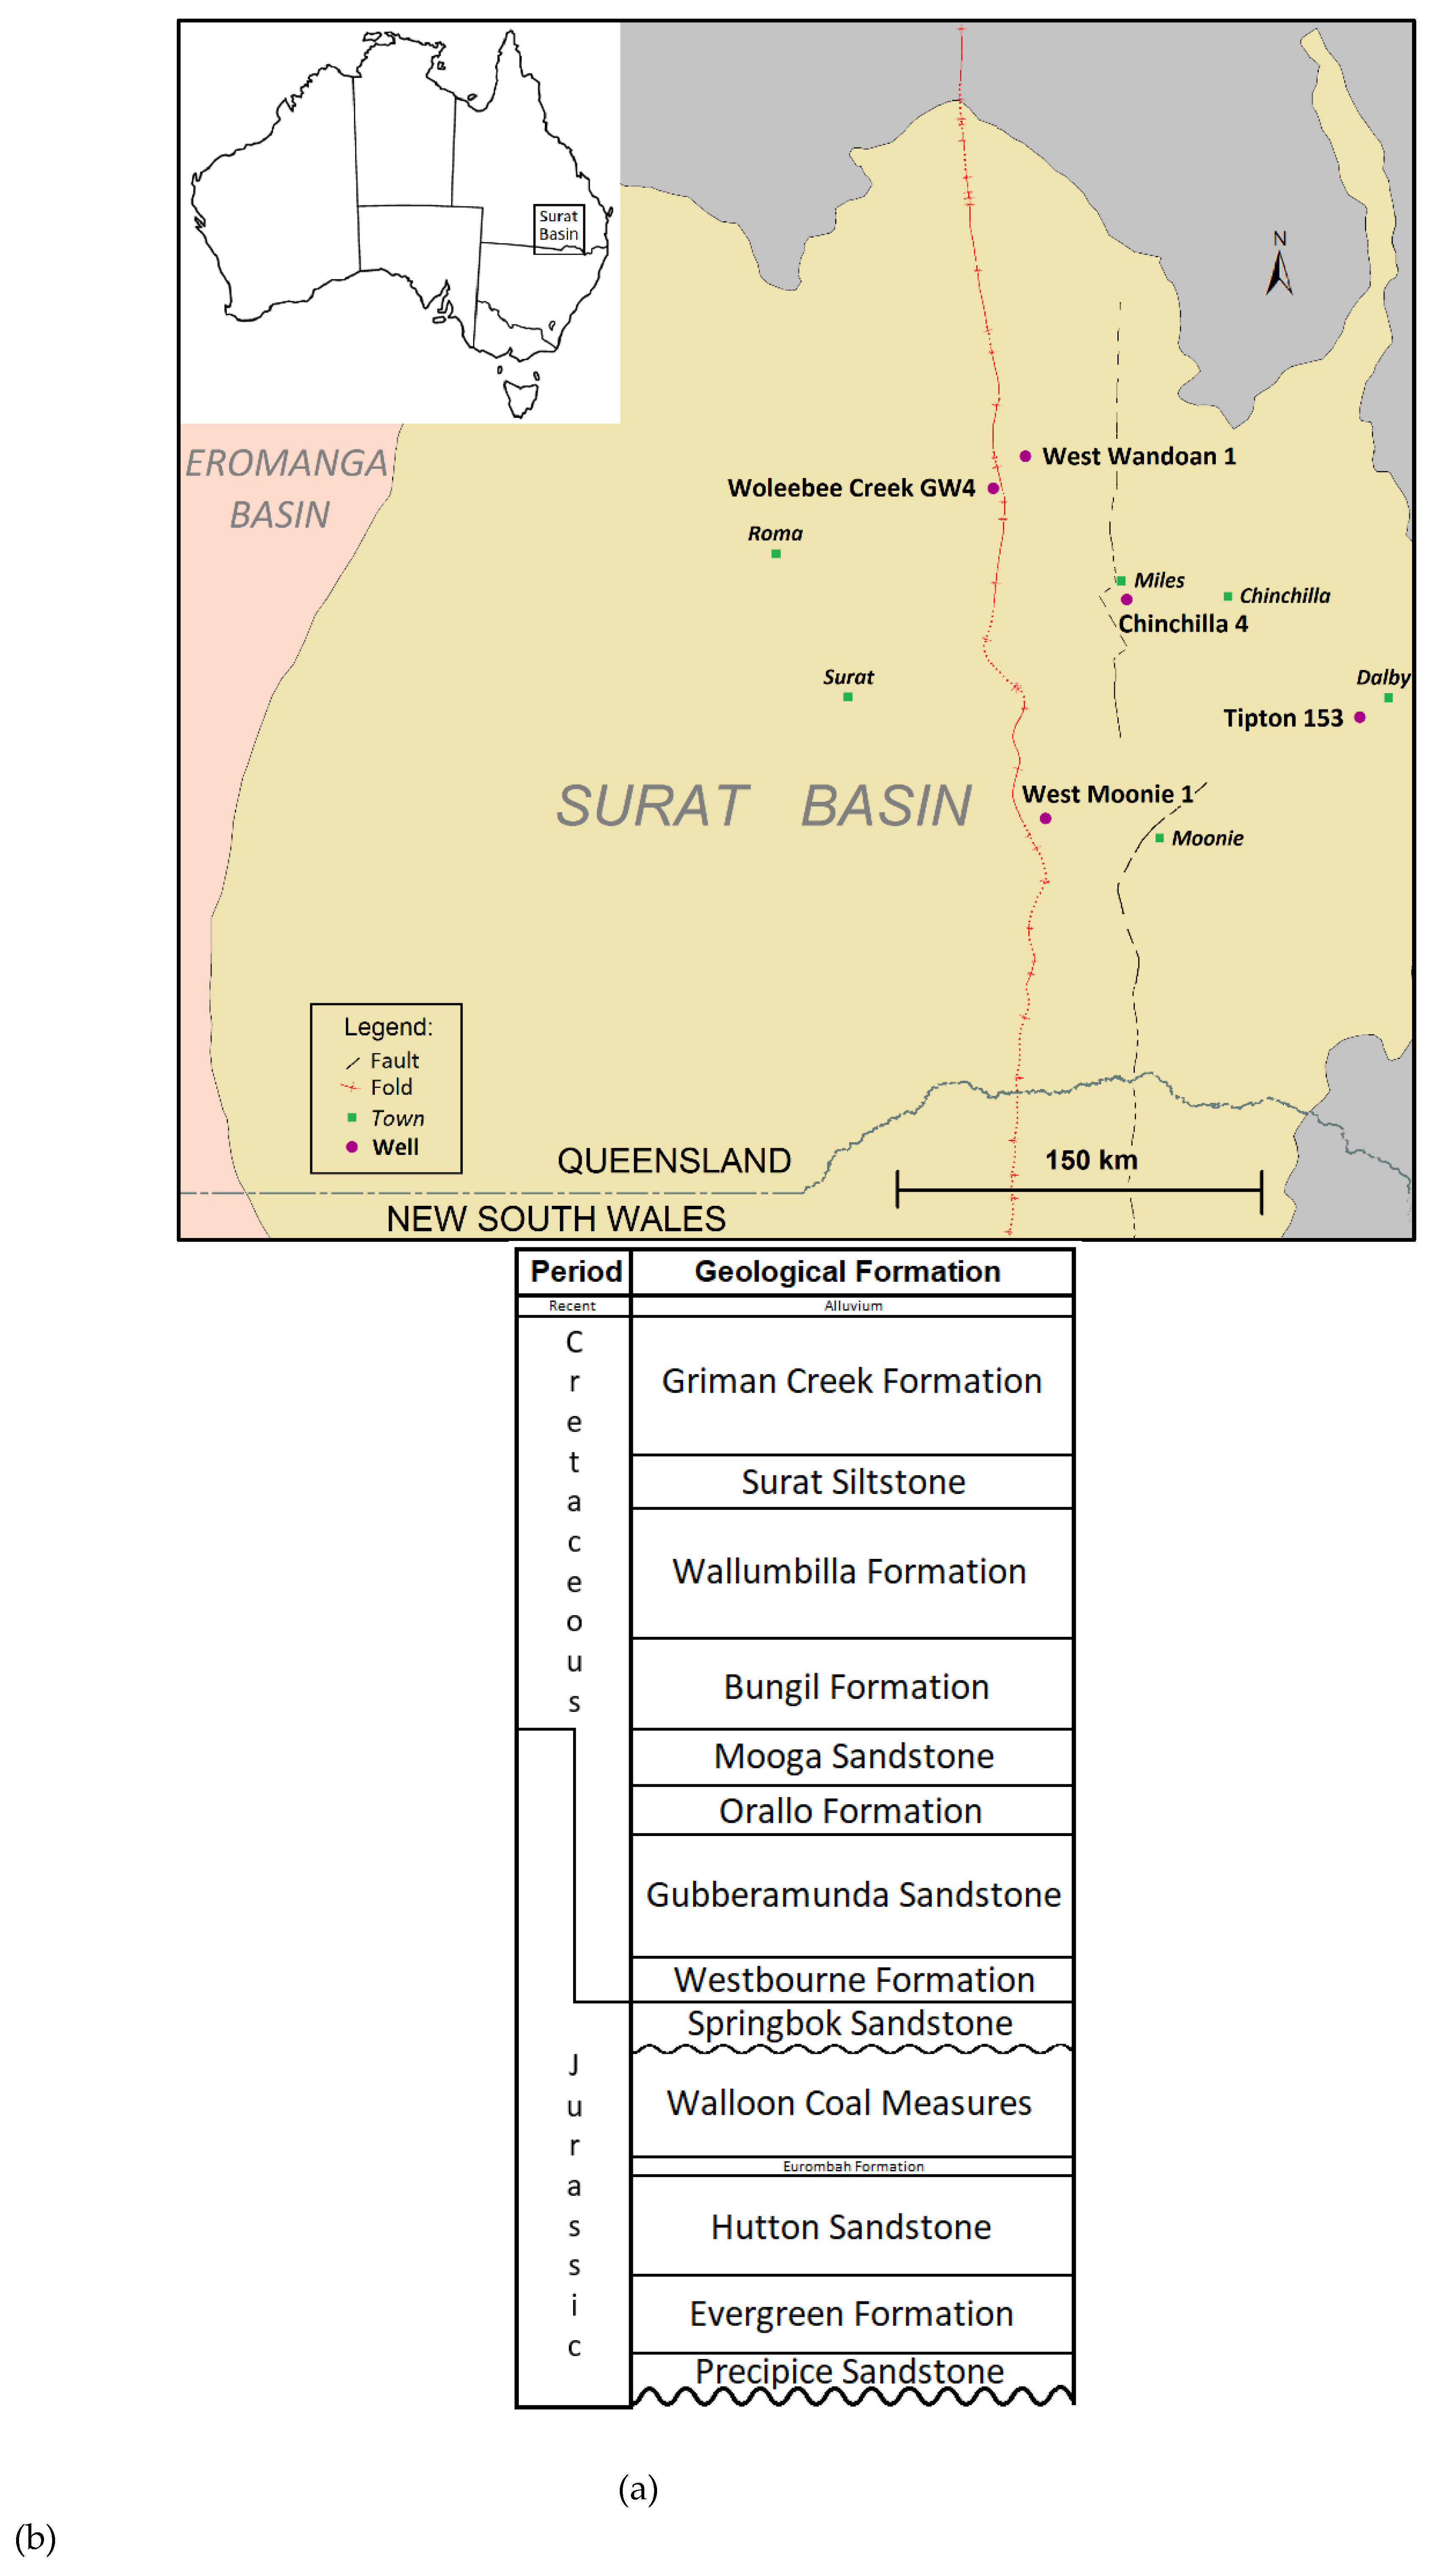
Figure 2.
Examples of QEMSCAN mineral maps of thin sections of core from Chinchilla 4: Sandstone interval 1215.47-1215.59 m (left) and interbedded siltstone/sandstone interval 1218.02-1218.10 m (right). The dark and purple areas in 1215.47-1215.59 m are intergranular porosity and siderite cement, respectively. The dark linear areas in 1218.02-1218.10 m are coalified organic matter.
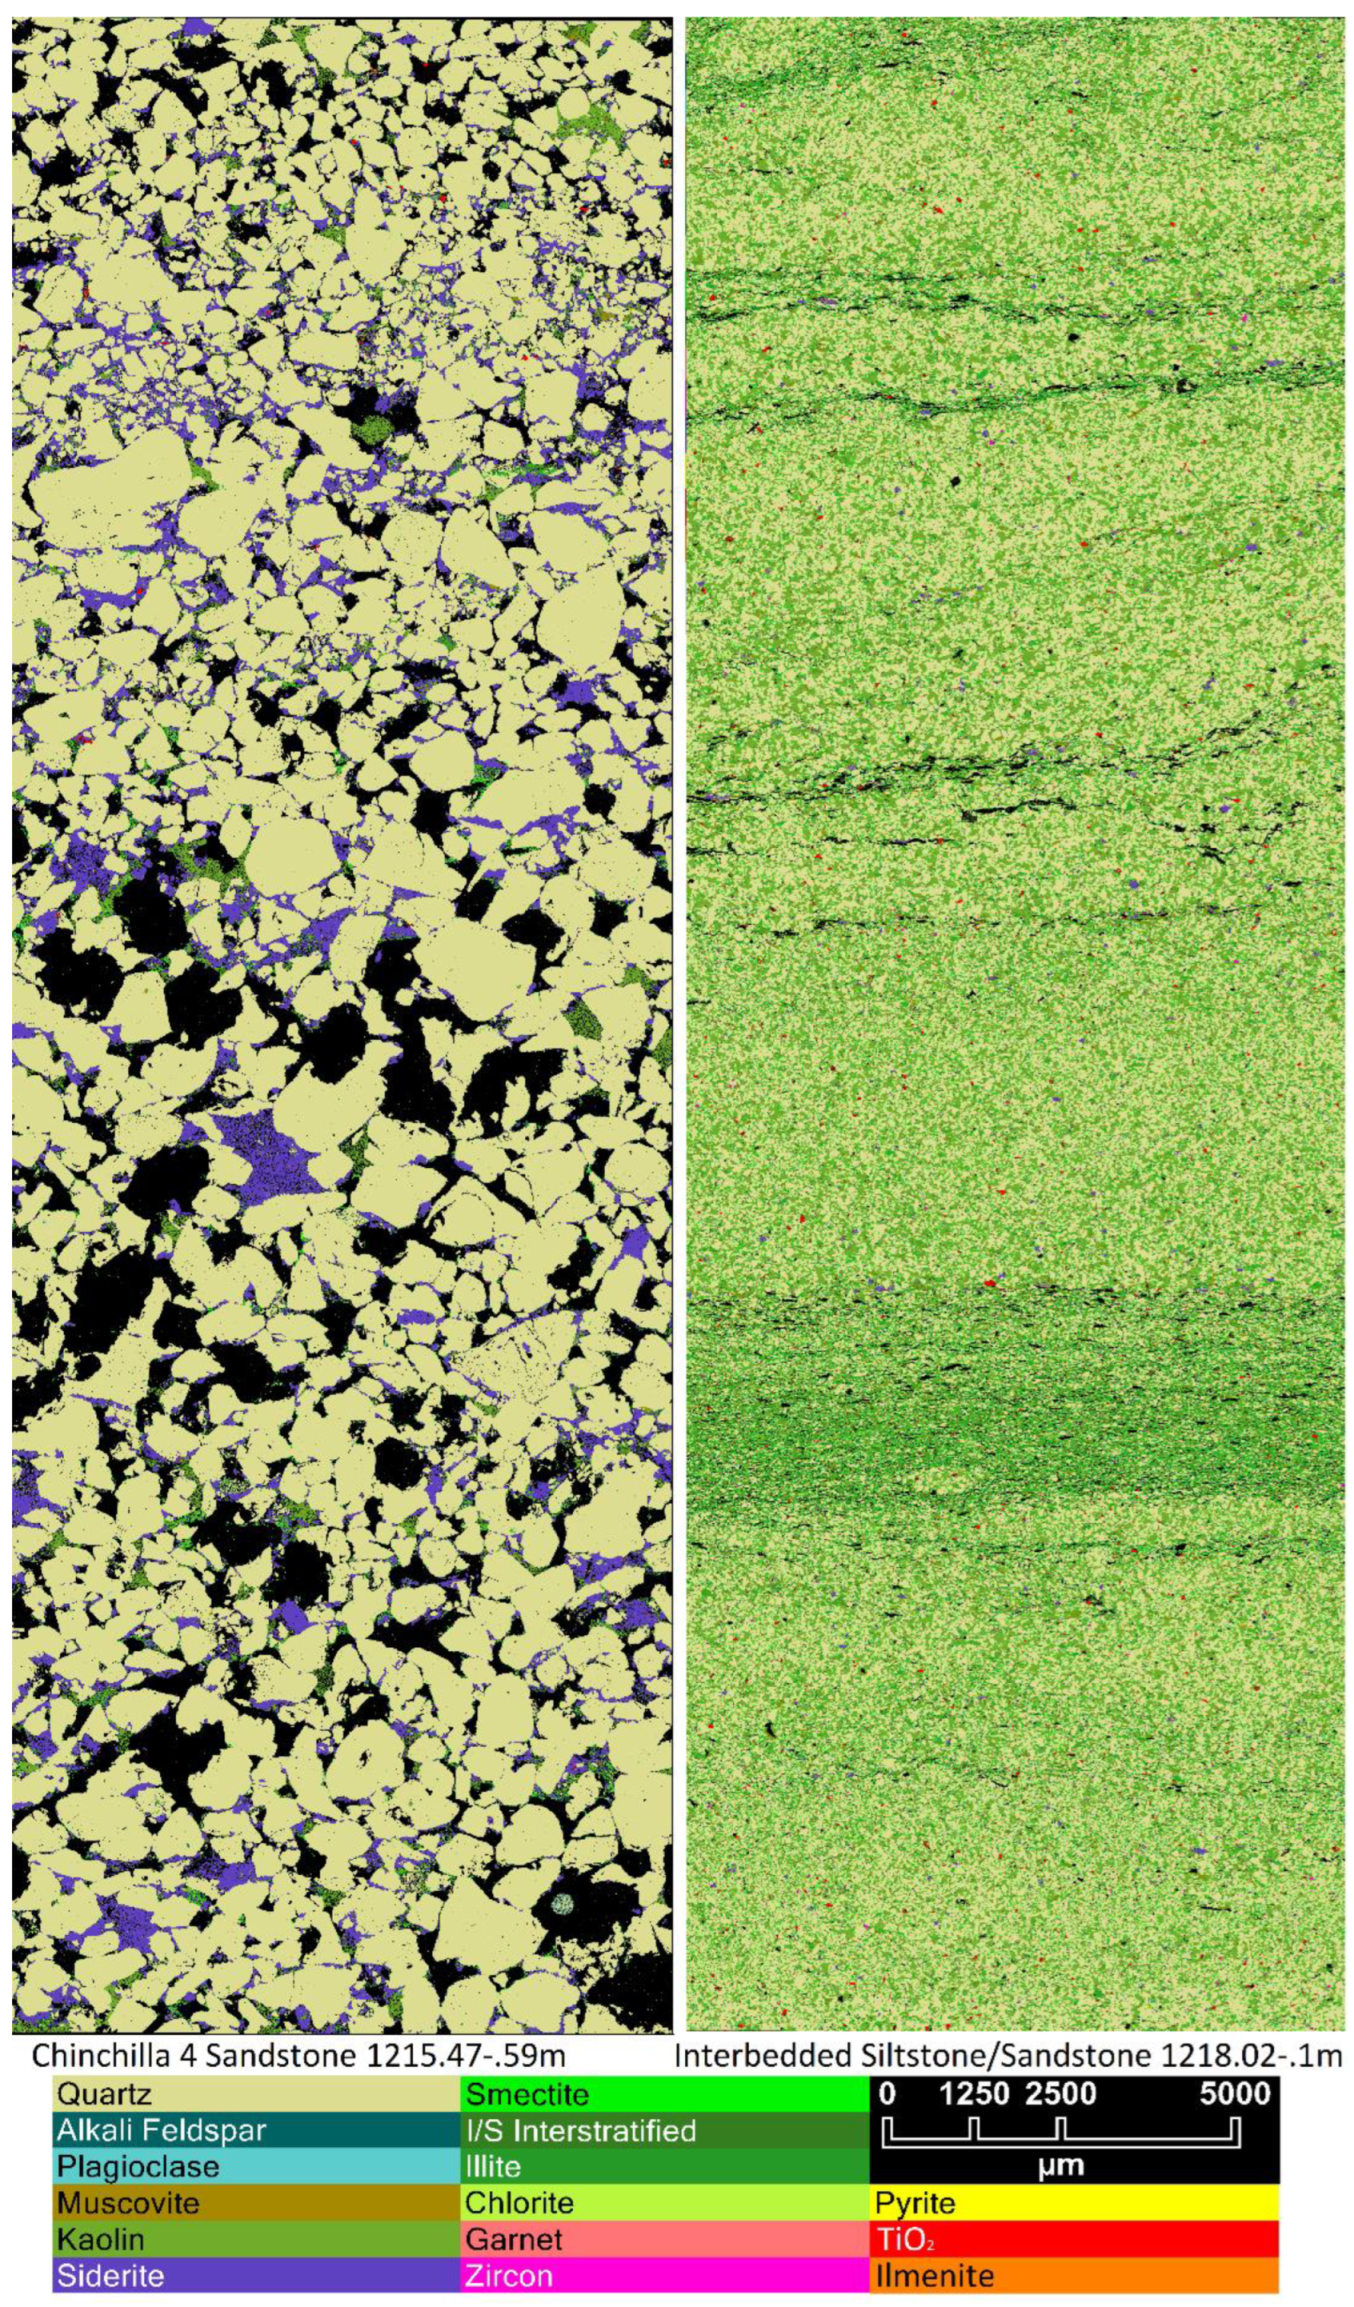
Figure 3.
(a) The linear relationship between water extracted sulfur (S) and potassium (K) for West Wandoan 1 (WW1) sandstones during the first step (S1) likely indicates contamination from concentrated drilling salts such as potassium sulfate used during coring in that well [16]; (b) whole rock (WR) sulfur and potassium data also shows a linear trend for WW1 sandstones but not for other samples.
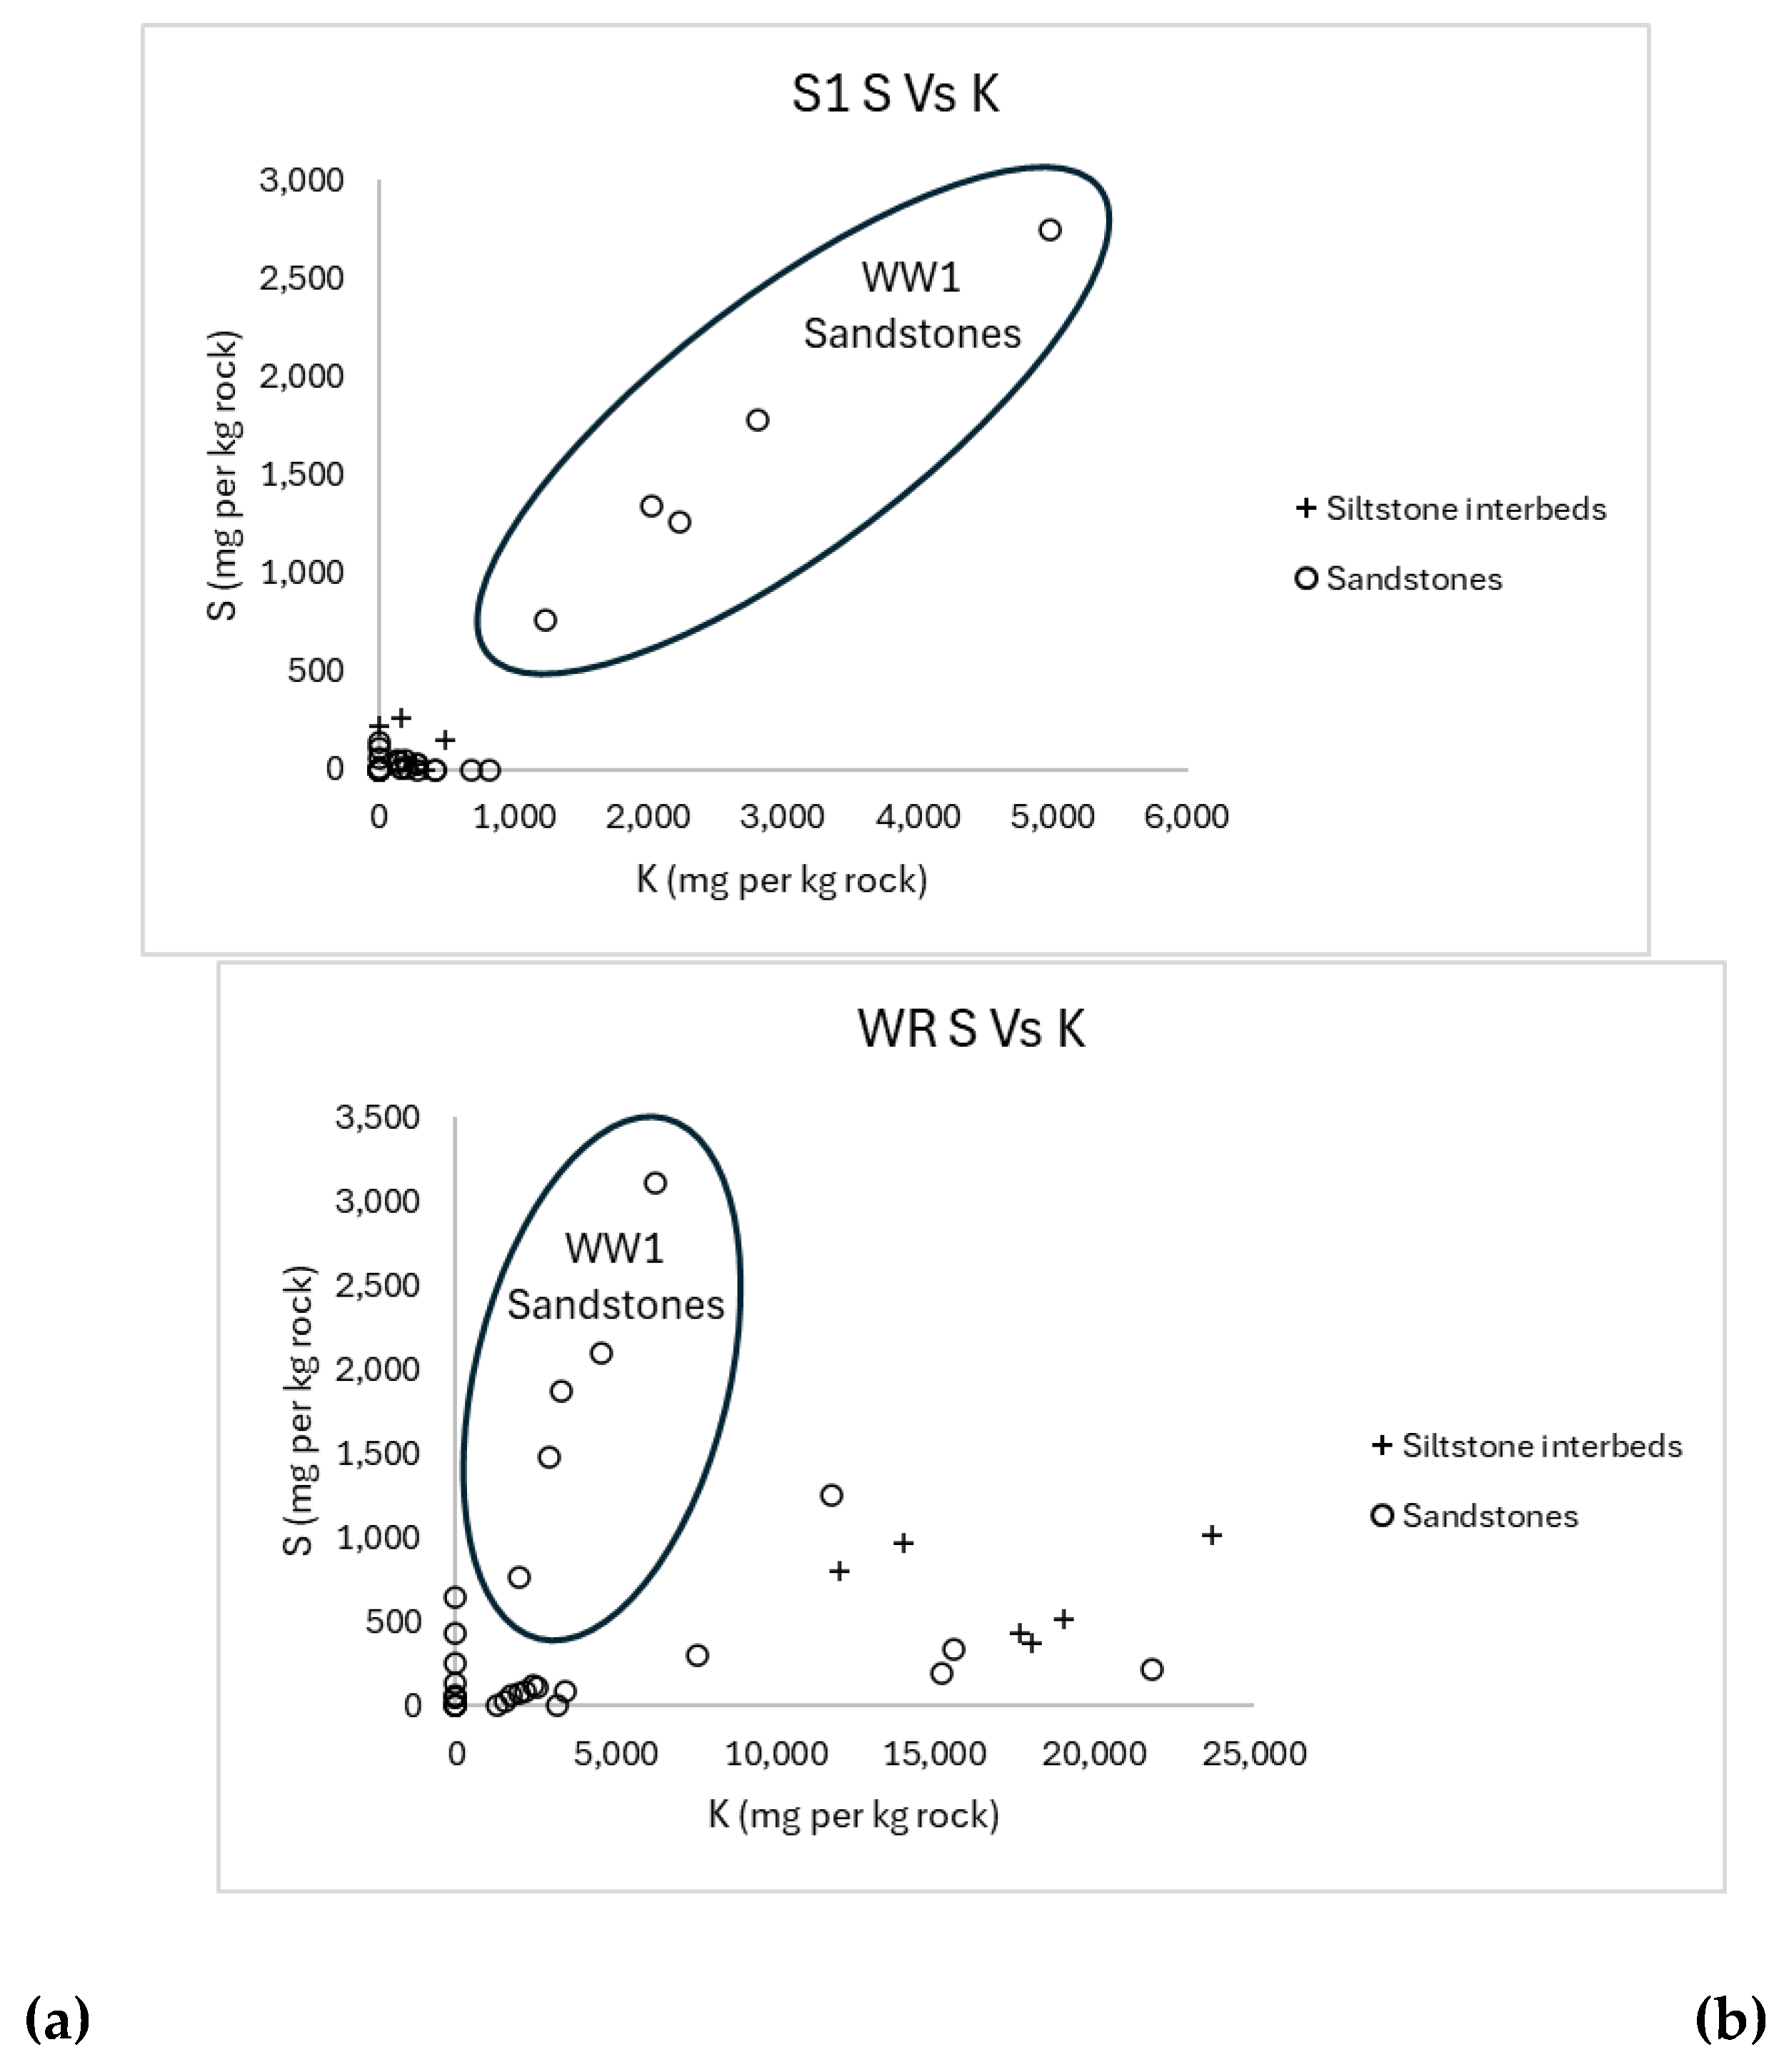
Figure 4.
A linear trend between cobalt (Co) and nickel (Ni) for both: (a) Extraction at pH 5 during the second step (S2); (b) total abundance within Precipice Sandstone whole rock (WR) samples.
Figure 4.
A linear trend between cobalt (Co) and nickel (Ni) for both: (a) Extraction at pH 5 during the second step (S2); (b) total abundance within Precipice Sandstone whole rock (WR) samples.
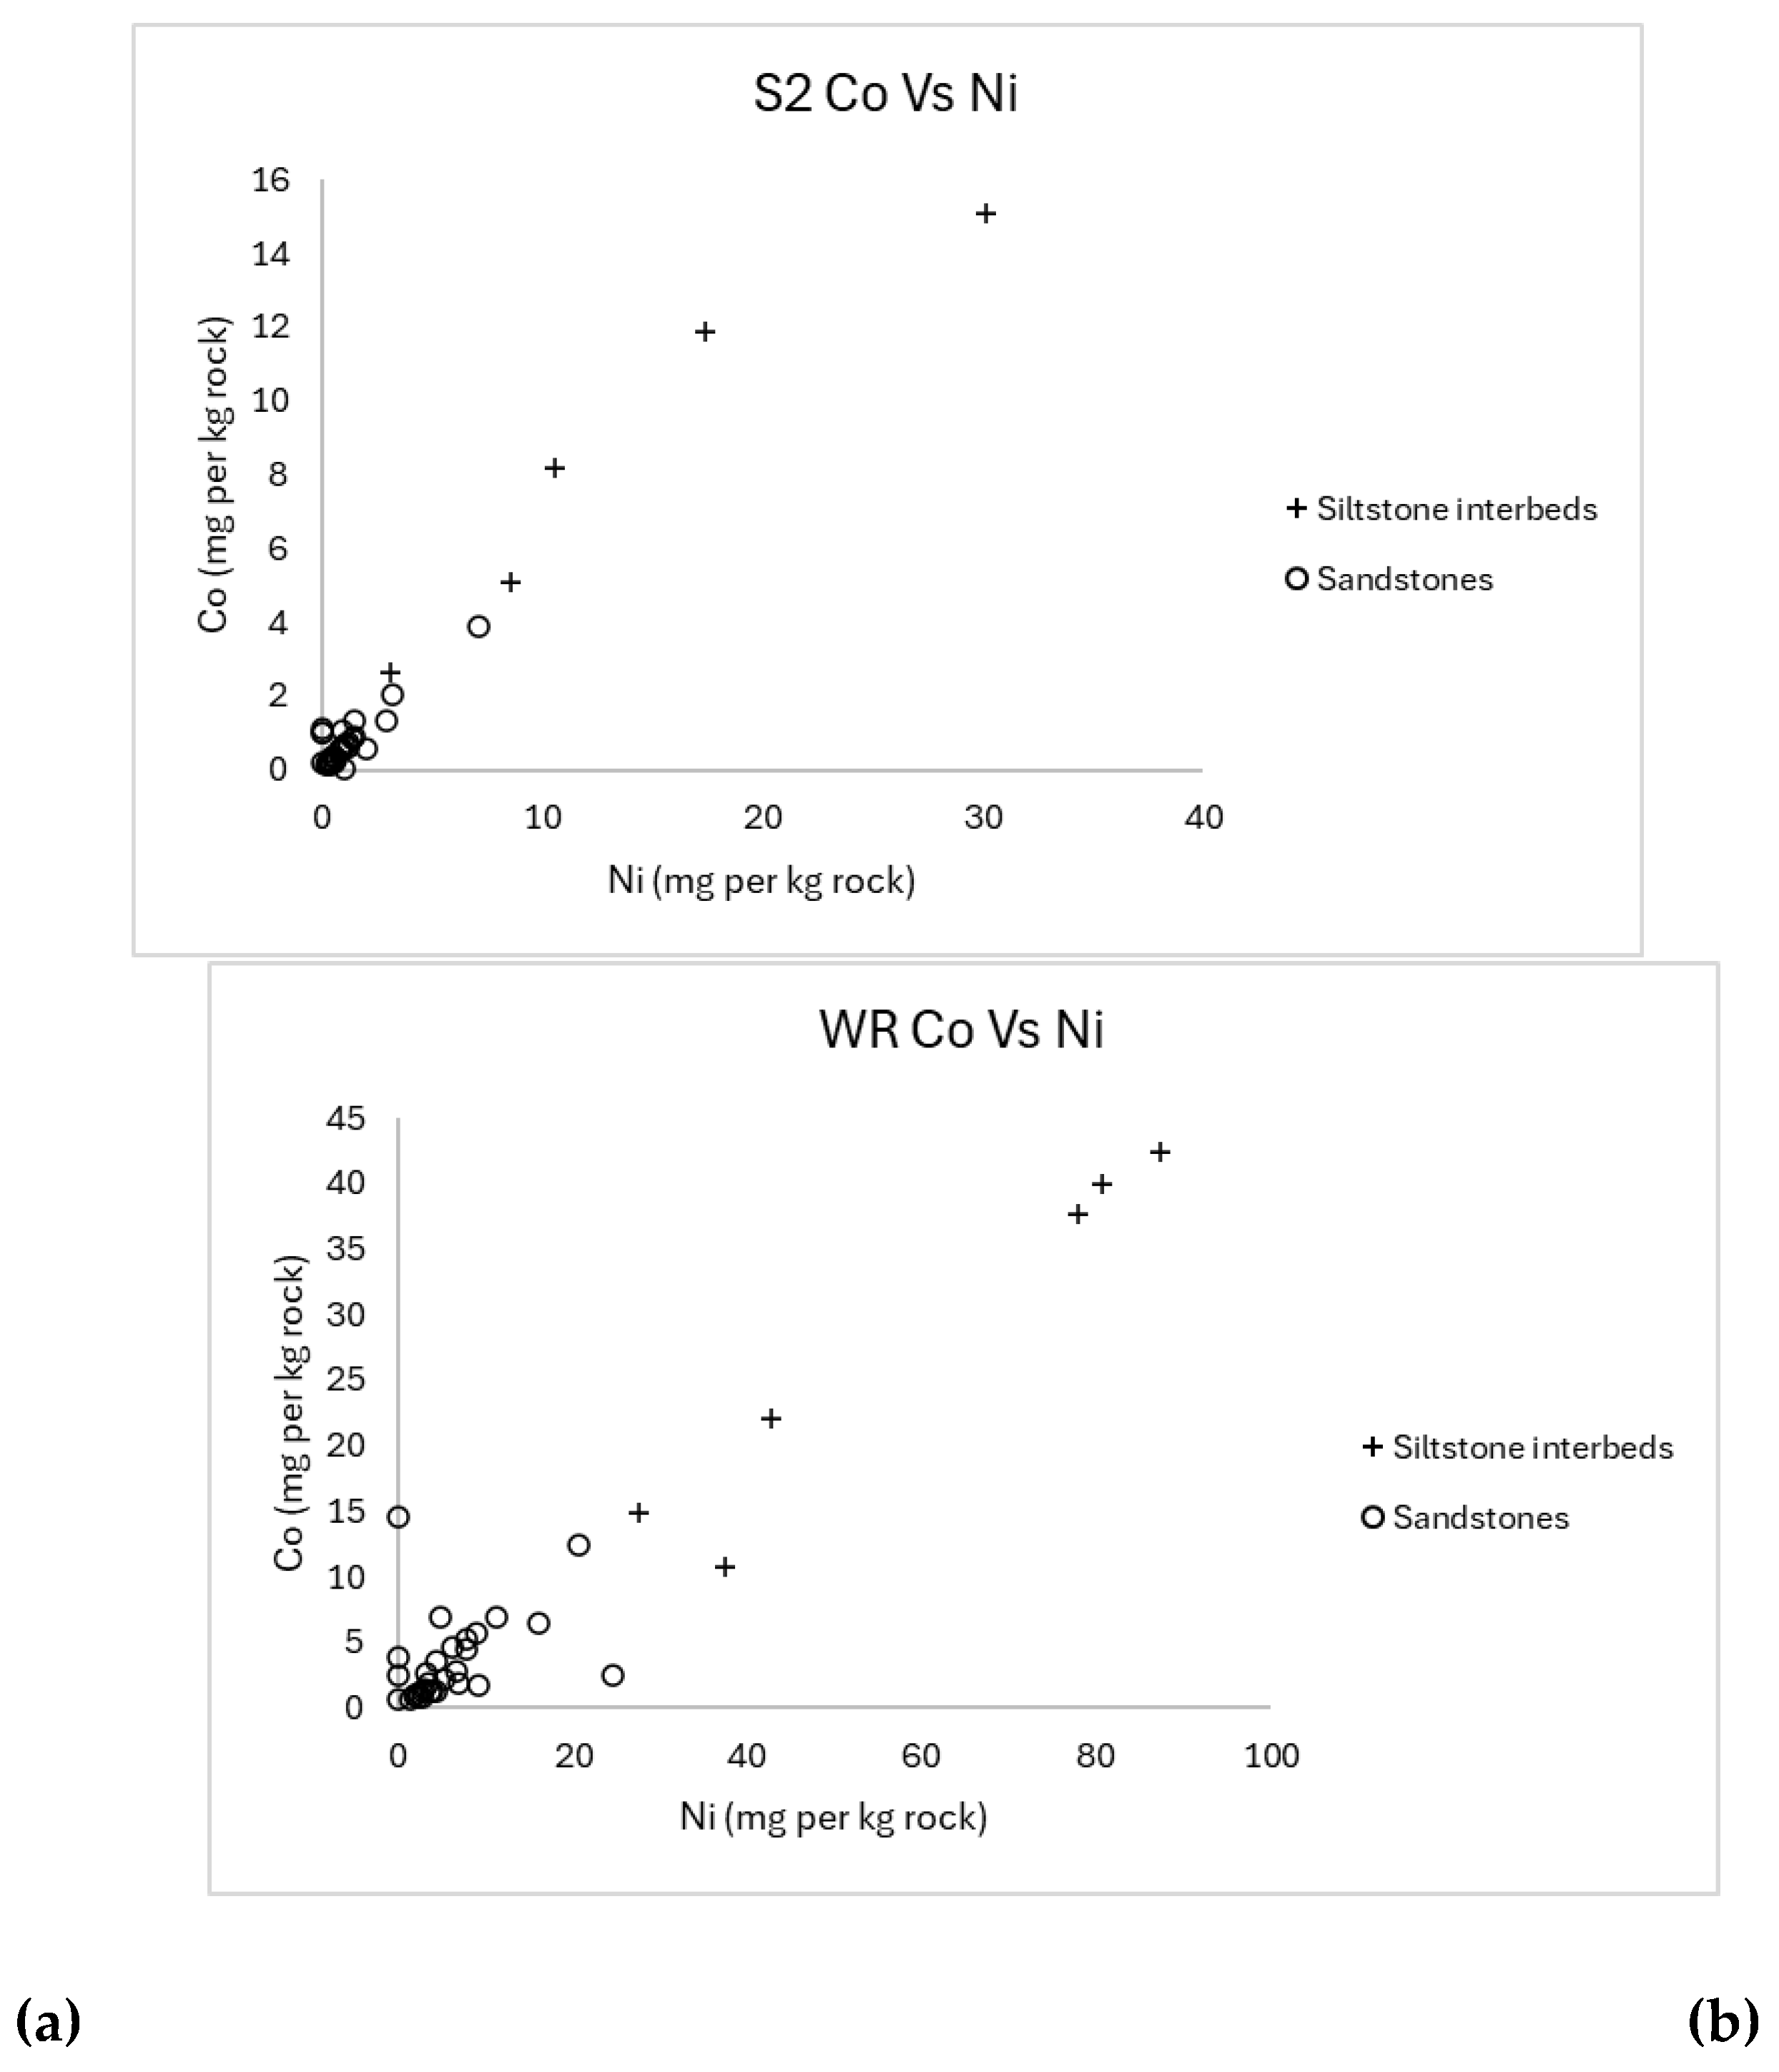
Figure 5.
A linear trend between thallium (Tl) and rubidium (Rb) for: (a) Extraction at pH 3 during the third step (S3); (b) total abundance within Precipice Sandstone whole rock (WR) samples.
Figure 5.
A linear trend between thallium (Tl) and rubidium (Rb) for: (a) Extraction at pH 3 during the third step (S3); (b) total abundance within Precipice Sandstone whole rock (WR) samples.
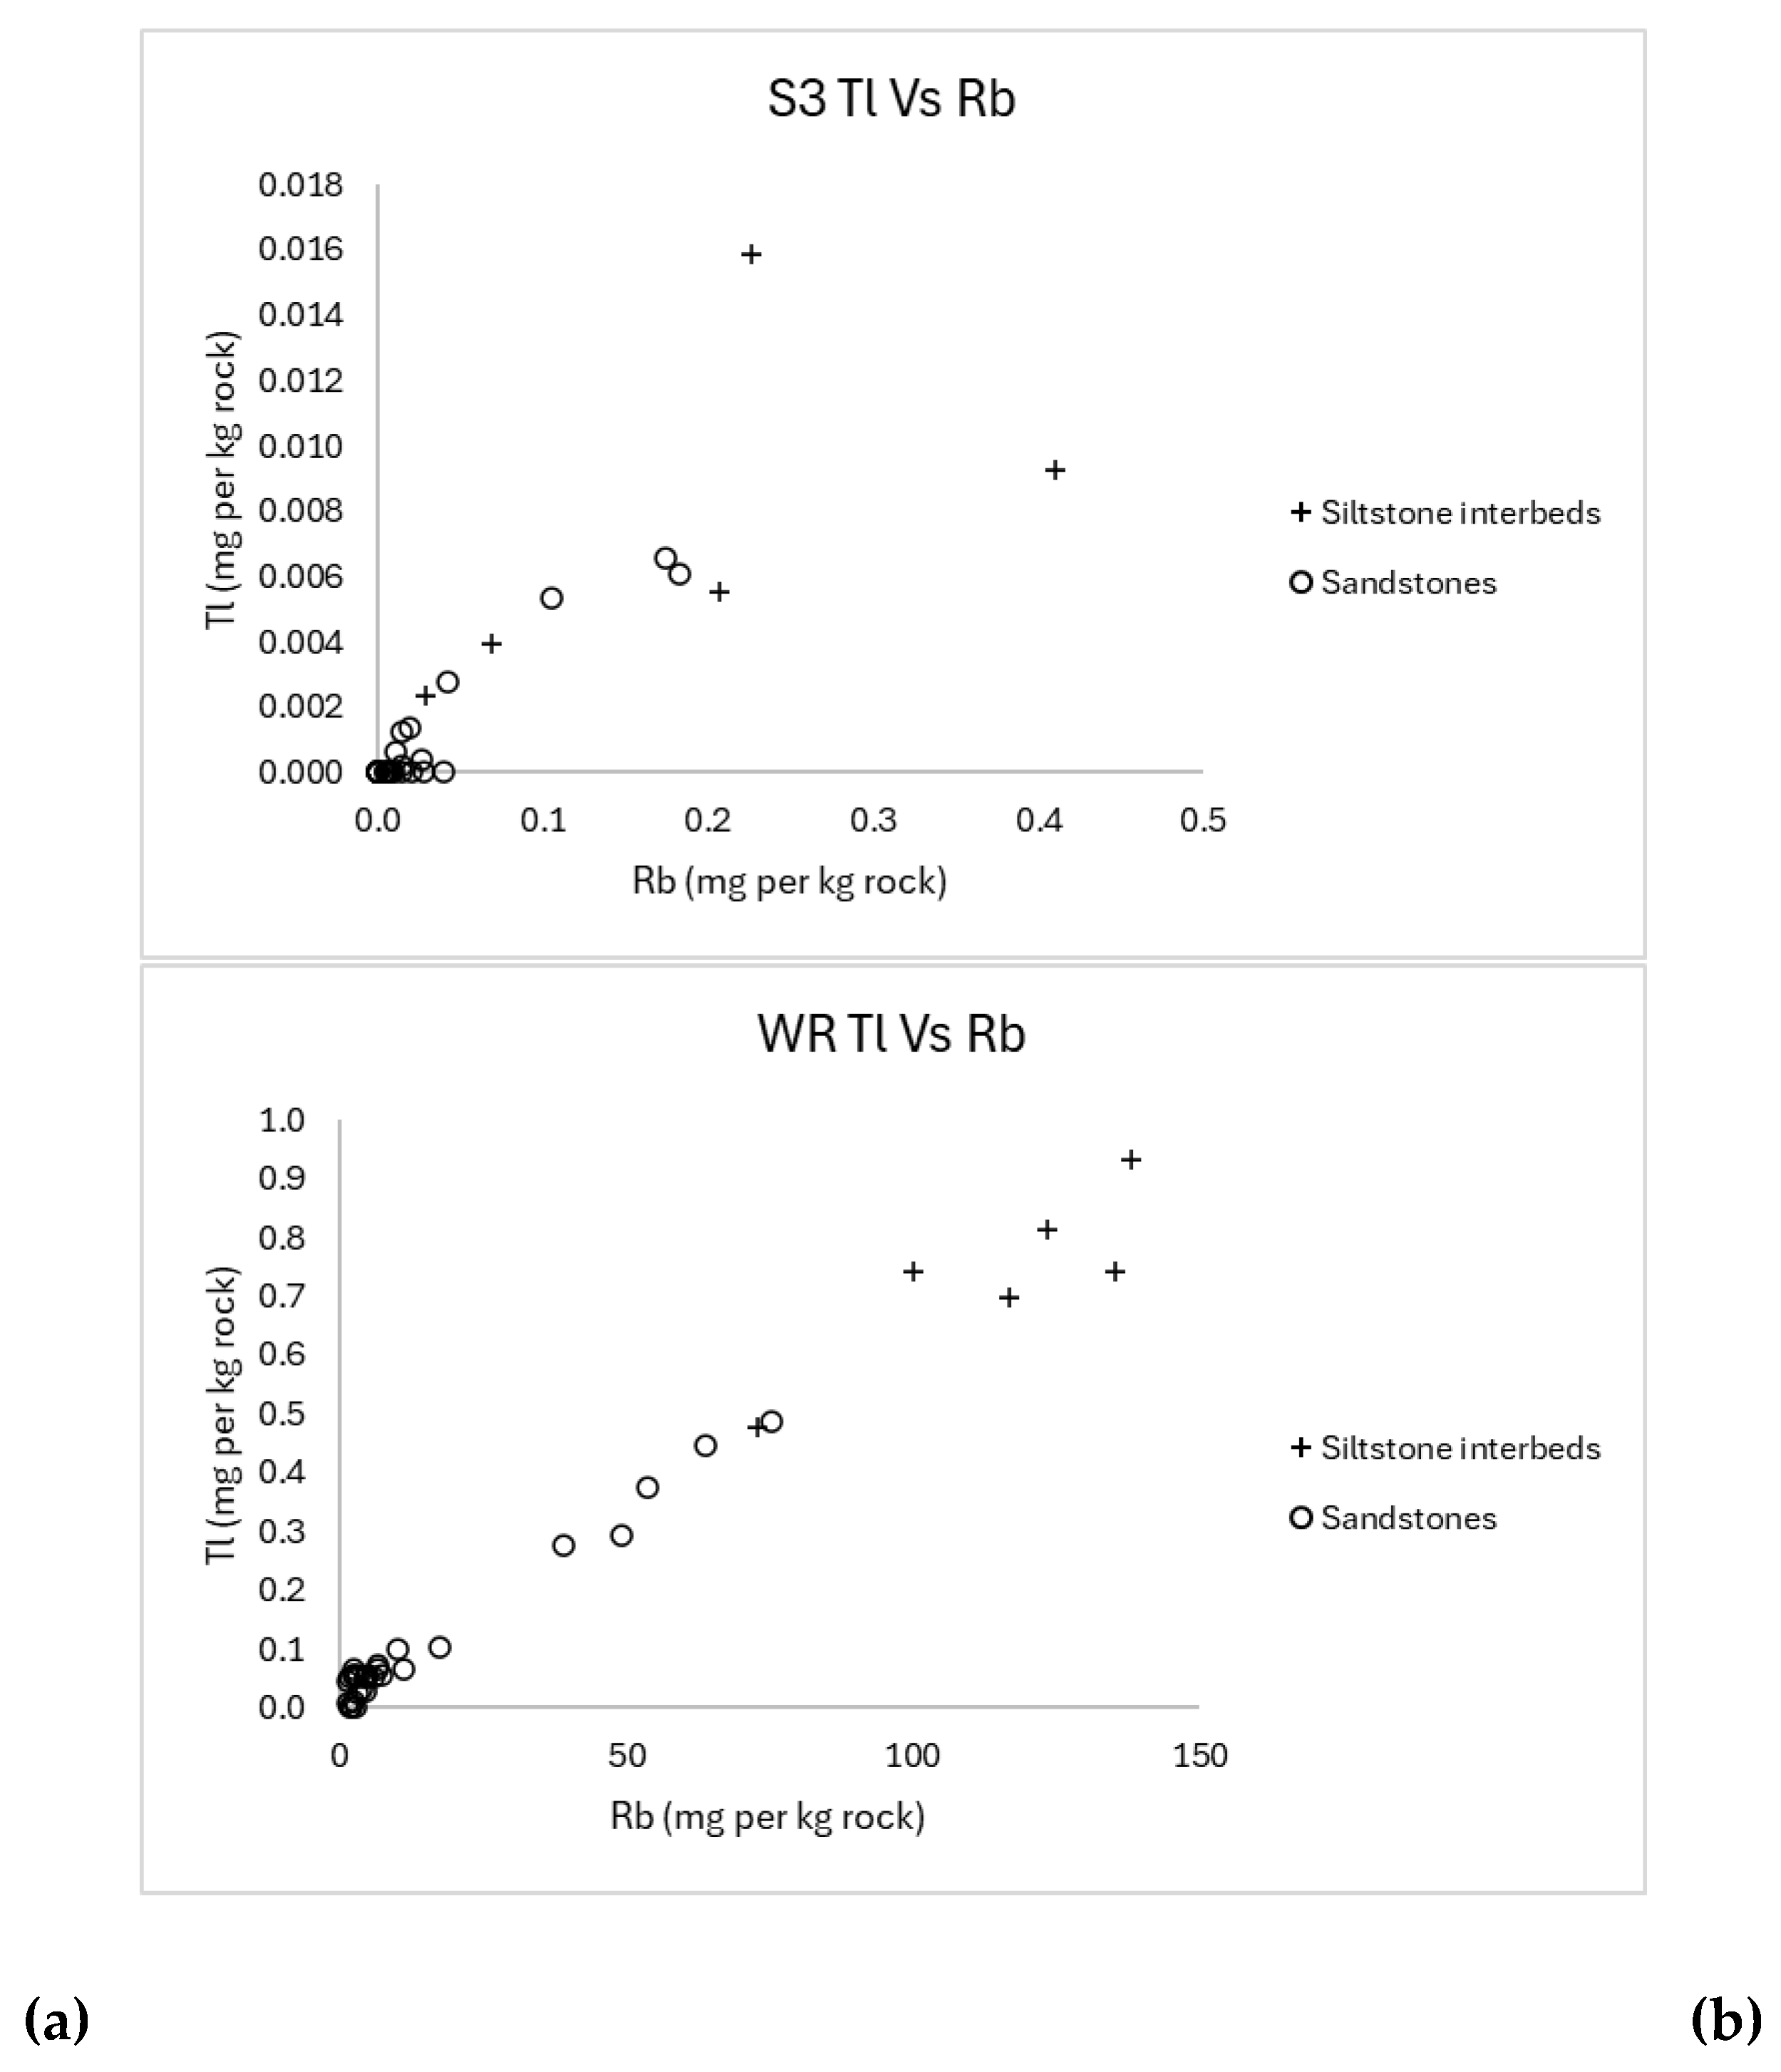
Table 1.
Average mineralogy* (%) of Precipice Sandstone samples.
| Tectosilicates | Phyllosilicates | Carbonates | Heavy Minerals | Unassigned | |||||||||||||||||
| Quartz | K-Feldspar | Plagioclase | Kaolinite | Micas/Illite | Smectite | I/S | Chlorite | Siderite | Dolomite | Ankerite | Calcite | Garnet | Ilmenite | Monazite | Pyrite | TiO2 | Zircon | ||||
| All | XRD | n = 36 | 82.0 | 1.2 | 7.7 | 6.8 | 0.8 | 1.1 | 0.08 | 0.1 | 0.06 | 0.01 | 0.08 | ||||||||
| SEM | n=22 | 79.3 | 0.6 | 0.5 | 11.1 | 3.7 | 2.4 | 0.8 | 0.06 | 0.9 | 0.01 | 0.05 | 0.2 | 0.01 | 0.2 | 0.03 | 0.08 | ||||
| Sandstones | XRD | n = 30 | 88.1 | 1.1 | 4.5 | 3.7 | 1.0 | 1.3 | 0.02 | 0.1 | 0.06 | 0.01 | 0.07 | ||||||||
| SEM | n=18 | 89.5 | 0.6 | 0.2 | 5.2 | 1.2 | 1.6 | 0.3 | 0.03 | 1.0 | 0.02 | 0.03 | 0.1 | 0.02 | 0.1 | 0.02 | 0.02 | ||||
| Interbedded | XRD | n = 6 | 51.3 | 1.9 | 23.3 | 22.0 | 0.3 | 0.4 | 0.4 | 0.2 | 0.09 | 0.2 | |||||||||
| SEM | n=4 | 33.4 | 0.5 | 1.7 | 37.6 | 15.0 | 6.4 | 3.1 | 0.2 | 0.3 | 0.01 | 0.1 | 0.7 | 0.01 | 0.6 | 0.08 | 0.3 | ||||
* SEM here refers to a combination of QEMSCAN and MLA of petrographic thin sections, whereas XRD assayed rock powders.
Table 2.
Median whole rock and element extraction data (mg element per kg rock, n = 36).
| Element* | Whole Rock | Step 1 (pH 7) | Step 2 (pH 5) | Step 3 (pH 3) | Sum of Acid Steps | Three Steps Summed |
| Al | 13,009 | <DL | 31 | 22 | 53 | 55 |
| As | 1 | 0.01 | 0.2 | 0.02 | 0.2 | 0.2 |
| Ba | 52 | 2 | 1 | 0.1 | 1 | 4 |
| Be | 0.2 | <DL | 0.009 | 0.006 | 0.01 | 0.01 |
| Bi | 0.06 | <DL | 0.01 | <DL | 0.01 | 0.01 |
| Ca | 122 | 13 | 4 | <DL | 5 | 18 |
| Co | 3 | 0.2 | 0.6 | 0.1 | 0.8 | 1 |
| Cr | 9 | <DL | 0.05 | 0.04 | 0.1 | 0.1 |
| Cs | 0.4 | 0.02 | 0.005 | <DL | 0.01 | 0.03 |
| Cu | 13 | 0.3 | 4 | 0.3 | 6 | 6 |
| Fe | 644 | <DL | 28 | 26 | 59 | 59 |
| Ga | 3 | 0.001 | 0.006 | 0.005 | 0.01 | 0.01 |
| Ge | 0.4 | <DL | 0.004 | 0.002 | 0.005 | 0.006 |
| Hf | 1 | <DL | <DL | <DL | <DL | <DL |
| K | 2,473 | 181 | <DL | <DL | <DL | 181 |
| Li | 4 | <DL | <DL | <DL | <DL | <DL |
| Mg | 148 | 4 | 2 | 1 | 4 | 7 |
| Mn | 10 | <DL | <DL | <DL | <DL | <DL |
| Mo | 0.2 | 0.003 | 0.001 | <DL | 0.001 | 0.01 |
| Na | 316 | 24 | <DL | <DL | <DL | 24 |
| Ni | 5 | 0.2 | 0.9 | 0.2 | 1 | 2 |
| P | 34 | <DL | <DL | <DL | <DL | <DL |
| Pb | 7 | 0.01 | 2 | 0.2 | 2 | 2 |
| Rb | 6 | 0.2 | 0.02 | 0.01 | 0.03 | 0.2 |
| REE | 33 | 0.001 | 0.1 | 0.05 | 0.2 | 0.2 |
| S | 205 | 16 | <DL | <DL | <DL | 19 |
| Sb | 0.2 | 0.008 | 0.01 | 0.003 | 0.02 | 0.02 |
| Sc | 1 | <DL | 0.04 | 0.008 | 0.05 | 0.05 |
| Si | 437,088 | <DL | <DL | <DL | <DL | <DL |
| Sn | 3 | <DL | 0.09 | 0.009 | 0.1 | 0.1 |
| Sr | 16 | 0.8 | 0.2 | 0.04 | 0.3 | 1 |
| Th | 3 | <DL | 0.02 | 0.006 | 0.03 | 0.03 |
| Ti | 834 | <DL | <DL | <DL | <DL | <DL |
| Tl | 0.06 | 0.007 | 0.0006 | <DL | 0.0006 | 0.01 |
| U | 0.7 | <DL | 0.01 | 0.004 | 0.02 | 0.02 |
| V | 10 | 0.01 | 0.06 | 0.09 | 0.2 | 0.2 |
| Y | 4 | <DL | 0.04 | 0.01 | 0.06 | 0.06 |
| Zn | 15 | 0.4 | 2 | 0.4 | 2 | 4 |
| Zr | 40 | <DL | 0.006 | <DL | 0.006 | 0.02 |
* Shading indicates median extraction greater than 1 mg of element per kg of rock (ppm).
Table 3.
Median element extraction (%) relative to whole rock element abundance, n = 36.
| Element* | Step 1 (pH 7) | Step 2 (pH 5) | Step 3 (pH 3) | Sum of Acid Steps | Three Steps Summed |
| Al | <DL | 0.2 | <0.01 | 0.2 | 0.4 |
| As | 0.4 | 16 | 2 | 18 | 20 |
| Ba | 3 | 2 | 0.1 | 3 | 6 |
| Be | <DL | 5 | 2 | 7 | 7 |
| Bi | <DL | 19 | <DL | 19 | 19 |
| Ca | 6 | 2 | <DL | 3 | 11 |
| Co | 10 | 25 | 3 | 31 | 41 |
| Cr | <DL | 0.3 | 0.2 | 0.5 | 0.8 |
| Cs | 4 | 1 | <DL | 2 | 5 |
| Cu | 4 | 40 | 3 | 44 | 53 |
| Fe | <DL | 1 | 2 | 3 | 3.2 |
| Ga | <0.01 | 0.1 | 0.1 | 0.2 | 0.4 |
| Ge | <DL | 0.6 | 0.3 | 1.2 | 1.3 |
| Hf | <DL | <DL | <DL | <DL | <DL |
| K | 1 | <DL | <DL | <DL | 1 |
| Li | <DL | <DL | <DL | <DL | <DL |
| Mg | 3 | 1 | 0.1 | 2 | 5 |
| Mn | <DL | <DL | <DL | <DL | <DL |
| Mo | 1 | 0.2 | <DL | 0.2 | 4 |
| Na | 6 | <DL | <DL | <DL | 6 |
| Ni | 6 | 18 | 3 | 21 | 28 |
| P | <DL | <DL | <DL | <DL | <DL |
| Pb | 0.1 | 31 | 2 | 35 | 36 |
| Rb | 2 | 0.2 | 0.1 | 0.5 | 3 |
| REE | <0.01 | 0.2 | <0.01 | 0.4 | 0.5 |
| S | 10 | <DL | <DL | <DL | 11 |
| Sb | 3 | 6 | 1 | 7 | 10 |
| Sc | <DL | 2 | 0.4 | 3 | 3 |
| Si | <DL | <DL | <DL | <DL | <DL |
| Sn | <DL | 3 | 0.3 | 3 | 3 |
| Sr | 6 | 1 | 0.1 | 2 | 8 |
| Th | <DL | 0.3 | <0.01 | 0.3 | 0.5 |
| Ti | <DL | <DL | <DL | <DL | <DL |
| Tl | 5 | 0.4 | <DL | 0.4 | 7 |
| U | <DL | 1 | 0.4 | 2 | 2 |
| V | 0.1 | 0.6 | 0.7 | 1 | 2 |
| Y | <DL | 0.5 | 0.2 | 0.8 | 0.8 |
| Zn | 3 | 9 | 2 | 13 | 20 |
| Zr | <DL | <0.01 | <DL | <0.01 | <0.01 |
* Shading indicates > 5 % median element extraction from rock.
Table 4.
Median most significantly* extracted elements from all samples (n=36).
| Extraction Step | Step 1 (pH 7) | Step 2 (pH 5) | Step 3 (pH 3) | |||||||||||||||||||||||||
| Element | Co | Ni | Sr | Tl | Ca | Na | S | Ba | K | Mg | As | Be | Bi | Co | Ni | Sb | Cu | Pb | Zn | Al | Ba | Ca | Fe | Mg | Al | Fe | Mg | |
| % of total | >5 | 10 | 6 | 6 | 5 | 6 | 6 | 10 | 3 | 1 | 3 | 16 | 5 | 19 | 25 | 18 | 6 | 40 | 31 | 9 | 0.2 | 2 | 2 | 1 | 1 | <0.01 | 2 | 0.1 |
| Rock ppm | >1 | 0.2 | 0.2 | 0.2 | 0.007 | 13 | 24 | 16 | 2 | 181 | 4 | 0.2 | 0.009 | 0.01 | 0.6 | 0.9 | 0.01 | 4 | 2 | 2 | 31 | 1 | 4 | 28 | 2 | 22 | 26 | 1 |
* In terms of mass extracted (> 1 mg element per kg rock) and/or proportion mobilized (> 5 %).
Disclaimer/Publisher’s Note: The statements, opinions and data contained in all publications are solely those of the individual author(s) and contributor(s) and not of MDPI and/or the editor(s). MDPI and/or the editor(s) disclaim responsibility for any injury to people or property resulting from any ideas, methods, instructions or products referred to in the content. |
© 2025 by the authors. Licensee MDPI, Basel, Switzerland. This article is an open access article distributed under the terms and conditions of the Creative Commons Attribution (CC BY) license (http://creativecommons.org/licenses/by/4.0/).
Copyright: This open access article is published under a Creative Commons CC BY 4.0 license, which permit the free download, distribution, and reuse, provided that the author and preprint are cited in any reuse.


