
Submitted:
20 June 2025
Posted:
24 June 2025
You are already at the latest version
Abstract
Underground hydrogen storage (UHS) in carbonate and siliceous formations presents a promising solution for managing intermittent renewable energy. However, experimental data on hydrogen-rock interactions under representative subsurface conditions remains limited. This study systematically investigates mineralogical and petrophysical altera-tions in dolomite, calcite-rich limestone, and quartz-dominant siliceous cores subjected to high-pressure hydrogen (100 bar, 70°C, 100 days). Distinct from prior research focused on diffraction peak shifts, our analysis prioritizes quantitative changes in mineral concentra-tion (%) as a direct metric of reactivity and structural integrity, offering more robust in-sights into long-term storage viability.
Hydrogen exposure induced significant dolomite dissolution, evidenced by reduced crys-talline content (from 12.20% to 10.53%) and accessory phase loss, indicative of partial de-carbonation and ankerite-like formation via cation exchange. Conversely, limestone ex-hibited more pronounced carbonate reduction (vaterite from 6.05% to 4.82% and calcite from 2.35% to 0%), signaling high reactivity, mineral instability, and potential pore clog-ging from secondary precipitation. In contrast, quartz-rich cores demonstrated exceptional chemical inertness, maintaining consistent mineral concentrations.
Furthermore, BET and BJH analyses revealed enhanced porosity and permeability in do-lomite (pore volume increased >10x), while calcite showed declining properties and quartz negligible changes. SEM-EDS supported these trends, detailing Fe migration and textural evolution in dolomite, microfissuring in calcite, and structural preservation in quartz.
This research establishes a unique experimental framework for understanding hydrogen–rock interactions under reservoir-relevant conditions. It provides crucial insights into mineralogical compatibility and structural resilience for UHS, identifying dolomite as a highly promising host and highlighting calcitic rocks limitations for long-term hydrogen containment.
Keywords:
underground hydrogen storage
; hydrogen-rock interactions
; dolomite
; petrophysical properties
; geochemical reactivity
1. Introduction
In light of the rapid expansion of hydrogen production and its adoption as a clean energy carrier, there is a growing need for subsurface geological storage solutions capable of balancing fluctuations in supply driven by variable renewable electricity input and seasonal variations in demand, thereby enhancing long-term energy security [1]. While salt caverns are considered a promising option due to their operational flexibility [2,3], porous reservoirs such as depleted gas fields [4] and deep saline aquifers [5] despite their broader availability still require comprehensive investigation to assess their geochemical behavior and effectiveness as safe and efficient media for hydrogen storage[6,7].
The study of geochemical processes within underground hydrogen storage systems is of critical importance, particularly those that may contribute to hydrogen loss during storage operations [8]. Although the past decade has seen numerous investigations ranging from geochemical modeling and to experimental studies [9,10,11,12] across various rock types the current understanding of the physicochemical interactions between hydrogen and geological formations remains limited and requires further systematic development [13,14].
Hydrogen loss during high-pressure underground hydrogen storage (UHS) is primarily attributed to geochemical and microbial interactions that typically occur under reservoir conditions characterized by temperatures below 127 °C and pressures below 350 bar. Understanding these interactions is essential for evaluating hydrogen mobility and reactivity within geological media, which is key to enhancing storage monitoring and ensuring long-term operational stability [15].
Hydrogen-rock interactions are influenced by various factors, including mineral composition, storage pressure and temperature, pore structure, and the rock’s specific properties such as heterogeneity, mechanical stability, organic content, and wettability behavior [16]. These physical, chemical, and biological interactions can induce changes in permeability, porosity, and wettability [15,17,18], as well as trigger microfracture activation directly impacting the long-term safety and efficiency of geological hydrogen storage systems [19].
In this context, Al-Yaseri et al. [17] investigated carbonate cores exposed to hydrogen for 75 days (48 bar, 75°C), revealing that calcite expansion reduced effective porosity by 47%, significantly impairing limestone storage capacity. In contrast, dolomite showed a slight (~6%) improvement due to a balance between dissolution and grain expansion. In another study by Al-Yaseri et al. [9] exposed calcite-rich shale samples from the EFS and WCS formations to hydrogen at 9.65 MPa and 348 K for 108 days. Calcite precipitation occurred due to organic matter interactions, with no sulfate or pyrite reduction. Minimal pore changes were observed, indicating preserved rock integrity and suitability for geological hydrogen storage. Bo et al.[20] suggest that calcite-free reservoirs and caprocks are geochemically more suitable for underground hydrogen storage, as carbonate presence particularly calcite can induce hydrogen dissociation during dissolution, leading to losses of up to 9.5%. The study by Cheng et al.[21] demonstrated that hydrogen interaction with pyrite-free Buntsandstein sandstone is limited, even after exposure to 150 bar and 100°C for four weeks. No significant mineralogical transformations were observed, and no noticeable changes were detected in key petrophysical properties such as porosity and permeability, confirming the rock’s suitability for hydrogen storage. Flesch et al. [22]investigated how sandstone formations respond petrographically and petrophysically to hydrogen exposure. The study revealed a moderate decline in median porosity from 13.3% to 11.9% accompanied by a notable increase in permeability, rising from 48.78 mD to 61.53 mD. Interestingly, in some cases, an inverse behavior was observed, with porosity increasing while permeability declined. The observed porosity increase was primarily attributed to the dissolution of pore-filling phases such as anhydrite and carbonate minerals, whereas permeability remained relatively unaffected. In a recent study, Al-Yaseri et al. [23] examined the geochemical interaction of hydrogen with sandstone and limestone formations under 75°C and 96 bar for six months. Only minor morphological changes were observed, with slight reductions in porosity from 14.4% to 13.33% for sandstone and from 20.2% to 18.44% for limestone. These results indicate limited H2 reactivity. Overall, the minimal hydrogen loss confirms the potential of sandstone and limestone as suitable candidates for underground hydrogen storage.
Building upon the existing knowledge gaps concerning the mineralogical and petrophysical responses of geological formations to hydrogen exposure, this study adopted a comprehensive experimental methodology to evaluate three representative lithologies: dolomite, calcite-rich limestone, and quartz-dominated siliceous rock. The investigations focused on quantifying hydrogen-induced changes in crystallographic structure and in characteristics related to: porosity, permeability, and elemental distribution. By integrating XRD, BET/BJH, SEM-EDS and poro-perm analyses, the study allowed a rigorous comparison of reactivity and structural integrity between the analyzed rock types, under reservoir-relevant conditions. The results discussed in the following section provide valuable insights into the physicochemical mechanisms governing hydrogen-rock interactions, with implications for assessing.
2. Materials and Methods
The research program included laboratory experiments that aimed to evaluate the effect of hydrogen gas (Linde, purity 5.0) on three distinct rock types: dolomite (CaMg(CO3)2), vaterite-rich limestone (CaCO3), and a siliceous sample composed predominantly of quartz. These samples were labeled A, B, and C, respectively, as shown in Figure 1. The experiments were designed to simulate subsurface underground hydrogen storage conditions.
To identify geochemical alterations and variations in petrophysical properties induced by hydrogen exposure, a combination of analytical techniques was employed. The petrophysical properties of the rock cores were characterized both before and after hydrogen treatment to assess the extent of any changes.
Mineralogical analysis was performed using X-ray diffraction (XRD) with a D8 Advance diffractometer (Bruker-AXS, Karlsruhe, Germany) operating with Cu-Kα radiation (λ = 1.54 Å), equipped with a nickel filter, θ-θ geometry, and a Bragg–Brentano configuration. XRD measurements were carried out under the following conditions: 40 kV, 40 mA, a step size of 0.1°, a scan speed of 0.1° per 5 seconds, and a 2θ scan range from 5° to 60°.
Permeability and porosity measurements of the rock cores were conducted using a GASPERM permeameter (Vinci Technologies, France) and a helium porosimeter (He-Porosimeter, Vinci Technologies, France), respectively.
To analyze textural changes such as BET surface area, pore size distribution, and mean pore diameter, nitrogen adsorption–desorption isotherms were recorded using a Quantachrome NOVA 2200e gas adsorption analyzer (Boynton Beach, FL, USA). Isotherms were collected at 77.35 K over a relative pressure range (p/p0) of 0.005 to 1.0, and the data were processed using NovaWin software, version 11.03.
Additionally, morphological changes and elemental composition of the rock samples before and after hydrogen treatment were examined using scanning electron microscopy (SEM). A Hitachi S-3400N SEM and an FEI SEM system (Hillsboro, OR, USA), both equipped with energy-dispersive X-ray spectroscopy (EDS), were utilized. SEM images were acquired at an accelerating voltage of 2 kV, while EDS analyses were conducted at 30 kV.
Initially, cylindrical rock samples (core plugs) were placed in a stainless-steel test cell. The cell had a diameter of 3.5 cm, a wall thickness of 1 cm, and a length of 50 cm, and was designed to withstand pressures up to 250 bar. It was equipped with a gas inlet fitted with a pressure gauge and a sealed outlet connected to a flowmeter for monitoring hydrogen flow.
Hydrogen gas was introduced into the cell until a pressure of 100 bar was reached, using a 50 L hydrogen cylinder pressurized to 200 bar and regulated with a pressure controller. The rock samples were exposed to the hydrogen atmosphere for 100 days under constant pressure (100 bar). The internal temperature of the cell was monitored using a thermocouple and maintained at 70°C throughout the experiment. After exposure, the samples were retrieved and stored under a hydrogen atmosphere for subsequent characterization analyses.
3. Results and Discussions
3.1. X-Ray Diffraction (XRD) Analysis
The X-ray diffraction (XRD) analysis conducted on the untreated dolomite sample (Core A) revealed distinct and intense reflections at 2θ value equal with 24.10°, 30.88°, 37.25°, 41.05°, 44.85° and 50.90°, corresponding to the characteristic crystallographic planes of dolomite [24,25,26], as presented in Figure 2. Additionally, minor peaks related to chlorite and calcite were identified at 6.2° and 29.5°, attributed to the (001) and (104) planes, respectively [26,27]. Quartz-related peaks were also observed at 20.8° and 26.6°, assigned to the (100) and (101) planes, respectively [28], alongside a weak reflection for illite at 8.9° (001 plane) [29].
Following hydrogen exposure at 100 bar and 70 °C, the XRD patterns of the treated dolomite sample (Core AH) (Figure 2) revealed significant mineralogical and structural transformations. A marked reduction in the intensity of the characteristic reflections at 24.1° and 41.05°, corresponding to the (012) and (113) planes, was observed. Additionally, reflections associated with calcite, chlorite, and illite diminished or disappeared entirely. These changes are attributed to the ability of hydrogen to induce partial dissolution and destabilization of the mineral’s crystalline structure, possibly due to phase transformation or local rearrangement of the crystal lattice [30] . The process is illustrated by the dissolution mechanism of dolomite, which leads to the release of constituent ions and rearrangement within the mineral matrix, the following reaction describes the hydrogen-induced breakdown of dolomite in the presence of moisture [17,30,31,32]:
These pathways suggest that dolomite undergoes hydrogen-driven destabilization, releasing Ca2+ and Mg2+ ions, hydroxides, and methane, thus altering its crystalline framework.
In the case of the limestone sample (Core B), the XRD pattern depicted in Figure 3 confirmed the dominance of carbonates (calcite and dolomite) as the primary crystalline phases. Calcite (CaCO3) shows sharp peaks at 29.4°, 36.10°, 39.38°, 43.2°, 47.4°, 48.50° matching the (104), (110), (113), (202), (018), and (116) planes. On the other hand, dolomite show significant peaks at 30.88°, 56.2°, and 57.3°, corresponding to (104), (018), and (116) planes [24,26,27]. Furthermore, vaterite (CaCO3 biogenic polymorph) was detected through additional peaks at 24.8°, 27.1°, 32.7°, 43.8°, and 55.7°, corresponding to the (110), (112), (114), (300), and (224) planes [27].
Following hydrogen exposure, the treated sample Core BH (Figure 3) exhibited the complete disappearance of several calcite-associated peaks, including those at 31.3°, 43.2°, and 57.3° ((006), (202), and (122) planes), along with the 20.9° peak corresponding to the (004) plane of vaterite. These changes imply strong reactivity between hydrogen and carbonate phases, particularly calcite, resulting in progressive dissolution [17]. The reduction of carbonate by H2 likely increases the acidity of the pore fluid[9,15], thereby accelerating the dissolution process and possibly leading to methane formation, as outlined in reaction (3) [32].
The siliceous rock sample (Core C), prior to hydrogen exposure, exhibited a mineralogical composition dominated by quartz, accompanied by minor amounts of chlorite and albite, as shown in Figure 4. The diffractogram revealed prominent quartz peaks at 20.8°, 26.7°, 36.45°, 39.5°, 42.5°, 45.9°, 50.2°, 54.9 and 60.2°, corresponding to the (100), (101), (110), (102), (200), (201), (112), (202), and (211) planes [28,33]. In addition, chlorite reflections were noted at 6.2° and 12.5° ((001) and (002) planes), with a distinct illite signal at 8.9° (100) [29], and peaks at 27.92° (albite (112)) [33] and 29.4° (calcite (104)) [27], indicating minor accessory phases.
Following hydrogen exposure, the XRD analysis of the siliceous rock sample Core CH (Figure 4) showed that the diffraction peaks associated with quartz remained unchanged after hydrogen exposure compared to other minerals such as feldspars [30]. This observation confirms the exceptional chemical stability of quartz in reactive hydrogen-rich environments, thereby reinforcing its suitability as a long-term host matrix for underground hydrogen storage.
These findings establish the baseline mineralogical composition of the three core samples, serving as a reference for comparative analysis after hydrogen exposure.
Table 1, Table 2 and Table 3 provide quantitative insights into the compositional changes in core samples A, B, and C before and after hydrogen exposure, highlighting the extent of mineral dissolution and secondary transformations as reflected in the variation of mineral content (%). These variations, more than peak position shifts, directly illustrate the chemical reactivity and structural resilience of different lithologies under high-pressure hydrogen conditions.
In Table 1, the dolomitic core (A) exhibits a clear reduction in dolomite content after hydrogen treatment (from 12.20% to 10.53% for the dominant (104) plane, and complete disappearance of other dolomite components), confirming selective dissolution of CaMg(CO3)2. This process is facilitated by hydrogen in the presence of moisture, which triggers partial decarbonation and release of Ca2+ and Mg2+ ions. Concurrently, the complete loss of calcite (from 1.32% to 0%) and albite (2.03% to 0%) suggests a destabilization of accessory phases, while the increase in the (116) dolomite plane (from 2.68% to 2.84%) may indicate local recrystallization or lattice reorganization, as mentioned above. These compositional shifts align with the dissolution–reprecipitation mechanism and support the formation of secondary Fe-rich carbonates (ankerite), as also confirmed by EDS.
In Table 2, the limestone core (B) demonstrates a sharp decrease in vaterite content (e.g., from 6.05% to 4.82% at 27°, and complete loss at 20.9°), as well as the disappearance of several calcite planes (e.g., from 2.35% to 0% at 31.2° and from 1.11% to 0% at 43.1°). These losses indicate intensive carbonate dissolution, likely promoted by pore fluid acidification due to hydrogen-carbonate interactions. The slight increase in some vaterite and calcite reflections (e.g., 43.8° vaterite from 2.98% to 3.50%, 50° calcite from 2.68% to 2.94%) suggests secondary carbonate precipitation possibly clogging pore throats and contributing to the observed drop in porosity and permeability. This mineralogical behavior reinforces the idea that calcitic formations are structurally vulnerable under reductive hydrogen environments.
Table 3 shows minimal compositional changes in the siliceous core (C), particularly for quartz, whose dominant reflections remain almost unchanged (e.g., 14.64% to 13.87% for 26.7°, and 3.57% to 3.78% for 20.9°). Minor losses in illite (2.62% to 0%) and chlorite variations (6.87% to 5.94% for 6.3°, but 2.19% to 3.22% for 12.6°) are within the experimental margin and may reflect superficial rearrangements rather than true dissolution. This overall mineralogical stability strongly supports the chemical inertness of quartz-rich formations under hydrogen storage conditions.
3.2. Porosity, Permeability and Textural Characteristics
The nitrogen adsorption–desorption isotherms obtained at 77 K for core samples A and AH (Figure 5) exhibit the characteristics of mesoporous materials, showing a type IV profile in accordance with the IUPAC classification. The presence of hysteresis loops confirms capillary condensation in pores with intricate geometries. Specifically, core A displays a hysteresis loop of the H2 type, associated with “Ink-Bottle” shaped pores, whereas core AH exhibits an H3-type loop, indicative of Groove pores [34,35,36].
Hydrogen exposure at 100 bar for 100 days led to pronounced morphological alterations in core AH, resulting in a 61.57% increase in the adsorbed nitrogen volume at high relative pressures from 14.376 cm3/g (A) to 23.35 cm3/g (AH) as shown in Figure 5. Although the total porosity variation was negligible (23.95% for A vs. 23.87% for AH), the pore network in AH appears significantly more extended and interconnected.
BET and BJH analyses corroborate this transformation: the specific surface area increased from 3.270 m2/g (A) to 4.023 m2/g (AH), and the total pore volume rose from 0.0214 cm3/g to 0.245 cm3/g. Additionally, the mean pore diameter (Dv(d)) increased from 3.3 nm to 5.09 nm (Figure 6), reflecting a more open and fluid-accessible mesoporous architecture.
The pore size distribution further reveals a higher density of small pores in AH, contributing to enhanced adsorption capacity and internal network expansion. These structural modifications positively influence permeability, which increased from 574.84 mD (A) to 592.44 mD (AH), suggesting improved pore connectivity and possibly reduced tortuosity.
These textural and transport enhancements are primarily attributed to selective dolomite (CaMg(CO3)2 dissolution under reductive hydrogen exposure [17,30,31,32], as described by reactions (1) and (2), along with the concurrent precipitation of ankerite (Fe-carbonate). The elevated presence of ankerite likely originates from the reduction of siderite, while the cationic substitution of Mg2+ by Fe2+ in the dolomite matrix led to the formation of ferroan carbonates (reaction 4) [31].
Accordingly, dolomitic formations emerge as promising candidates for subsurface hydrogen storage. These findings extend current literature [17,37], highlighting that not only the geochemical reactivity but also the physical structure of the host rock is critical in governing mineralogical transformation kinetics in reductive environments.
The nitrogen adsorption–desorption isotherms at 77 K for all studied core samples (B/BH, and C/CH) reveal mesoporous characteristics with type IV profiles and H3-type hysteresis loops and H4-type hysteresis respectively according to IUPAC classification, denoting capillary condensation within groove pores and silt pores, indicates the presence of a developed but poorly connected pore network typical of carbonate rocks with irregular medium porosity [34,35,36]. However, the impact of hydrogen exposure (100 bar for 100 days) differed significantly depending on mineralogical composition
Upon hydrogen exposure (100 bar for 100 days), core BH exhibited a considerable reduction in adsorption capacity throughout the relative pressure range. At the maximum relative pressure, the nitrogen adsorption volume dropped by approximately 19%, from 26.11 cm3/g (B) to 21.17 cm3/g (BH) As observed in Figure 7 suggesting significant structural alterations in the pore network caused by the hydrogen treatment.
Textural parameter analysis confirmed this trend: the BET specific surface area decreased from 6.93 m2/g (B) to 5.80 m2/g (BH), while the total pore volume (BJH) declined from 0.0175 cm3/g to 0.0143 cm3/g. Additionally, the mean pore diameter (Dv(d)) experienced a slight reduction from 3.023 nm to 2.853 nm. These variations align with the decrease in total porosity (from 19.89% to 16.33%) and permeability (from 132.16 mD to 107.43 mD), indicating diminished pore connectivity and a potential partial collapse of the porous framework.
The pore size distribution (Figure 8) further supports this observation, revealing a reduced density of active pores especially within the 3–6 nm range in the hydrogen-treated sample. Such transformations are likely attributable to mineral reprecipitation phenomena or localized pore blockage, possibly induced by the formation of secondary carbonate phases (e.g., redeposited calcite), triggered by solid gas reactions under high hydrogen pressure [32,38].
These findings underscore the negative impact of prolonged hydrogen exposure on the structural integrity of calcitic rocks. Unlike dolomite, which exhibited pore network enhancement, calcite underwent compaction and occlusion, leading to reduced storage potential. Consequently, calcitic formations appear less favorable for long-term hydrogen containment due to their susceptibility to morphological degradation under reductive conditions.
In contrast, core samples C and CH, composed primarily of quartz, exhibited remarkable structural resilience following exposure to hydrogen at 100 bar for 100 days (Figure 9). However, the structural response of quartz was notably more stable.
The adsorbed nitrogen volume showed only a marginal decrease of ~1.5%, from 27.81 cm3/g (C) to 27.40 cm3/g (CH), significantly lower than the changes observed in dolomite (+61.57%) and calcite (−19%). This indicates that hydrogen has a minimal effect on the microstructural integrity of quartz.
This conclusion is further supported by the textural parameters: the BET surface area slightly decreased from 19.048 m2/g to 18.87 m2/g, the total pore volume (BJH) declined marginally from 0.0291 cm3/g to 0.0284 cm3/g, and the mean pore diameter (Dv(d)) increased moderately from 3.107 nm to 3.305 nm. Total porosity and permeability also exhibited only slight reductions, from 24.5% to 24.13%, and from 581.96 mD to 567.43 mD, respectively.
The pore size distributions (Figure 10) for samples C and CH are nearly superimposed, indicating negligible structural changes. The stable pore population within the 3–10 nm range confirms the absence of collapse, obstruction, or secondary phase precipitation, in contrast to the behavior observed in dolomite and calcite.
Quartz, as a silica-dominated mineral phase, demonstrates outstanding stability under high-pressure hydrogen conditions, maintaining both its structural and petrophysical integrity. Unlike dolomite, which undergoes pronounced pore enlargement, or calcite, which shows susceptibility to partial network collapse, quartz exhibits negligible microstructural degradation, thereby reinforcing its candidacy as a robust matrix component in subsurface hydrogen storage environments [15,20,37,39].
This stability is quantitatively reflected in the minimal variations recorded across key textural descriptors: the BET surface area decreased only slightly (from 19.048 to 18.87 m2/g), total pore volume showed a marginal reduction (0.0291 to 0.0284 cm3/g), and the average pore diameter increased modestly (3.107 to 3.305 nm). Additionally, total porosity declined from 24.5% to 24.13%, and permeability from 581.96 to 567.43 mD. These minor shifts, detailed in Table 4, underscore the resilience of the quartz framework and further validate its functional neutrality in the face of hydrogen-induced chemical and physical stress.
3.3. SEM-EDS Analysis
The SEM micrographs acquired at magnifications of 100× and 200× reveal substantial morphological differences between untreated and hydrogen-exposed carbonate core samples. As illustrated in Figure 11, core A (dolomite, untreated) displays a relatively compact granular structure, composed of well-defined dolomite crystals with sharp boundaries and tight grain contacts features typical of a preserved stoichiometric carbonate phase with a uniform crystalline framework [40].
Conversely, the hydrogen-exposed counterpart (core AH) exhibits a more developed porous texture, with partially eroded grains, irregular margins, and expanded intergranular voids. Fine particles are observed to accumulate between larger crystals, indicating localized dolomite dissolution and possible reprecipitation of secondary phases [17,30,31,32]. These morphological observations corroborate the BET/BJH adsorption data and confirm partial reorganization of the pore network following hydrogen exposure.
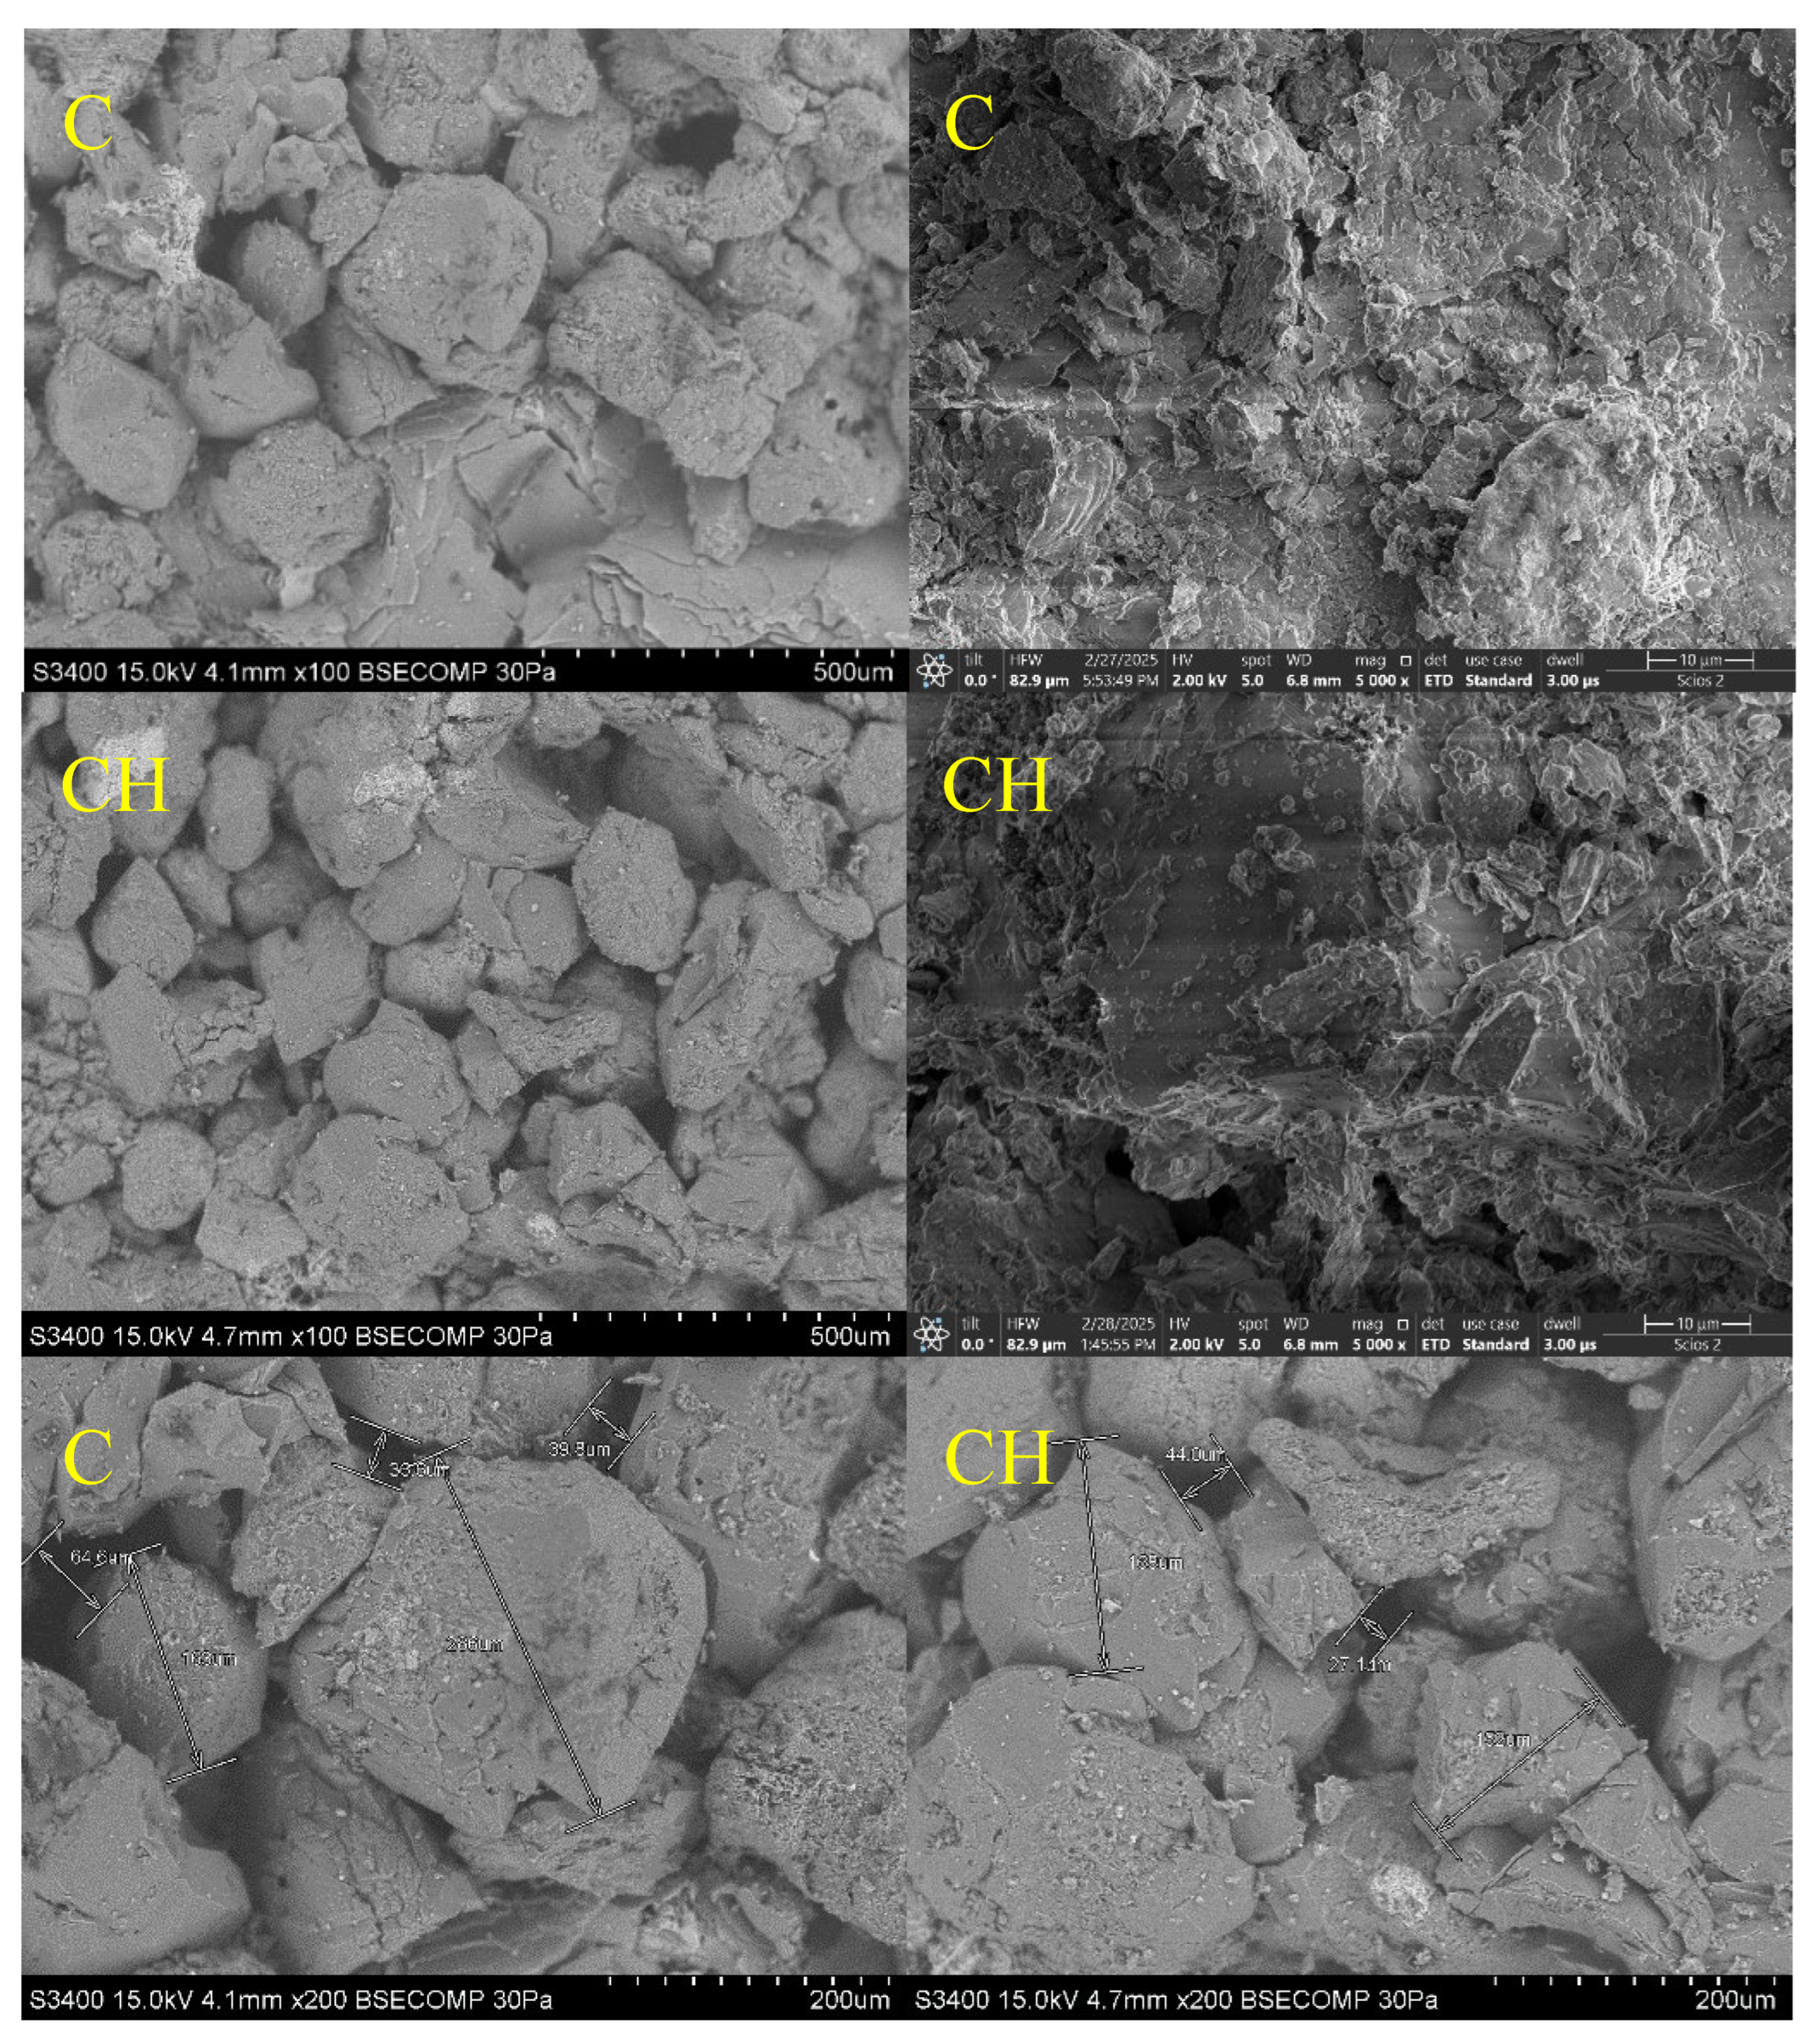
A similar trend is observed for calcitic samples. As shown in Figure 12, SEM images of core B reveal a relatively dense microstructure formed by large, well-faceted calcite crystals with regular faces and compact intergranular contacts. The pore network is poorly developed, with minimal connectivity. After hydrogen treatment (core BH), the microstructure becomes noticeably irregular, characterized by fragmented crystal surfaces, fine fissures, and increased grain boundary roughness. While intercrystalline voids are more apparent, they do not translate into enhanced effective porosity, likely due to partial pore clogging by redeposited carbonate phases (Figure 12).
Quartz-based samples exhibit a markedly different behavior. As seen in Figure 12, core C shows a compact granular architecture with large, smooth-faced quartz crystals and limited intergranular space. Following hydrogen exposure, core CH maintains this structure with only minor surface roughening and the appearance of microcracks. The pore network remains largely unaffected, with no signs of structural collapse or significant mineralogical alteration, confirming the high chemical and structural stability of quartz under reductive conditions [15,20,37,39].
Figure 13.
Scanning Electron Microscopy (SEM) Images of Core Samples C and CH.
EDS analysis provides further insights into the chemical evolution associated with hydrogen treatment. For dolomitic cores, EDS spectra and elemental maps Figure 14 show that core A is dominated by calcium and magnesium with uniform distribution, consistent with stoichiometric CaMg(CO3)2. Iron is present only in trace amounts. After hydrogen exposure, core AH exhibits a notable increase in iron concentration and a relative decrease in magnesium. The heterogeneous distribution of Fe suggests cation exchange, where Fe2+ likely sourced from siderite reduction partially replaces Mg2+ in the dolomite lattice, leading to ankerite-type phase formation [31].
Other elements (Si, Al, K) show no significant compositional variation between A and AH, indicating that these elements are not actively involved in hydrogen-induced reactions (Figure 14). This SEM–EDS evidence confirms that dolomite is susceptible to both structural and chemical alteration under hydrogen exposure, primarily via selective dissolution, Fe for Mg substitution, and secondary carbonate reprecipitation. These changes reshape the pore framework and influence the rock’s petrophysical behavior, which is critical when assessing its suitability for hydrogen storage applications.
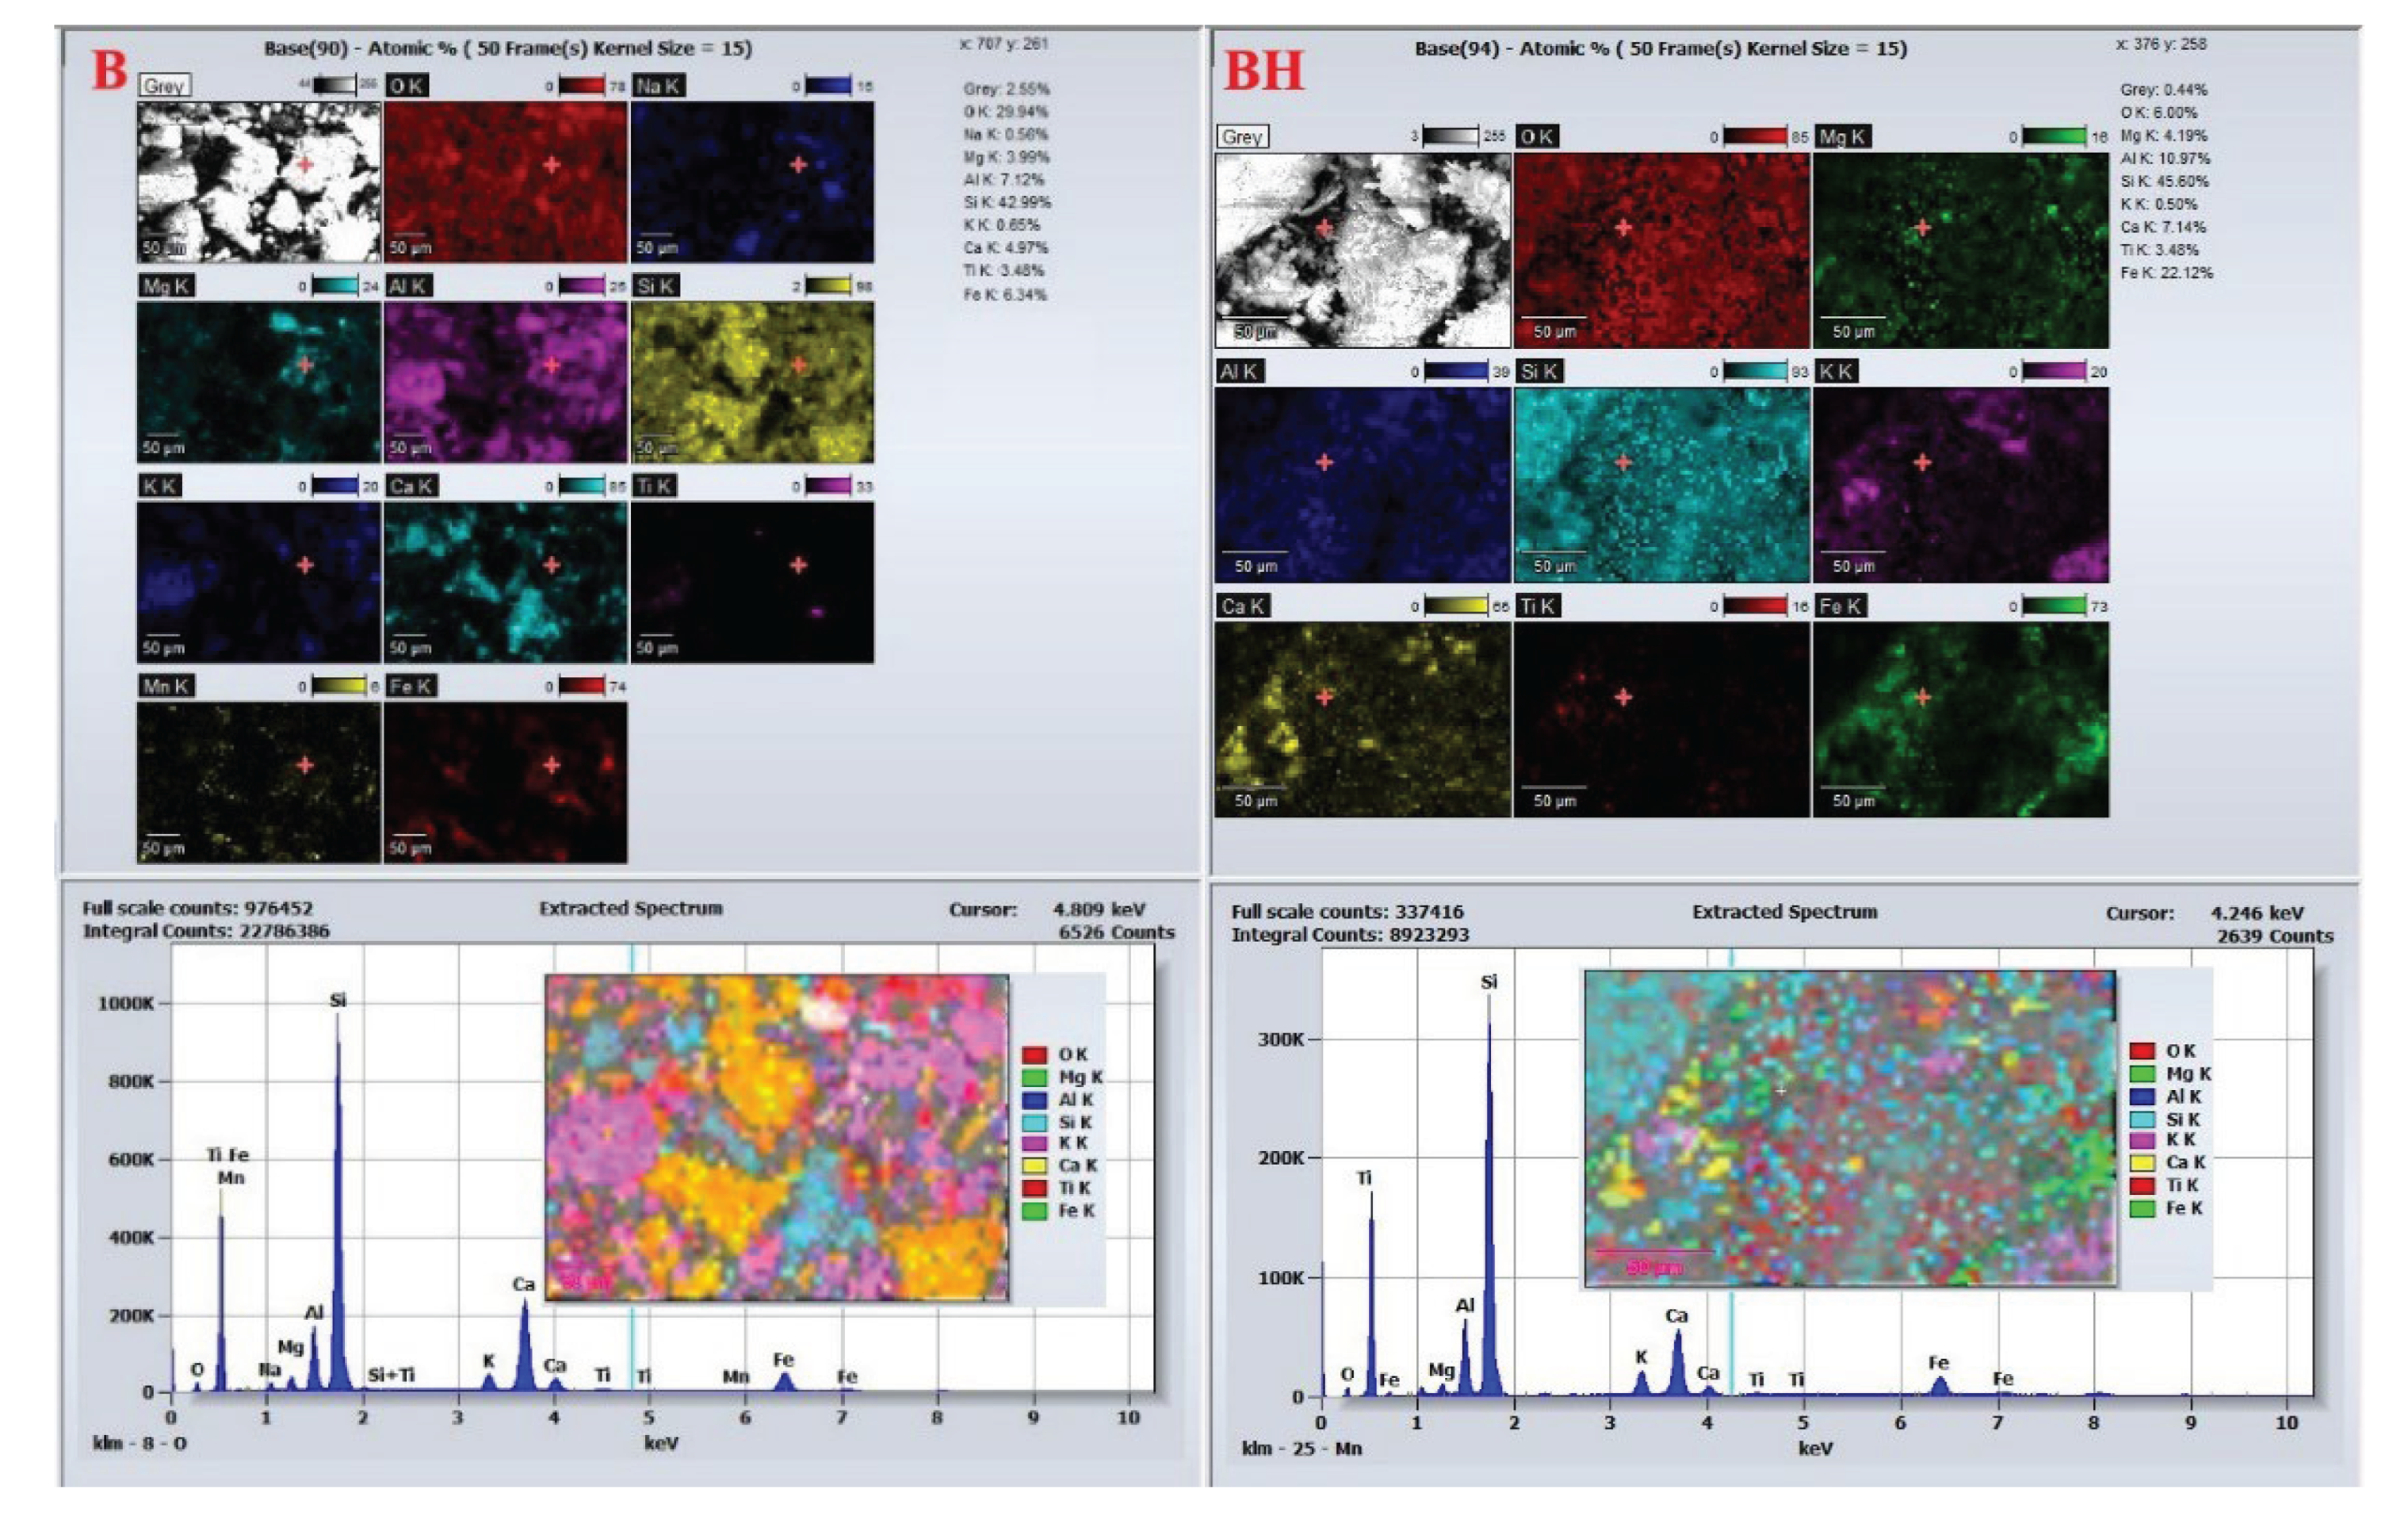
EDS analysis of the calcitic cores (Figure 14) reinforces these trends. Core B exhibits a composition dominated by Ca and O with a uniform distribution of minor elements. In core BH, a slight increase in Fe is detected, with a more heterogeneous spatial pattern, suggesting secondary Fe-rich phase formation driven by hydrogen-induced redox reactions. Redistribution of Mg and minor elements is also observed, indicating localized elemental migration within the calcite matrix.
Figure 15.
EDS Spectrum and Elemental Distribution for Core Samples B and BH.
In contrast, EDS results for the quartz samples (C and CH, Figure 16) reveal consistent compositional stability. Both spectra show Si and O as dominant elements with uniform distributions of Al, K, Mg, and Fe. No notable differences are observed in elemental composition or spatial distribution after hydrogen treatment, further affirming the chemical inertness of quartz. Meanwhile, major elemental redistributions were observed in AH and BH samples, linked to ankerite formation (in dolomite) and secondary calcite precipitation (in calcite).
These microstructural and compositional findings are consistent with textural parameter evolution. In calcite, hydrogen exposure reduced BET surface area from 6.93 to 5.80 m2/g, total pore volume from 0.0175 to 0.0143 cm3/g, mean pore diameter from 3.023 to 2.853 nm, porosity from 19.89% to 16.33%, and permeability from 132.16 to 107.43 mD highlighting partial pore collapse and occlusion due to carbonate reprecipitation.
In contrast, the dolomitic system demonstrated a distinct structural response: after hydrogen exposure, total pore volume increased from 0.0214 to 0.245 cm3/g, average pore diameter expanded from 3.3 to 5.09 nm, and permeability improved alongside surface area growth. SEM images of core AH confirmed severe grain disaggregation and development of an interconnected pore system, enriched with Fe-bearing phases attributed to ankerite formation.
These contrasting behaviors clearly illustrate that calcite and dolomite respond differently to hydrogen treatment. While dolomite undergoes beneficial structural modifications enhancing porosity and permeability, calcite exhibits degradation of the pore network through mineral reprecipitation and occlusion. This distinction is crucial for evaluating the petrophysical suitability of carbonate rocks in geological hydrogen storage, with dolomite emerging as a more promising candidate than calcite.
4. Conclusions
This section is not mandatory but can be added to the manuscript if the discussion is unusually long or complex.
This experimental study – which was based on the simulation of geological hydrogen storage conditions (100 bar, 70°C, for 100 days) - revealed significant differences in the mineralogical and petrophysical responses of three representative rock types dolomite, calcite-rich limestone, and quartz-rich siliceous rock. The results demonstrated that dolomite exhibited moderate but constructive geochemical reactivity, leading to a remarkable enhancement in its pore architecture. Permeability increased from 574.84 to 592.44 mD (+3.1%), BET surface area rose from 3.27 to 4.02 m2/g (+22.9%), and the average pore diameter expanded from 3.3 to 5.09 nm (+54.2%). Most notably, total pore volume increased from 0.0214 to 0.245 cm3/g, marking a dramatic +1045% improvement. Importantly, these changes occurred without significant variation in total porosity (23.95% to 23.87%), indicating improved internal pore connectivity rather than simple void expansion. These enhancements were driven by selective dolomite dissolution under moist hydrogen conditions and the formation of ankerite-type ferroan carbonates via Fe2+ ↔ Mg2+ substitution mechanisms.
In contrast with the dolomite, the calcite-rich limestone samples exhibited a pronounced deterioration in storage-relevant properties. Porosity declined from 19.89% to 16.33% (−17.9%), permeability dropped from 132.16 to 107.43 mD (−18.7%), surface area decreased from 6.93 to 5.80 m2/g (−16.3%), and total pore volume was reduced from 0.0175 to 0.0143 cm3/g (−18.3%). These reductions are attributed to intense carbonate dissolution followed by secondary carbonate precipitation, leading to partial pore clogging and loss of effective pore space connectivity.
Research conducted on quartz-dominant siliceous rock has shown that it maintained near-complete structural and chemical stability. The porosity of these samples remained nearly unchanged (24.50% to 24.13%), and permeability dropped only slightly (581.96 to 567.43 mD, −2.5%). Changes in BET surface area and pore volume were minimal (within ±1%), confirming the mineral’s inert nature and structural resilience under reductive hydrogen conditions.
In summary, dolomite emerges as the most promising and practically relevant lithology among those tested. It balances controlled chemical reactivity with favorable enhancements in pore structure and permeability without compromising integrity making it a strong candidate for underground hydrogen storage applications. In contrast, calcite-rich formations present structural instability risks, while quartz may serve as a reliable inert matrix within mixed lithological systems. These findings contribute valuable scientific insight for the strategic selection of geological formations suited for long-term green hydrogen storage.
Author Contributions
Conceptualization, R.D, I.V.G and T.V.C.; methodology, R.D., Ș.A.G and G.B.; validation, R.D., D.B.S., R.H. and I.N.R.; formal analysis, R.D., G.B. and D.B.S.; investigation, M.G.P., Ș.A.G. and T.V.C.; resources, R.D. and R.H.; data curation, R.D and D.B.S.; writing—original draft preparation, R.D., M.G.P. and G.B.; writing—review and editing, R.D. and R.H.; visualization, D.B.S., I.N.R., R.H., I.V.G and R.D.; supervision, T.V.C, D.B.S., I.V.G and M.G.P.; project administration, R.D.
Funding
The authors thankfully acknowledge the Petroleum-Gas University of Ploiesti, Romania for the financial support, project GO-GICS “Research on the reduction of greenhouse gas emissions in the exploitation process of natural gas deposits / deposits” number 27715/07.11.2024.
Data Availability Statement
The data presented in this study are available in the article.
Conflicts of Interest
“The authors declare no conflicts of interest.”
References
- (IEA), T.I.E.A. Global Hydrogen Review 2023; 2023; p. 68.
- Caglayan, D.G.; Weber, N.; Heinrichs, H.U.; Linßen, J.; Robinius, M.; Kukla, P.A.; Stolten, D. Technical potential of salt caverns for hydrogen storage in Europe. International Journal of Hydrogen Energy 2020, 45, 6793-6805. [CrossRef]
- Li, P.; Shi, X.; Li, Y.; Zhu, S.; Liu, W.; Ma, H.; Yang, C. Optimizing geological hydrogen storage in bedded salt formations: Assessing permeation and leakage dynamics. Journal of Energy Storage 2025, 122, 116709. [CrossRef]
- Zhang, J.; Zhang, L.; Hu, S. Underground hydrogen storage in depleted gas fields: Progress, challenges, and outlook. Journal of Energy Storage 2024, 102, 113842. [CrossRef]
- Luboń, K.; Tarkowski, R. Hydrogen Storage in Deep Saline Aquifers: Non-Recoverable Cushion Gas after Storage. Energies 2024, 17. [CrossRef]
- Bade, S.O.; Taiwo, K.; Ndulue, U.F.; Tomomewo, O.S.; Aisosa Oni, B. A review of underground hydrogen storage systems: Current status, modeling approaches, challenges, and future prospective. International Journal of Hydrogen Energy 2024, 80, 449-474. [CrossRef]
- Ali, M.; Isah, A.; Yekeen, N.; Hassanpouryouzband, A.; Sarmadivaleh, M.; Okoroafor, E.R.; Al Kobaisi, M.; Mahmoud, M.; Vahrenkamp, V.; Hoteit, H. Recent progress in underground hydrogen storage. Energy & Environmental Science 2025. [CrossRef]
- Shojaee, A.; Ghanbari, S.; Wang, G.; Mackay, E. Interplay between microbial activity and geochemical reactions during underground hydrogen storage in a seawater-rich formation. International Journal of Hydrogen Energy 2024, 50, 1529-1541. [CrossRef]
- Al-Yaseri, A.; Amao, A.; Fatah, A. Experimental investigation of shale/hydrogen geochemical interactions. Fuel 2023, 346, 128272. [CrossRef]
- Al-Yaseri, A.; Yekeen, N.; Al-Mukainah, H.; Hassanpouryouzband, A. Geochemical interactions in geological hydrogen Storage: The role of sandstone clay content. Fuel 2024, 361, 130728. [CrossRef]
- Hassanpouryouzband, A.; Adie, K.; Cowen, T.; Thaysen, E.M.; Heinemann, N.; Butler, I.B.; Wilkinson, M.; Edlmann, K. Geological Hydrogen Storage: Geochemical Reactivity of Hydrogen with Sandstone Reservoirs. ACS Energy Letters 2022, 7, 2203-2210. [CrossRef]
- Driba, D.L.; Beckingham, L.E. Unraveling hydrogen induced geochemical reaction mechanisms through coupled geochemical modeling and machine learning. Applied Geochemistry 2025, 183, 106330. [CrossRef]
- Thiyagarajan, S.R.; Emadi, H.; Hussain, A.; Patange, P.; Watson, M. A comprehensive review of the mechanisms and efficiency of underground hydrogen storage. Journal of Energy Storage 2022, 51, 104490. [CrossRef]
- Zeng, L.; Keshavarz, A.; Xie, Q.; Iglauer, S. Hydrogen storage in Majiagou carbonate reservoir in China: Geochemical modelling on carbonate dissolution and hydrogen loss. International Journal of Hydrogen Energy 2022, 47, 24861-24870. [CrossRef]
- Al-Yaseri, A.; Al-Mukainah, H.; Yekeen, N. Experimental insights into limestone-hydrogen interactions and the resultant effects on underground hydrogen storage. Fuel 2023, 344, 128000. [CrossRef]
- Aslannezhad, M.; Ali, M.; Kalantariasl, A.; Sayyafzadeh, M.; You, Z.; Iglauer, S.; Keshavarz, A. A review of hydrogen/rock/brine interaction: Implications for Hydrogen Geo-storage. Progress in Energy and Combustion Science 2023, 95, 101066. [CrossRef]
- Al-Yaseri, A.; Al-Mukainah, H.; Yekeen, N.; Al-Qasim, A.S. Experimental investigation of hydrogen-carbonate reactions via computerized tomography: Implications for underground hydrogen storage. International Journal of Hydrogen Energy 2023, 48, 3583-3592. [CrossRef]
- Ugarte, E.R.; Tetteh, D.; Salehi, S. Experimental studies of well integrity in cementing during underground hydrogen storage. International Journal of Hydrogen Energy 2024, 51, 473-488. [CrossRef]
- Mwakipunda, G.C.; Franck Kouassi, A.K.; Ayimadu, E.T.; Komba, N.A.; Nadege, M.N.; Mgimba, M.M.; Ngata, M.R.; Yu, L. Underground hydrogen storage in geological formations: A review. Journal of Rock Mechanics and Geotechnical Engineering 2025. [CrossRef]
- Bo, Z.; Zeng, L.; Chen, Y.; Xie, Q. Geochemical reactions-induced hydrogen loss during underground hydrogen storage in sandstone reservoirs. International Journal of Hydrogen Energy 2021, 46, 19998-20009. [CrossRef]
- Cheng, C.; Busch, B.; Kontny, A.; Hilgers, C. Underground hydrogen storage in sandstone reservoirs: Effects of geochemical reactivity of hydrogen on reservoir performance. International Journal of Hydrogen Energy 2025, 105, 492-504. [CrossRef]
- Flesch, S.; Pudlo, D.; Albrecht, D.; Jacob, A.; Enzmann, F. Hydrogen underground storage—Petrographic and petrophysical variations in reservoir sandstones from laboratory experiments under simulated reservoir conditions. International Journal of Hydrogen Energy 2018, 43, 20822-20835. [CrossRef]
- Al-Yaseri, A.; Fatah, A.; Adebayo, A.R.; Al-Qasim, A.S.; Patil, P.D. Pore structure analysis of storage rocks during geological hydrogen storage: Investigation of geochemical interactions. Fuel 2024, 361, 130683. [CrossRef]
- Kaczmarek, S.E.; Gregg, J.M.; Bish, D.L.; Machel, H.G.; Fouke, B.W. DOLOMITE, VERY HIGH-MAGNESIUM CALCITE, AND MICROBES—IMPLICATIONS FOR THE MICROBIAL MODEL OF DOLOMITIZATION. Characterization and Modeling of Carbonates–Mountjoy Symposium 1 2017, 109, 0. [CrossRef]
- Medina-Carrasco, S.; Valverde, J.M. In situ XRD analysis of dolomite calcination under CO2 in a humid environment. CrystEngComm 2020, 22, 6502-6516. [CrossRef]
- Al-Jaroudi, S.S.; Ul-Hamid, A.; Mohammed, A.-R.I.; Saner, S. Use of X-ray powder diffraction for quantitative analysis of carbonate rock reservoir samples. Powder Technology 2007, 175, 115-121. [CrossRef]
- Zhao, T.; Xu, C.; Ma, Y.; Zeng, Y.; Wang, N. Study on preparation and structure of chrysanthemum-shaped micron calcium carbonate based on inverse microemulsion. Micro & Nano Letters 2020, 15, 1151-1155. [CrossRef]
- Zhang, C.; Xu, Z.; Hu, Y.; He, J.; Tian, M.; Zhou, J.; Zhou, Q.; Chen, S.; Chen, D.; Chen, P.; et al. Novel Insights into the Hydroxylation Behaviors of ?-Quartz (101) Surface and its Effects on the Adsorption of Sodium Oleate. Minerals 2019, 9. [CrossRef]
- Liu, R.; Mei, X.; Zhang, J.; Zhao, D.-b. Characteristics of clay minerals in sediments of Hemudu area, Zhejiang, China in Holocene and their environmental significance. China Geology 2019, 2, 8-15. [CrossRef]
- Braid, H.; Taylor, K.; Hough, E.; Rochelle, C.; Niasar, V.; Ma, L. Hydrogen-induced mineral alteration: A review in the context of underground hydrogen storage (UHS) in saline aquifers. Earth-Science Reviews 2024, 259, 104975. [CrossRef]
- Davies, K.; Esteban, L.; Sarout, J.; Keshavarz, A.; Iglauer, S. Hydrogen-Induced Transformations in Dolomite: Unlocking Natural Hydrogen Exploration and Subsurface Storage in Carbonates. Energy & Fuels 2025. [CrossRef]
- Opoku Duartey, K.; Ampomah, W.; Rahnema, H.; Mehana, M. Underground Hydrogen Storage: Transforming Subsurface Science into Sustainable Energy Solutions. Energies 2025, 18. [CrossRef]
- Kharya, A.; Sachan, H.K.; Tiwari, S.K.; Singhal, S.; Singh, P.C.; Rai, S.; Kumar, S.; Mehta, M.; Gautam, P.K.R. New occurrence of albitite from Nubra valley, Ladakh: characterization from mineralogy and whole rock geochemistry. Current Science 2016, 111, 1531-1535.
- Thommes, M.; Kaneko, K.; Neimark, A.V.; Olivier, J.P.; Rodriguez-Reinoso, F.; Rouquerol, J.; Sing, K.S.W. Physisorption of gases, with special reference to the evaluation of surface area and pore size distribution (IUPAC Technical Report). 2015, 87, 1051-1069, doi:doi:10.1515/pac-2014-1117.
- Yang, Y.; Zhang, J.; Xu, L.; Li, P.; Liu, Y.; Dang, W. Pore Structure and Fractal Characteristics of Deep Shale: A Case Study from Permian Shanxi Formation Shale, from the Ordos Basin. ACS Omega 2022, 7, 9229-9243. [CrossRef]
- Chen, K.; Zhang, T.; Chen, X.; He, Y.; Liang, X. Model construction of micro-pores in shale: A case study of Silurian Longmaxi Formation shale in Dianqianbei area, SW China. Petroleum Exploration and Development 2018, 45, 412-421. [CrossRef]
- Truche, L.; Jodin-Caumon, M.-C.; Lerouge, C.; Berger, G.; Mosser-Ruck, R.; Giffaut, E.; Michau, N. Sulphide mineral reactions in clay-rich rock induced by high hydrogen pressure. Application to disturbed or natural settings up to 250°C and 30bar. Chemical Geology 2013, 351, 217-228. [CrossRef]
- Gelencsér, O.; Árvai, C.; Mika, L.T.; Breitner, D.; LeClair, D.; Szabó, C.; Falus, G.; Szabó-Krausz, Z. Effect of hydrogen on calcite reactivity in sandstone reservoirs: Experimental results compared to geochemical modeling predictions. Journal of Energy Storage 2023, 61, 106737. [CrossRef]
- Yekta, A.E.; Pichavant, M.; Audigane, P. Evaluation of geochemical reactivity of hydrogen in sandstone: Application to geological storage. Applied Geochemistry 2018, 95, 182-194. [CrossRef]
- Liu, X.; Fu, M.; Gluyas, J.; Song, R.; Lan, H.; Fan, Y.; Wu, D. Dolomitization Facilitated by Clay Minerals on Mixed Siliciclastic-Carbonate Shoals of Carboniferous Age in the Tarim Basin, China: Constraints on Element Mobility and Isotope Geochemistry. Minerals 2025, 15. [CrossRef]
Figure 1.
Core samples used in the study of hydrogen’s effect on geological components.
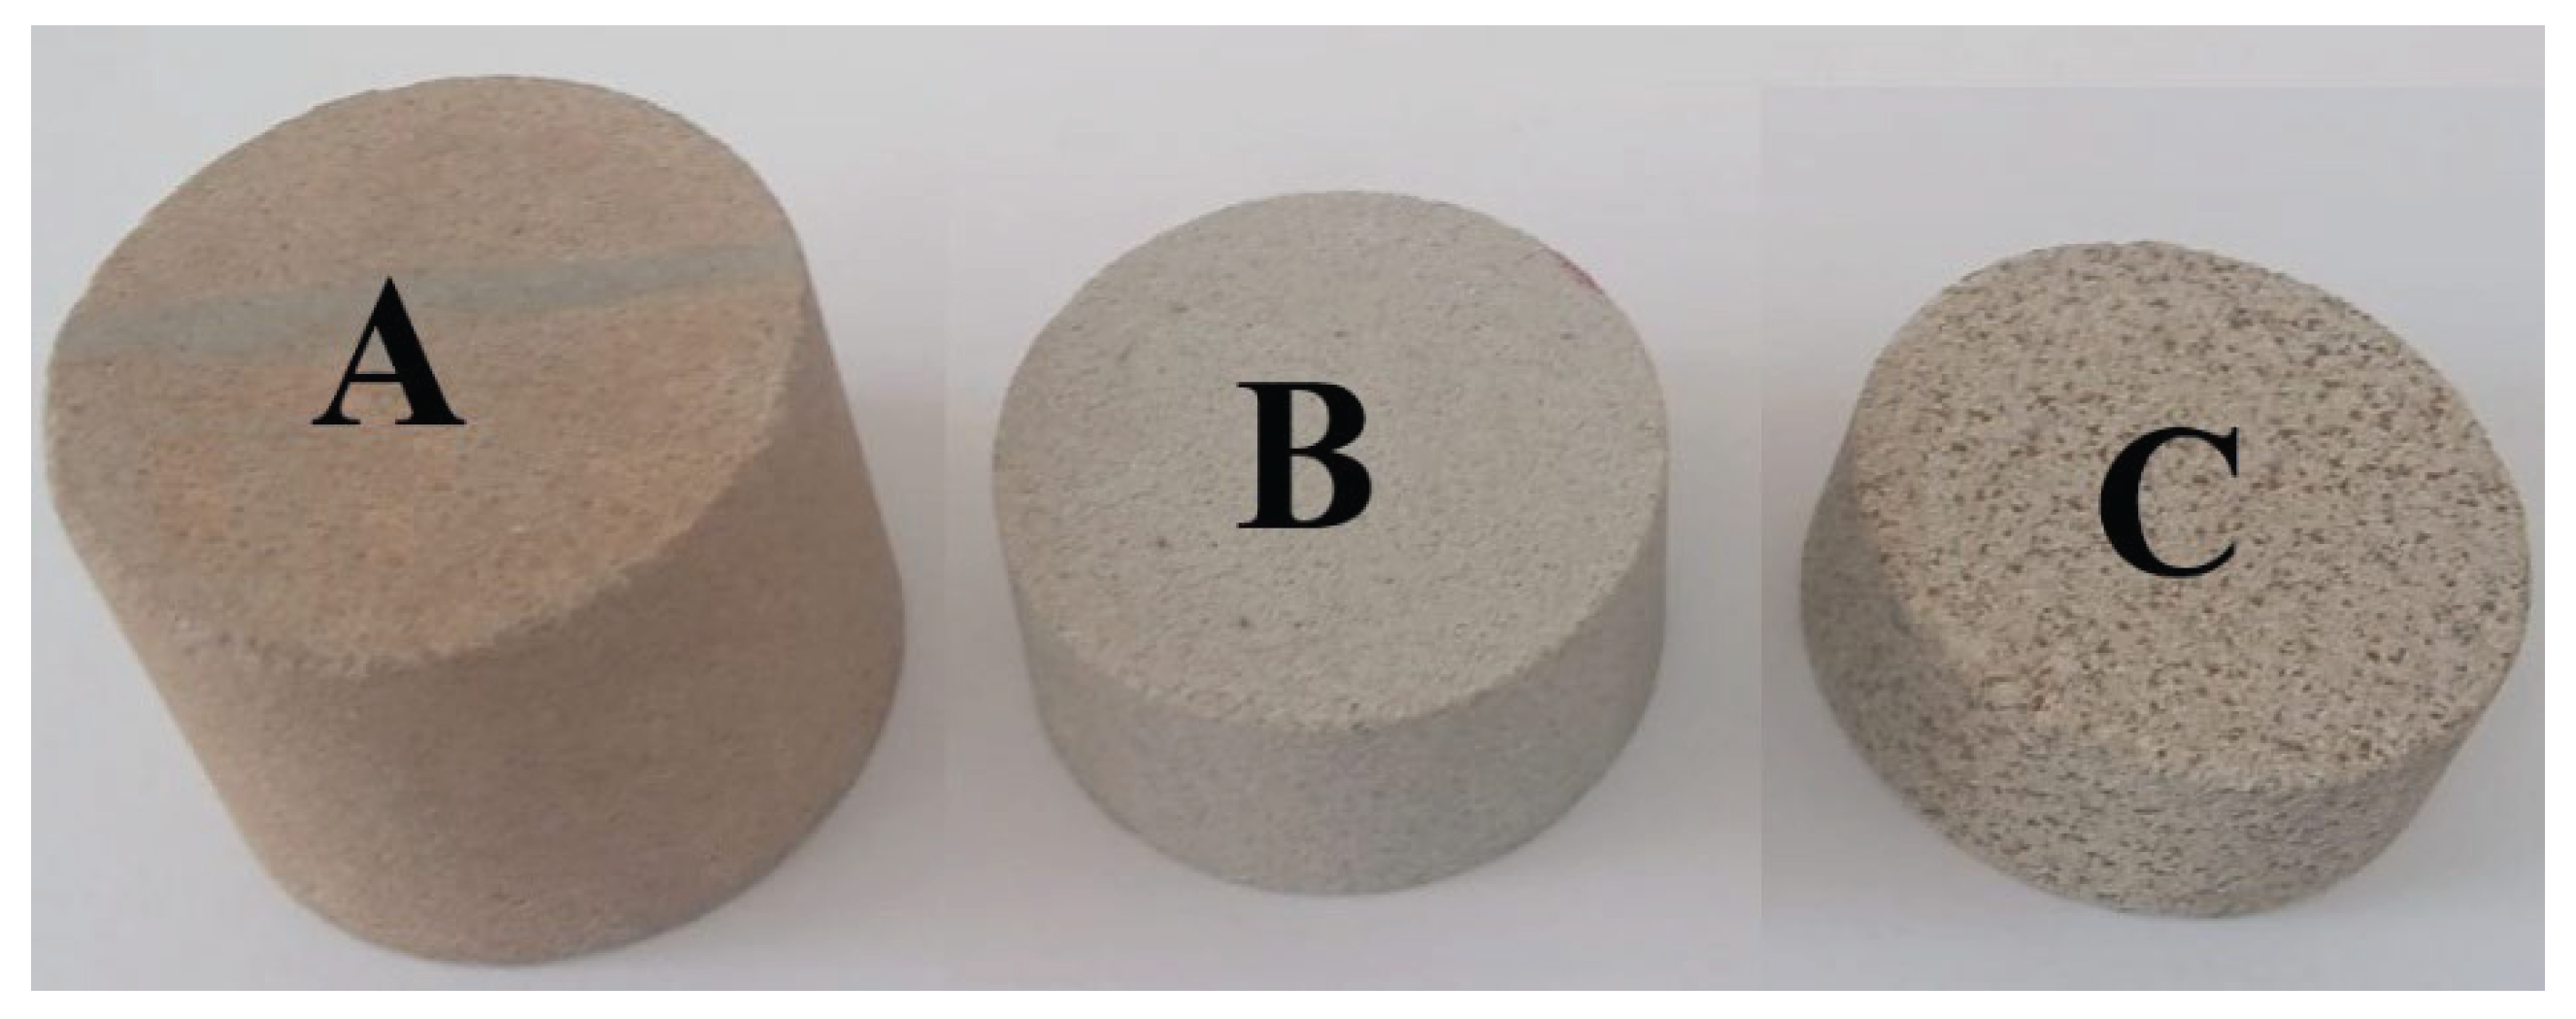
Figure 2.
XRD Diffractograms of Raw Dolomite (Core A) Before and After Exposure to Hydrogen at 100 bar Pressure (The Untreated Sample is Denoted as Core A, While the Hydrogen-Treated Sample is Denoted as Core AH).
Figure 2.
XRD Diffractograms of Raw Dolomite (Core A) Before and After Exposure to Hydrogen at 100 bar Pressure (The Untreated Sample is Denoted as Core A, While the Hydrogen-Treated Sample is Denoted as Core AH).
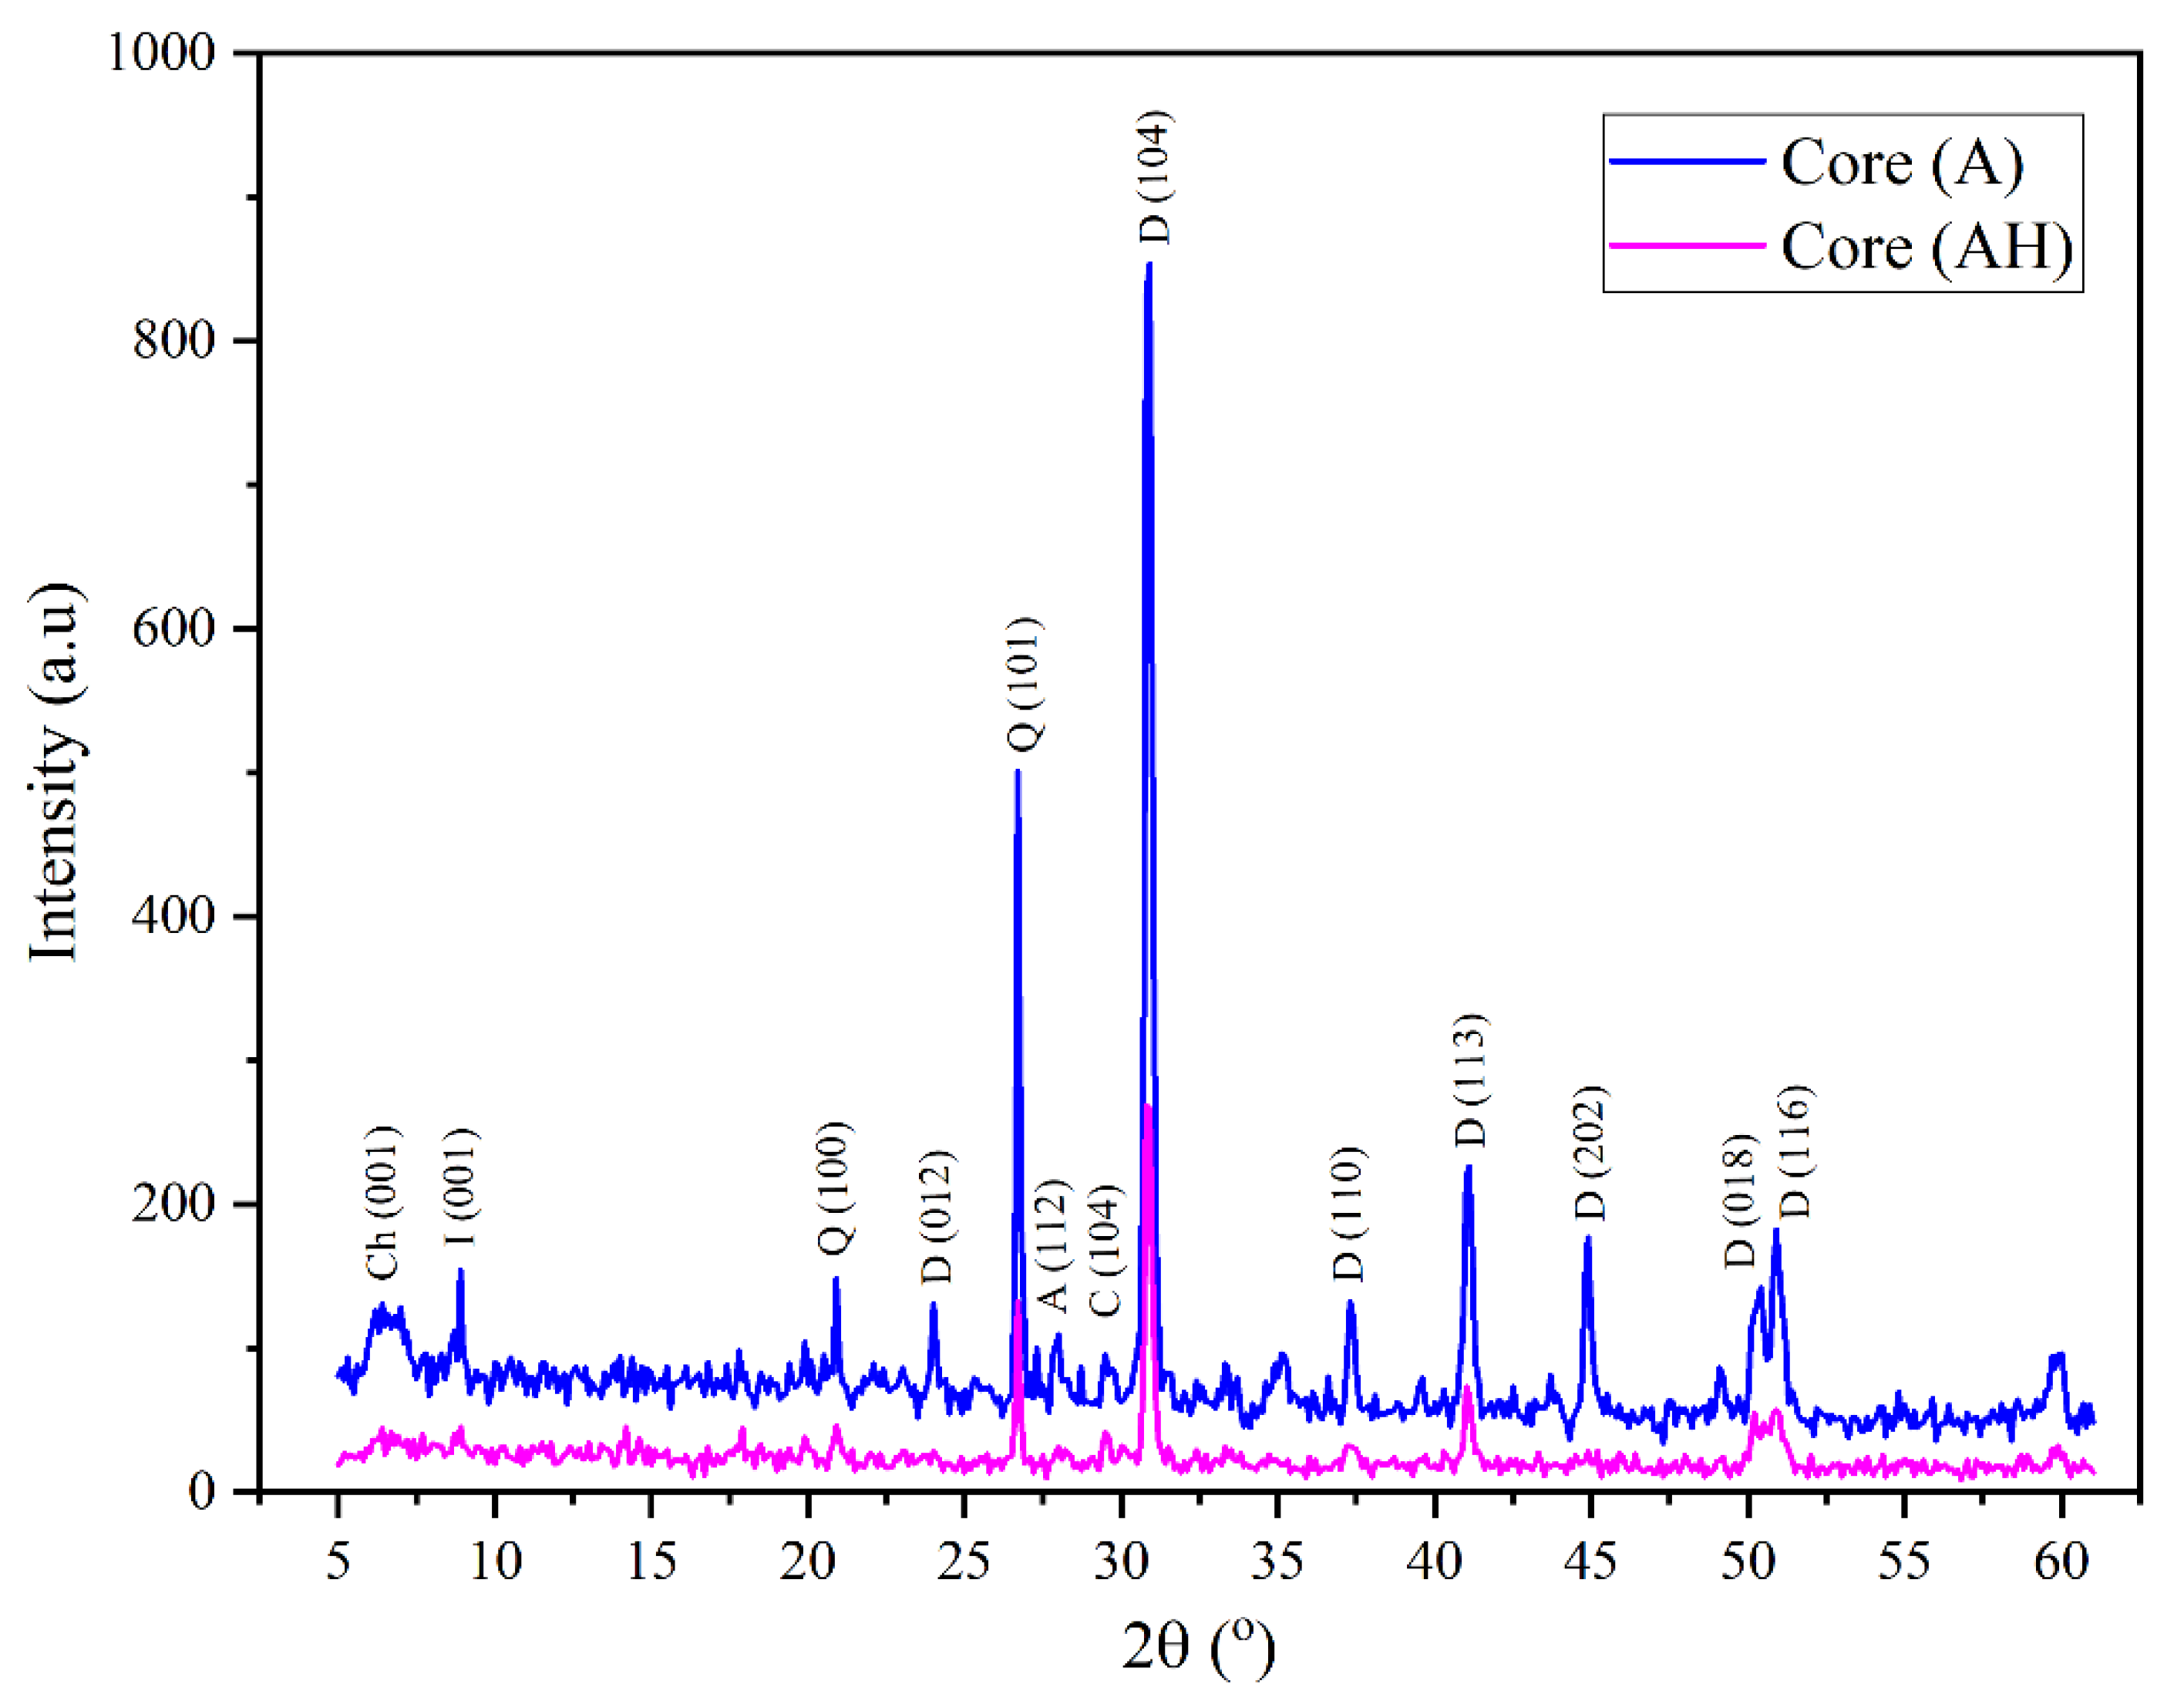
Figure 3.
XRD Diffractograms of Raw Limestone (Core B) Before and After Exposure to Hydrogen at 100 bar Pressure (The Untreated Sample is Denoted as Core B, and the Hydrogen-Treated Sample as Core BH).
Figure 3.
XRD Diffractograms of Raw Limestone (Core B) Before and After Exposure to Hydrogen at 100 bar Pressure (The Untreated Sample is Denoted as Core B, and the Hydrogen-Treated Sample as Core BH).
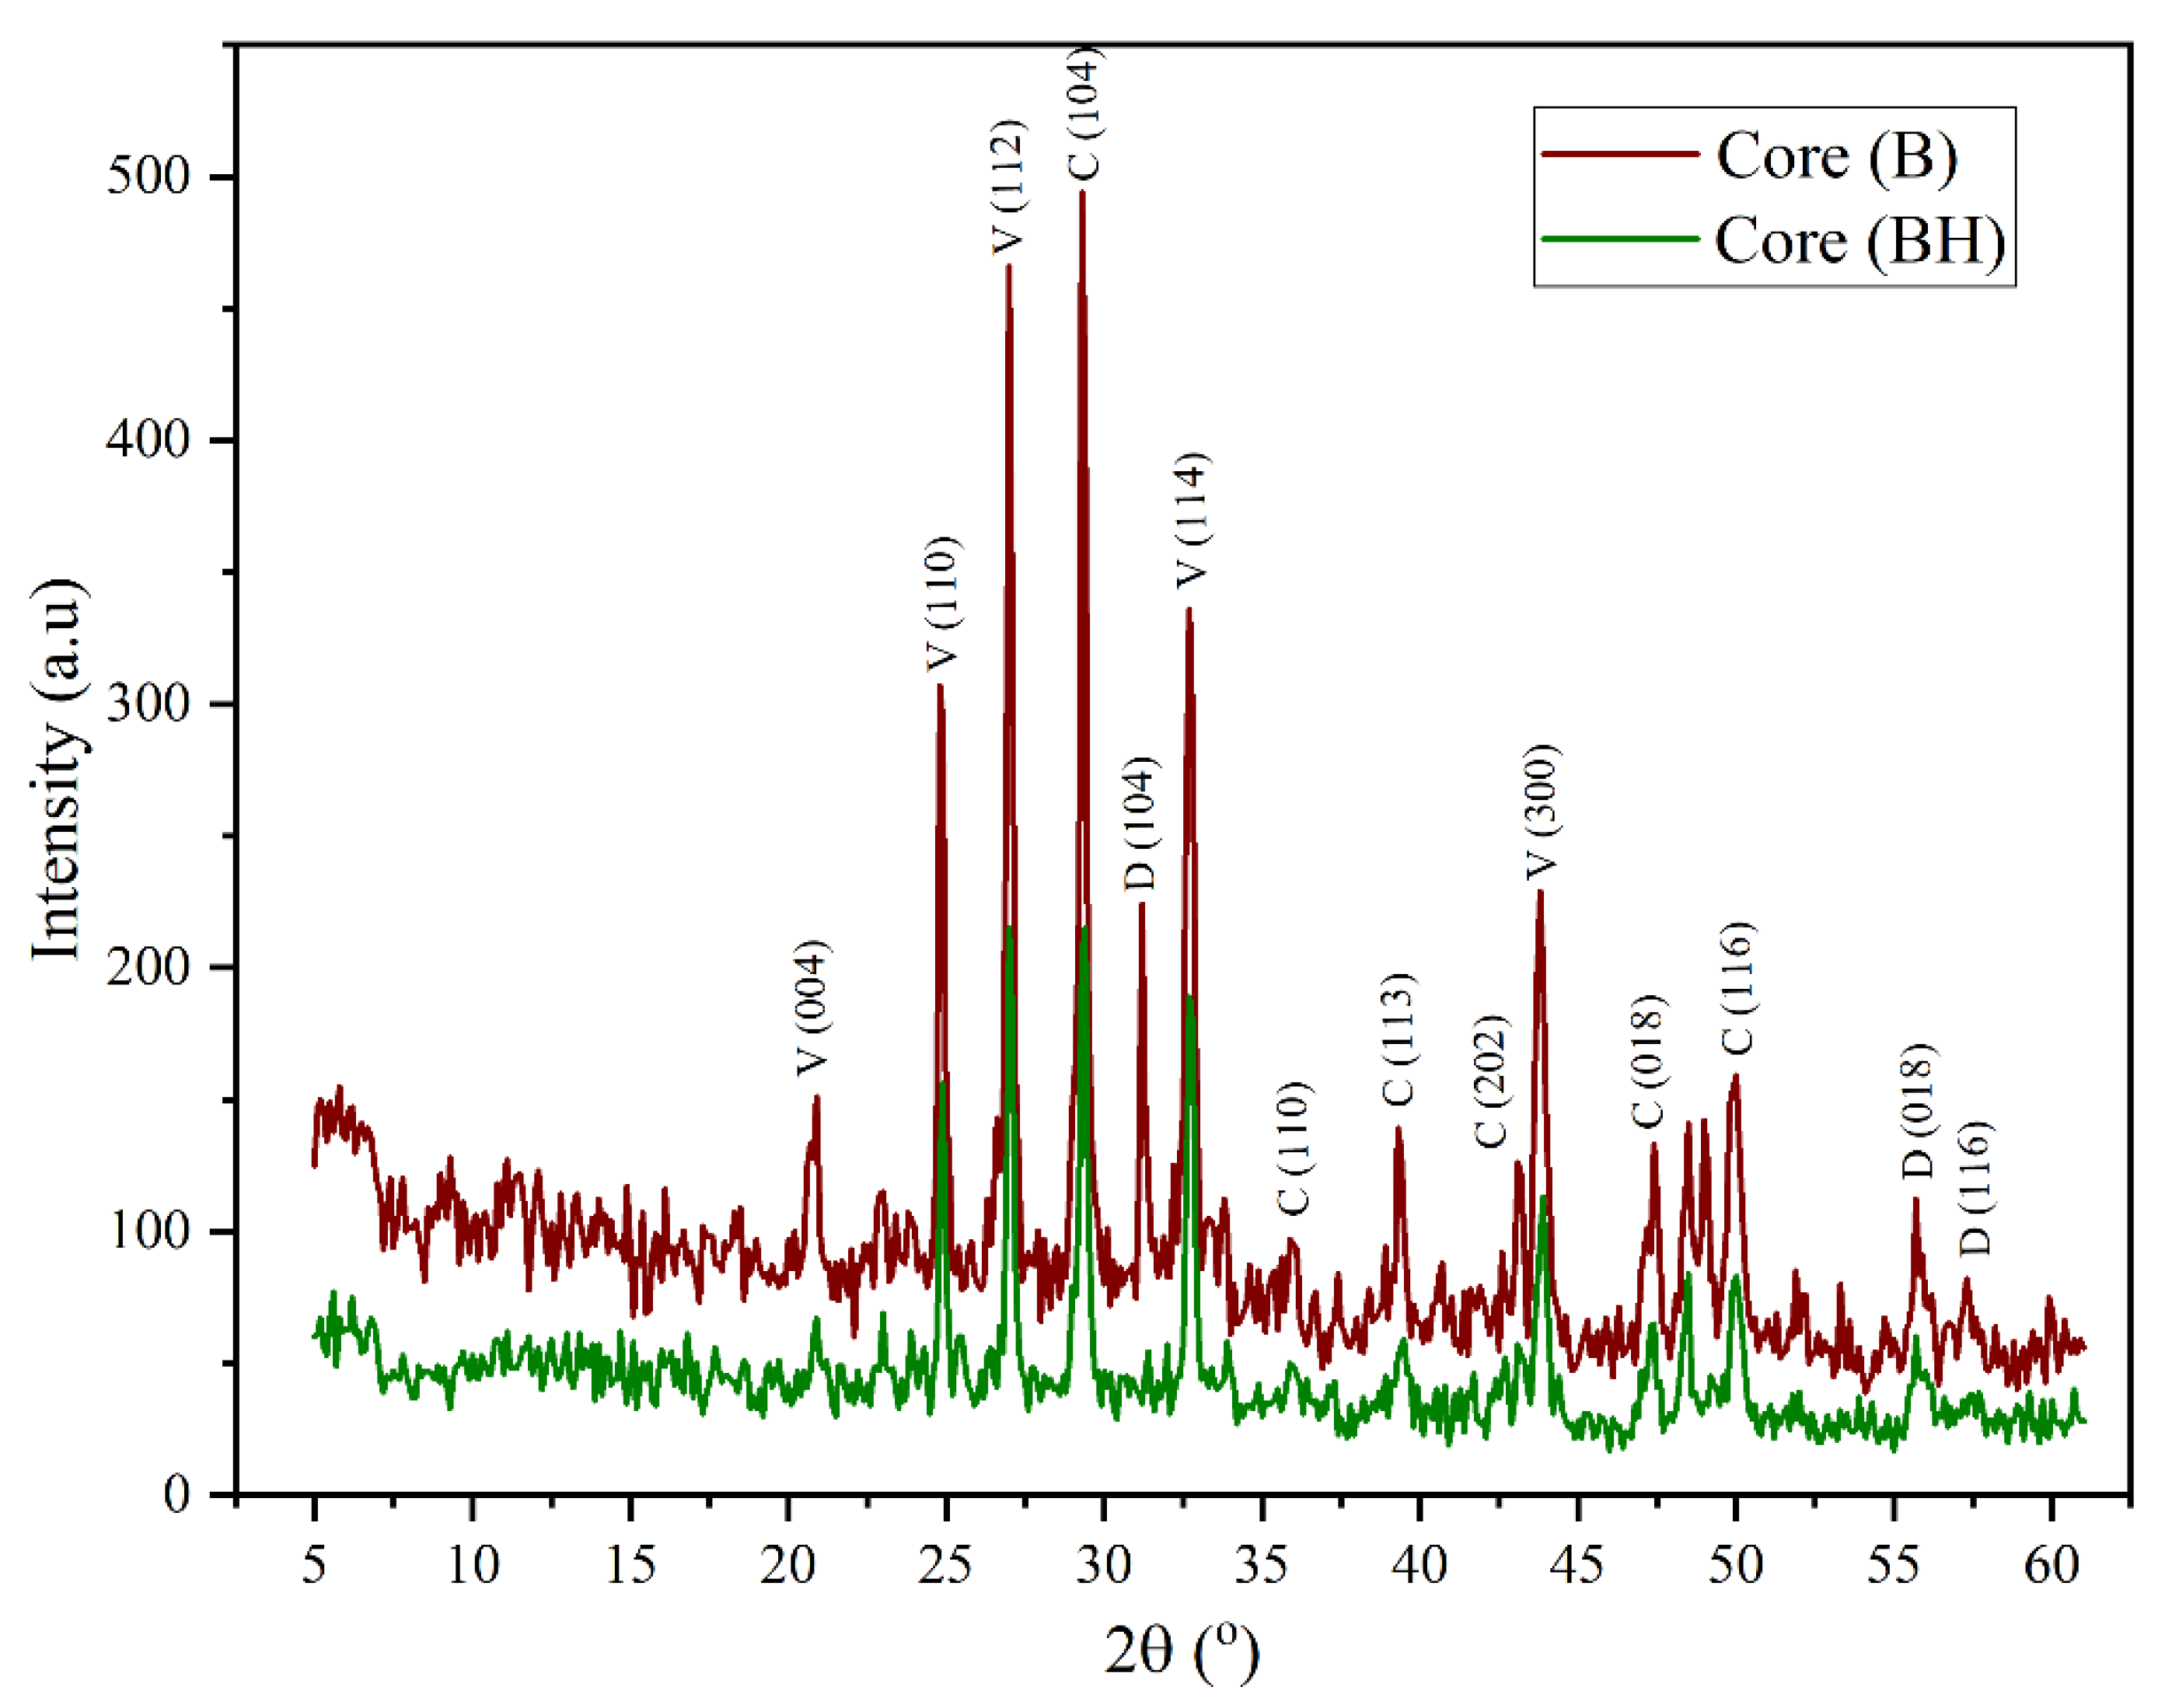
Figure 4.
XRD Diffractograms of Raw Siliceous Rock (Core C) Before and After Exposure to Hydrogen at 100 bar Pressure (The Untreated Sample is Denoted as Core C, and the Hydrogen-Treated Sample as Core CH).
Figure 4.
XRD Diffractograms of Raw Siliceous Rock (Core C) Before and After Exposure to Hydrogen at 100 bar Pressure (The Untreated Sample is Denoted as Core C, and the Hydrogen-Treated Sample as Core CH).
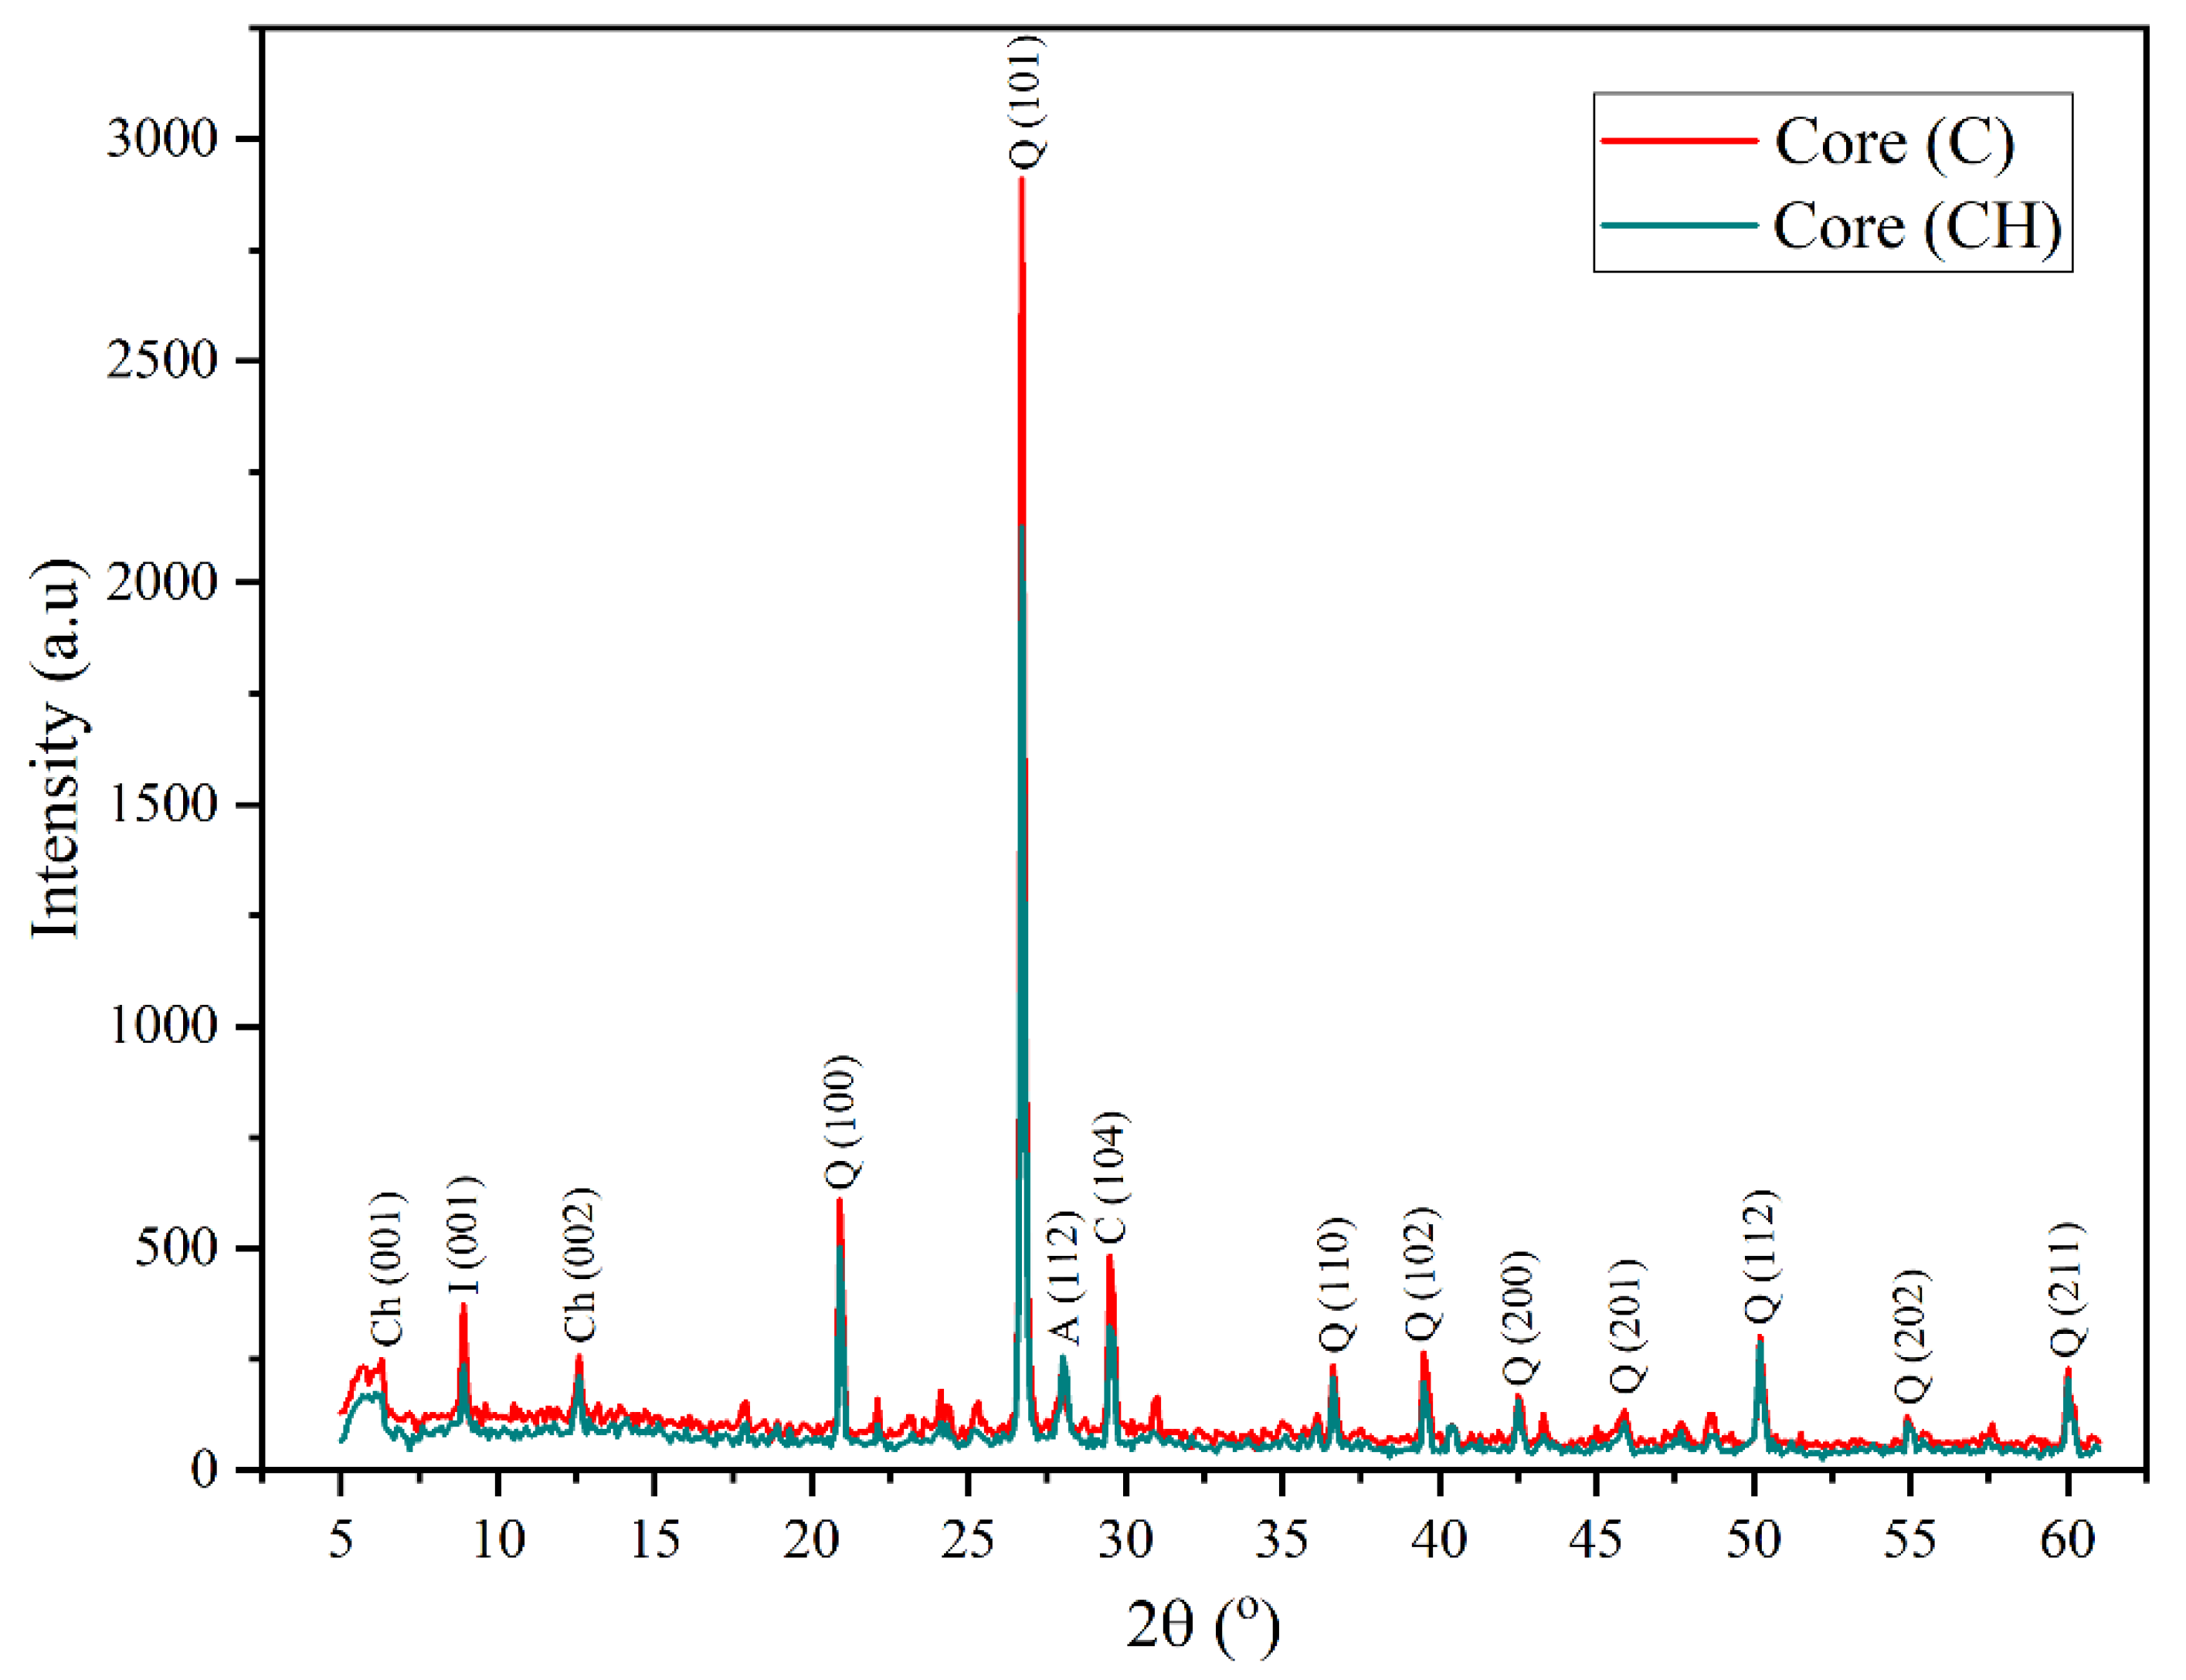
Figure 5.
Nitrogen adsorption–desorption isotherms for cores A and AH.
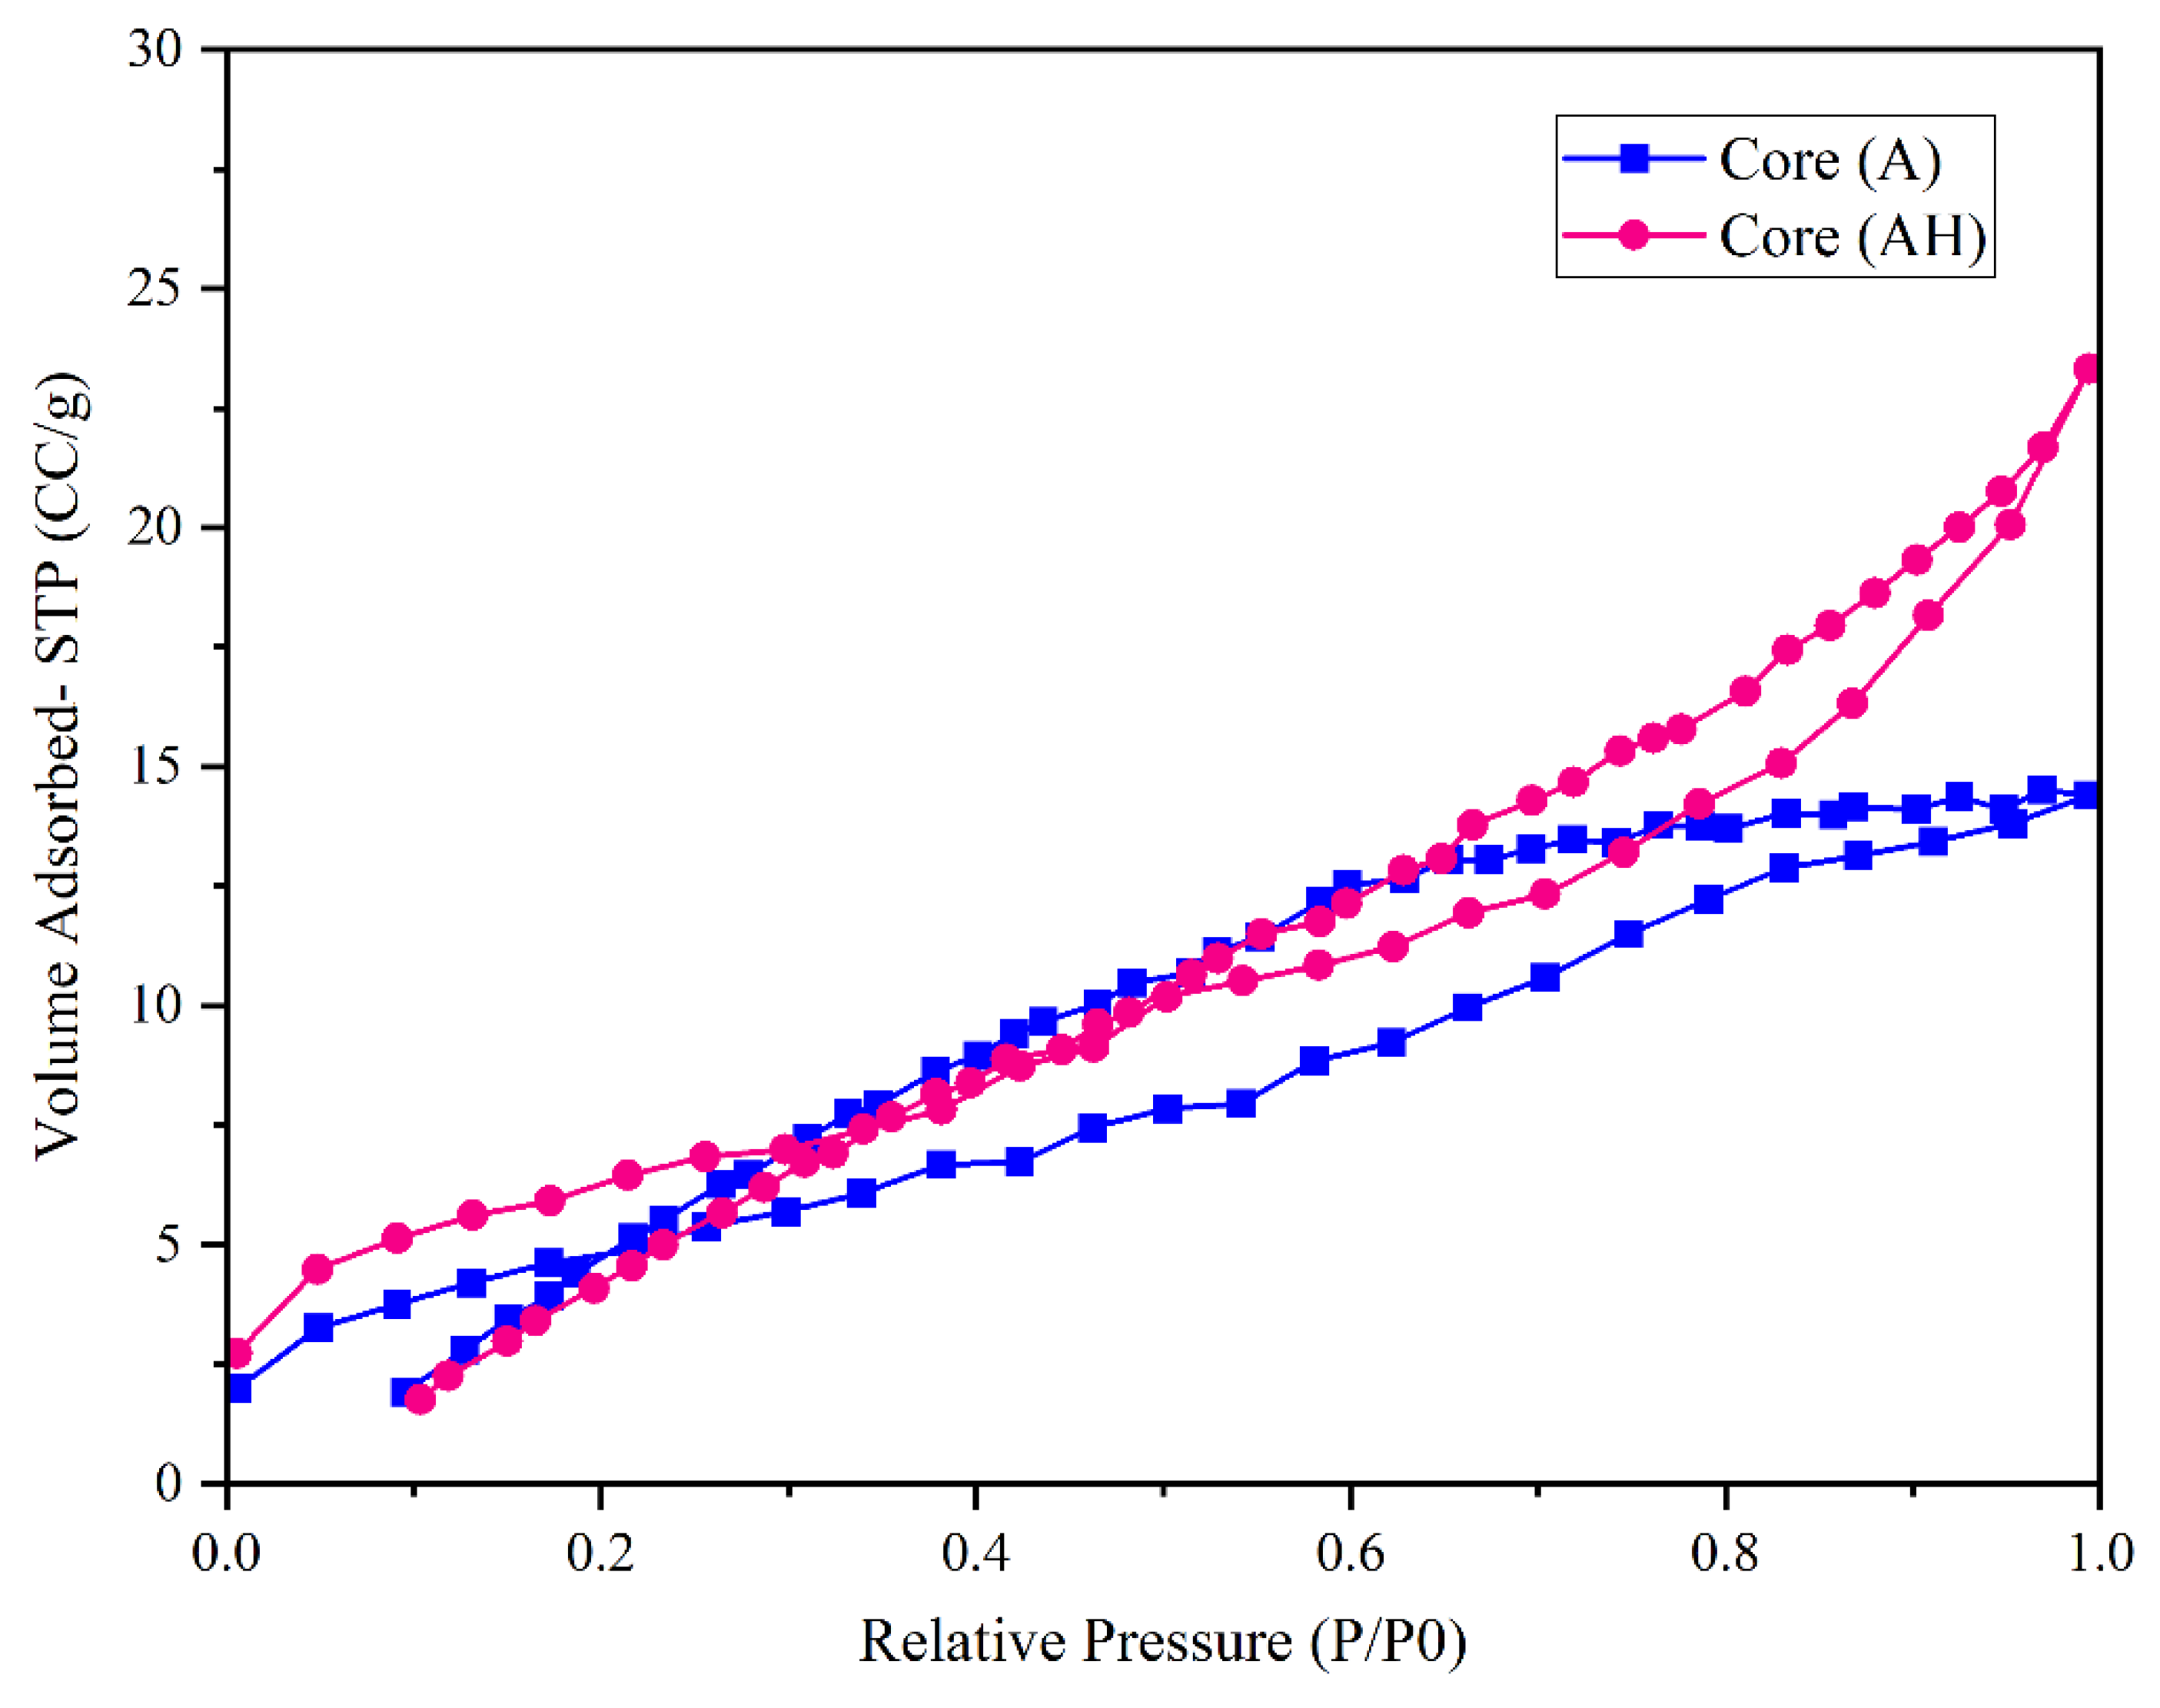
Figure 6.
Pore size distribution and pore volume for cores A and AH.
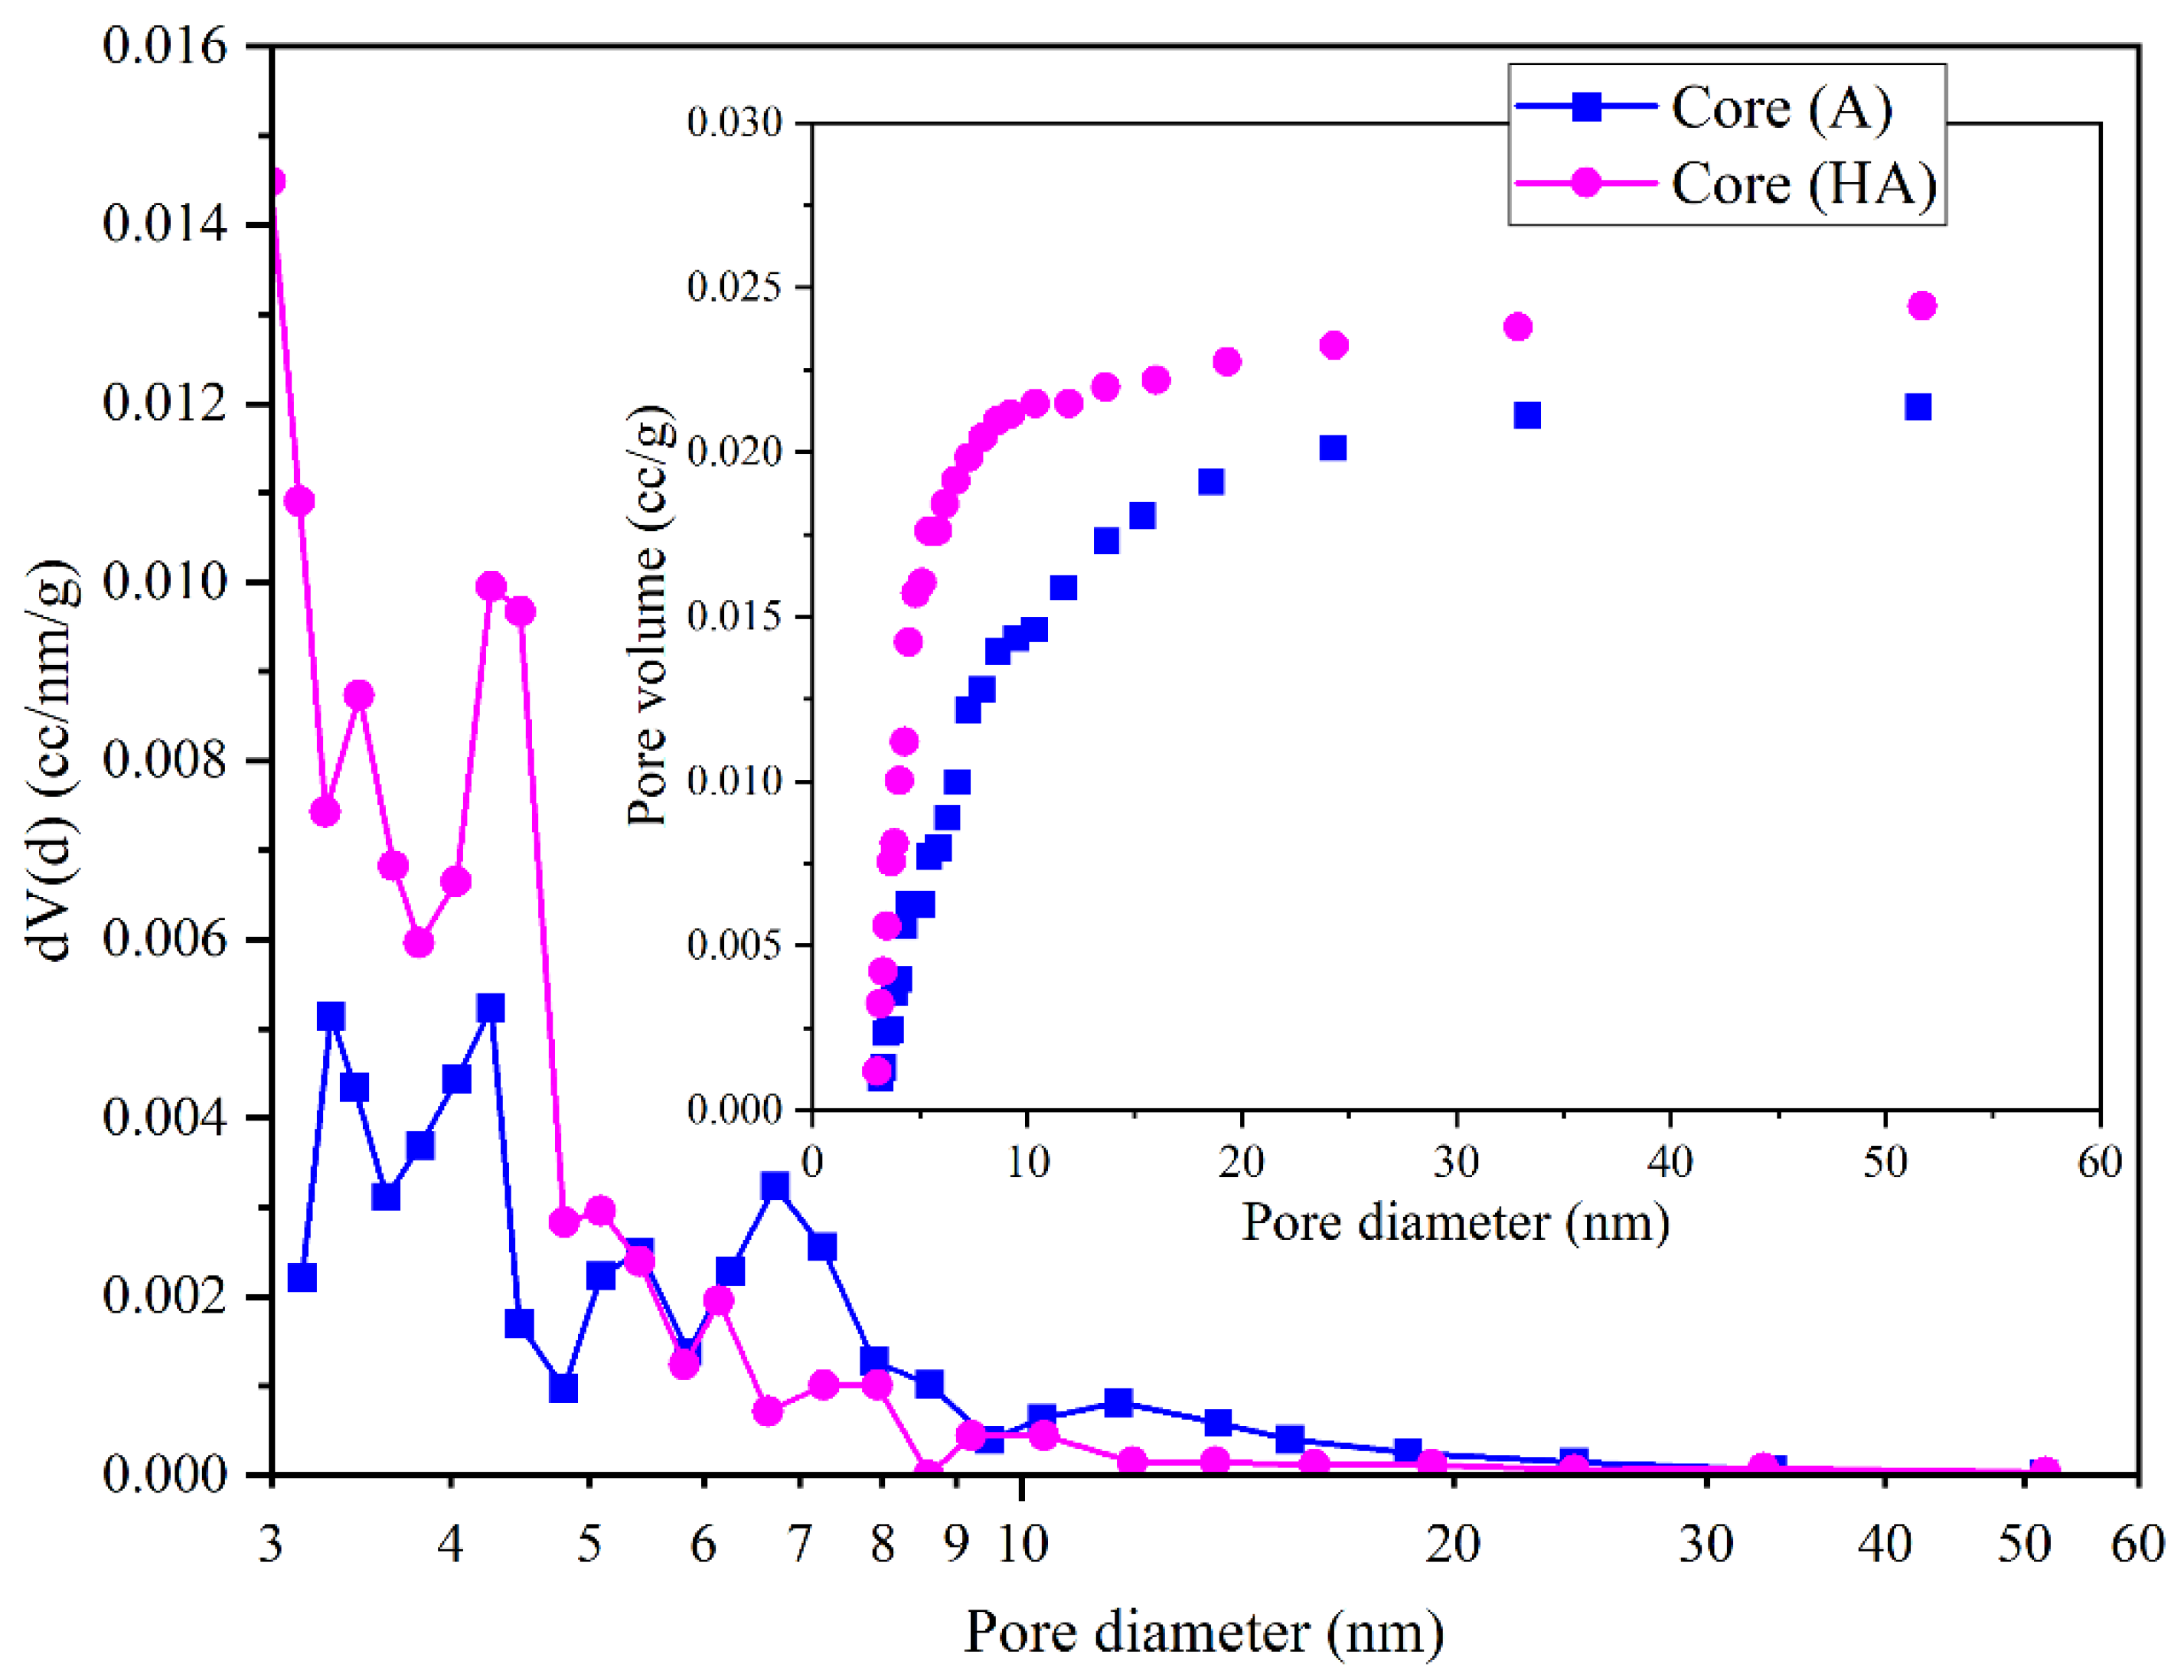
Figure 7.
Nitrogen adsorption–desorption isotherms for cores B and BH.
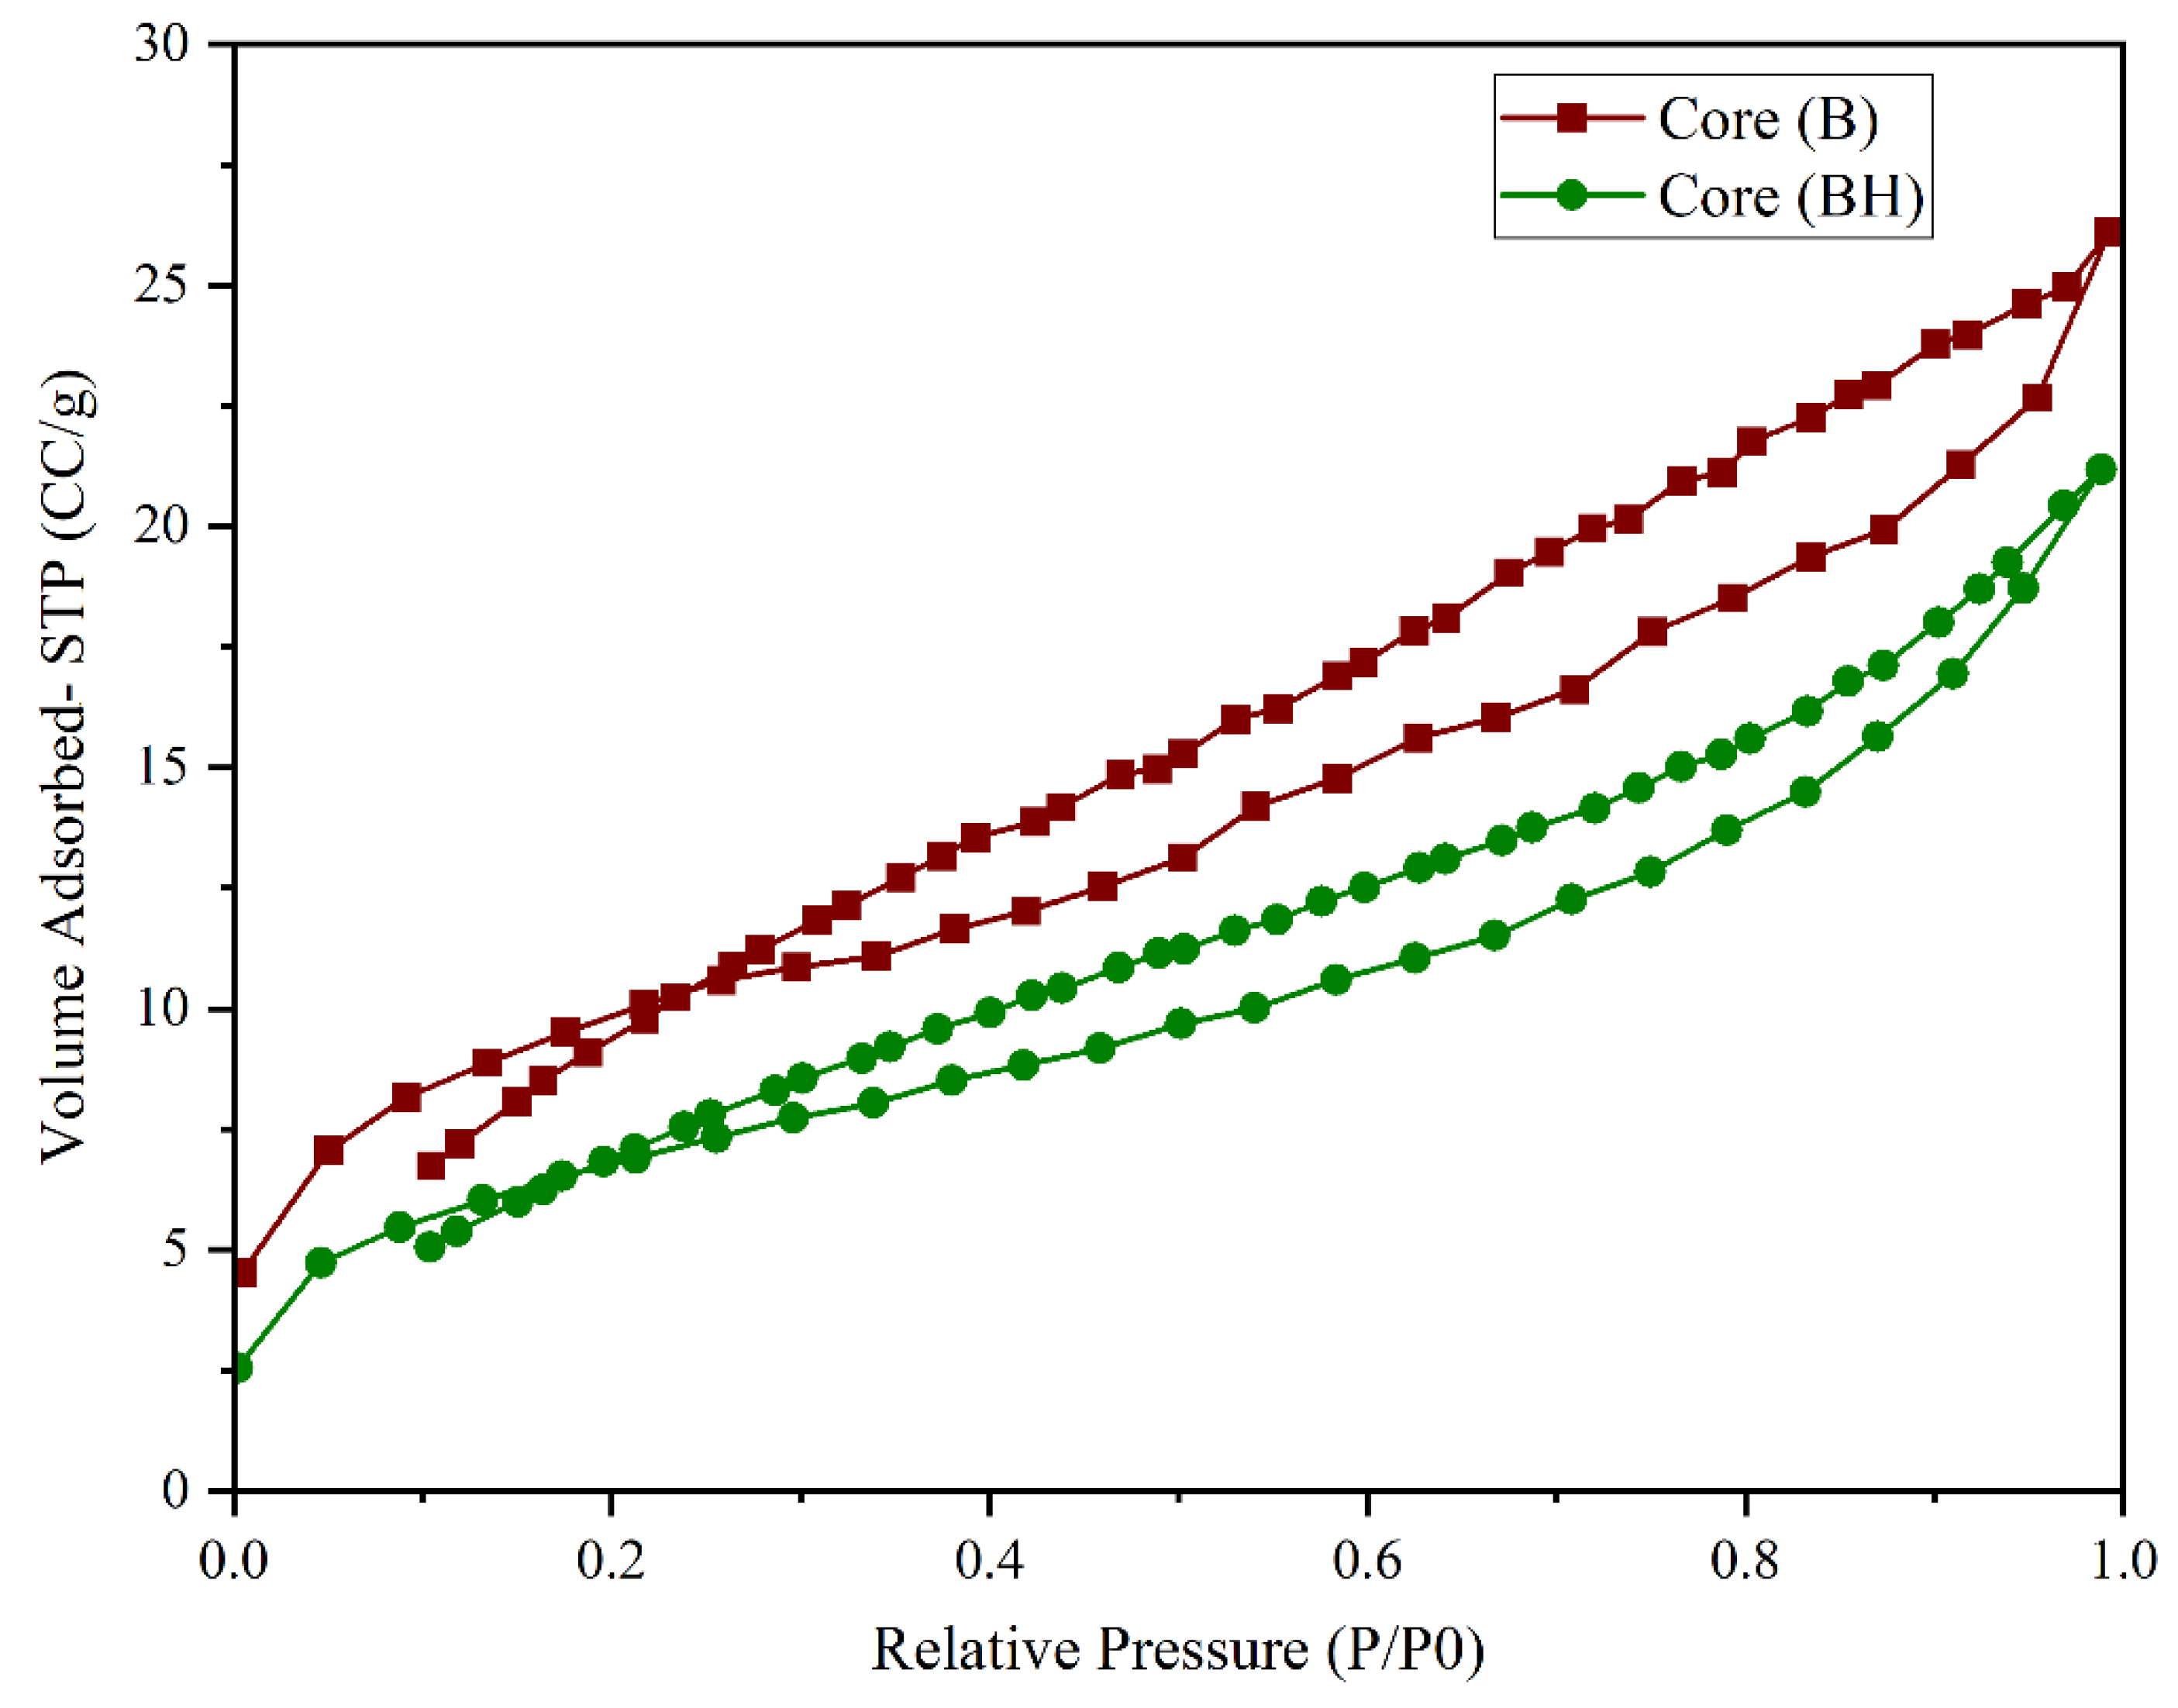
Figure 8.
Pore size distribution and pore volume for cores B and BH.
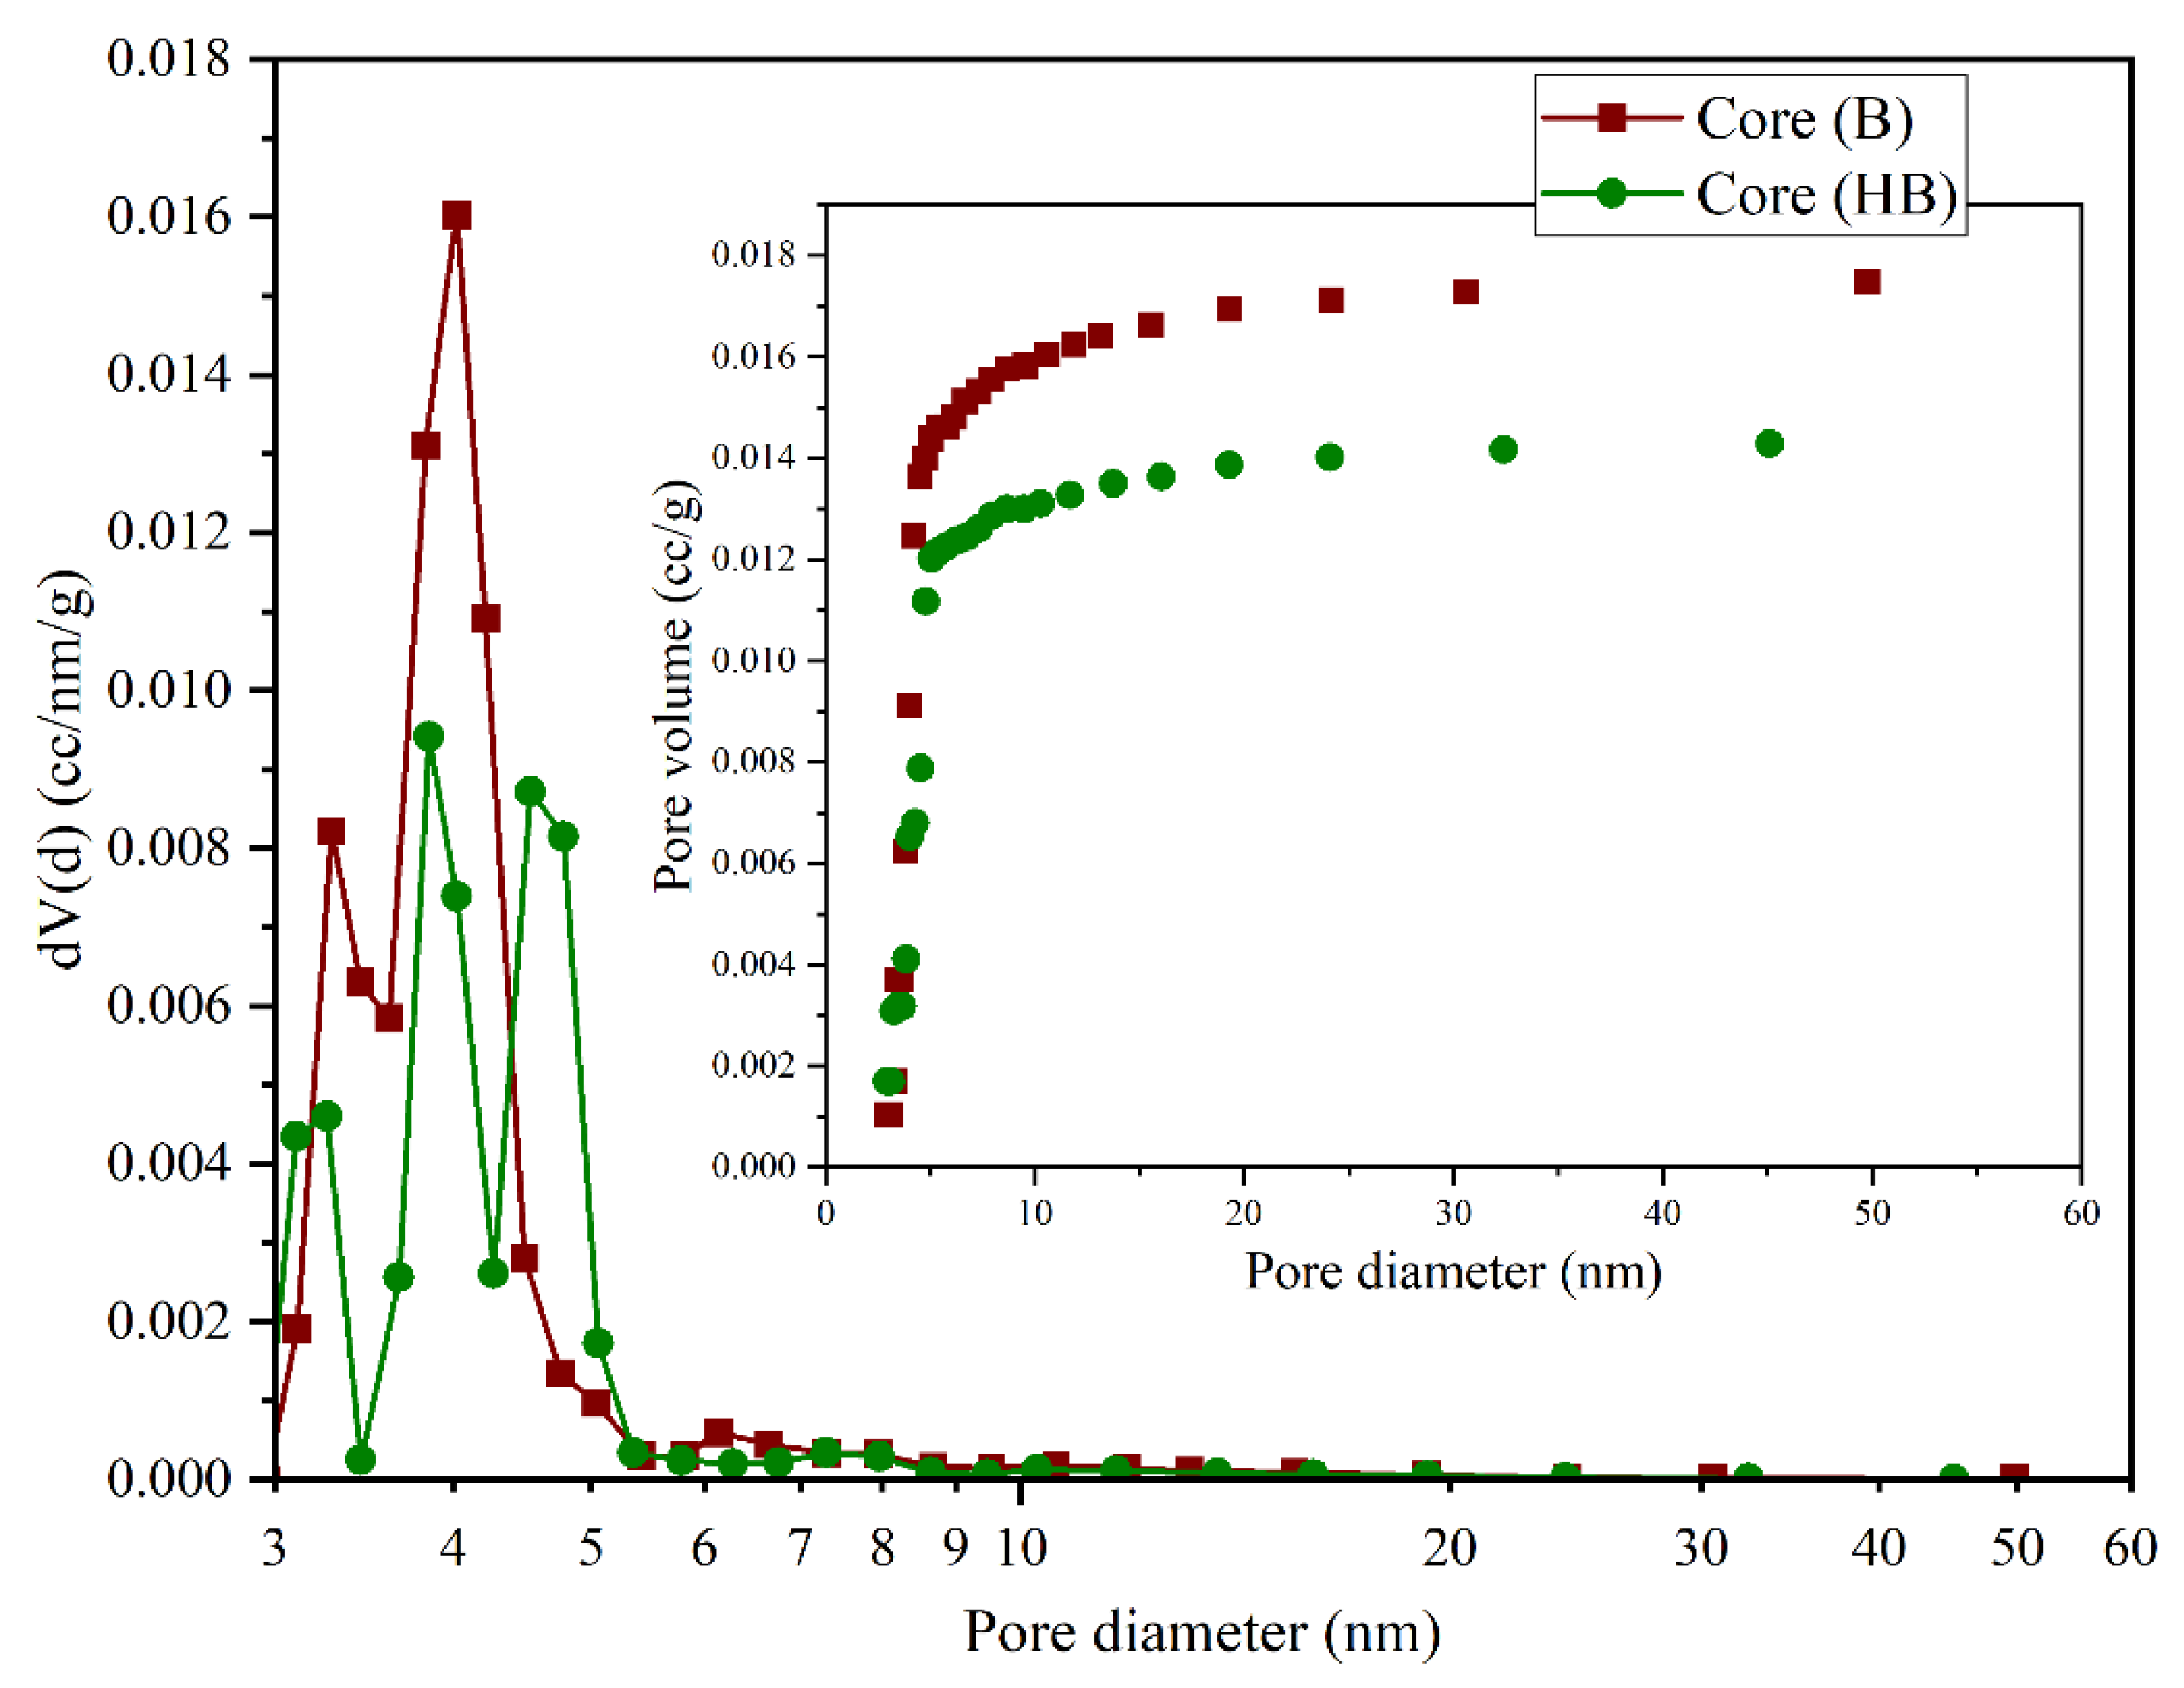
Figure 9.
Nitrogen adsorption–desorption isotherms for cores C and CH.
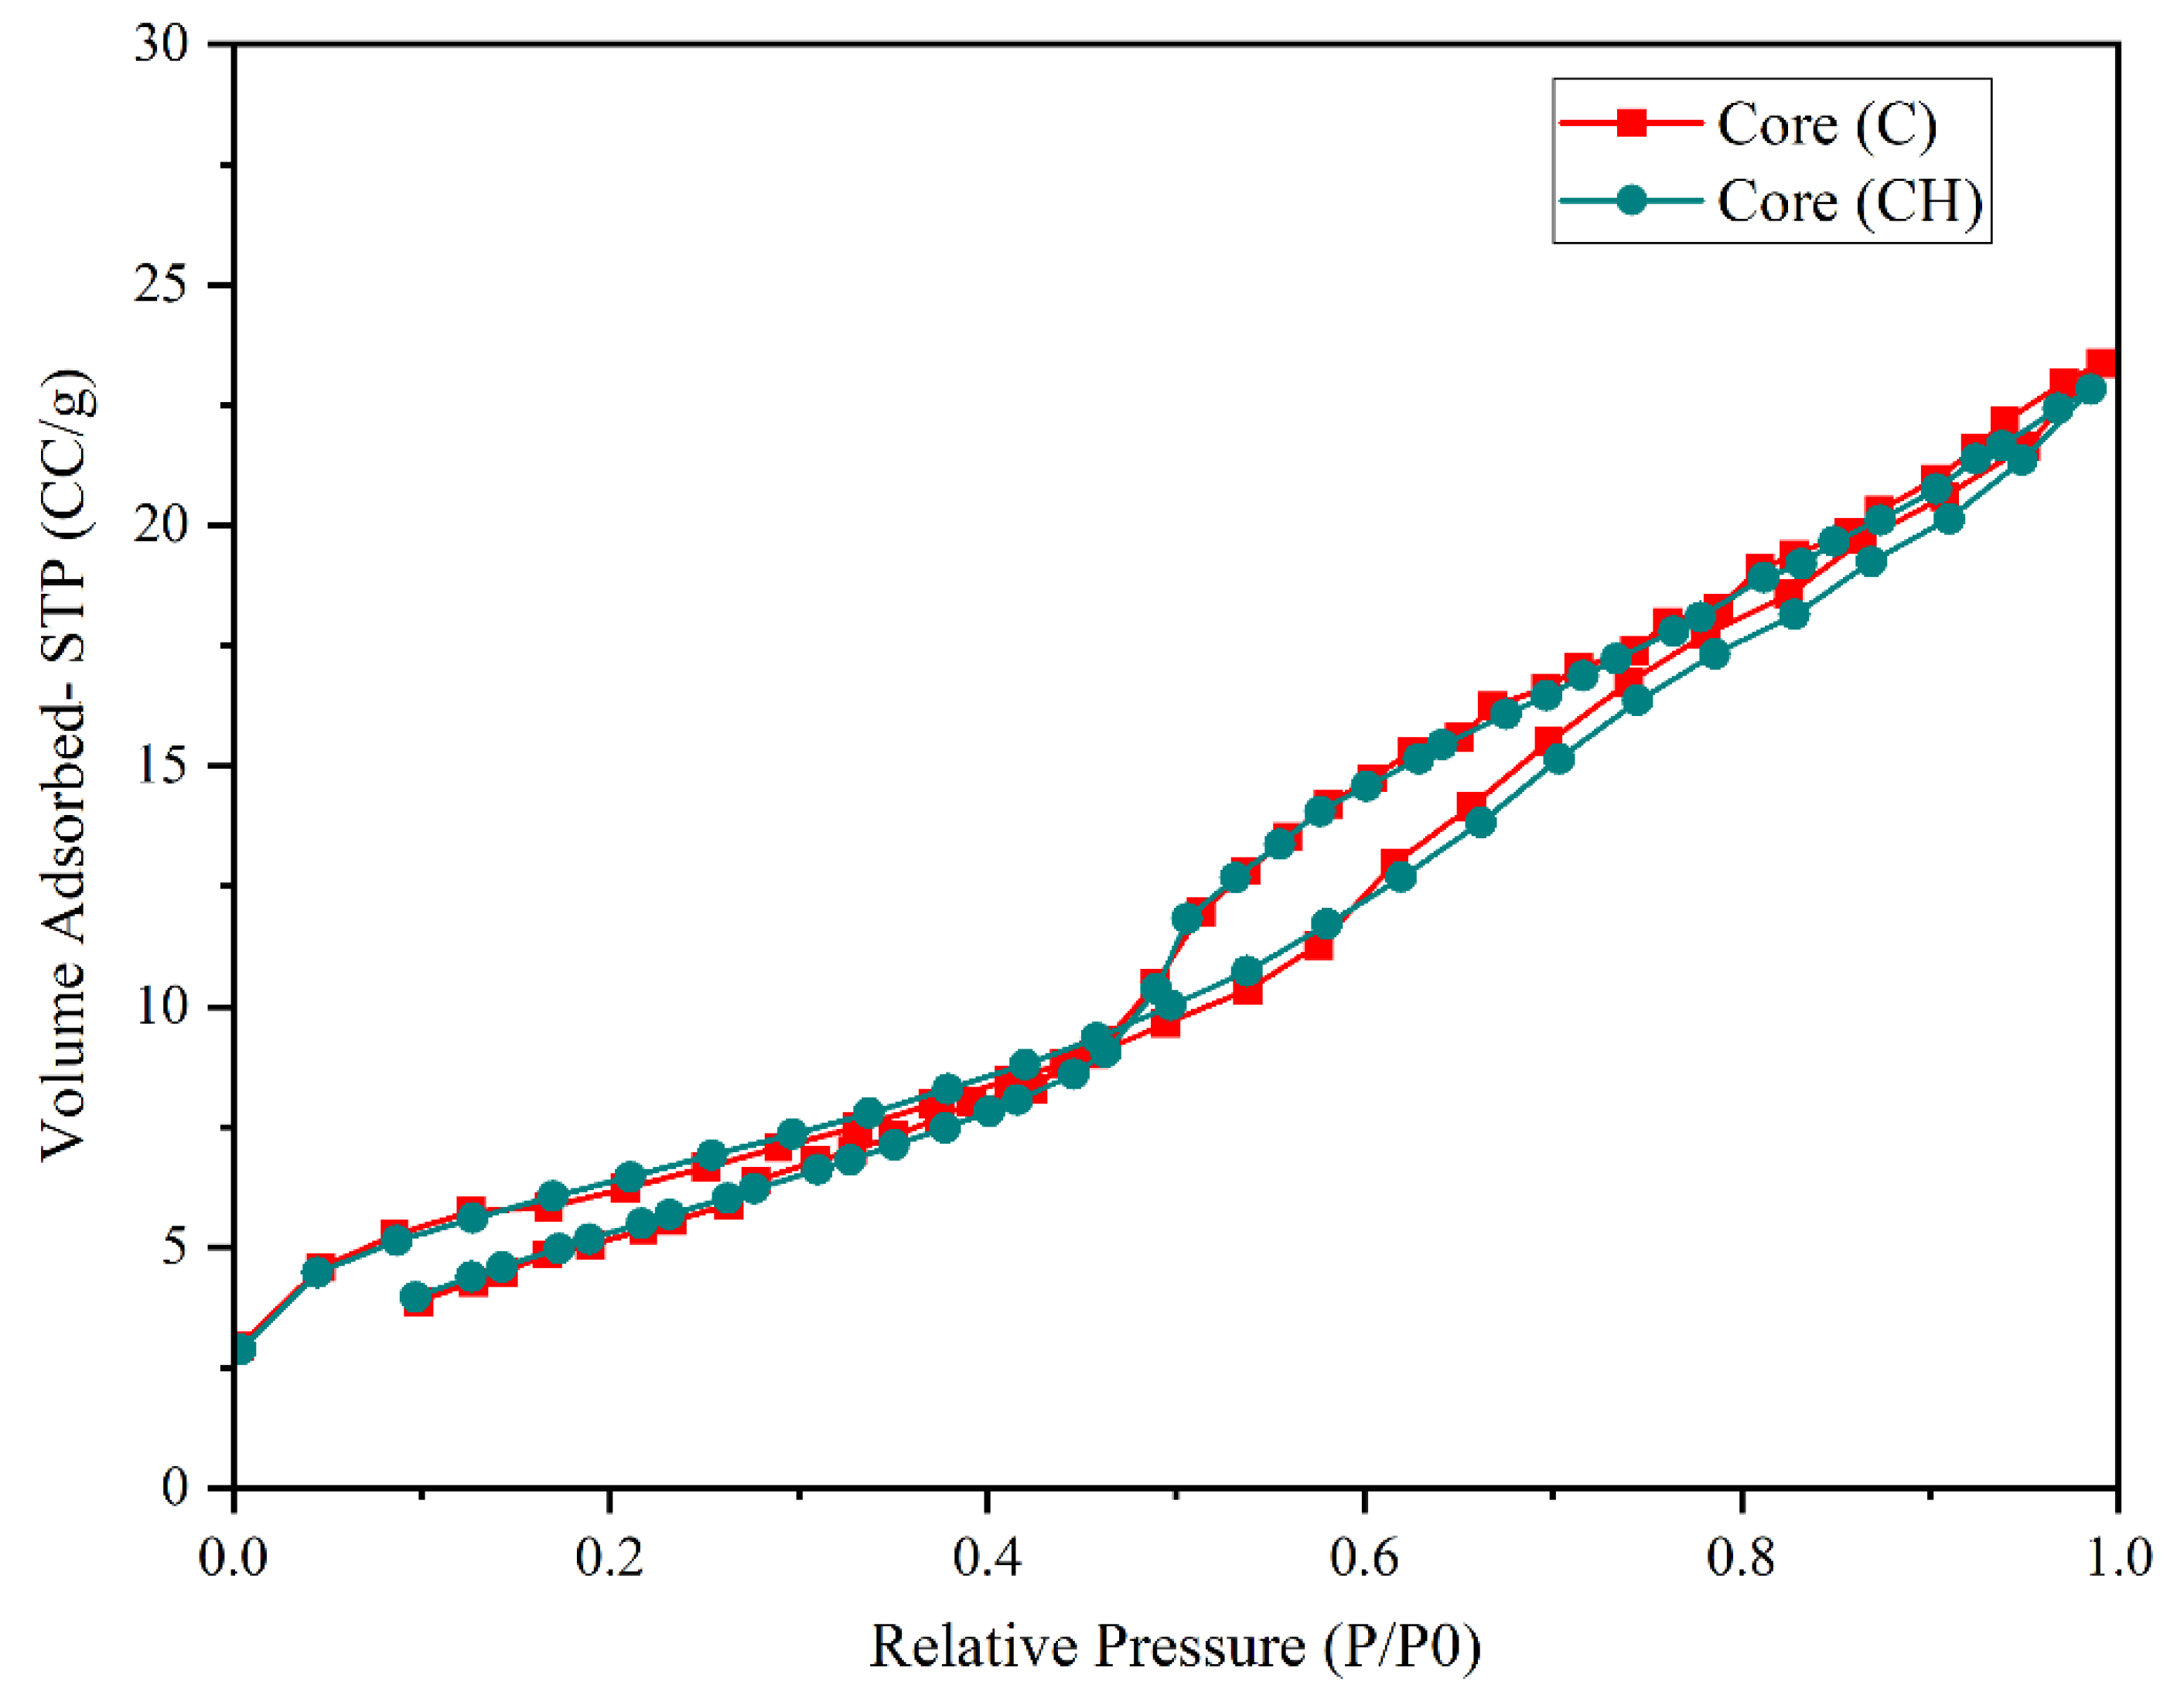
Figure 10.
Pore size distribution and pore volume for cores C and CH.
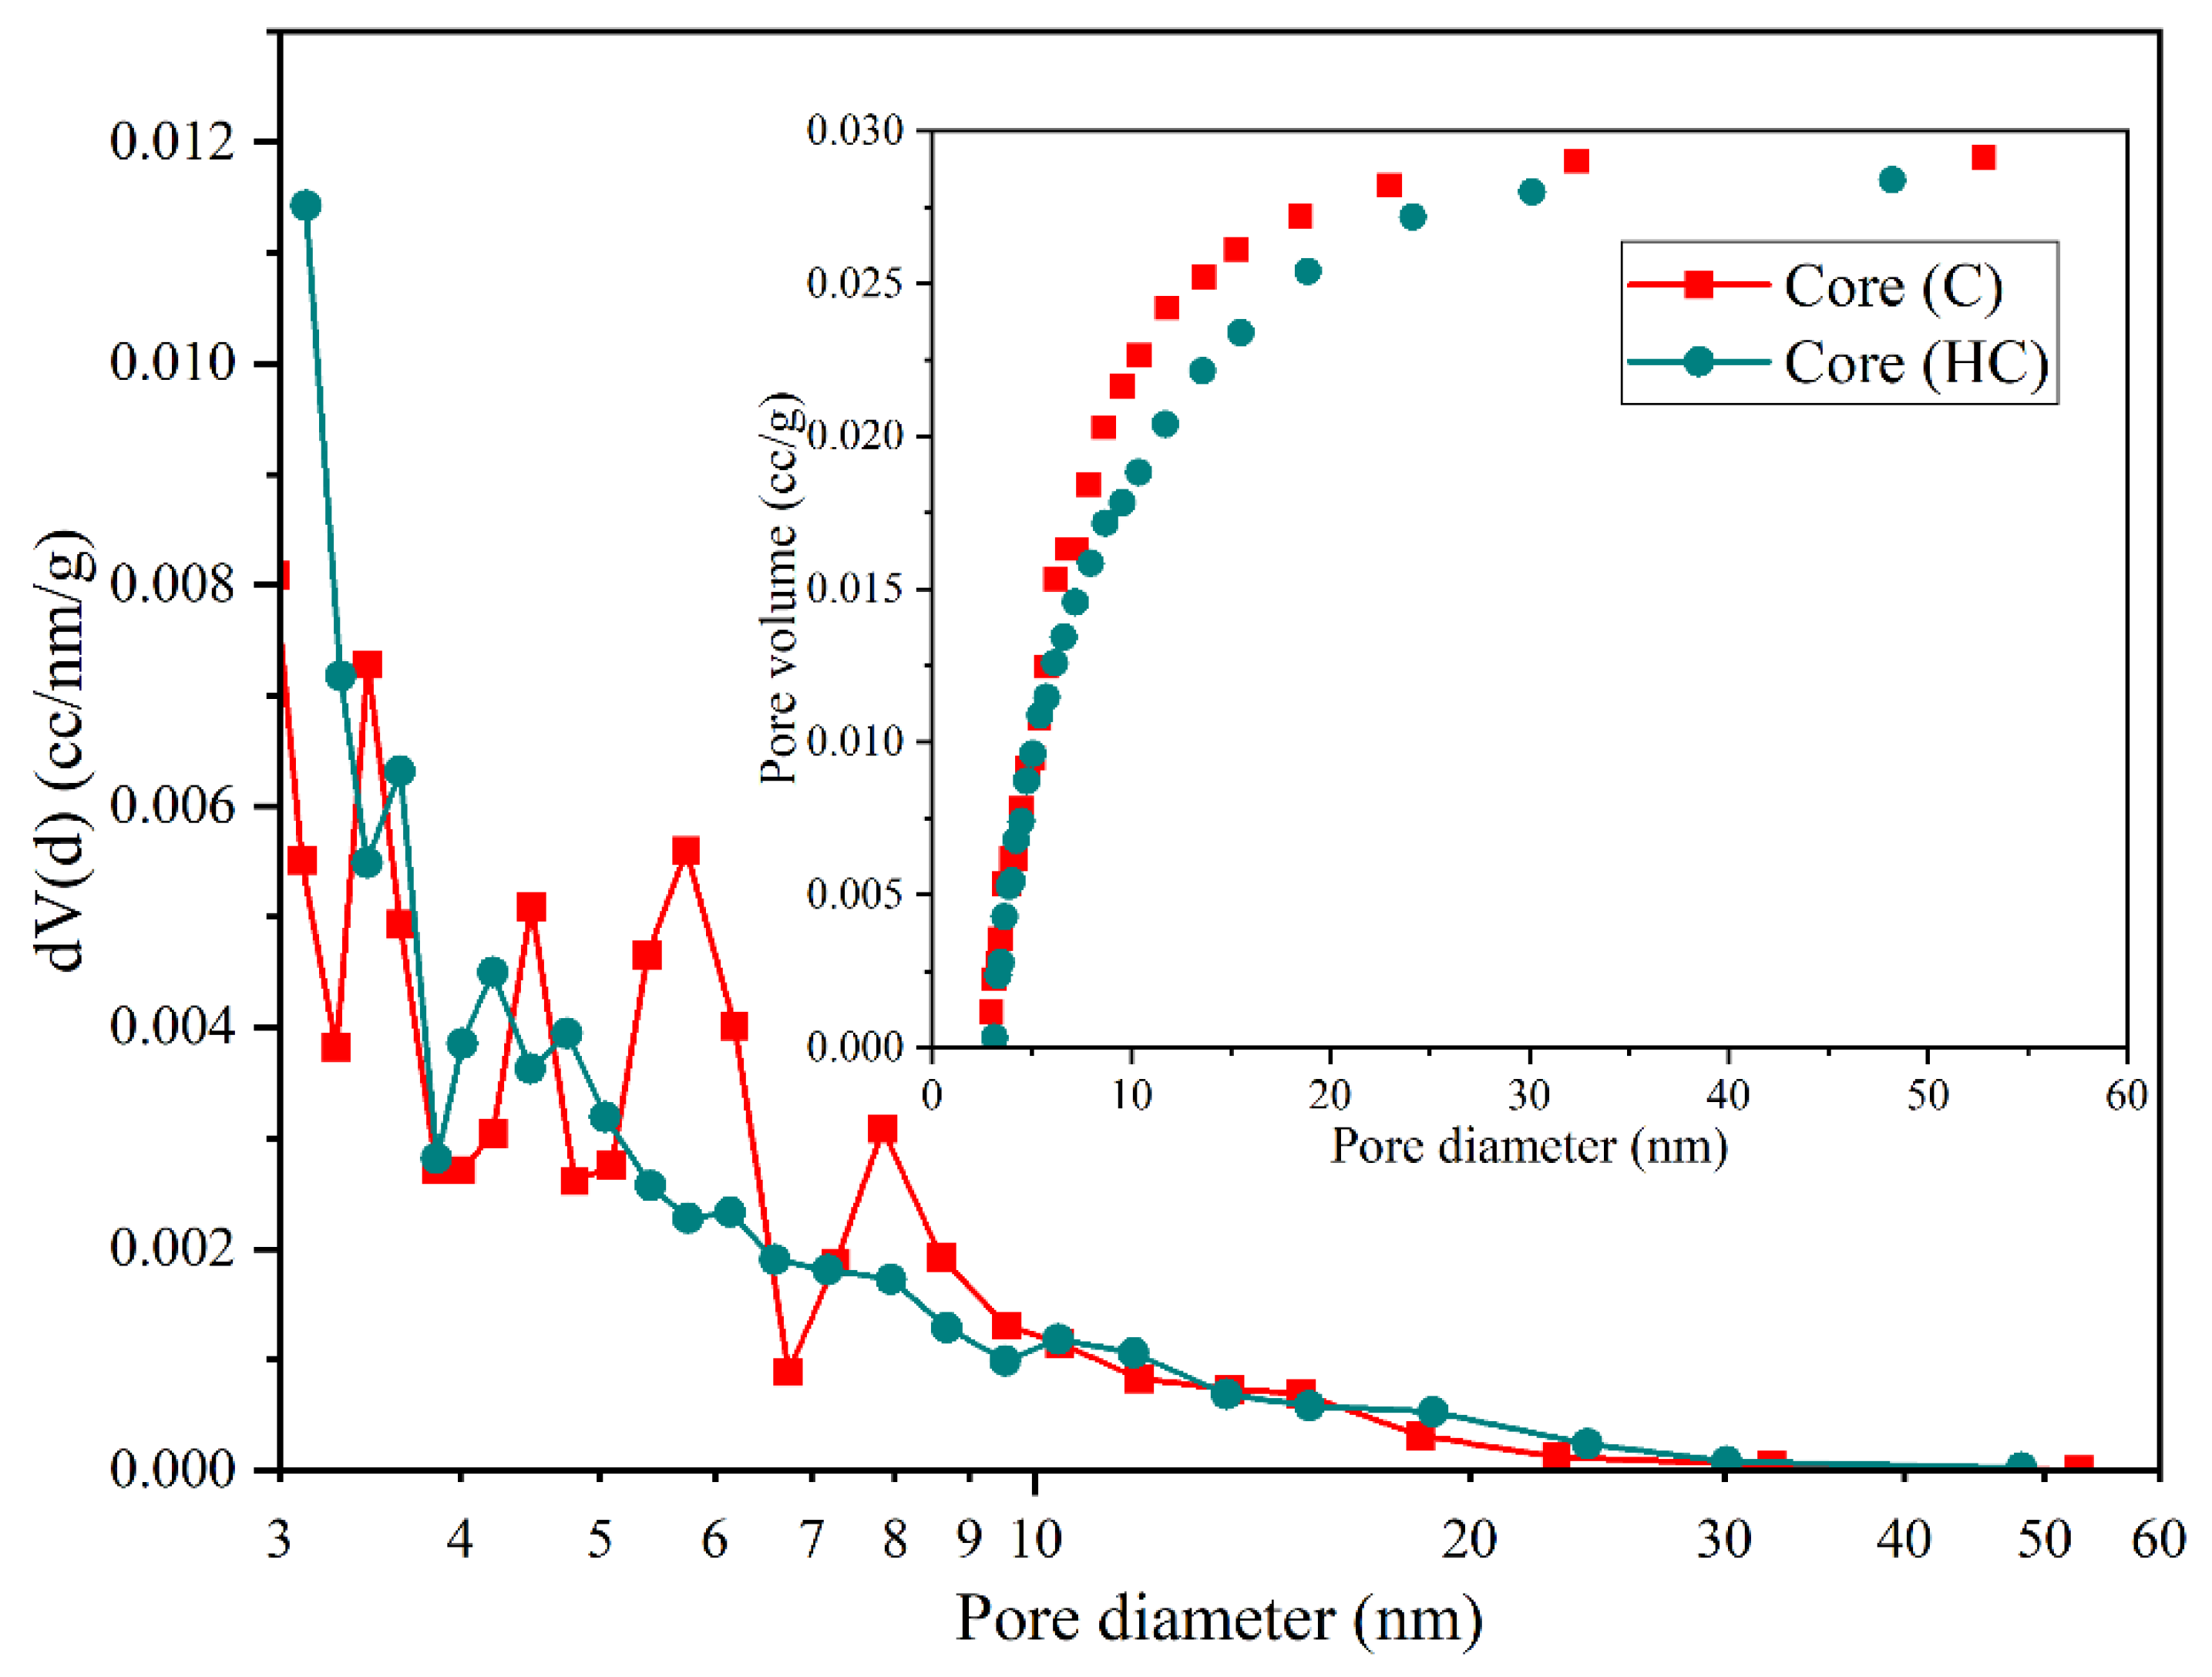
Figure 11.
Scanning Electron Microscopy (SEM) Images of Core Samples A and AH.
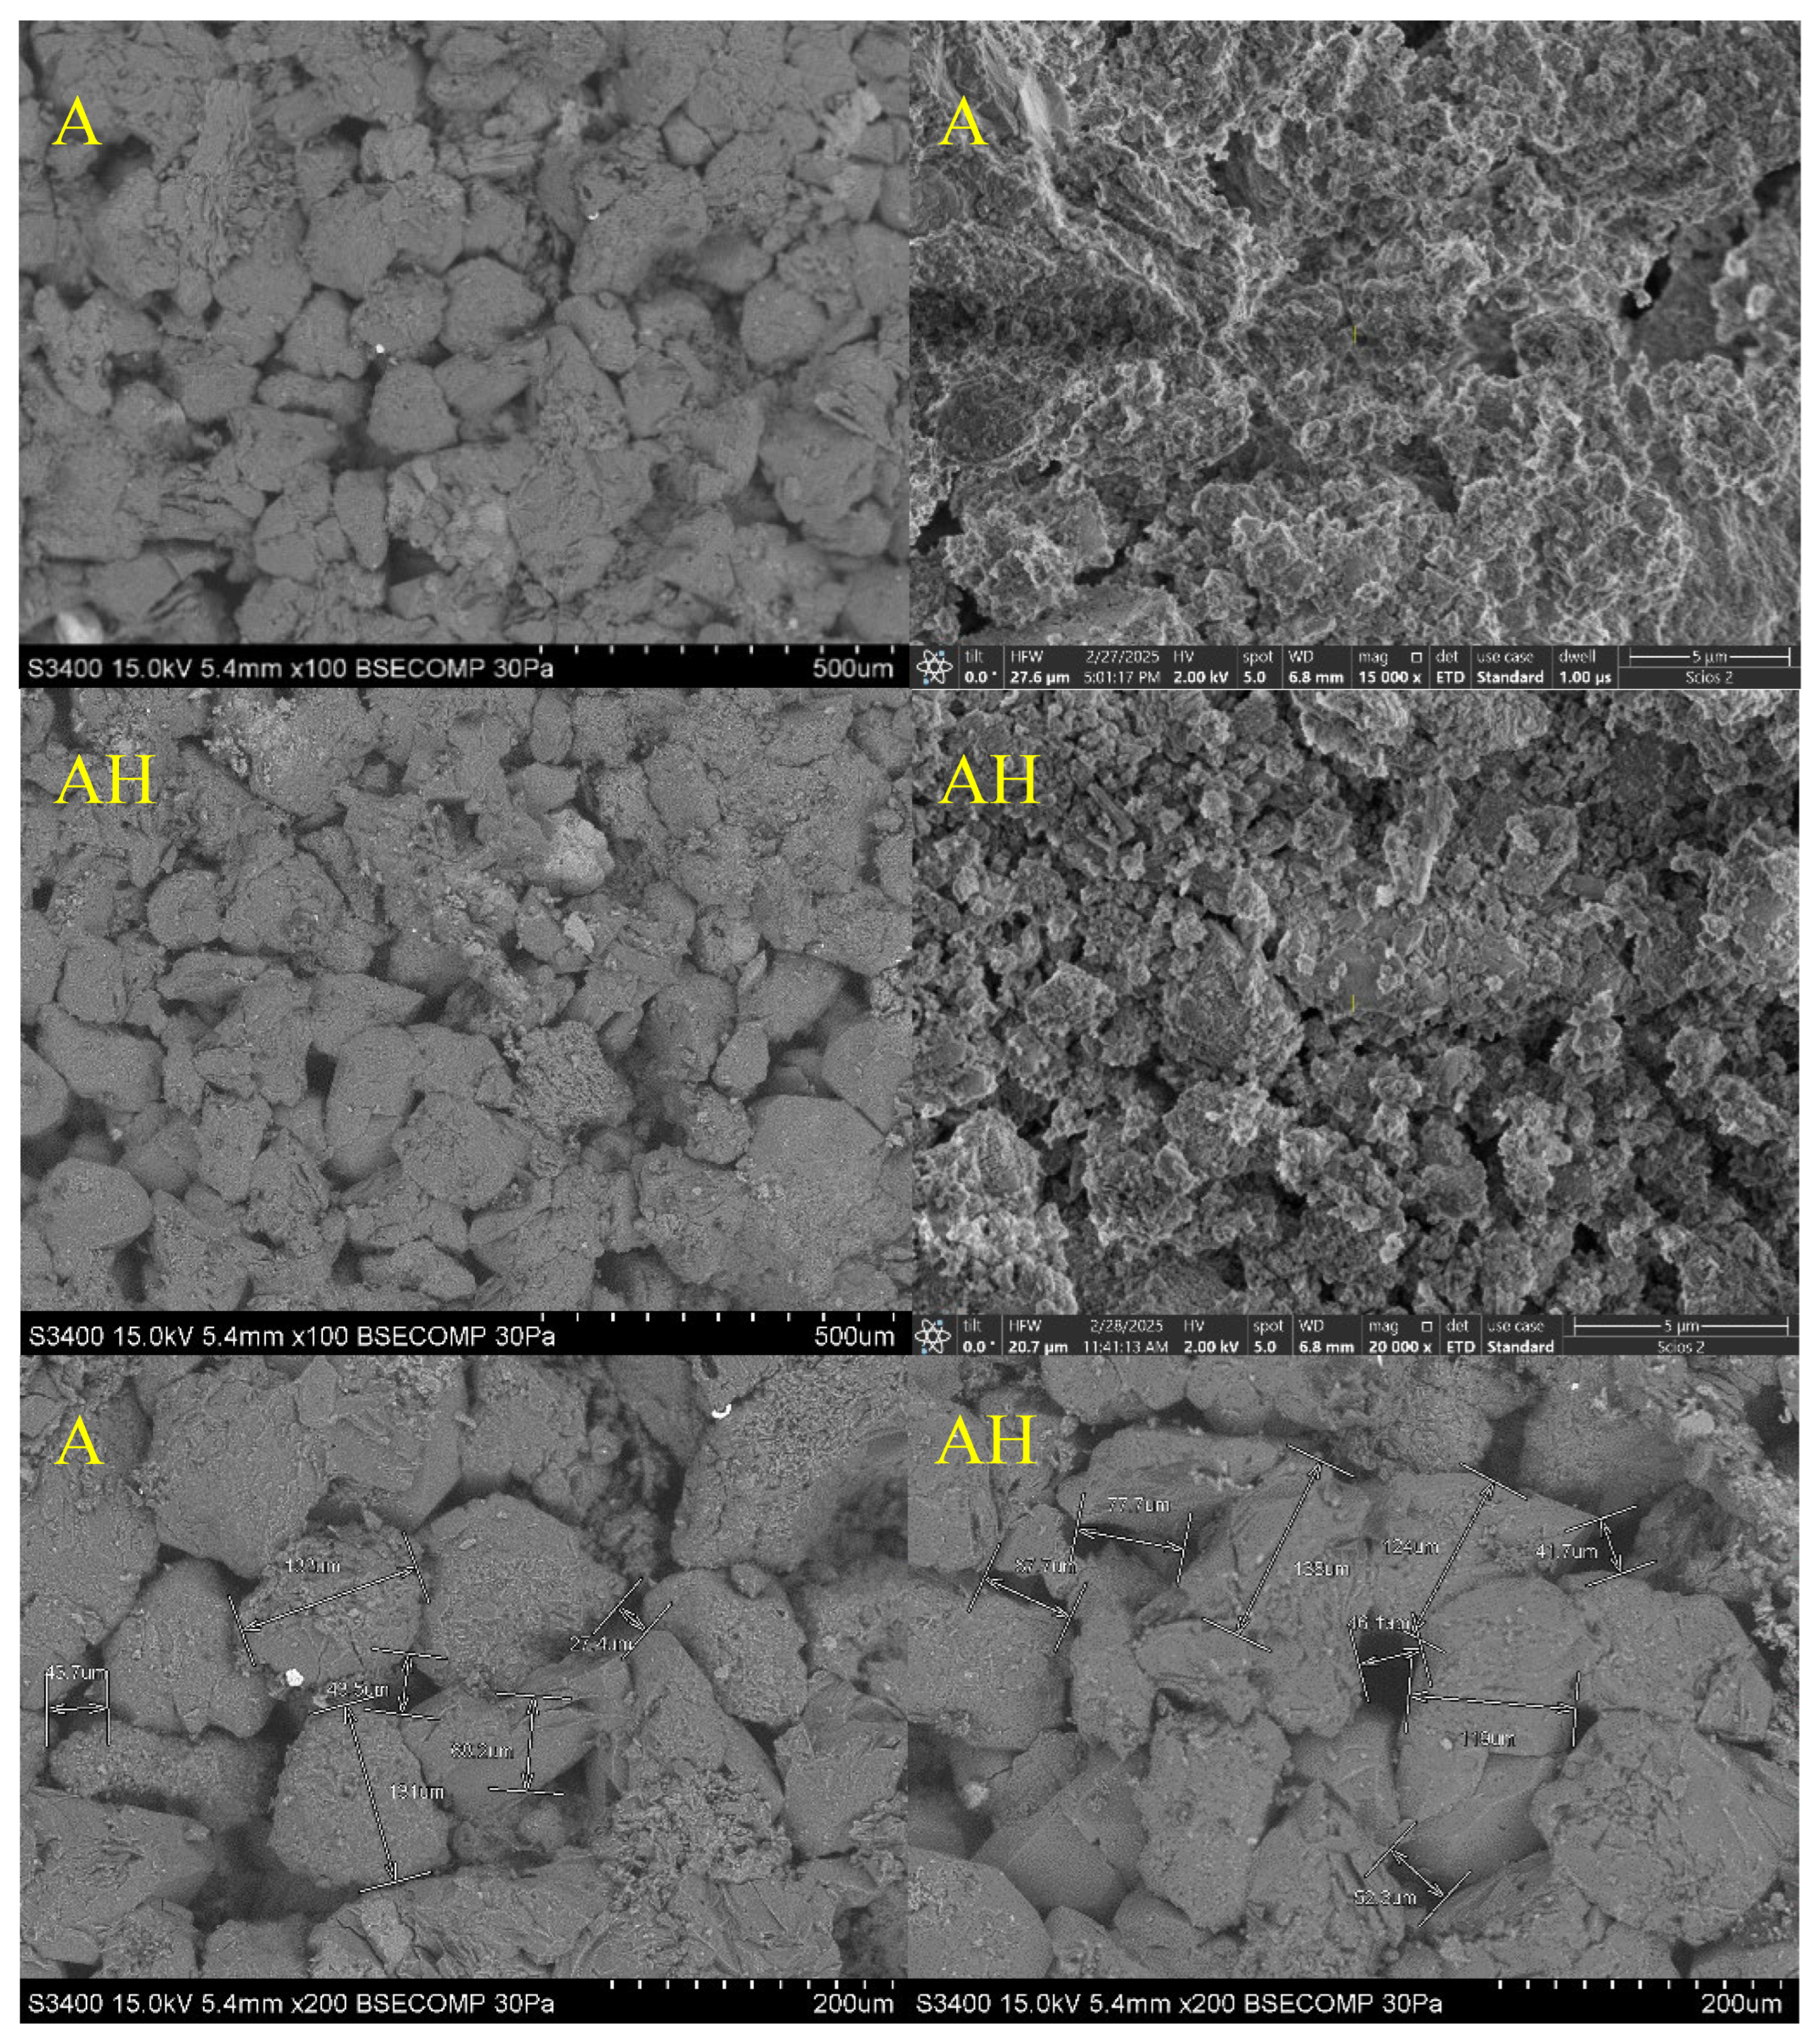
Figure 12.
Scanning Electron Microscopy (SEM) Images of Core Samples B and BH.
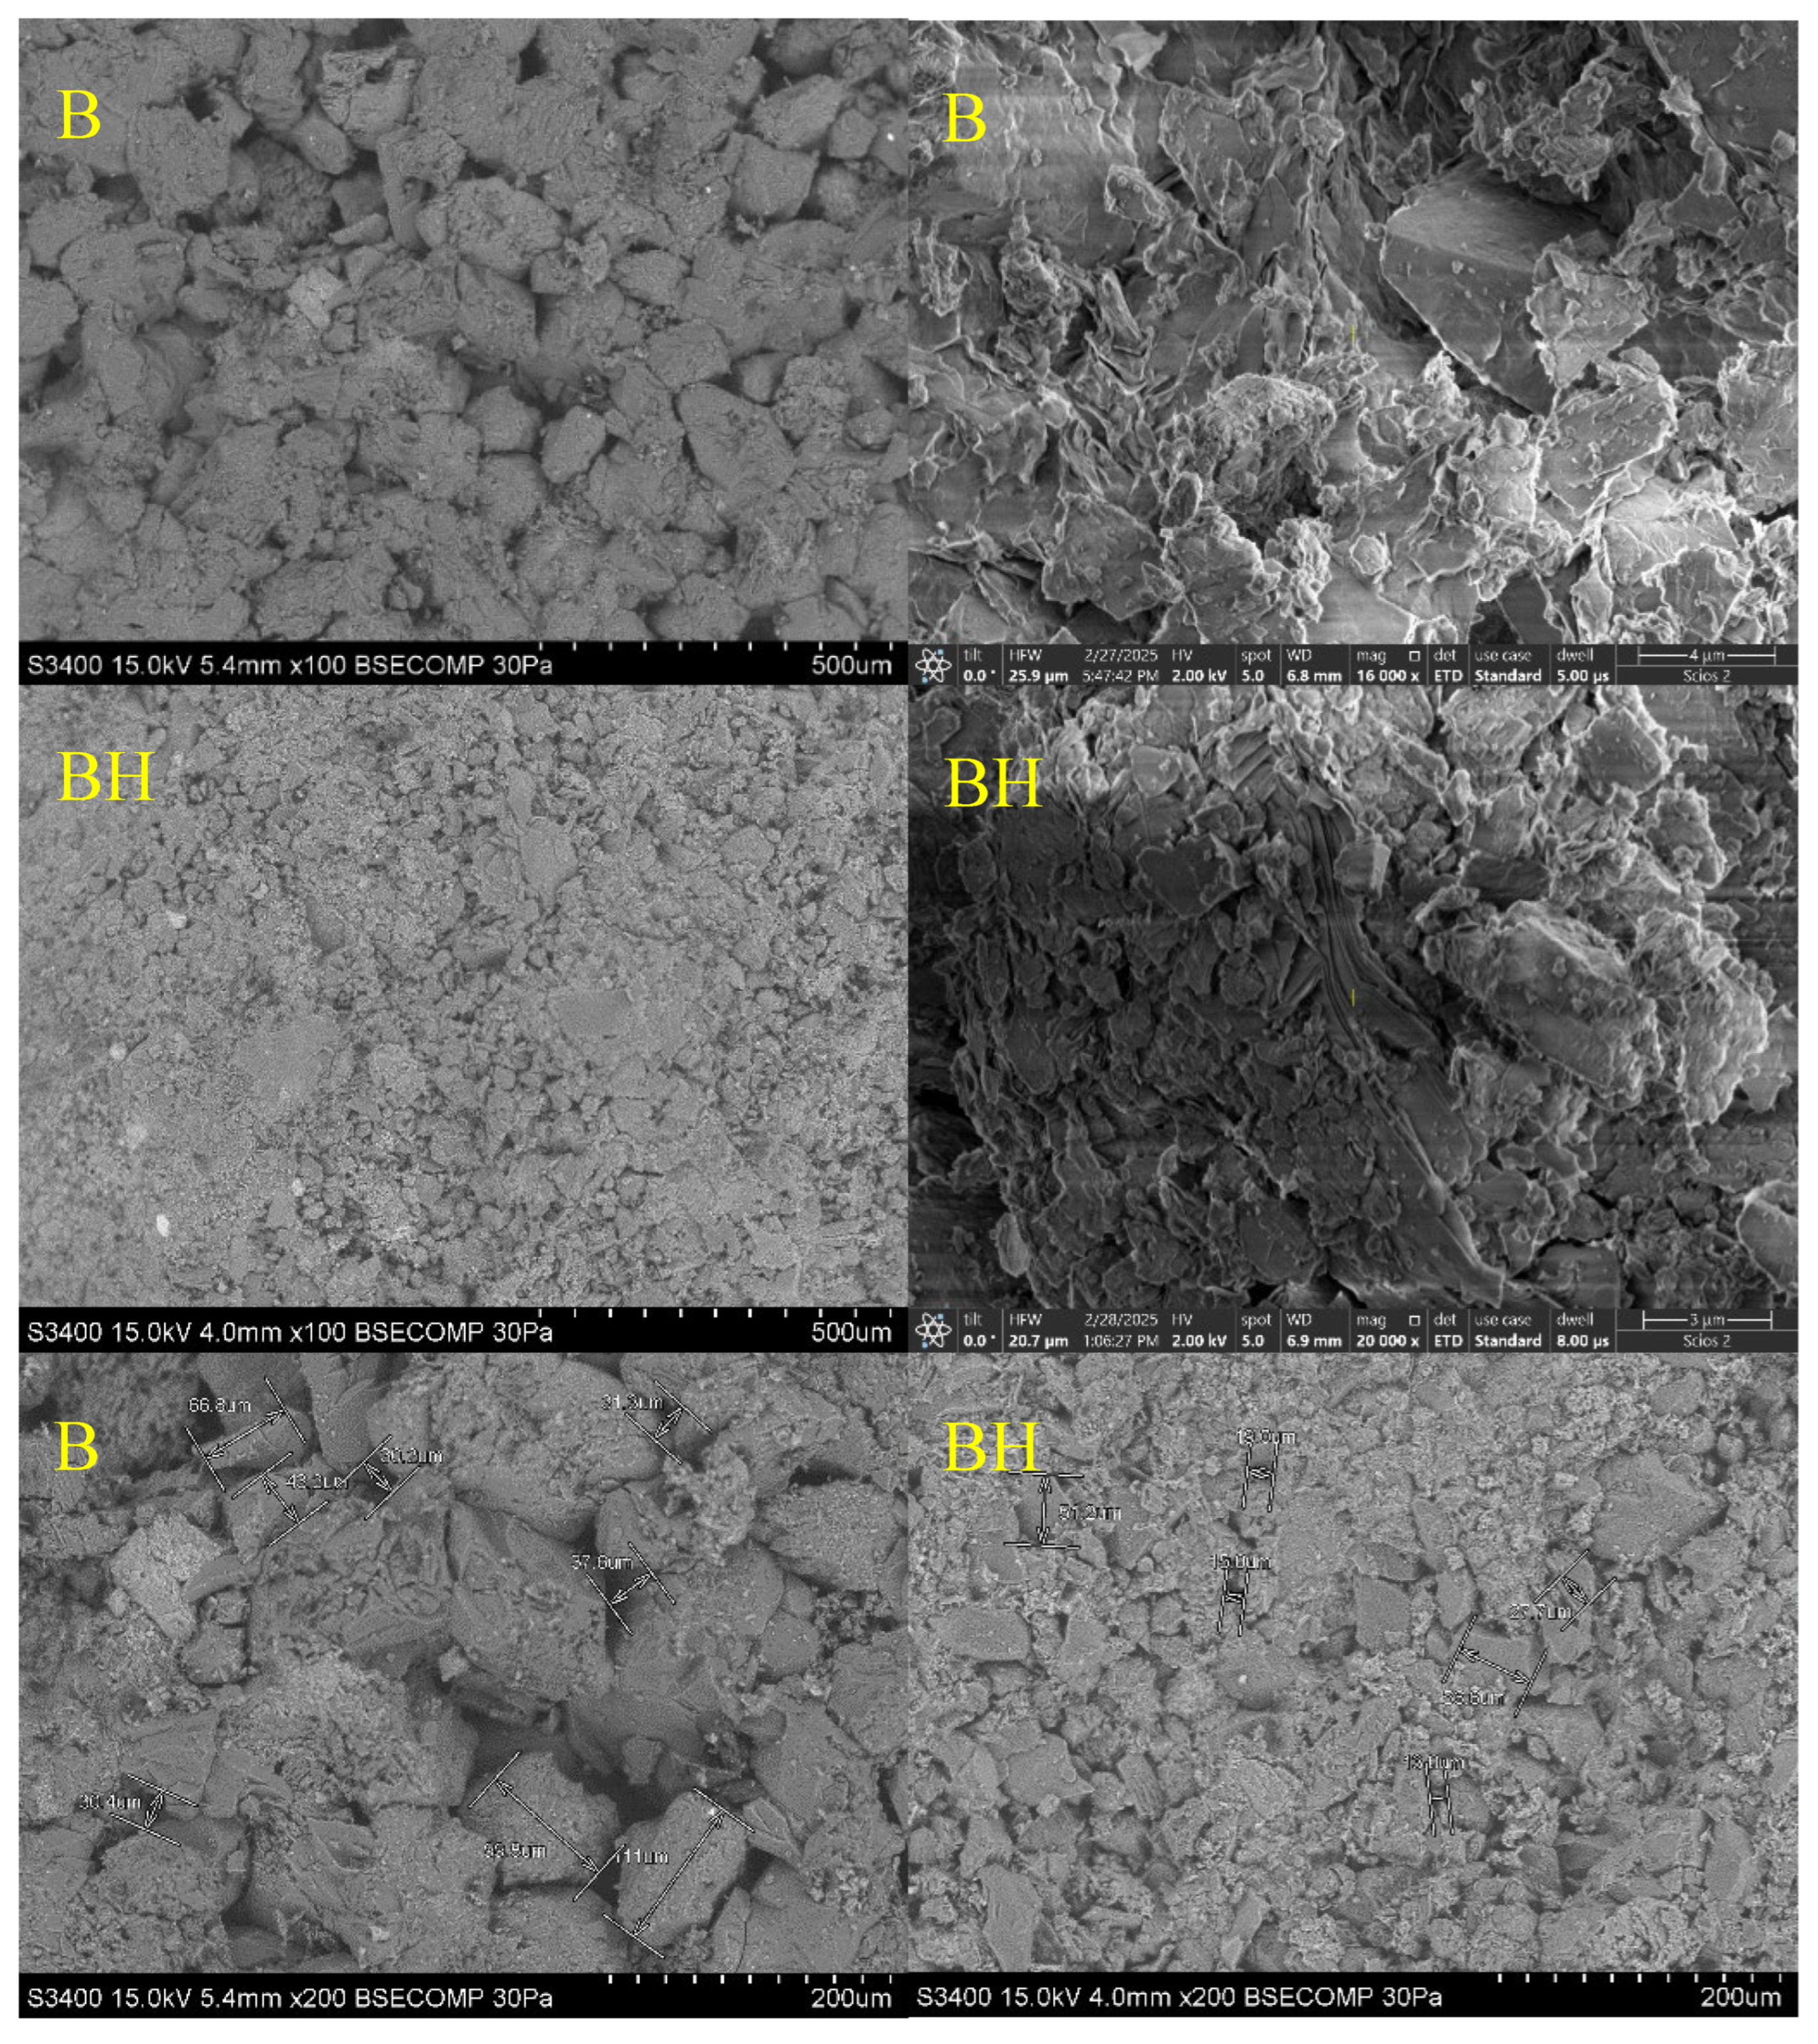
Figure 14.
EDS Spectrum and Elemental Distribution for Core Samples A and AH.
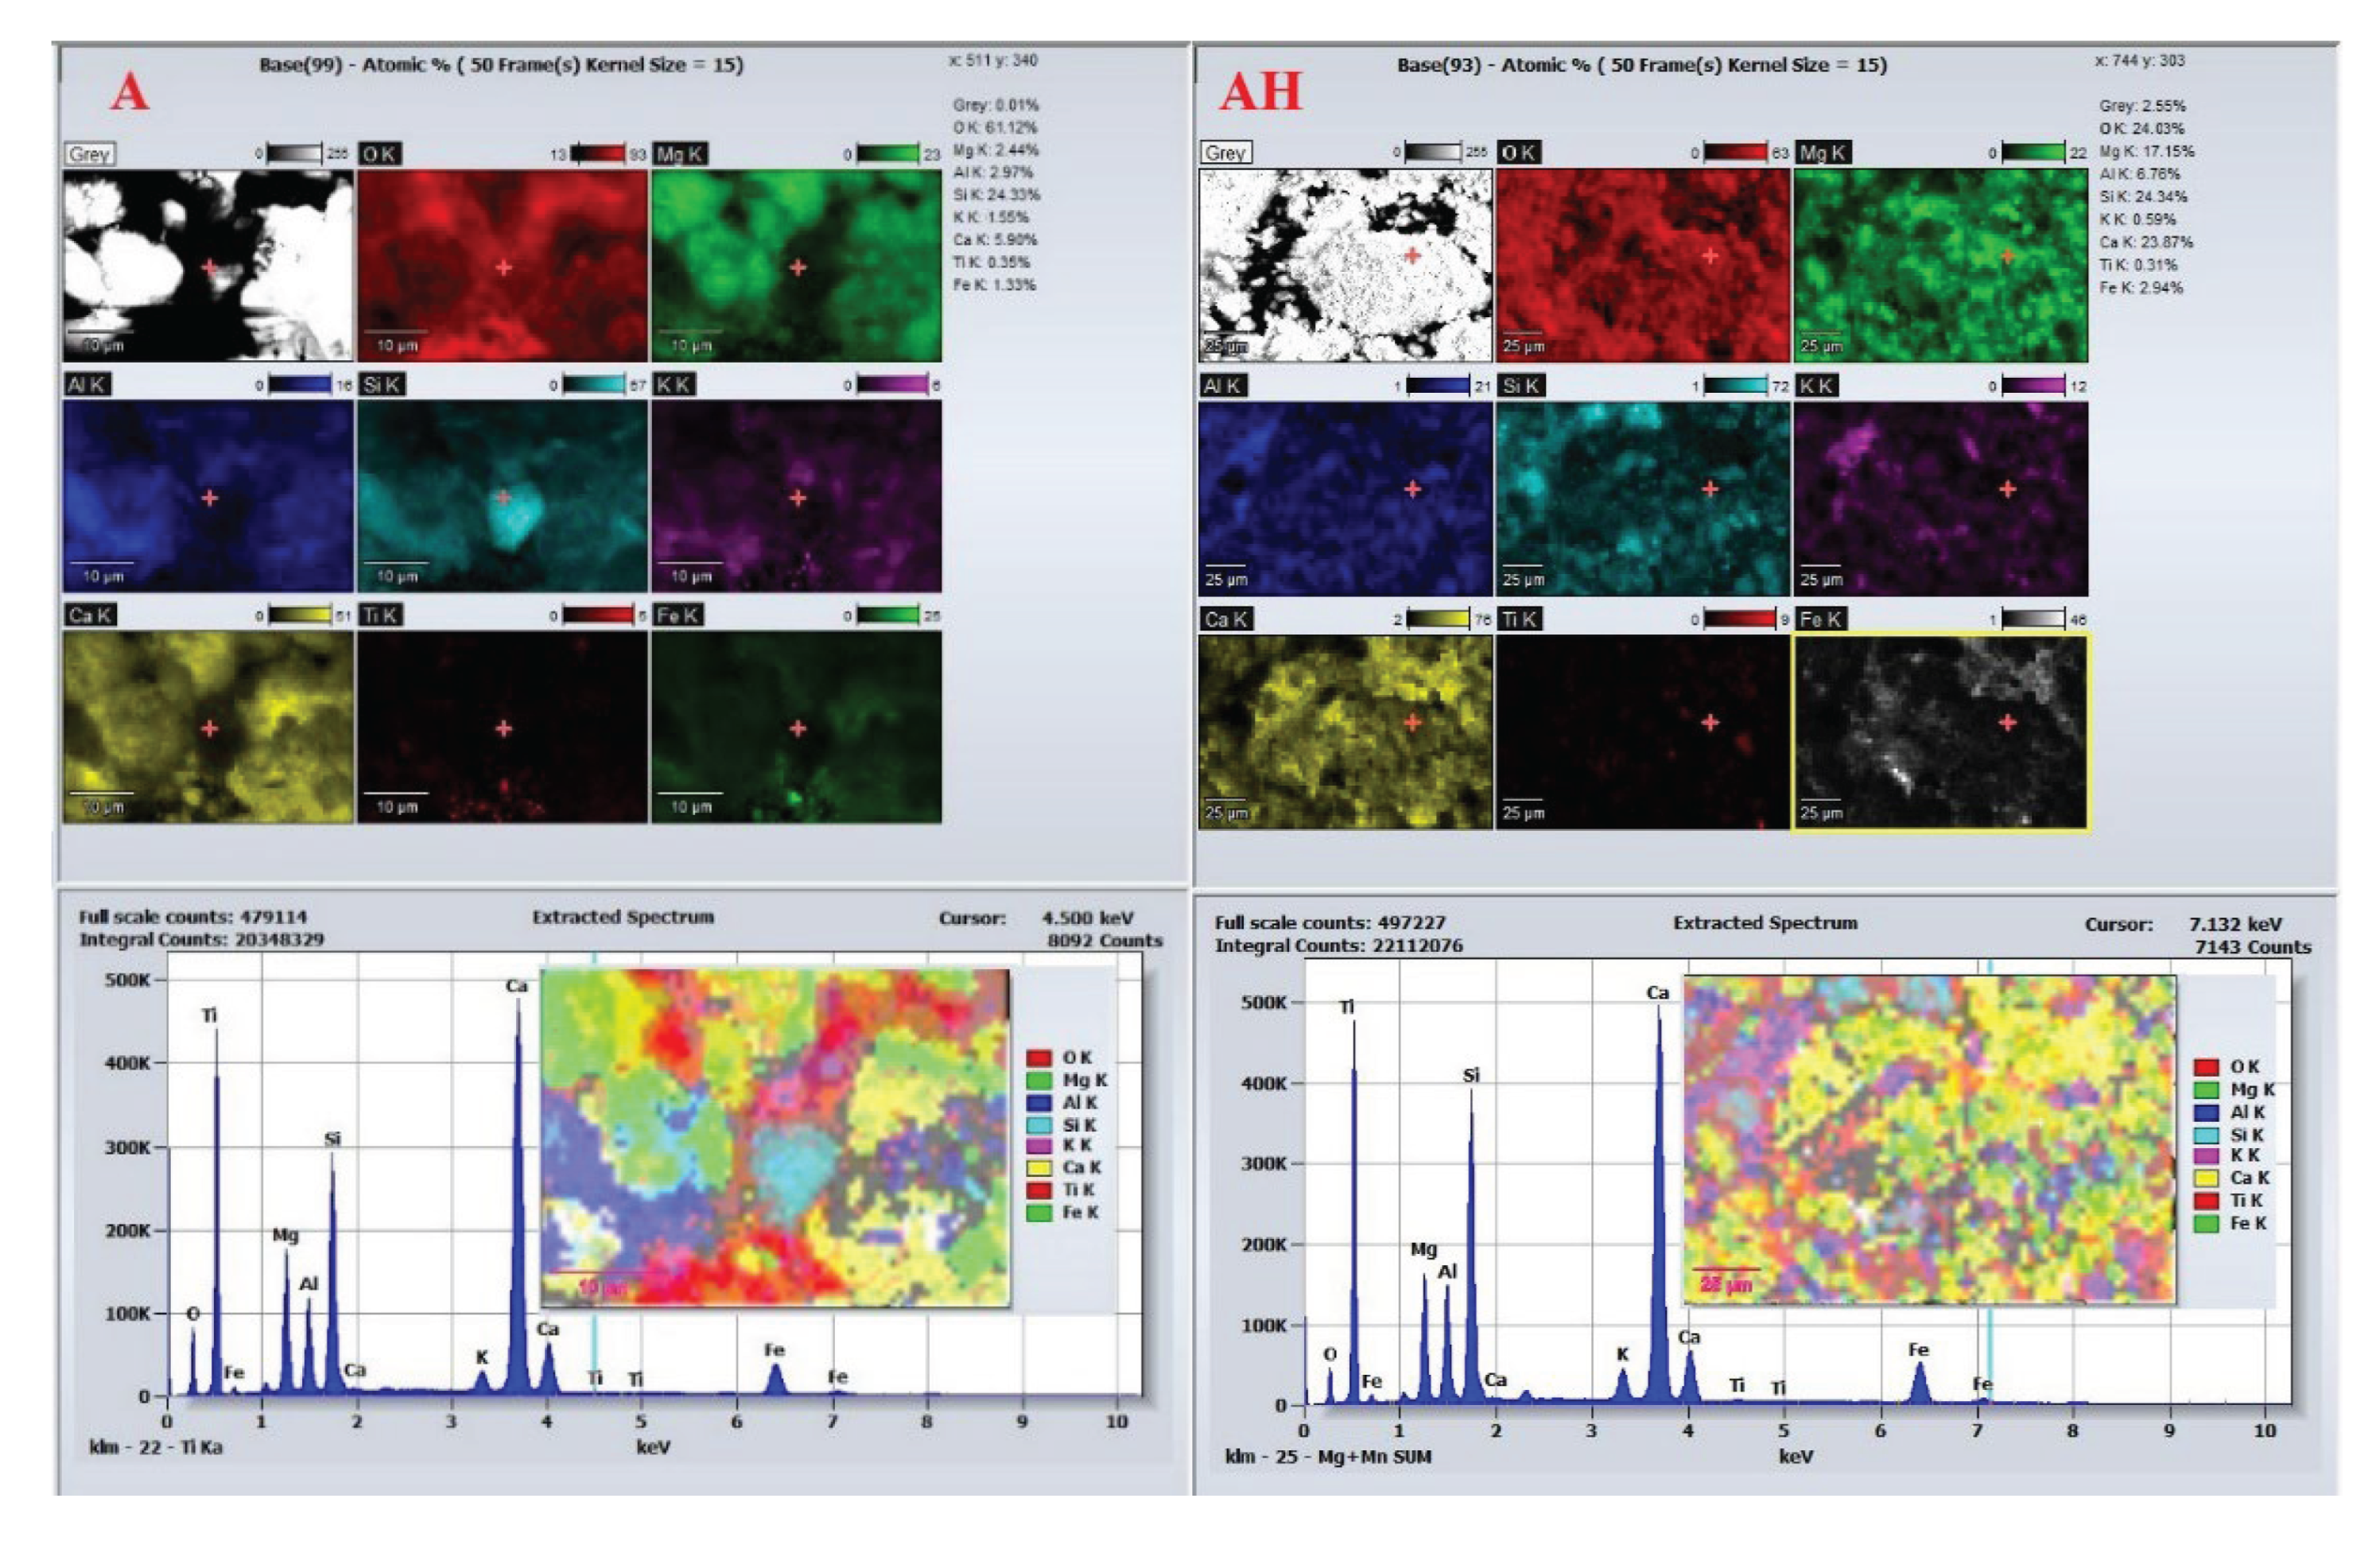
Figure 16.
EDS Spectrum and Elemental Distribution for Core Samples C and CH.
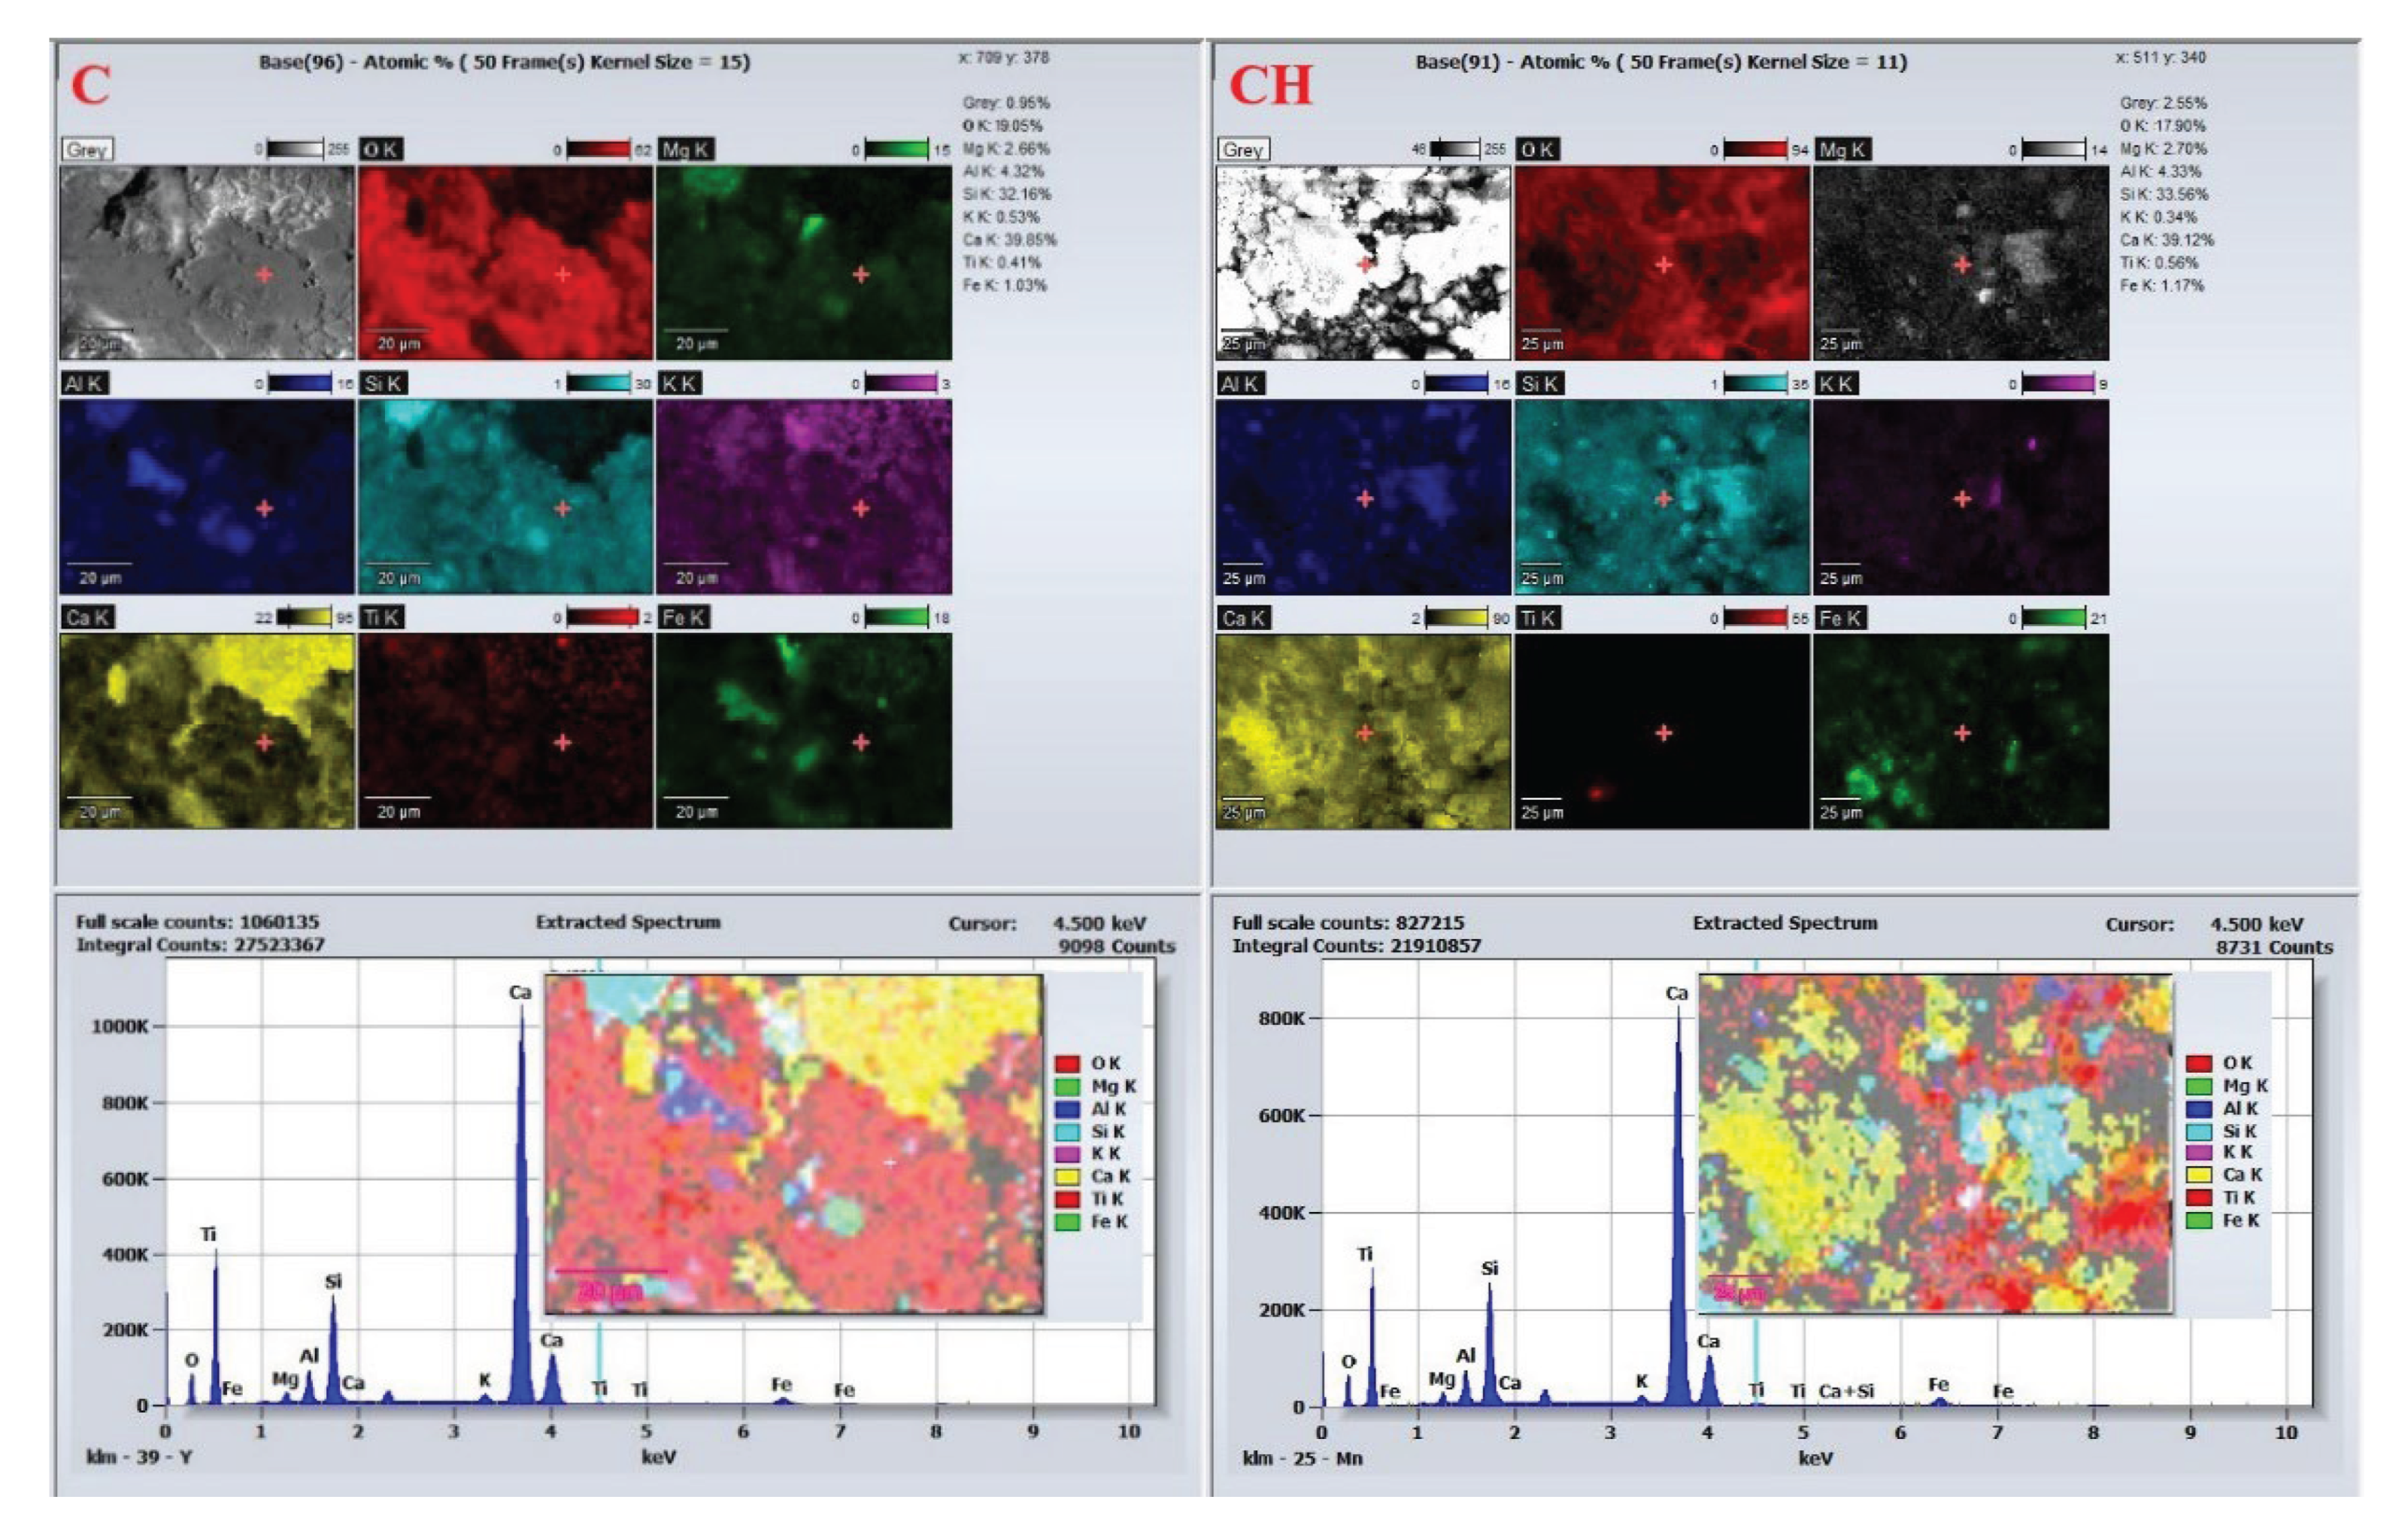

Table 1.
Characteristic XRD Reflections and Variation of Mineralogical Composition in Core A and Core AH Sample.
Table 1.
Characteristic XRD Reflections and Variation of Mineralogical Composition in Core A and Core AH Sample.
| Mineral Phase | Crystal Plane – Miller Index (hkl) | (°) | Content % in Core A | Content % in Core AH |
|---|---|---|---|---|
| Chlorite (Ch) | 001 | 6.2 | 5.62 | - |
| Illite (I) | 001 | 8.9 | 2.84 | 2.41 |
| Quartz (Q) | 100 | 20.8 | 2.49 | 2.10 |
| Dolomite (D) | 012 | 24.1 | 1.92 | - |
| Quartz (Q) | 101 | 26.6 | 4.13 | 3.46 |
| Albite (A) | 112 | 27.92 | 2.03 | - |
| Calcite (C) | 104 | 29.4 | 1.32 | - |
| Dolomite (D) | 104 | 30.88 | 12.20 | 10.53 |
| Dolomite (D) | 110 | 37.25 | 1.31 | - |
| Dolomite (D) | 113 | 41.05 | 3.17 | 3.13 |
| Dolomite (D) | 202 | 44.85 | 2.04 | - |
| Dolomite (D) | 018 | 50.4 | 2.19 | 2.21 |
| Dolomite (D) | 116 | 50.9 | 2.68 | 2.84 |
Table 2.
Characteristic XRD Reflections and Variation of Mineralogical Composition in Core B and Core BH Samples.
Table 2.
Characteristic XRD Reflections and Variation of Mineralogical Composition in Core B and Core BH Samples.
| Mineral Phase | Crystal Plane – Miller Index (hkl) | (°) | Content % in Core B | Content % in Core BH |
|---|---|---|---|---|
| Vaterite (V) | 004 | 20.9 | 2.61 | - |
| Vaterite (V) | 110 | 24.8 | 3.87 | 3.43 |
| Vaterite (V) | 112 | 27.1 | 6.05 | 4.82 |
| Calcite (C) | 104 | 29.3 | 6.42 | 6.37 |
| Calcite (C) | 006 | 31.2 | 2.35 | - |
| Vaterite (V) | 114 | 32.7 | 5.13 | 5.44 |
| Calcite (C) | 113 | 39.38 | 1.66 | - |
| Calcite (C) | 202 | 43.2 | 1.11 | - |
| Vaterite (C) | 300 | 43.8 | 2.98 | 3.50 |
| Calcite (C) | 018 | 47.4 | 1.75 | 1.75 |
| Calcite (C) | 116 | 48.5 | 2.68 | 2.94 |
| Vaterite (V) | 224 | 55.7 | 1.27 | 1.64 |
| Calcite (C) | 122 | 57.3 | 0.52 | - |
Table 3.
Characteristic XRD Reflections and Variation of Mineralogical Composition in Core C and Core CH Samples.
Table 3.
Characteristic XRD Reflections and Variation of Mineralogical Composition in Core C and Core CH Samples.
| Mineral Phase | Crystal Plane – Miller Index (hkl) | (°) | Content % in Core B | Content % in Core BH |
|---|---|---|---|---|
| Chlorite (Ch) | 001 | 6.2 | 6.87 | 5.94 |
| Illite (I) | 001 | 8.9 | 2.62 | - |
| Chlorite (Ch) | 002 | 12.5 | 2.19 | 3.22 |
| Quartz (Q) | 100 | 20.8 | 3.57 | 3.78 |
| Quartz (Q) | 101 | 26.7 | 14.64 | 13.87 |
| Albite (A) | 112 | 27.92 | 2.58 | - |
| Calcite (C) | 104 | 29.4 | 3.90 | - |
| Quartz (Q) | 110 | 36.45 | 1.52 | 1.77 |
| Quartz (Q) | 102 | 39.5 | 1.92 | 1.68 |
| Quartz (Q) | 200 | 42.5 | 1.16 | 1.39 |
| Quartz (Q) | 201 | 45.9 | 1.30 | 1.52 |
| Quartz (Q) | 112 | 50.2 | 2.02 | 2.88 |
| Quartz (Q) | 211 | 60.2 | 1.50 | 1.64 |
Table 4.
Physical and textural parameters of core samples: porosity and permeability.
| Core | Porosity (%) | Permeability (mD) | BET surface area (m2/g) | Total pore volume (cm3/g) | Mean pore diameter (nm) | Adsorbed N2 volume (cm3/g) |
|---|---|---|---|---|---|---|
| A | 23.95 | 574.84 | 3.270 | 0.0214 | 3.3 | 14.376 |
| AH | 23.87 | 592.44 | 4.023 | 0.245 | 5.09 | 23.35 |
| B | 19.89 | 132.16 | 6.93 | 0.0175 | 3.023 | 26.11 |
| BH | 16.33 | 107.43 | 5.80 | 0.0143 | 2.853 | 21.17 |
| C | 24.50 | 581.96 | 19.048 | 0.0291 | 3.107 | 27.81 |
| CH | 24.13 | 567.43 | 18.87 | 0.0284 | 3.305 | 27.40 |
Disclaimer/Publisher’s Note: The statements, opinions and data contained in all publications are solely those of the individual author(s) and contributor(s) and not of MDPI and/or the editor(s). MDPI and/or the editor(s) disclaim responsibility for any injury to people or property resulting from any ideas, methods, instructions or products referred to in the content. |
© 2025 by the authors. Licensee MDPI, Basel, Switzerland. This article is an open access article distributed under the terms and conditions of the Creative Commons Attribution (CC BY) license (http://creativecommons.org/licenses/by/4.0/).
Copyright: This open access article is published under a Creative Commons CC BY 4.0 license, which permit the free download, distribution, and reuse, provided that the author and preprint are cited in any reuse.


