1. Introduction
Familial Alzheimer’s disease (FAD) is a genetically induced neurodegenerative condition characterized by early-onset dementia (onset before age 65) and a family history of dementia. It is also associated with various non-cognitive neurological symptoms and signs, as well as a more aggressive course [
1,
2]. Similar to sporadic Alzheimer’s disease (SAD, [
3]), FAD presents with abundant plaques composed of extracellular amyloid beta (eAβ), neurofibrillary tangles made of intracellular hyperphosphorylated tau protein (p-Tau), and loss of brain weight due to accelerated neuronal cell death. To date, at least 556 mutations in the presenilin (PSEN1 and PSEN2) and amyloid precursor protein (APP) genes have been identified in FAD (
http://www.alzforum.org, accessed October 2025). These mutations affect a common pathogenic pathway in APP synthesis and proteolysis, leading to the excessive production of eAβ via a mechanism that is not yet fully understood [
4]. PSEN1 is a key component of the aspartyl protease γ-secretase complex [
5] and, together with β-secretase, preferentially cleaves APP (770 amino acids) at residues 713 and 671, respectively, producing an Aβ42 fragment [
6]. Several hypotheses have been proposed to explain how eAβ42 induces AD and FAD. These include the amyloid cascade hypothesis [
7], the cholinergic hypothesis [
8], the oxidative stress hypothesis [
9], the two-hit hypothesis [
10], the mitochondrial hypothesis [
11], the presenilin hypothesis [
12], the inside-out amyloid hypothesis [
13,
14], the tau hypothesis [
15], and the ApoE cascade hypothesis [
16], among others [
17,
18]. However, none of these hypotheses have been proven conclusively, and some remain controversial (e.g., [
19,
20,
21,
22]. Therefore, the mechanism by which Aβ induces neurotoxicity and cell death is still open to validation.
Specifically, the intracellular amyloid hypothesis [
23,
24] posits that Aβ accumulation inside neurons, rather than just extracellular plaques, is an early driver of AD pathology, disrupting cellular functions like protein degradation, axonal transport, and cell survival. This accumulation can lead to tau hyperphosphorylation, neuronal dysfunction, and eventually cell death, making iAβ a promising therapeutic target. Consistent with this perspective, our research group has presented substantial evidence in support of the intracellular Aβ hypothesis. We have demonstrated that cholinergic-like neurons (ChLNs) with the E280A or the I416T mutation—which result from a substitution of aspartic acid (E) for alanine (A) at position 280 [
25] or isoleucine (I) for threonine (T) at position 416 [
26], respectively, —produce aberrant accumulation of iAβ, abnormal phosphorylation of tau, oxidative stress, mitochondrial depolarization, apoptosis, and calcium dysregulation [
27,
28]. Interestingly, we obtained PSEN1 E280A ChLNs derived from umbilical cord Wharton’s jelly mesenchymal stromal cells (WJ-MSCs) or menstrual mesenchymal stromal cells (MenSCs), which are tissue equivalents [
29], using the Cholinergic-N-Run medium (Ch-N-Rm, [
30], and observed that by day 7 of the transdifferentiation process, mutant ChLNs exhibited abnormal accumulation of iAβ42, oxidized DJ-1 (i.e., DJ-1Cys
106-SO₃), which is indicative of oxidative stress (OS), and aberrant accumulation of autophagosomes. However, there was no evidence of cell death [
27,
31]. By day 11, however, cholinergic mutant cells exhibited abnormal phosphorylation of the protein TAU (at Ser
202/Thr
205) and positive markers of apoptosis, such as tumor protein p53 (TP53), p-Ser
63/Ser
73 JUN, p53-upregulated modulator of apoptosis (PUMA), and cleaved caspase-3 (CC3). They also exhibited loss of mitochondrial membrane potential (ΔΨm) and dysfunctional acetylcholine (ACh)-induced Ca²⁺ ion influx [
27]. These observations suggest that the accumulation of intraneuronal Aβ, oxidized DJ-1, and impairment of autophagy lysosomal pathway are early event in AD pathogenesis and precedes p-TAU and eAβ deposits [
32]. Therefore, iA triggers signals that lead to neuronal dysfunction [
33]. Because the earliest pathological detection in PSEN1 E280A ChLNs was the accumulation of iAβ and DJ-1Cys
106-SO₃ [
27,
31] and exposure to antioxidants, such as epigallocatechin-3-gallate and tramiprosate, simultaneously abolished the accumulation of iAβ and autophagosomes, and DJ-1 oxidation [
31], this led us to wonder whether oxidized DJ-1 is essential to iAβ accumulation in mutant ChLN cells.
DJ-1 is a 189-amino-acid protein that is expressed throughout the body and forms dimers under physiological conditions. It is encoded by the
PARK7 gene, which was first associated with early-onset, familial forms of Parkinson’s disease (FPD) [
34]. As a homodimer protein [
35], DJ-1 protects against oxidative stress (OS) by operating as an antioxidant, neuroprotectant, and survival signaling molecule [
36]. DJ-1 can sense OS through thiolate Cys
106-SH residue, which is highly susceptible to oxidation by reactive oxygen species (ROS), particularly H₂O₂ [
37,
38]. Depending on the strength of intracellular oxidation, ranging from moderate to high, the thiolate Cys
106-SH can be oxidized into sulfenic form of DJ-1 (Cys
106-SOH), which can be oxidized to the sulfinic acid form (Cys
106-SO
2H) and then to the sulfonic acid form (Cys
106-SO
3H). The sulfinic DJ-1 form is responsible for DJ-1’s neuroprotective actions [
38,
39,
40]; whereas the sulfonic form is an unstable protein prone to aggregation and loss of function [
41,
42,
43]. Interestingly, DJ-1 has been shown to undergo extensive and irreversible oxidation in the brains of patients with SAD [
44,
45]. Furthermore, Solti et al. [
46] have shown that oxidized DJ-1 aggregates colocalize with pathological amyloid deposits in the postmortem brain tissue of human SAD patients. However, it is not yet known whether oxidized DJ-1 Cys
106-SO₃ colocalizes with iA in FAD postmortem brain tissue or in an in vitro model (e.g., organoids and 2D ChLNs culture).
To gain insight into these issues, we first sought to assess whether oxidized DJ-1, detected with rabbit recombinant monoclonal PARK7/DJ1 antibody, colocalizes with iAβ42 in the frontal and occipital cortex and hippocampus of PSEN1 E280A patients’ postmortem and control brains. Next, we evaluated whether oxidized DJ-1 drives intracellular Aβ42 aggregation using 2D (iPSCs-derived ChLNs) and 3D in vitro models (iPSCs-derived organoids), and in silico molecular docking analysis together with ELISA test and fibril kinetics analysis.
2. Materials and Methods
2.1. Induced Pluripotent Stem Cells Reprogramming
One vial containing 1x10⁶ fibroblast cells (3rd passage) was thawed in one well of a 6-well plate previously treated with Vitronectin (VTN-N, Thermo Fisher Scientific, cat# A14700, Waltham, MA, USA). Once cells became >90% confluent were detached and split in 4 wells of a 6-well plate (1:4 ratio) in fibroblast medium, which include High glucose DMEM, (Thermo Fisher Scientific, cat# 11965092, Waltham, MA, USA), 10% Fetal Bovine Serum (Thermo Fisher Scientific, cat# A5256701, Waltham, MA, USA; 1X NEAA (Thermo Fisher Scientific, cat#11140050, Waltham, MA, USA), and 1X -mercaptoethanol (Thermo Fisher Scientific, cat#21985023, Waltham, MA, USA). On day 0 cells were transduced using the CytoTune™ 2.0 Sendai reprogramming (Thermo Fisher Scientific, cat# A16517, Waltham, MA, USAby incubating overnight with 10 l KOS, 10 l of hc-Myc, and 7 l hKlf4. After 1 day, the medium was replaced with fresh complete fibroblast medium to remove the CytoTune™ 2.0 Sendai reprogramming vectors, then after we changed the medium every other day, and once cells became >90% confluent they were detached and split in 3 wells of a 6-well plate. On day 7, the medium was changed to complete Essential 8™ Medium (Thermo Fisher Scientific, cat# A1517001, Waltham, MA, USA). On days 9–28 the medium was replaced every day and monitor the culture vessels for the emergence of iPSC colonies.
2.2. Neural Precursor Cell Generation Protocol
Human iPSC cells were mechanically detached from VTN-N surface. Embryoid bodies (EBs) were generated by transferring iPSCs to non-adherent plates in E6 medium (Thermo Fisher Scientific, cat# A1516401, Waltham, MA, USA) at 37 °C in 5% CO2. After 7 days, EBs were transferred to a non-adherent plate and E6 medium was supplemented with 10ng/ml bFGF (Thermo Fisher Scientific, cat# 100-18B-50UG, Waltham, MA, USA), after 2 days, the floating structures were dissociated by trituration and transferred to an VTN-N-treated dish. For generation of neural precursor cells (NPCs), EBs were cultured in NPC medium (Neurobasal medium, 1% N2 supplement, 2% B27 supplement (Thermo Fisher Scientific, cat# 17504044, Waltham, MA, USA), 20 ng/ ml epidermal growth factor (Thermo Fisher Scientific, cat#PHG0311L, Waltham, MA, USA), 1g/ ml heparin sodium salt (Thermo Fisher Scientific, cat#A16198.MD, Waltham, MA, USA), 1ng/ ml bFGF, 1X -mercaptoethanol, and 1% penicillin/streptomycin (Thermo Fisher Scientific, cat#15140122, Waltham, MA, USA).
2.3. Generation of Cholinergic Neurons from Neural Precursor Cells (NPCs)
Neural precursor cells (NPC) were seeded at a density of 3×10⁴ cells/cm² in 24-well culture plates and maintained for 24 h in NPC culture medium under standard conditions. Following this period, the medium was replaced with a cholinergic differentiation medium (Cholinergic-N-Run, [
30]), and cells were incubated at 37 °C for 7 days, as previously described [
27]. After the induction phase, the differentiation medium was replaced with neural medium (NM) consisting of Neurobasal medium supplemented with 1×N2 (Thermo Fisher Scientific, cat#17502048, Waltham, MA, USA) and 1% penicillin/streptomycin.
2.4. Generation of Cerebral Organoids (COs)
Cerebral organoids (COs) were generated by differentiating wild-type (WT) and PSEN1 E280A mutant induced pluripotent stem cell (iPSC)-derived neural progenitor cells (NPCs), following the protocol described in ref.
[29]. Briefly, WT and mutant NPCs were cultured in a novel medium formulation,
Fast-N-Spheres V2 [
47], supplemented with Corning Matrigel® (Cat# 356232, Thermo Fisher Scientific Inc., Santa Fe, NM, USA) and 1% fetal bovine serum (FBS) (Cat# CVFSVF00-01, Eurobio Scientific, Les Ulis, France). Cells were maintained under standard conditions until the spontaneous formation of neurospheres was observed. Subsequently, the spheres were transferred to ultra-low attachment culture dishes and continuously agitated at 60 rpm. The culture medium was refreshed every 3–4 days, and organoids were maintained for a total of 60 days.
2.5. Western Blot Analysis
Cells were incubated as described above, detached with 0.25% trypsin, and lysed in 50 mM Tris-HCl, pH 8.0, with 150 mM sodium chloride, 1.0% Igepal CA-630 (NP-40), and 0.1% sodium dodecyl sulfate and a protease inhibitor cocktail (cat#P8340, Sigma-Aldrich Co. LLC, (USA)). All lysates were quantified using the bicinchoninic acid assay (Thermo Scientific cat # 23225, Waltham, MA, USA). Extracted samples (40 μg of proteins) were heated at 95 °C for 5 min in 2 x SDS and 20x reducing agent (except for protein oxDJ-1) and loaded into 12% Bis/Tris gels at 120 V for 90 min, and the bands were transferred onto nitrocellulose membranes (Hybond-ECL, Amersham Biosciences) at 270 mA for 90 min using an electrophoretic transfer system (BIO-RAD). The membranes were incubated overnight at 4 °C amyloid β1–42 and ox(Cys106) DJ1 primary antibodies (1:5000). The anti-actin antibody (1:1000, cat #MAB1501, Millipore) was used as an expression control. Secondary infrared antibodies (goat anti-rabbit IRDye® 680RD, cat #926–68071; donkey anti-goat IRDye ® 680RD, cat # 926–68074; and goat anti mouse IRDye ® 800CW, cat #926–32270; LI-CORBiosciences, Lincoln, NE, USA) at 1:1000 were used for western blotting analysis, and data were acquired using Odyssey software. The assessment was repeated three times in independent experiments.
2.6. Immunofluorescence Analysis
For the analysis of neural-, Alzheimer’s disease-, oxidative stress- and cell death-related markers, the cells treated under different conditions were fixed with cold ethanol (-20 °C) for 20 min, followed by Triton X-100 (0.1%) permeabilization and 10% bovine serum albumin (BSA) blockage. Cells were incubated overnight with primary neural antibodies against OCT4 (1:500), SOX-2 (1:500), NANOG (1:500), and KLF4 (1:500), the neuronal marker Nestin (1:500; cat# MA1-5840, Invitrogen, Waltham, MA, USA); and glial fibrillary acidic protein (GFAP 1:200, cat# sc6170, Santa Cruz, Dallas, TX, USA), microtubule-associated protein 2 (MAP2, 1:250, cat MA1-25044, Invitrogen, Carlsbad, CA, USA), β-tubulin III (1:250, cat# G712 A, Promega, Madison, WI, USA) and choline-acetyltransferase (ChAT, 1:50, cat# AB144 P, Millipore, Burlington, MA, USA), amyloid β1–42 (1:500; clone 6E10, cat# 803014, Biolegend, San Diego, CA, USA), and primary antibodies against oxidized DJ-1 (1:500; ox(Cys106)DJ1; spanning residue C106 of human PARK7/DJ1; oxidized to produce cysteine sulfonic (SO3) acid; cat #ab169520, Abcam, Cambridge, UK). After exhaustive rinsing, we incubated the cells with secondary fluorescent antibodies (DyLight 488 and 594 horse anti-rabbit, -goat and -mouse, cat DI 1094, DI 3088, and DI 2488, respectively) at 1:500. The nuclei were stained with 1 μM Hoechst 33342 (Life Technologies, Carlsbad, CA, USA), and images were acquired on a Floyd Cells Imaging Station microscope (Life Technologies, Carlsbad, CA, USA).
2.7. Flow Cytometry Analysis
For flow cytometry analyses, cells were detached using trypsin and centrifuged for 10 min at 2000 rpm. Then, cells were fixed using cold ethanol at -20 °C overnight. Then, cell suspensions were washed with PBS and incubated with 0.2% Triton X-100 plus 1.5% bovine serum albumin (BSA) for 30 min. After, cells were incubated with primary (see above). After exhaustive rinsing, we incubated the cells with secondary fluorescent antibodies (DyLight 488 and 594 horse anti-rabbit, -goat and -mouse, cat DI 1094, DI 3088, and DI 2488, respectively, Thermo Fisher Scientific, Waltham, MA, USA) at 1:500. Fluorescence analysis was performed on a BD LSRFortessa II flow cytometer (BD Biosciences, Becton, Dickinson and Company, BD Biosciences, 2350 Qume Dr, San Jose, CA 95131-1812, USA). Cells without primary antibodies served as a negative control. For assessment, 10,000 events and quantitative data and figures were obtained using FlowJo 7.6.2 Data Analysis Software (TIBCO® Data Science, Palo Alto, Ca, USA). Events analysis was performed by determining the cell population (Forward Scatter analysis, Y axis) that exceeded the basal fluorescence (488 nm or 594 nm, X axis) of the negative control. Accordingly, contour diagrams were created from event analysis, and the cells located in the box (quadrants labeled as + or (+)) represent the cell population exceeding the basal fluorescence.
2.8. Molecular Docking Analysis
To enable the 3D structure of DJ-1, the PDB database was used to access the PDB format of DJ-1 proteins under different oxidation status (Sulfenic, PDB:4p34; Sulfinic, PDB: 1soa; Sulfonic, PDB: 3bwe (aggregated)). Moreover, AlphaFold2.ipynb program (
https://colab.research.google.com/github/sokrypton/ColabFold/blob/main/AlphaFold2.ipynb, accessed in July 2025) was loaded with the 42-aminoacid amyloid beta protein (Structured with AlphaFold2). The blind molecular docking was performed with HDOCK Server. For analysis, we selected the docking poses with the strongest Vina score. The generated PDB files of the molecular docking of each protein were visualized with the PDB viewer interphase.
2.9. Real-Time Quaking Induced Conversion (RT-QuIC)
Amyloid aggregation measurement was performed following minor modifications to a previously optimized protocol [
48]. Purified DJ-1 protein was prepared at a concentration of 100 µg/mL in PBS, and 1 µg of protein was subsequently diluted in seeding buffer (PBS, pH 7.4). Synthetic Aβ42 peptide (100 µg/ml, Cat# ab120301, Abcam, Cambridge, UK,) was dissolved in DMSO (Cat#34869, Sigma-Aldrich Co. LLC, (USA)) and sonicated for 5 minutes immediately before the reaction. The peptide was then added to either untreated or H₂O₂ (100 µM) treated recombinant DJ-1 protein (Cat#P219-31H, Sino Biological, Beijing, China) in the presence of Congo Red (CR, 10 µM) in PBS. The final reaction volume for each mixture was 100 µL. Multiple technical replicates of each condition were incubated simultaneously in a Multiskan SkyHigh Plate Reader (Thermo Fisher Scientific, cat#A51119600DPC, Waltham, MA, USA) for 48 hours under intermittent shaking (600 rpm for 1 minute every 60 minutes) at 37 °C. Absorbance measurements were recorded every 60 minutes at 420 nm and 540 nm and used for subsequent analysis.
2.10. ELISA Test (Modified)
To determine the levels of oxidized DJ-1 (oxDJ-1) bound to Aβ₄₂ peptides, we designed a modified version of the Human Aβ₄₂ solid-phase sandwich ELISA (Cat. No. KHB3441, Invitrogen, Waltham, MA, USA). Briefly, recombinant DJ-1 protein (1 µg) was either left untreated or oxidized with H₂O₂ for 5 min. Each protein sample was then incubated with recombinant Aβ₄₂ peptide (1 µg) for 10 min. The resulting protein mixtures were subsequently used as substrates in the ELISA procedure. During the initial incubation step (in plate wells), the oxidized form of DJ-1 was detected using a specific anti-PARK7/DJ-1 antibody (oxidized cysteine sulfonic acid, Cat. No. ab169520, Abcam, Cambridge, UK) as the capture antibody. The remaining steps were performed according to the manufacturer’s instructions. Binding levels were determined as the absorbance values after subtraction of the blank. This assay was conducted in triplicate in three independent experiments, with the experimenter blinded to sample identity.
2.10. Data Analysis
In this experimental design, two codes of iPSCs were cultured (WT PSEN1 and PSEN1 E280A) and the cell suspension was pipetted at a standardized cellular density of 2 × 10
4 cells/cm
2 into different wells of a 24- or 6-well plate. Cells (i.e., the biological and observational units) [
49] were randomized to wells by simple randomization (sampling without replacement method), and then wells (i.e., the experimental units) were randomized to treatments by a similar method. Experiments were performed on three independent occasions (n = 3) blind to the experimenter and/or flow cytometer and/or microscopy analyst. The data from the three repetitions, i.e., independent experiments, were averaged, and representative flow cytometry density or histogram plots from the three independent experiments were selected for illustrative purposes, whereas the bars in the quantification figures represent the mean ± SD and the three black dots show the data point of each experimental repetition. Based on the assumptions that the experimental unit (i.e., the well) data comply with the independence of observations, the dependent variable is normally distributed in each treatment group (Shapiro–Wilk test), and there is homogeneity of variances (Levene’s test), where the statistical significance is determined by a one-way analysis of variance (ANOVA) followed by Tukey’s post hoc comparison calculated with GraphPad Prism 5.0 software. Differences between groups were only deemed significant with a p-value of 0.05 (*), 0.01 (**), and 0.001 (***). All data are presented as the mean ± S.D.
4. Discussion
In the present study, we demonstrate that sulfonated DJ-1 (DJ-1 Cys
106-SO₃H) colocalizes with intracellular Aβ₄₂ in cells from the hippocampi and frontal and occipital cortices of brains of patients with FAD caused by the PSEN1 E280A mutation. These findings contradict those of Solti et al. [
46]
. While those authors suggest that oxidized DJ-1 aggregates colocalize with amyloid deposits in the frontal cortex of human SAD patients, we found intracellular accumulation of Aβ42 and DJ-1 in brain cells (
see Figure 5). One possible explanation for this discrepancy is the different antibodies used to detect Aβ. The Solti’s group used a polyclonal rabbit antibody (Abcam, Cat# ab2539) raised against human APP, whereas we used a monoclonal anti-β-amyloid antibody (BioLegend, Clone 6E10, Cat# 803014, RRID: AB_2728527). Interestingly, we detected the colocalization of DJ-1 and Aβ42 in blood vessels for the first time in FAD brain samples (
Figure 1T). This observation suggests that not only do DJ-1 and Aβ42 proteins aggregate in neuronal cells, but endothelial cells are also capable of accumulating and aggregating intracellular Aβ42 [
51] and oxidized DJ-1. Consequently, the positive identification of sulfonic DJ-1 and Aβ42 should be considered a marker of cerebral amyloid angiopathy (CAA) in FAD brain pathology. However, it remains unclear whether PSEN1 E280A neurons accumulate and aggregate intracellular Aβ by a similar mechanism as endothelial cells [
52], a question that deserves further investigation. We also present evidence of the concurrent accumulation of iAβ and oxidized DJ-1 in PSEN1 E280A iPSC-derived cerebral organoids neurons (COs) and NPC-derived cholinergic neurons (ChNs). Similar proteinaceous pathology was also observed in MSCs/MenSCs PSEN1 E280A-derived ChLNs and cerebral spheroids [
31,
53,
54] or PSEN1 I416T ChLNs derived from MenSCs [
28]. These observations suggest that the colocalization of DJ-1 with Aβ42 occurs independently of the cells’ pluripotent or stromal origin. Furthermore, both proteins appear to colocalize simultaneously in the early stages of cholinergic lineage development (e.g., [
27,
31]). However, the nature of their colocalization remains unclear i.e., are they accidental encounters or partners? Our findings support the notion that A42 and oxidized DJ-1 are associates proteins.
In silico molecular docking analysis suggest that sulfonic DJ-1 physically interacts with iAβ42. Such theoretical prediction was confirmed by ELISA test and RT-QuIC. According to ELISA test, sulfonic DJ-1, but not reduced DJ-1, binds to A42. Likewise, RT-QuIC experiments show that sulfonic DJ-1, but not reduced DJ-1, was able to bind to monomeric iAβ42. In fact, in the RT-QuIC test, sulfonic DJ-1 significantly reduced Aβ42 fibril formation during the plateau phase, likely due to a shortage of available monomeric Aβ. Since sulfonic DJ-1 did not interfere with the growth phase of Aβ fibrils, these results suggest that DJ-1 binds to iAβ42 in a noncovalent manner. Interestingly, sulfonic DJ-1 has been shown to form aggregates not only with Aβ but also with α-synuclein (α-Syn) and p-Thr205 tau, intraneuronal pathogenic proteins involved in PD and AD, respectively [
46]. Unexpectedly, these DJ-1-protein complexes (Aβ, α-synuclein, and p-Tau) may overwhelm the autophagy-lysosomal pathway, an efficient protein degradation system most impaired in AD [
31,
55]. Further investigation is needed to determine if sulfonic DJ-1 physically interacts with α-synuclein and p-Tau, as demonstrated in the present study with Aβ42.
Our findings support the intracellular amyloid hypothesis [
23,
24]. Indeed, we (e.g., [
27,
28] and others [
56,
57,
58,
59,
60,
61,
62,
63] have provided evidence for the intracellular accumulation of Aβ within neurons, including studies on postmortem AD brains, transgenic mouse brains, and in vitro AD models. Recently, we have demonstrated that, during the transdifferentiation of mesenchymal stromal cells (MenSCs) into the PSEN1 E280A cholinergic lineage, the production and accumulation of the iAβ42 fragment increased after seven days of transdifferentiation of the PSEN1 E280A ChLNs compared to day zero of transdifferentiation [
31]. In parallel, we observed a significant increase in DJ-1C
106-SO₃ at day 7 and an increase in autophagosome accumulation at day 5 of transdifferentiation, though there were no detected cell death markers. These observations suggest that the earliest pathological events in PSEN1 E280A ChLNs are the simultaneous accumulation of iAβ42, sulfonic DJ-1 (Cys
106-SO₃), and autophagosomes [
31]. Since antioxidant agents (e.g., EGCG and tramiprosate) abolished these molecular events in mutant ChLNs, we suspected a link between them. However, the mechanism by which iA, DJ-1 Cys
106-SO
3, and autophagosomes interact has not been clearly delineated. One possible explanation is that PSEN1 E280A-overproduced iA42 generates H
2O
2 through direct or indirect inhibition of mitochondrial complex I [
64,
65]. Since DJ-1 is an atypical peroxiredoxin-like peroxidase that scavenges H
2O
2 through oxidation of Cys
106-SH [
66], this molecule can turn sulfenic acid (Cys
106-SOH) into sulfonic acid groups (Cys
106-SO
3H) in DJ-1 protein [
37,
67], leading to loss of function and protein aggregation [
42]. Interestingly, sulfonic acid DJ-1 (Cys
106-SO
3) can form a protein complex with iA42 (this work), which possibly overcharged the autophagy-lysosomal pathway, wherein the autophagosomes accumulate and fail to mature into functional autolysosomes [
68], leading to a blockage in the degradation process in mutant ChLNs. Therefore, early suppression of H
2O
2 generation (e.g., by antioxidants) might block the cascade of events, such iA42> mitochondria Complex I > H
2O
2> DJ-1 (Cys
106-SO
3)>> iA42-sulfonic DJ-1 complex, leading to dysregulation of autophagy. Our present work and previous one (e.g., [
27,
31]) supports such a scenario (
Figure 8).
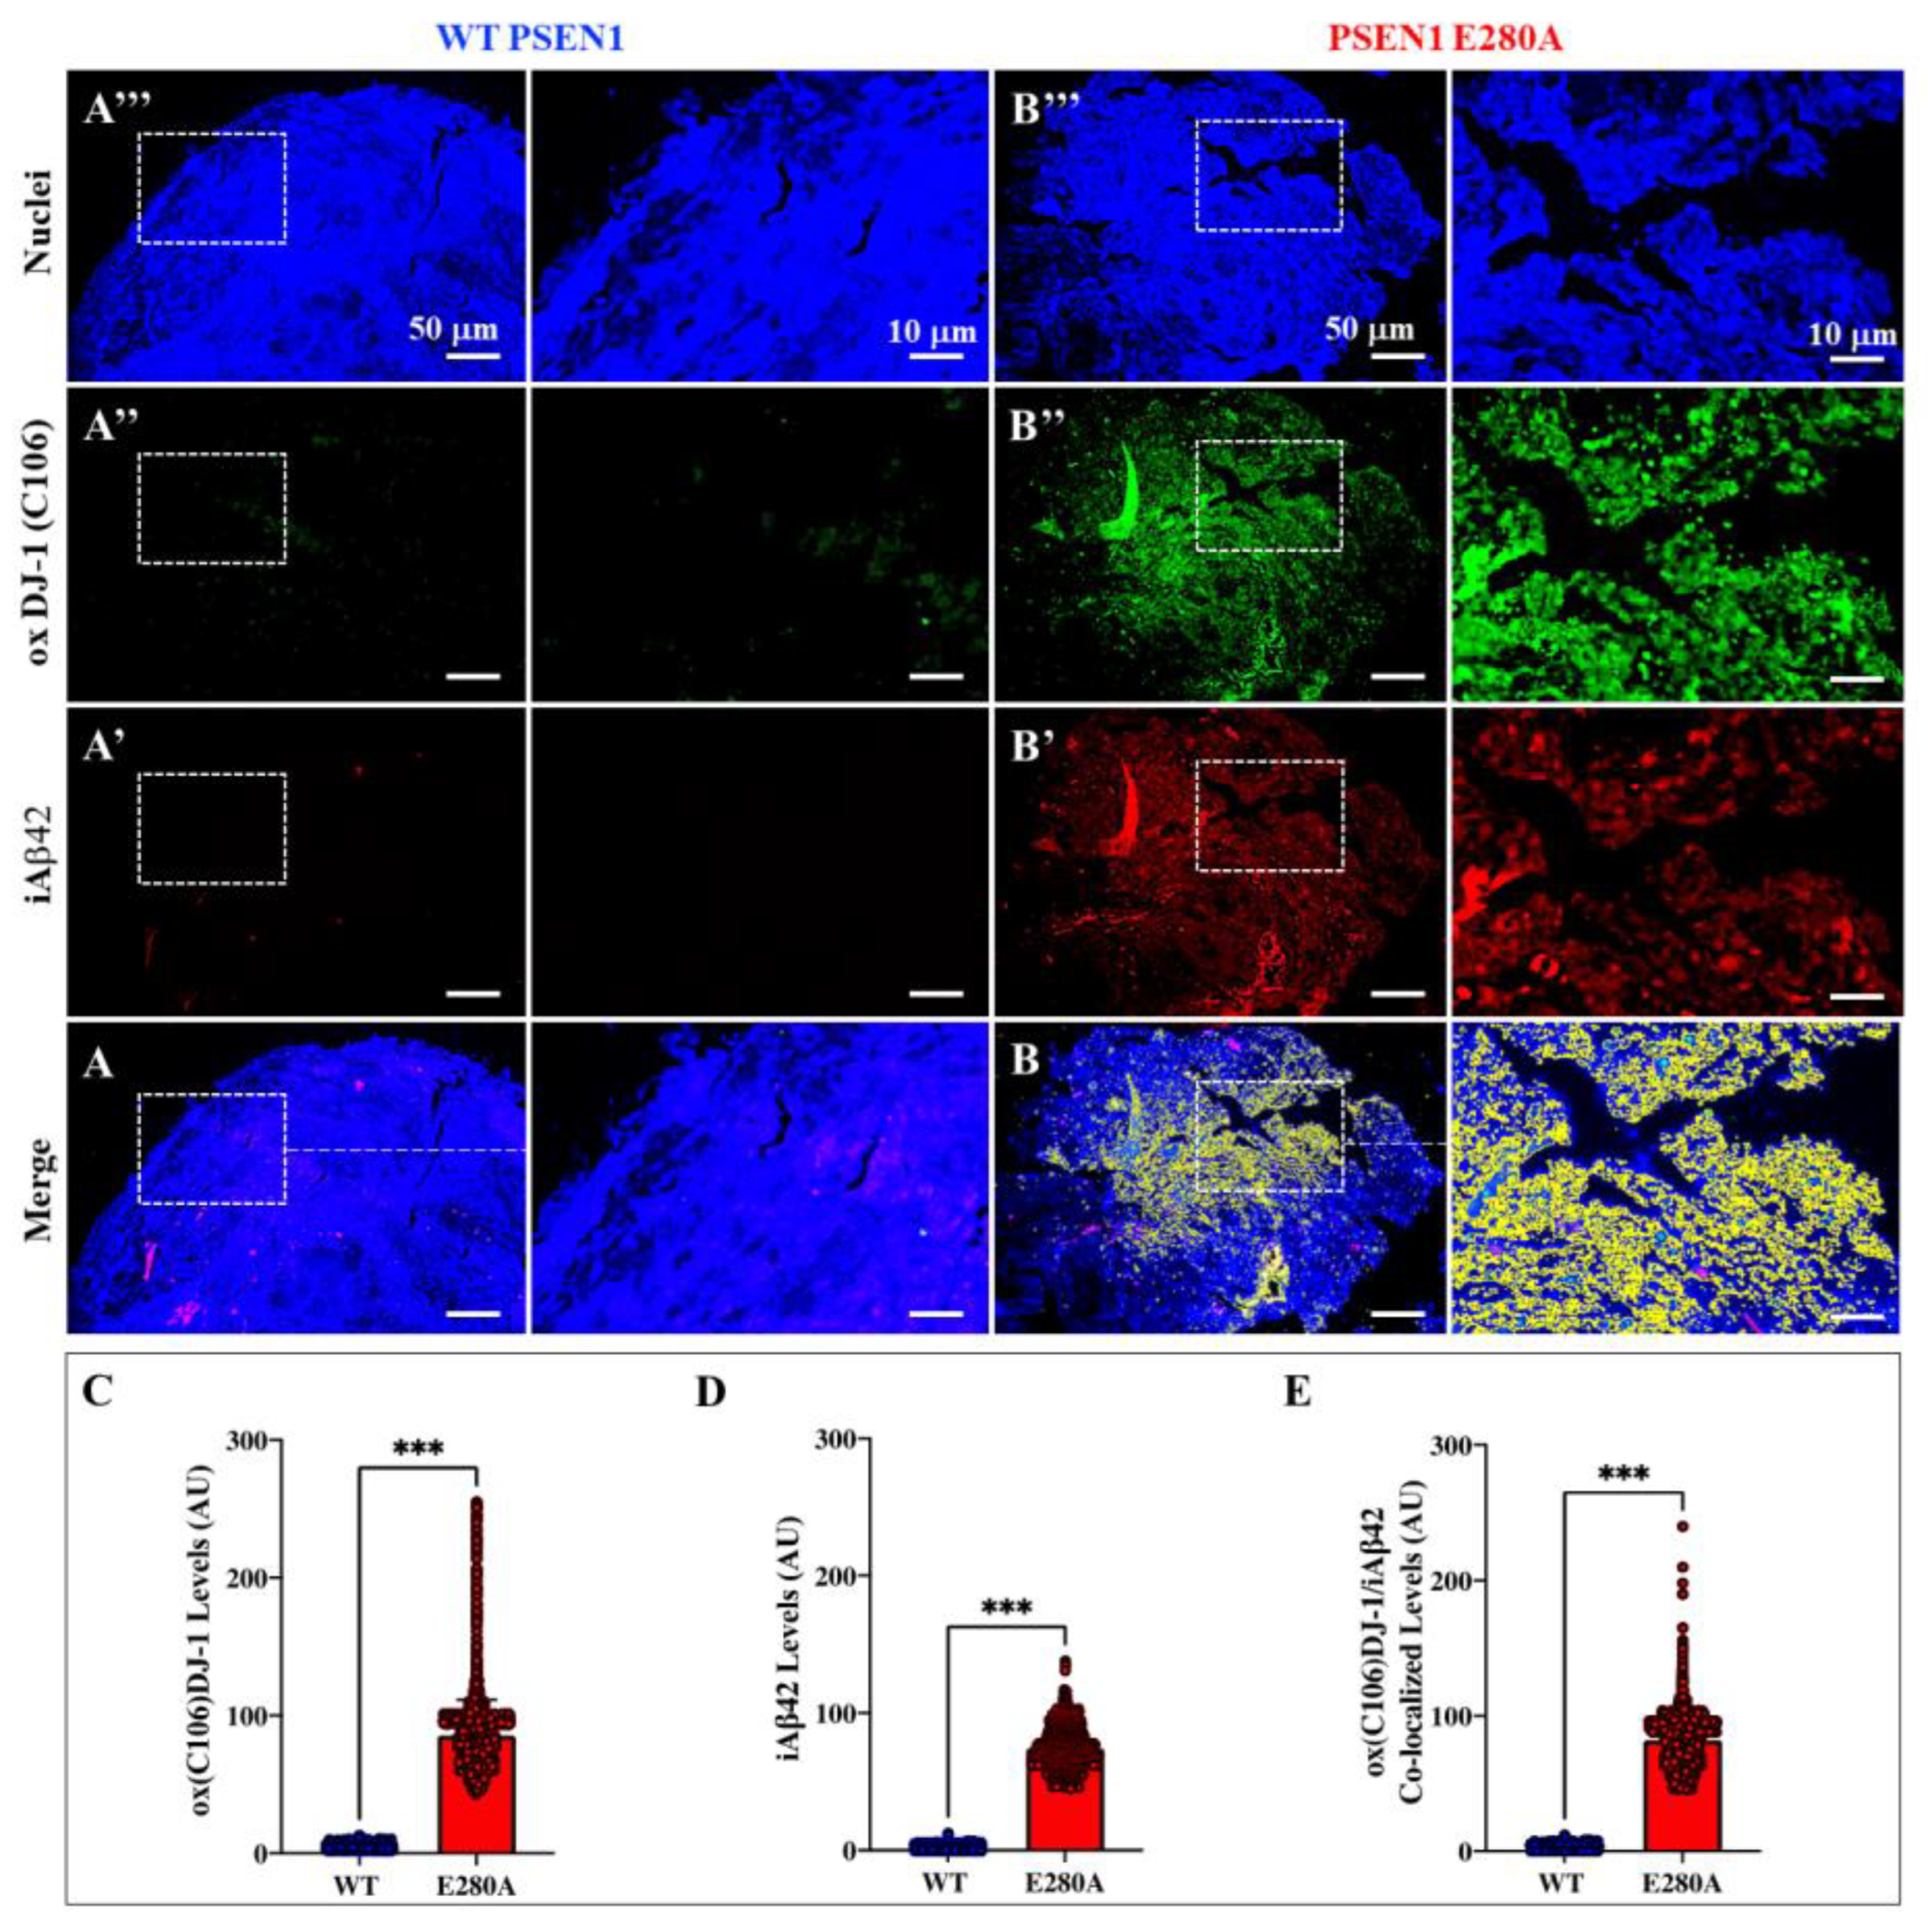
Figure 1.
DJ-1 oxidation co-localizes with amyloid beta 42 (A42) reactivity in postmortem cerebral slides from familial Alzheimer’s disease PSEN1 E280A individuals. Hippocampal (A-F and A’-F’ insets), Frontal cortex (H-M and H’-M’ insets) and Occipital cortex (O-T and O’-T’ insets) representative pictures showing oxidized oxDJ-1(Cys106) (A, D, H, K, O and R), A42 aggregates (B, E, I, L, P and S) and merge (C, F, J, M, Q and T) labelling in WT (A-C, H-J, and O-Q) and PSEN1 E280A (D-F, K-M, and R-T) with anti-DJ-1 monoclonal antibody against cysteine106 sulfonic (SO3) and anti-amyloid β1–42 antibody 6E10. Images were analyzed and quantitative data for protein co-localization was compared (G, N and S). Data are expressed as mean ± SD; *** p < 0.001. Photomicrographs, figures, and bars represent 1 of 3 WT PSEN1 individuals and 1 of 5 PSEN1 E280A cases. Image magnification ×10. Inset magnification ×100 is a representation of broken lines square.
Figure 2.
Generation of organoids from WT PSEN1 and PSEN1 E280A iPSC-derived neural precursor cells (NPC). WT PSEN1 and PSEN1 E280A NPCs were cultivated as described in Materials and Methods section and spontaneous organoid formation was noticed. Representative light images showing 0 (A, E), 7 (B, F), 15 (C, G) and 20 (D, H) days of organoids progression from WT PSEN1 individual’s- (A-D) and PSEN1-E280A (E-H) patient’s-derived NPC. Representative fluorescence images showing the MAP2 (blue; I’, J’), ChAT (red; I’’, J’’), GFAP (red; I’’’, J’’’) and merge (I, J) labelling of WT (I’-I) and PSEN1-E280A (J’-J) organoids after 20 days. Images were analyzed and quantitative data for MAP2 (K), ChAT (L) and GFAP (M) was compared. Representative light images showing 25 (N, R), 30 (O, S), 40 (P, T) and 50 (Q, U) days of organoids progression from WT PSEN1 individual’s- (N-Q) and PSEN1-E280A (R-U) patient’s-derived NPC. Comparative analysis of organoids diameter (V). Data are expressed as the mean ± SD; ns= not significant. Light images magnification (A-H), 10x. Fluorescence Images magnification, 10x. Light images magnification (N-P; R-T), 5x.
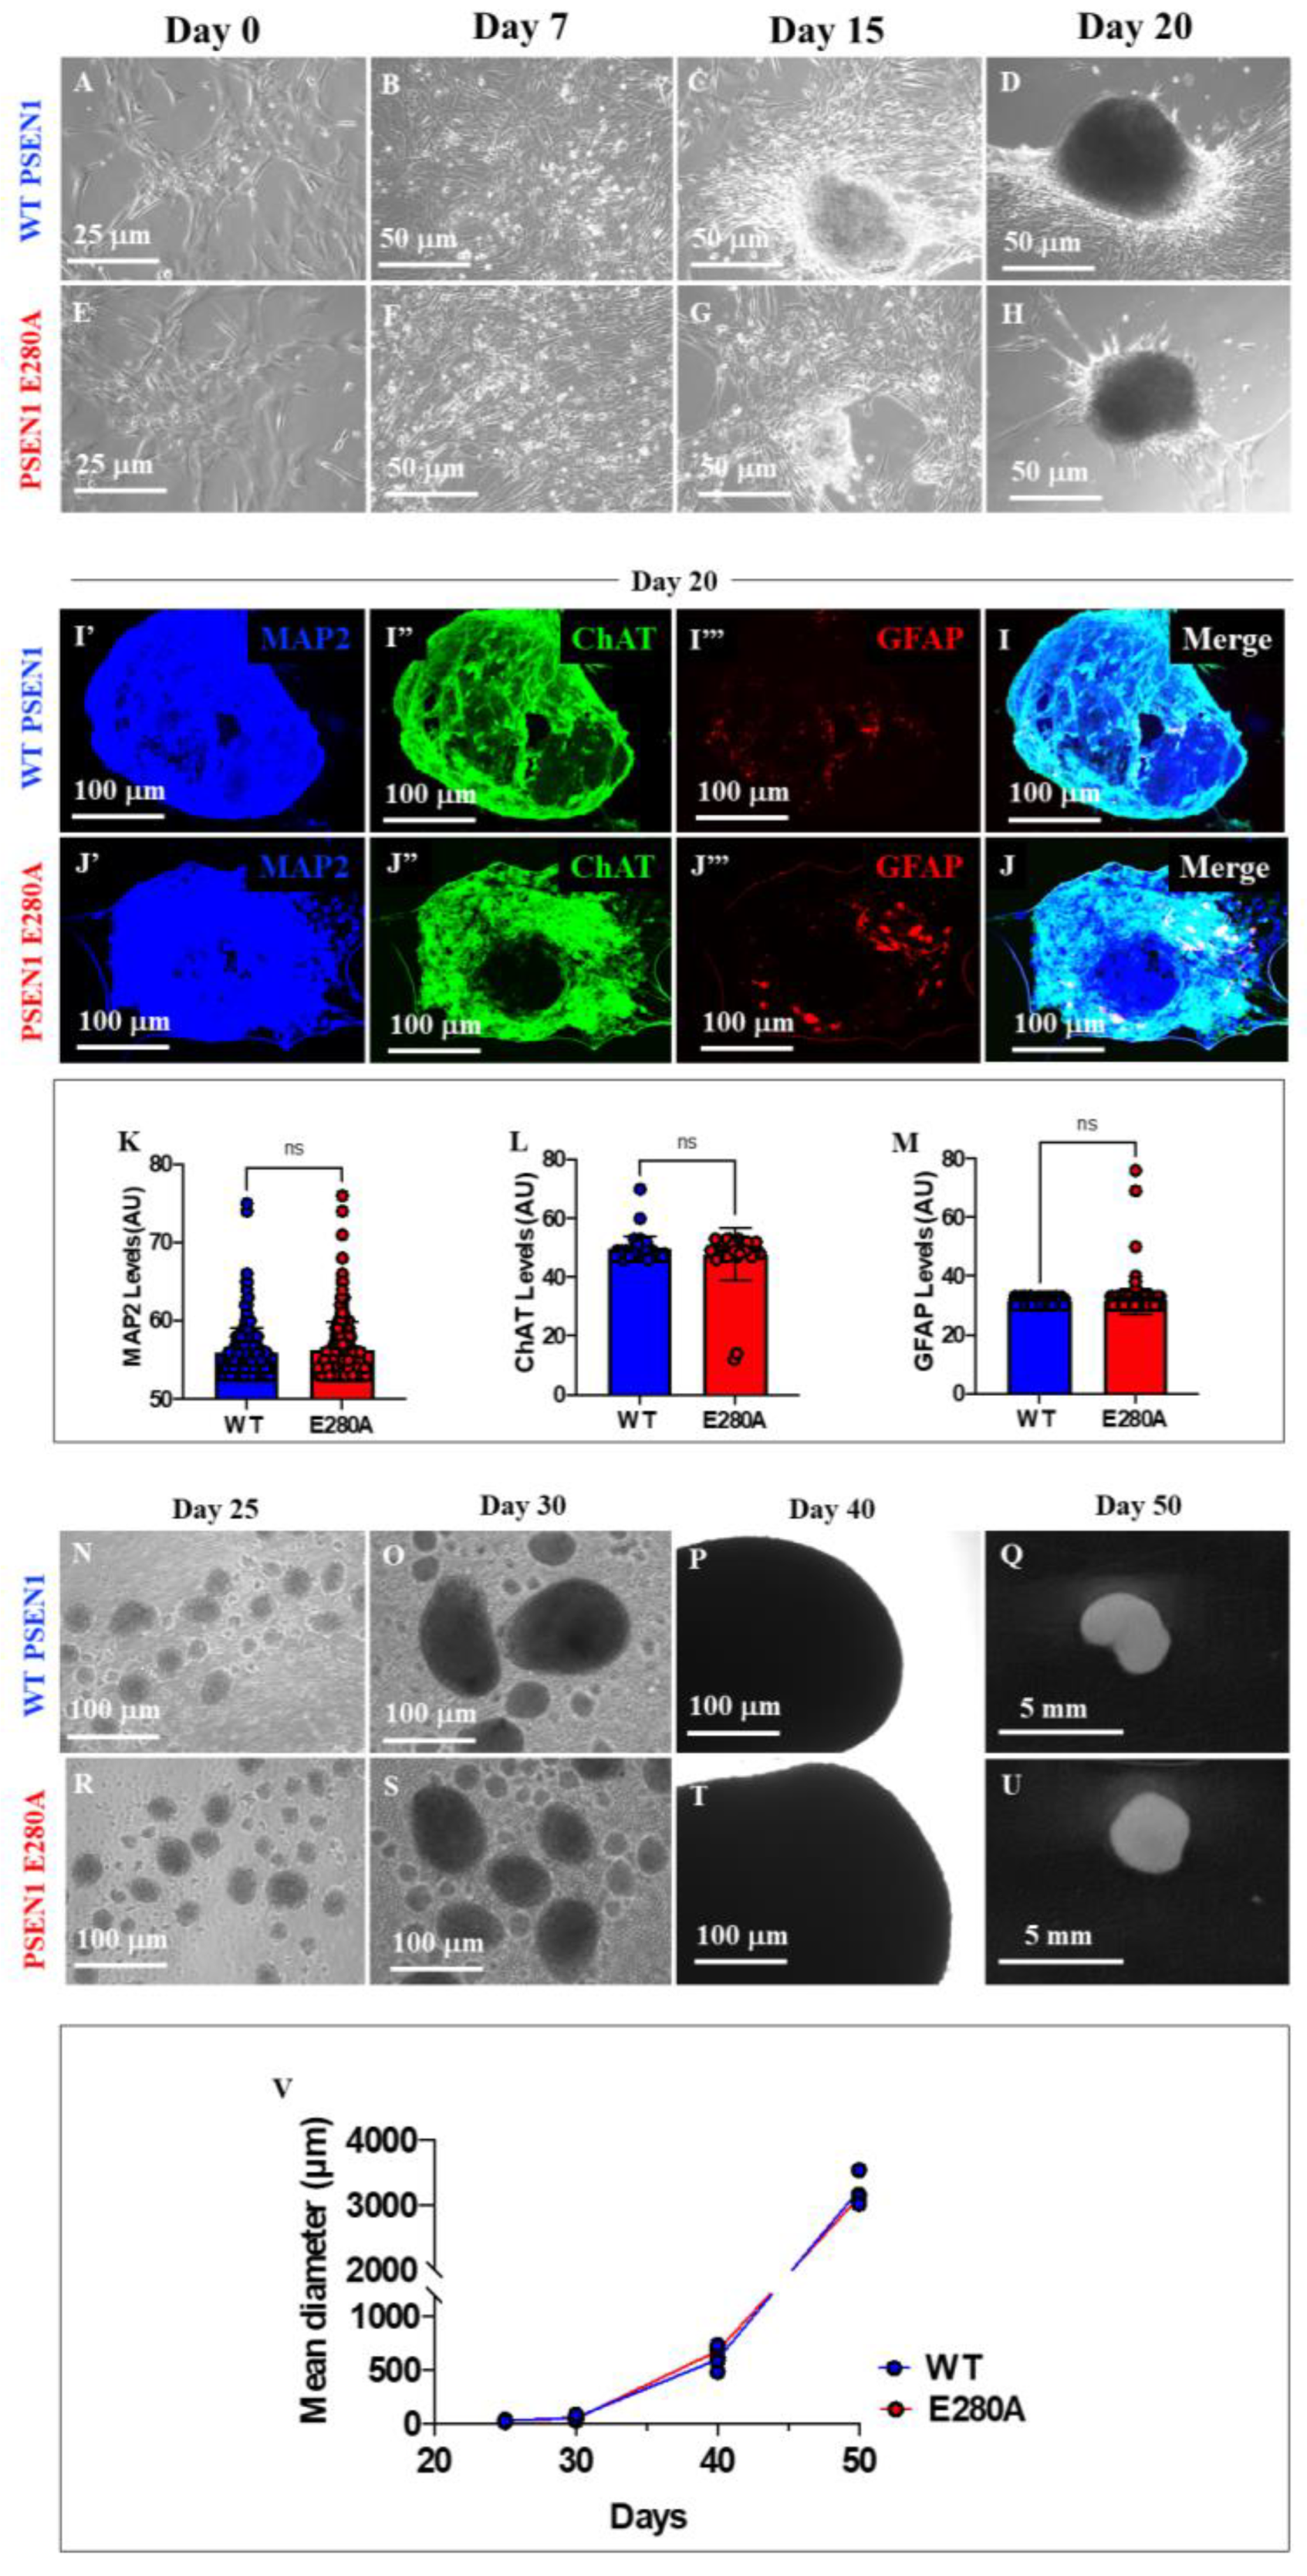
Figure 3.
Cerebral organoids derived from PSEN1 E280A neural precursor cells (NPC) show intracellular Aβ42 colocalization with sulfonic DJ-1(Cys106-SO3H). WT PSEN1 and PSEN1 E280A NPC were cultivated in as described in Materials and Methods section to induce spontaneous organoid formation. After 60 days, organoids were collected and immunofluorescence analysis was performed. Representative fluorescence images showing nuclei (A, B and insets), oxDJ-1 (Cys106-SO3H) (A”, B’’ and insets), iA42 (A’, B’ and insets) and oxDJ-1(Cys106) /iA42 co-localization (A, B, and insets) in WT PSEN1 and PSEN1 E280A organoids. Images were analyzed and quantitative data for oxDJ-1(Cys106) (C), iA42 (D), and oxDJ-1(Cys106) /iA42 co-localization (E). Data are expressed as the mean ± SD; ***p<0.001. The figures represent one of three independent experiments. Fluorescence Images magnification, 10x.
Figure 4.
Increased intracellular Aβ42 and oxidized DJ-1 (Cys106-SO3H) precede fibril and plaque formation in cerebral organoids derived from PSEN1 E280A neural precursor cells. WT PSEN1 and PSEN1 E280A NPC were cultivated as described in Materials and Methods section to induce spontaneous organoid formation. After 60 days, organoids were collected, and fluorescence analysis was performed. Representative fluorescence images showing nuclei (red) and BTA-1 A42 staining (blue) in WT PSEN1 (A) and PSEN1 E280A (B) organoids. Images were analyzed and quantitative data for BTA-1 A42 staining (C) was compared. Representative fluorescence images showing Nuclei (red) and BTA-1 A42 staining (blue) in WT PSEN1 (D) and PSEN1 E280A (E) cerebral slices. Images were analyzed and quantitative data for BTA-1 A42 staining (F) was compared. Data are expressed as the mean ± SD; ***p<0.001; ns= not significant. The figures represent one of three independent experiments. Fluorescence Images magnification, 10x.
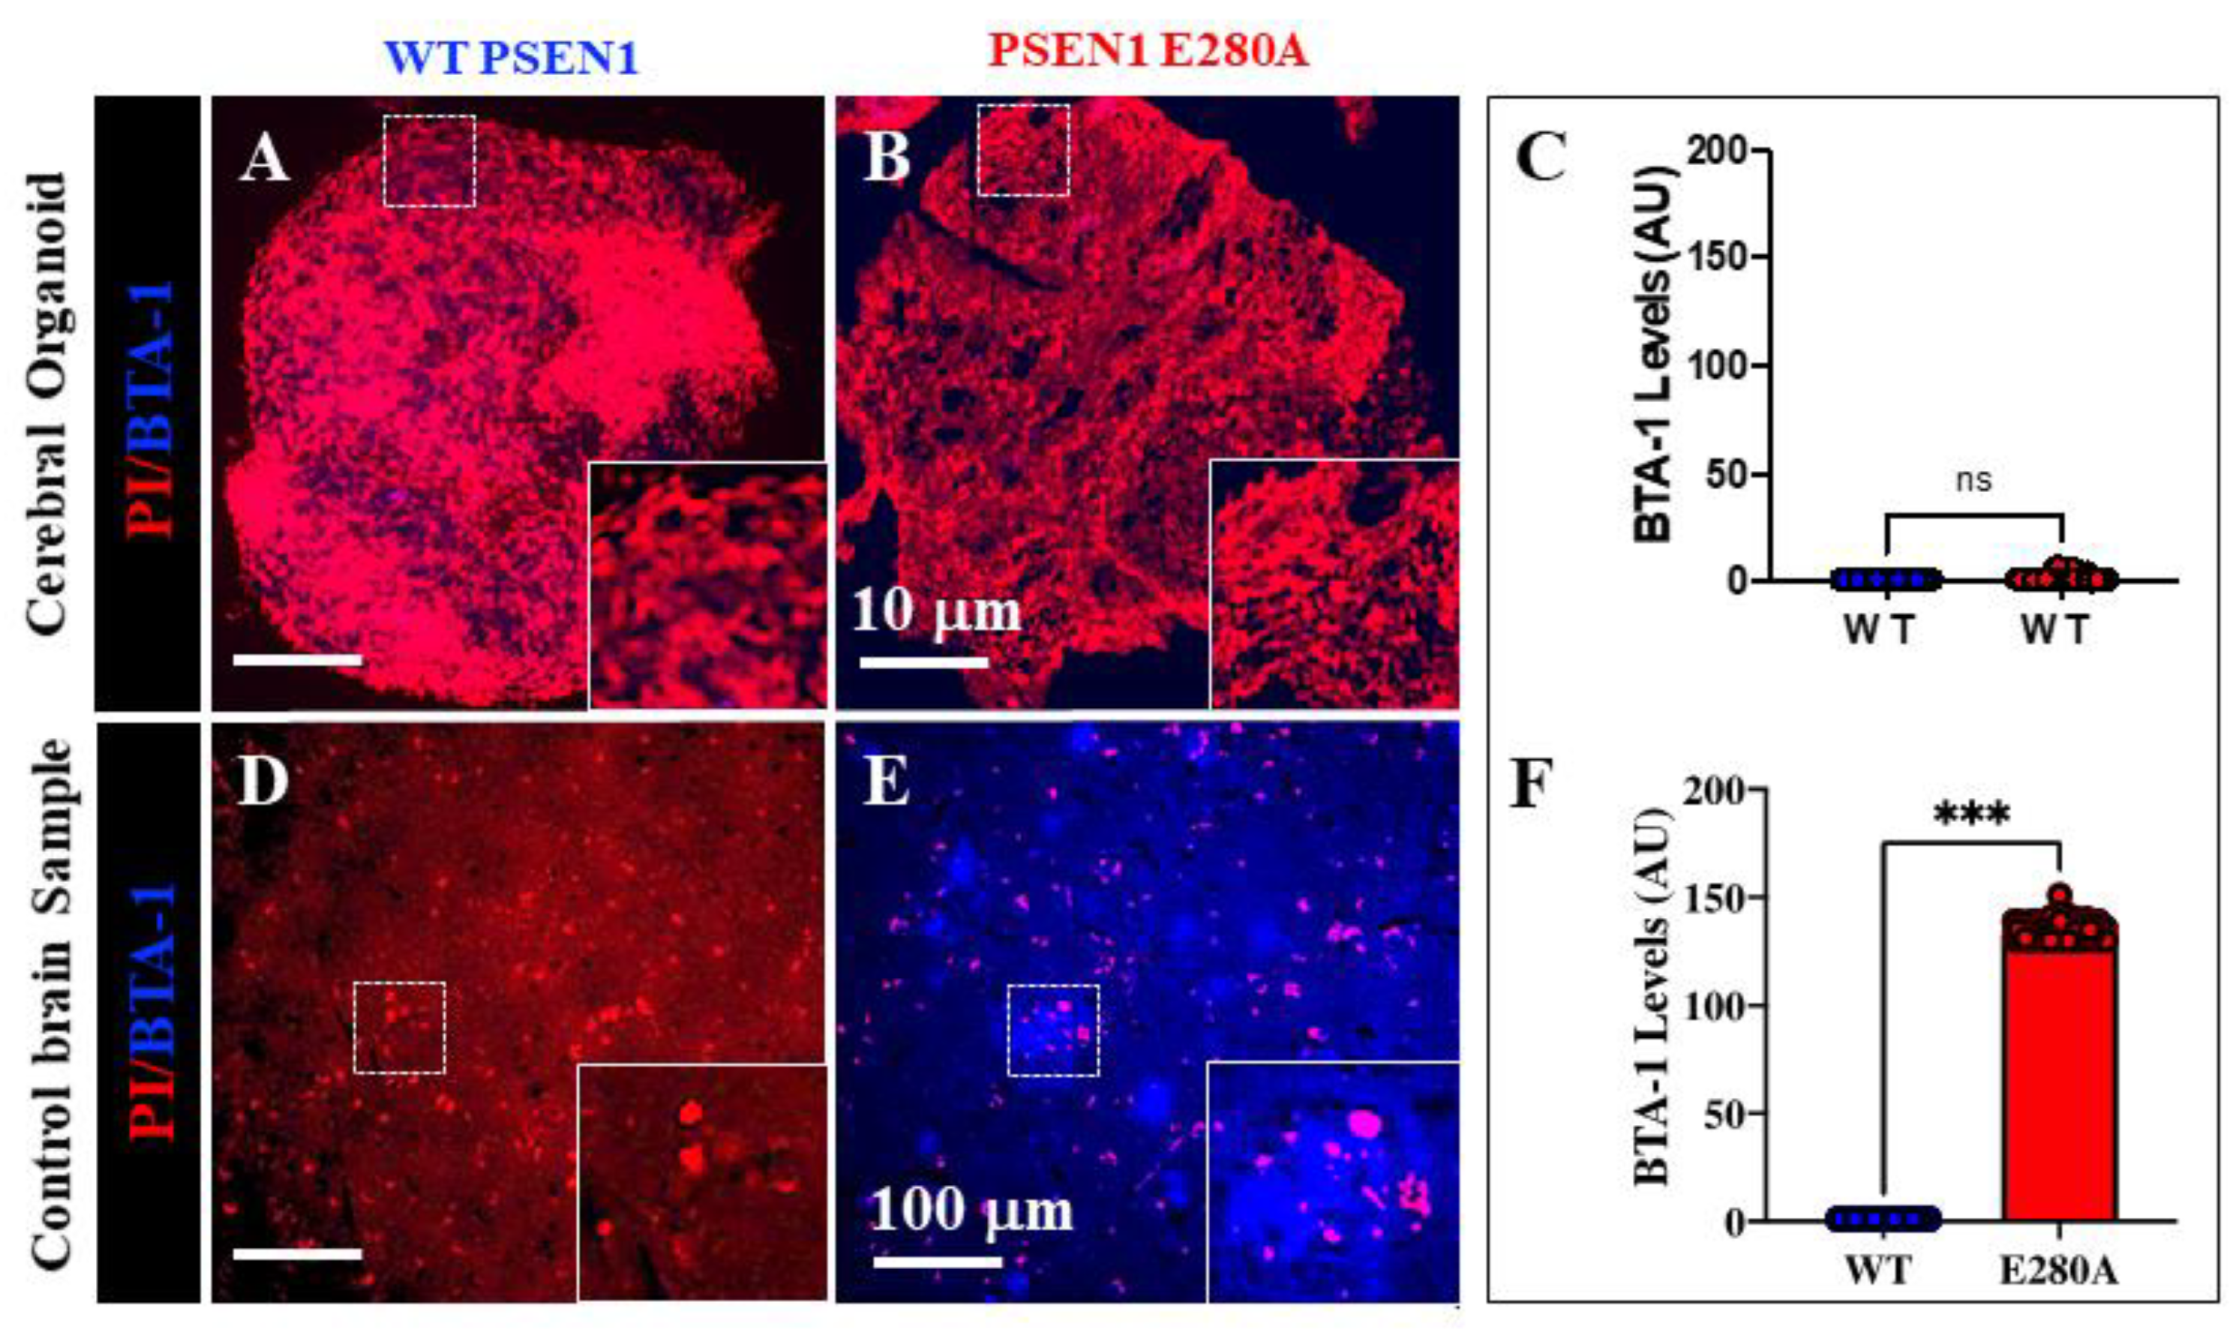
Figure 5.
Induced-Pluripotent Cells (iPSC) and immediate Neural Precursor Cells (NPC) generation from WT PSEN1 (control) individual’s- and PSEN1-E280A patient’s-derived fibroblasts. Representative light images showing 1 (A, B), 7 (C, D) and 28 (E, F) days emerging iPSC colonies from WT PSEN1 healthy (control) individual (A, C, E) and PSEN1 E280A (B, D, F) patient’s-derived fibroblasts. Determination of pluripotency markers by immunofluorescence. Nuclear (G’-J’) colocalization of OCT4 (G’’ and I’’) and SOX2 (G’’’and I’’’) in WT (G) and PSEN1 E280A (I) iPSC. Colocalization of NANOG (H’’ and J’’) and KLF4 (H’’’ and J’’’) in WT (H) and PSEN1-E280A (J) iPSC. Images were analyzed and quantitative data was compared (K). Flow cytometry analysis of negative controls (gray dot plots), WT (blue dot plots) and PSEN 1 E280A (red dot plots) iPSC to identify SOX2/OCT4 (L) and NANOG/KLF4 (M) double positive cells. Quantitative data showing the mean percentage of OCT4, SOX2 NANOG and KLF4 positive iPSC (N). Representative light images showing WT (O) and PSEN 1 E280A (P) iPSC-derived embryoid bodies. Representative light images showing WT (Q) and PSEN 1 E280A (R) embryoid bodies-derived NPC. Determination of Neural Stem Cells markers by immunofluorescence. Nuclei staining (S’-T’) and identification of Nestin (S’’, T’’) and SOX2 (S’’’, T’’’) in WT (S) and PSEN1-E280A (T) NPC. Images were analyzed and quantitative data was compared (U). Flow cytometry analysis of negative controls (gray dot plots), WT (blue dot plots) and PSEN 1 E280A (red dot plots) NPC to identify Nestin/SOX2 (V) double positive cells. Quantitative data showing the mean percentage of Nestin and SOX2 positive NPC (W). Data are expressed as mean ± SD; ns = not significant. Photomicrographs, figures, and bars represent one out of three independent experiments. Light images magnification 10x. Fluorescence images magnification 20x.
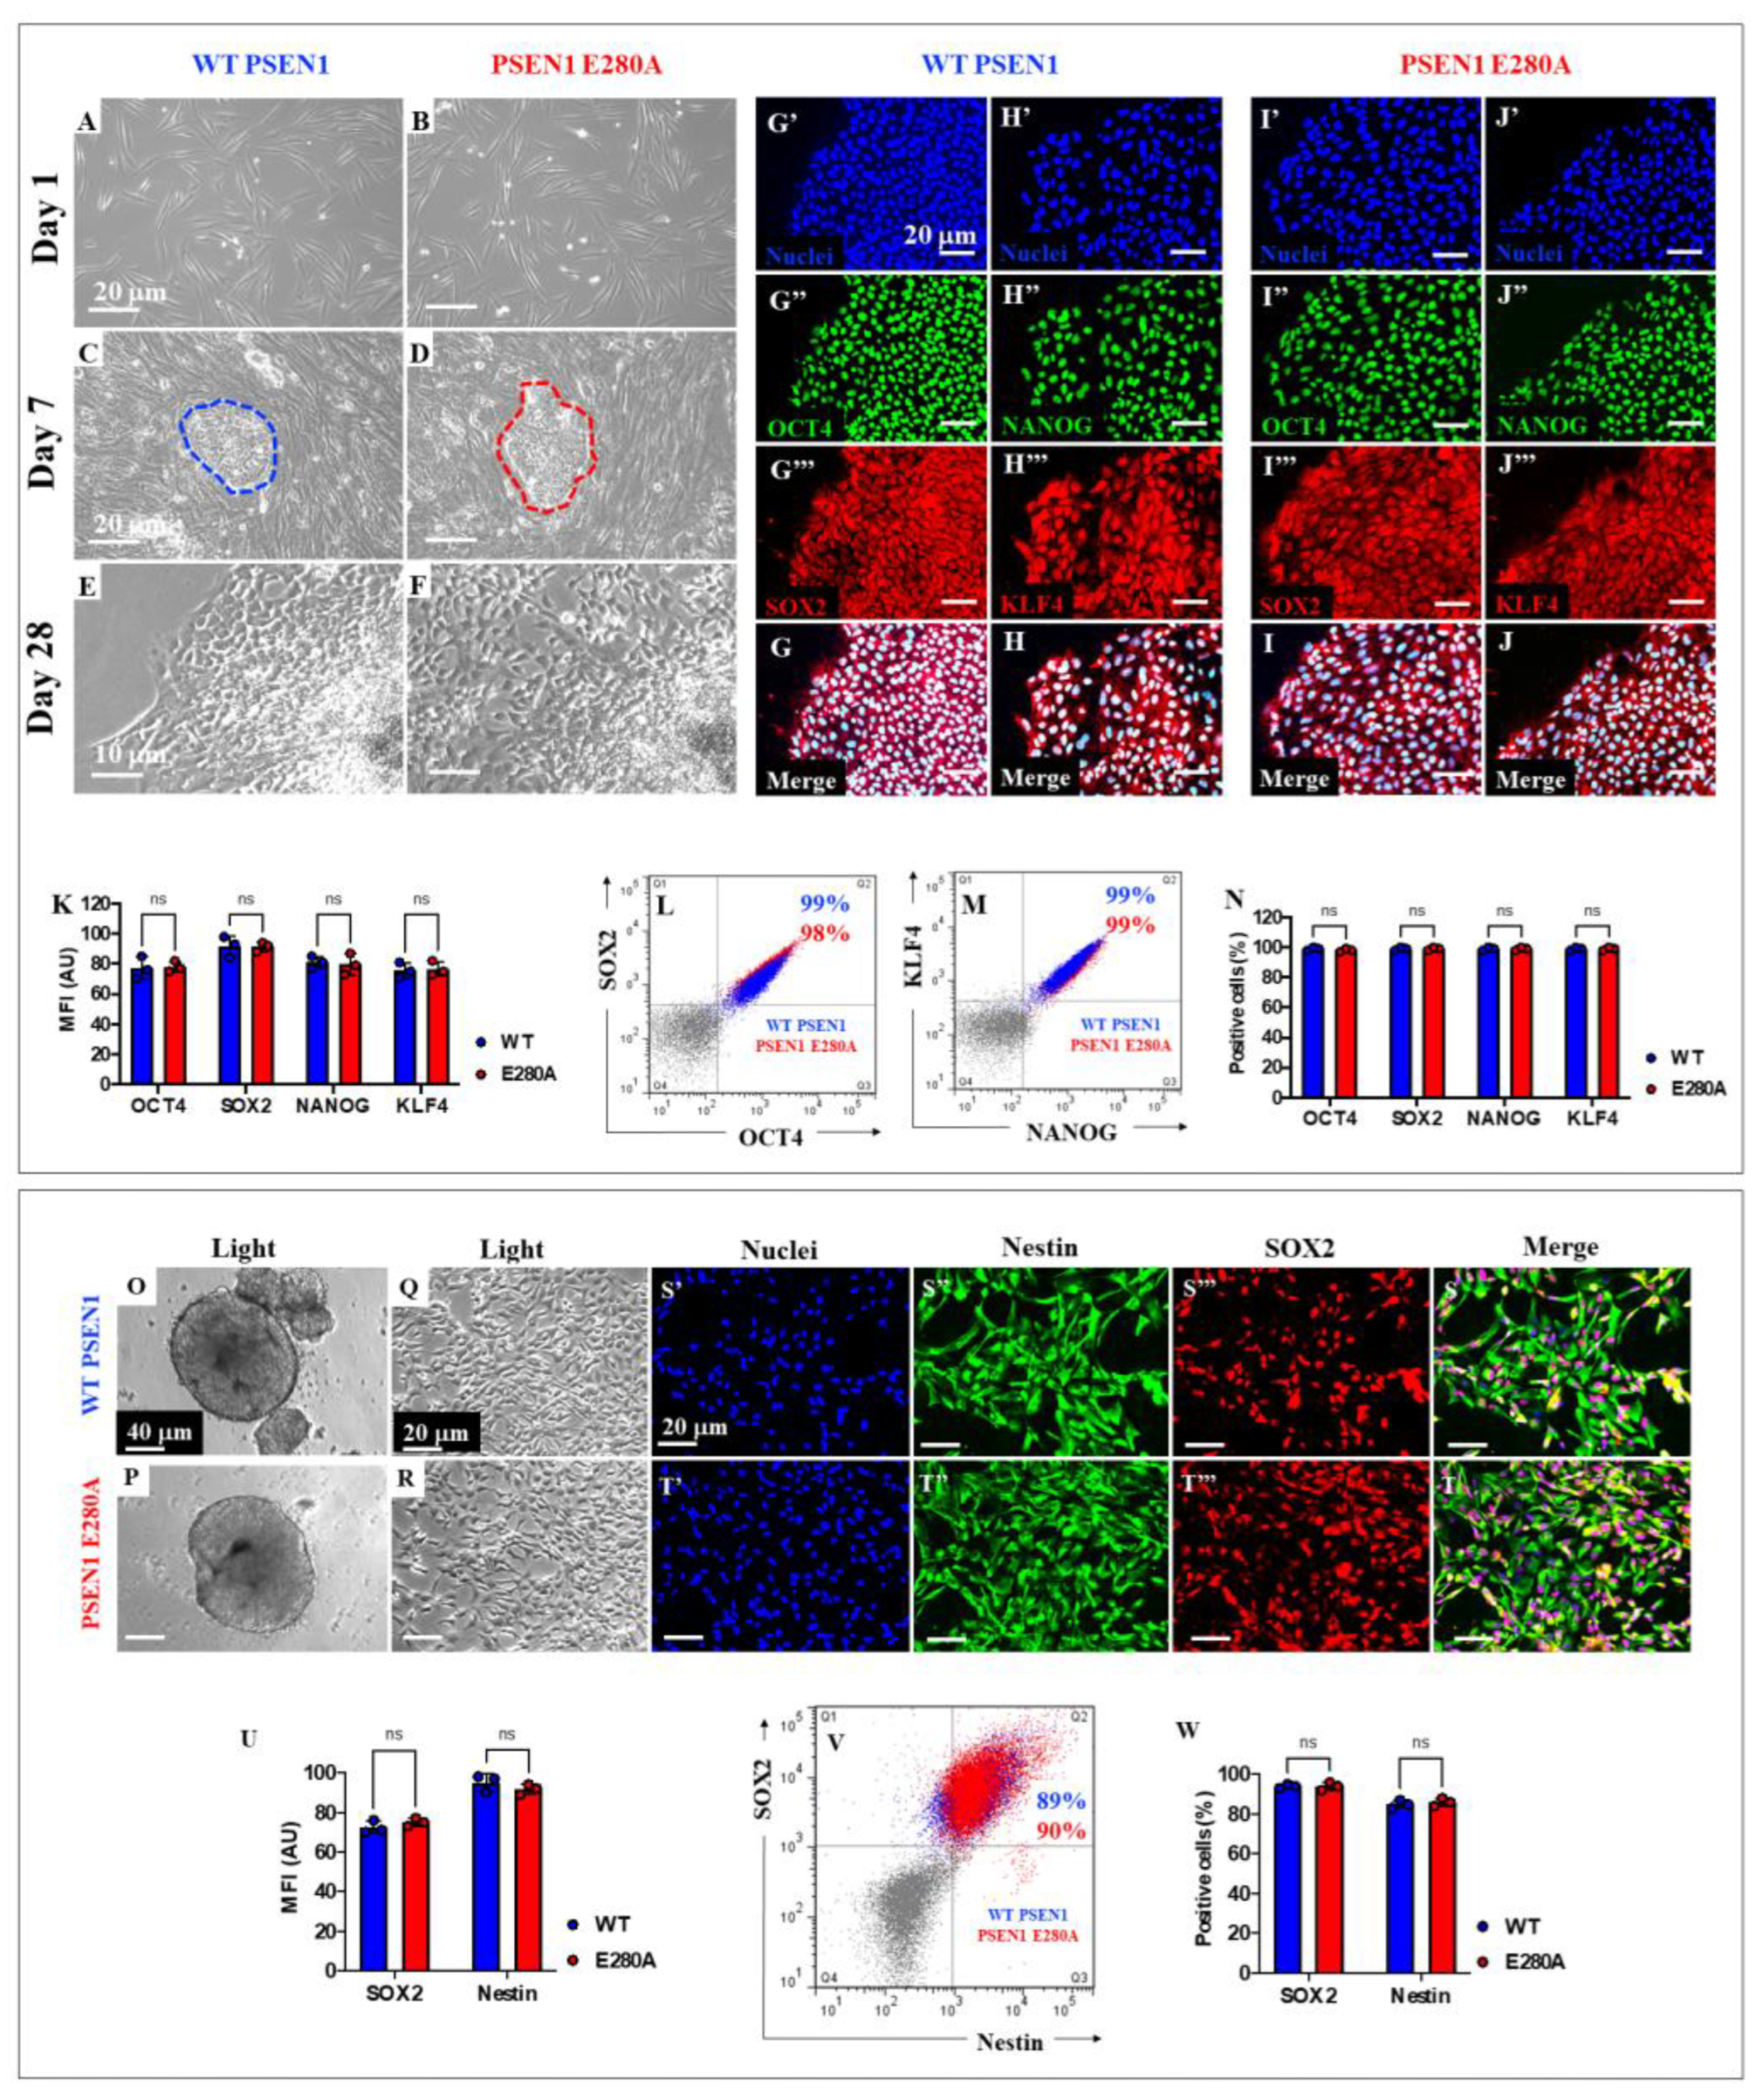
Figure 6.
PSEN1 E280A Cholinergic neurons (ChN) show increasing levels of intracellular Aβ42 and oxidized DJ-1 (Cys106) upon differentiation. Representative light images showing 7 days differentiated neurons from NPC-derived WT PSEN1 (A) and PSEN1 E280A ChNs (E). Determination of neural markers by immunofluorescence. Nuclear (blue) and III Tubulin (red) labelling of WT (B) and PSEN1-E280A neural cells (F). Nuclear (blue) and ChAT (red) labelling of WT (C) and PSEN1-E280A (G). Nuclear (blue) and GFAP (red) labelling of WT (D) and PSEN1-E280A (H). Images were analyzed and quantitative data was compared (I). Flow cytometry analysis of negative controls (gray dot plots), WT (blue dot plots) and PSEN 1 E280A (red dot plots) ChN to identify III Tubulin/GFAP (J) and III Tubulin/ChAT (K) double positive cells. Quantitative data showing the mean percentage of III Tubulin, GFAP, and ChAT positive ChN (L). After 7 days of differentiation, WT PSEN1 and PSEN1 E280A ChNs were left in neural medium (NM) for 0, 2, and 4 days post-transdifferentiation, as indicated in the figure. After this time, the proteins in the extracts were blotted with primary antibodies against Aβ42, ox DJ-1 (Cys106) and actin proteins. The intensities of the western blot bands shown in (M and N) were measured (O, P) by an infrared imaging system (Odyssey, LI-COR), and the intensity was normalized to that of actin. Additionally, WT PSEN1 (Q-S) and PSEN1 E280A (T-V) ChNs were double stained as indicated in the figure with primary antibodies against ox(Cys106) DJ-1 (green) and iAβ42 (red). The nuclei were stained with Hoechst 33342 (blue). The ox(Cys106) DJ-1 (green) and Aβ42 (red) was further co-localized as shown in figures (Q’-V’) Quantification of iAβ42 fluorescence intensity (W). Quantification of ox(Cys106) DJ-1 fluorescence intensity (X). Quantification of iAβ42/ox(C106) DJ-1 fluorescence co-localization (Y). Data are expressed as the mean ± SD; *p<0.05; **p<0.01; ***p<0.001; ns= not significant. The blots and figures represent one of three independent experiments. Light images magnification, 10x. Fluorescence Images magnification in (B-D and F-H), 20x. Fluorescence Images magnification in (Q-V and Q’-V’), 40x.
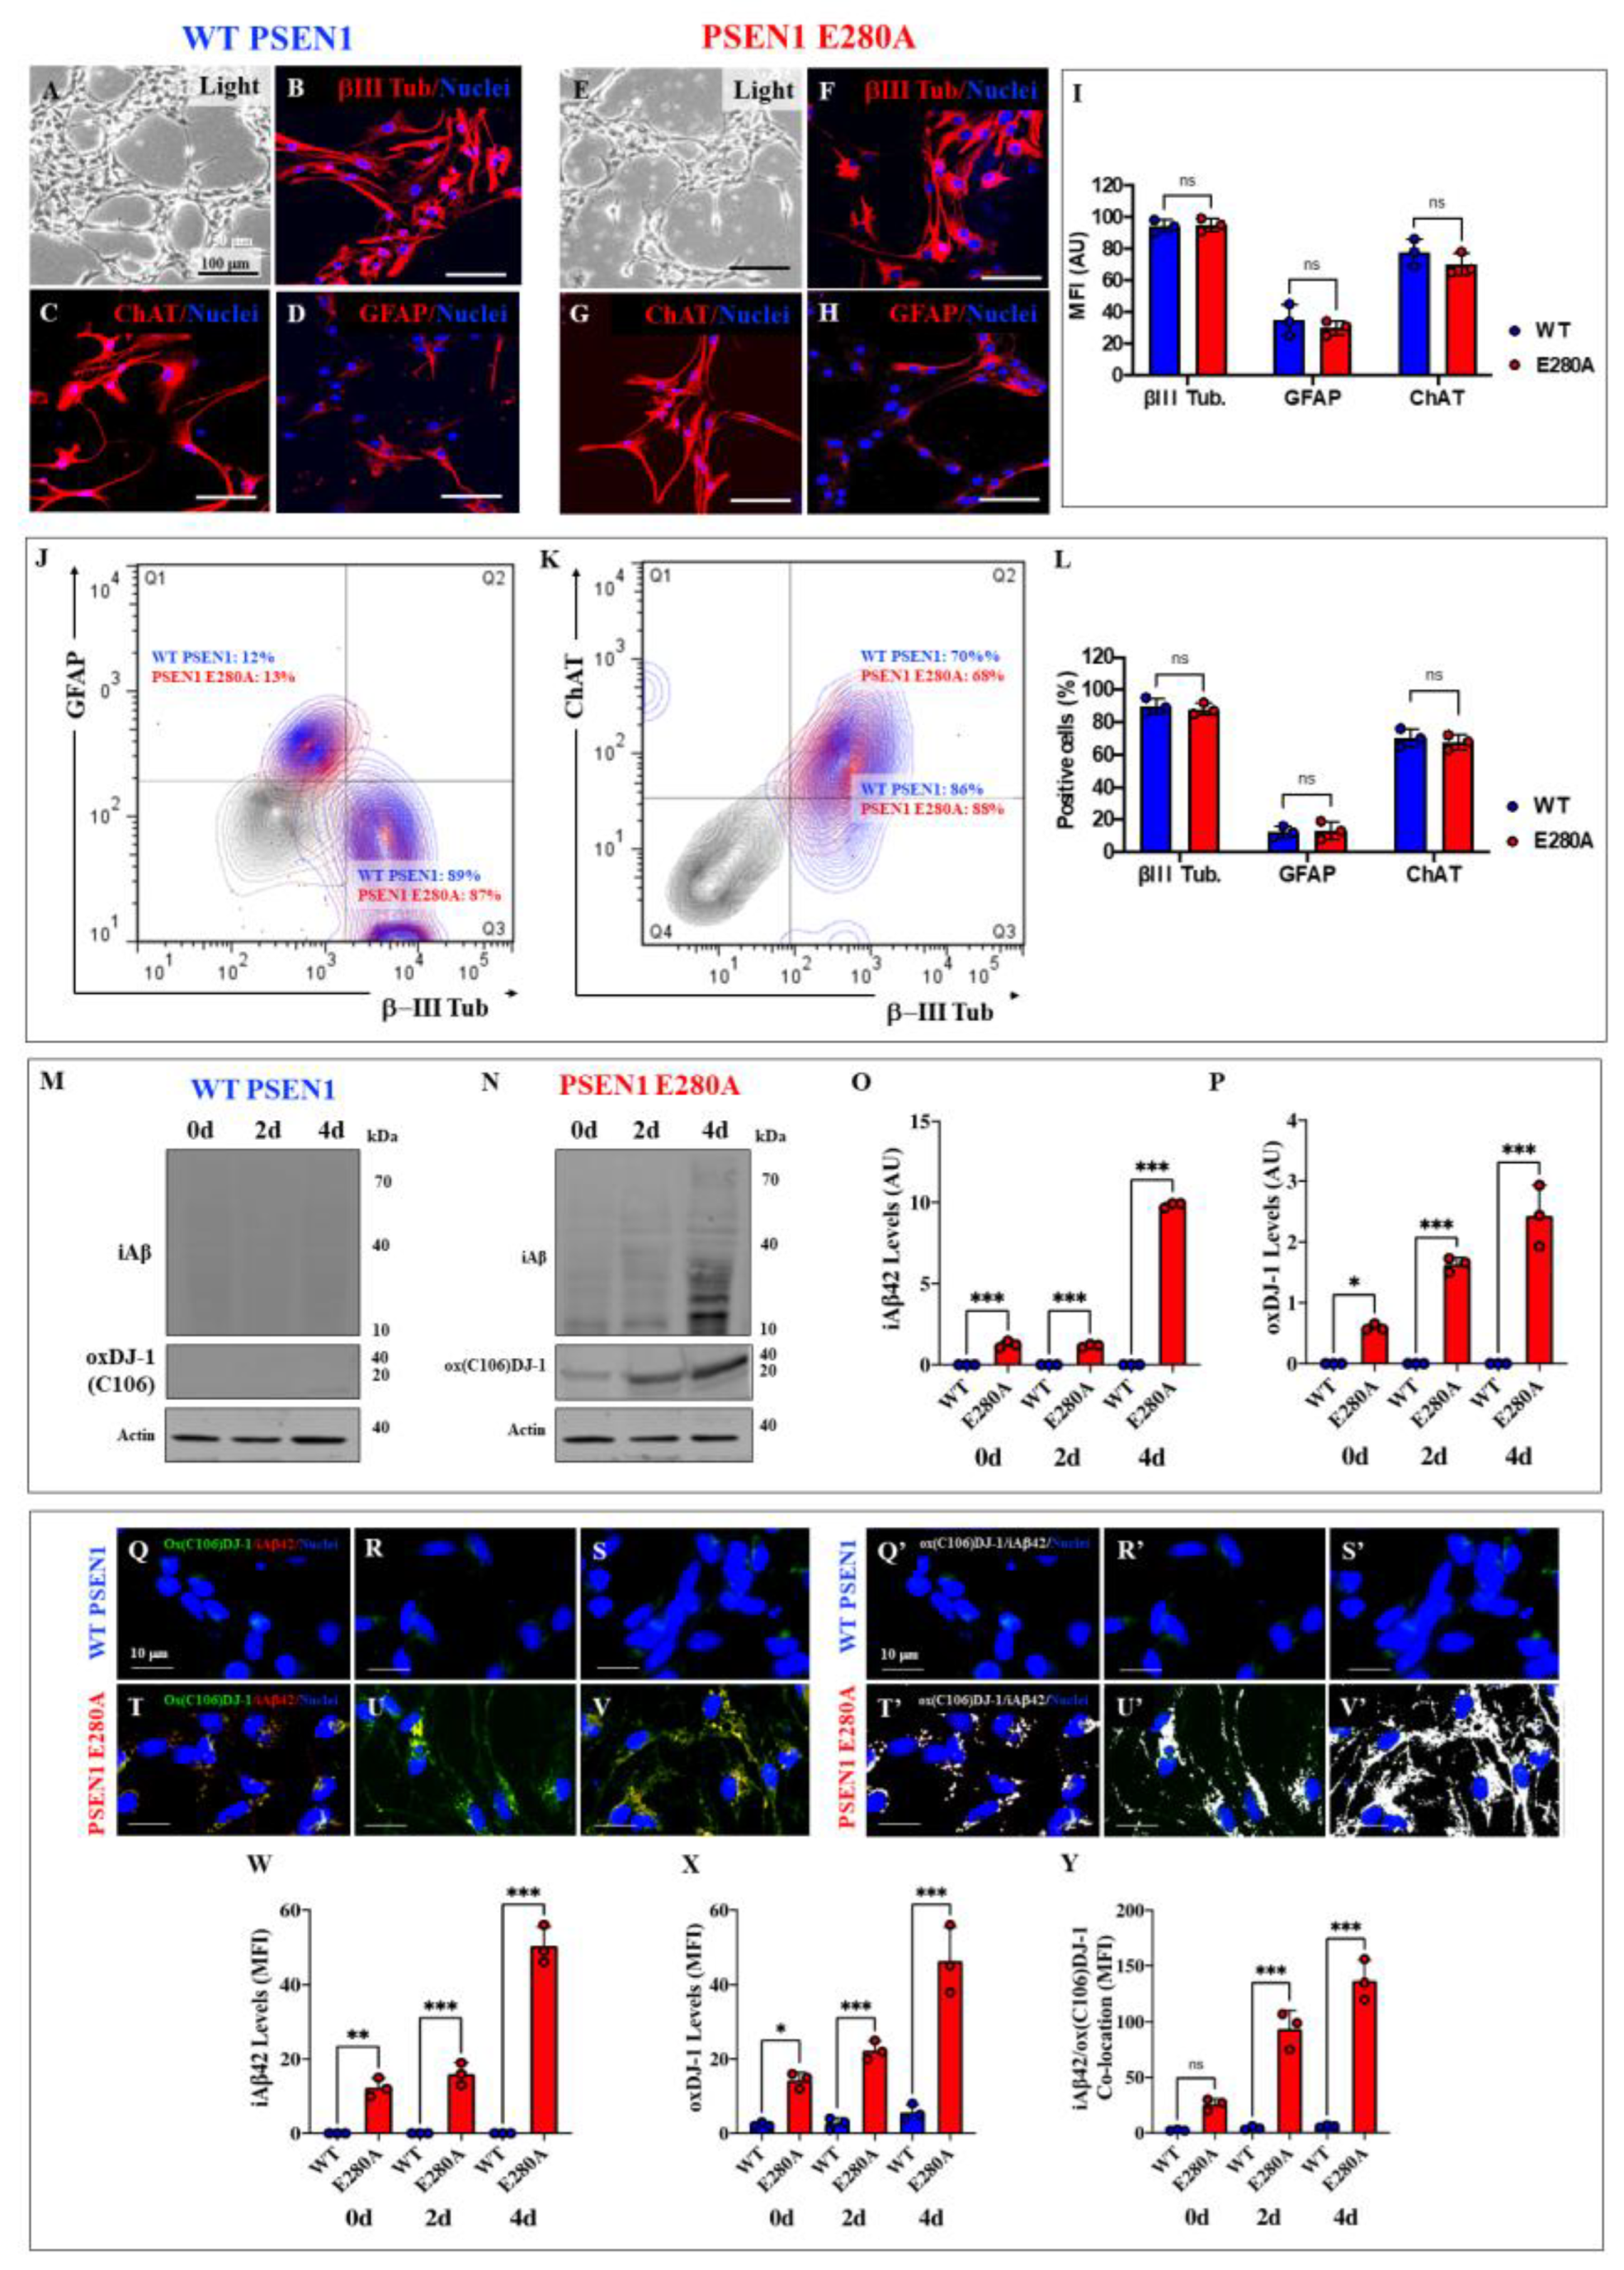
Figure 7.
In silico docking analysis of the binding of sulfonic DJ-1 (Cys106-SO3) and monomeric amyloid beta 42 (A42), ELISA test, and fibril growth in cell-free analysis. Representative HDOCK 3D images showing the molecular docking of (A) Sulfenic (PDB:4p34), (B) Sulfinic (PDB: 1soa), (C) sulfonic DJ-1 (aggregated, PDB: 3bwe) with monomeric A42. (D) ELISA test diagram of A42 and DJ-1 in the absence of H2O2; (E) ELISA test diagram of A42 and DJ-1 in the presence of H2O2; (F) Quantification of the levels of ox(106) DJ-1-A42 levels in absence or presence of H2O2. (G) Representative aggregation kinetics of A42 fibrillar growth in presence of DJ-1 and the absence of H2O2. (H) Representative aggregation kinetics of A42 fibrillar growth in presence of DJ-1 and in the presence of H2O2. The figures represent 1 out of 3 independent experiments (n = 3). Data are expressed as mean ± SD; ***p < 0.001; ns = not significant. Figures/histograms, and bars represent 1 of 3 independent experiments (n = 3).
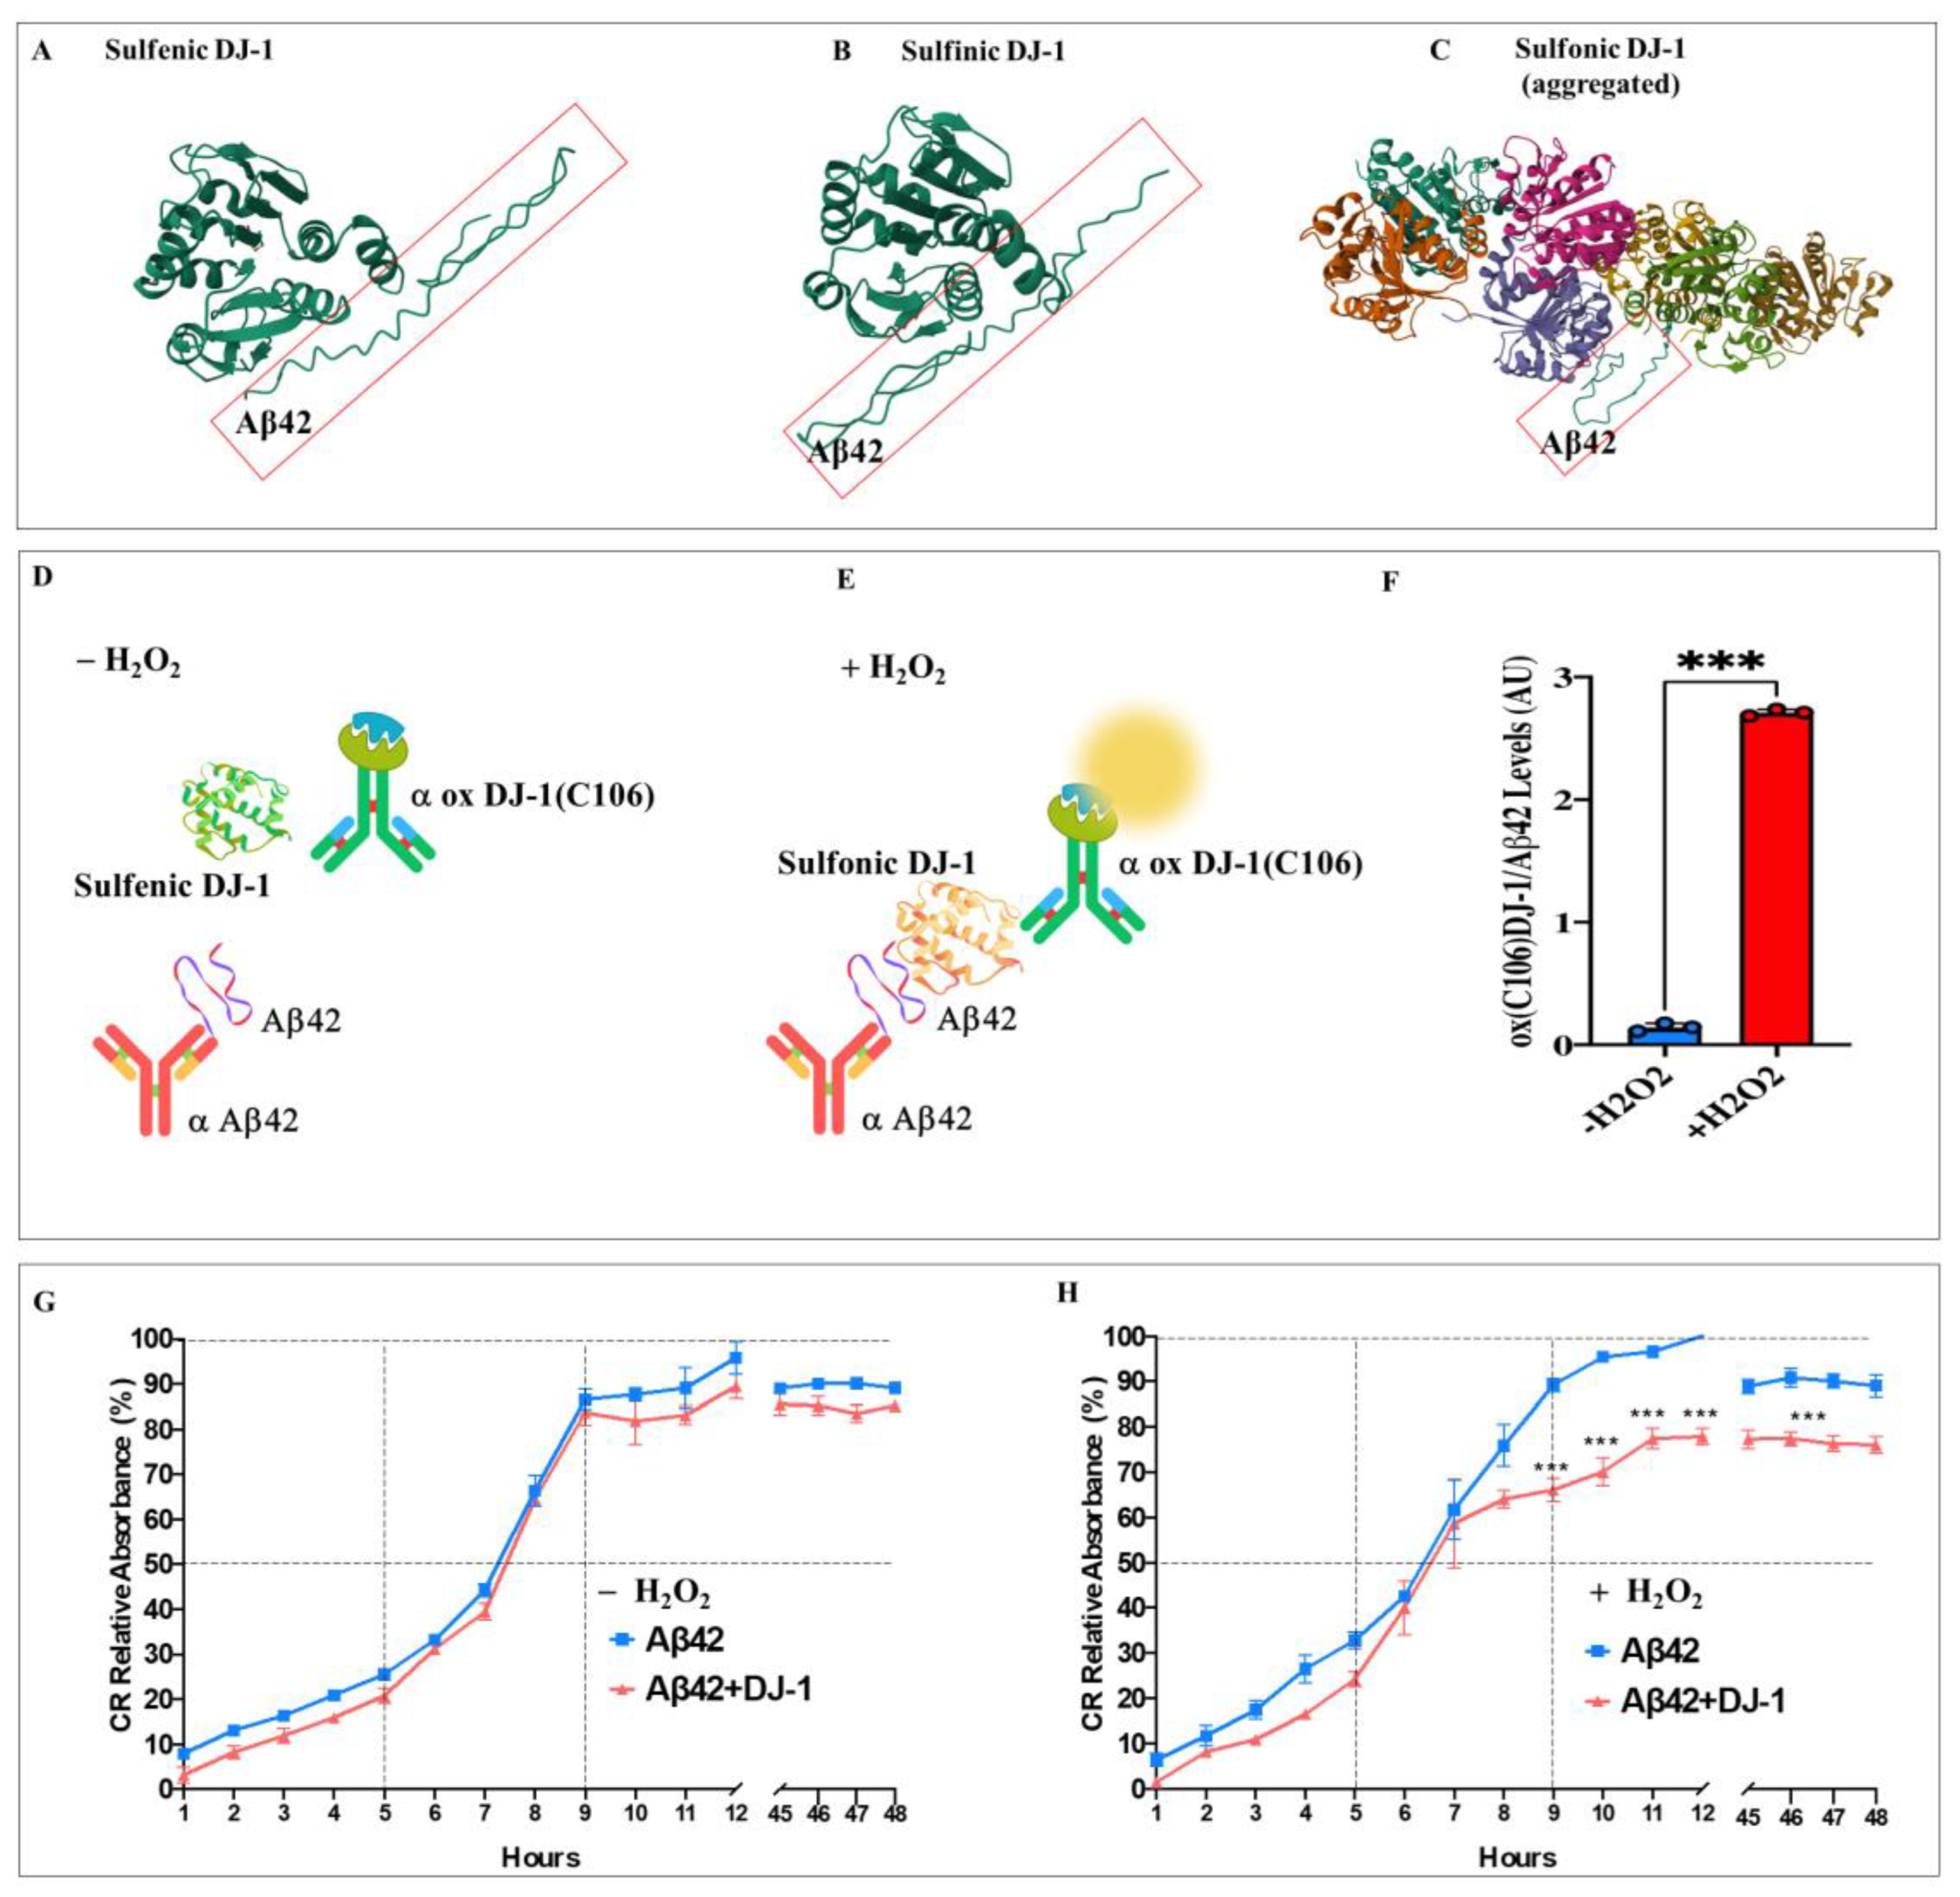
Figure 8.
Schematic representation of the early intraneuronal pathological interactions between Aβ42 and oxidized DJ-1. (
1) PSEN1 E280A-induced monomeric intracellular Aβ42 production is imported into the mitochondria via the translocase of the outer membrane (TOM) import machinery [
69]. (
2) Once inside the mitochondrial matrix, Aβ42 binds to and blocks Complex I, resulting in electron leakage [
64,
65]. This is followed by non-enzymatic reactions involving the one-electron reduction of molecular oxygen into superoxide anion radicals (
3). These radicals can then be converted to hydrogen peroxide (H₂O₂, step
4) through a dismutation reaction, either spontaneously or catalyzed by the enzyme superoxide dismutase (SOD). (
5) The H₂O₂ then oxidizes sulfenic (-SOH) to sulfinic (-SO₂H) to sulfonic (-SO₃H) DJ-1, which physically binds to Aβ42 (
6, this work), forming Aβ42-DJ-1 Cys106-SO₃H aggregates (
7, this work). In an attempt to eliminate these aggregates, Aβ42-DJ-1 complex accumulates in autophagosomes (
8). Because the autophagy-lysosomal system is unable to clear these aggregates efficiently, the autophagosomes accumulate [
31]. This may contribute to impairment of the autophagy-lysosomal pathway (
9) and, over time, cell death.
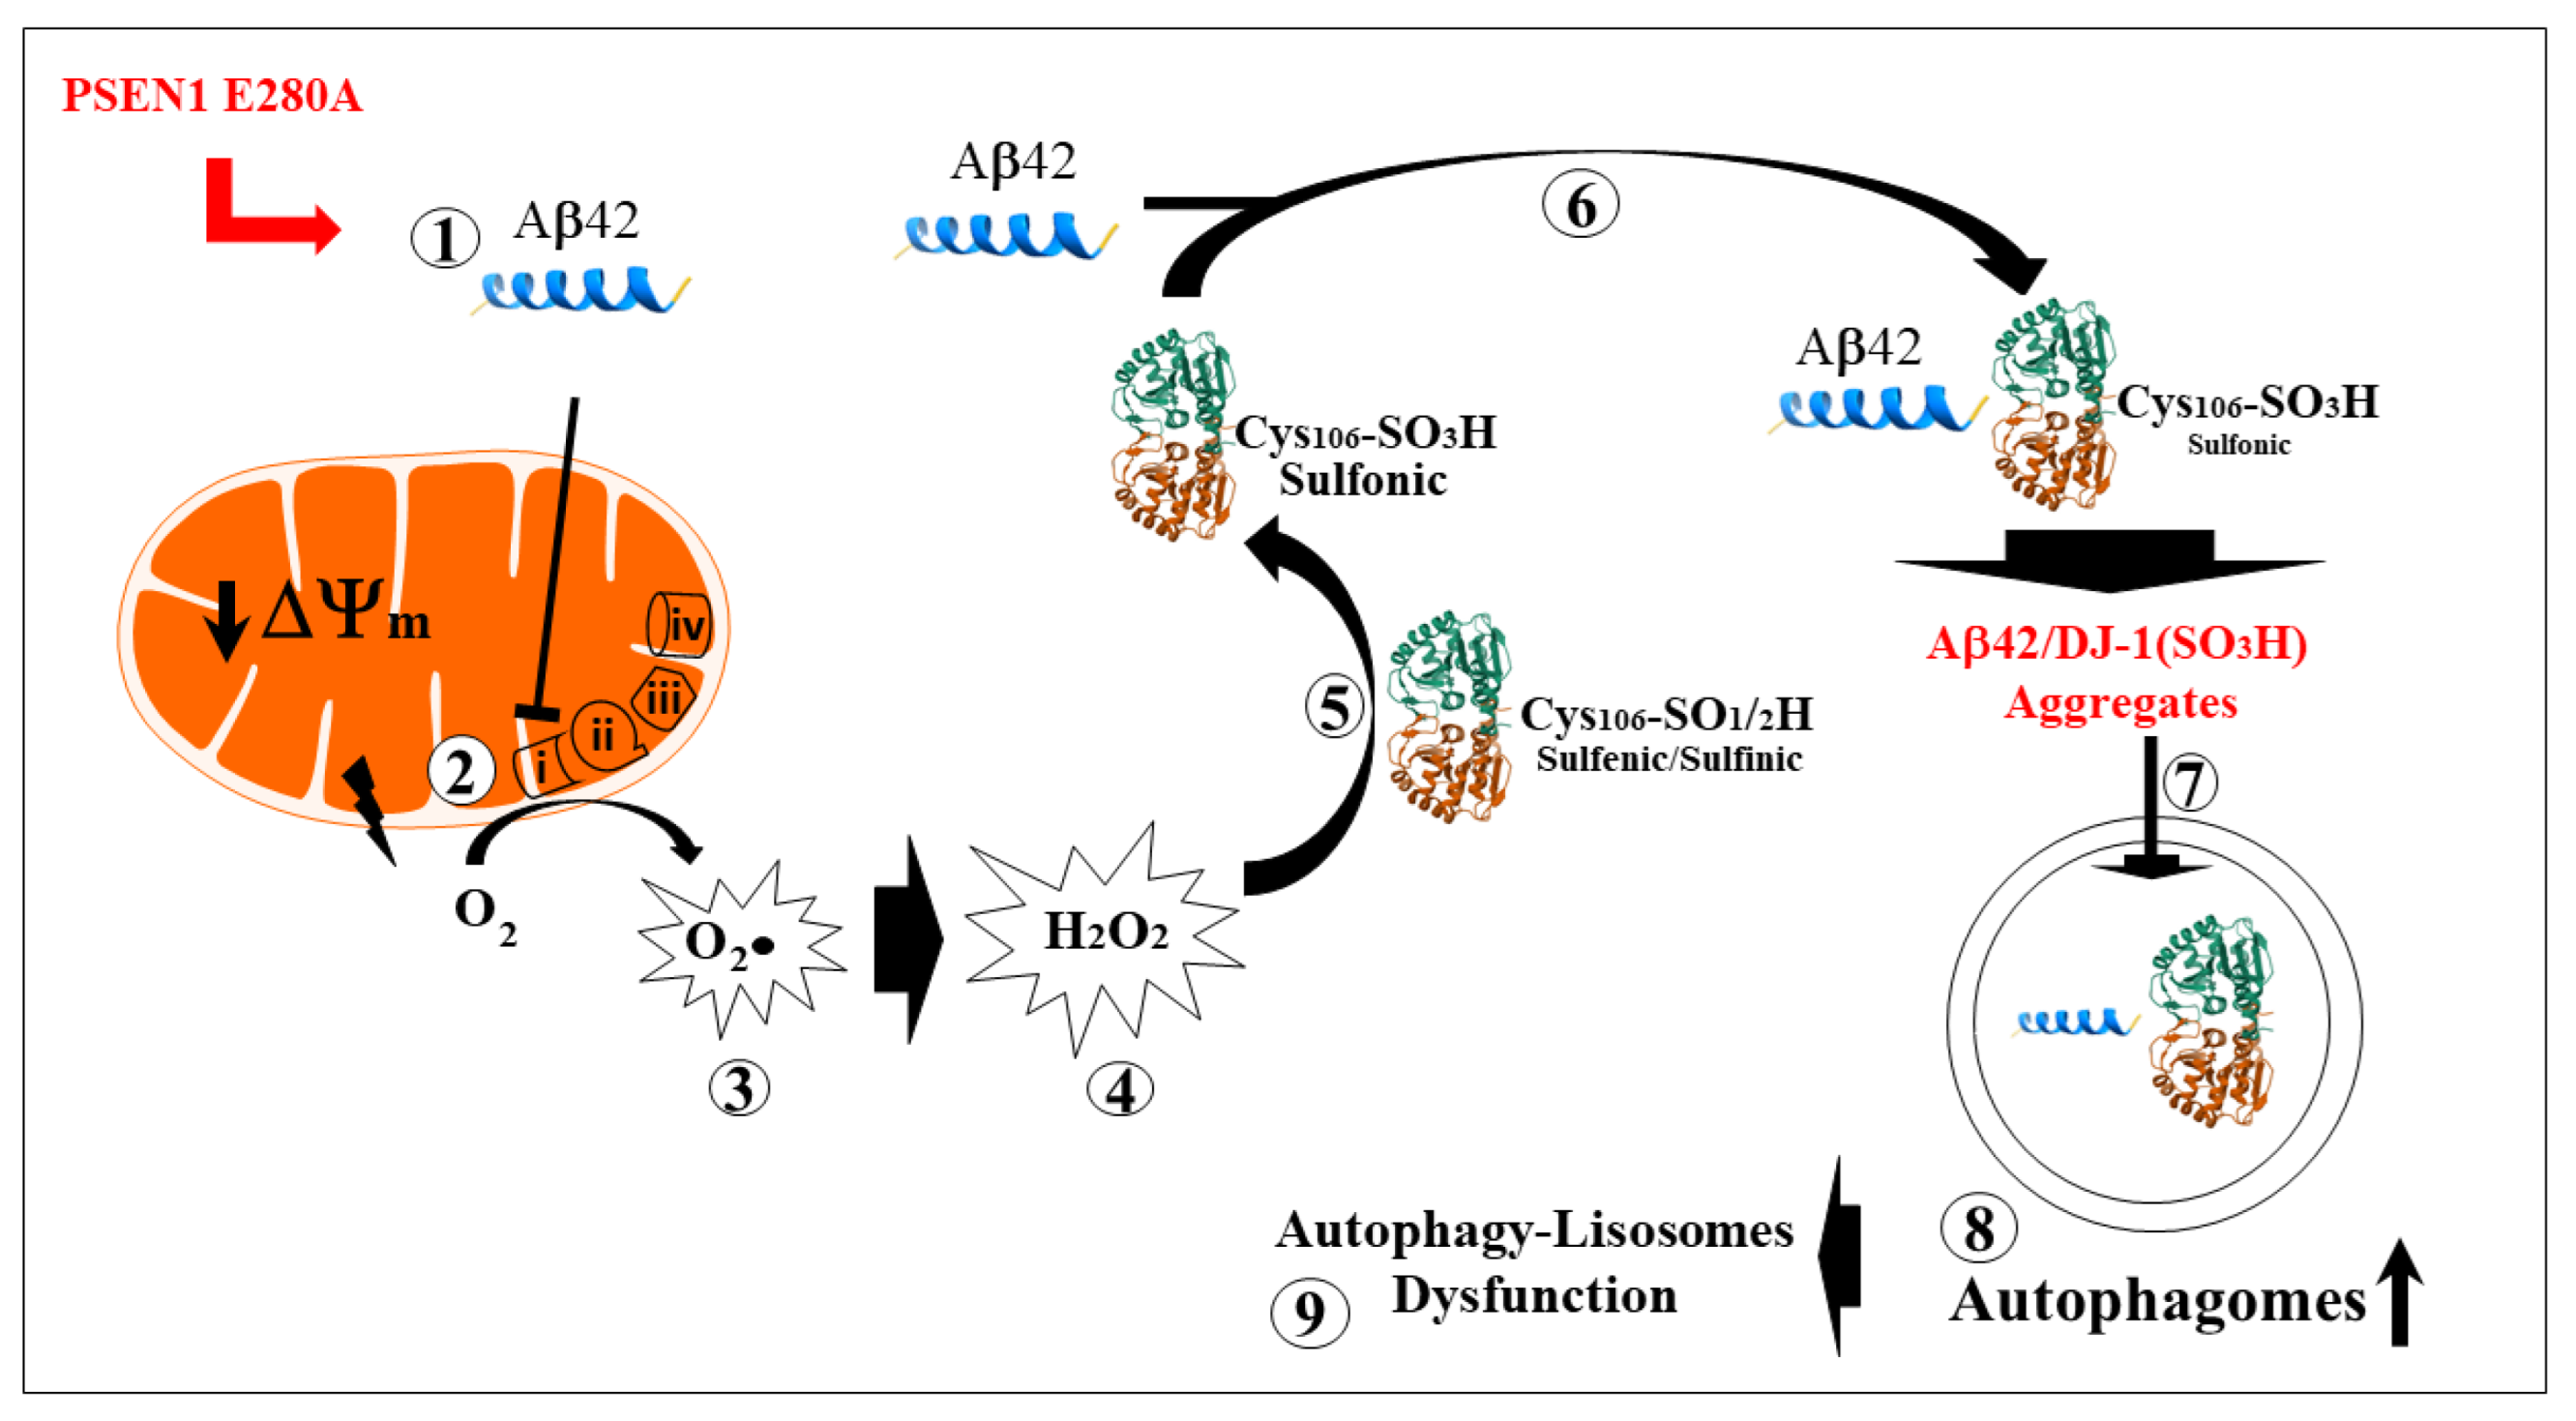
Table 1.
In silico molecular docking analysis of Aβ42 (synthetized with AlphaFold2), Sulfenic (PDB: 4p34), Sulfinic (PDB: 1soa), and Sulfonic (PDB: 3bwe, aggregated) DJ-1 according to HDOCK Server. Abbreviations: RMSD, root mean square deviation.
Table 1.
In silico molecular docking analysis of Aβ42 (synthetized with AlphaFold2), Sulfenic (PDB: 4p34), Sulfinic (PDB: 1soa), and Sulfonic (PDB: 3bwe, aggregated) DJ-1 according to HDOCK Server. Abbreviations: RMSD, root mean square deviation.
Sulfenic DJ-1
(PDB:4p34)
|
Sulfinic DJ-1
(PDB: 1soa)
|
Sulfonic DJ-1 (aggregated)
(PDB: 3bwe)
|
Rank 1
Docking Score -195.81
Confidence Score 0.7143
Ligand RMSD (Å) 46.53 |
Rank 1
Docking Score -203.03
Confidence Score 0.7428
Ligand RMSD (Å) 57.22 |
Rank 1
Docking Score -228.94
Confidence Score 0.8290
Ligand RMSD (Å) 55.45
|
# Receptor-ligand interface residue pair(s):
10A - 6A 4.346
19A - 6A 4.299
20A - 6A 4.622
23A - 6A 3.948
23A - 8A 3.013
24A - 8A 3.794
24A - 10A 3.362
27A - 6A 4.357
27A - 8A 2.804
27A - 9A 4.734
27A - 10A 4.287
28A - 10A 2.819
28A - 12A 3.467
28A - 14A 3.985
29A - 14A 4.540
35A - 6A 3.233
43A - 2A 2.628
50A - 4A 4.620
51A - 1A 3.923
51A - 2A 3.984
51A - 3A 3.947
51A - 4A 2.667
51A - 5A 4.470
52A - 4A 3.056
52A - 5A 4.684
52A - 6A 2.027
53A - 2A 4.128
53A - 3A 4.738
53A - 4A 3.229
53A - 5A 3.217
53A - 6A 3.879
55A - 6A 4.663
176A - 16A 4.862
177A - 14A 3.654
180A - 14A 3.227
180A - 16A 4.505
181A - 14A 3.030
183A - 35A 4.276
183A - 36A 3.129
183A - 37A 2.898
184A - 36A 3.513
184A - 37A 4.304
186A - 37A 3.375
|
# Receptor-ligand interface residue pair(s):
15A - 14A 4.879
16A - 14A 2.546
17A - 12A 4.611
17A - 14A 3.218
20A - 36A 4.581
23A - 35A 4.561
23A - 37A 4.079
24A - 36A 3.589
24A - 37A 2.763
24A - 38A 4.702
25A - 37A 4.974
27A - 35A 3.330
27A - 37A 2.510
27A - 38A 4.167
27A - 39A 3.233
28A - 37A 3.705
32A - 41A 4.286
35A - 35A 3.981
43A - 19A 4.337
49A - 16A 3.007
50A - 14A 2.902
50A - 15A 4.585
50A - 16A 3.969
50A - 17A 4.890
51A - 16A 2.594
51A - 17A 2.518
51A - 18A 4.384
52A - 17A 4.577
52A - 35A 3.863
53A - 17A 4.955
53A - 19A 3.666
53A - 35A 2.906
54A - 35A 4.366
55A - 35A 3.855
145A - 6A 3.860
145A - 8A 4.942
159A - 8A 4.745
162A - 10A 3.385
185A - 10A 2.484
186A - 10A 3.138
187A - 10A 3.307
188A - 4A 3.685
188A - 5A 2.875
188A - 6A 4.524
188A - 7A 2.336 |
# Receptor-ligand interface residue pair(s):
459C - 28A 4.523
480C - 34A 3.873
481C - 31A 4.885
483C - 34A 4.134
483C - 40A 4.263
484C - 31A 3.222
484C - 32A 2.234
484C - 33A 3.308
484C - 34A 3.539
484C - 40A 4.888
484C - 42A 4.769
485C - 31A 4.524
485C - 32A 4.720
485C - 42A 4.433
486C - 32A 4.082
486C - 42A 3.537
489C - 41A 4.013
489C - 42A 3.431
513C - 38A 2.959
513C - 39A 3.341
514C - 34A 4.620
514C - 39A 3.644
514C - 40A 2.518
514C - 41A 4.176
515C - 40A 4.404
516C - 39A 4.090
516C - 41A 3.567
519C - 39A 4.988
532C - 38A 4.257
535C - 37A 2.320
535C - 38A 3.457
538C - 39A 4.369
944E - 16A 3.351
945E - 12A 3.080
945E - 13A 3.850
945E - 14A 4.000
958E - 11A 4.961
959E - 11A 3.619
959E - 13A 4.179
960E - 13A 4.972
961E - 13A 4.961
962E - 11A 4.542
962E - 13A 2.584
963E - 12A 4.458
963E - 13A 2.822
963E - 14A 3.253
963E - 15A 4.058
966E - 15A 2.898
967E - 15A 4.795
982E - 15A 3.787
987E - 11A 4.478
987E - 13A 3.121
988E - 10A 3.976
988E - 11A 2.251
988E - 12A 2.977
988E - 13A 3.568
989E - 11A 4.919
989E - 13A 3.650
989E - 36A 3.876
1145F - 9A 4.393
1145F - 10A 3.298
1145F - 11A 3.206
1146F - 7A 4.489
1148F - 3A 3.615
1149F - 3A 4.950
1150F - 3A 3.420
1159F - 11A 3.634
1159F - 13A 4.968
1162F - 11A 3.490
1163F - 7A 4.202
1163F - 9A 2.380
1163F - 10A 3.867
1163F - 11A 3.638
1166F - 7A 4.566
1167F - 7A 3.239
1170F - 5A 2.632
1170F - 6A 3.503
1170F - 7A 4.109
1171F - 5A 4.242
1174F - 5A 3.650
1175F - 5A 4.306
1175F - 6A 4.137
1182F - 8A 3.585
1182F - 9A 4.474
1187F - 11A 3.026
1188F - 10A 3.195
1188F - 11A 4.233
1188F - 12A 1.940
1188F - 13A 3.895
1188F - 14A 4.424 |