
Submitted:
18 November 2025
Posted:
20 November 2025
You are already at the latest version
Abstract
Ti-6Al-4V(Ti64), widely used in aerospace structures for its high specific strength and corrosion resistance, is increasingly produced by additive manufacturing (AM) to enhance material efficiency and design flexibility. However, its fatigue performance remains highly variable due to process-induced microstructural heterogeneities and inherent defects. Since aerospace components are designed under damage-tolerant principles, understanding fatigue crack growth (FCG) behavior in AM Ti64 is essential for reliable life prediction. This short review critically examines FCG in Ti64, focusing on the influence of build orientation, processing routes, heat treatment, mean stress, defects, and environmental conditions. These factors, through their effect on the microstructure, govern crack propagation. Achieving consistent and predictable FCG behavior requires standardized test reporting, high-resolution microstructural and defect characterization, and data-driven approaches, that link processing, microstructure, and mechanical response. To complement this mechanistic perspective, a meta-analysis of 67 studies was conducted to assess how FCG research in AM Ti64 is reported. The results showed that only 66 percent of studies included details on manufacturing processes and specimen preparation, and just 68 percent documented feedstock characteristics and material properties, whereas 99 percent reported testing conditions. These gaps highlight the need for more consistent and harmonized reporting. To address this, a reporting benchmark grounded in established testing standards and domain expertise is proposed. Such standardization will enhance reproducibility, enable meaningful data comparisons, and advance data-driven FCG research in AM.
Keywords:
Ti-6Al-4V
; Additive Manufacturing
; Fatigue Crack Growth
; Fracture Mechanics
; Damage Tolerance
1. Introduction
Titanium alloys are extensively used in aerospace structures where fatigue performance is critical, owing to their high strength-to-weight ratio, low density, and excellent corrosion resistance [1]. Among them, Ti-6Al-4V (Ti64) is the most widely employed alloy, offering an optimal balance of strength and ductility that enables reliable performance under demanding operating conditions and high temperatures [1,2,3]. Despite these advantages, Ti64 poses significant challenges during machining due to its low thermal conductivity, high chemical reactivity with cutting tools, and pronounced work-hardening tendency [4,5]. These factors contribute to rapid tool wear, making the conventional manufacturing of complex geometries both costly and inefficient [6].
Additive manufacturing (AM) has emerged as a transformative approach for producing complex Ti64 components with high material efficiency and reduced lead times [7]. By constructing parts layer by layer through laser or electron beam melting of metal powder or wire, AM streamlines production, eliminating several stages inherent to conventional manufacturing while maintaining structural integrity for critical applications. According to ASTM standard F2792-12 [8], metal AM technologies are classified based on feedstock type and interlayer bonding mechanisms into powder bed fusion (PBF), directed energy deposition (DED), sheet lamination, binder jetting, and material extrusion [9]. PBF and DED are the predominant AM techniques for fabricating Ti64 parts. PBF employs a high energy source such as a laser, electron beam, or plasma arc to selectively melt and fuse pre-spread powder along toolpaths derived from CAD models. After each layer is completed, a recoater distributes a new powder layer for the subsequent scan, enabling the production of complex, near-net-shape components with high dimensional precision. In contrast, DED uses a focused heat source (laser, electron beam, or electric arc) to simultaneously deposit and melt feedstock, typically powder or wire, through a multi axis nozzle. Unlike PBF, which melts stationary powder beds, DED melts material during deposition while the build platform remains fixed and the deposition head moves according to CAD/CAM-defined toolpaths. Detailed operational principles of both PBF and DED are well documented in the literature [7,9,10,11,12] and are therefore not the focus of this review. With the increasing use of AM components in dynamic load-bearing applications, a thorough understanding of the mechanical behavior of AM Ti64 under static and cyclic loading is essential to ensure structural integrity and reliable performance.
Fatigue resistance is a crucial property for structural materials, as nearly 90% of component failures in engineering applications are attributed to fatigue [13]. Fatigue failure generally occurs in three stages: crack initiation, crack propagation, and final fracture. Under cyclic loading, localized plastic deformation develops at the surface, particularly near defects or microstructural irregularities, creating stress concentration zones. When the cyclic stress exceeds the fatigue limit, microcracks form and propagate, driven by these stress concentrations and the localized plasticity at the crack tip. Crack growth rates and paths are influenced by factors such as crystal structure, internal flaws, and dominant deformation mechanisms, including dislocation motion and slip [14,15,16].
In aerospace applications, component certification typically follows a damage-tolerant approach, which assumes the presence of flaws while ensuring structural integrity through strategies that allow their detection and management during scheduled inspections. This approach is particularly important for AM components, where inherent defects such as pores and lack-of-fusion regions act as stress concentrators and can accelerate crack initiation. Damage-tolerant design focuses on controlling crack growth rather than preventing its initiation, recognizing that fatigue cracks are inevitable and must be managed before reaching a critical size capable of causing failure. Comprehensive fatigue crack growth (FCG) data are therefore essential for establishing damage-tolerant design criteria, especially in safety-critical aerospace components. When combined with non-destructive inspection (NDI) or non-destructive testing (NDT) techniques, these data enable engineers to predict remaining life and establish inspection intervals that keep cracks below critical dimensions. Fracture mechanics models are commonly used to estimate the number of loading cycles or service time required for a detectable flaw to reach a critical size. The initial flaw size is typically set by the detection limit of the NDT method, assuming the largest undetectable crack exists. Factors such as limited accessibility, surface roughness, and microstructural heterogeneity can reduce NDT reliability, particularly in AM components [17].
FCG data for Ti64 provide insights into crack propagation that are not captured by traditional stress-life or strain-life data, which primarily capture crack initiation. This distinction is important for service-critical aerospace components, where internal flaws and stress concentrators are often unavoidable. In such applications, FCG data underpin life prediction, inspection scheduling, and failure prevention. Regulatory standards require that cracks remain below critical sizes between inspections, making experimentally derived FCG rates and flaw-size estimates essential for accurate life assessments. However, most fatigue studies on AM Ti64 focus on uniaxial performance without clearly distinguishing between initiation and propagation phases. This highlights the need for targeted FCG investigations to ensure the structural reliability of AM components.
This review critically examines FCG studies on AM Ti64 reported in the scientific literature and evaluates the key factors influencing FCG behavior across different AM processes. Although several reviews have examined the fatigue behavior of AM Ti64 [2,3,10,18,19,20,21,22,23,24,25,26], most have focused primarily on stress- or strain-life fatigue [2,3,10,23,24,25,26], ], with only a few [18,19,20,21,22] addressing FCG in detail. Those that did often provided broad overviews focused on AM metals in general rather than Ti64 specifically. While Ti64 exhibits the characteristic FCG behavior seen in metallic alloys, the mechanisms governing its crack growth response depend strongly on the processing route and the resulting microstructure unique to this alloy. As a result, the depth of analysis devoted specifically to FCG behavior has remained limited. The present review addresses this gap by focusing exclusively on FCG in AM Ti64, a critical yet less thoroughly reviewed aspect of fatigue performance. To ensure methodological consistency and comparability, only ASTM E647-compliant FCG data are considered, specifically those obtained through compliance and direct current potential drop techniques for both short and long cracks. Studies that report data derived from 2D or 3D tomography reconstructions or from fracture surface striation measurements using an scanning electron microscope (SEM) e.g., [27]) are excluded. This review also addresses the gap observed when compiling and evaluating FCG data from the literature by proposing a reporting benchmark. To enhance reliability and support cross-study comparability, it provides guidelines for assessing reported FCG results and improving consistency in AM FCG research. The objectives of this review are twofold: (1) to critically examine the key factors that influence FCG behavior in AM Ti64, including build orientation, processing route, post-processing treatments, residual stress, defects, mean stress, and environmental conditions; and (2) to provide a consolidated and interpretable assessment of existing FCG data across published studies.
2. Microstructure of AM Ti64
The mechanical behavior of Ti64 is governed by its microstructure, including grain morphology, phase distribution, precipitates, defects, and boundary features, all of which reflect the alloy’s thermal processing history. At room temperature, Ti64 retains a dual α+β constitution, with hcp α (stabilized by ≈6 wt.% Al) and bcc β (stabilized by ≈4 wt.% V) phases [28]. This α+β balance imparts Ti64 with high strength, good ductility, excellent corrosion resistance, and weldability, making it a versatile structural alloy.
In AM of Ti64, localized energy input, steep thermal gradients, and rapid non-equilibrium solidification produce highly variable thermal histories that are strongly influenced by process parameters, part geometry, and component size [29,30,31]. Selective laser melting (SLM) uses a focused laser to locally melt powder, resulting in cooling rates of 105–106 K/s [7] that favor the formation of fine acicular α′ martensite. EBM, by contrast, scans preheated powder with an electron beam in a vacuum, and the lower cooling rates of about ~10⁴ K/s [7], combined with tempering from the hot build chamber, allow partial α′ decomposition to yield a mixed α+β microstructure. DED involves cyclic heating and cooling as material is deposited layer by layer, producing α′ martensite in the as-built state during to its high cooling rate of 104–106 K/s[32], unless substrate preheating moderates the cooling rate. In DED, heat flow is primarily governed by conduction into the baseplate and convection to the shielding gas [29,30,31]. Figure 1 [29] presents optical micrographs of the α/α′ microstructures within prior β grains in Ti64 fabricated by DED, SLM, and EBM, with wrought material included for comparison. In these images, the α and α′ phases appear bright, while the β phase appears dark. As-built DED and SLM (Figure 1a–b) display fine, needle-shaped α′, reflecting the rapid cooling rates that suppress diffusion and stabilize this metastable phase. In EBM (Figure 1c), slower cooling and chamber tempering produce a fine α+β dual-phase morphology by partial decomposition of α′ into equilibrium α and retained β. Annealed DED (Figure 1d) and wrought Ti64 (Figure 1e–f) show coarser, equiaxed α grains and lamellar α+β colonies, illustrating how thermomechanical and post-build heat treatments promote uniform phase distribution.
In the microstructure of AM Ti64, aluminum stabilizes the α phase and vanadium stabilizes the β phase. Ti64 retains a dual α+β phase at room temperature, with phase transformations strongly influenced by the temperature history and cooling rates during the AM process [29]. Depending on the peak temperatures and cooling rates during AM and subsequent post-processing, Ti64 can form equiaxed, lamellar, bimodal, or martensitic microstructures, as shown in Figure 1. Equiaxed α grains in a transformed β matrix (Figure 1f) develop when cooling occurs within the α+β field at ≈930–970 °C [33]. Lamellar morphologies form during slower cooling from the β field at ≈995–1010 °C and consist of plate-like α laths within prior β grains. Bimodal microstructures (Figure 1e) combine equiaxed primary α grains with lamellar α in a β matrix to balance ductility and strength. Rapid quenching or AM solidification yields acicular α′ martensite, which typically requires tempering or annealing to decompose into stable α+β and optimize properties [23].
In their as-built state, AM Ti64 parts typically exhibit columnar prior-β grains elongated along the build direction, as shown in Figure 2 [34]. These microstructural features generally result from rapid solidification above the β transus temperature, where the alloy transforms completely from the α + β phase mixture to a single β phase [21]. SLM specimens (Figure 2a–b) feature extremely fine α′ laths within these columnar grains and contain small spherical pores. EBM builds (Figure 2c–d) likewise exhibit epitaxial prior-β columnar grains but host Widmanstätten-type α platelets and rod-shaped β phases arranged in basket-weave or colony morphologies. This pronounced texture and anisotropy can compromise fatigue resistance by providing easy crack paths along grain boundaries [29].
Post-build heat treatments are commonly applied to convert the anisotropic, columnar grain structure into a more equiaxed one, as seen in parts produced by isothermal forging (Figure 2e–f). These treatments can also dissolve unwanted phases and promote the formation of strengthening precipitates, thereby improving isotropy and overall mechanical performance. Based on the literature [35,36,37], five primary heat-treatment strategies are widely used:
- (a)
- Stress relieving (480-800 °C): Stress-relieving treatments reduces residual stresses in the AM build while causing minimal coarsening of the α′ martensite. It increases ductility and dimensional stability while largely preserving the as-built microstructural features [38].
- (b)
- Super-transus heat treatment (β-annealing): In this heat treatment procedure, Ti64 is heated 20–200 °C above its β-transus temperature (995 °C [29,35,39]) to fully convert the microstructure to the β phase. Controlled cooling then produces equiaxed, recrystallized prior-β grains, reducing build-direction texture and improving mechanical isotropy[35].
- (c)
- Sub-transus treatment (recrystallization annealing): Heating Ti64 to ~800–950 °C (within the α+β two-phase field) [40] triggers recrystallization of both hcp α and bcc β grains. Controlled soak times and cooling rates refine grain size, adjust α/β phase fractions, and enable a tailored balance of strength and ductility.
- (d)
- Solution treatment and aging (STA): Solution treatment is conducted just below or above the β-transus (995 °C) to dissolve metastable α′ and homogenize the β matrix. After quenching or air cooling, aging at 400–750 °C precipitates fine α phases, which strengthen the alloy while retaining ductility [38].
- (e)
- Hot isostatic pressing (HIP) (800–1200 °C, 100–200 MPa): HIP closes internal pores and homogenizes the microstructure in AM Ti64 [41]. It is classified into super-transus HIP (1000–1200 °C) and sub-transus HIP (800–950 °C), with further distinctions based on pressure, hold time, and cooling rate, each influencing the microstructure and mechanical behavior.
The careful selection and combination of these heat treatment strategies can significantly improve the microstructural uniformity, mechanical isotropy, and overall FCG performance of AM Ti64.
3. FCG Behavior of AM Ti64
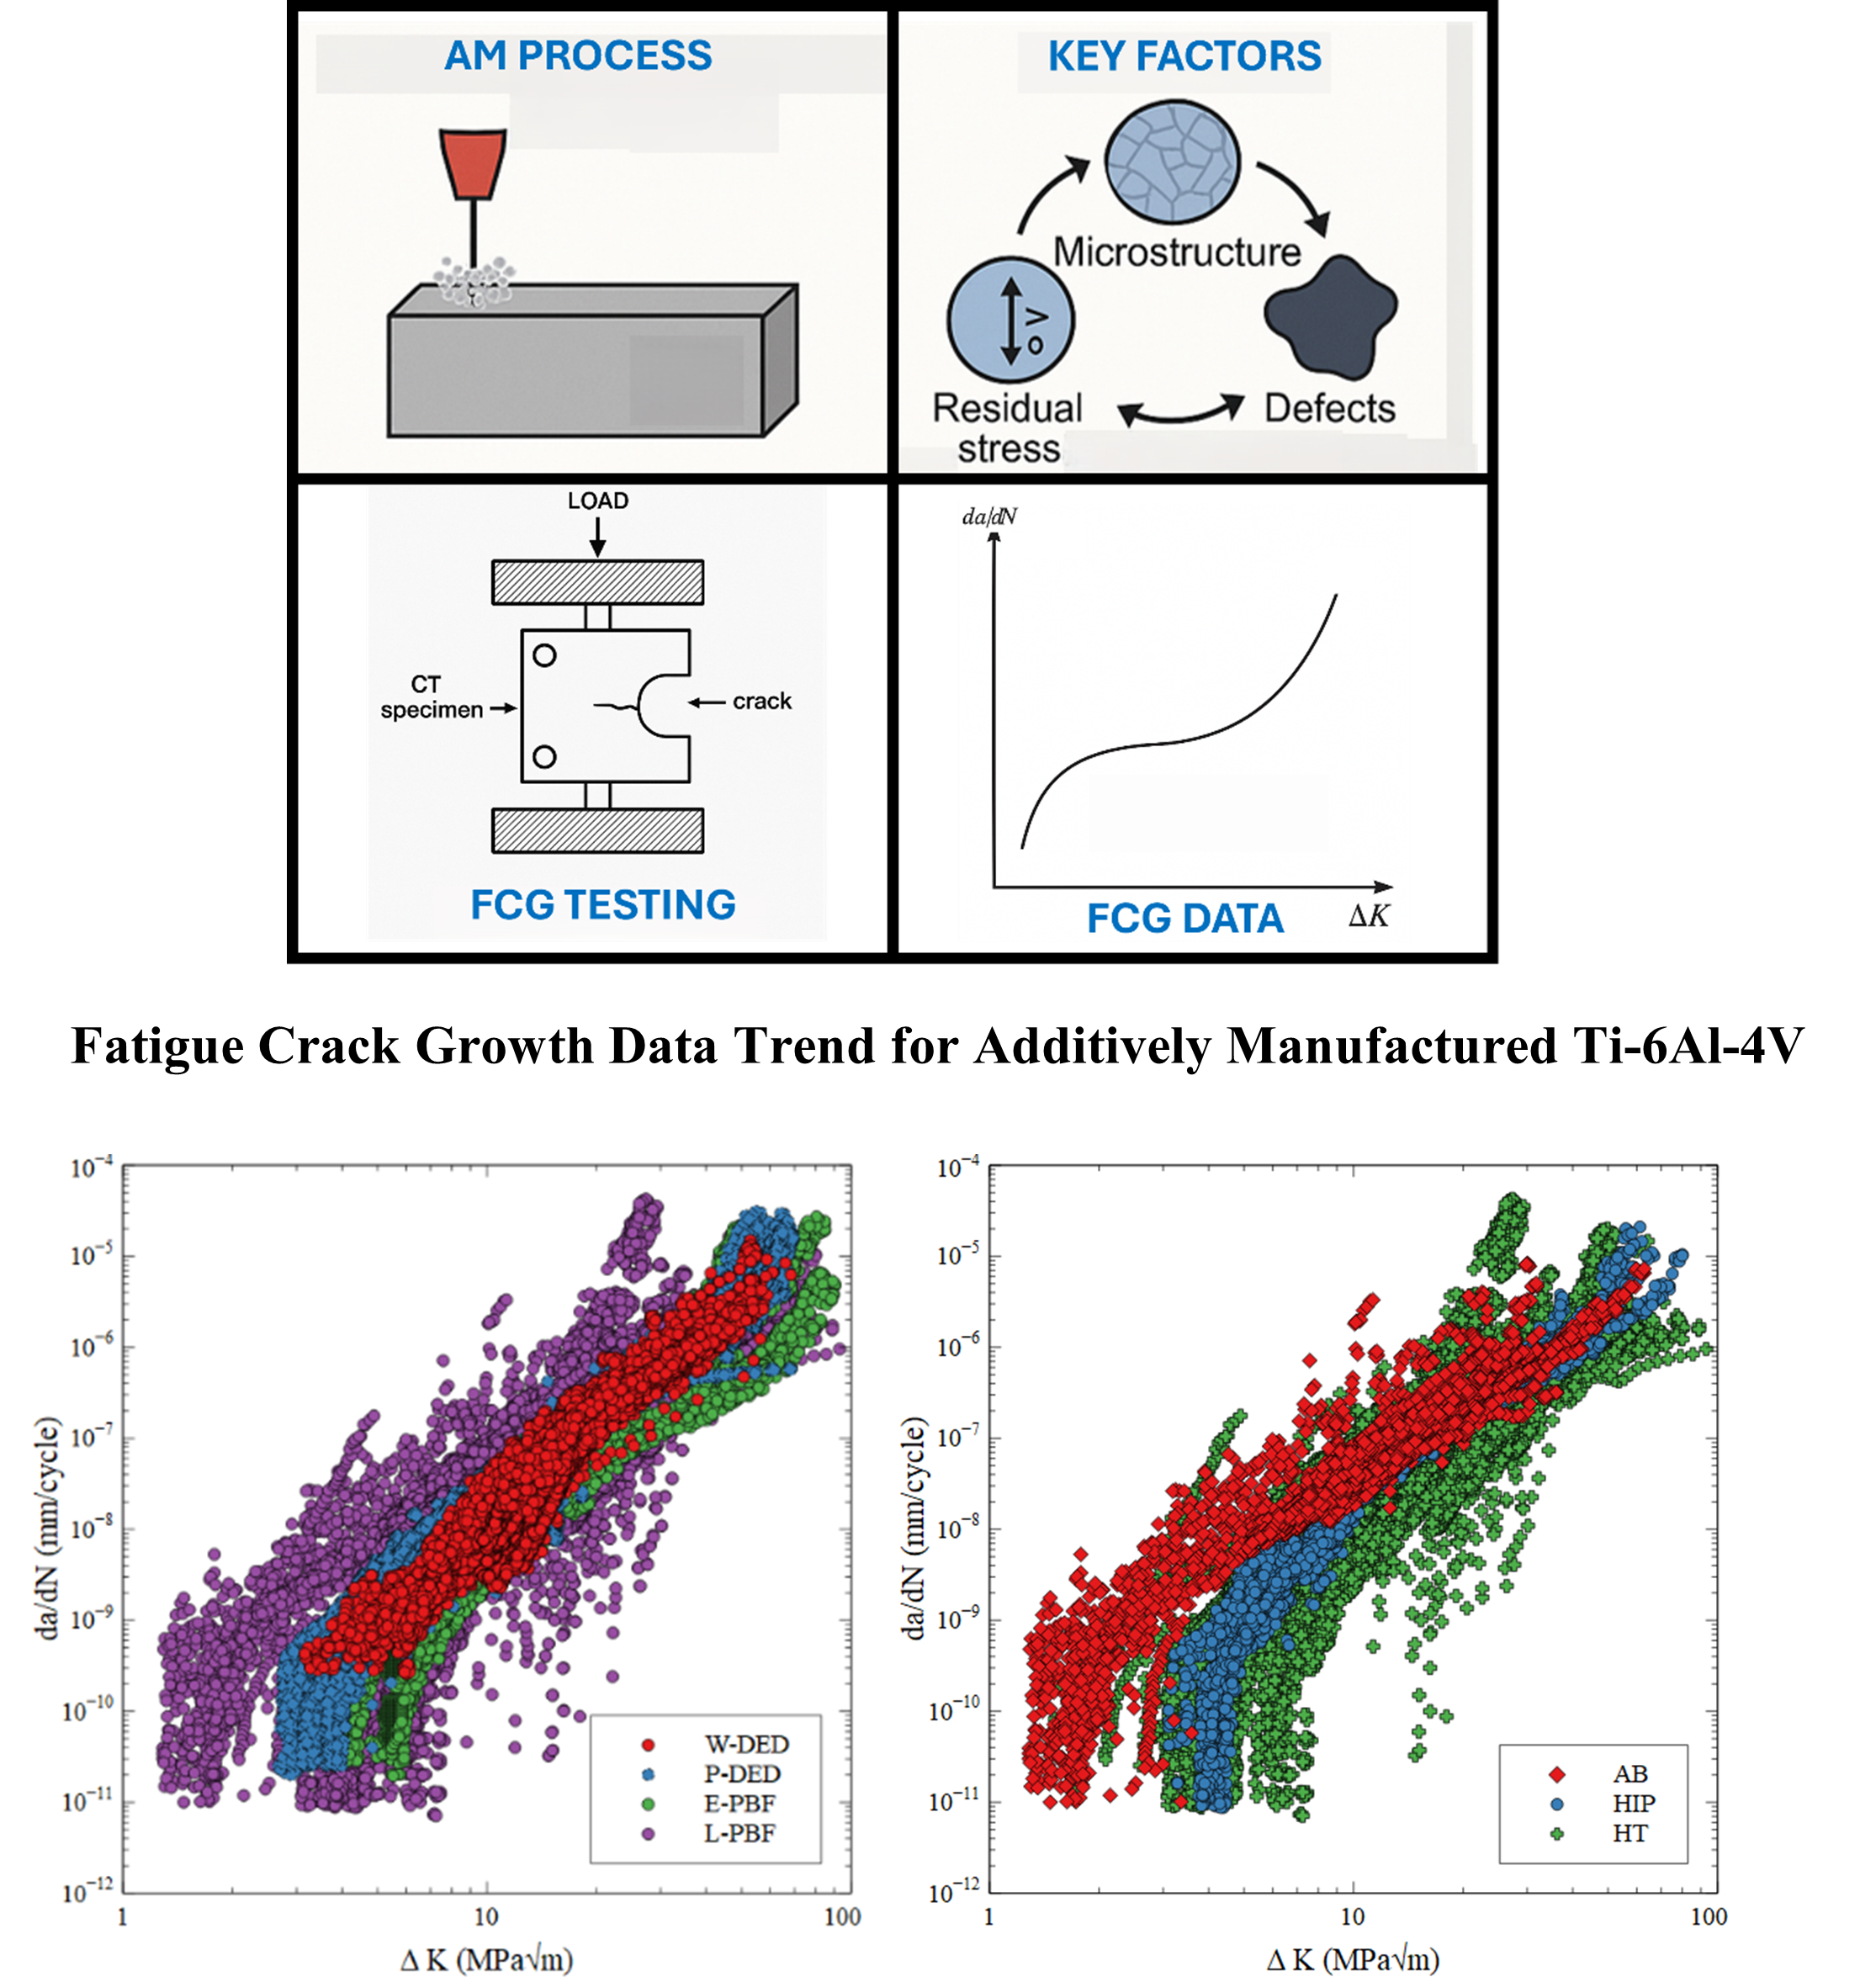
Most FCG studies on AM Ti64 follow ASTM E647 [42]. Accurately characterizing FCG resistance is challenging due to sensitivity to process parameters (scan speed, laser power, wire feed speed, hatch spacing), feedstock quality, build orientation, residual stresses, specimen geometry, heat treatment, surface finish, and defects [43]. This section reviews these factors and their combined effects, with studies summarized in Table 1. This review surveyed FCG studies across multiple length scales (Figure 3a), emphasizing long crack growth due to extensive literature coverage. FCG behavior is characterized by the relationship between crack growth rate per cycle (da/dN) and stress intensity factor range (ΔK), typically plotted on a log-log scale producing a sigmoidal curve (Figure 3b).
The curve has three distinct regions: Region I (Near-threshold) has extremely small crack growth rates (often less lattice spacing), with the lower bound defining the fatigue threshold (ΔKₜₕ) below which no measurable growth occurs. Region II (Steady-state) shows a linear (da/dN)-(ΔK) relationship described by Paris law: da/dN = C(ΔK)m, where higher m indicates greater ΔK sensitivity and higher C means faster growth at given ΔK; FCG here is relatively microstructure-insensitive, enabling cross-process comparison. Region III (Fast-fracture) exhibits dramatically increasing FCG rates leading to catastrophic failure. Behavior in Regions I and III is strongly influenced by microstructure, residual stresses, and deformation mechanisms. Key parameters (ΔKₜₕ, m, C) are compiled in Table S1 of the supplementary material. A leftward FCG curve shift indicates reduced resistance: lower ΔKₜₕ and higher da/dN at lower ΔK.
3.1. Build Orientation
Build orientation refers to the angular position of a component within the AM machine coordinate system, defining how its geometry is aligned relative to the layer stacking or build direction. It plays a crucial role in influencing FCG behavior in AM Ti64 by inducing microstructural anisotropy. The alignment of β grains along the build direction, determined by thermal gradients resulting from the part geometry and scanning strategy [41], together with the effects of porosity and interlayer interfaces, collectively governs crack initiation paths and growth rates. In the reviewed studies, compact tension (C(T)) and related specimens were fabricated according to predefined build layouts (Figure 4) and were either produced as near-net-shape parts or built as oversized blanks that were subsequently machined to final dimensions. Systematic evaluation of build orientation effects on FCG is enabled by varying the notch orientation relative to the build direction. As defined by ISO/ASTM 17295:2023(E) [31] and illustrated in Figure 4, specimen orientations are categorized according to notch alignment: vertical (notch parallel to the build direction), horizontal (notch perpendicular to the build direction and parallel to the scan direction), transverse (notch perpendicular to both the build and scan directions), diagonal (notch at 45° to the build direction), and off-axis (notch at any other angle). These distinctions are essential for isolating how build-induced anisotropy and microstructural features affect FCG in AM Ti64. Unless otherwise noted, all referenced studies use C(T) specimens. Comparative analyses typically evaluate FCG trends among horizontal, vertical, diagonal, and off-axis specimens and often compare AM specimens to conventionally manufactured Ti64.
Although the impact of build orientation on the FCG behavior of AM Ti64 has been examined both independently and alongside other factors, the literature presents no clear trend. Many studies [43,46,51,67,68,86,100] report no consistent trend, suggesting that build orientation may not significantly affect FCG properties under certain conditions. In contrast, other investigations [49,55,66,78,81,95,96,97,104] indicate that particular build orientations can enhance FCG resistance, likely due to orientation-induced variations in microstructure and residual stress distributions influencing FCG behavior. These divergent findings highlight that the influence of build orientation on the FCG behavior of AM Ti64 remains ambiguous. A summary of key findings from the literature is provided below to illustrate differing perspectives on the influence of build orientation on FCG behavior in AM Ti64.
The first group of studies reports negligible effects, indicating that FCG properties can be largely insensitive to build orientation under specific processing and testing conditions. Edwards et al. [86] examined the effect of build orientation on FCG behavior in as-built SLM Ti64 by testing C(T) specimens in both transverse and horizontal orientations. They found only minor differences in average ΔKth and Paris law parameters between orientations, all within experimental scatter, indicating no statistically significant impact of build orientation. The authors suggested that uniformly high tensile residual stresses across all builds dominated the FCG response, outweighing any microstructural differences. Notably, considerable variability in FCG behavior was also observed within the same build orientation, likely due to inhomogeneous residual stress distributions characteristic of the SLM process. To reduce the influence of inherent residual stresses on FCG in as-built SLM Ti64, Rans et al. [43] applied stress relief heat treatment to SENT specimens produced at various build orientations (0°, 30°, 45°, 60°, and 90°; see Figure 4), with some specimens also receiving hot isostatic pressing (HIP). In contrast to Edwards et al. [86], who tested C(T) specimens, Rans et al. [43] used Single Edge Notch Tension ((SEN(T)) specimens due to their suitability for thin-walled components, ability to provide plane-stress crack tip conditions, and capacity to capture FCG data over a broader range of crack length-to-width ratios. Regardless of build orientation and post-processing condition (stress relief or HIP), they observed no significant differences in FCG rates. The authors attributed this result to the minimal effect of microstructural features, specifically the random orientation and narrow width of columnar β grains (relative to the 2 mm specimen thickness), which caused the advancing crack front to intersect multiple grains of varying orientation rather than propagating along a single grain direction. Similar observations were reported by Konečná et al. [50,100] who found that build orientation had no significant effect on the FCG behavior of stress-relieved Direct Metal Laser Sintered (DMLS) Ti64 specimens, regardless of whether they were built in horizontal, vertical, or transverse orientations. This outcome was attributed to the effective elimination of residual stresses following stress-relieving. Kim et al. [46] likewise observed that the FCG behavior of DED Ti64 was independent of build orientation (horizontal versus vertical) and material condition (as-built, α/β-annealed, or β-annealed). Even with predominantly elongated β grains, cracks did not show a preference for propagating along or across grain boundaries. These results indicate that, when residual stresses are removed or minimized, microstructural variations due to build orientation exert little influence on FCG. Collectively, these studies suggest that residual stress distributions are the primary factor governing FCG behavior in AM Ti64, while build orientation mainly affects microstructure and has a comparatively minor effect on FCG. The impact of build orientation on FCG has also been investigated using detailed analyses of crack propagation paths to determine how microstructural features and post-processing treatments, such as stress relief and HIP, influence crack trajectories. Rans et al. [43] examined fracture paths from the notch origin to the 50 mm specimen width in both stress-relieved and HIP SENT specimens (Figure 5). They observed that cracks predominantly followed the notch plane, with modest deviations occurring only at the 30° and 45° orientations during the final stages of crack growth. No significant differences in crack path behavior were found between stress-relieved and HIP specimens. These findings indicate that reducing porosity through HIP had little effect on FCG, likely because the initial porosity in stress-relieved specimens was already low (~0.50%) and did not substantially affect crack growth.
A second group of studies [49,55,57,60,61,66,73,78,81,87,95,97,105] has shown that build orientation can significantly influence on FCG behavior, with certain build orientations demonstrating superior performance. These differences in FCG resistance are commonly attributed to the combined effects of anisotropic microstructural features which dictate crack growth paths. In addition, non-uniform residual stress distributions across different build orientations further contribute to the observed variations in FCG behavior. Cain et al. [97] found that build orientation had a stronger effect on the FCG rate of SLM Ti64 in the as-built condition than after heat treatment, likely due to anisotropic residual stresses. In the as-built state, transverse specimens exhibited higher FCG rates than horizontal and vertical specimens. Subsequent stress relief at 650 °C for 4 h and annealing at 890 °C for 2 h enhanced FCG resistance and reduced anisotropy, leading to a reversal of this trend: horizontal and vertical specimens displayed higher FCG rates than transverse specimens. This reversal was attributed to the significant reduction of compressive residual stresses, which were initially highest in the transverse specimens, and the alleviation of tensile residual stresses, which were more pronounced in the horizontal and vertical orientations. Notably, the horizontal and vertical specimens exhibited nearly identical behavior under both conditions [97]. Leuders et al. [55] investigated the FCG behavior of as-built, heat-treated, and HIP SLM Ti64. In the as-built condition, horizontal specimens showed high variability and generally lower FCG rates compared to the reference wrought material, as shown in Figure 6(a). In contrast, vertical specimens displayed more consistent FCG behavior. The authors did not provide an explanation for this difference between build orientations. At low ΔK, vertical specimens had higher FCG rates than the wrought baseline, as shown in Figure 6(b), although this difference diminished at higher ΔK levels. No such trend was observed in the horizontal specimens, and the authors again did not comment on the origin of this directional behavior. Post-processing heat treatments (sub-transus at 800 °C, super-transus at 1050 °C, and HIP) effectively reduced the inconsistent FCG behavior observed in both horizontal and vertical specimens in the as-built condition. These treatments also decreased the FCG rate in both orientations, aligning it with that of the reference wrought Ti64. This improvement was primarily attributed to the reduction of tensile residual stresses in the as-built condition, as confirmed by residual stress measurements. Interestingly, specimens subjected to the 1050 °C super-transus heat treatment continued to exhibit irregular FCG behavior similar to that of the as-built specimens. The authors attributed this to the development of coarse lamellar microstructures, which promoted increased crack path deflection during growth. Such behavior was not observed in specimens treated at 800 °C or those processed via HIP, suggesting that microstructural characteristics governed FCG behavior after the removal of residual stresses. In summary, residual stress was identified as the primary factor governing FCG performance in SLM Ti64, while microstructural effects played a secondary role. Porosity, however, did not have a significant influence on crack propagation in the specimens examined.
Sun et al. [65,81] investigated the effect of build orientation on the FCG rate of heat-treated SLM Ti64 and found that the rate increased in the order: diagonal < horizontal < vertical. Although no direct explanation was provided, the authors analyzed the fracture morphology. Horizontal specimens exhibited smooth fracture surfaces with distinct fatigue striations, diagonal specimens showed sloped fracture surfaces along the thickness, and vertical specimens displayed cluttered fracture surfaces with visible build layers and indistinct striations. These observations suggest that the alignment of microstructural features as a result of the build layer orientation can strongly influence crack growth behavior in SLM Ti64.
The effect of build orientation on ΔKₜₕ has also been investigated. Paul et al. [95] studied the effect of build orientation on the ΔKₜₕ of stress-relieved L-PBF Ti64 at R =0.1 and found that vertical specimens exhibited slightly higher ΔKₜₕ values (2.99 MPa√m) and lower FCG rates compared to horizontal (2.79 MPa√m) and diagonal (2.74 MPa√m) specimens. This behavior was attributed to enhanced crack closure effects arising from increased fracture surface roughness and plasticity. Fractographic analysis further showed that vertical specimens had the roughest surfaces, promoting roughness-induced closure in the near-threshold regime. At ΔK levels approaching ΔKₜₕ, cracks behaved as microstructurally short cracks and became sensitive to local crystallographic orientation. Deviations from the Mode I fracture path introduced in-plane shear (Mode II), which increased surface roughness and further enhanced crack closure. Consequently, specimens with greater fracture surface roughness exhibited higher ΔKₜₕ values. These results emphasize the critical role of build orientation in controlling fatigue resistance in SLM Ti64, as it directly influences fracture surface morphology and crack closure behavior near the threshold. A similar trend was observed by Lv et al. [78] in their study of FCG behavior in as-built Ti64 fabricated via laser metal deposition (LMD), comparing horizontal and vertical specimens. Vertical specimens had lower FCG rates than horizontal ones in both the near-threshold and Paris regimes. This anisotropic behavior was primarily attributed to the microstructure, consisting of prior β columnar grains with preferential orientation and associated α colonies. Post-processing machining was also suggested to have relieved residual stresses introduced during fabrication. In horizontal specimens, fatigue cracks interacted with only one or two columnar grains, limiting FCG resistance. In contrast, cracks in vertical specimens traversed multiple columnar grains, enabling greater plastic deformation and improving FCG resistance.
Some studies have reported significant variability in FCG behavior for AM Ti64, even within the same build, with differences exceeding acceptable experimental scatter. For instance, Leuders et al. [55] found that in the as-built condition, horizontal SLM Ti64 specimens exhibited highly scattered FCG data, whereas vertical specimens showed more consistent performance. Similarly, Dhansay et al. [96] found that even after duplex annealing (950 °C for 1 hour followed by 700 °C for 2 hours and air cooling), vertical specimens remained more inconsistent than transverse specimens.
The reviewed studies indicate that variability in the effect of build orientation on FCG is largely attributable to the strong sensitivity of crack growth to process-induced characteristics. Among these, residual stresses play a dominant and interactive role, often outweighing the influence of microstructural features. Microstructural features appear to play a more pronounced role in Region I of the FCG curve, particularly affecting the ΔKₜₕ, rather than the overall FCG behavior. Moreover, AM processes often exhibit limited repeatability, as differences in machines, feedstock materials, and fabrication methods result in varying residual stress levels across studies. These factors collectively complicate the direct comparison of FCG behavior in AM Ti64.
3.2. Mean Stress Effect
Mean stress is a critical parameter affecting FCG, primarily because of its impact on crack closure behavior and ΔKₜₕ [106,107]. In studies on AM Ti64 alloys, it is generally observed that higher stress ratios accelerate the rate of FCG, shifting the FCG curves to the left [59,60,64,75,80,95,101,106,107]. Conversely, lower stress ratios promote crack closure, while higher stress ratios reduce closure and lead to faster FCG [108]. In the context of AM alloys, these trends are further complicated by process-induced defects and residual stresses, emphasizing the importance of carefully considering mean stress effects to ensure reliable component design. Paul et al. [95] investigated the effect of stress ratio on the FCG behavior of stress-relieved L-PBF Ti64. As shown in Figure 7, increasing stress ratio led to higher FCG rates and lower ΔKₜₕ, independent of build orientation (horizontal, vertical, or diagonal). This pattern was attributed to reduced crack closure effects. Figure 7(d) summarized ΔKₜₕ values across orientations and stress ratios. The systematic increase in FCG rate with stress ratio is evidenced by the leftward shift of FCG curves to lower ΔK values in Figure 7(a–c). The observed decrease in ΔKₜₕ with increasing stress ratio results from changes in crack closure: at low stress ratios, partial crack closure during the load cycle reduces the effective stress intensity range (ΔKₑff), thereby increasing the apparent ΔKₜₕ. As stress ratio increases, Kₘᵢₙ becomes sufficient to keep the crack open throughout the cycle, minimizing closure and increasing ΔKₑff. This promotes crack growth and lowers the observed ΔKₜₕ, demonstrating the diminished influence of crack closure at higher stress ratios [95].
Ren et al. [75] studied the FCG behavior of solution- and aging-treated Ti64 fabricated by laser-(L)-DED. Tests on horizontal specimens at stress ratio, R = 0.1, 0.3, 0.5, and 0.8 demonstrated that FCG rate increased with stress ratio, regardless of scan speed during fabrication. At R = 0.1, specimens produced at 900 mm/min (V900) and 1500 mm/min (V1500) exhibited a bilinear FCG rate relationship, highlighting strong microstructural sensitivity. At higher stress ratios, this transition point was not observed, indicating reduced microstructural influence under higher loading. As shown in Figure 8, microstructural effects were significant in the initiation and near-threshold regions, but minimal in the steady-state growth region. Based on fitting curves, for ΔK between 18–40 MPa√m, V1500 specimens showed lower FCG rates than V900; beyond 40 MPa√m, the rates converged. The transition point identified marks the change from microstructure-sensitive to microstructure-insensitive FCG behavior.
This transition behavior was also observed by Ye et al. [67] in their study on the post-processing effects in LMD Ti64. They reported that FCG rate is highly microstructure-dependent when ΔK is below a transition point. In the hypo-transitional region, FCG rate exhibited strong directional sensitivity, especially in as-built material, while above the transition point (the hyper-transitional region), no significant directional effect was noted. The transition points were identified at 13.6 MPa√m for as-built specimens and 15 MPa√m for heat-treated specimens. A similar transition behavior was reported by Xie et al. [71] in their study of FCG behavior in wire arc additively manufactured Ti64. They found the transition stress intensity factor, ΔKₜ, to be 11.3 MPa√m for horizontal specimens and 10.3 MPa√m for vertical specimens. Below this transition point, the FCG rate for vertical specimens was about 5% higher than for horizontal ones, a difference attributed to microstructural characteristics and crack growth orientation.
3.3. Post-Processing Heat Treatment
While several studies have explored the combined effects of build orientation, mean stress, and post-processing on AM Ti64, relatively few [39,44,46,72,85,91,99] have systematically isolated the specific influence of post-processing on FCG. This distinction is important because post-processing can significantly alter residual stress, microstructure, and defect characteristics. These changes can strongly impact FCG behavior and also influence how other factors affect FCG. Jesus et al. [44,85] investigated the effect of HIP on the FCG behavior of L-PBF Ti64, comparing the results to stress-relieved specimens. HIP improved FCG resistance across all regimes, with ΔKₜₕ increasing from 3.19 MPa√m in stress-relieved specimens to 4.35 MPa√m in HIP specimens. This improvement was attributed to two primary factors: the presence of compressive residual stresses and roughness-induced crack closure. Compressive residual stresses aligned with the loading direction in HIP specimens reduced the effective stress intensity at the crack tip. Additionally, increased surface roughness promoted crack closure, particularly in the near-threshold regime. This was confirmed by calculating the crack closure parameter, U = (Pₘₐₓ − Pₒₚ) / (Pₘₐₓ − Pₘᵢₙ), which was 0.654 for HIP and 0.747 for stress-relieved specimens, with the lower U value for HIP specimens indicating stronger crack closure and slower crack growth. In the Paris regime, HIP specimens demonstrated enhanced FCG resistance compared to stress-relieved specimens, mainly due to greater plasticity-induced crack closure. This is supported by the lower U value for HIP specimens (0.881) versus stress-relieved specimens (0.931), indicating increased crack closure. The HIP process also improved the alloy’s ductility, resulting in a larger cyclic plastic zone at the crack tip and a more pronounced plastic wake. In this region, compressive residual stresses from HIP played a minimal role, as they were largely dissipated by the intense plastic deformation near the crack tip. In the unstable crack growth region, the fracture toughness for HIP specimens was about double that of stress-relieved specimens. This improvement is linked to the increased ductility imparted by HIP, which allows HIP specimens to absorb more strain energy and withstand greater fatigue damage [44,85]. Greitemeier et al. [56] studied the influence of annealing (720 °C for 2 h under vacuum) and HIP (920 °C, 20 bar, 2 h under argon) on the FCG behavior of EBM and DMLS Ti64. They observed that ΔKₜₕ was higher for HIP material (DMLS: 4.4 MPa√m; EBM: 4.8 MPa√m) compared to the annealed condition (DMLS: 3.2 MPa√m; EBM: 4.2 MPa√m). The enhanced resistance in HIP specimens was attributed to porosity elimination and improved microstructural homogeneity, which promote crack closure and delay crack initiation. However, crack growth rates in the Paris regime were similar regardless of process or heat treatment. Kim et al. investigated the effect of post-processing heat treatments (α/β annealing and β annealing) on the FCG behavior of DED-processed Ti64. Both treatments significantly increased FCG resistance compared to the as-built condition, especially in the low and intermediate ΔK regimes. The ΔKₜₕ increased by 26% with α/β annealing and by 71% with β annealing, which demonstrates the superior effectiveness of β annealing. As shown in Figure 9, the FCG curves capture these improvements and attribute them to microstructural coarsening, specifically the enlargement of α platelets observed in fractographic analysis. This coarser microstructure, especially evident after β annealing, reduces the frequency of crack-front obstruction by microstructural barriers and improves slip reversibility. Improved slip reversibility limits fatigue damage accumulation at the crack tip, resulting in greater resistance to FCG [56].
Qi et al. [39] examined the influence of microstructural evolution on the FCG behavior of Ti64 fabricated by SLM. The as-built microstructure consisted of columnar prior β grains aligned along the build direction, with fully martensitic α′ within the β grains. To assess the effect of this microstructure on FCG behavior, specimens underwent two post-processing heat treatments: sub-transus heat treatment at 900 °C, and super-transus heat treatment at 1015 °C. The sub-transus treatment preserved the columnar β grain structure but decomposed the martensite into a basketweave α structure. Annealing at 1015 °C removed SLM-induced features, resulting in a Widmanstätten microstructure. FCG tests at room temperature showed that while the prior β grains influenced the overall fracture morphology, they had little effect on FCG rate. Instead, FCG behavior was mainly determined by the morphology of the α phase. Fully martensitic α′ in the as-built specimens led to higher FCG rates, whereas heat treatment refined the α morphology, changed the FCG path, and enhanced FCG resistance. Although the difference in FCG resistance between sub- and super-transus heat-treated specimens was minor, with the super-transus heat-treated specimens exhibiting slightly higher resistance, Figure 10 shows that the crack growth mechanisms differed. In the sub-transus heat-treated specimens, crack paths changed direction upon encountering α laths; the basketweave structure reduced the influence of columnar grain boundaries, causing growth primarily along and across the laths. In contrast, Figure 10c demonstrates that in super-transus heat-treated specimens, cracks traversed large blocky β grains and anisotropic α lamellae colonies, resulting in complex, multibranched paths and greater volatility in the FCG data. These results underscore the importance of the balance between strength and toughness achieved by heat treatment in determining the FCG resistance of SLM Ti64.
Hasib et al. [63] examined the effect of post-processing on the FCG behavior of L-PBF Ti64, including sub-transus HIP (820 °C), super-transus HIP (950 °C), and β-annealing (1020 °C), in comparison with the as-built condition. Sub-transus HIP closed residual porosity while coarsening the basketweave α′/α microstructure. Super-transus HIP generated aligned lamellar colonies and resulted in the coarsest microstructure, although all treatments largely preserved the epitaxial β-grain texture. The thickness of α-laths was identified as the main factor controlling strength and near-threshold FCG resistance. Larger laths increased ΔKₜₕ and improved resistance at growth rates below approximately 10⁻⁷ m/cycle by promoting more tortuous crack paths and frequent branching. At higher growth rates, FCG resistance became insensitive to lath size. These results highlight the importance of microstructural control for optimizing fatigue performance in AM Ti64. Ye et al. [67] reported similar findings for LMD Ti64, showing that coarsened α-laths improved FCG resistance and altered crack propagation after vacuum heat treatment at 900 °C for 2 h with air cooling, followed by aging at 550 °C for 4 h with air cooling. The combined effects of build orientation, mean stress, and post-processing that have been discussed are analyzed in the next section.
3.4. Combined Factors
Galarraga et al. [49] investigated the combined effects of build orientation, mean stress, and post-processing on the FCG behavior of EBM-fabricated Ti64 extra low interstitial. In the as-built condition, FCG thresholds were approximately 15% higher for vertical specimens than for horizontal ones. This difference was attributed to roughness- and branching-induced closure resulting from prior β columnar grains and scan layer tortuosity. β-annealing increased ΔKₜₕ by 35–45% and eliminated anisotropy, which was achieved through microstructural coarsening and increased crack path roughness. Fractographic analysis showed smoother surfaces in Region II and rougher features in Region III for the as-built material, while the β-annealed specimens exhibited more uniform faceted fracture surfaces across all orientations, particularly at higher stress ratios. Becker et al. [47] conducted similar studies and found that ΔKₜₕ depends on build orientation and residual stresses. At low stress ratios, typical crack closure was observed, and ΔKₜₕ decreased with increasing stress ratio. Residual stresses shifted near-threshold FCG data to higher stress ratios and reduced ΔKₜₕ by minimizing crack closure. Anisotropy in ΔKₜₕ was linked to variations in the morphology of the near-tip microstructure.
Compared to build orientation, whose effect was largely governed by residual stresses, the microstructure played a more dominant role after post-processing heat treatment in dictating FCG behavior. Heat treatment promoted microstructural coarsening; the more coarse the microstructure, the lower the FCG resistance. Furthermore, the morphology and thickness of the α-laths significantly influenced crack propagation, with thicker α-laths reducing FCG resistance and lowering the ΔKₜₕ threshold. In contrast, the prior β grain size exhibited a relatively minor effect on FCG behavior compared to α-lath morphology.
3.5. Effect of Processing Parameters
AM offers significant design flexibility, but it also introduces variability in fatigue behavior due to its sensitivity to process parameters such as laser power, scan speed, hatch spacing, current, voltage, and wire feed speed. Since FCG governs long-term durability in service, a systematic investigation of how process parameters affect FCG is essential for developing design guidelines, optimizing processing conditions, and informing certification efforts. As a result, several studies have focused on linking processing parameters to FCG behavior, providing valuable insights into the underlying mechanisms and their impact on performance. Zhai et al. [79,109] investigated the influence of processing parameters on the FCG behavior of as-built and heat-treated laser engineered net shaping (LENS) Ti64. By varying laser power from 330 W (low) to 780 W (high) and testing both horizontal and vertical specimens, they examined long crack and microstructurally small crack growth behavior. Microstructural analysis showed that low-power as-built specimens were predominantly martensitic with a fine acicular α′ phase, while high-power specimens had a mixed α + α′ structure in a prior β matrix. Heat treatment transformed the martensitic α′ in low-power specimens into a refined α + β microstructure, with β forming as a continuous layer between former α′ plates. The mill-annealed Ti64 plate exhibited a typical equiaxed α grain structure within a β matrix. Compared to the mill-annealed alloy, LENS Ti64 had a lower ΔKₜₕ, but in region III, LENS specimens showed slower FCG rates, indicating improved fracture toughness. Among LENS conditions, low-power as-built specimens consistently had lower ΔKₜₕ than high-power specimens, regardless of orientation or stress ratio (R = 0.1 and 0.8). Heat treatment slightly increased ΔKₜₕ for the low-power condition but had no effect for the high-power condition, a result attributed to the transformation of α′ into a more refined α + β structure. These outcomes underscore the significant role of α phase morphology in controlling FCG behavior in LENS Ti64. Further experiments with surface flaw tension specimens (Figure 11(c)) assessed microstructurally small crack growth. SEM investigations revealed that variations in crack growth rates, including both acceleration and retardation, were linked to interactions at prior β grain boundaries, influenced by crystallographic misorientations and localized strain concentrations. The authors suggested that refining the columnar grain structure could improve resistance to crack growth. Additionally, Figure 11 shows that ΔKₜₕ for small cracks is much lower than for long and physically small cracks, highlighting the need to incorporate microstructurally small crack growth mechanisms in structural design.
Paul et al. [95] investigated the influence of process-induced volumetric defects on the FCG behavior of L-PBF Ti64. Specimens were fabricated using different laser powers and scan speeds to deliberately introduce defects with varying populations and morphologies, allowing for a systematic evaluation of their impact on FCG behavior. Three distinct process parameter sets were studied. The recommended set, using manufacturer-specified parameters, achieved a high relative density of 99.9930%. The underheated set, produced with lower volumetric energy density, intentionally generated lack of fusion defects and resulted in a relative density of 99.3%. The overheated set applied a higher energy density to encourage keyhole defect formation, with a relative density of 99.9985%. The findings showed that, while these parameter sets led to clear differences in defect populations and relative densities, their effect on FCG behavior was minor and largely confined to the near-threshold region as seen in Figure 7.
3.6. Repairs
AM is increasingly being considered as an alternative for repairing high-value aerospace components. Although AM-based repairs can reduce costs and extend service life, differences in microstructure, residual stress, and defects at the repair interface present concerns for fatigue performance. Because FCG is critical for long-term durability, understanding the impact of AM repairs on FCG behavior is essential for ensuring structural reliability and supporting certification. Shrestha et al. [110] investigated the FCG behavior of Ti64 specimens repaired using DED with powder and wire feedstocks. They measured FCG rates at the bond line, the interface between the repaired region and the base material, and compared them to conventionally wrought and annealed Ti64. The AM-repaired specimens showed slightly higher FCG rates than wrought material. Microstructural analysis near the bond line found no significant differences between powder-fed and wire-fed DED repairs in α-phase morphology or colony size. These results indicate that DED repair methods yield similar microstructures but a modest reduction in fatigue performance compared to conventional material, a critical consideration in repair applications. Metal AM provides major advantages for manufacturing geometrically complex components with high design flexibility. However, its adoption in large-scale industrial applications is limited by the build size constraints of the vacuum chamber, which prevents the fabrication of large, monolithic parts. To address this, post-processing techniques such as welding are being used to join multiple AM-fabricated subcomponents into larger assemblies. Hu et al. [88] investigated the FCG behavior of EBM-fabricated Ti64 and its welded joints. Their results showed that both as-built and welded materials exhibited similar FCG resistance in the stable crack growth region. These findings suggest that welding can be a viable post-processing method for assembling larger EBM structures without compromising fatigue performance, thereby extending the use of EBM in structural applications.
3.7. Variable Amplitude Loading
The AM Ti64 FCG studies discussed so far have primarily focused on constant amplitude loading conditions. However, real-world service environments, especially in aerospace applications, often involve variable amplitude loading, which introduces transient effects such as crack growth retardation, acceleration, and complex load interactions. These effects are influenced by overloads, underloads, and the sequence of applied loads, all of which can significantly change crack growth rates compared to constant amplitude loading. For instance, overloads can create plastic zones and residual compressive stresses near the crack tip, resulting in temporary crack growth retardation [111]. Because constant amplitude tests do not capture these mechanisms, understanding variable amplitude loading is essential for accurate assessment of fatigue performance and ensuring the structural integrity of AM Ti64. Jesus et al. [44,83,85] investigated these transient effects in HIP L-PBF Ti64 at R = 0 and R = 0.4. They applied overloads (OLR) and underloads (ULR) to assess the influence of mean stress, using the crack closure parameter. Plasticity-induced crack closure was observed at R = 0 but was absent at R = 0.4. Results in Figure 12(a) demonstrated that an overload with OLR = 1.5 had little impact on the FCG rate, which remained similar to that under constant amplitude loading. An overload of OLR = 2, however, reduced the FCG rate by about 3.4 times, leading to significant crack retardation and extended fatigue life. The delay in crack growth was attributed to crack closure from plastic deformation in the crack wake and the residual compressive stress field at the crack tip. At R = 0.4, the FCG rate showed a different pattern after overloads. As shown in Figure 12(b), an OLR of 1.5 did not reduce the FCG rate at ΔK = 9 MPa√m but did show reductions at ΔK = 14 and 20 MPa√m, similar to the R = 0 condition. The first overload was not enough to activate plasticity-induced crack closure, while later overloads produced sufficient plasticity to trigger the mechanism. Overloads with OLR = 2 created a larger plastic zone, resulting in greater crack retardation and a longer transient period. The third overload reached the KIC value, causing specimen fracture. For underloads (ULR = 2 and 3), the da/dN–ΔK curves at R = 0 showed no significant effect on the FCG rate [44,85].
3.8. Environmental Assisted FCG
Most studies on AM Ti64 FCG have been conducted in air; however, many applications expose components to harsher environments such as saline, humid, or high-temperature conditions. These environments can accelerate crack growth through mechanisms like oxidation, hydrogen-assisted cracking, and microstructural instability. Understanding how such conditions affect the FCG behavior of AM Ti64 is therefore crucial for reliable fatigue designs and safe use in demanding service environments. Oh et al. [45] investigated the environment-assisted FCG behavior of as-built and β-annealed Ti64 specimens produced by the DED process. Testing was conducted in both ambient air and a 3.5 pct NaCl solution under anodic potentials of Ecorr and 0.05 VSCE. The as-built microstructure had fine, acicular α platelets within prior β grains, along with a considerable amount of intergranular β phase. β-annealing resulted in coarser, more equiaxed α platelets, a change that generally improves crack deflection and branching behavior. FCG tests showed a substantial drop in FCG resistance for both as-built and β-annealed specimens in low and intermediate ΔK regimes under corrosive conditions, indicating greater susceptibility to environment-assisted cracking. Both horizontal and vertical specimens exhibited increased crack growth rates in the chloride-bearing environment compared to air, which demonstrates that crack growth was highly sensitive to the environment regardless of build orientation. This reduction in resistance is mainly attributed to the breakdown of the passive oxide film under cyclic loading and the preferential corrosion of the β phase at α/β interfaces. The microstructural advantage of crack branching, often present in air due to acicular α features, was greatly reduced in the chloride environment, leading to straighter crack paths (Figure 13). As a result, the microstructure provided less protection, the effective ΔK at the crack tip increased, and crack growth accelerated.
Jesus et al. [82] found that in artificial saliva, the FCG rate increased as the testing frequency rose from 1 Hz to 10 Hz. Additionally, at any given frequency, the FCG rate in artificial saliva was lower than in air. This behavior was attributed to more significant corrosion damage in the saliva environment, which promoted faster crack propagation at both frequencies. Jesus et al. [94] introduced cylindrical specimens with central cracks, produced by SLM, as an alternative to conventional C(T) specimens for FCG studies. Testing on Ti64 at R = 0 showed that FCG resistance was higher in vacuum, with crack growth rates up to 50% lower than those observed in air. When compared with 6 mm C(T) specimens, significant differences appeared at higher ΔK values, mainly due to stress state effects. Cylindrical specimens maintain plane strain conditions, whereas C(T) specimens shifted toward plane stress as crack length increased. Overload effects under constant amplitude loading, especially near specimen surfaces, were also found to influence the observed differences.
3.9. Temperature Effects
Wu et al. [89] studied the combined effects of build orientation, stress ratio, and temperature on the FCG behavior of SLM Ti64. At 400 °C, specimens showed higher FCG rates and lower threshold values compared to room temperature, which was attributed to grain softening. Build orientation significantly affected results in the threshold regime, with horizontal specimens demonstrating greater resistance than vertical specimens due to the alignment of the fracture plane relative to β columnar grains. However, this anisotropy decreased in the Paris regime, where FCG resistance was similar regardless of orientation. An increase in stress ratio further reduced crack closure, resulting in lower thresholds and FCG.
3.10. Small Cracks
Most of the FCG research discussed in the previous sections has focused on long cracks, which are typically large enough for ΔK to predict their growth behavior accurately. In contrast, small cracks, often comparable in size to microstructural features such as grains or defects, can exhibit growth that deviates from long-crack trends [90,102,109,112]. Small cracks usually grow faster than long cracks at the same ΔK and are capable of propagating below the conventional long-crack threshold. This phenomenon, known as the small-crack effect, is significant because a large portion of a material’s fatigue life is spent in this stage. As a result, fatigue predictions that rely only on long-crack data can be inaccurate, highlighting the need to consider small-crack behavior [90,102,113,114,115]. Zhai et al. [58] investigated the small FCG behavior of LENS-processed Ti64 and found that small cracks could propagate below the conventional long-crack FCG threshold, with growth rates influenced by microstructural barriers. In contrast, Waddell et al. [102] found that in SLM Ti64, small cracks sometimes grew more slowly than long cracks measured in C(T) specimens at the same ΔK. This unexpected behavior was attributed to three factors: (i) interactions between propagating cracks and microstructural defects, which blunted crack tips and hindered propagation; (ii) the presence of multiple crack initiation sites and crack bridging, which contributed to crack shielding and a reduced effective growth rate; and (iii) frequent crack path deflections arising from the distinctive prior-β grain microstructure. Wu et al. [90] investigated small FCG in SLM Ti64 using artificial defects to simulate process-induced pores. Early-stage growth was strongly affected by microstructure: cracks followed zigzag paths along α lamellae or α/β interfaces, and α grain boundaries appeared to retard growth (Figure 14). FCG rates were higher at R = 0.5 than at R = 0.1, indicating partial crack closure effects. Overall, small cracks propagated below the long-crack threshold and generally grew faster than long cracks at the ΔKth.
4. Perspectives for Future Research
The potential use of AM Ti64 in fatigue-critical sectors such as aerospace systems are driven by its exceptional design flexibility which can be tailored for specific mechanical performance. However, undesirable variations in microstructure, residual stress, and process-induced defects can have a significant and often unpredictable impact on the FCG behavior of AM Ti64. To ensure long service life and damage tolerance in safety-critical applications, it is therefore crucial to gain a comprehensive understanding of these factors and develop effective strategies to mitigate against them. In recent years, research in this field has progressed beyond simply reporting FCG curves. There is now a clear focus on mechanistic and correlative studies that utilize advanced techniques such as X-ray computed tomography, in-situ imaging, residual stress measurement and microstructure mapping to provide deeper insights into FCG behavior [61,65,77,89,95] and to establish robust process-structure-property relationships. There is also a general consensus in the AM literature that controlling defects, along with appropriate post-processing methods like HIP, machining, and heat treatment, is effective in improving FCG performance[2,7,116]. Nevertheless, consistent and reproducible FCG results can only be achieved with the adoption of standardized test data reporting and experiments that accurately represent service conditions. This section highlights the key research gaps identified in the literature and outlines promising directions for future investigation.
- Build Orientation Effects: The influence of build orientation on FCG behavior in AM Ti64 remains inconclusive in the current literature. Some studies report a strong dependence of FCG resistance on build orientation, whereas others find only minimal effects. These divergent results are primarily attributed to variations in residual stress states, microstructural characteristics, and defect distributions associated with specific printing directions. Most research has focused on horizontal and vertical specimen orientations; however, real-world components often experience multiaxial loading and complex geometries, which promote crack propagation along off-axis directions [117]. Evaluating FCG in off-axis orientations is therefore essential to fully capture the effects of anisotropy and layer-related defects.
Zerbst et al. [17] suggested that, as a general expectation for AM alloys, vertical specimens in the as-built state should exhibit greater resistance to FCG than horizontal specimens. This expectation arises from the tendency of cracks in horizontal specimens to propagate along layer interfaces, where defects and interlayer porosity are more prevalent, thereby accelerating crack growth. In contrast, cracks in vertical specimens typically traverse multiple layers, resulting in more tortuous and deflected crack paths that enhance FCG resistance. However, this general expectation was not consistently observed in the reviewed studies. The inconsistency is believed to originate from non-uniform residual stress distributions across different build orientations, which can outweigh the effects of microstructural and defect-related factors.
It is well established in the FCG literature that post-processing treatments, such as stress relief or heat treatment, tend to reduce anisotropic effects by redistributing residual stresses and promoting microstructural homogenization, thereby leading to more isotropic FCG behavior [7,8]. The studies reviewed in this work consistently support this trend, indicating that residual stress plays the dominant role in governing FCG behavior in AM Ti64, while microstructure and defect distribution act as secondary influences.
A practical approach to address these inconsistencies is through round-robin testing, in which multiple research laboratories fabricate and test identical specimens under well-defined build orientations and processing parameters. Cross-laboratory comparisons can help identify sources of variability and improve data consistency. Furthermore, establishing standardized reporting guidelines for key variables such as build orientation, machine settings, and defect quantification would enhance the comparability and reproducibility of studies. Finally, applying advanced data analytics and machine learning to aggregated datasets can reveal subtle relationships between build orientation and FCG behavior. Together, these measures can clarify the role of build orientation and support the development of more reliable design standards for AM Ti64.
- 2.
- Mean Stress Effects and Microstructural Sensitivity: The influence of mean stress, typically characterized by the stress ratio, on FCG in AM Ti64 is well documented. Higher stress ratios generally lead to faster FCG and lower ΔKth [13,118]. However, the combined effects of mean stress and microstructural features such as grain orientation, α/β morphology, and porosity on crack closure are not well understood, particularly during the transition from microstructure-sensitive near-threshold behavior (Region I) to steady-state crack growth (Region II). Addressing this knowledge gap requires targeted research that integrates comprehensive microstructural characterization with in-situ FCG testing under varying mean stress conditions. By combining advanced imaging and analysis techniques with real-time crack growth measurements, researchers can directly observe how specific microstructural features and applied mean stresses interact to influence crack closure and subsequently FCG. These insights are essential for developing more robust design standards for AM Ti64 components, ultimately ensuring greater damage tolerance and structural reliability.
- 3.
- Process Parameters and Defect Populations: FCG behavior in AM Ti64 is sensitive to process parameters such as laser power, scan speed, and hatch spacing, since these factors determine the resulting microstructure and the distribution of defects including pores and lack-of-fusion defects. Few studies [79,95,109] have systematically isolated the effects of individual process parameters, especially for small cracks where conventional fracture mechanics models may not be fully applicable. Achieving a deeper understanding of how these processing conditions impact microstructure and fatigue performance across different build orientations and loading scenarios is essential for optimizing AM processes and improving FCG resistance in AM Ti64.
- 4.
- Repairs, Interfaces, and Service-Relevant Conditions: As AM is increasingly employed for component repair, it has become crucial to understand FCG behavior at repair interfaces. Even when DED techniques closely replicate the substrate microstructure, FCG rates at the bond line are often higher than those observed in wrought Ti64 [88,110] . The specific impacts of interface microstructure on FCG performance are still not well characterized. Furthermore, most existing FCG studies are performed under constant amplitude loading, whereas actual service environments involve variable amplitude loading, multiaxial stresses, and exposure to harsh conditions. This gap in representative test data limits the ability to accurately model and predict damage tolerance for repaired components operating under real-world conditions.
- 5.
- Functionally Graded Ti64: Ti64 alloys offer excellent high-temperature strength, yet their limited wear resistance and hardness restrict use in certain aerospace applications [119]. AM enables the fabrication of functionally graded materials (FGMs) with tailored composition gradients, providing location-specific mechanical properties [119]. Unlike conventional composites with sharp interfaces, FGMs promote smooth transitions between dissimilar materials, enhancing overall performance and expanding aerospace applicability. Studies investigating reinforcements such as TiC, Al₂O₃, stainless steel, and Mo in Ti64 have reported varying improvements in micro-hardness and tensile properties depending on phase fractions [120,121,122,123]. However, while tensile and hardness data are available for functionally graded Ti64, their fatigue behavior remains underexplored. For instance, Li et al. [2] showed that TiC-reinforced Ti64 fabricated by LMD exhibited enhanced tensile and micro-hardness properties when 5% TiC is added to Ti64. This underscores the need to examine FCG, as microstructural modifications can greatly affect durability under cyclic loading and high temperatures. Comprehensive FCG evaluation is essential to establish reliable design criteria and fully realize the potential of these FGMs. High-integrity joining of Ti64 and stainless steels is vital for aerospace structures, but direct welding often leads to the formation of brittle intermetallics such as FeTi and Fe₂Ti, causing premature failure [119,120]. FGMs address this challenge by introducing graded interlayer zones, often employing Cu, Ni, or Al alloys, to reduce incompatibility. The selection of suitable interlayer materials and assessment of their fatigue properties, especially FCG behavior, are crucial for advancing robust multi-material joints.
- 6.
- Cold Spray AM: Among solid-state AM processes, cold spray has emerged as a promising technique for fabricating and repairing structural metallic components[124]. Unlike fusion-based AM methods, cold spray operates entirely in the solid state, producing dense, oxidation-free deposits with minimal thermal distortion [125,126,127]. As its applications expand from coatings to structural and load-bearing parts, evaluating the fatigue performance of cold spray materials has become increasingly important. The adoption of nondestructive inspection techniques for structural health monitoring is vital to establishing cold spray as a certified method for structural restoration, particularly in aerospace applications where continuous health monitoring is required [126,128]. Studies have shown that cold spray coatings can improve fatigue performance, with the degree of enhancement governed by coating–substrate material compatibility, interface quality, and residual stress state. Coatings composed of higher-strength materials than the substrate generally yield greater fatigue improvements. Fatigue resistance is equally critical in repair applications, where restored components must recover the fatigue strength of undamaged parts. Although variations in damage geometry and size complicate systematic evaluation, optimized cold spray repairs can extend component life while reducing costs and environmental impact.
Research on cold spray AM remains limited but encouraging. Studies on alloys such as IN718, 316L, Al2024, and Al7075 have reported promising fatigue behavior [128]. However, FCG data are currently available only for Al6061-T6 and 316L, with no comparable studies on Ti64, which represents a notable gap given its importance in aerospace applications [128]. A review of the literature shows that freestanding cold spray AM deposits exhibit notable resilience under cyclic loading [128]. As-sprayed materials typically show high hardness and low ductility due to severe particle deformation, but post-deposition heat treatments can effectively restore ductility and enhance fatigue resistance. The fatigue performance of heat-treated cold spray AM materials often approaches that of laser-based AM alloys and, in some cases, wrought counterparts, underscoring cold spray as a viable solid-state AM route that mitigates challenges associated with melting-based processes, including thermal distortion, residual stress, and limited deposition rates[128,129,130]. Future studies comparing the FCG behavior of freestanding cold spray AM Ti64 with conventionally manufactured and fusion-based AM materials will provide valuable insights into its structural performance. Most of the existing studies [129,131,132,133,134,135,136] have focused on the effects of heat treatment, tensile properties and micro-hardness on cold spray Ti64 with a few focusing on axial fatigue and none on FCG properties.
- 7.
- Standardization and Data Openness: Progress in understanding FCG in AM Ti64 is limited by incomplete documentation and inconsistent reporting across studies. Many publications lack comprehensive details about the AM process, FCG testing methods, and post-processing conditions, making it difficult to compare results or build reliable datasets for accurate FCG modeling. To address these challenges, it is essential to establish standardized testing protocols, adopt consistent terminology, and encourage open data-sharing practices. These steps will improve reproducibility, enable robust meta-analyses, and ultimately support the development of dependable fatigue design guidelines for AM Ti64.
- 8.
- In-situ FCG testing: Of the reviewed FCG studies, only a few [61,68,73,77,89] employed in-situ FCG testing. In-situ FCG testing offers a powerful approach to directly observe crack initiation and propagation in AM Ti64, capturing the dynamic interactions between cracks, microstructure, inherent defects, and residual stresses. Unlike conventional ex-situ tests, in-situ methods provide high-resolution, real-time data that enable a mechanistic understanding of defect criticality, microstructural influences, and residual stress effects, thereby supporting improved predictive modeling, process optimization, and damage-tolerant design for aerospace applications.
Carefully addressing these gaps through coordinated research efforts will be crucial for unlocking the full damage tolerance and reliability potential of AM Ti64. To achieve this, some research directions targeted advancements are required in several key areas and proposed below:
- Multiscale and In-Situ Characterization: Perform more in-situ studies are needed to systematically investigate these interactions across different AM process parameters, build orientations, and heat treatment conditions to fully leverage the benefits of in-situ testing for fatigue performance assessment.
- Service-Relevant Spectrum Testing: Develop fatigue testing protocols that incorporate variable amplitude loading, multiaxial stresses, and realistic environmental conditions, such as high temperatures and corrosive media. Implementing these protocols will ensure that laboratory data more accurately represent the performance and reliability of AM Ti64 under actual service conditions.
- Data-Driven Process Optimization: Employ machine learning and big data analytics to model the complex relationships among AM process parameters, resulting microstructure, defect populations, and FCG performance. Establishing open-access databases will further accelerate the optimization of processing strategies, enabling enhanced fatigue resistance and damage tolerance in AM Ti64 components.
- Standardized Test Results Reporting: Establish unified testing protocols, clear conventions for specimen orientation, and thorough documentation of processing conditions. Promoting open data sharing and adherence to best practices will enhance the reproducibility of results, facilitate meaningful benchmarking across studies, and provide a robust foundation for certifying and qualifying AM Ti64 components in critical applications.
- Data-driven advancements in AM fatigue: Recent progress in data-driven approaches has demonstrated that these methods can significantly enhance our understanding of fatigue behavior in AM materials [137,138]. Machine learning algorithms and advanced statistical analyses are increasingly employed to uncover key process-structure-property relationships that govern fatigue performance, providing predictive capabilities that match and potentially surpass those of conventional mechanistic models. By harnessing large, high-fidelity datasets that capture the intricacies of the AM process, including build parameters, microstructural features, defect distributions, and post-processing conditions, researchers are able to develop robust models for predicting FCG behavior in Ti64. Data-driven modeling not only improves the accuracy of fatigue property predictions [138], but also facilitates the early identification of process-induced anomalies.
4.1. Observations on Experimental Trends in AM Ti64 FCG
As part of this review, FCG datasets for AM Ti64 were digitized (Figure 15) and compiled (Table A1, Table A2 and Table A3) from the AM Ti64 FCG literature. A comprehensive analysis of the aggregated data reveals distinct trends in processing routes, testing conditions, post-processing sequence, and environmental conditions. These patterns highlight both current areas of research focus and gaps where further investigation could be valuable. Specimens produced using SLM/L-PBF comprise approximately 40 percent of the dataset, underscoring the predominance of this processing route in both academic research and industrial application (see Figure 15a). Most FCG tests, about 75 percent, were conducted at a frequency of 10 Hz. Tension–tension loading (R ≈ 0.1) is the most common configuration, while higher stress ratios and fully reversed loading (R = −1) are infrequently studied. Air is the predominant testing environment, representing about 70 percent of the dataset and providing a baseline for intrinsic material behavior. In contrast, tests conducted in corrosive media (such as 3.5% NaCl, Ringer’s solution, and artificial saliva) and under vacuum conditions are relatively rare, indicating potential opportunities for further research in physiological, marine, or oxidation-free environments. The majority of tests were conducted at room temperature, while only around 10 percent were performed at 400°C. The impact of processing route and post-processing is evident in the observed trends (Figure 15). Non-heat-treated specimens generally exhibit higher FCG rates, likely due to the presence of residual stresses in the as-built condition, microstructural heterogeneity and process-induced defects. In comparison, specimens that have undergone HIP or heat treatment typically show improved FCG resistance with lower da/dN values, and subsequently higher ΔKth. The considerable variation observed in the compiled dataset could result from differences in processing and build orientation (see Figure 16).
4.2. A Reporting Benchmark for Quantitative Assessment of FCG Data in AM Studies
Available fatigue data for AM Ti64 in the literature is crucial for efficient and reliable component design, as it reduces dependence on extensive custom testing. However, as noted in the previous section, the usefulness of these datasets is often limited by incomplete reporting, which increases uncertainty in predicting fatigue performance. This review showed that FCG behavior in AM Ti64 depends on factors such as processing route, build orientation, microstructure, loading, and environment. Failure to accurately document these variables undermines data reliability, particularly for safety-critical applications, and limits the relevance of published results. Although several approaches exist to assess the applicability of fatigue test data, most were developed for conventionally manufactured materials [139,140] and focus primarily on total fatigue life rather than FCG. There is currently no method dedicated to evaluating the quality and completeness of AM FCG data, nor is there a standard for reporting such results. Existing standards, such as ASTM E647, provide a foundation for FCG testing, but do not specify reporting requirements for AM. Similarly, ASTM F2971-13 [141] addresses mechanical testing, while E468-18 [142] covers the presentation of total fatigue life data. However, neither standard address FCG data in AM materials. To address this gap, a reporting benchmark is introduced here for evaluating the quality of reported FCG data in AM materials, using Ti64 as a demonstrative case. This benchmark assesses data completeness and offers clear guidance for effective reporting. Similar to the approach of Rogers et al. [140], who provided a reporting benchmark for the total fatigue life of AM alloys, this criterion has been specifically adapted to address the unique requirements of AM FCG data.
To address the documentation issues identified in the previous section, a reporting benchmark has been established based on two indices. The first index, , is derived from ASTM E647 [42], which covers material, process, and testing factors relevant to FCG. The second, , is based on ASTM F2971[141], which standardizes reporting for test specimens produced by AM. Both indices are combined into a single index, , which integrates both measures and serves as the reporting benchmark. A scoring system is proposed for damage-tolerance design, using the metric α (ranging from 0 to 1), with 0 indicating incomplete documentation and 1 representing complete documentation. Each dataset from every study in the literature receives a score, ,calculated as the weighted sum of documented variables, where weights reflect expert judgment or relevance to FCG behavior. For simplicity, this work assumes equal weighting, though weight selection may vary depending on the application or researcher’s priorities. To provide an overall measure of dataset completeness, the average score across all variables, , is determined by:
The first index for FCG reporting of Ti64, , is presented in Table 2. As discussed previously, factors such as residual stresses, microstructure, defects, and testing conditions all have a significant impact on the FCG behavior of Ti64. Therefore, comprehensive reporting of material characteristics and post-processing techniques is vital for meaningful interpretation of experimental findings (see Table 1, ASTM E647) [42]. AM introduces additional considerations, such as build orientation and processing parameters. These aspects influence surface texture and the presence of internal defects, both of which directly affecting FCG response. Documenting these AM-specific parameters, as outlined in the second index, ,in Table 3 (ASTM F2971-13) [141], is essential for an accurate understanding of the FCG performance of AM alloys.
To reduce uncertainty and standardize reporting of AM FCG data, a new reporting benchmark (; Table 4) is developed by integrating elements from (Table 2) and (Table 3). consists of two categories; Category 1 includes essential elements from necessary for accurate FCG reporting, while Category 2 comprises additional elements from not covered by . A correlation matrix (See Figure S1 of the supplementary material), which integrates elements from and , highlighting which elements are “highly” correlated (directly aligned) or “moderately” correlated (indirect alignment) between the two indices. A brief description for each of the elements in as documented in Table 4, is provided in the Section S2 of the supplementary material. Analysis of the correlation matrix yields several key findings. Approximately 19% of the elements are correlated between the two indices. Among these, highly correlated elements (N = 45) are about twice as common as those showing moderate correlation (N = 20). Notably, all AM documentation elements correspond to at least one FCG-relevant element, although some of these connections are only moderate. In contrast, only 74% of FCG elements correlate with at least one AM element.
Although the proposed reporting benchmark is applicable to any FCG dataset, this study focuses on the previously reviewed AM Ti64 FCG studies. Applying the reporting standard developed in Table 4 to AM FCG Ti64 datasets from the literature reveals that FCG reporting often does not meet these criteria, as demonstrated in Figure 17. Key insights from these analyses are as follows:
- The average score, ,for the reporting benchmark across all the reviewed AM Ti64 FCG studies is 0.75.
- Of the 20 elements of the reporting benchmark evaluated, only alloy specification, AM process type, FCG test method, graphical representation of FCG data, and R were reported in 100% of the studies.
- Additionally, the following indices were frequently reported : microstructural features, alloy condition and details of post-processing heat treatment protocols, temperature and/or relative humidity conditions during testing, fatigue test frequency and cyclic waveform characteristics, orientation of test specimens within the AM build chamber, Specimen geometry including dimensional tolerances, and crack propagation direction relative to the build orientation
- Conversely, some important indices were underreported. For example, only 12% of studies reported preheat temperature of the powder or build plate , even though preheating is critical in processes such as LPBF to reduce residual stresses, distortion, and warping, reducing the need for post-process stress-relief treatments[143,144,145]. Information on build plate preheating, another significant means of stress reduction, is also rarely included, despite evidence that elevated base plate temperatures further mitigate thermal gradients [146].
- Other commonly omitted indices include feedstock’s chemical composition, surface treatment or roughness measurements, AM process parameters , details of the controlled AM environment and shielding gas composition, powder size distribution for powder feedstock or wire diameter specification , and tensile properties
- As illustrated in Figure 17, none of the reviewed AM FCG Ti64 studies achieved full documentation
- Test conditions and data representation (Category C) are the most consistently reported, with an average of ~99.1%, demonstrating strong compliance.
- Material properties (Category A) are moderately reported (~68.1%), with gaps in powder/wire specifications and tensile properties.
- AM process and specimen preparation (Category B) are the least documented (~66.3%), with frequent omissions in preheating, scan strategy, and shielding gas details.
Based on the reporting trends identified in AM Ti64 studies using the proposed documentation indices, several recommendations are offered to improve the transparency, reproducibility, and comparability of FCG investigations:
- Enhance documentation of AM process parameters, including preheating temperature, scan strategy, laser or electron beam power, layer thickness, build orientation, hatch spacing, powder flow rate, wire feed rate, shielding gas type, and power settings. Comprehensive reporting of these parameters is essential, as they strongly influence microstructure, porosity, defect formation, and residual stress, all of which have a critical impact on FCG behavior in AM Ti64.
- Improve reporting of material properties by thoroughly documenting powder characteristics such as particle size distribution, morphology, and chemical composition, as well as tensile behavior. These properties directly influence crack initiation and growth in AM Ti64.
- Maintain comprehensive reporting of testing conditions by consistently documenting load type, stress intensity range, R-ratio, frequency, and environmental factors. Future efforts should continue this level of thoroughness while also prioritizing the inclusion of upstream AM process parameters to further improve the reproducibility of FCG results in AM Ti64.
5. Conclusion
Additive manufacturing (AM) of Ti-6Al-4V (Ti64) continues to demonstrate exceptional promise for producing lightweight, high-performance components in fatigue-critical aerospace applications, offering unparalleled design freedom and material efficiency. Yet, the fatigue crack growth (FCG) behavior of AM Ti64 remains highly variable and often unpredictable, primarily due to the complex interplay among process-induced microstructural heterogeneities, defects, and residual stresses. Considerable progress has been achieved in characterizing FCG performance and identifying key influencing factors, including build orientation, mean stress, heat treatment, and environmental exposure. However, a comprehensive understanding of their combined effects, particularly under realistic service-relevant loading and environmental conditions, remains limited, as does insight into the behavior of repair interfaces.
The accompanying meta-analysis highlights an equally critical issue: inconsistent reporting of manufacturing and material details across published studies. These gaps restrict reproducibility, hinder cross-study comparison, and limit the development of robust predictive FCG models. Addressing these shortcomings calls for unified reporting standards, transparent data-sharing practices, and systematic benchmarking grounded in established testing protocols and domain expertise.
Future progress will depend on integrating multiscale and in-situ characterization techniques with data-driven frameworks to capture the evolving interactions between processing, microstructure, and crack propagation. Such coordinated efforts will be pivotal for realizing the full damage tolerance and reliability potential of AM Ti64 in aerospace applications.
References
- Marin, E.; Lanzutti, A. Biomedical Applications of Titanium Alloys: A Comprehensive Review. Materials 2024, 17. [Google Scholar] [CrossRef] [PubMed]
- Li, P.; Warner, D.H.; Fatemi, A.; Phan, N. Critical assessment of the fatigue performance of additively manufactured Ti-6Al-4V and perspective for future research. Int J Fatigue 2016, 85, 130–143. [Google Scholar] [CrossRef]
- Chern, A.H.; Nandwana, P.; Yuan, T.; et al. A review on the fatigue behavior of Ti-6Al-4V fabricated by electron beam melting additive manufacturing. Int J Fatigue 2019, 119, 173–184. [Google Scholar] [CrossRef]
- El-Hadad, S.; Elsayed, A.; Shi, B.; Attia, H. Experimental Investigation on Machinability of α/β Titanium Alloys with Different Microstructures. Materials 2023, 16. [Google Scholar] [CrossRef] [PubMed]
- Patil, A.S.; Ingle, S.V.; More, Y.S.; Mathe, M.S. Machining Challenges in Ti-6Al-4V. -A Review. Int J Innov Eng Technol 2015, 5, 6–23. [Google Scholar]
- Pramanik, A. Problems and solutions in machining of titanium alloys. Int J Adv Manuf Technol 2014, 70, 919–928. [Google Scholar] [CrossRef]
- DebRoy, T.; Wei, H.L.; Zuback, J.S.; et al. Additive manufacturing of metallic components – Process, structure and properties. Prog Mater Sci 2018, 92, 112–224. [Google Scholar] [CrossRef]
- ISO/ASTM Additive Manufacturing - General Principles Terminology (ASTM52900). Rapid Manuf Assoc 2013, 10–12. [CrossRef]
- Diegel, O.; Nordin, A.; Motte, D. Additive Manufacturing Technologies. A Pract Guid to Des Addit Manuf 2019, 19–39. [Google Scholar] [CrossRef]
- Lewandowski, J.J.; Seifi, M. Metal Additive Manufacturing: A Review of Mechanical Properties. Annu Rev Mater Res 2016, 46, 151–186. [Google Scholar] [CrossRef]
- Frazier, W.E. Metal additive manufacturing: A review. J Mater Eng Perform 2014, 23, 1917–1928. [Google Scholar] [CrossRef]
- Yusuf, S.M.; Cutler, S.; Gao, N. Review : The Impact of Metal Additive Manufacturing on the Aerospace Industry. Metals 2019.
- Alfred, S.O.; Amiri, M. High-Temperature Fatigue of Additively Manufactured Inconel 718 A Short Review. J Eng Mater Technol 2025, 147, 1–17. [Google Scholar] [CrossRef]
- Sabirov, I.; Kolednik, O. The effect of inclusion size on the local conditions for void nucleation near a crack tip in a mild steel. Scr Mater 2005, 53, 1373–1378. [Google Scholar] [CrossRef]
- Sangid, M.D. The physics of fatigue crack initiation. Int J Fatigue 2013, 57, 58–72. [Google Scholar] [CrossRef]
- Sangid, M.D. The physics of fatigue crack propagation. Int J Fatigue 2025, 197, 108928. [Google Scholar] [CrossRef]
- Zerbst, U.; Bruno, G.; Buffière, J.Y.; et al. Damage tolerant design of additively manufactured metallic components subjected to cyclic loading: State of the art and challenges. Prog Mater Sci 2021, 121, 1–73. [Google Scholar] [CrossRef]
- Yi, M.; Tang, W.; Zhu, Y.; et al. A holistic review on fatigue properties of additively manufactured metals. J Mater Process Technol 2024, 329, 118425. [Google Scholar] [CrossRef]
- Nguyen, H.D.; Pramanik, A.; Basak, A.K.; et al. A critical review on additive manufacturing of Ti-6Al-4V alloy: Microstructure and mechanical properties. J Mater Res Technol 2022, 18, 4641–4661. [Google Scholar] [CrossRef]
- Cao, F.; Zhang, T.; Ryder, M.A.; Lados, D.A. A Review of the Fatigue Properties of Additively Manufactured Ti-6Al-4V. Jom 2018, 70, 349–357. [Google Scholar] [CrossRef]
- Agius, D.; Kourousis, K.I.; Wallbrink, C. A review of the as-built SLM Ti-6Al-4V mechanical properties towards achieving fatigue resistant designs. Metals 2018, 8. [Google Scholar] [CrossRef]
- Afroz, L.; Das, R.; Qian, M.; et al. Fatigue behaviour of laser powder bed fusion (L-PBF) Ti–6Al–4V, Al–Si–Mg and stainless steels: a brief overview. 2022. [Google Scholar]
- Fatemi, A.; Molaei, R.; Simsiriwong, J.; et al. Fatigue behaviour of additive manufactured materials: An overview of some recent experimental studies on Ti-6Al-4V considering various processing and loading direction effects. Fatigue Fract Eng Mater Struct 2019, 42, 991–1009. [Google Scholar] [CrossRef]
- Romero, C.; Yang, F.; Bolzoni, L. Fatigue and fracture properties of Ti alloys from powder-based processes – A review. Int J Fatigue 2018, 117, 407–419. [Google Scholar] [CrossRef]
- Fotovvati, B.; Namdari, N.; Dehghanghadikolaei, A. Fatigue performance of selective laser melted Ti6Al4V components: State of the art. Mater Res Express 2019, 6. [Google Scholar] [CrossRef]
- Li, Z.; Affolter, C. High-Cycle Fatigue Performance of Laser Powder Bed Fusion Ti-6Al-4V Alloy with Inherent Internal Defects: A Critical Literature Review. Metals 2024, 14, 972. [Google Scholar] [CrossRef]
- Sandgren, H.R.; Zhai, Y.; Lados, D.A.; et al. Characterization of fatigue crack growth behavior in LENS fabricated Ti-6Al-4V using high-energy synchrotron x-ray microtomography. Addit Manuf 2016, 12, 132–141. [Google Scholar] [CrossRef]
- Elshaer, R.N.; El-Hadad, S.; Nofal, A. Influence of heat treatment processes on microstructure evolution, tensile and tribological properties of Ti6Al4V alloy. Sci Rep 2023, 13, 1–21. [Google Scholar] [CrossRef]
- Liu, S.; Shin, Y.C. Additive manufacturing of Ti6Al4V alloy: A review. Mater Des 2019, 164, 107552. [Google Scholar] [CrossRef]
- Nguyen, H.D.; Pramanik, A.; Basak, A.K.; et al. A critical review on additive manufacturing of Ti-6Al-4V alloy: Microstructure and mechanical properties. J Mater Res Technol 2022, 18, 4641–4661. [Google Scholar] [CrossRef]
- Carroll, B.E.; Palmer, T.A.; Beese, A.M. Anisotropic tensile behavior of Ti-6Al-4V components fabricated with directed energy deposition additive manufacturing. Acta Mater 2015, 87, 309–320. [Google Scholar] [CrossRef]
- Liu, Z.; He, B.; Lyu, T.; Zou, Y. A Review on Additive Manufacturing of Titanium Alloys for Aerospace Applications: Directed Energy Deposition and Beyond Ti-6Al-4V. Jom 2021, 73, 1804–1818. [Google Scholar] [CrossRef]
- Leyens, C.; Peters, M. Titanium and Titanium Alloys. 2003. [Google Scholar]
- Yu, Z.; Chen, Z.; Qu, D.; et al. Microstructure and Electrochemical Behavior of a 3D-Printed Ti-6Al-4V Alloy. Materials 2022, 15. [Google Scholar] [CrossRef]
- Laleh, M.; Sadeghi, E.; Revilla, R.I.; et al. Heat treatment for metal additive manufacturing. Prog Mater Sci 2023, 133, 101051. [Google Scholar] [CrossRef]
- Lu, Y.; Aristizabal, M.; Wang, X.; et al. The influence of heat treatment on the microstructure and properties of HIPped Ti-6Al-4V. Acta Mater 2019, 165, 520–527. [Google Scholar] [CrossRef]
- Fan, Z.; Feng, H. Study on selective laser melting and heat treatment of Ti-6Al-4V alloy. Results Phys 2018, 10, 660–664. [Google Scholar] [CrossRef]
- Vrancken, B.; Thijs, L.; Kruth, J.P.; Van Humbeeck, J. Heat treatment of Ti6Al4V produced by Selective Laser Melting: Microstructure and mechanical properties. J Alloys Compd 2012, 541, 177–185. [Google Scholar] [CrossRef]
- Qi, Z.; Wang, B.; Zhang, P.; et al. Different effects of multiscale microstructure on fatigue crack growth path and rate in selective laser melted Ti6Al4V. Fatigue Fract Eng Mater Struct 2022, 45, 2457–2467. [Google Scholar] [CrossRef]
- Dhiman, S.; Chinthapenta, V.; Brandt, M.; et al. Microstructure control in additively manufactured Ti-6Al-4V during high-power laser powder bed fusion. Addit Manuf 2024, 96, 104573. [Google Scholar] [CrossRef]
- Sames, W.J.; List, F.A.; Pannala, S.; et al. The metallurgy and processing science of metal additive manufacturing. Int Mater Rev 2016, 61, 315–360. [Google Scholar] [CrossRef]
- ASTM Standard Test Method for Measurement of Fatigue Crack Growth Rates. 2023. [CrossRef]
- Rans, C.; Michielssen, J.; Walker, M.; et al. Beyond the orthogonal: on the influence of build orientation on fatigue crack growth in SLM Ti-6Al-4V. Int J Fatigue 2018, 116, 344–354. [Google Scholar] [CrossRef]
- Jesus, J.S.; Borrego, L.P.; Ferreira, J.A.M.; et al. Fatigue crack growth behaviour in Ti6Al4V alloy specimens produced by selective laser melting. Int J Fract 2020, 223, 123–133. [Google Scholar] [CrossRef]
- Oh, H.; Kim, J.G.; Lee, J.; Kim, S. Environment-Assisted Fatigue Crack Propagation (EAFCP) Behavior of Ti64 Alloy Fabricated by Direct Energy Deposition (DED) Process. Metall Mater Trans A Phys Metall Mater Sci 2022, 53, 3604–3614. [Google Scholar] [CrossRef]
- Kim, S.; Oh, H.; Kim, J.G.; Kim, S. Effect of Annealing and Crack Orientation on Fatigue Crack Propagation of Ti64 Alloy Fabricated by Direct Energy Deposition Process. Met Mater Int 2022, 28, 205–215. [Google Scholar] [CrossRef]
- Becker, T.H.; Dhansay, N.M.; Haar GMTer Vanmeensel, K. Near-threshold fatigue crack growth rates of laser powder bed fusion produced Ti-6Al-4V. Acta Mater 2020, 197, 269–282. [Google Scholar] [CrossRef]
- Jesus, J.S.; Borrego, L.P.; Ferreira, J.A.M.; et al. Fatigue crack growth under corrosive environments of Ti-6Al-4V specimens produced by SLM. Eng Fail Anal 2020, 118, 104852. [Google Scholar] [CrossRef]
- Galarraga, H.; Warren, R.J.; Lados, D.A.; et al. Fatigue crack growth mechanisms at the microstructure scale in as-fabricated and heat treated Ti-6Al-4V ELI manufactured by electron beam melting (EBM). Eng Fract Mech 2017, 176, 263–280. [Google Scholar] [CrossRef]
- Konečná, R.; Kunz, L.; Bača, A.; Nicoletto, G. Resistance of direct metal laser sintered Ti6Al4V alloy against growth of fatigue cracks. Eng Fract Mech 2017, 185, 82–91. [Google Scholar] [CrossRef]
- Hu, Y.; Ao, N.; Wu, S.; et al. Influence of in situ micro-rolling on the improved strength and ductility of hybrid additively manufactured metals. Eng Fract Mech 2021, 253. [Google Scholar] [CrossRef]
- Shamir, M.; Zhang, X.; Syed, A.K. Characterising and representing small crack growth in an additive manufactured titanium alloy. Eng Fract Mech 2021, 253, 107876. [Google Scholar] [CrossRef]
- Akgun, E.; Zhang, X.; Lowe, T.; et al. Fatigue of laser powder-bed fusion additive manufactured Ti-6Al-4V in presence of process-induced porosity defects. Eng Fract Mech 2022, 259. [Google Scholar] [CrossRef]
- Lee, E.U.; Vasudevan, A.K.; Sadananda, K. Effects of various environments on fatigue crack growth in Laser formed and im Ti-6Al-4V alloys. Int J Fatigue 2005, 27, 1597–1607. [Google Scholar] [CrossRef]
- Leuders, S.; Thöne, M.; Riemer, A.; et al. On the mechanical behaviour of titanium alloy TiAl6V4 manufactured by selective laser melting: Fatigue resistance and crack growth performance. Int J Fatigue 2013, 48, 300–307. [Google Scholar] [CrossRef]
- Greitemeier, D.; Palm, F.; Syassen, F.; Melz, T. Fatigue performance of additive manufactured TiAl6V4 using electron and laser beam melting. Int J Fatigue 2017, 94, 211–217. [Google Scholar] [CrossRef]
- Seifi, M.; Salem, A.; Satko, D.; et al. Defect distribution and microstructure heterogeneity effects on fracture resistance and fatigue behavior of EBM Ti–6Al–4V. Int J Fatigue 2017, 94, 263–287. [Google Scholar] [CrossRef]
- Zhai, Y.; Lados, D.A.; Brown, E.J.; Vigilante, G.N. Fatigue crack growth behavior and microstructural mechanisms in Ti-6Al-4V manufactured by laser engineered net shaping. Int J Fatigue 2016, 93, 51–63. [Google Scholar] [CrossRef]
- Benedetti, M.; Santus, C. Notch fatigue and crack growth resistance of Ti-6Al-4V ELI additively manufactured via selective laser melting: A critical distance approach to defect sensitivity. Int J Fatigue 2019, 121, 281–292. [Google Scholar] [CrossRef]
- Sun, W.; Ma, Y.; Huang, W.; et al. Effects of build direction on tensile and fatigue performance of selective laser melting Ti6Al4V titanium alloy. Int J Fatigue 2020, 130. [Google Scholar] [CrossRef]
- Qian, G.; Jian, Z.; Pan, X.; Berto, F. In-situ investigation on fatigue behaviors of Ti-6Al-4V manufactured by selective laser melting. Int J Fatigue 2020, 133, 105424. [Google Scholar] [CrossRef]
- Hu, Y.N.; Wu, S.C.; Wu, Z.K.; et al. A new approach to correlate the defect population with the fatigue life of selective laser melted Ti-6Al-4V alloy. Int J Fatigue 2020, 136. [Google Scholar] [CrossRef]
- Tarik Hasib, M.; Ostergaard, H.E.; Li, X.; Kruzic, J.J. Fatigue crack growth behavior of laser powder bed fusion additive manufactured Ti-6Al-4V: Roles of post heat treatment and build orientation. Int J Fatigue 2021, 142, 105955. [Google Scholar] [CrossRef]
- Kahlin, M.; Ansell, H.; Moverare, J. Fatigue crack growth for through and part-through cracks in additively manufactured Ti6Al4V. Int J Fatigue 2022, 155, 106608. [Google Scholar] [CrossRef]
- Sun, W.; Ma, Y.E.; Li, P.; Wang, Z. Residual stress and long fatigue crack growth behaviour of laser powder bed fused Ti6Al4V: Role of build direction. Int J Fatigue 2022, 160. [Google Scholar] [CrossRef]
- Su, C.; Yu, H.; Wang, Z.; et al. Controlling the tensile and fatigue properties of selective laser melted Ti–6Al–4V alloy by post treatment. J Alloys Compd 2021, 857, 157552. [Google Scholar] [CrossRef]
- Ye, H.; Le, F.; Wei, C.; et al. Fatigue crack growth behavior of Ti-6Al-4V alloy fabricated via laser metal deposition: Effects of building orientation and heat treatment. J Alloys Compd 2021, 868, 159023. [Google Scholar] [CrossRef]
- Xu, Z.; Liu, A.; Wang, X. Fatigue performance differences between rolled and selective laser melted Ti6Al4V alloys. Mater Charact 2022, 189, 111963. [Google Scholar] [CrossRef]
- Zhang, J.; Wang, X.; Paddea, S.; Zhang, X. Fatigue crack propagation behaviour in wire+arc additive manufactured Ti-6Al-4V: Effects of microstructure and residual stress. Mater Des 2016, 90, 551–561. [Google Scholar] [CrossRef]
- Hu, Y.N.; Wu, S.C.; Withers, P.J.; et al. The effect of manufacturing defects on the fatigue life of selective laser melted Ti-6Al-4V structures. Mater Des 2020, 192. [Google Scholar] [CrossRef]
- Xie, Y.; Gao, M.; Wang, F.; et al. Anisotropy of fatigue crack growth in wire arc additive manufactured Ti-6Al-4V. Mater Sci Eng A 2018, 709, 265–269. [Google Scholar] [CrossRef]
- Syed, A.K.; Ahmad, B.; Guo, H.; et al. An experimental study of residual stress and direction-dependence of fatigue crack growth behaviour in as-built and stress-relieved selective-laser-melted Ti6Al4V. Mater Sci Eng A 2019, 755, 246–257. [Google Scholar] [CrossRef]
- Xu, Z.W.; Liu, A.; Wang, X.S. The influence of building direction on the fatigue crack propagation behavior of Ti6Al4V alloy produced by selective laser melting. Mater Sci Eng A 2019, 767. [Google Scholar] [CrossRef]
- Syed, A.K.; Zhang, X.; Davis, A.E.; et al. Effect of deposition strategies on fatigue crack growth behaviour of wire + arc additive manufactured titanium alloy Ti–6Al–4V. Mater Sci Eng A 2021, 814. [Google Scholar] [CrossRef]
- Ren, Y.; Lin, X.; Jian, Z.; et al. Long fatigue crack growth behavior of Ti–6Al–4V produced via high-power laser directed energy deposition. Mater Sci Eng A 2021, 819, 141392. [Google Scholar] [CrossRef]
- Xie, Y.; Gong, M.; Zhou, Q.; et al. Effect of microstructure on fatigue crack growth of wire arc additive manufactured Ti–6Al–4V. Mater Sci Eng A 2021, 826, 141942. [Google Scholar] [CrossRef]
- Wang, Z.; Wang, S.; Yang, K.; et al. In-situ SEM investigation on the fatigue behavior of Ti–6Al–4V ELI fabricated by the powder-blown underwater directed energy deposition technique. Mater Sci Eng A 2022, 838, 142783. [Google Scholar] [CrossRef]
- Lv, H.; Zhang, Z.; Chen, Y.; et al. The anisotropy of high cycle fatigue property and fatigue crack growth behavior of Ti–6Al–4V alloy fabricated by high-power laser metal deposition. Mater Sci Eng A 2022, 853, 143745. [Google Scholar] [CrossRef]
- Zhai, Y.; Galarraga, H.; Lados, D.A. Microstructure Evolution, Tensile Properties, and Fatigue Damage Mechanisms in Ti-6Al-4V Alloys Fabricated by Two Additive Manufacturing Techniques. Procedia Eng 2015, 114, 658–666. [Google Scholar] [CrossRef]
- Jiao, Z.H.; Xu, R.D.; Yu, H.C.; Wu, X.R. Evaluation on Tensile and Fatigue Crack Growth Performances of Ti6Al4V Alloy Produced by Selective Laser Melting. Procedia Struct Integr 2017, 7, 124–132. [Google Scholar] [CrossRef]
- Sun, W.; Ma, Y.; Ai, X.; Li, J. Effects of the building direction on fatigue crack growth behavior of Ti-6Al-4V manufactured by selective laser melting. Procedia Struct Integr 2018, 13, 1020–1025. [Google Scholar] [CrossRef]
- de Jesus, J.; Borrego, L.P.; Vilhena, L.; etal., *!!! REPLACE !!!*. Effect of artificial saliva on the fatigue and wear response of TiAl6V4 specimens produced by SLM. Procedia Struct Integr 2020, 28, 790–795. [Google Scholar] [CrossRef]
- Borrego, L.P.; Jesus, J.S.; Ferreira, J.A.M.; et al. Overloading effect on transient fatigue crack growth of Ti-6Al-4V parts produced by Laser Powder Bed Fusion. Procedia Struct Integr 2021, 37, 330–335. [Google Scholar] [CrossRef]
- Zhao, Z.; Chen, J.; Tan, H.; et al. In situ tailoring microstructure in laser solid formed titanium alloy for superior fatigue crack growth resistance. Scr Mater 2020, 174, 53–57. [Google Scholar] [CrossRef]
- Jesus, J.S.; Borrego, L.P.; Ferreira, J.A.M.; et al. Fatigue crack growth in Ti-6Al-4V specimens produced by Laser Powder Bed Fusion and submitted to Hot Isostatic Pressing. Theor Appl Fract Mech 2022, 118, 103231. [Google Scholar] [CrossRef]
- Edwards, P.; Ramulu, M. Effect of build direction on the fracture toughness and fatigue crack growth in selective laser melted Ti-6Al-4V. Fatigue Fract Eng Mater Struct 2015, 38, 1228–1236. [Google Scholar] [CrossRef]
- Zhang, X.; Martina, F.; Ding, J.; et al. Fracture toughness and fatigue crack growth rate properties in wire + arc additive manufactured Ti-6Al-4V. Fatigue Fract Eng Mater Struct 2017, 40, 790–803. [Google Scholar] [CrossRef]
- Hu, Y.; Wu, S.; Xie, C.; et al. Fatigue life evaluation of Ti–6Al–4V welded joints manufactured by electron beam melting. Fatigue Fract Eng Mater Struct 2021, 44, 2210–2221. [Google Scholar] [CrossRef]
- Wu, L.; Jiao, Z.; Yu, H. Study on fatigue crack growth behavior of selective laser-melted Ti6Al4V under different build directions, stress ratios, and temperatures. Fatigue Fract Eng Mater Struct 2022, 45, 1421–1434. [Google Scholar] [CrossRef]
- Wu, L.; Jiao, Z.; Yu, H. Study on small crack growth behavior of laser powder bed fused Ti6Al4V alloy. Fatigue Fract Eng Mater Struct 2022, 1–13. [Google Scholar] [CrossRef]
- Roberts, C.; McGill, P.; Foreman, L.; et al. Material characterization of additively manufactured Ti-6Al-4V parts for an environmental control and life support system in space flight hardware. Mater Perform Charact 2020, 9, 714–731. [Google Scholar] [CrossRef]
- Ferreira, F.F.; Neto, D.M.; Jesus, J.S.; et al. Numerical prediction of the fatigue crack growth rate in SLM Ti-6Al-4V based on crack tip plastic strain. Metals 2020, 10, 1–22. [Google Scholar] [CrossRef]
- Liu, J.; Liu, J.; Li, Y.; et al. Effects of Heat Treatments on Microstructures and Mechanical Properties of Ti6Al4V Alloy Produced by Laser Solid Forming. Metals 2021, 11. [Google Scholar] [CrossRef]
- Jesus, J.D.; Borges, M.; Antunes, F.; Ferreira, J.; Reis, L.; Capela, C. A Novel Specimen Produced by Additive Manufacturing for Pure Plane Strain Fatigue Crack Growth Studies. Metals 2021, 1–18. [Google Scholar] [CrossRef]
- Paul, M.; Soman, S.; Shao, S.; Shamsaei, N. Fatigue crack growth in L-PBF Ti-6Al-4V : Influence of notch orientation, stress ratio, and volumetric defects. Int J Fatigue 2025, 198, 109027. [Google Scholar] [CrossRef]
- Dhansay, N.M.; Tait, R.; Becker, T. Fatigue and fracture toughness of Ti-6Al-4V titanium alloy manufactured by selective laser melting. Adv Mater Res 1019, 1019, 248–253. [Google Scholar] [CrossRef]
- Cain, V.; Thijs, L.; Van Humbeeck, J.; et al. Crack propagation and fracture toughness of Ti6Al4V alloy produced by selective laser melting. Addit Manuf 2015, 5, 68–76. [Google Scholar] [CrossRef]
- Wycisk, E.; Solbach, A.; Siddique, S.; et al. Effects of defects in laser additive manufactured Ti-6Al-4V on fatigue properties. Phys Procedia 2014, 56, 371–378. [Google Scholar] [CrossRef]
- Zhang, H.; Dong, D.; Su, S.; Chen, A. Experimental study of effect of post processing on fracture toughness and fatigue crack growth performance of selective laser melting Ti-6Al-4V. Chinese J Aeronaut 2019, 32, 2383–2393. [Google Scholar] [CrossRef]
- Konečná, R.; Kunz, L.; Bača, A.; Nicoletto, G. Long Fatigue Crack Growth in Ti6Al4V Produced by Direct Metal Laser Sintering. Procedia Eng 2016, 160, 69–76. [Google Scholar] [CrossRef]
- Macallister, N.; Vanmeensel, K.; Becker, T.H. Fatigue crack growth parameters of Laser Powder Bed Fusion produced Ti-6Al-4V. Int J Fatigue 2021, 145, 106100. [Google Scholar] [CrossRef]
- Waddell, M.; Walker, K.; Bandyopadhyay, R.; et al. Small fatigue crack growth behavior of Ti-6Al-4V produced via selective laser melting: In situ characterization of a 3D crack tip interactions with defects. Int J Fatigue 2020, 137, 105638. [Google Scholar] [CrossRef]
- Kumar, P.; Prakash, O.; Ramamurty, U. Micro-and meso-structures and their influence on mechanical properties of selectively laser melted Ti-6Al-4V. Acta Mater 2018, 154, 246–260. [Google Scholar] [CrossRef]
- Giannella, V.; Franchitti, S.; Borrelli, R.; Sepe, R. Influence of building direction on the fatigue crack-growth of Ti6Al4V specimens made by EBM. Procedia Struct Integr 2024, 53, 172–177. [Google Scholar] [CrossRef]
- Kumar, P.; Prakash, O.; Ramamurty, U. Micro-and meso-structures and their influence on mechanical properties of selectively laser melted Ti-6Al-4V. Acta Mater 2018, 154, 246–260. [Google Scholar] [CrossRef]
- Weertman, J.; Brown, R.D. 7050.
- Correia, J.A.F.O.; De Jesus, A.M.P.; Moreira, P.M.G.P.; Tavares, P.J.S. Crack Closure Effects on Fatigue Crack Propagation Rates: Application of a Proposed Theoretical Model. Adv Mater Sci Eng 2016. [Google Scholar] [CrossRef]
- ELBERW Fatigue Crack Closure Under Cyclic Tension. Eng Fract Mech 1970, 2, 37–44. [CrossRef]
- Zhai, Y.; Lados, D.A.; Brown, E.J.; Vigilante, G.N. Fatigue crack growth behavior and microstructural mechanisms in Ti-6Al-4V manufactured by laser engineered net shaping. Int J Fatigue 2016, 93, 51–63. [Google Scholar] [CrossRef]
- Shrestha, S.; El Rassi, J.; Kannan, M.; et al. Fracture toughness and fatigue crack growth rate properties of AM repaired Ti–6Al–4V by Direct Energy Deposition. Mater Sci Eng A 2021, 823, 141701. [Google Scholar] [CrossRef]
- Wheeler, O.E. Spectrum Loading and Crack Growth. J Basic Eng 1972, 94, 181–186. [Google Scholar] [CrossRef]
- Xie, Y.; Gong, M.; Luo, Z.; et al. Effect of microstructure on short fatigue crack growth of wire arc additive manufactured Ti-6Al-4V. Mater Charact 2021, 177, 111183. [Google Scholar] [CrossRef]
- Newman, J.C.; Annigeri, B.S. Fatigue-life prediction method based on small-crack theory in an engine material. J Eng Gas Turbines Power 2012, 134. [Google Scholar] [CrossRef]
- Newman, J.C.; Wu, X.R.; Swain, M.H.; et al. Small-crack growth and fatigue life predictions for high-strength aluminum alloys. Part II: Crack closure and fatigue analyses. Fatigue Fract Eng Mater Struct 2000, 23, 59–72. [Google Scholar] [CrossRef]
- Newman, J.C.; Elber, W. 1988.
- Yadollahi, A.; Shamsaei, N. Additive manufacturing of fatigue resistant materials: Challenges and opportunities. Int J Fatigue 2017, 98, 14–31. [Google Scholar] [CrossRef]
- Yu, S.; Park, S.; Lee, K.T.; et al. On the crack resistance and damage tolerance of 3D-printed nature-inspired hierarchical composite architecture. Nat Commun 2024, 15, 1–14. [Google Scholar] [CrossRef] [PubMed]
- Mote, A.; Lacy, T.E.; Newman, J.C. Assessing fatigue crack growth thresholds for a Ti-6Al-4V (STOA) alloy using two experimental methods. Eng Fract Mech 2024, 301, 110006. [Google Scholar] [CrossRef]
- Zhang, C.; Chen, F.; Huang, Z.; et al. Additive manufacturing of functionally graded materials: A review. Mater Sci Eng A 2019, 764, 138209. [Google Scholar] [CrossRef]
- Bobbio, L.D.; Bocklund, B.; Otis, R.; et al. Characterization of a functionally graded material of Ti-6Al-4V to 304L stainless steel with an intermediate V section. J Alloys Compd 2018, 742, 1031–1036. [Google Scholar] [CrossRef]
- Schneider-Maunoury, C.; Weiss, L.; Acquier, P.; et al. Functionally graded Ti6Al4V-Mo alloy manufactured with DED-CLAD ® process. Addit Manuf 2017, 17, 55–66. [Google Scholar] [CrossRef]
- Geng, Y.; Xie, W.; Tu, Y.; et al. Ti–6Al–4V microstructural functionally graded material by additive manufacturing: Experiment and computational modelling. Mater Sci Eng A 2021, 823, 141782. [Google Scholar] [CrossRef]
- Zhang, Y.; Bandyopadhyay, A. Direct fabrication of compositionally graded Ti-Al2O3 multi-material structures using Laser Engineered Net Shaping. Addit Manuf 2018, 21, 104–111. [Google Scholar] [CrossRef]
- Kafle, A.; Lu, S.; Silwal, R.; Zhu, W. A Review on Material Dynamics in Cold Spray Additive Manufacturing: Bonding, Stress, and Structural Evolution in Metals. Metals 2025, 15, 1–20. [Google Scholar] [CrossRef]
- Kafle, A.; Silwal, R.; Koirala, B.; Zhu, W. Advancements in Cold Spray Additive Manufacturing: Process, Materials, Optimization, Applications, and Challenges. Materials 2024, 17. [Google Scholar] [CrossRef]
- Ashokkumar, M.; Thirumalaikumarasamy, D.; Sonar, T.; et al. An overview of cold spray coating in additive manufacturing, component repairing and other engineering applications. J Mech Behav Mater 2022, 31, 514–534. [Google Scholar] [CrossRef]
- Agar, O.B.; Alex, A.C.; Kubacki, G.W.; et al. Corrosion Behavior of Cold Sprayed Aluminum Alloys 2024 and 7075 in an Immersed Seawater Environment. Corrosion 2021, 77, 1354–1364. [Google Scholar] [CrossRef] [PubMed]
- Bagherifard, S.; Guagliano, M. Fatigue performance of cold spray deposits: Coating, repair and additive manufacturing cases. Int J Fatigue 2020, 139, 105744. [Google Scholar] [CrossRef]
- Tan, A.W.Y.; Wen, S.; Khun, N.W.; et al. Potential of cold spray as additive manufacturing for TI6AL4V. Proc Int Conf Prog Addit Manuf Part 1290, F1290, 403–408. [Google Scholar] [CrossRef]
- SENGDHL; ZHANGZ; ZHANGZQ; et al. Influence of spray angle in cold spray deposition of Ti-6Al-4V coatings on Al6061-T6 substrates. Surf Coatings Technol 2022, 432, 128068. [Google Scholar] [CrossRef]
- Vaz, R.F.; Avila, J.A.; Barriobero-Vila, P.; et al. Heat treatment effect on microstructural evolution of cold spray additive manufacturing Ti6Al4V. J Mater Sci 2025, 60, 5558–5576. [Google Scholar] [CrossRef]
- Price, T.S.; Shipway, P.H.; McCartney, D.G. Effect of cold spray deposition of a titanium coating on fatigue behavior of a titanium alloy. Proc Int Therm Spray Conf 2006, 15, 507–512. [Google Scholar] [CrossRef]
- Tan, A.W.Y.; Sun, W.; Bhowmik, A.; et al. Effect of coating thickness on microstructure, mechanical properties and fracture behaviour of cold sprayed Ti6Al4V coatings on Ti6Al4V substrates. Surf Coatings Technol 2018, 349, 303–317. [Google Scholar] [CrossRef]
- Sun, W.; Tan, A.W.Y.; Khun, N.W.; et al. Effect of substrate surface condition on fatigue behavior of cold sprayed Ti6Al4V coatings. Surf Coatings Technol 2017, 320, 452–457. [Google Scholar] [CrossRef]
- Lett, S.; Cormier, J.; Quet, A.; et al. Microstructure optimization of cold sprayed Ti-6Al-4V using post-process heat treatment for improved mechanical properties. Addit Manuf 2024, 86. [Google Scholar] [CrossRef]
- Kondas, J.; Guagliano, M.; Bagherifard, S.; et al. Cold Spray Additive Manufacturing of Ti6Al4V: Deposition Optimization. J Therm Spray Technol 2024, 33, 2672–2685. [Google Scholar] [CrossRef]
- Chen, J.; Liu, Y. Fatigue modeling using neural networks: a comprehensive review. Authorea Prepr. 2021. [CrossRef]
- Alfred, S.O.; Amiri, M. A data-informed knowledge discovery framework to predict fatigue properties of additively manufactured Ti–6Al–4V, IN718 and AlSi10Mg alloys using fatigue databases. Prog Addit Manuf. 2025. [CrossRef]
- Leary, M.; Burvill, C. Applicability of published data for fatigue-limited design. Qual Reliab Eng Int 2009, 25, 921–932. [Google Scholar] [CrossRef]
- Rogers, J.; Qian, M.; Elambasseril, J.; et al. Fatigue test data applicability for additive manufacture: A method for quantifying the uncertainty of AM fatigue data. Mater Des 2023, 231, 111978. [Google Scholar] [CrossRef]
- ASTM Standard Practice for Reporting Data for Test Specimens Prepared by Additive Manufacturing. ASTM F2971 − 13 2021, 13, 1–4. [CrossRef]
- ASTM Standard Practice for Presentation of Constant Amplitude Fatigue Test Results for Metallic Materials. ASTM E468-18 2007, 90, 1–6. [CrossRef]
- Bayoumy, D.; Boll, T.; Karapuzha, A.S.; et al. Effective Platform Heating for Laser Powder Bed Fusion of an Al-Mn-Sc-Based Alloy. Materials 2023, 16. [Google Scholar] [CrossRef]
- Narvan, M.; Ghasemi, A.; Fereiduni, E.; et al. Part deflection and residual stresses in laser powder bed fusion of H13 tool steel. Mater Des 2021, 204, 109659. [Google Scholar] [CrossRef]
- Klingbeil, N.W.; Beuth, J.L.; Chin, R.K.; Amon, C.H. Residual stress-induced warping in direct metal solid freeform fabrication. Int J Mech Sci 2002, 44, 57–77. [Google Scholar] [CrossRef]
- Ranjbareslamloo, S.; Dzukey, G.A.; Islam Muhit, M.M.; Qattawi, A. Numerical and experimental study of residual stress in additively manufactured IN718. Manuf Lett 2025, 44, 915–927. [Google Scholar] [CrossRef]
Figure 1.
Representative optical microstructures of Ti64 obtained through various processing routes: (a) acicular α′ martensite formed by DED; (b) α′ martensitic structure in SLM material; (c) fine α + β dual-phase morphology from EBM; (d) dual-phase α + β structure produced by annealing DED alloy at 940 °C for 1 h followed by air cooling; (e) equiaxed primary α with secondary α + β lamellae in solution-treated and overaged wrought alloy; and (f) equiaxed α colonies in the mill-annealed condition. Reproduced with permission from Elsevier [29].
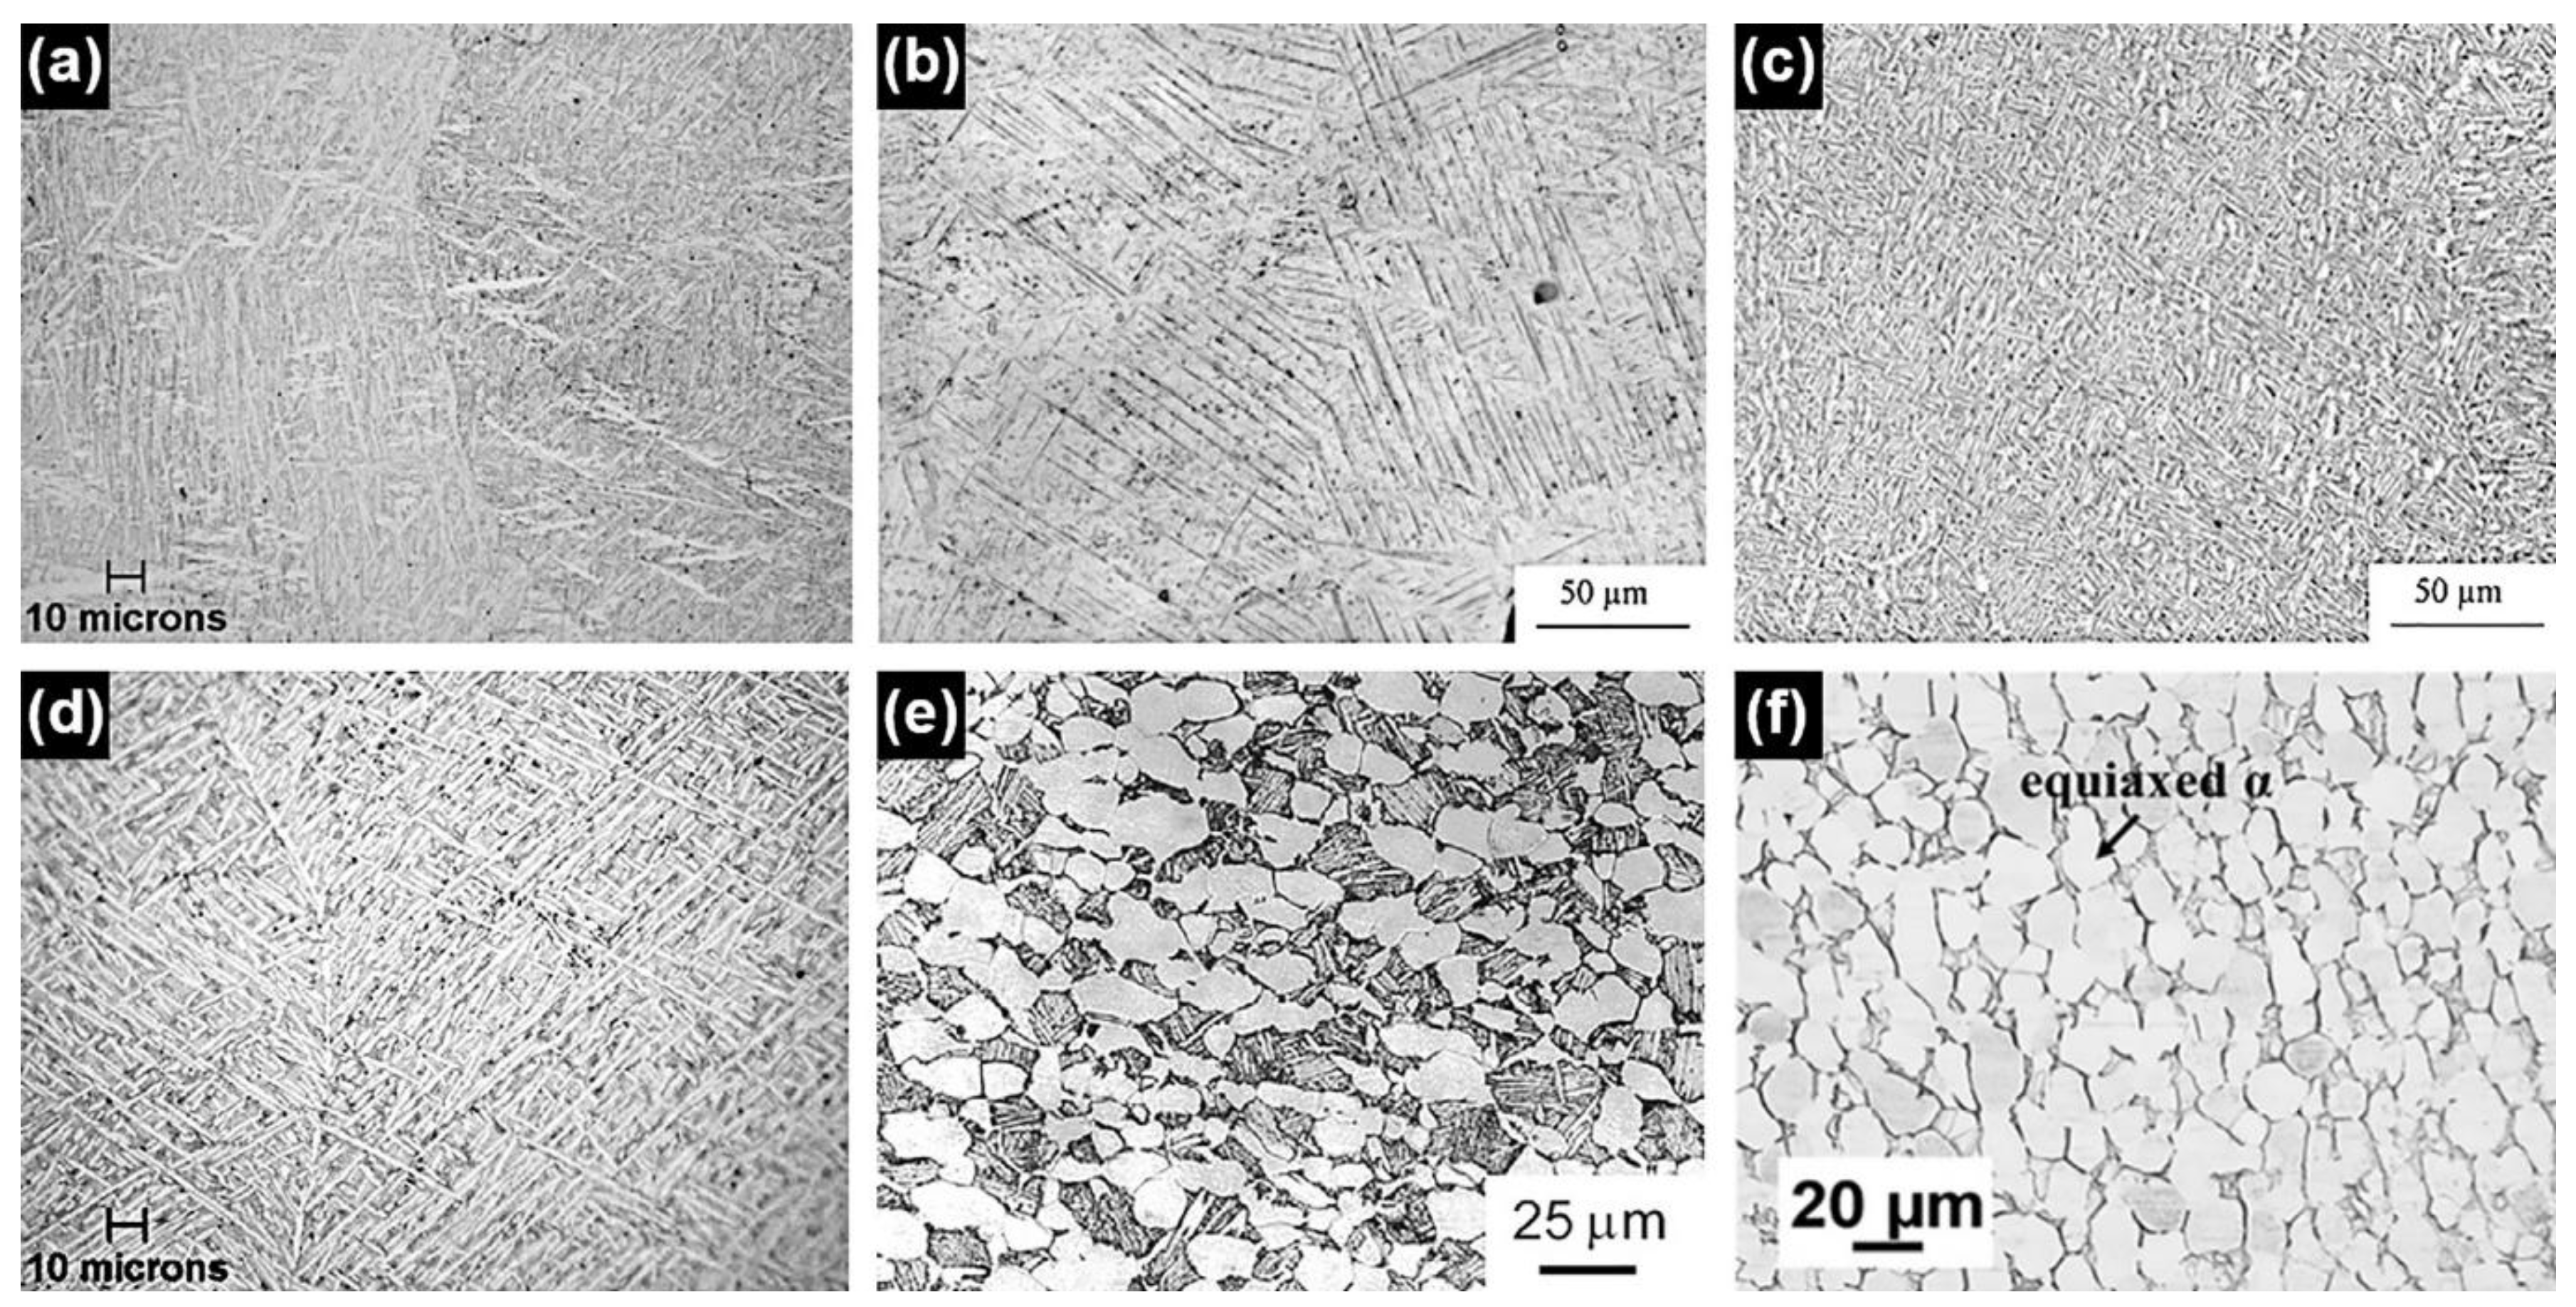
Figure 2.
Optical micrographs of Ti64 specimens fabricated by (a, b) SLM, (c, d) EBM, and (e, f) Isothermal forging. Reprinted with permission from MDPI [34].
Figure 2.
Optical micrographs of Ti64 specimens fabricated by (a, b) SLM, (c, d) EBM, and (e, f) Isothermal forging. Reprinted with permission from MDPI [34].
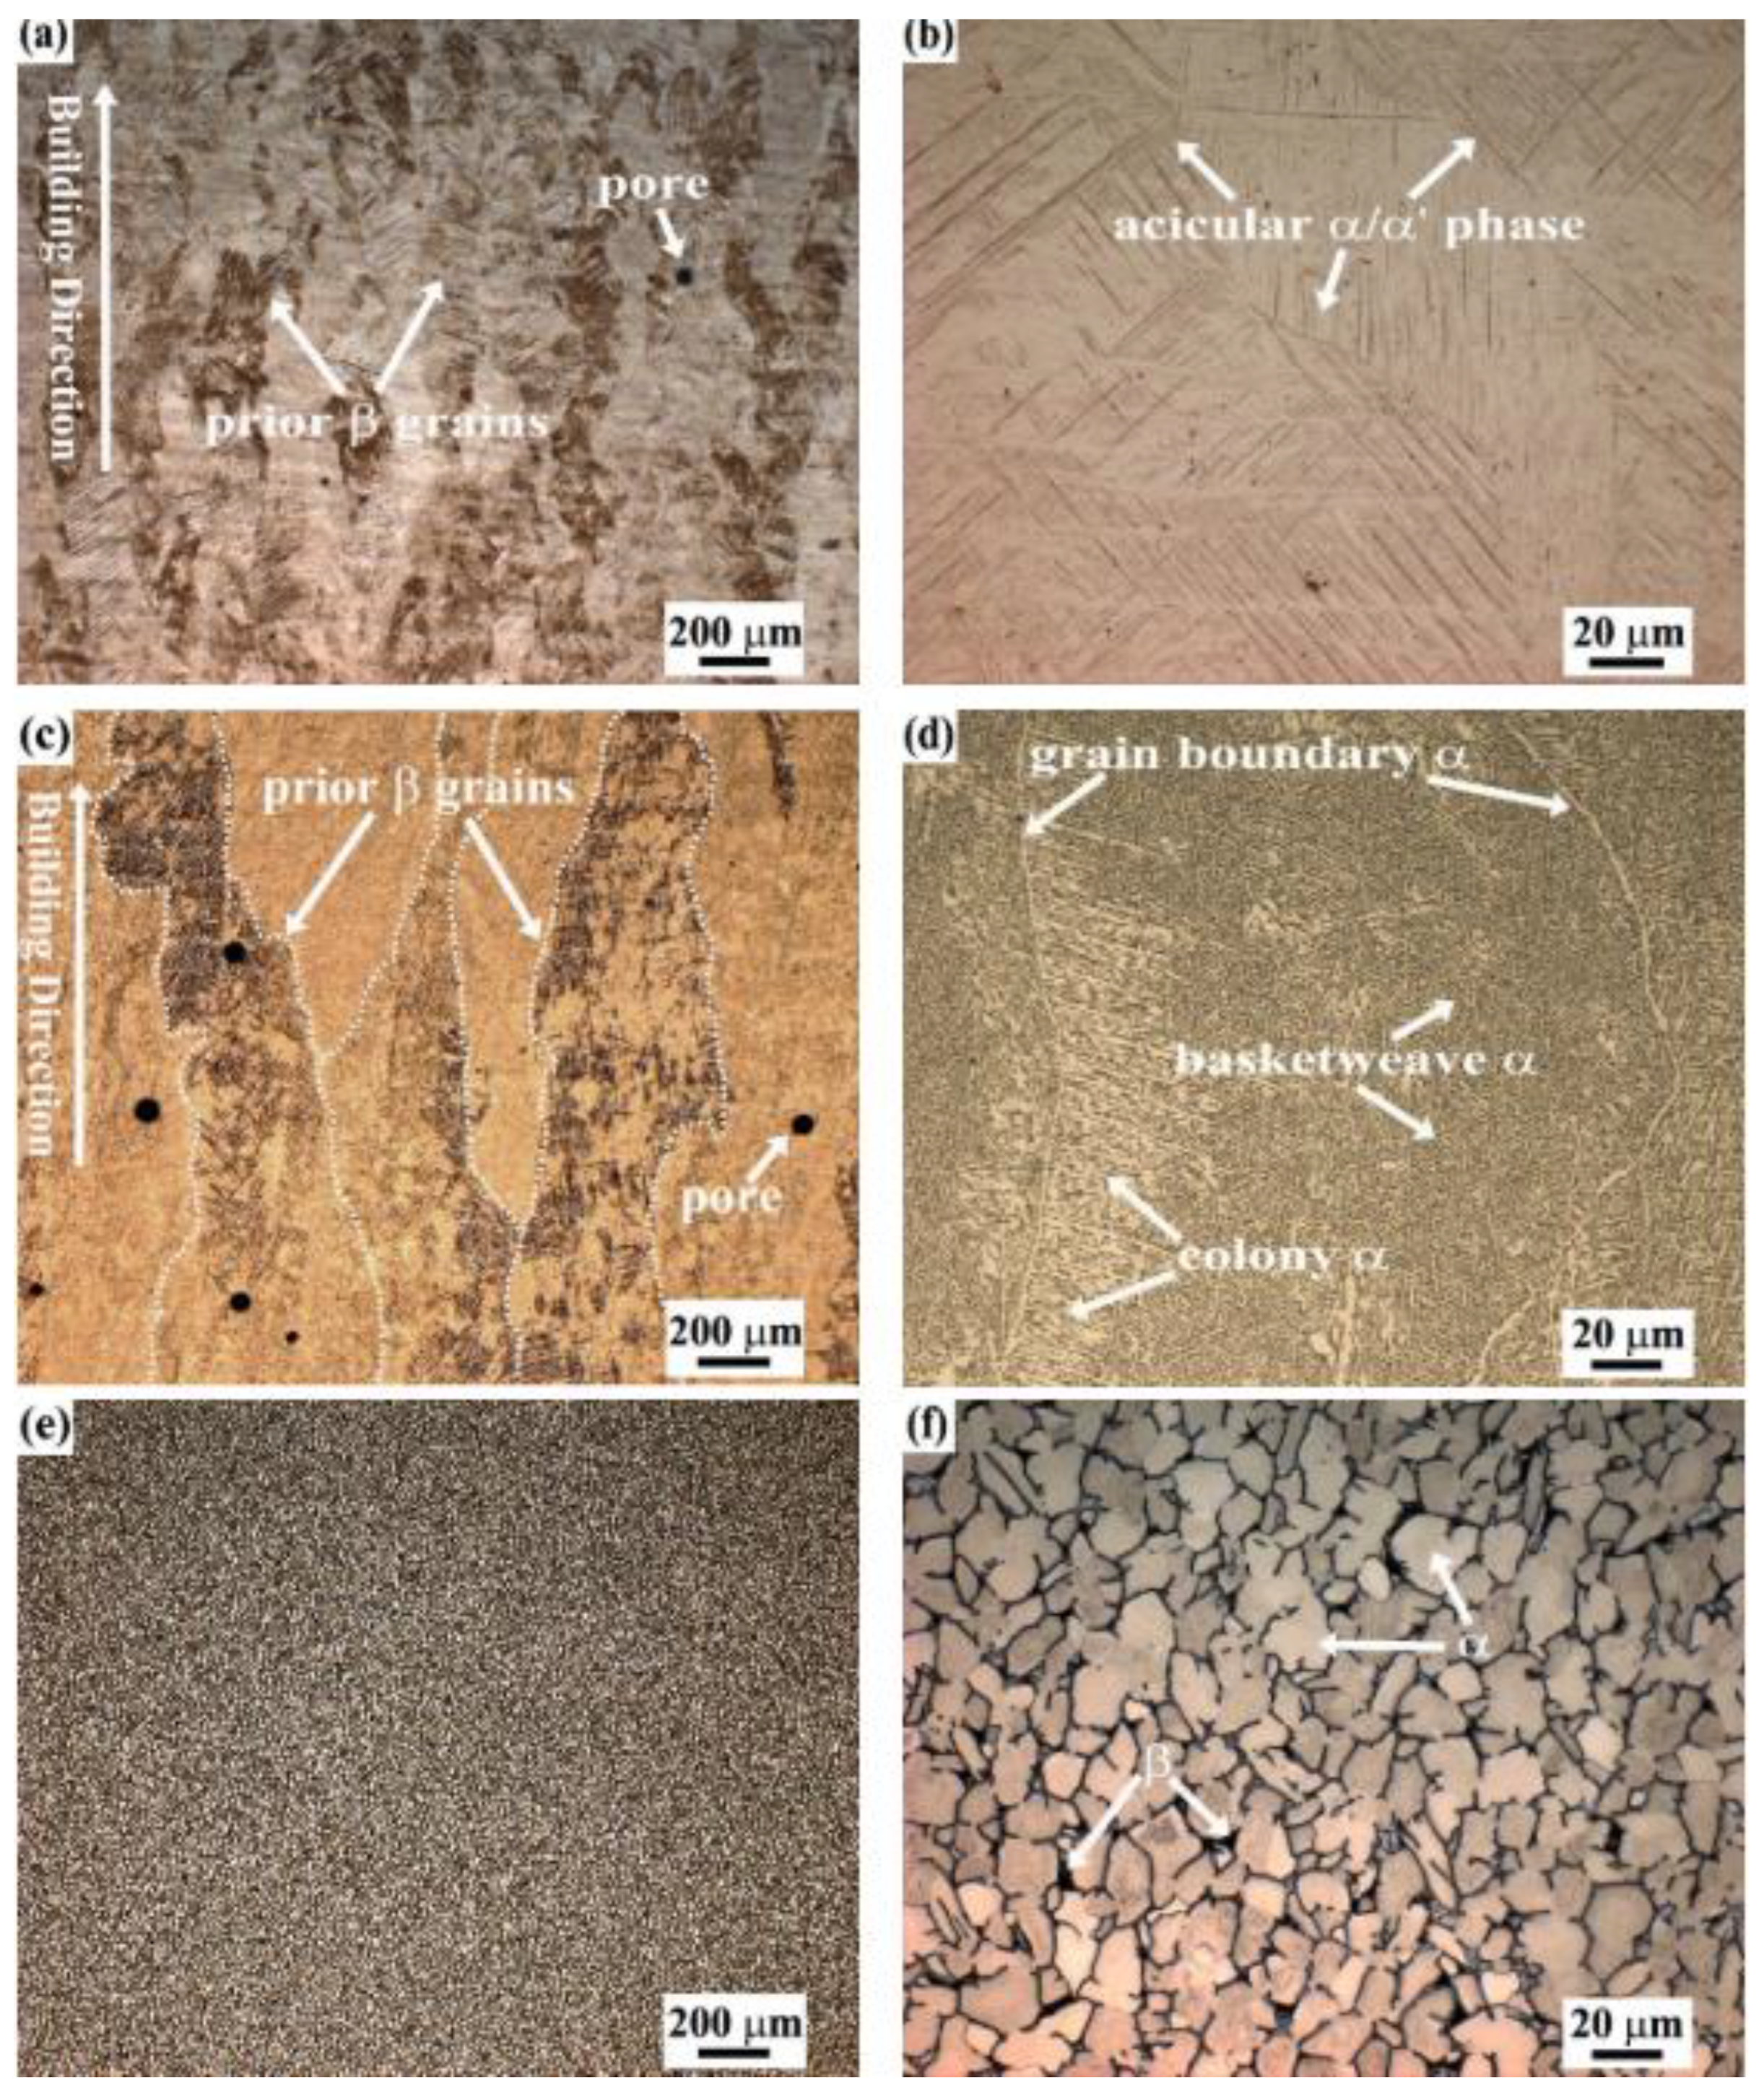
Figure 3.
Schematic illustration showing: (a) the types of cracks commonly studied in FCG research; (b) the key parameters measured during long crack FCG tests; and (c) trends in FCG data.
Figure 3.
Schematic illustration showing: (a) the types of cracks commonly studied in FCG research; (b) the key parameters measured during long crack FCG tests; and (c) trends in FCG data.
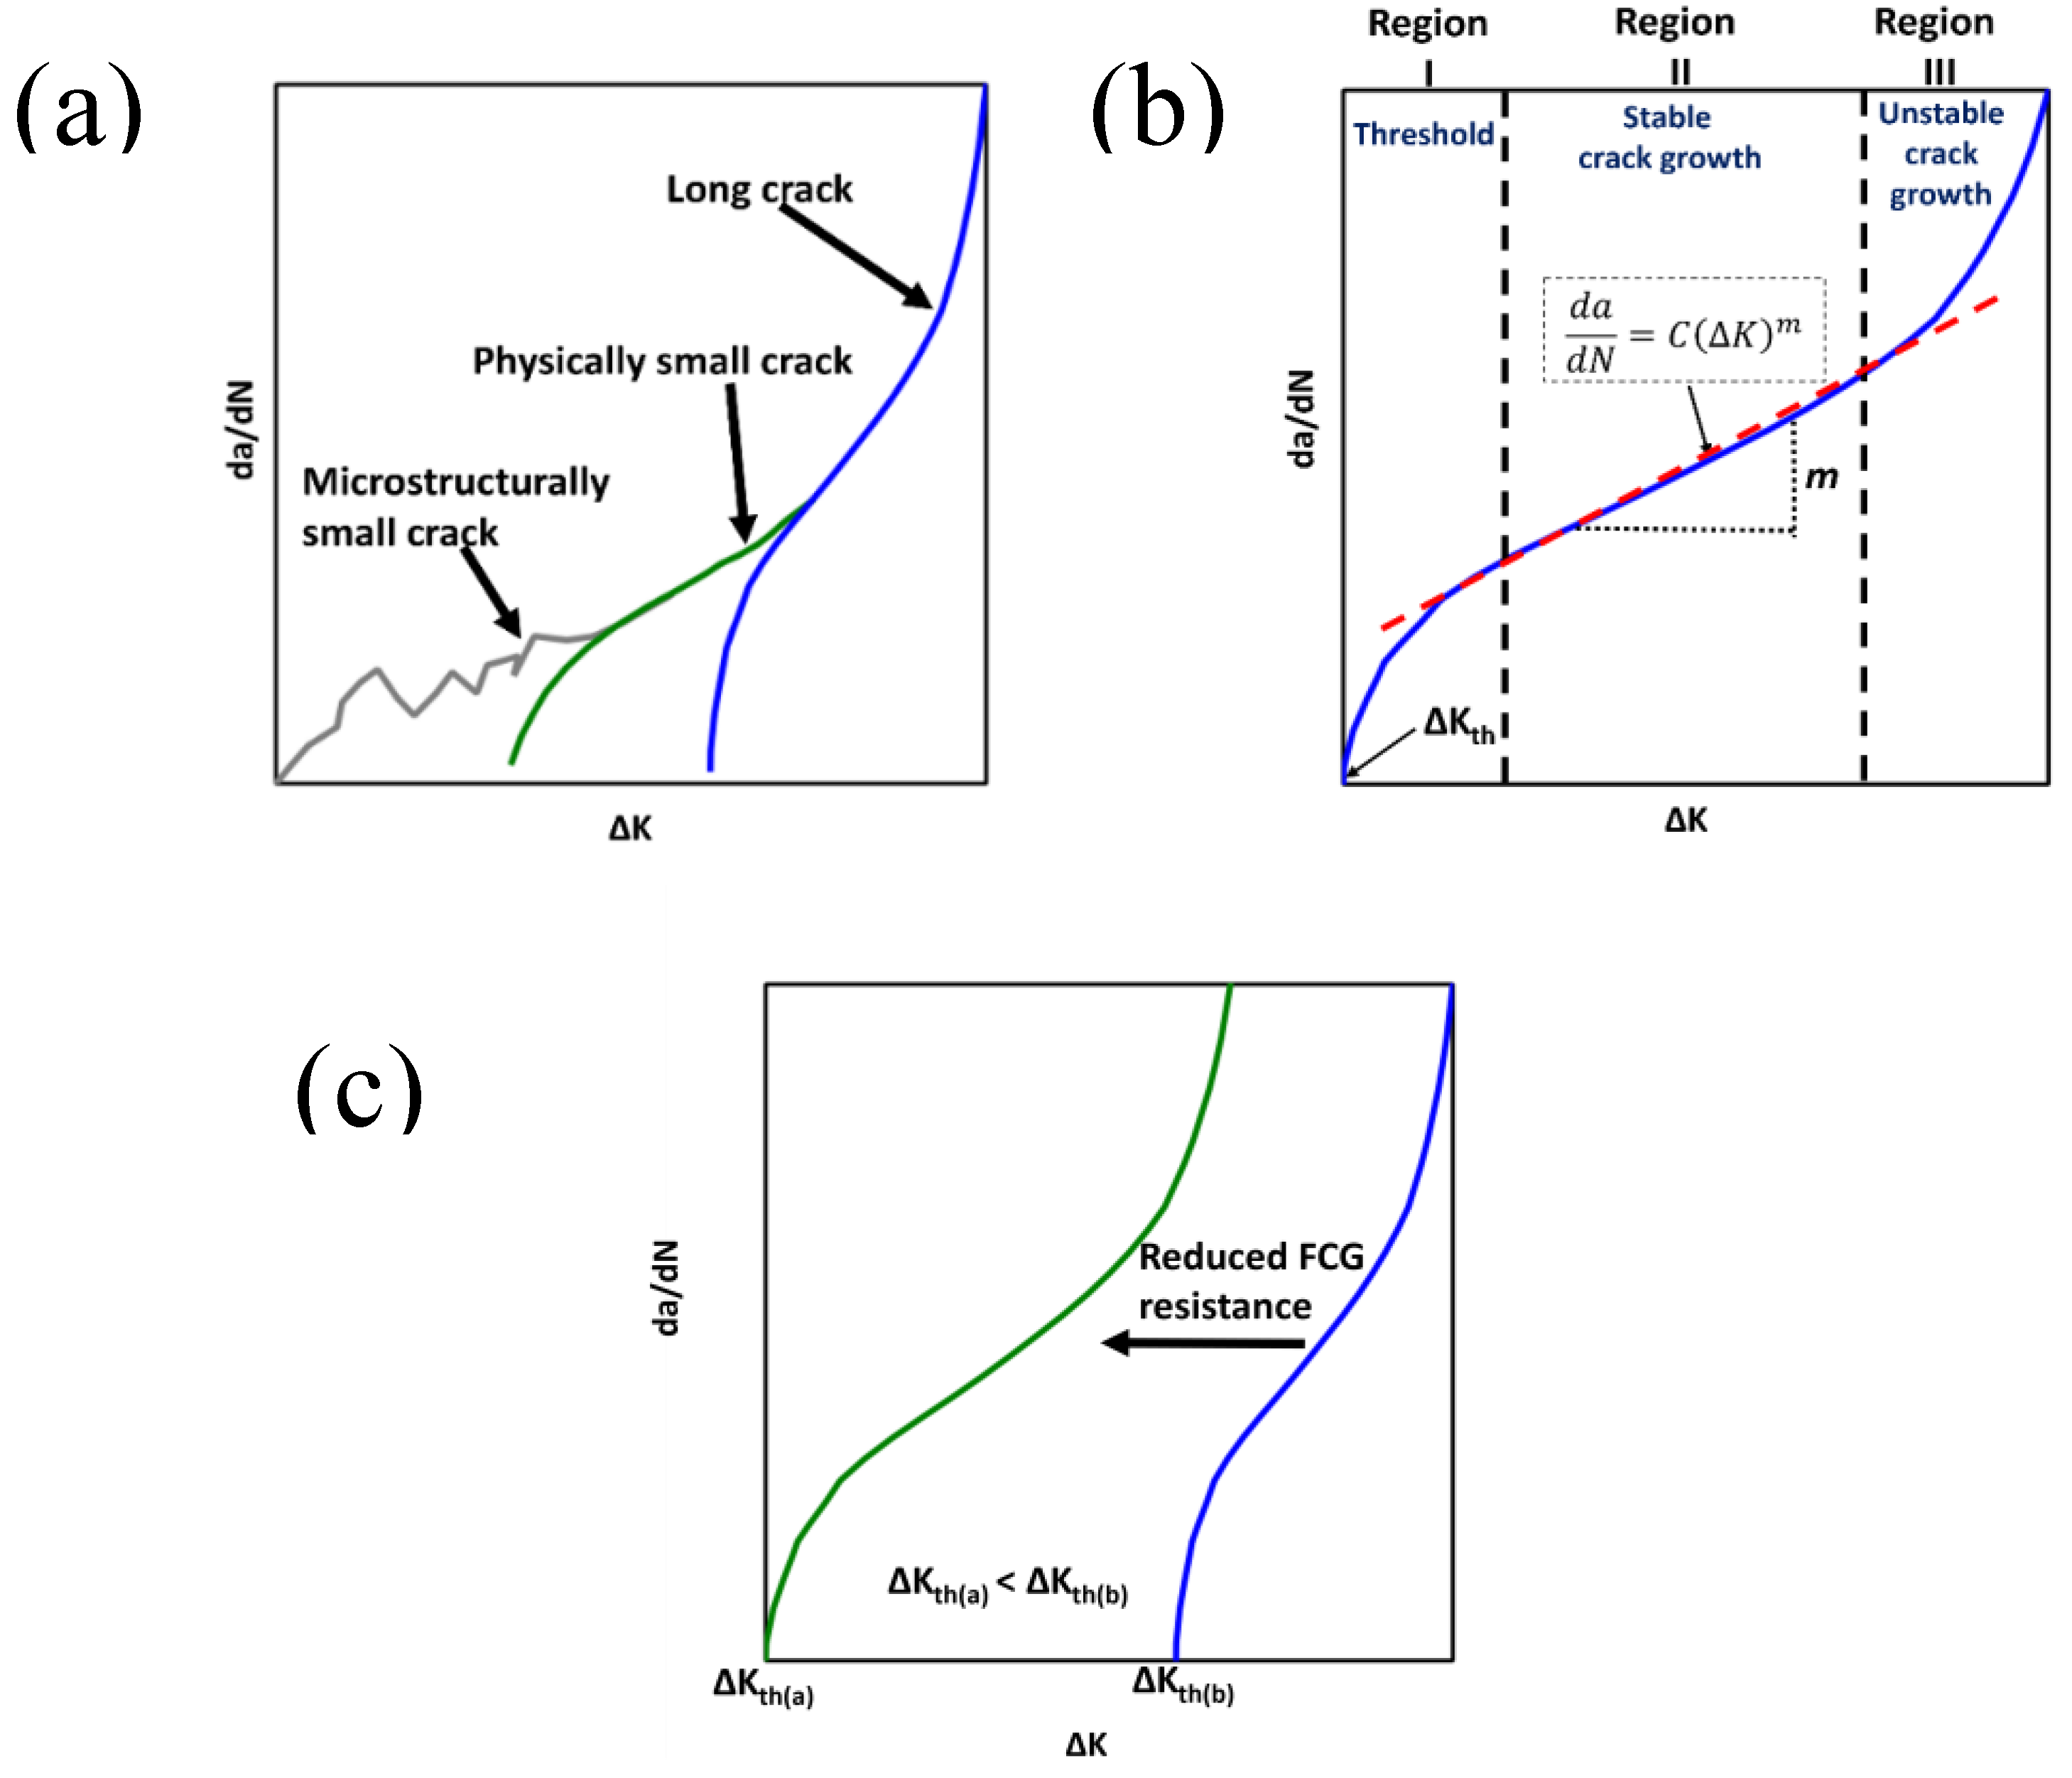
Figure 4.
Schematic illustration of: (a) commonly used specimen geometries in FCG studies; (b) nomenclature defining the standard orientations used in this review, including transverse (XYZ and YXZ), horizontal (XZY and YZX), diagonal, and vertical (ZXY and ZYX) builds; (c) equivalent orientations as in (b) with reversed notch directions; and (d) off-axis specimens with notches oriented at various angles relative to the build direction.
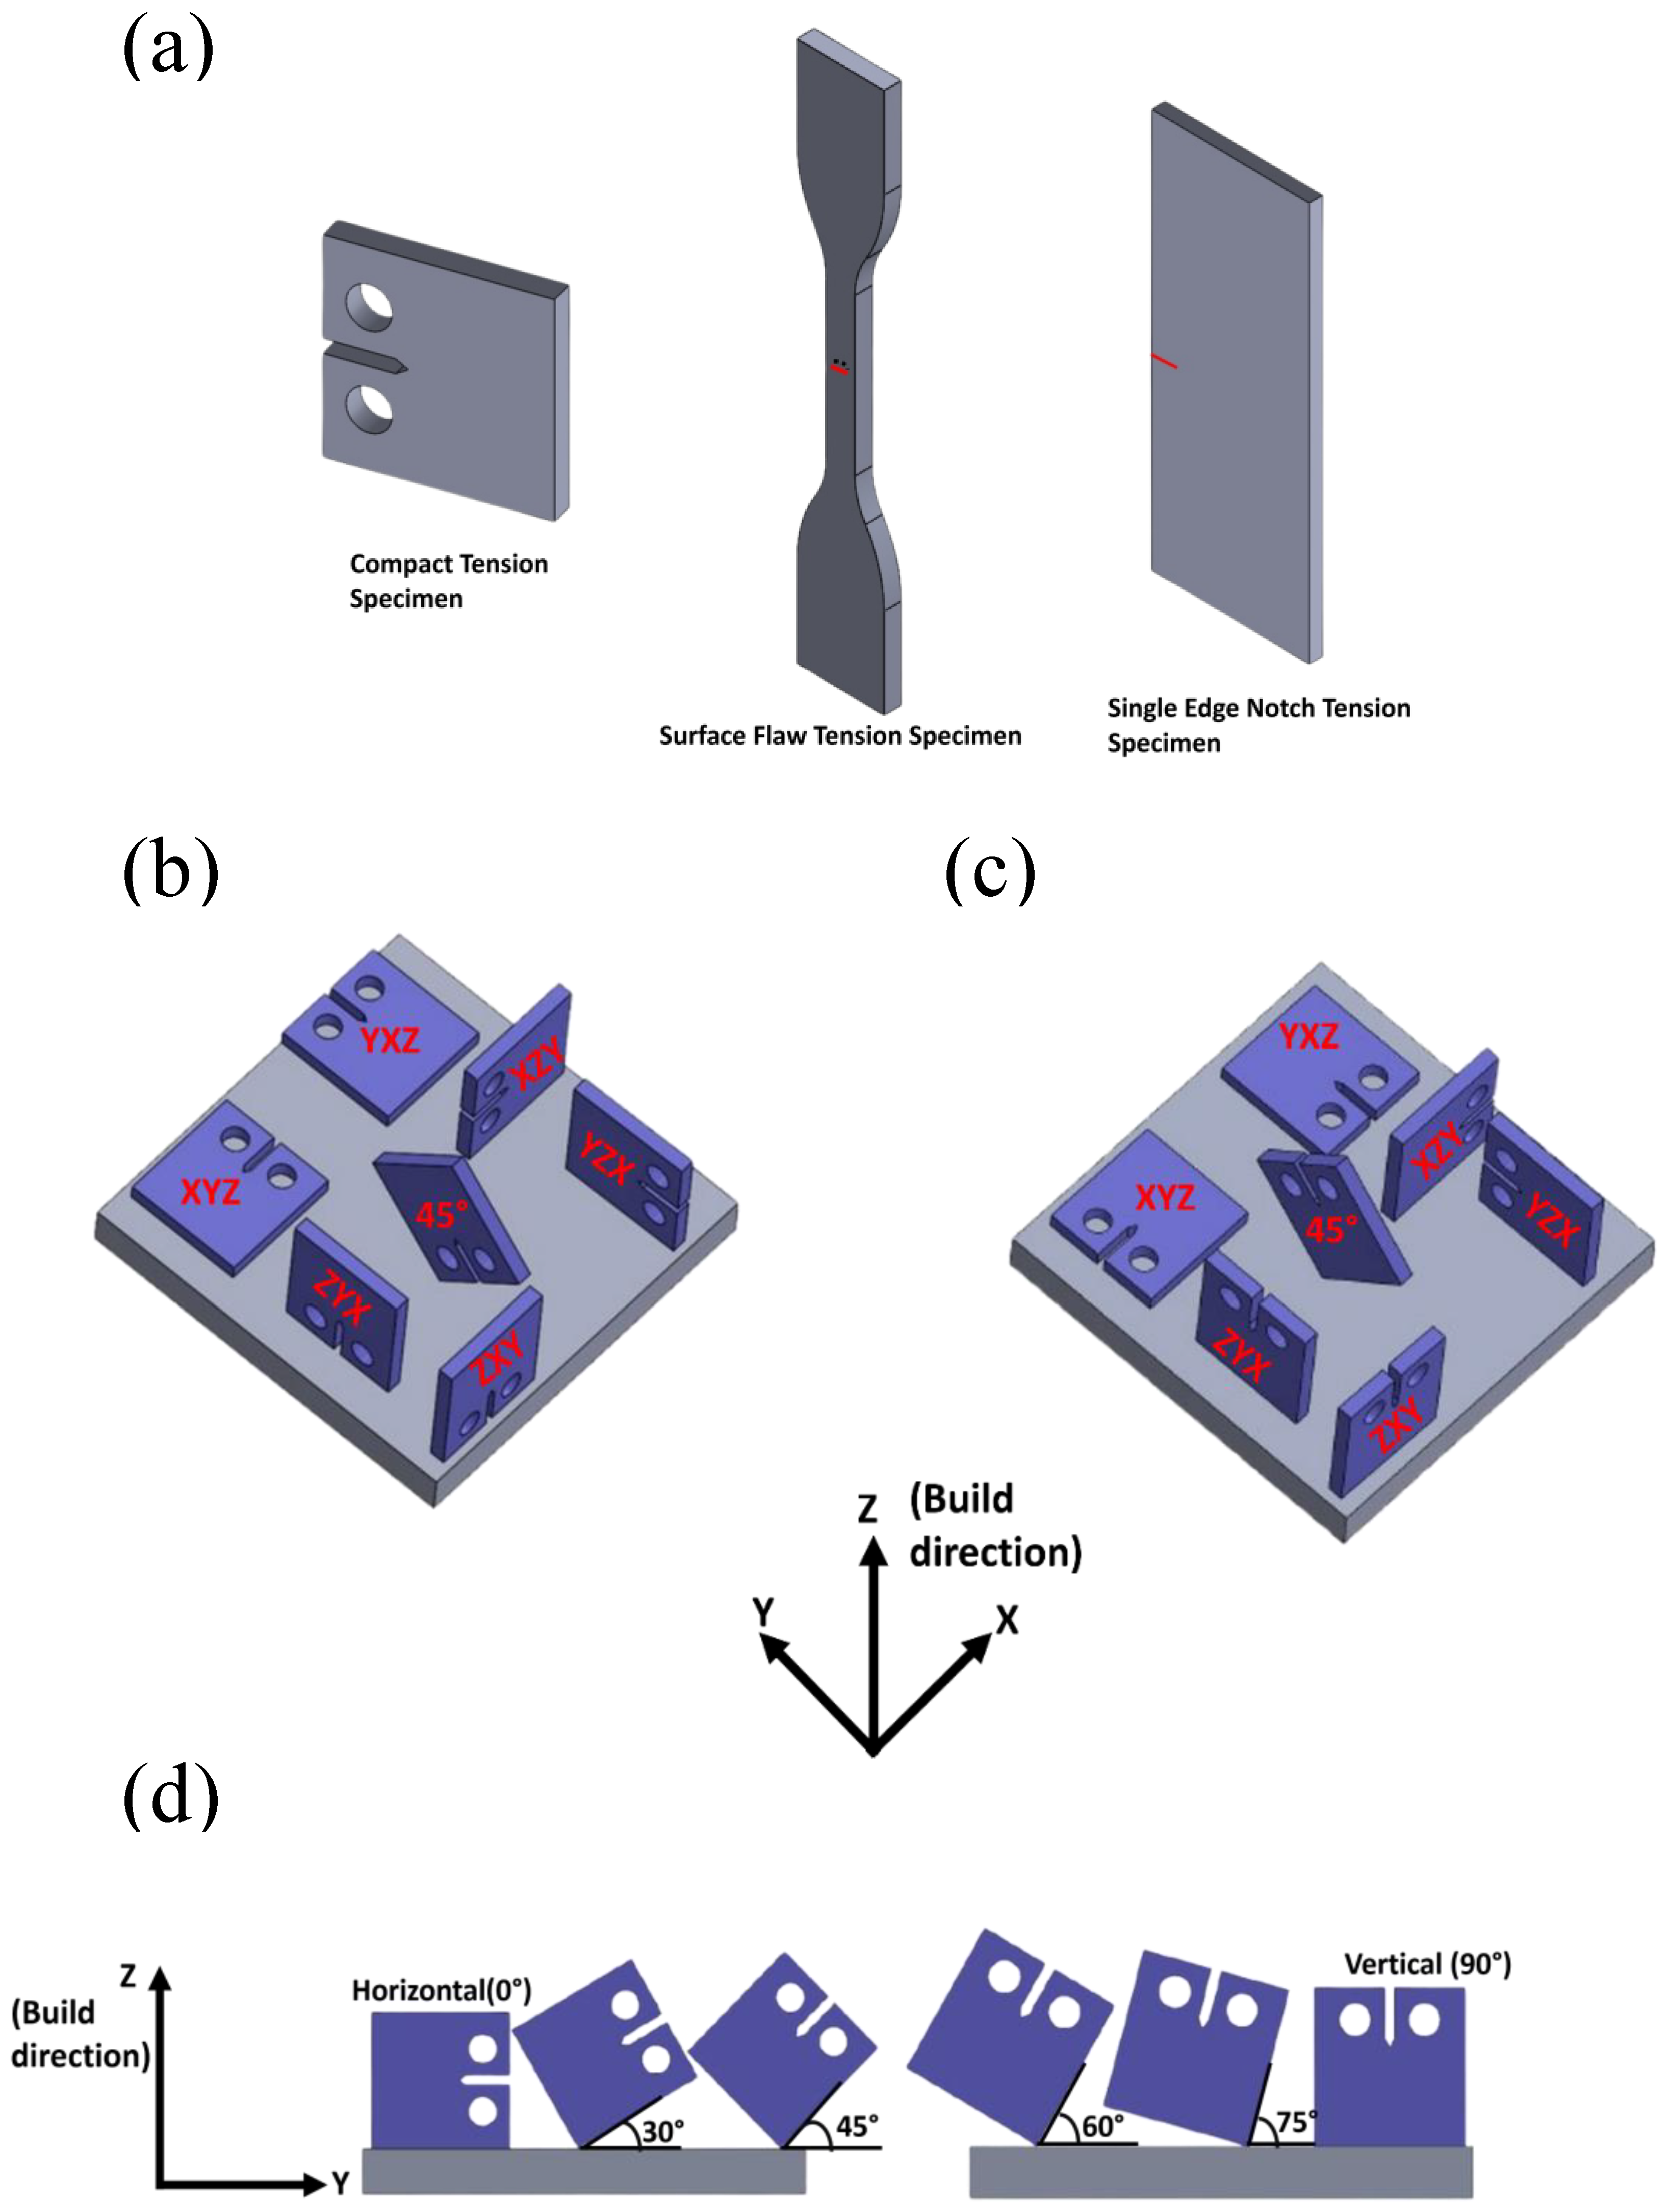
Figure 5.
Deviations in fatigue crack observed from the notch plane. Reprinted with permission from Elsevier [43].
Figure 5.
Deviations in fatigue crack observed from the notch plane. Reprinted with permission from Elsevier [43].
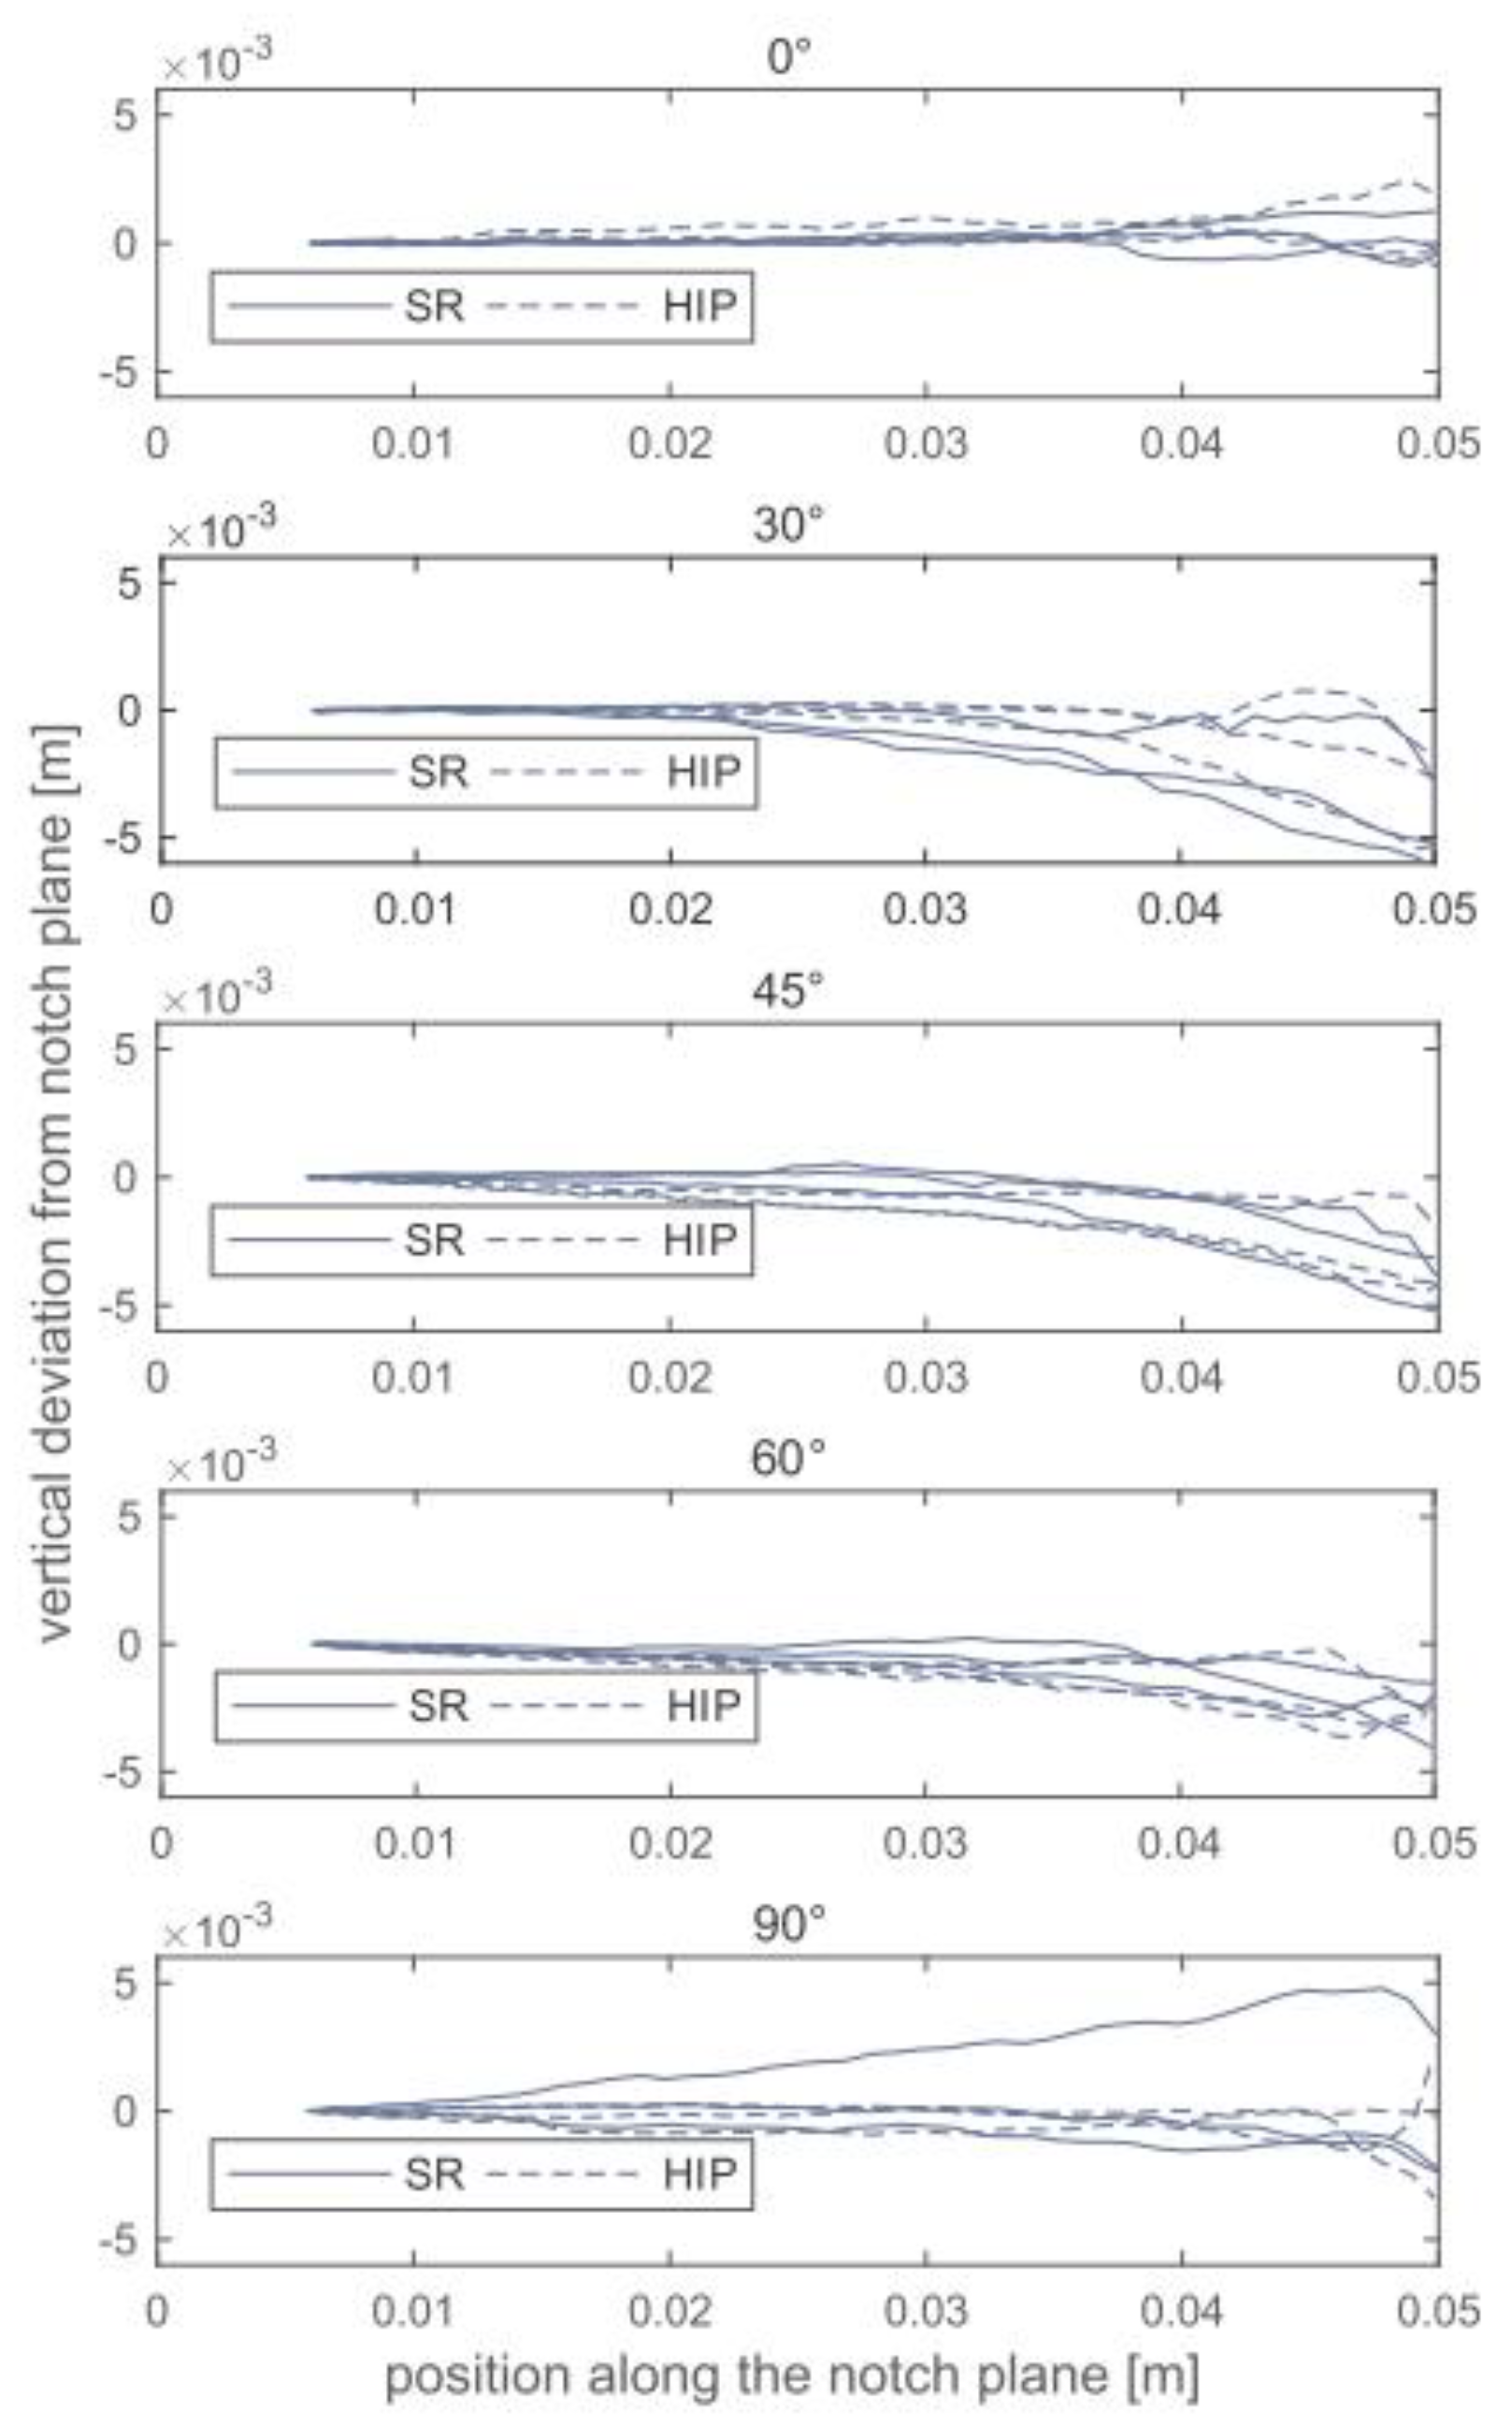
Figure 6.
FCG curves for SLM-processed Ti64 in various conditions for (a) horizontal and (b) vertical specimens. The scatter band in the upper right represents the reference data for wrought Ti64. Reprinted with permission from [55].
Figure 6.
FCG curves for SLM-processed Ti64 in various conditions for (a) horizontal and (b) vertical specimens. The scatter band in the upper right represents the reference data for wrought Ti64. Reprinted with permission from [55].
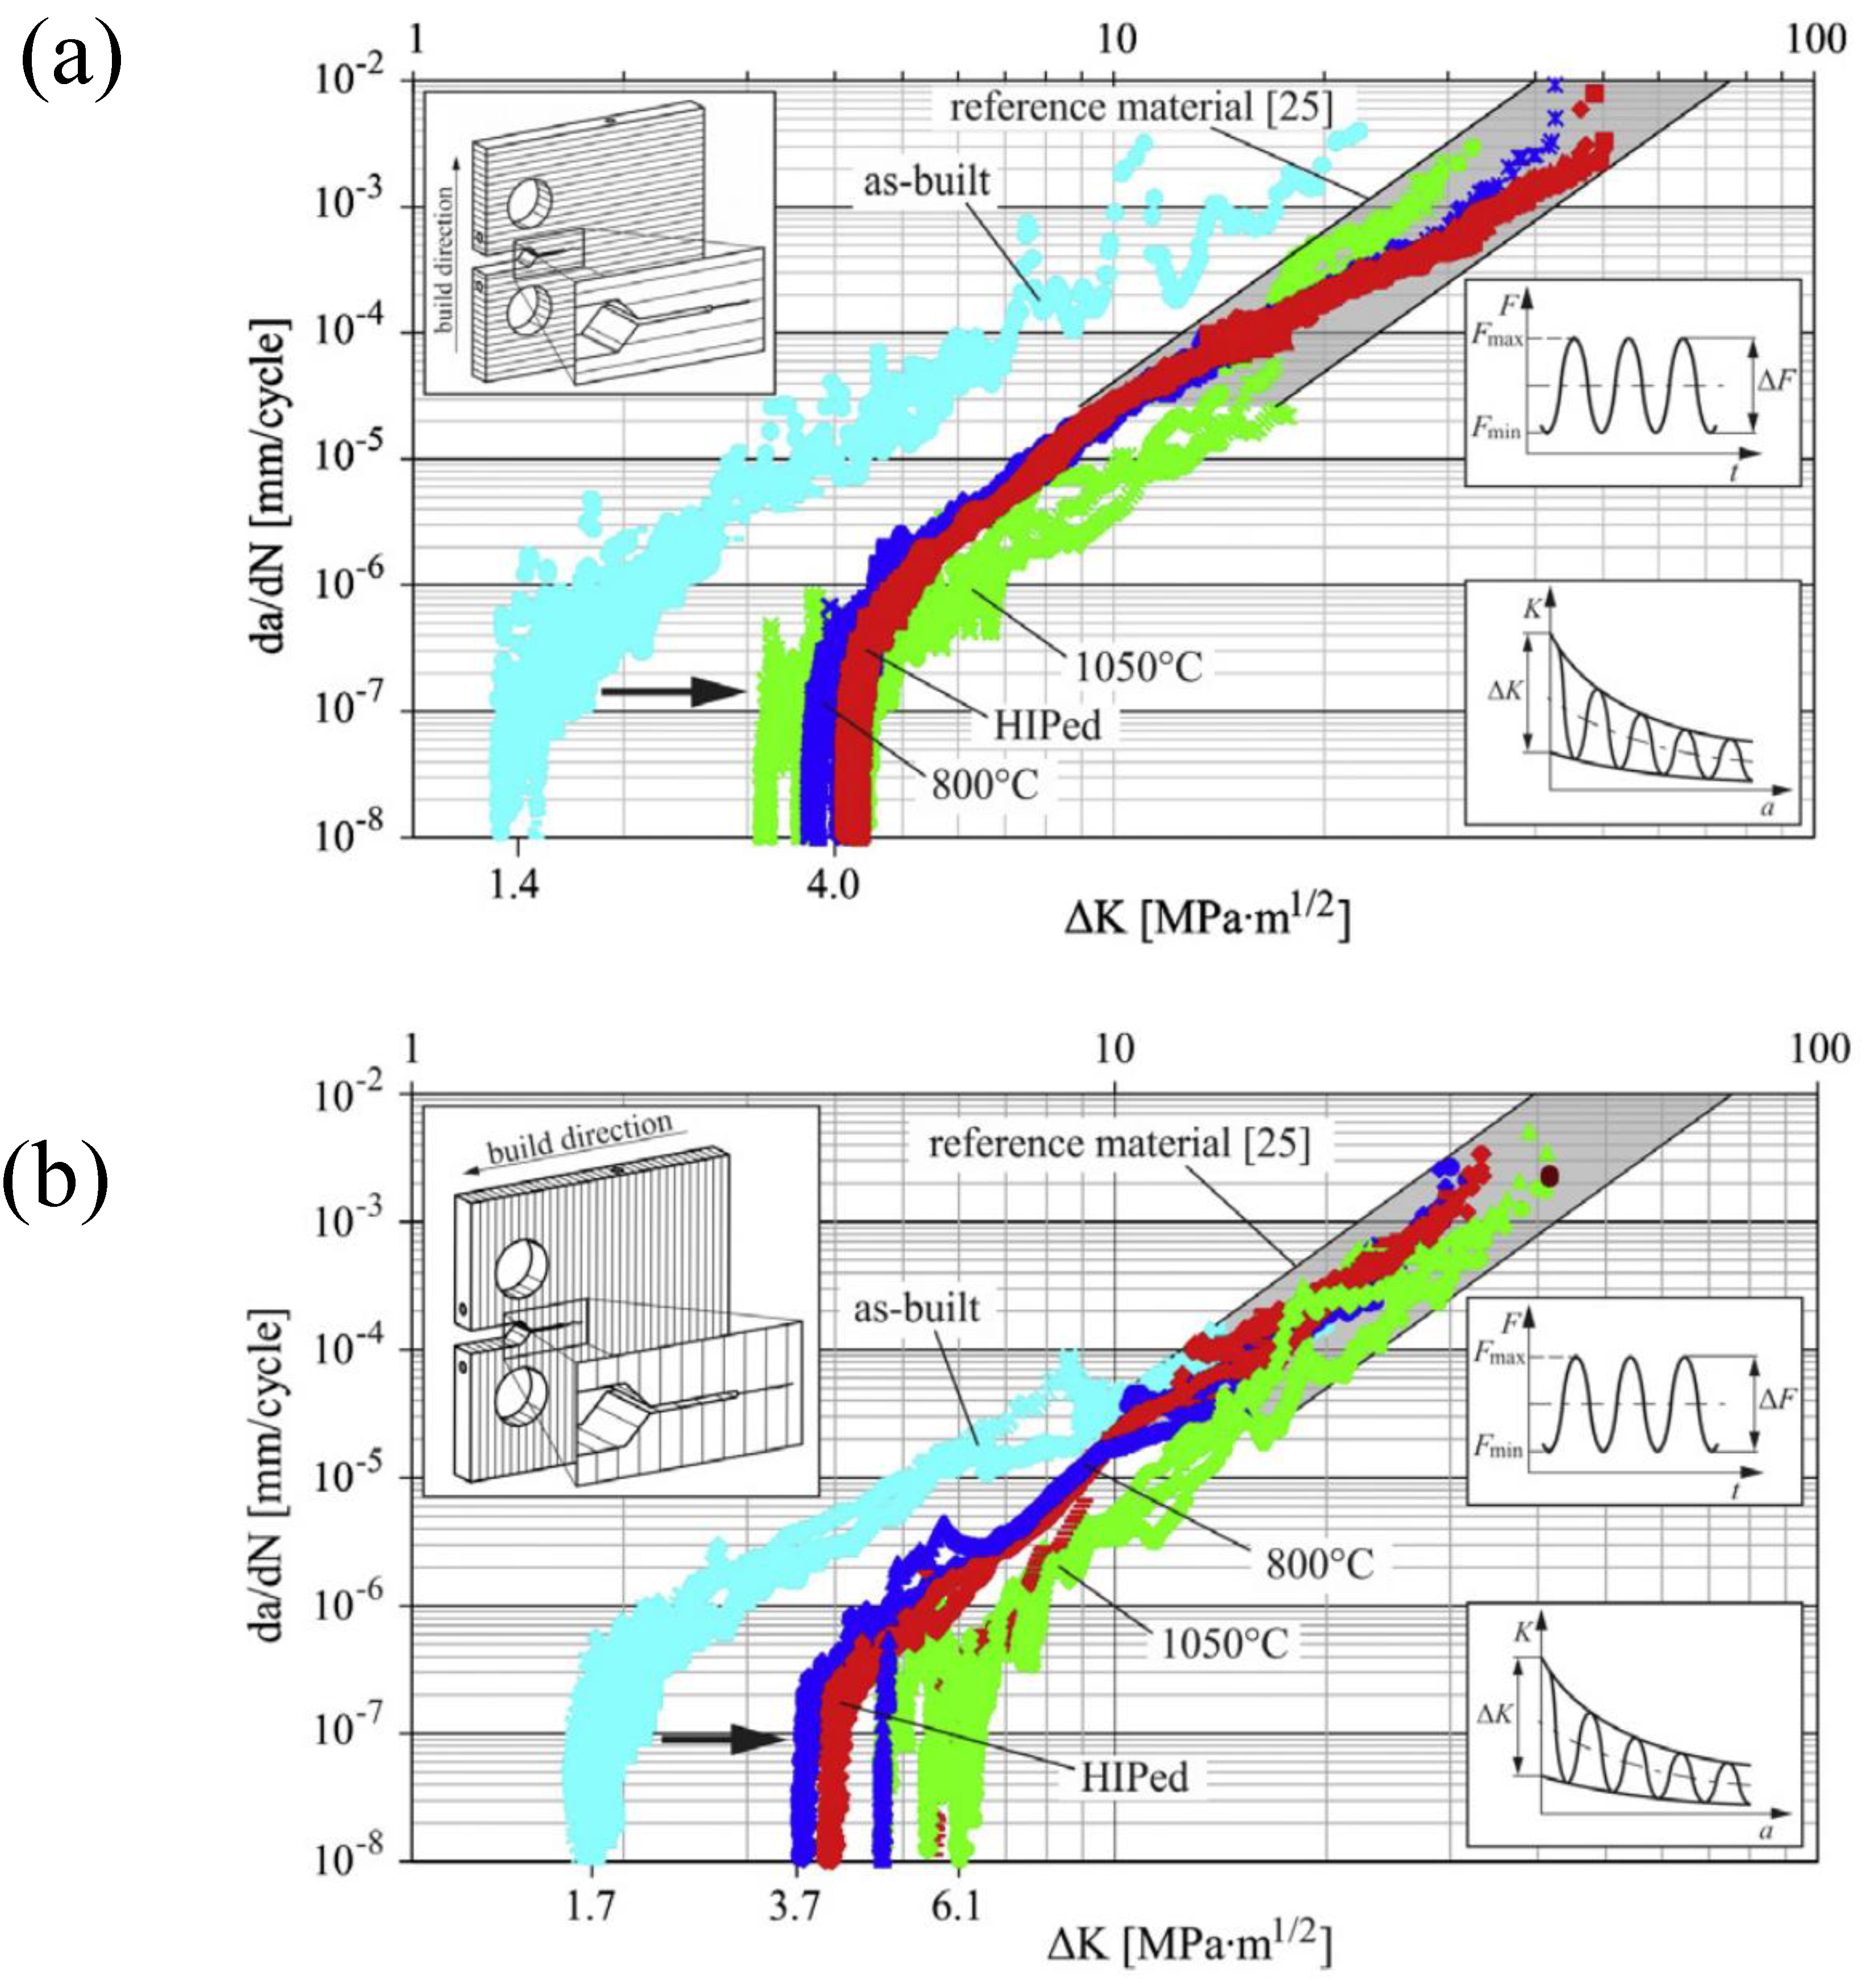
Figure 7.
FCG curves showing the effect of R for (a) vertical, (b) horizontal, and (c) diagonal specimens. The corresponding ΔKth values for each build orientation and R are summarized in (d). Reprinted with permission from Elsevier [95].
Figure 7.
FCG curves showing the effect of R for (a) vertical, (b) horizontal, and (c) diagonal specimens. The corresponding ΔKth values for each build orientation and R are summarized in (d). Reprinted with permission from Elsevier [95].
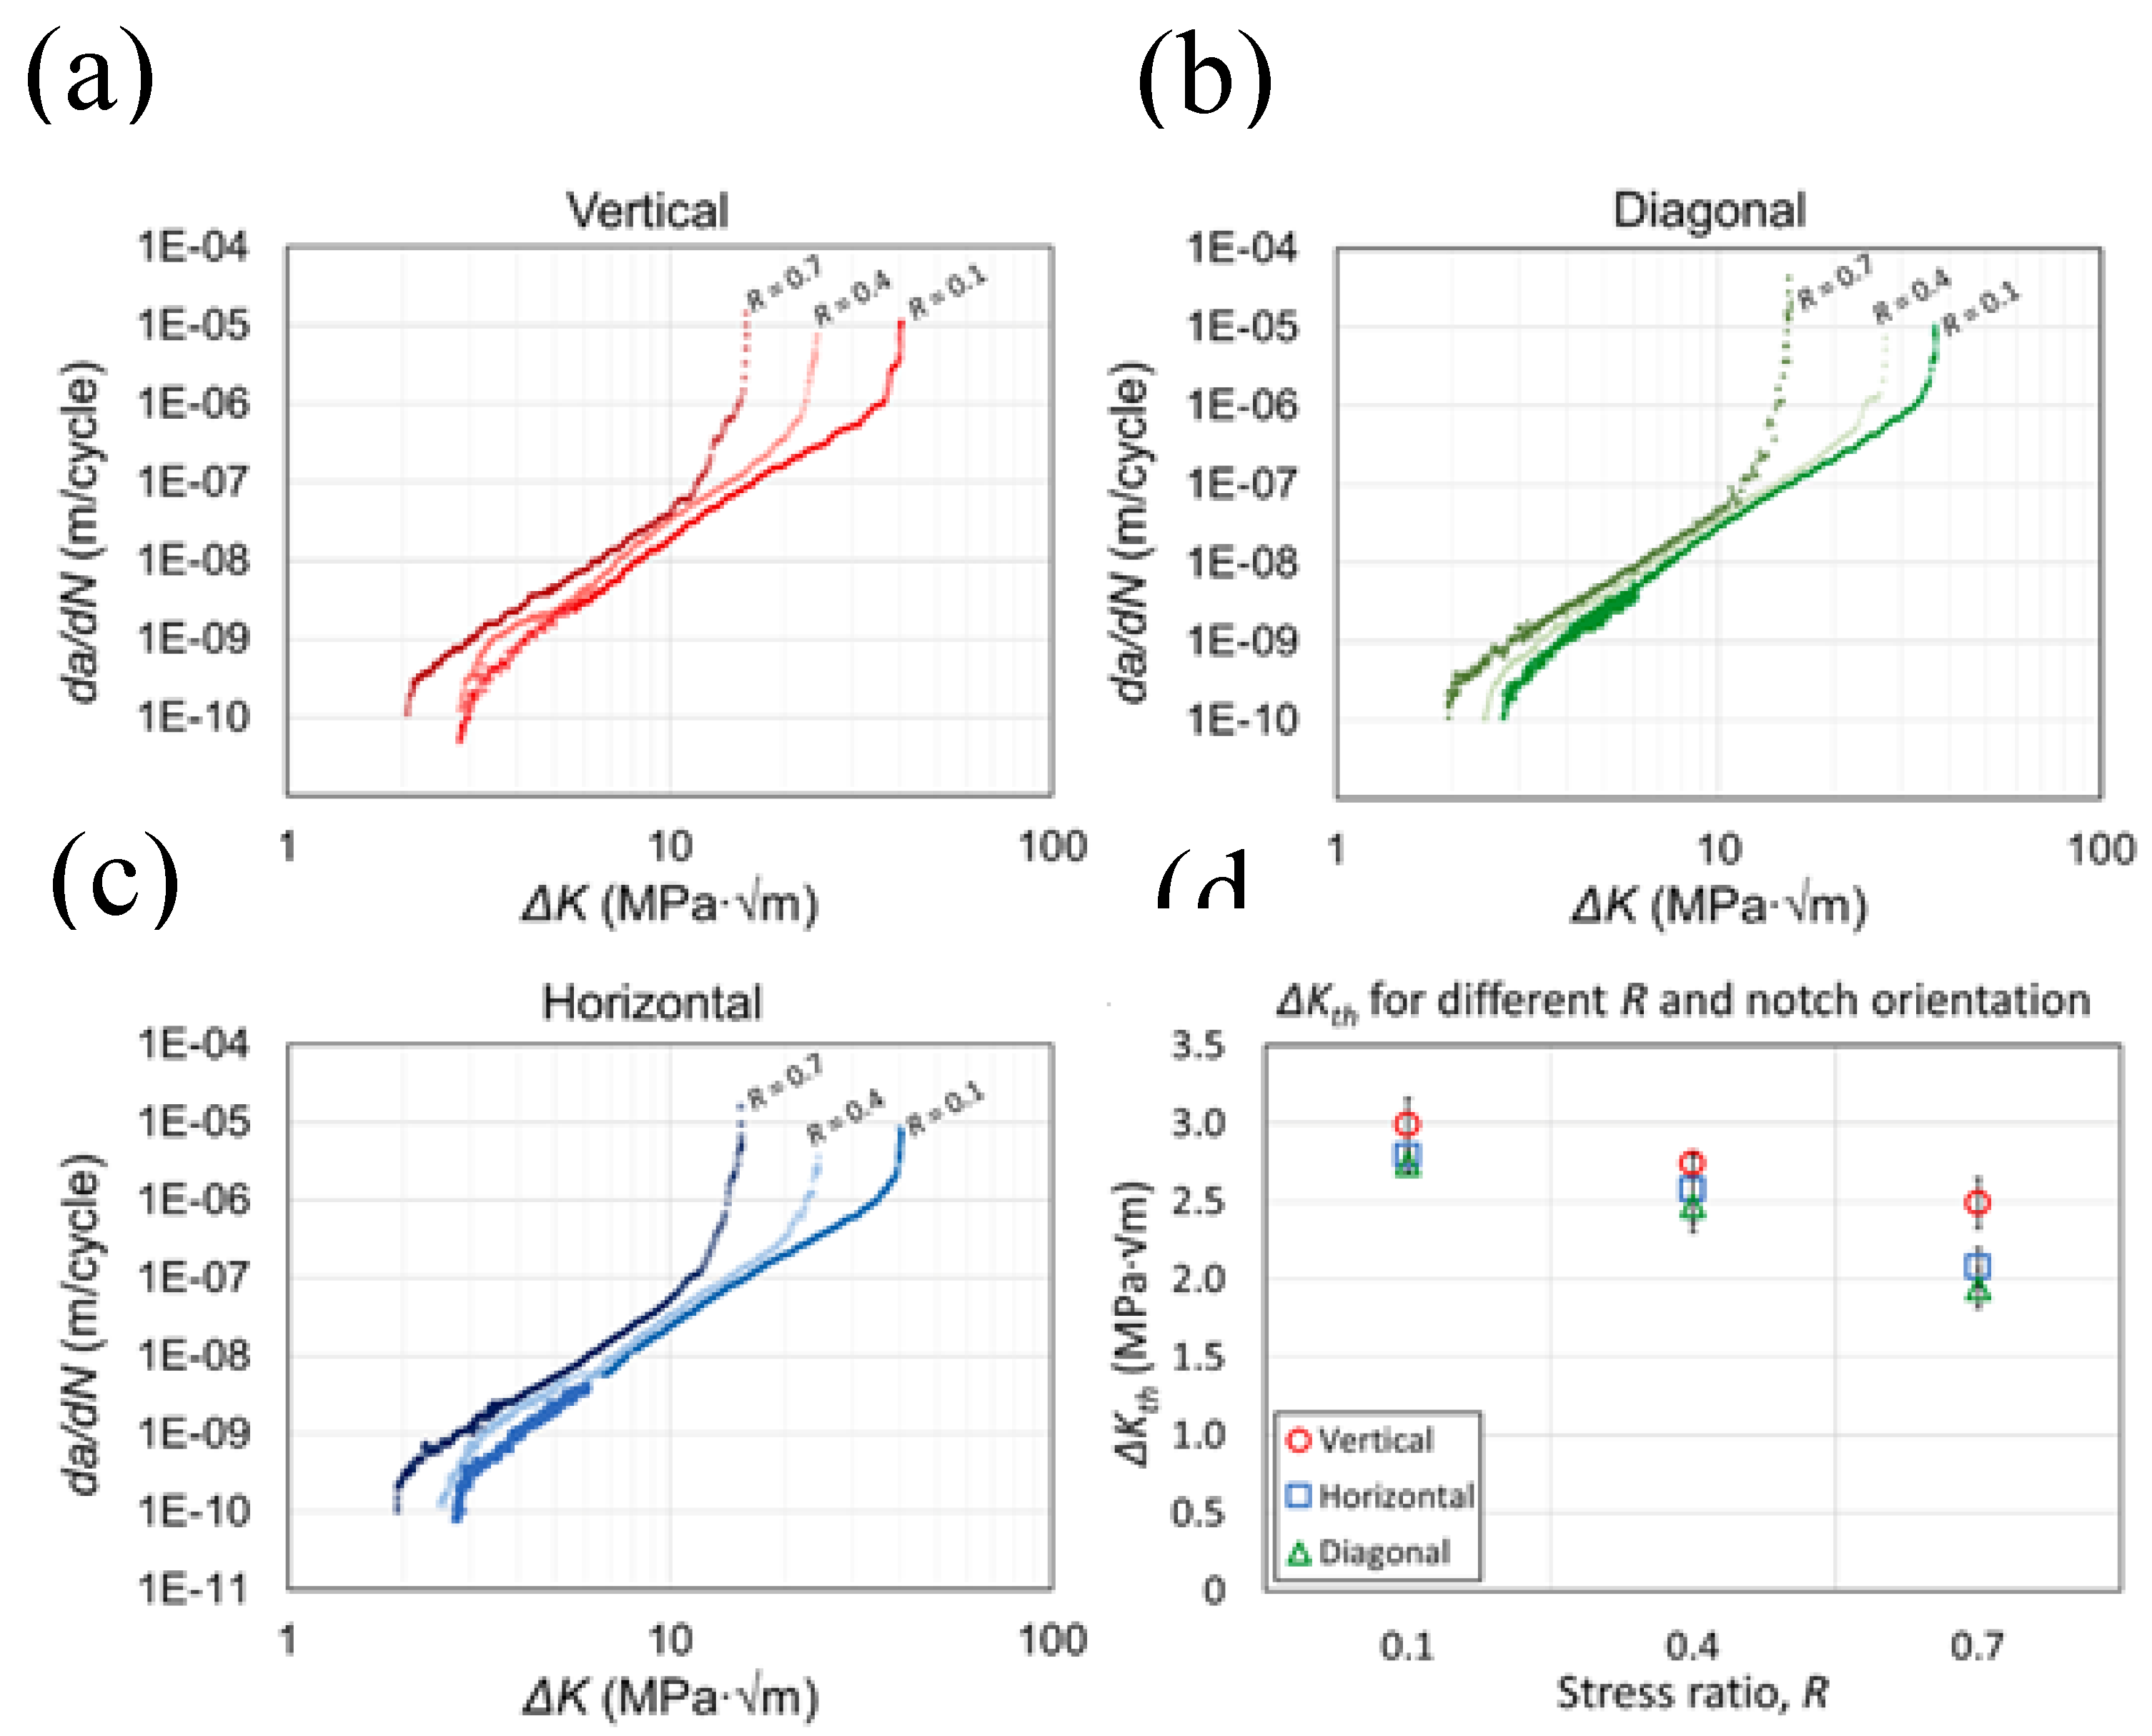
Figure 8.
FCG curves for laser (L)-DED Ti64 after solution- and aging-treatment: (a) V900, (b) V1500. Reprinted with permission from Elsevier [75].
Figure 8.
FCG curves for laser (L)-DED Ti64 after solution- and aging-treatment: (a) V900, (b) V1500. Reprinted with permission from Elsevier [75].
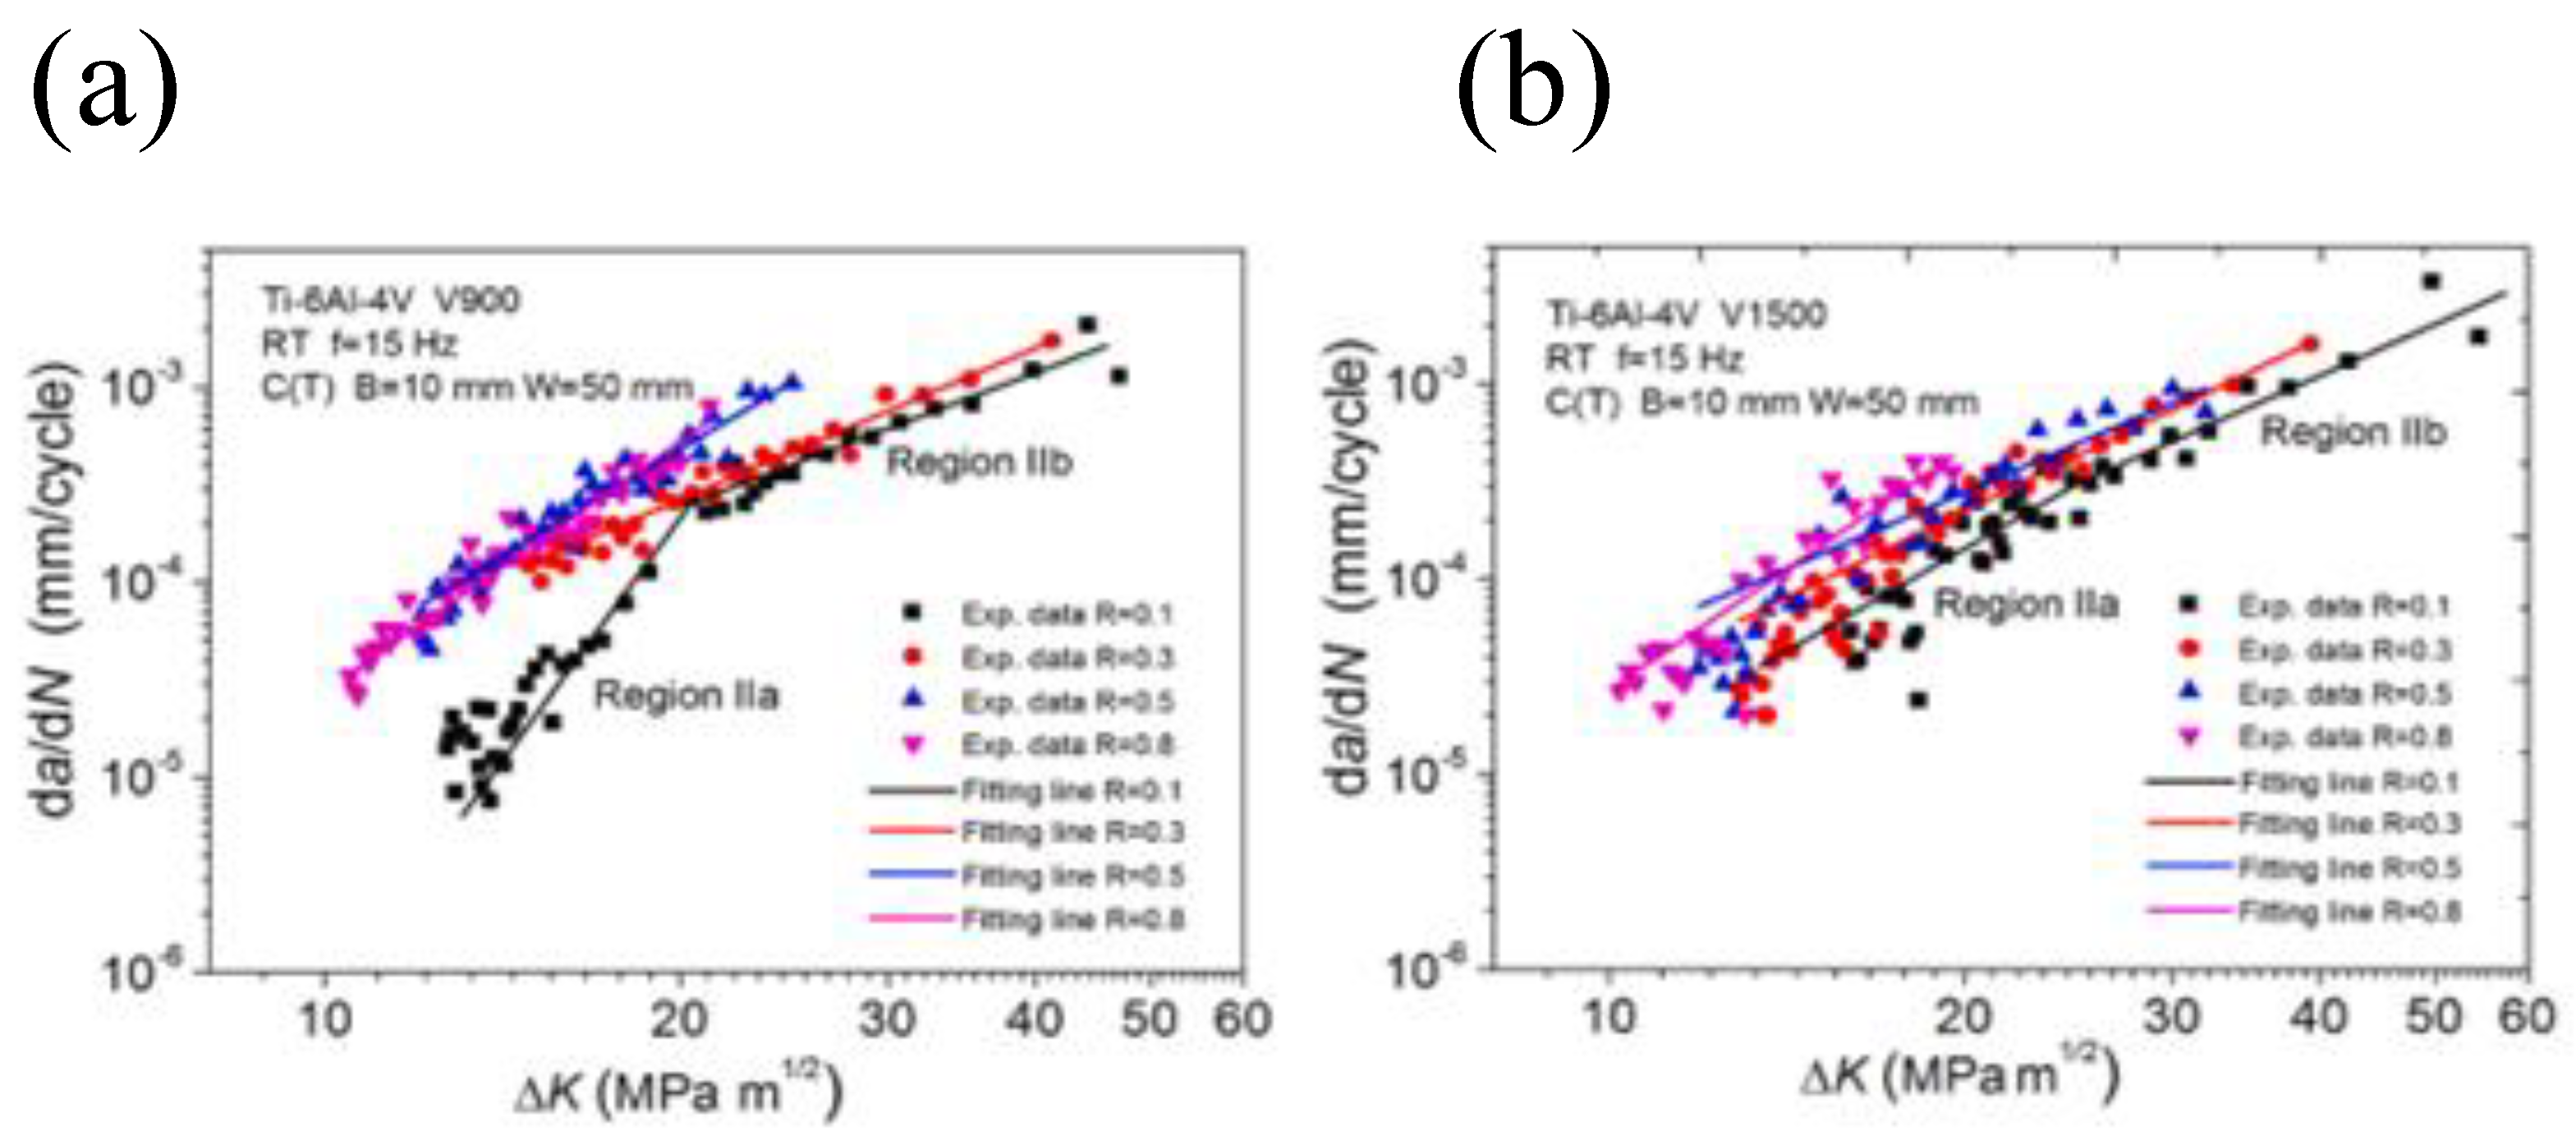
Figure 9.
FCG curves for as-built, α/β-annealed, and β-annealed DED Ti64 specimens with horizontally built specimens, tested at a R of 0.1. Reprinted with permission from Springer [46].
Figure 9.
FCG curves for as-built, α/β-annealed, and β-annealed DED Ti64 specimens with horizontally built specimens, tested at a R of 0.1. Reprinted with permission from Springer [46].
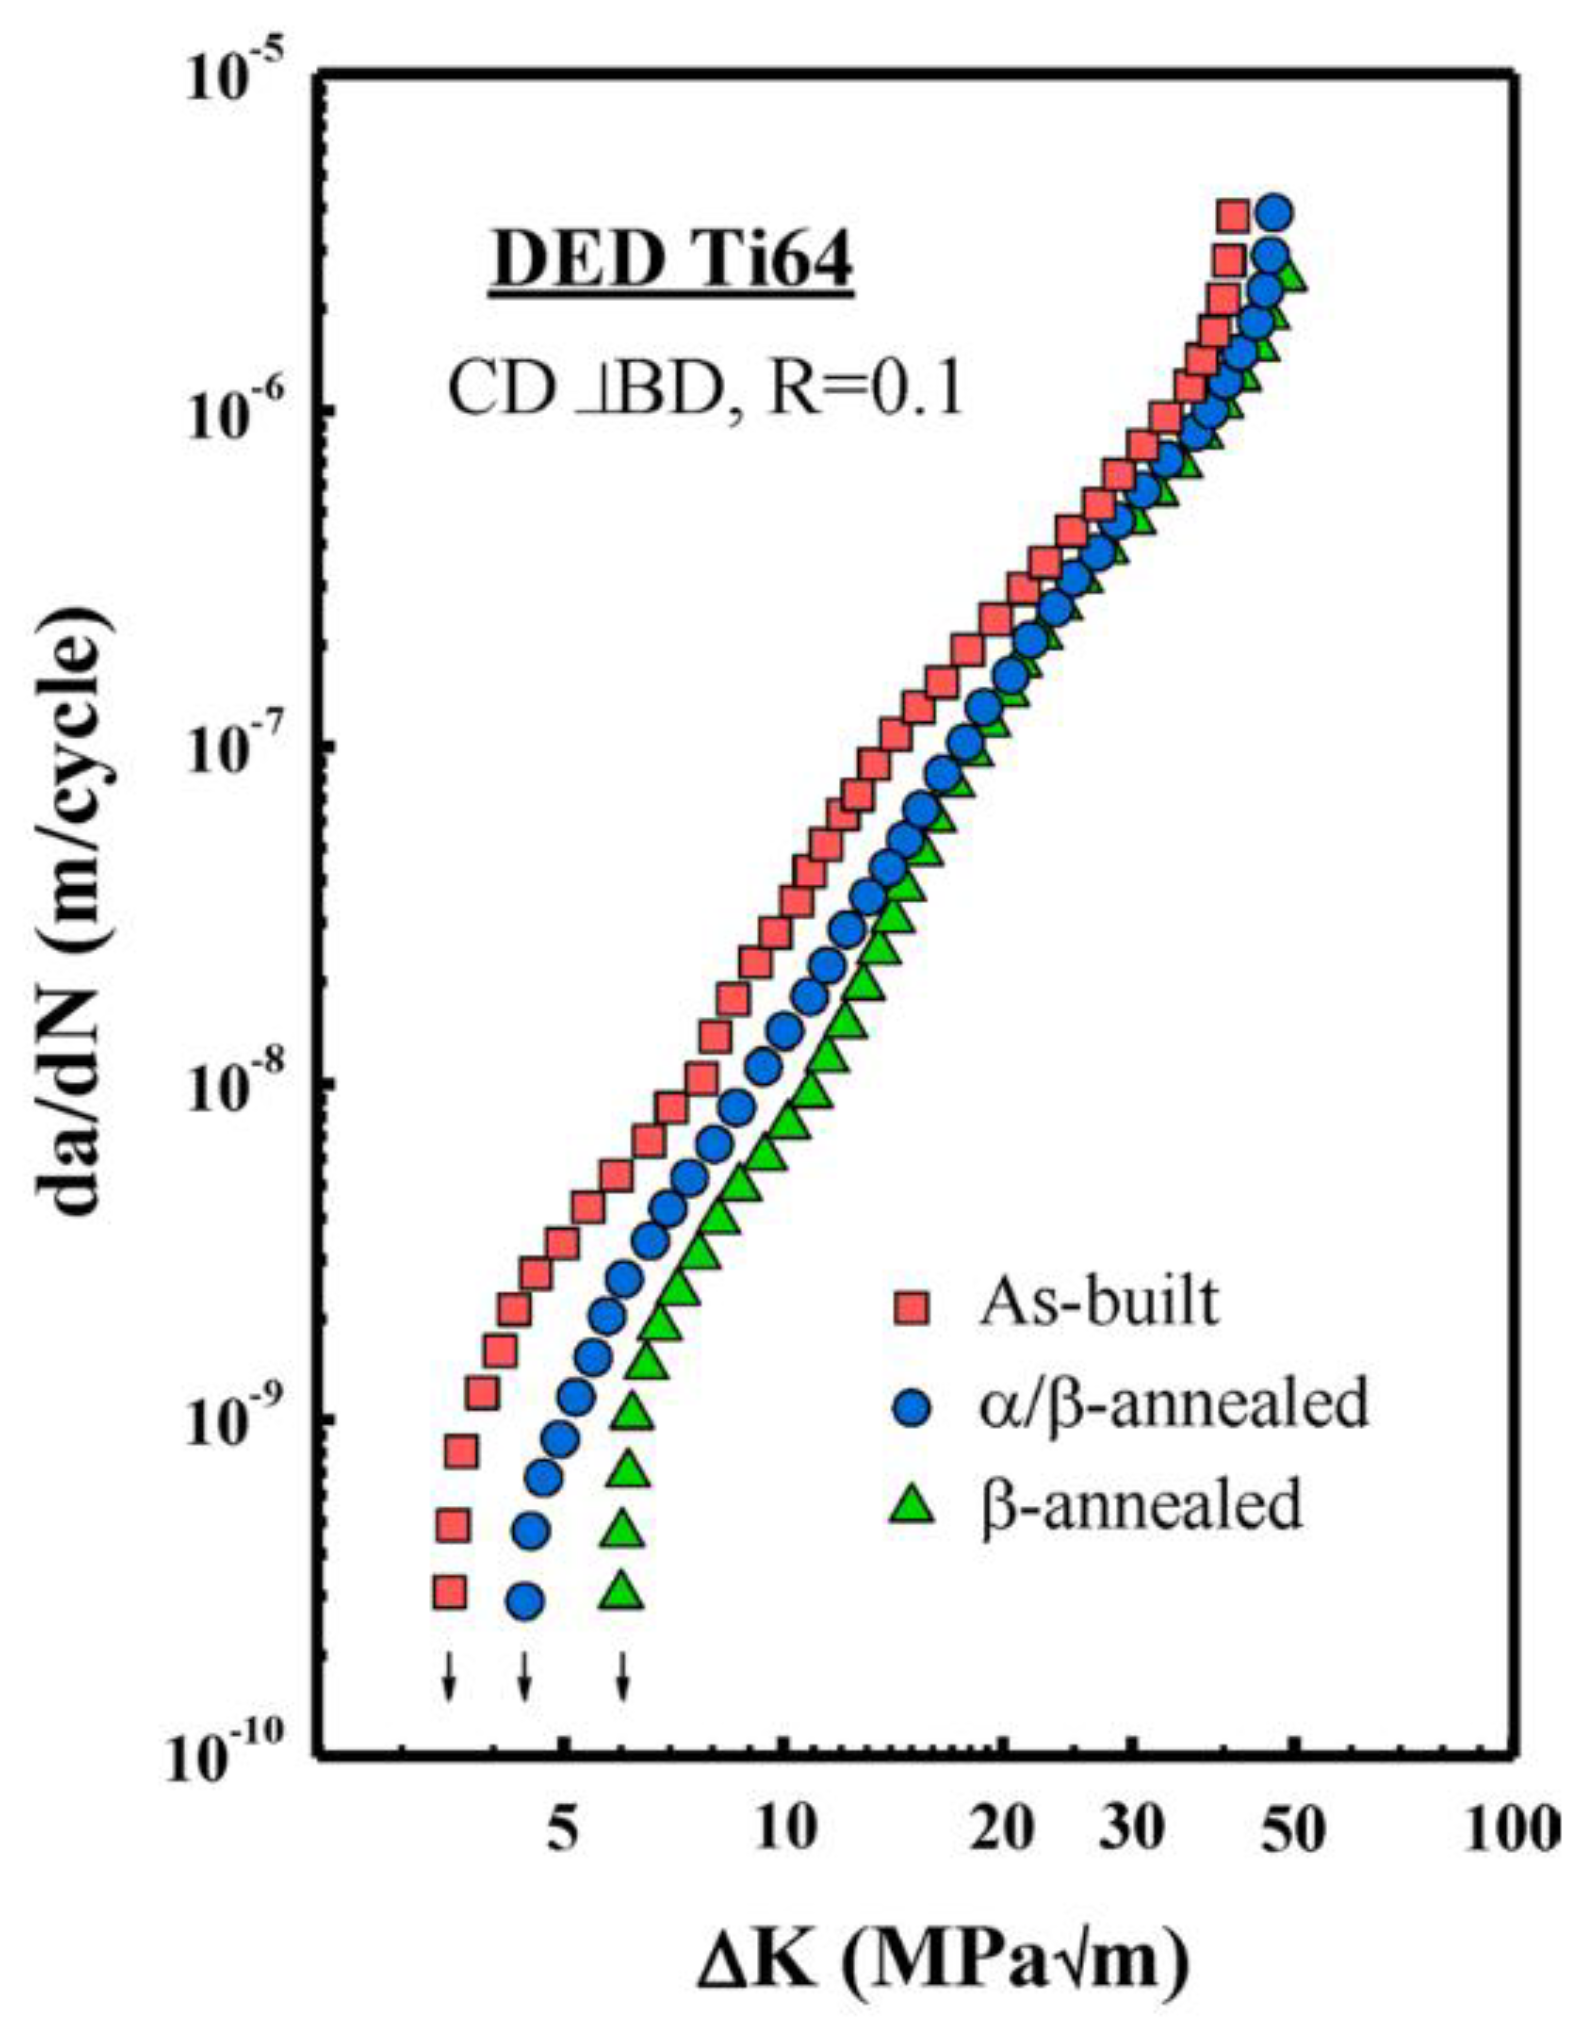
Figure 10.
Illustration of the FCG path: (a) As- built, (b) Sub-transus heat-treatment (900 °C), and (c) Sub-transus heat-treatment (1015 °C).
Figure 10.
Illustration of the FCG path: (a) As- built, (b) Sub-transus heat-treatment (900 °C), and (c) Sub-transus heat-treatment (1015 °C).
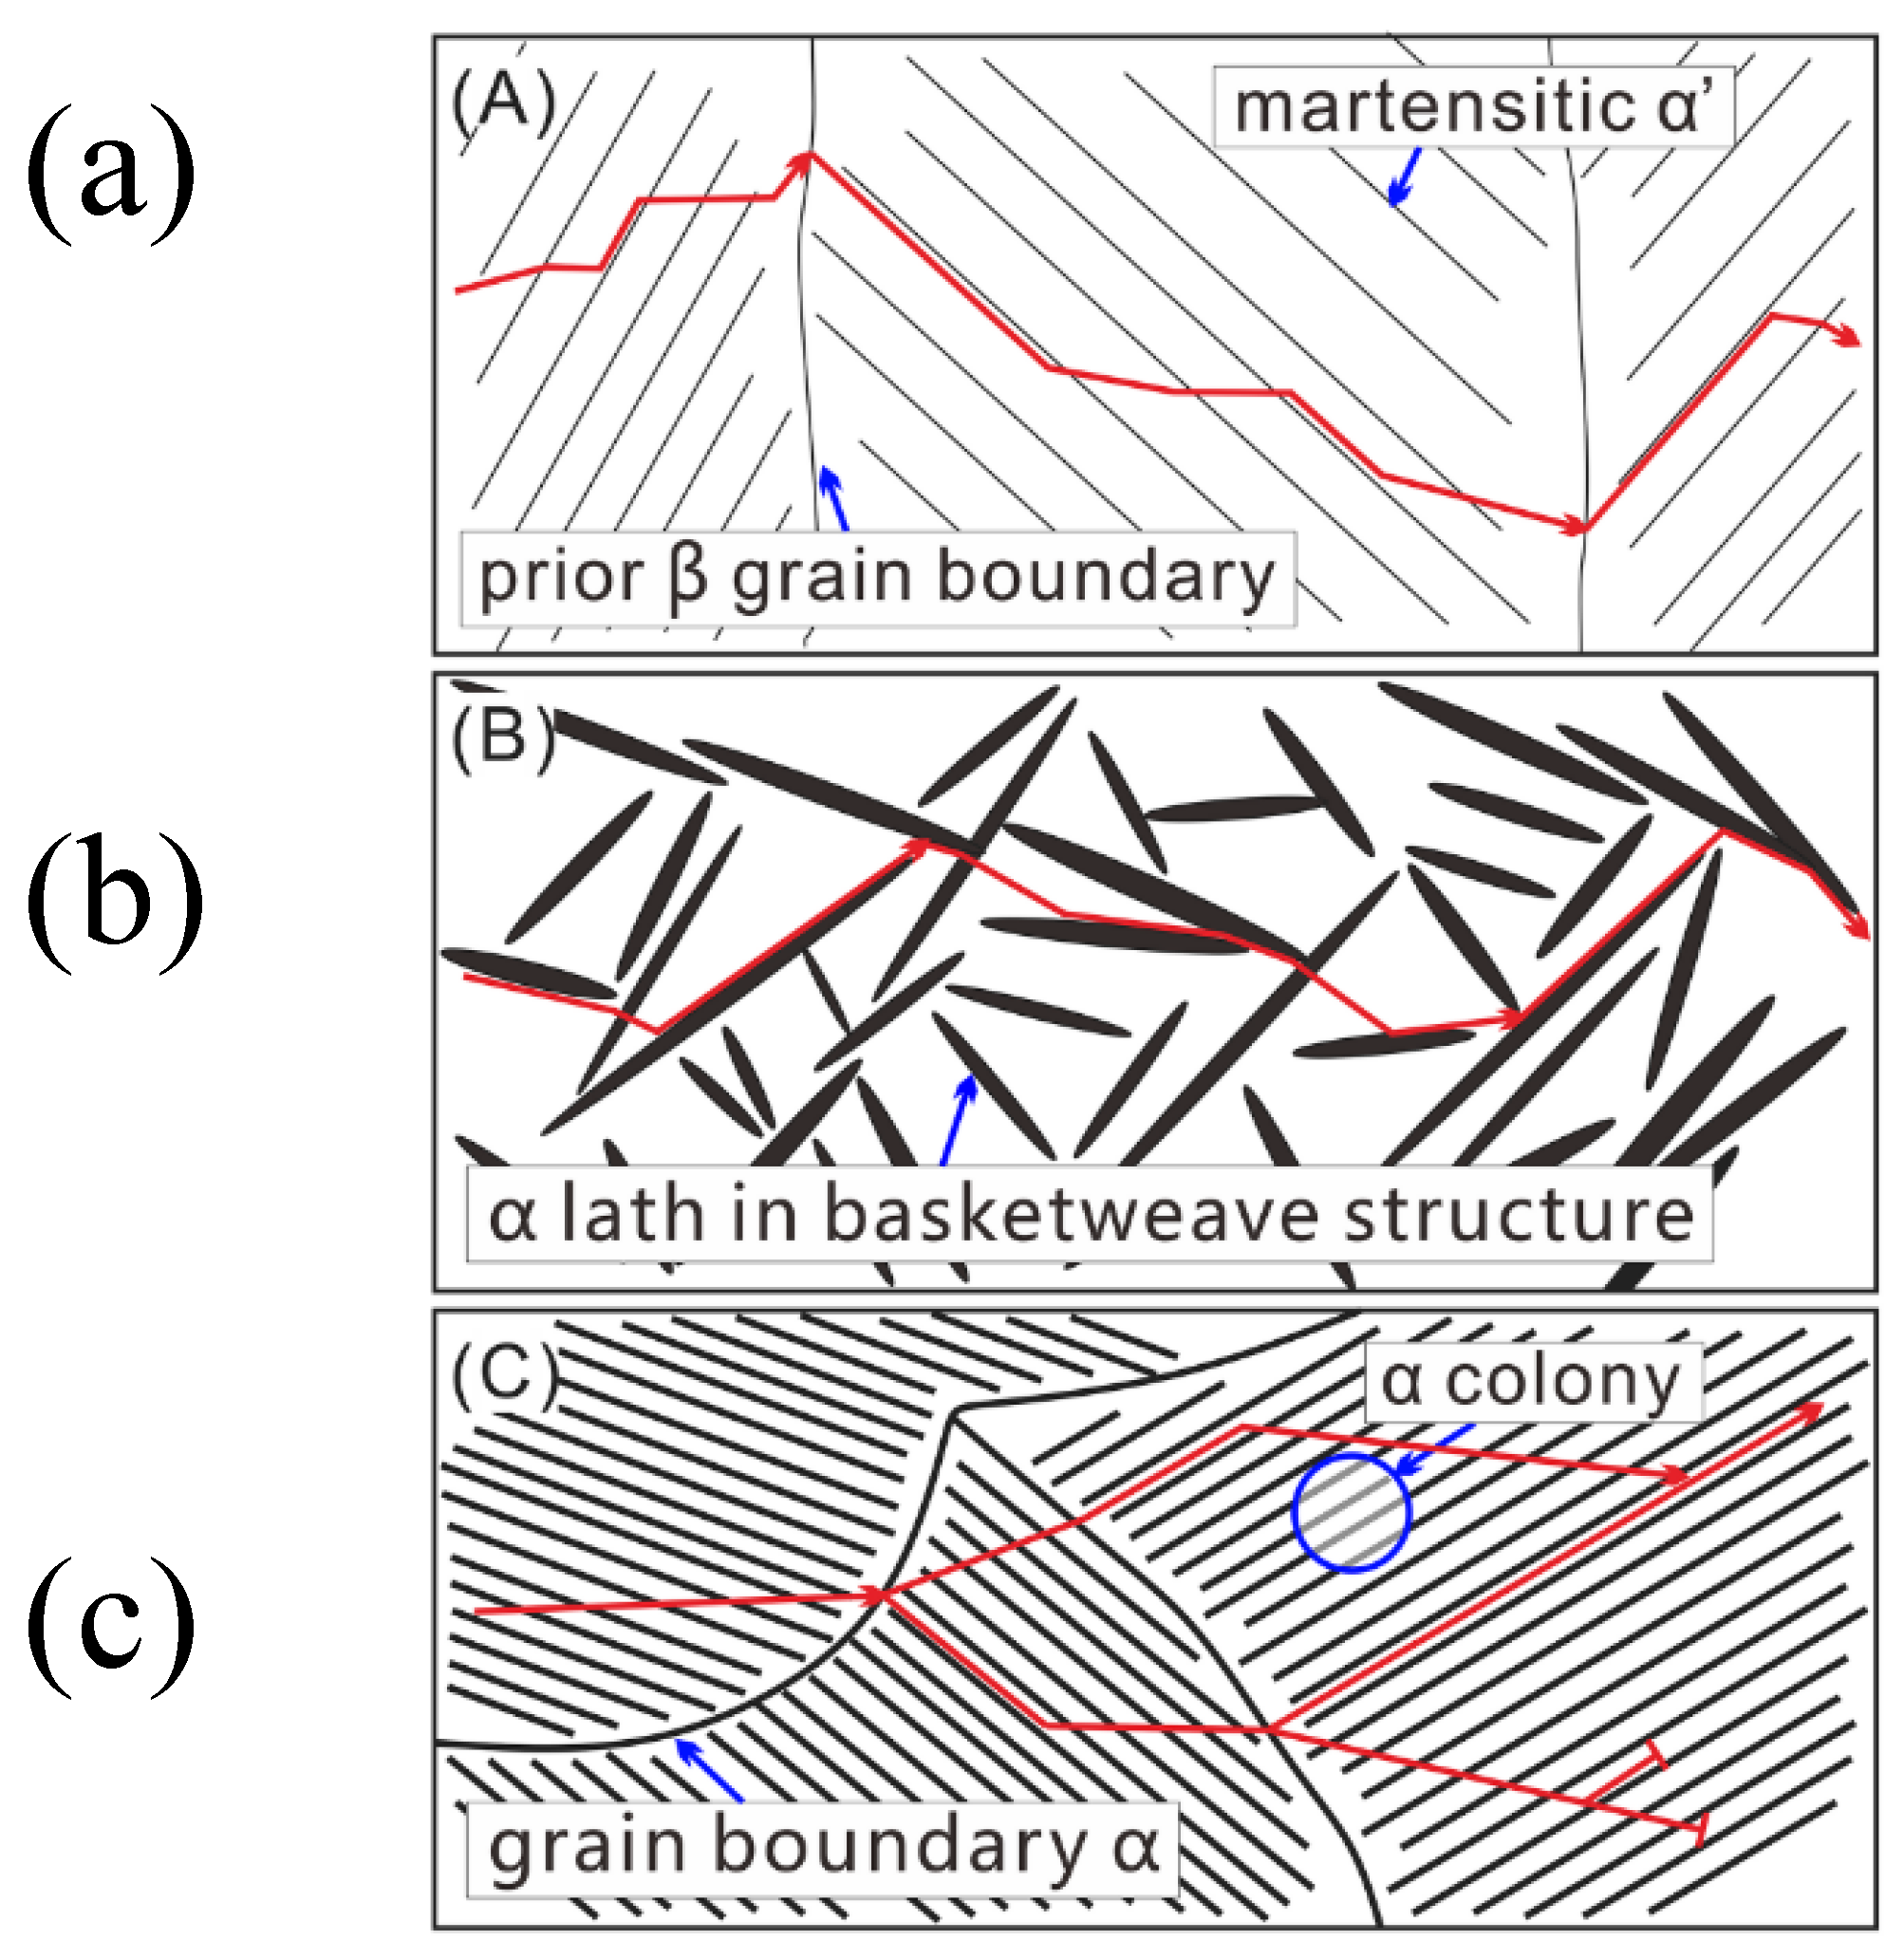
Figure 11.
FCG behavior of LENS-processed and mill-annealed Ti64 at a R = 0.1: (a) horizontal specimens, (b) vertical specimens, and (c) comparison of microstructurally small crack FCG data for LENS Ti64 with long crack FCG and physically small crack data estimated from the long crack regime using the adjusted compliance ratio method. Reprinted with permission from Elsevier [109]. Low Power -LP, High Power-HP, AF- As-Fabricated, HT- Heat Treated.
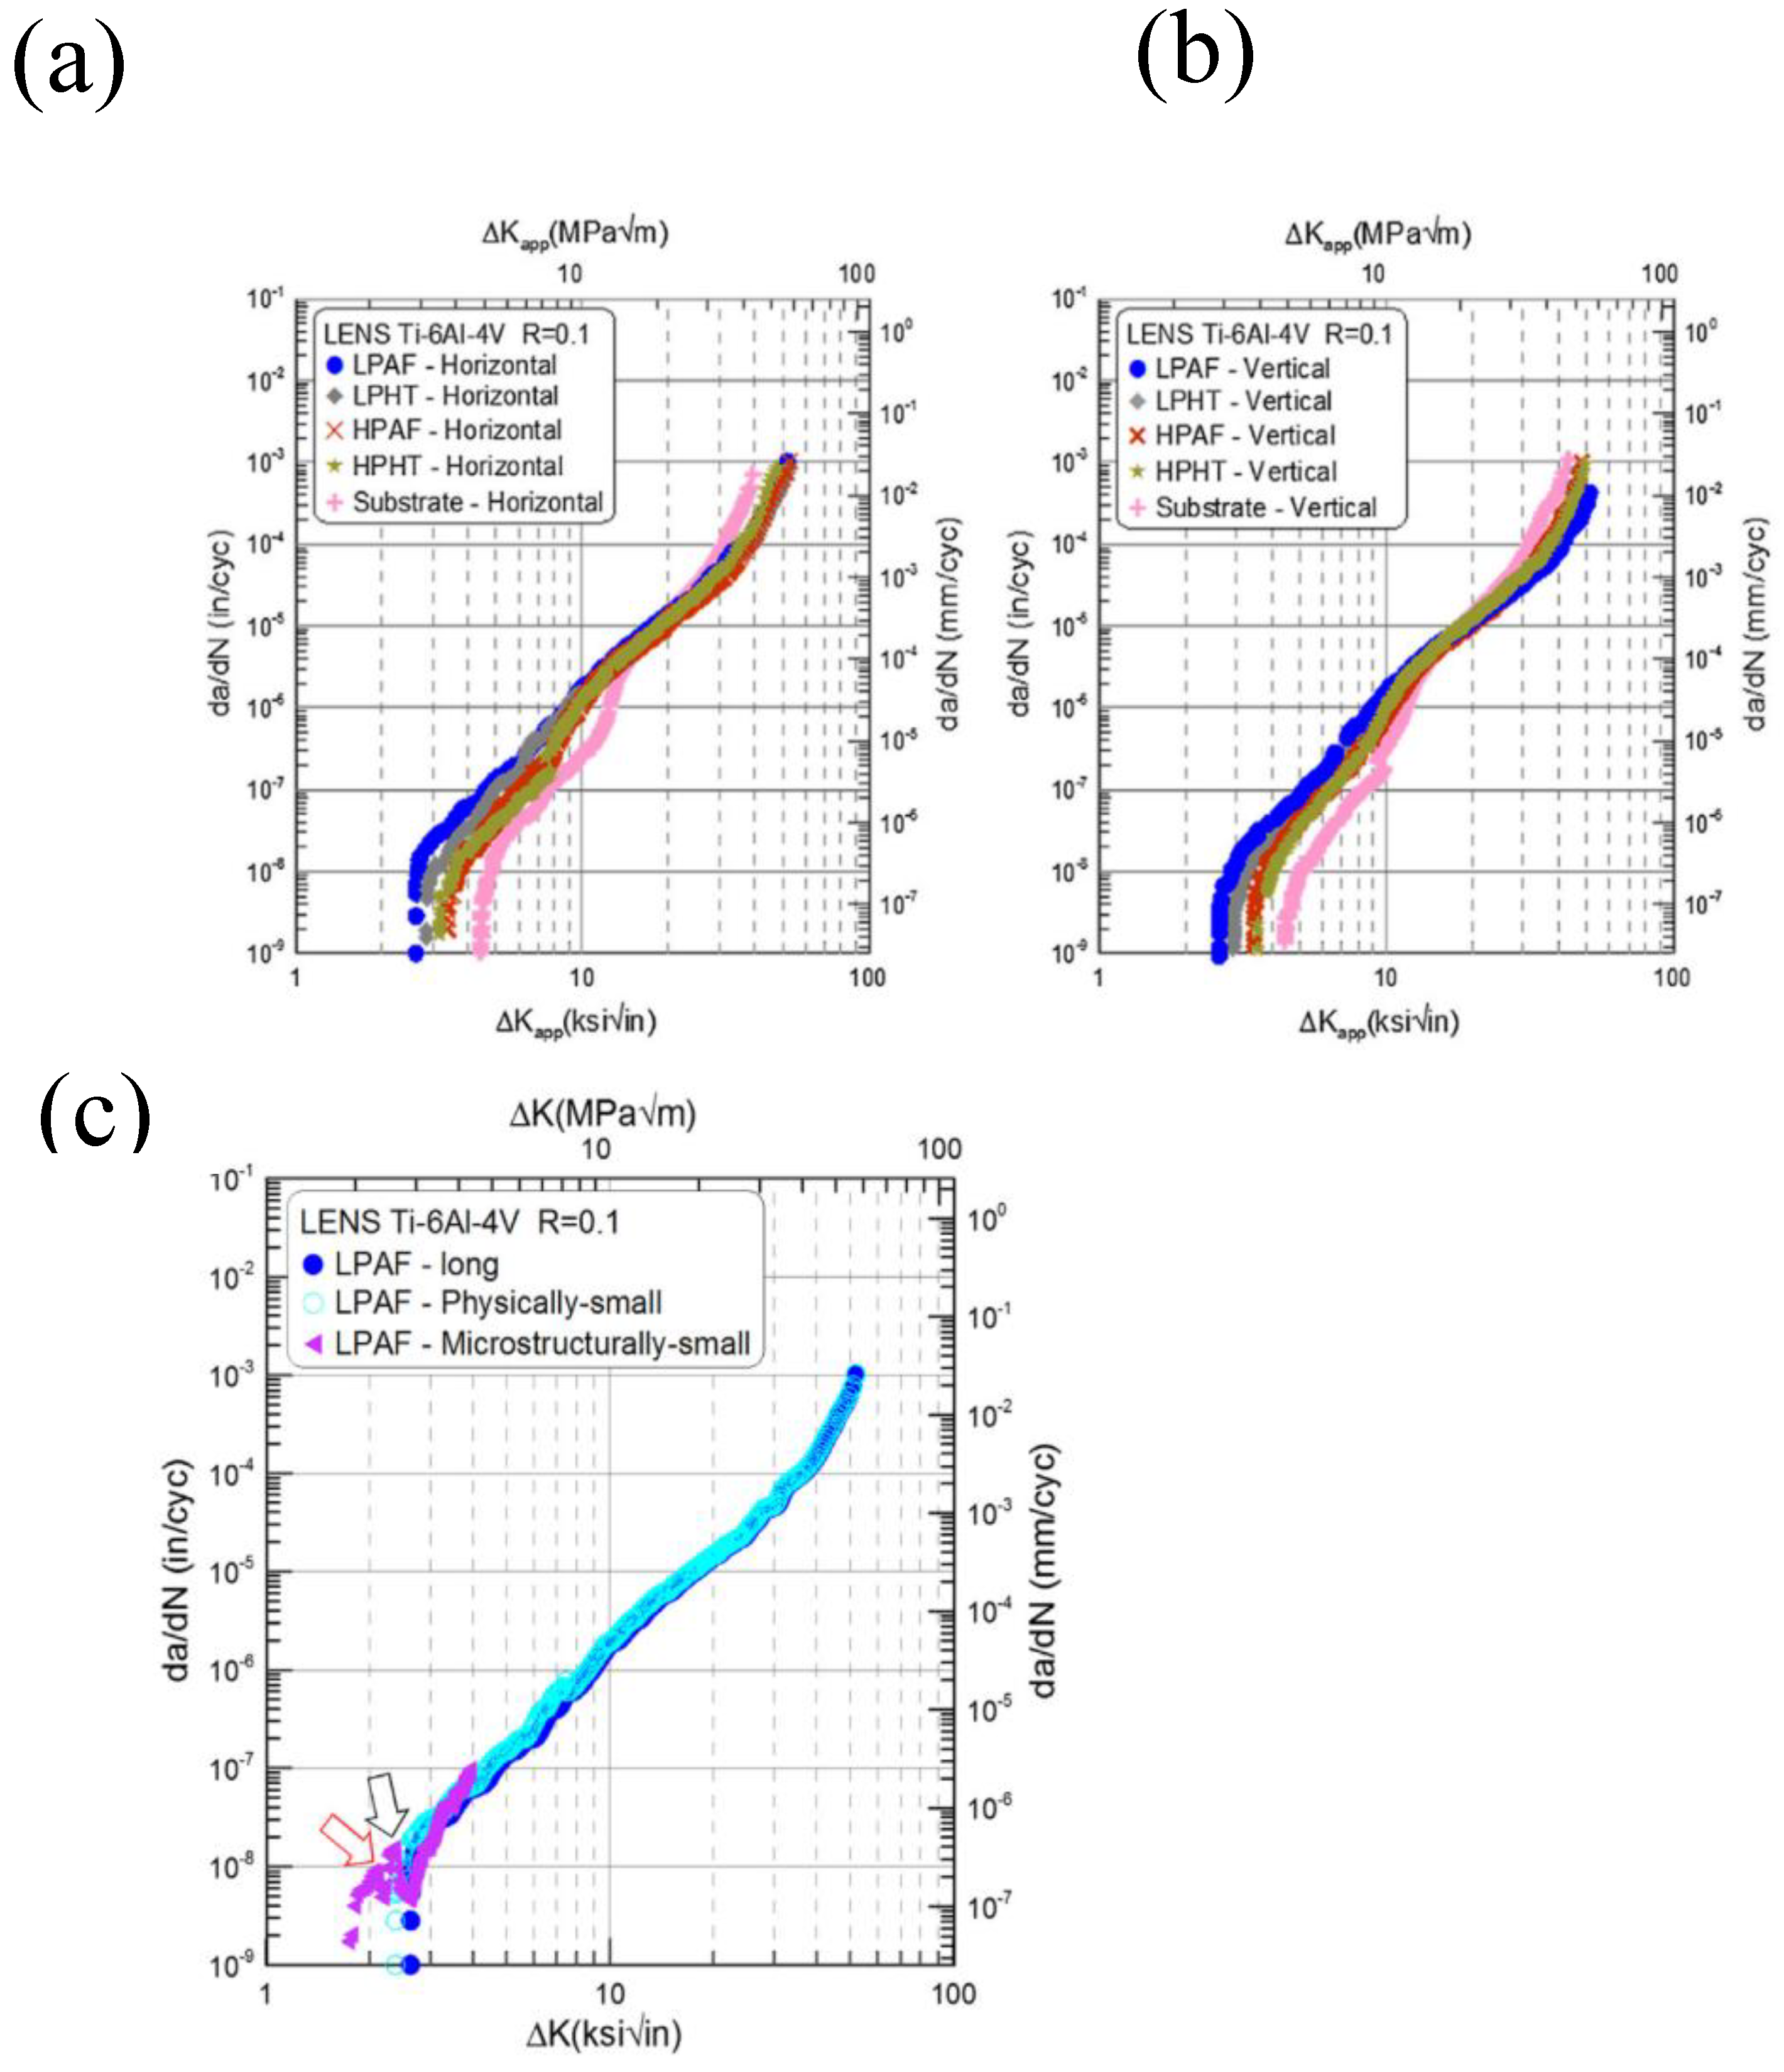
Figure 12.
FCG rate (da/dN) versus ΔK curves for HIP specimens: (a) R = 0 with overloads at OLR = 1.5 and OLR = 2; (b) R = 0.4 with overloads at OLR = 1.5 and OLR = 2; and (c) R = 0 with underloads at ULR = 2 and ULR = 3. Note: OLR denotes overload ratio, ULR denotes underload ratio. Overloads correspond to 50% (OLR = 1.5) and 100% (OLR = 2) load increases; underloads correspond to 100% (ULR = 2) and 150% (ULR = 3) load reductions. Reprinted with permission from Elsevier [85].
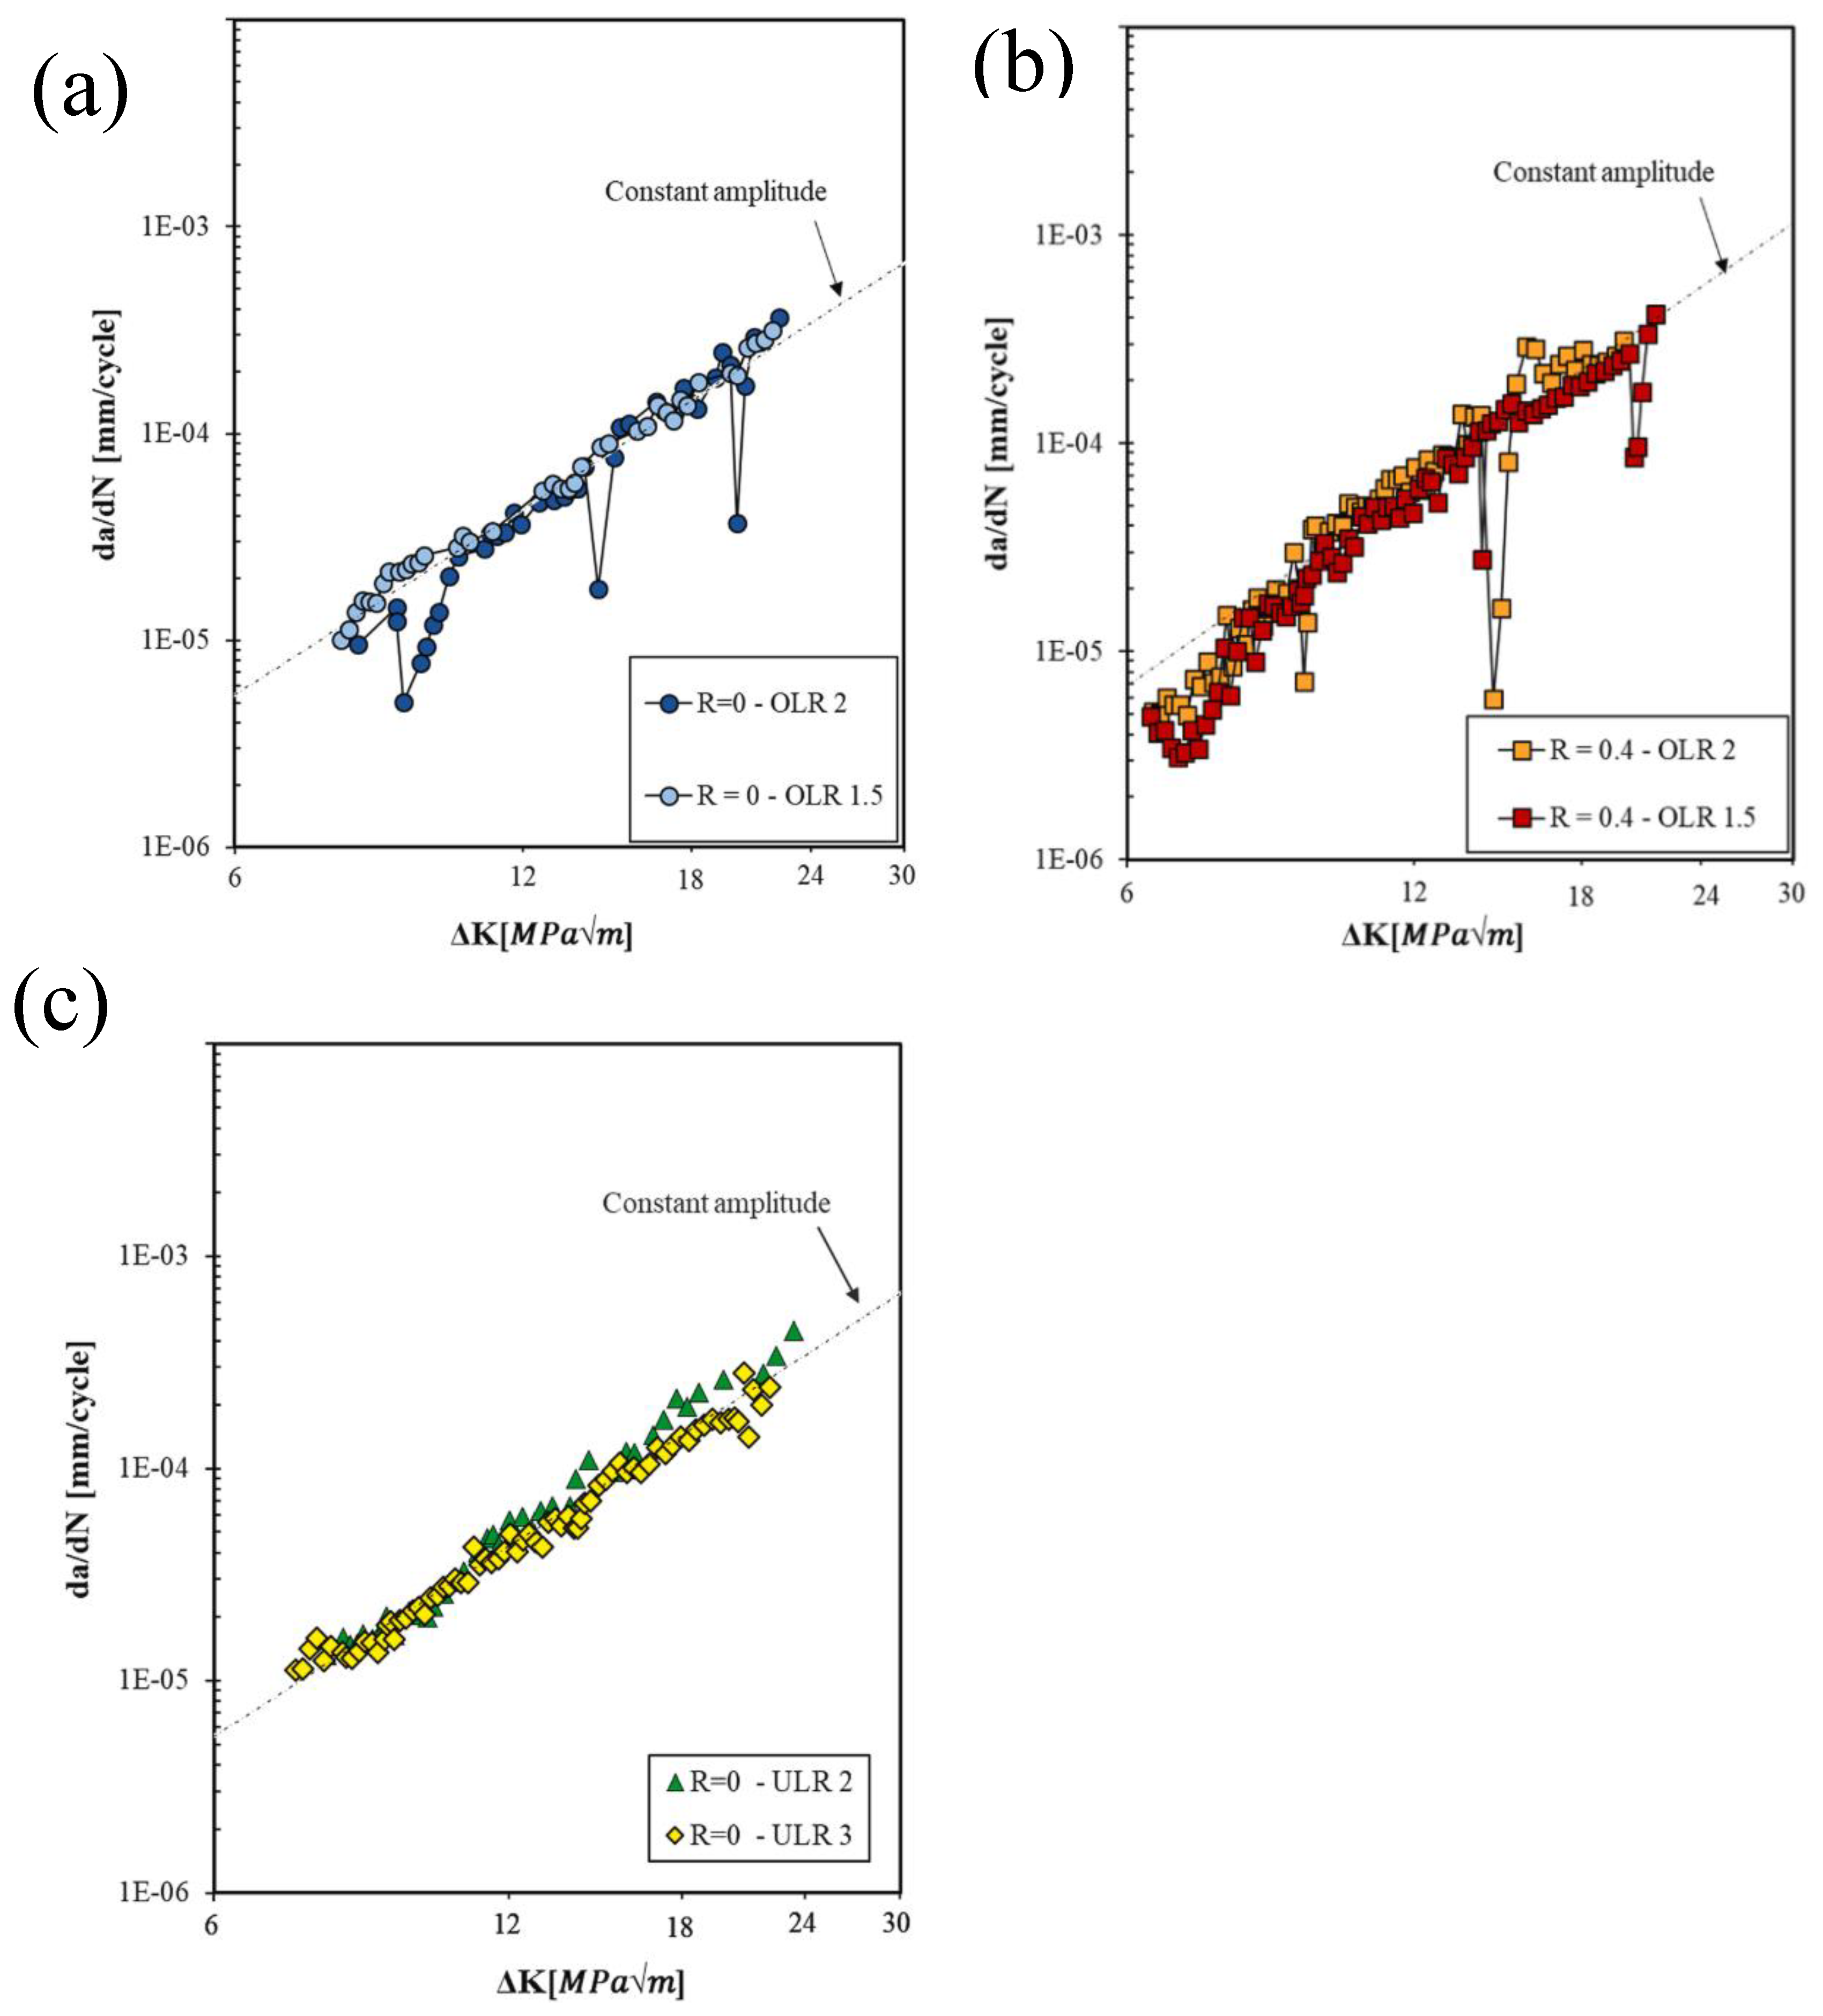
Figure 13.
Fractographs and crack paths of vertically built, as-built DED Ti64 specimens following FCG testing in (a) air and (b) 3.5 pct NaCl solution at an R ratio of 0.1. Reprinted with permission from Springer [45].
Figure 13.
Fractographs and crack paths of vertically built, as-built DED Ti64 specimens following FCG testing in (a) air and (b) 3.5 pct NaCl solution at an R ratio of 0.1. Reprinted with permission from Springer [45].
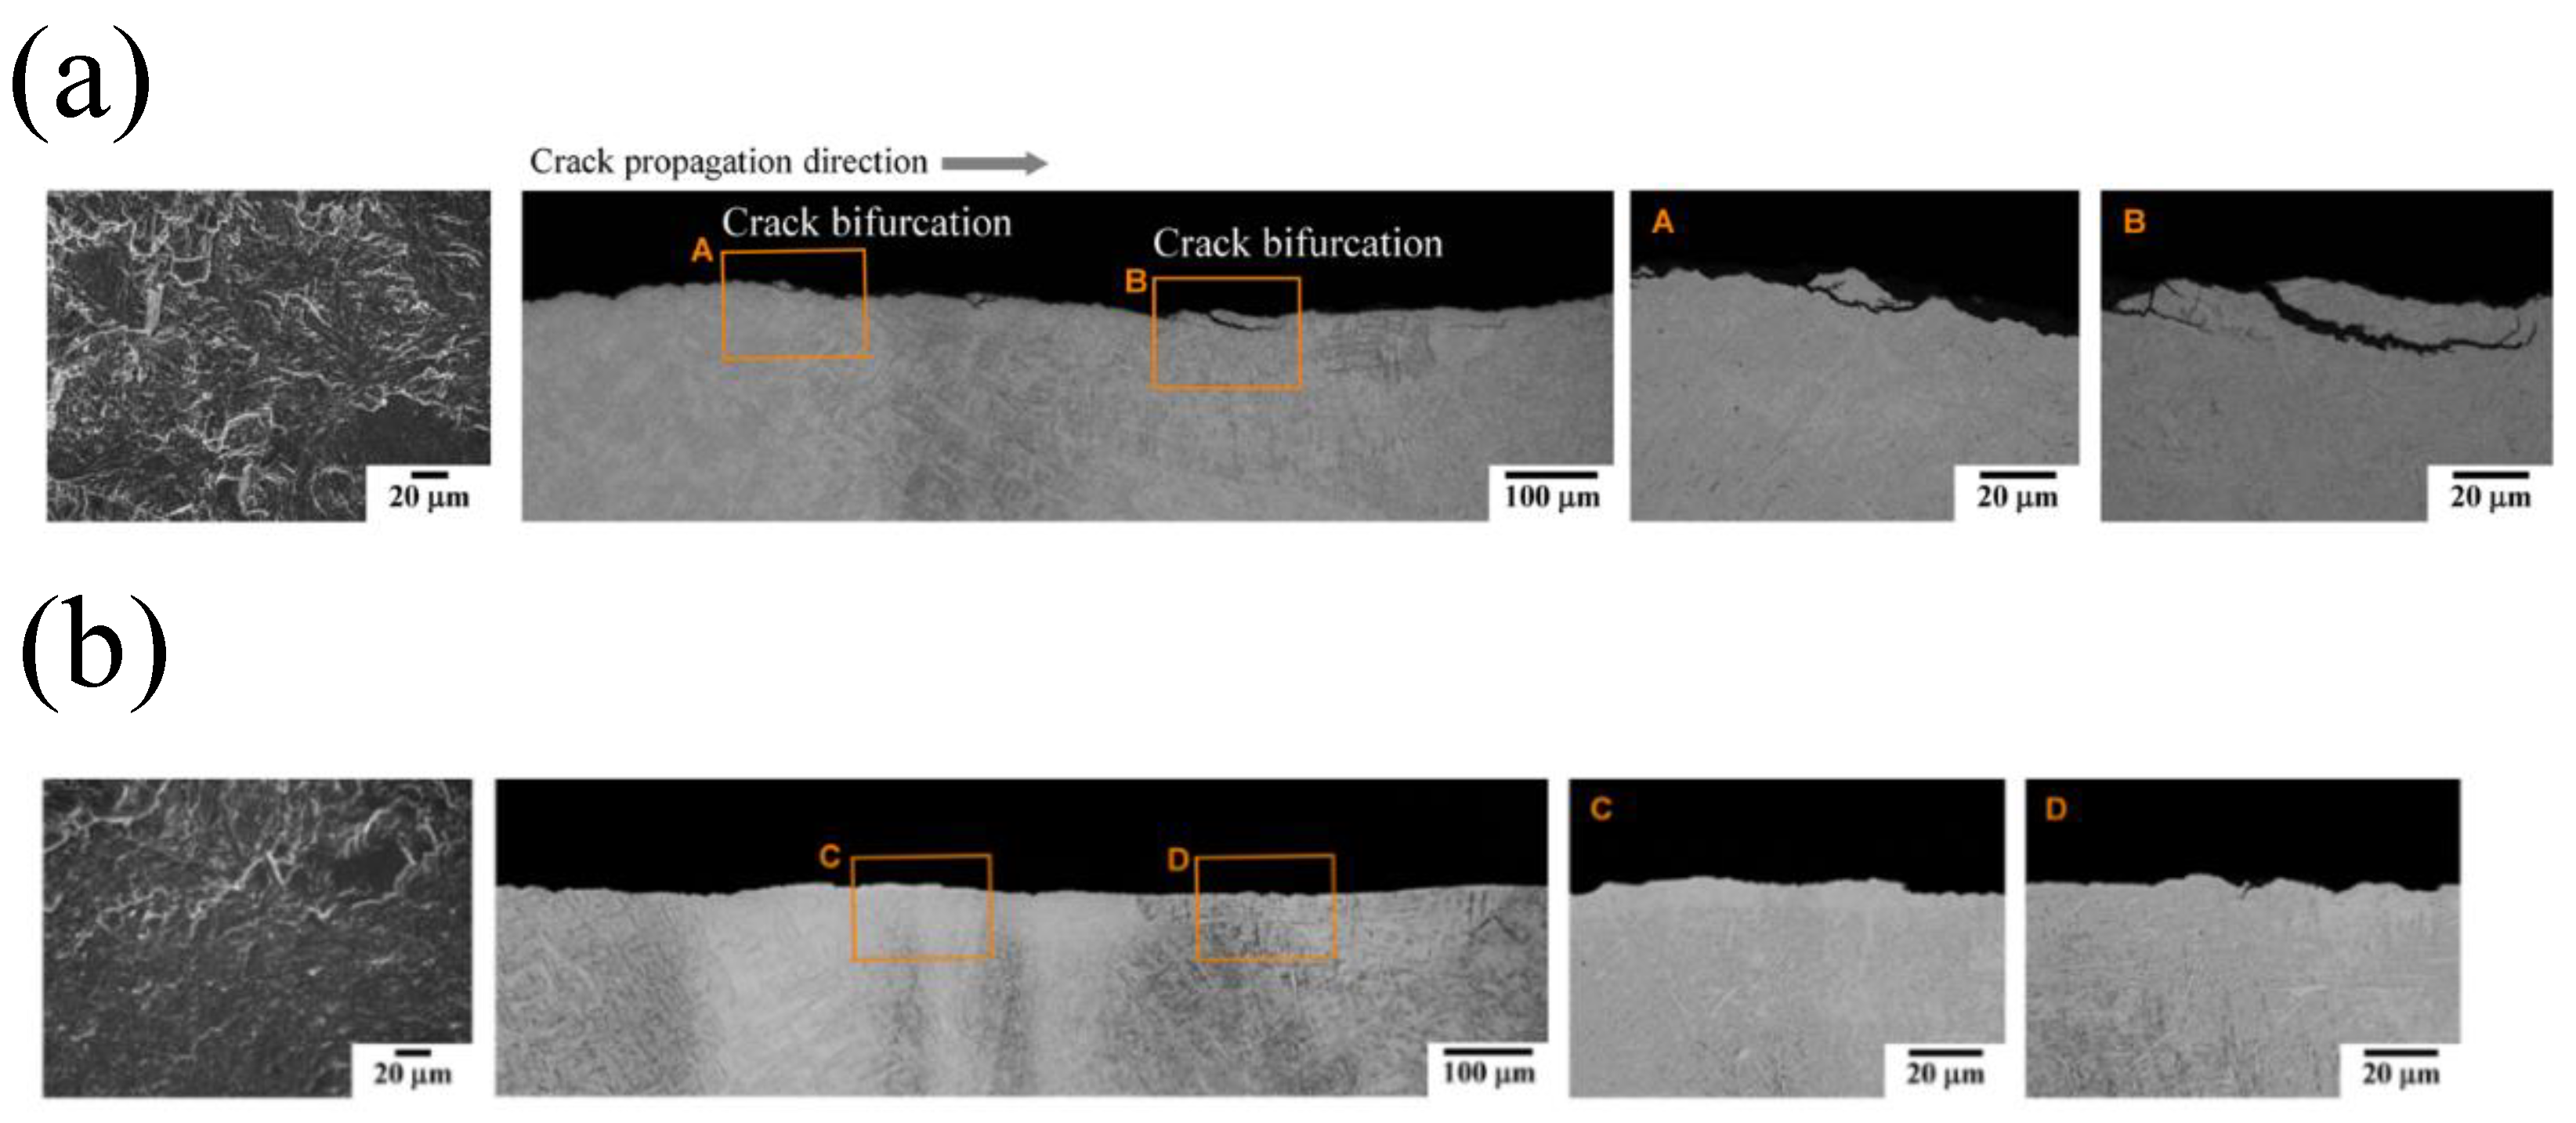
Figure 14.
Small FCG curves at R = 0.1 and R = 0.5, and comparison of small and long FCG curves at (B) R = 0.1 and (C) R = 0.5. Reprinted with permission from Wiley-Blackwell [90].
Figure 14.
Small FCG curves at R = 0.1 and R = 0.5, and comparison of small and long FCG curves at (B) R = 0.1 and (C) R = 0.5. Reprinted with permission from Wiley-Blackwell [90].
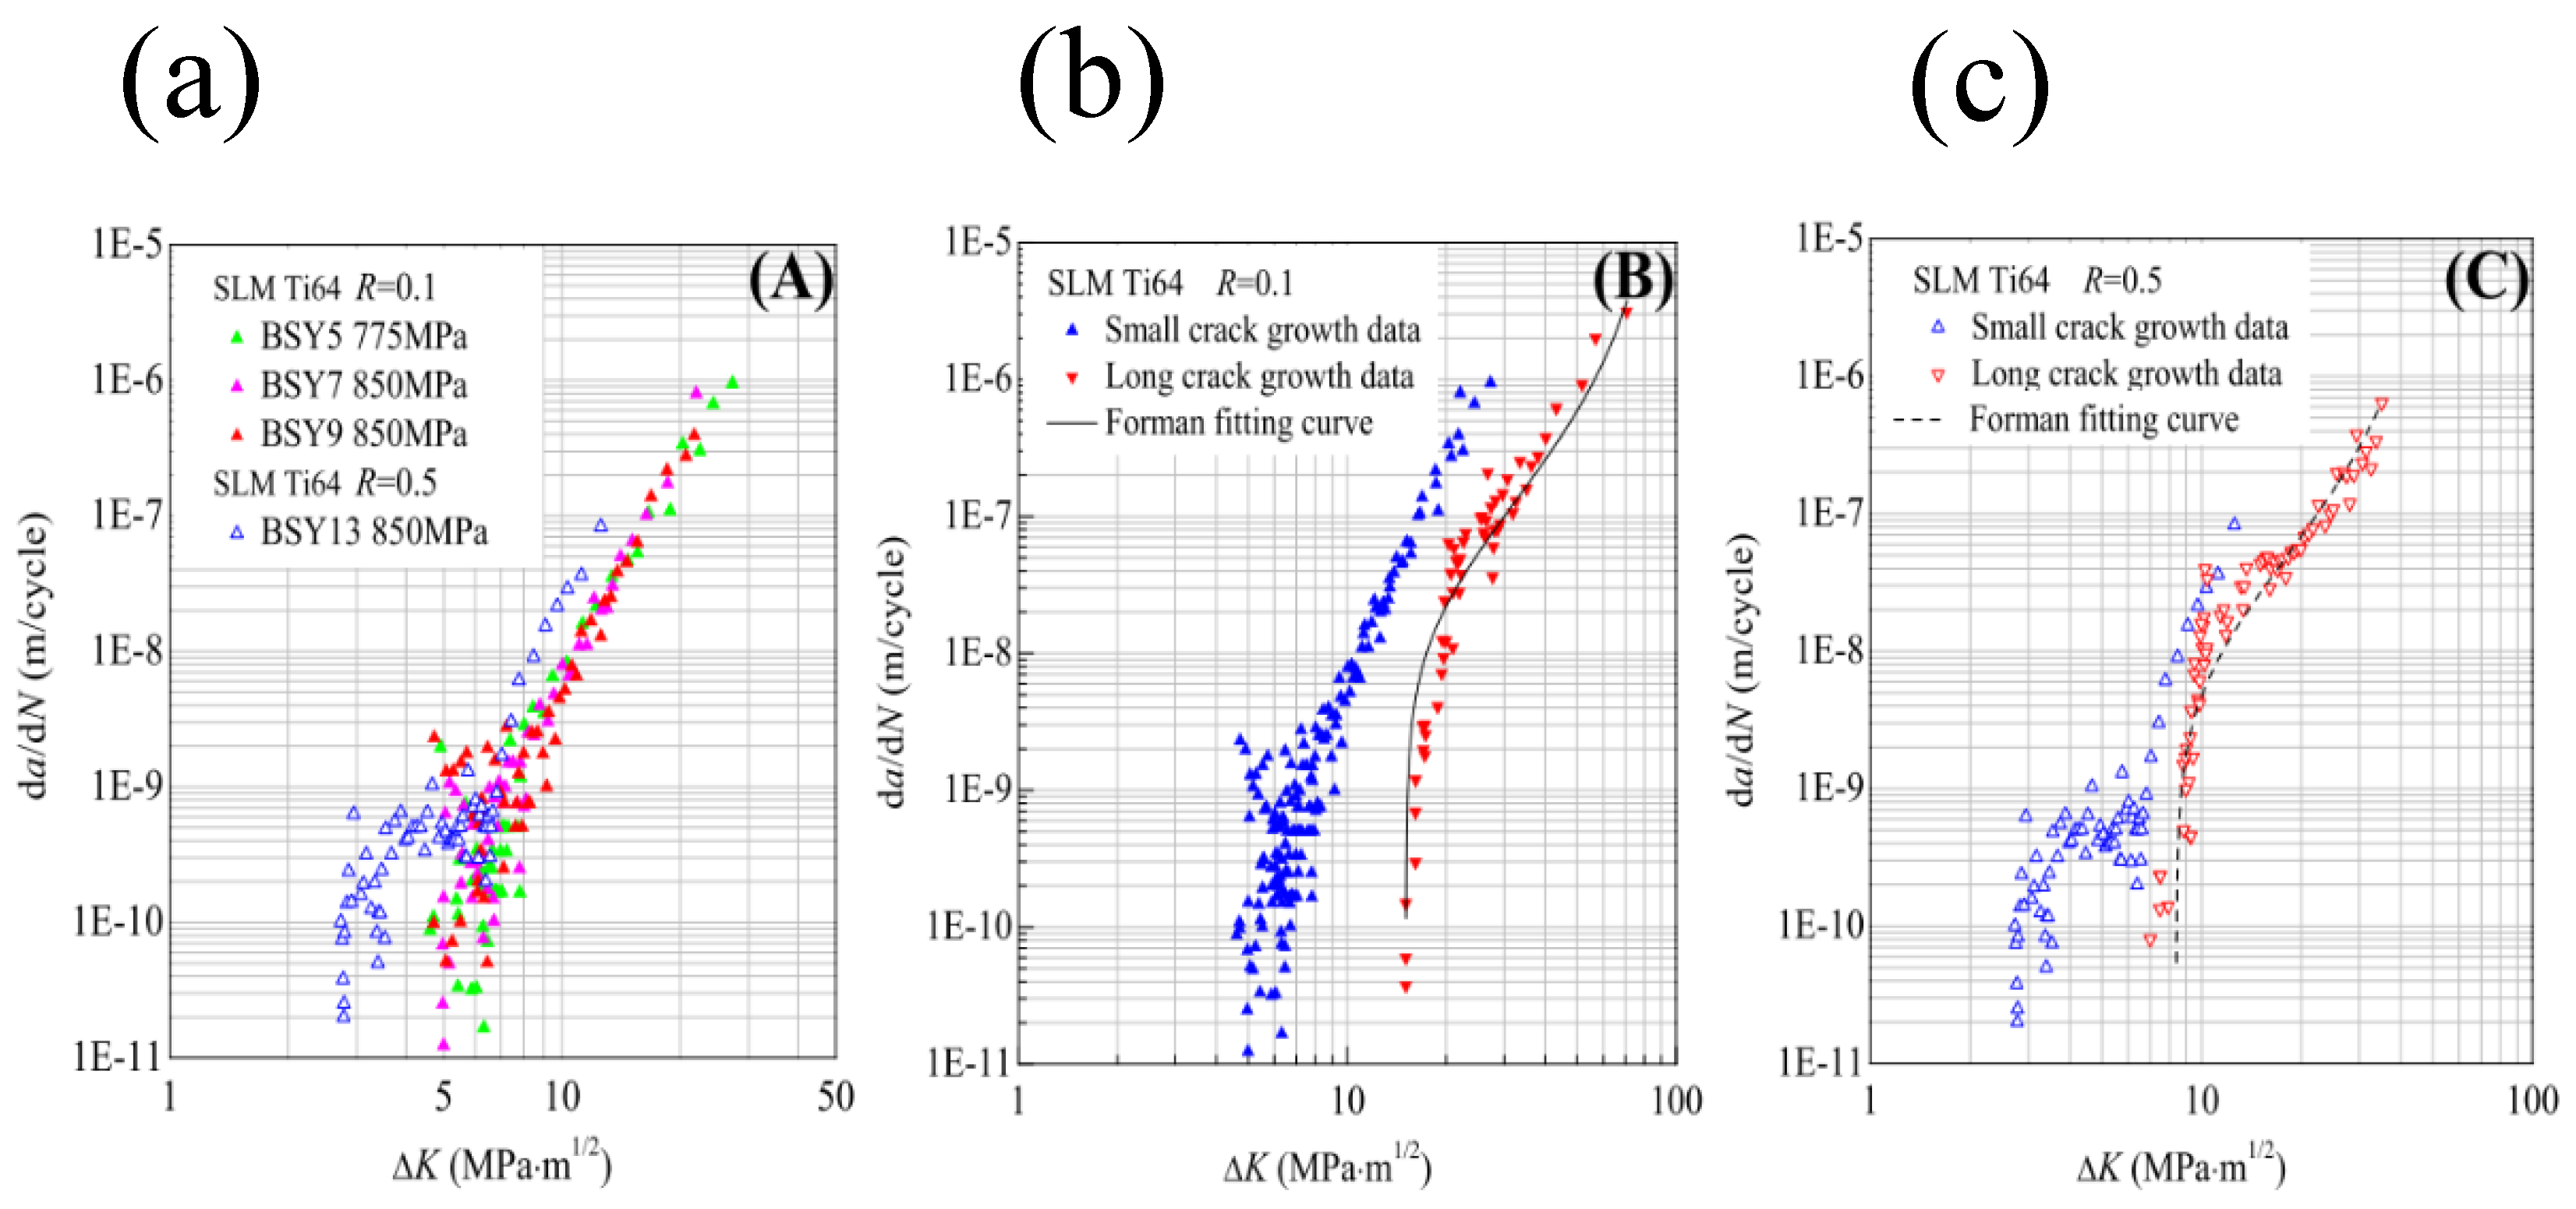
Figure 15.
Collated FCG datasets for AM Ti64 from the literature: (a) comparison across AM processes (Wire (W)-DED, Powder (P)-DED, Electron (E)-PBF, and L-PBF) tested in air at R = 0.1; (b) variation among L-PBF specimens with different post-processing conditions (as-built, heat-treated, and HIP).
Figure 15.
Collated FCG datasets for AM Ti64 from the literature: (a) comparison across AM processes (Wire (W)-DED, Powder (P)-DED, Electron (E)-PBF, and L-PBF) tested in air at R = 0.1; (b) variation among L-PBF specimens with different post-processing conditions (as-built, heat-treated, and HIP).
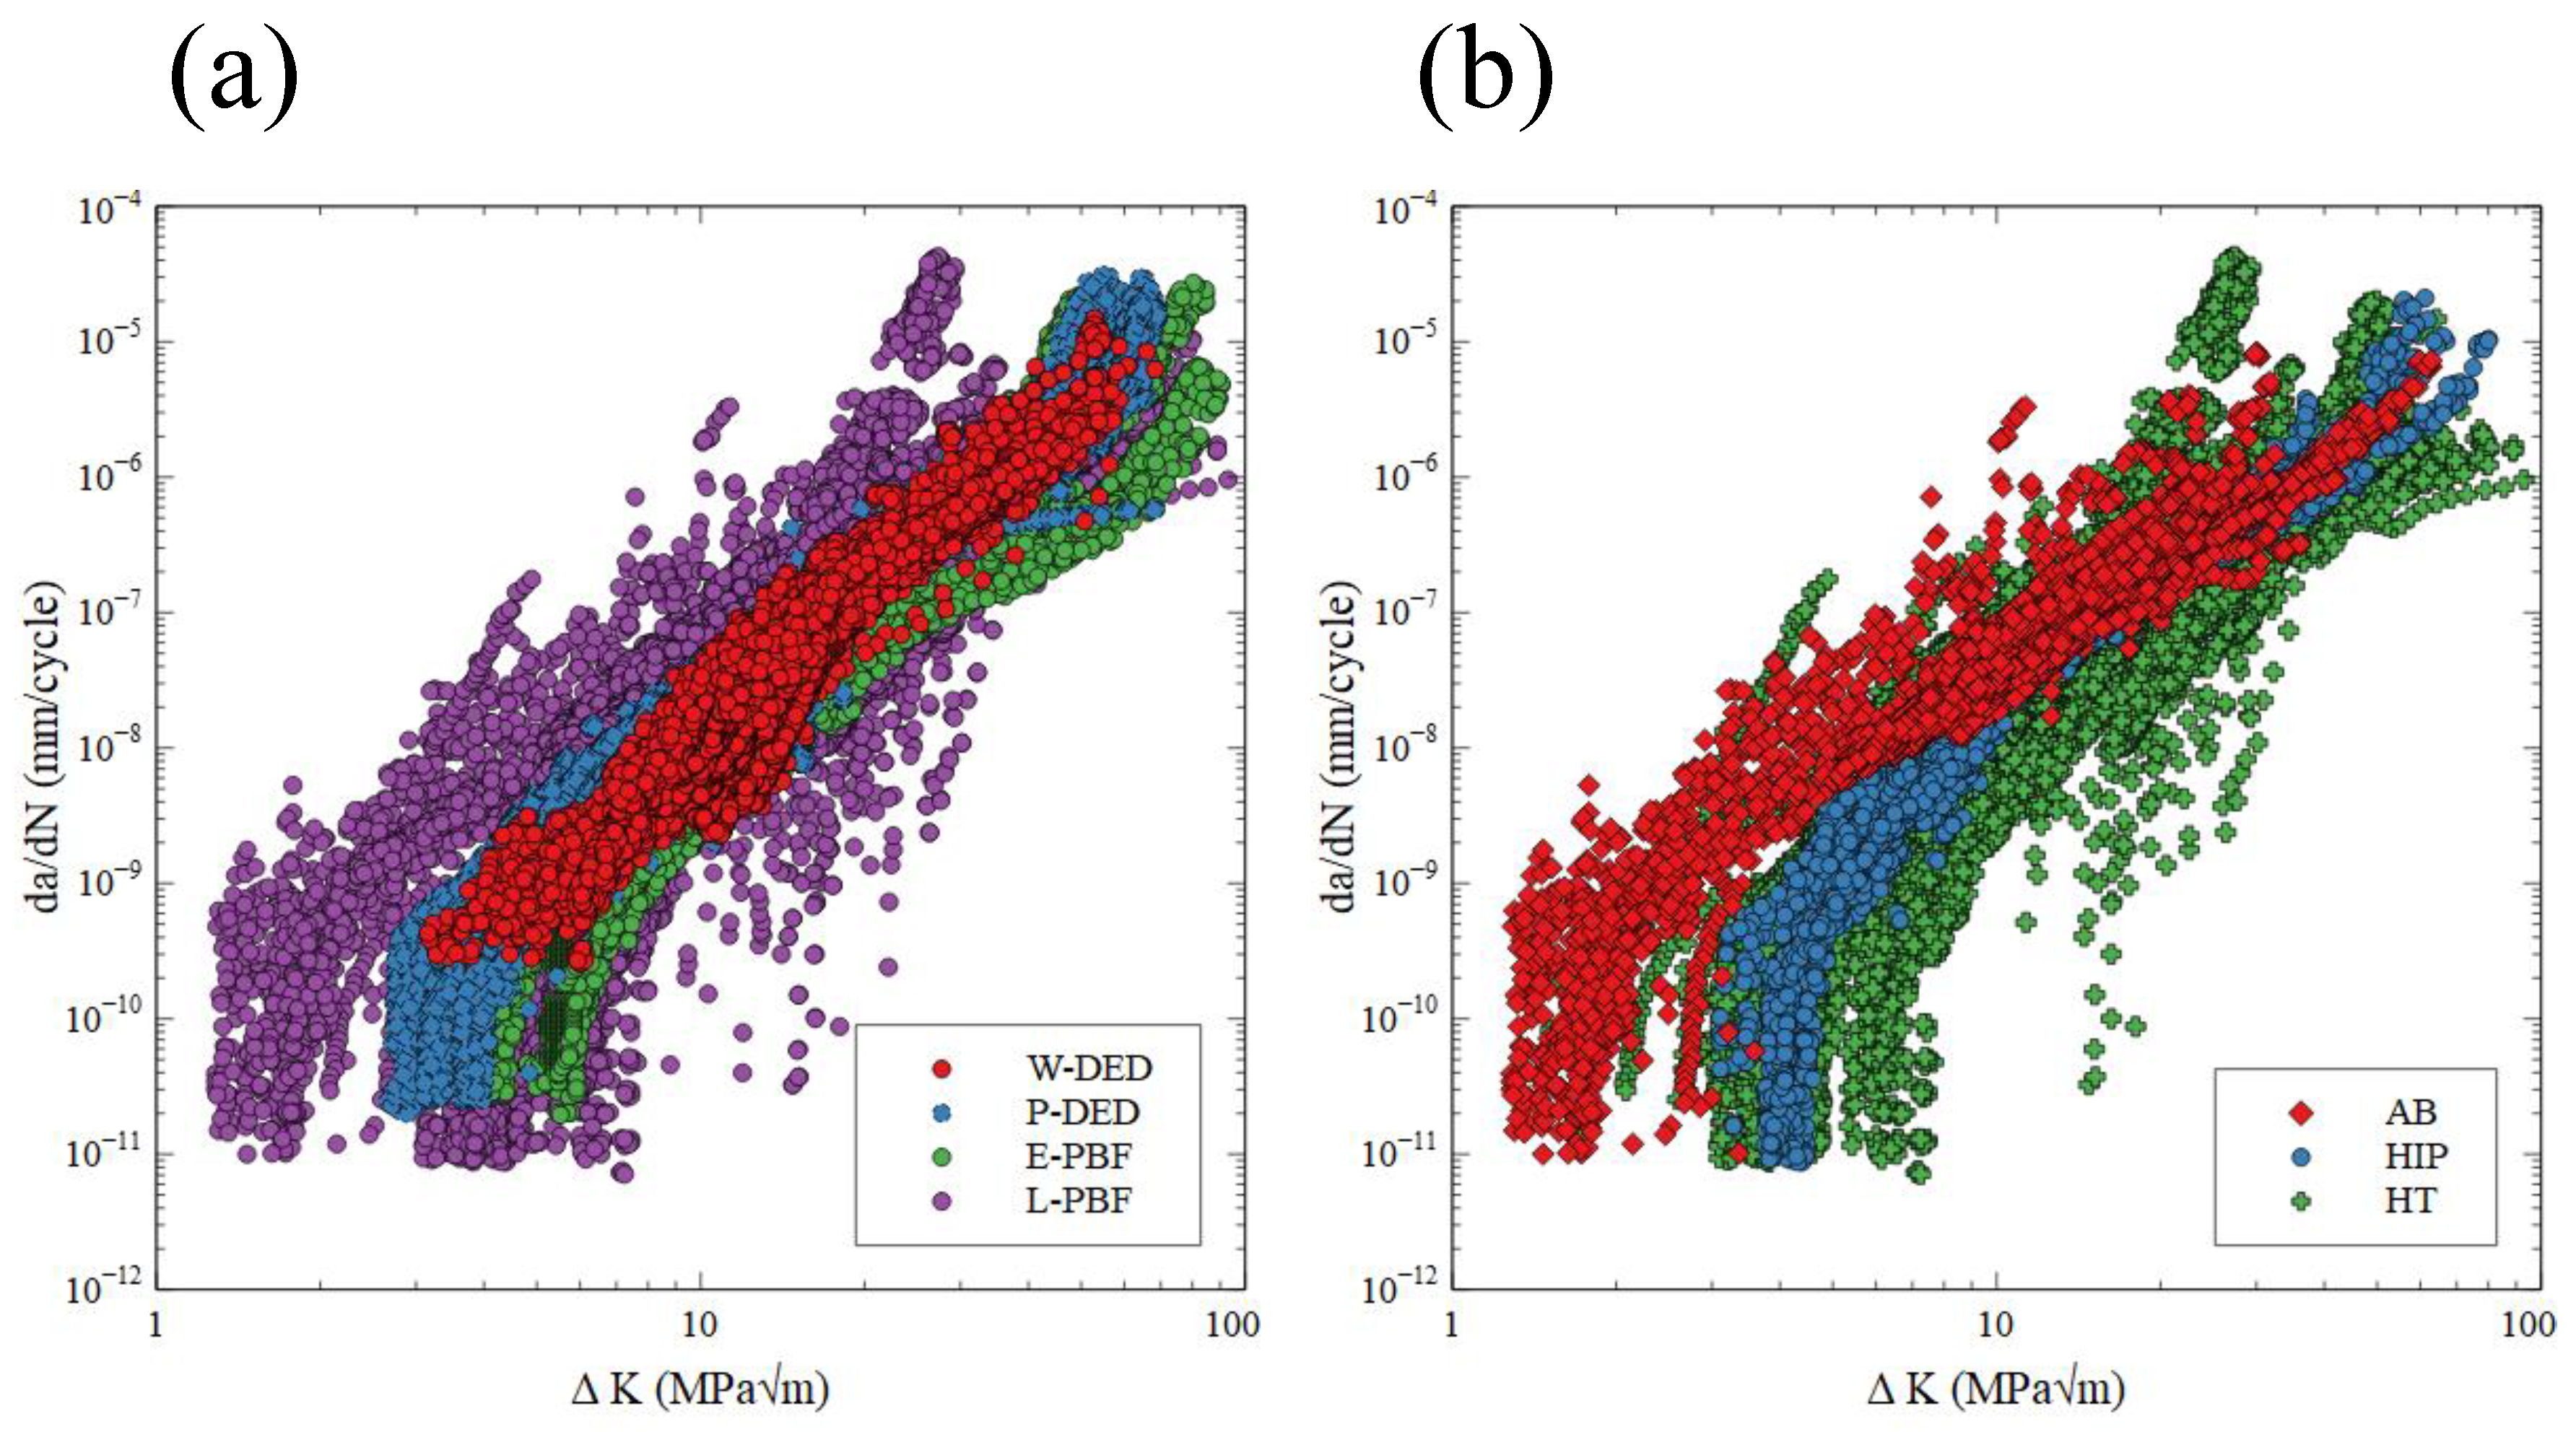
Figure 16.
ΔKth vs AM process plots of AM Ti64 datasets collated from the literature.
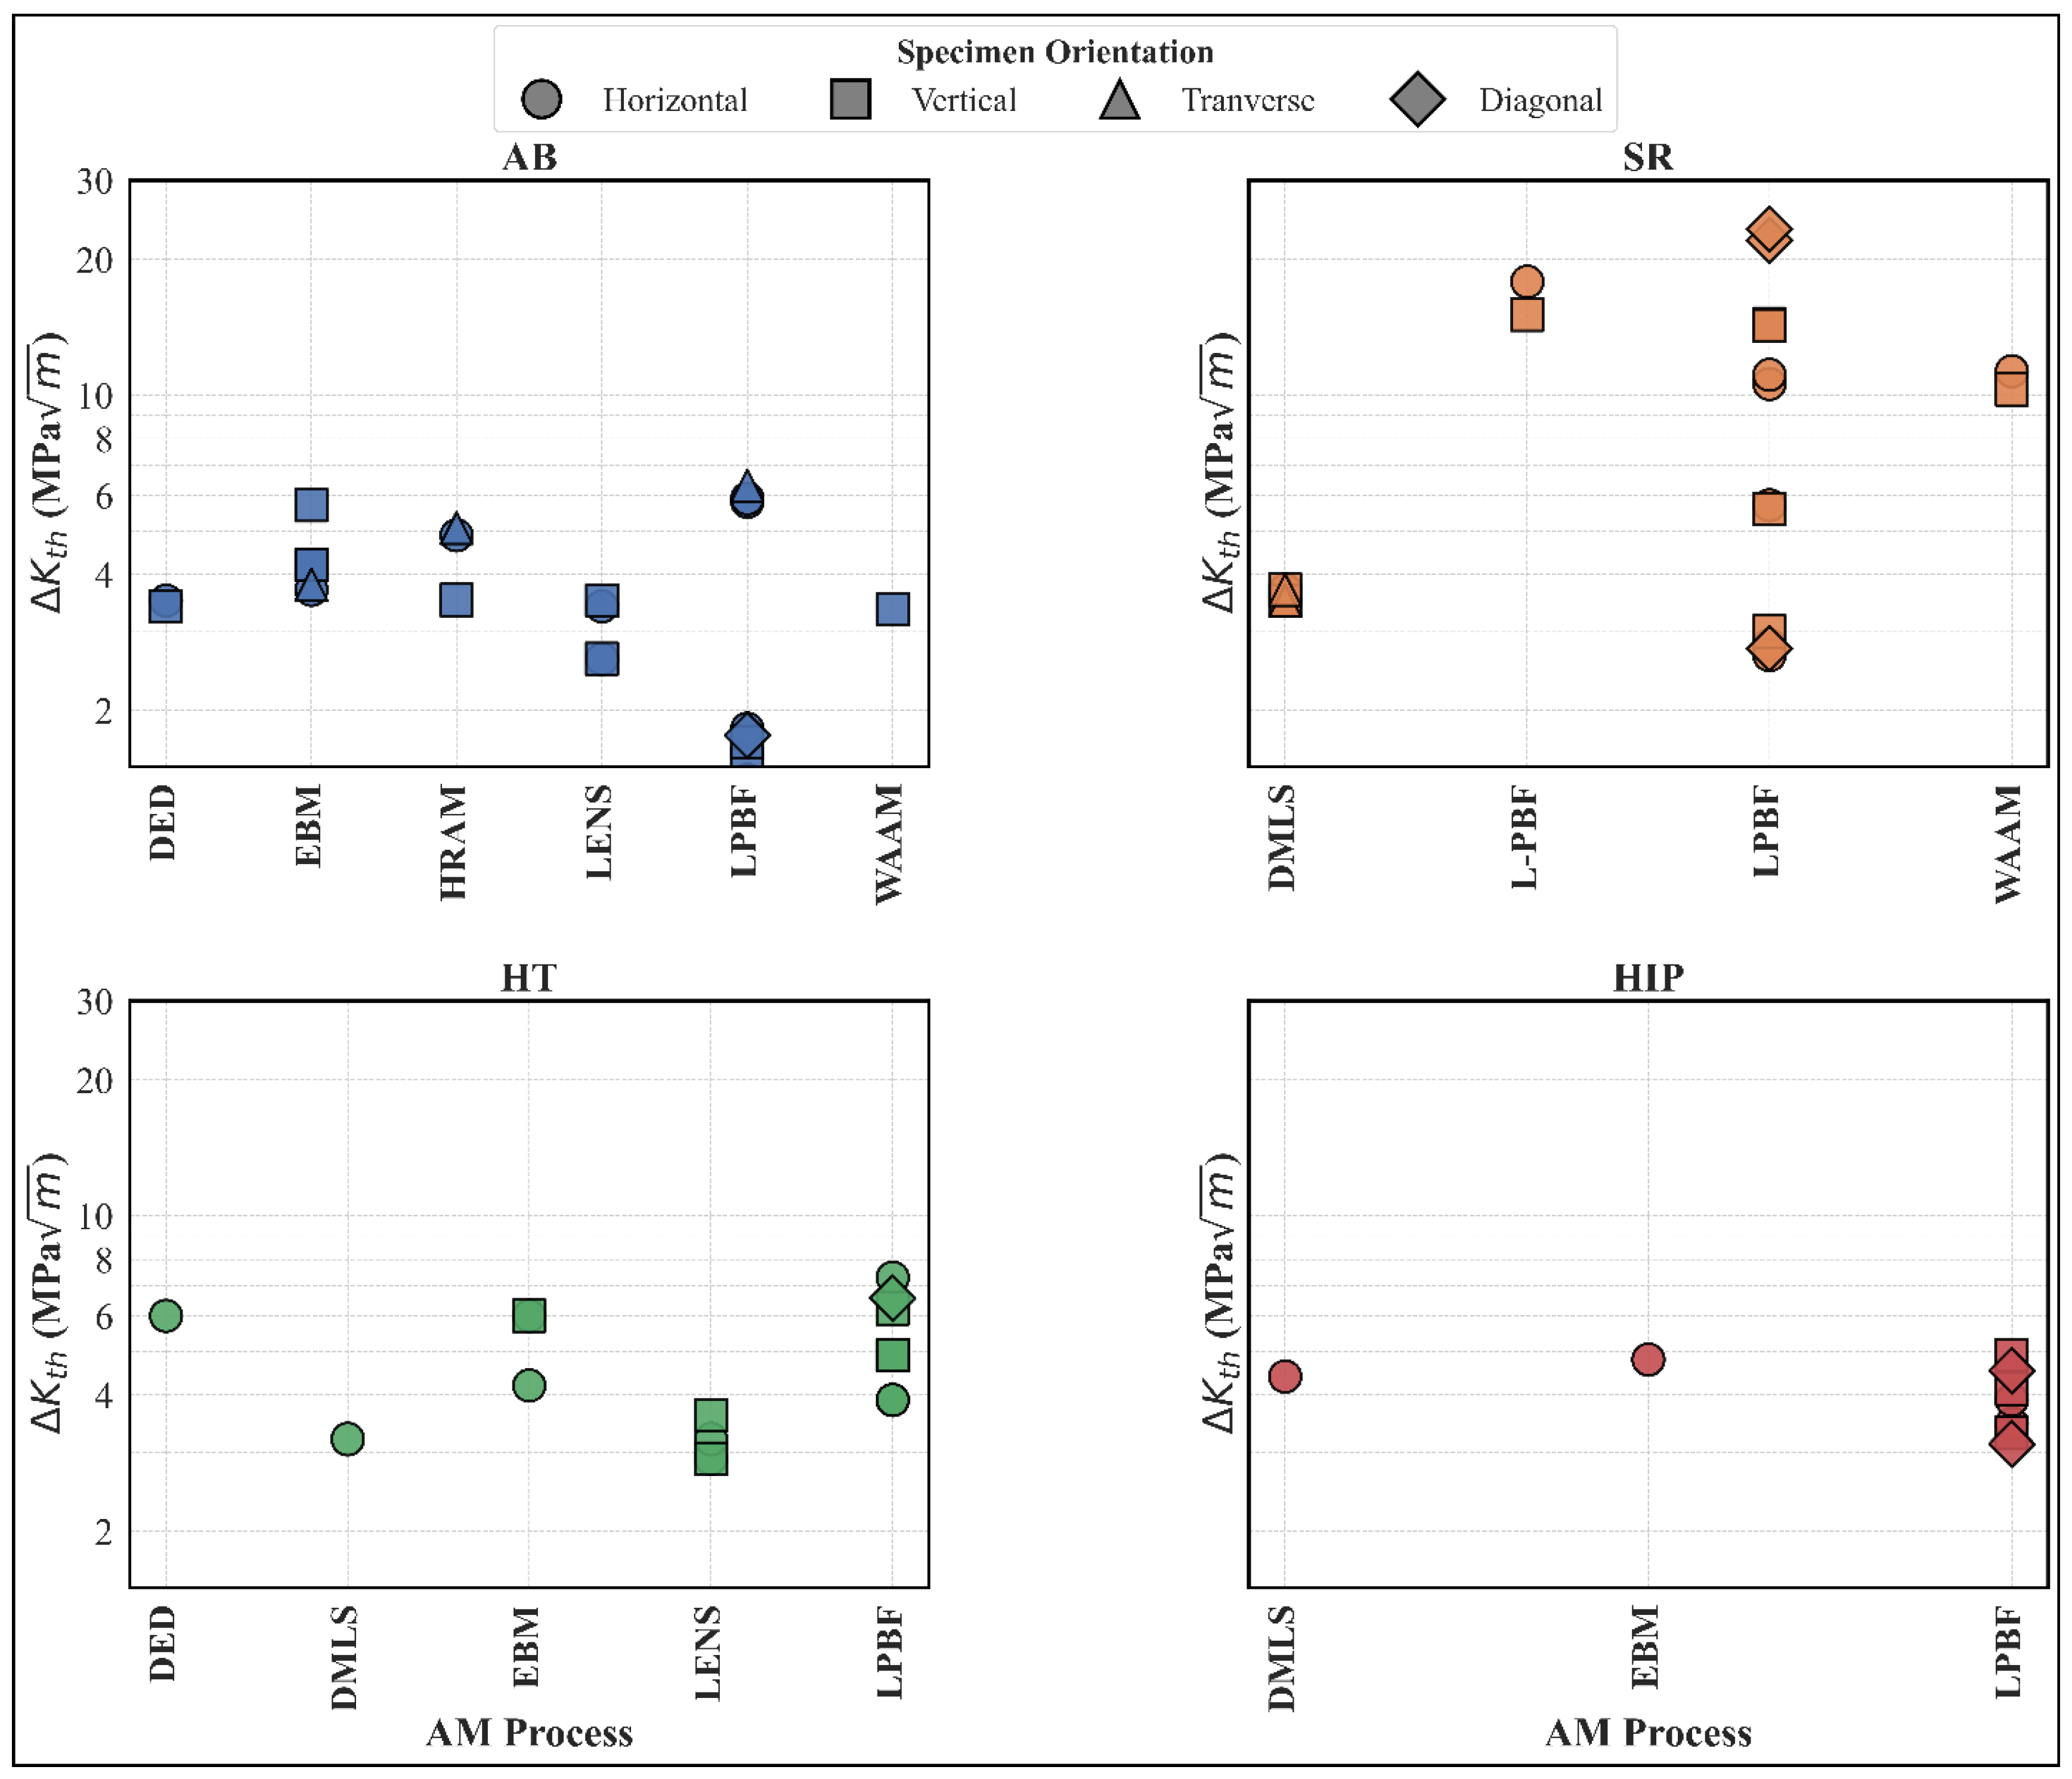
Figure 17.
(a) Degree of compliance with the 20 combined documentation indices () listed in Table 3; (b) Scores for the AM Ti64 FCG studies reviewed in this study.
Figure 17.
(a) Degree of compliance with the 20 combined documentation indices () listed in Table 3; (b) Scores for the AM Ti64 FCG studies reviewed in this study.
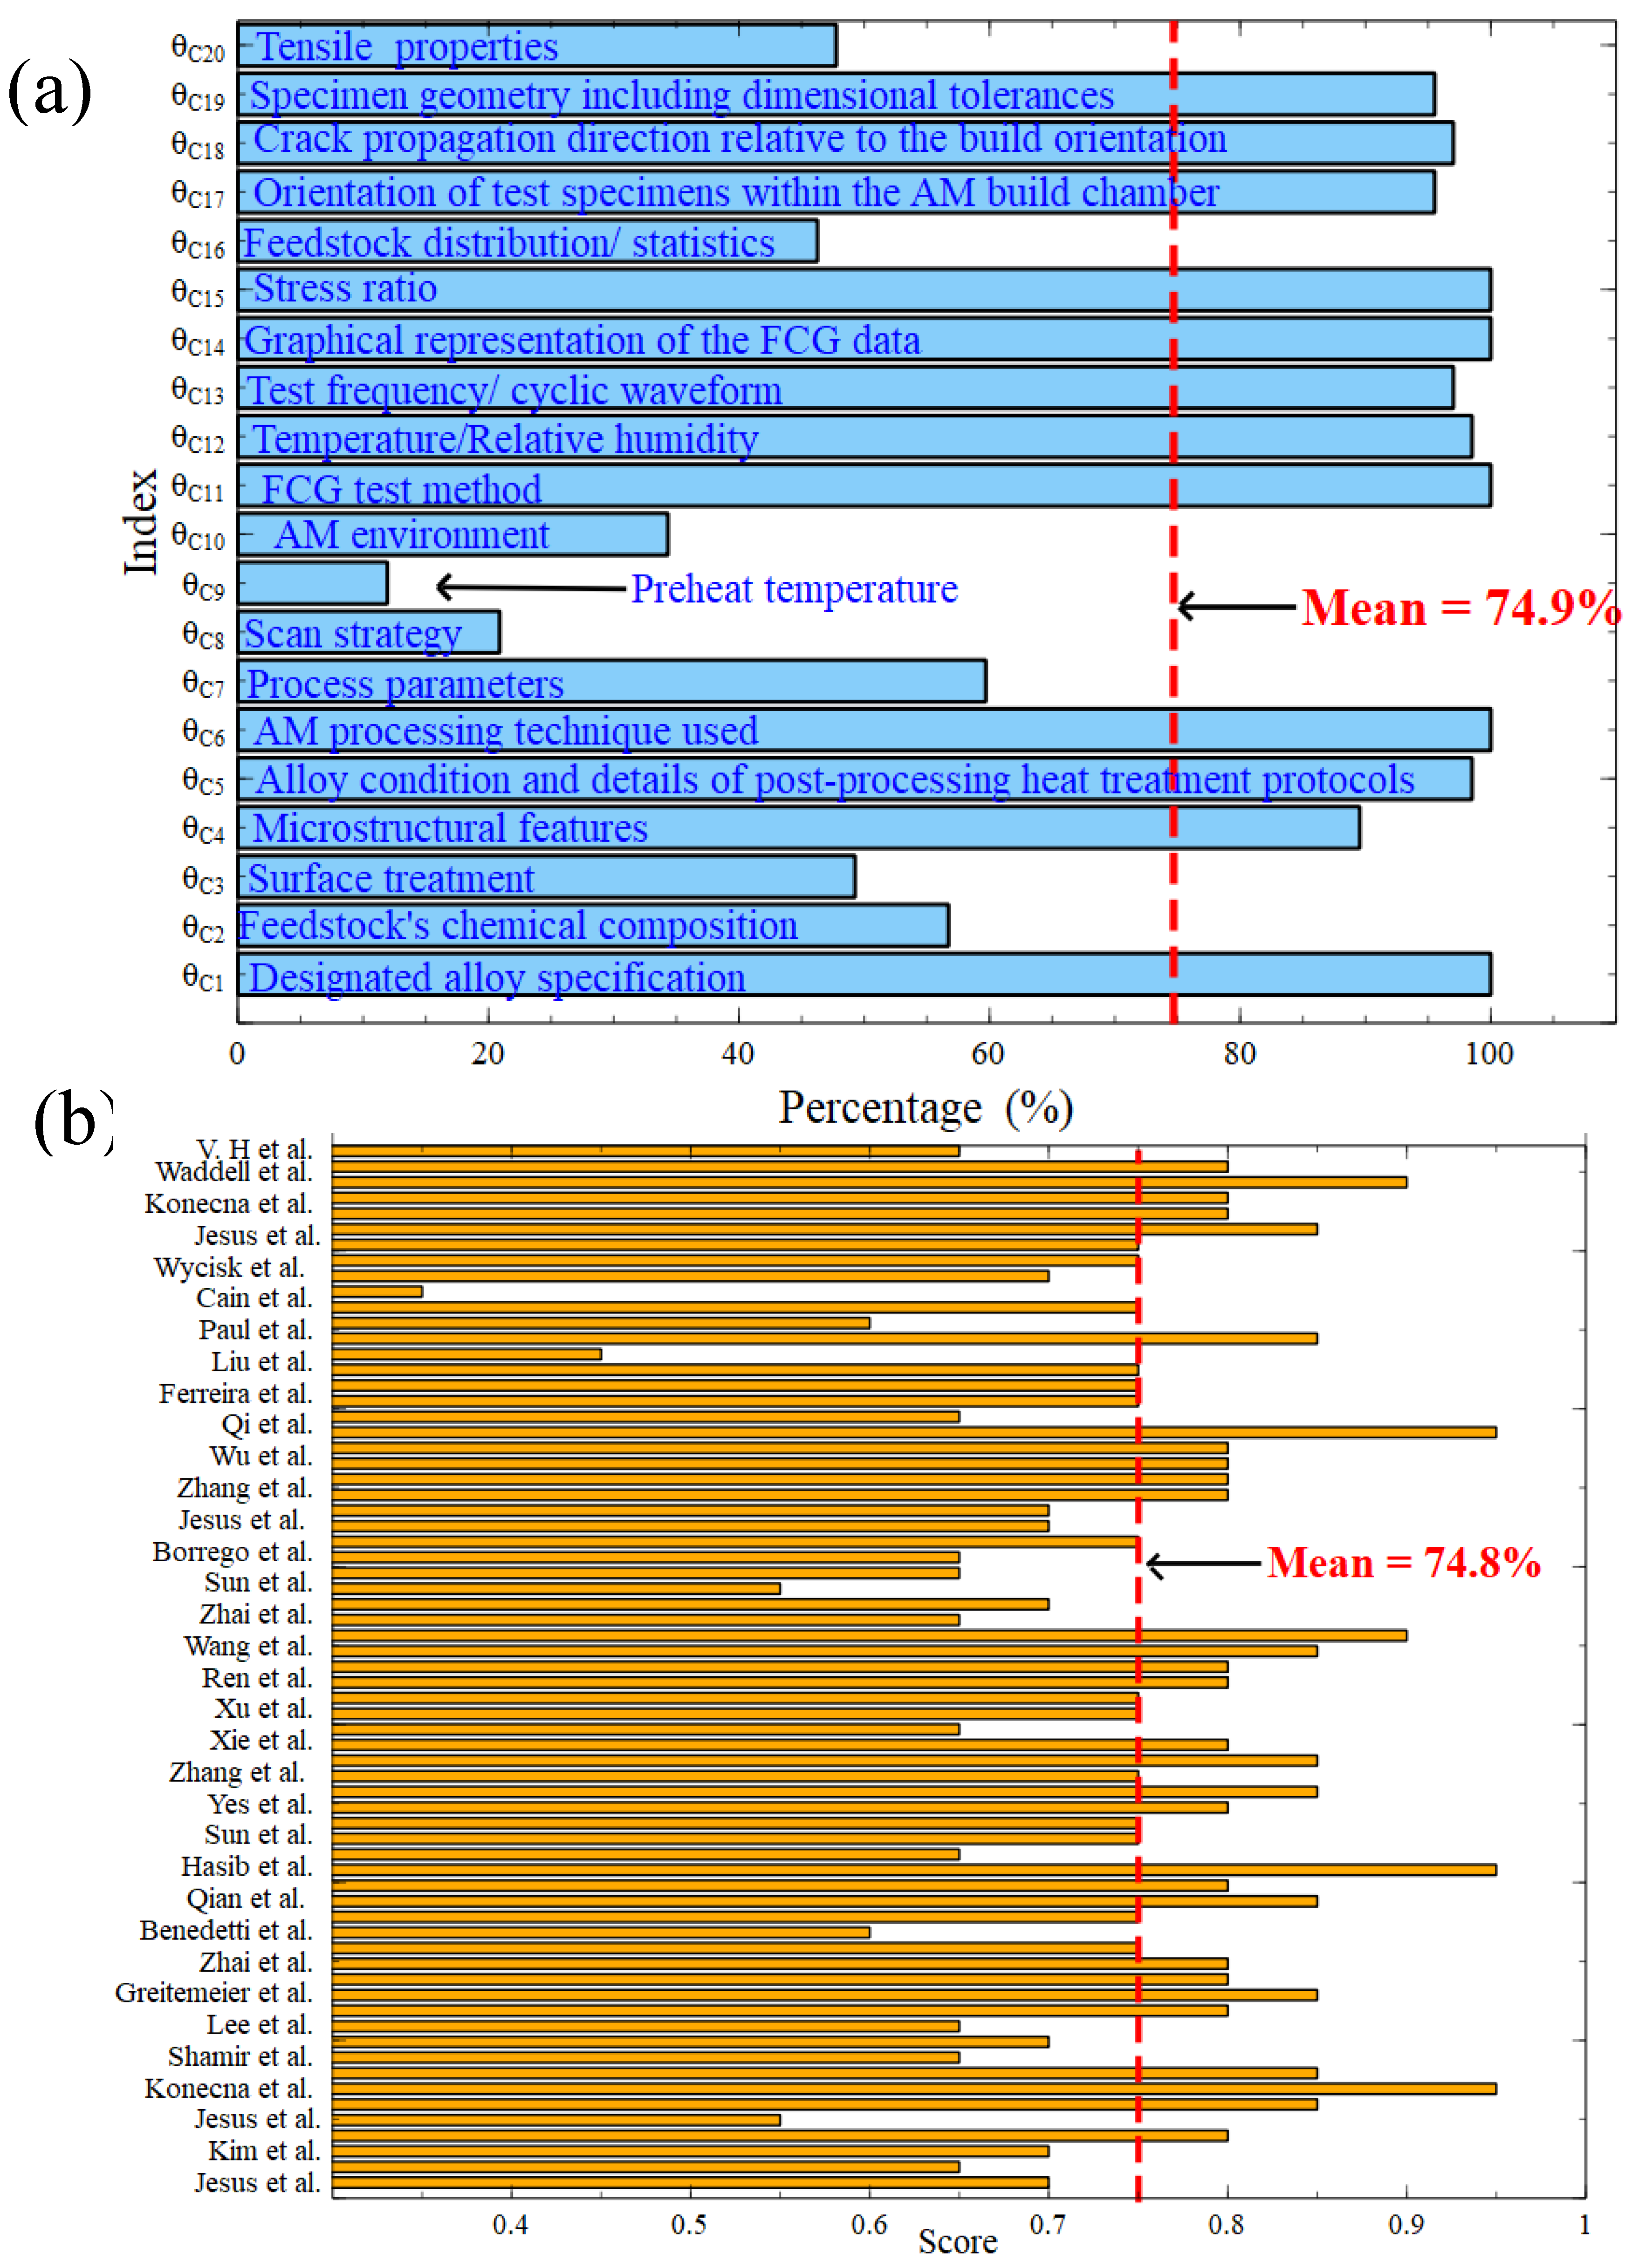

Table 1.
Summary of literature on FCG in AM Ti64.
| Ref. | AM type | Orientation | Fatigue Temperature (°C) | Fatigue Environment | Load Ratio | Frequency (Hz) | Specimen Type | Type of fatigue test |
| [44] | L-PBF | H | RT | Air | 0.05,0.4 | 10 | C(T) | Uniaxial |
| [45] | P-DED | H, V | RT | Air, 3.5% NaCl | 0.1 | 10 | C(T) | Uniaxial |
| [46] | P-DED | H, V | RT | Air | 0.1 | 10 | C(T) | Uniaxial |
| [47] | L-PBF | H, V, T | RT | Air | 0.1-0.92 | 60,80 | C(T) | Uniaxial |
| [48] | L-PBF | - | RT | Air, artificial saliva, Ringer’s solution | 0.05 | 1,10 | C(T) | Uniaxial |
| [49] | E-PBF | H, V | RT | Air | 0.1,0.5,0.8 | 20 | C(T) | Uniaxial |
| [50] | L-PBF | H, V | RT | Air | 0.1 | 50,80 | C(T) | Uniaxial |
| [51] | W-DED+ roll | H, V | RT | Air | 0.1 | 10 | C(T) | Uniaxial |
| [52] | W-DED | V | RT | Air | 0.1 | 10 | C(T) | Uniaxial |
| [53] | L-PBF | - | RT | Air | 0.1 | 10 | Rectangular c/s | Uniaxial |
| [54] | P-DED | - | RT | Air, vacuum, 3.5% NaCl | 0.1,0.9 | 10 | C(T) | Uniaxial |
| [55] | L-PBF | H, V | RT | Air | 0.1 | 10,40 | C(T) | Uniaxial |
| [56] | L-PBF (E-PBF) | H | RT | Air | 0.1,0.7 | - | C(T), SEN(B) | Uniaxial |
| [57] | E-PBF | H, V | RT | Air | 0.1,0.3,0.7 | 20 | C(T) | Uniaxial |
| [58] | P-DED | H, V | RT | Air | 0.1,0.8 | 20 | C(T) | Uniaxial |
| [43] | L-PBF | H, V, D, 30° | RT | Air | 0.1 | 10 | SEN(T) | Uniaxial |
| [59] | L-PBF | H | RT | Air | 0.1,1 | 150 | M(T) | Uniaxial |
| [60] | L-PBF | H, V, D | RT | Air | 0.1,0.3,0.6 | 20 | C(T) | Uniaxial |
| [61] | L-PBF | H, V | 400 | Air | 0.2 | 10 | SEN(T) | In-situ SEM |
| [62] | L-PBF | H | RT | Air | 0.1 | 10 | C(T) | Uniaxial |
| [63] | L-PBF | H, V | RT | Air | 0.1 | 60 | C(T) | Uniaxial |
| [64] | L-PBF | H | RT | Air | 0.1,0.5 | 10 | C(T) | Uniaxial |
| [65] | L-PBF | 15°,30°,60°,75°, V | RT | Air | 0.1 | 20 | C(T) | Uniaxial |
| [66] | L-PBF | H, V | RT | Air | -1 | 20 | SEN(T) | Uniaxial |
| [67] | P-DED | H, V | RT | Air | 0.1 | 20 | C(T) | Uniaxial |
| [68] | L-PBF | H, V, D | RT | Air | 0.1 | 8 | SEN(T) | In-situ SEM |
| [69] | W-DED+wrought | V | RT | Air | 0.1 | 10 | C(T) | Uniaxial |
| [70] | L-PBF | H | RT | Air | 0.1 | 10 | - | Uniaxial |
| [71] | W-DED | H, V | RT | Air | 0.1 | 8 | C(T) | Uniaxial |
| [72] | L-PBF | H, V | RT | Air | 0.1 | 10 | C(T) | Uniaxial |
| [73] | L-PBF | H, V | RT | Air | 0.1 | 8 | SEN(T) | In-situ SEM |
| [74] | W-DED | H, V | RT | Air | 0.1 | 10 | C(T) | Uniaxial |
| [75] | P-DED | H | RT | Air | 0.1,0.3,0.5,0.8 | 15 | C(T) | Uniaxial |
| [76] | W-DED | H, V | RT | Air | 0.1 | 30 | C(T) | Uniaxial |
| [77] | P-DED | V | RT | Air | 0.2 | 10 | SEN(T) | In-situ SEM |
| [78] | P-DED | V, T | RT | Air | 0.1 | 0.5 | C(T) | Uniaxial |
| [79] | E-PBF | H, V | RT | Air | 0.1 | 20 | C(T) | Uniaxial |
| [80] | L-PBF | H, V | RT | Air | 0.1,0.5 | 10 | C(T) | Uniaxial |
| [81] | L-PBF | H, V, D | RT | Air | 0.1 | 20 | C(T) | Uniaxial |
| [82] | L-PBF | V | RT | Air, artificial saliva | 0.05 | 1,10 | C(T) | Uniaxial |
| [83] | L-PBF | V | RT | Air | 0 | - | C(T) | Uniaxial |
| [84] | P-DED | H | RT | Air | 0.1 | 15 | C(T) | Uniaxial |
| [85] | L-PBF | H | RT | Air | 0 | 10 | C(T) | Uniaxial |
| [86] | L-PBF | H, V | RT | Air | 0.1 | 10 | C(T) | Uniaxial |
| [87] | W-DED+Wrought | H, V | RT | Air | 0.1 | 10 | C(T) | Uniaxial |
| [88] | W-DED+weld | T | RT | Air | 0.1 | - | C(T) | Uniaxial |
| [89] | L-PBF | H, V | RT, 400 | Air | 0.1,0.5 | - | SEN(T) | In-situ SEM |
| [90] | L-PBF | H | RT | Air | 0.1,0.5 | 10 | SEN(T) | Uniaxial |
| [39] | L-PBF | V | RT | Air | 0.1 | 10 | C(T) | Uniaxial |
| [91] | L-PBF | V | RT | Air | 0.1 | - | C(T) | Uniaxial |
| [92] | L-PBF | H | RT | Air | 0.05 | 10 | C(T) | Uniaxial |
| [93] | P-DED | H | RT | Air | 0.1 | 20 | C(T) | Uniaxial |
| [94] | L-PBF | H, V | RT | Air, vacuum | 0 | 15 | Circular c/s | Uniaxial |
| [95] | L-PBF | - | RT | Air | 0.1,0.4,0.7 | 15 | C(T) | Uniaxial |
| [96] | SLM | H, V, D | RT | Air | 0.1 | 10 | C(T) | Uniaxial |
| [97] | SLM | H, V | RT | Air | -1 | 5 | C(T) | Uniaxial |
| [98] | SLM | H, V, D | RT | Air | 0.1 | - | C(T) | Uniaxial |
| [99] | L-PBF | - | RT | Air | 0.1 | 13 | C(T) | Uniaxial |
| [85] | L-PBF | H | RT | Air | 0.1 | - | C(T) | Uniaxial |
| [100] | DMLS | H, V | RT | Air | 0.1 | 50,80 | C(T) | Uniaxial |
| [101] | L-PBF | H, V, T | RT | Air | 0.1 | - | C(T) | Uniaxial |
| [102] | SLM | H, V | RT | Air | 0.05 | 0.5,3 | C(T) | Uniaxial |
| [103] | SLM | H, V | RT | Air | 0.1 | 10 | C(T) | Uniaxial |
Abbreviations: RT: Room temperature; H: Horizontal; V: Vertical; D: Diagonal; T: Transverse; C(T): Compact tension; SEN(T): Single edge notch tension; SEN(B): Single edge notch bending; M(T): Middle tension; c/s: Cross Section
Table 2.
FCG Reporting Index () chosen in accordance with ASTM E647-23[42] for metallic material FCG reporting.
Table 2.
FCG Reporting Index () chosen in accordance with ASTM E647-23[42] for metallic material FCG reporting.
| Element | ASTM Reference | FCG relevant documentation |
| * | Alloy specification (e.g. Ti64) | |
| * | Grade (e.g., general purpose, aerospace, biomedical, extra-low interstitial, etc.) | |
| E647-10.1.3 | The chemical composition and the weight percentage of each element | |
| E647-10.1.1 | Specimen type (C(T), M(T), SENT etc.) | |
| E647-10.1.1 | Drawings showing the specimen geometry and important dimensions | |
| * | Plain stress or plane strain conditions | |
| E647-10.1.13 | Processing route used to produce the specimen | |
| E647-10.1.13 | Heat treatment procedure (duration, temperature, atmosphere, and method of cooling) | |
| E647-10.1.2 | Experimental set up (Test machine, grips used etc.) | |
| E647-10.1.1 | Machine type (pneumatic vs servo-hydraulic) | |
| E647-10.1.4 | Orientation & position: crack/build direction and location in AM build | |
| * | Surface treatment and roughness measurement | |
| * | Machining method (e.g., milling, turning, grinding) | |
| * | Polishing steps and travel direction | |
| E647-10.1.12 | Test method (Constant-force-amplitude test procedure, K-Decreasing procedure) | |
| E647-10.1.8 | Data reduction technique used to convert a-N to da/dN -ΔK and calculate the FCG properties (secant, incremental polynomial method etc.) | |
| * | FCG measurement technique (visual tracking, post-mortem fractographic analysis of striation spacing, and measurement of crack opening displacement) | |
| * | Pre-cracking method (mechanical pre-cracking, electrolytic pre-cracking etc.) | |
| E647-10.1.5 | Terminal values of ΔK, R, and a from fatigue pre-cracking | |
| E647-10.1.6 | Cyclic waveform (e.g., sinusoidal, triangular etc.) | |
| E647-10.1.6 | Test frequency | |
| E647-10.1.6 | Load or stress ratio | |
| E647-10.1.6 | Applied force range, ΔP (e.g., ) | |
| E647-10.1.7 | Environmental conditions (e.g., temperature, relative humidity, test medium) | |
| * | Failure criterion (e.g., critical crack length, sudden fracture, unstable crack growth) | |
| * | Target FCG parameters (e.g., Paris law constants, threshold ΔKₜₕ) | |
| E647-10.1.13 | Tabulation of FCG results (e.g., a, N, da/dN, ΔK etc.) | |
| E647-10.1.10 | Graphical FCG results, including a–N, da/dN -ΔK | |
| * | Fracture surface analysis (crack path, roughness, and features) | |
| E647-10.1.11 | Record of test anomalies influencing data validity (e.g., transients from load interruptions, shifts in R, or unexpected system responses | |
| E647-10.1.3 |
Report tensile properties following ASTM E8/E8M test methods |
* Domain knowledge informed indices.
Table 3.
AM reporting Index () chosen in accordance with ASTM F2971-13[141].
Table 3.
AM reporting Index () chosen in accordance with ASTM F2971-13[141].
| Element | ASTM Reference | AM relevant documentation |
| F2971-5.1.1.1 | AM feedstock: description and preparation | |
| F2971-5.1.1.2 | Feedstock reuse procedure | |
| F2971-5.1.1.4 | Special production procedures | |
| F2971-5.1.1.3 | Standard production processes (from feedstock to specimen) | |
| F2971-5.1.1.3 | Specimen placement and orientation in build chamber | |
| F2971-5.1.2.1 | Nominal dimensions and allowable tolerances | |
| F2971-5.1.2.1 | Experimental plan | |
| F2971-5.1.2.1 | Experimental procedures | |
| F2971-5.1.2.1 | Non-destructive testing method | |
| F2971-5.1.2.2 | Description of non-conventional test methods | |
| F2971-5.1.2.3 | Additional post-processing steps |
Table 4.
Combined reporting benchmark () selected according to category 1 (*) or category 2 (+). Relevant sub-sections of original standards are shown for reference.
Table 4.
Combined reporting benchmark () selected according to category 1 (*) or category 2 (+). Relevant sub-sections of original standards are shown for reference.
| ASTM Reference | Description | |
| - | Designated alloy specification or material grade | |
| E647-10.1.3 | Feedstock’s chemical composition | |
| - | Surface preparation/condition/ roughness measurements | |
| - | Microstructural features | |
| E647-10.1.3 | Alloy condition and details of post-processing heat treatment protocols | |
| F2971 -5.1.1.3 | AM processing technique used | |
| F2971 -5.1.1.3 | AM process parameters | |
| F2971 -5.1.1.3 | Scan strategy utilized during the AM fabrication process | |
| F2971 -5.1.1.3 | Build plate or substrate preheating temperature | |
| F2971 -5.1.1.3 | Details of the controlled AM environment and shielding gas composition | |
| E647-10.1.12 | Employed FCG testing methodology | |
| E647-10.1.7 | Temperature and/or relative humidity conditions during testing | |
| E647-10.1.6 | Fatigue test frequency and cyclic waveform characteristics | |
| E647-10.1.13 | Graphical plots illustrating FCG experimental results | |
| E647-10.1.6 | Load ratio or R applied during fatigue testing | |
| F2971 – 5.1.1.1 | Powder size distribution for powder feedstock or wire diameter specification | |
| F2971 – 5.1.1.3 | Orientation of test specimens within the AM build chamber | |
| F2971 – 5.1.2.1 | Precise specimen geometry including dimensional tolerances | |
| E647-10.1.4 | Crack propagation direction relative to the build orientation | |
| E647-10.1.3 | Tensile properties |
Disclaimer/Publisher’s Note: The statements, opinions and data contained in all publications are solely those of the individual author(s) and contributor(s) and not of MDPI and/or the editor(s). MDPI and/or the editor(s) disclaim responsibility for any injury to people or property resulting from any ideas, methods, instructions or products referred to in the content. |
© 2025 by the authors. Licensee MDPI, Basel, Switzerland. This article is an open access article distributed under the terms and conditions of the Creative Commons Attribution (CC BY) license (http://creativecommons.org/licenses/by/4.0/).
Copyright: This open access article is published under a Creative Commons CC BY 4.0 license, which permit the free download, distribution, and reuse, provided that the author and preprint are cited in any reuse.


