
Submitted:
19 November 2025
Posted:
20 November 2025
You are already at the latest version
Abstract
We analyzed the effect of reducing particulate matter in a forest by comparing concentrations and particle number concentrations (PNC) between urban and forest areas with the use of aero-dynamic particle sizers. PM is observed at a forest and urban site during the high events of par-ticulate matter from April 22 to April 30, 2019. Comparing the PM concentrations measured, PM10 and PM2.5 were 61.6㎍/㎥and 36.9㎍/㎥, respectively in urban, while PM10 and PM2.5 were 53.9㎍/㎥, 31.8㎍/㎥, respectively, in forest. PNCs are classified by particle size and analyzed by dividing them into 0.5㎛. Most PNCs at both sites ranged in size of particles less than 0.5㎛ (99%). Comparing the distribution of PNC in the forest, the smaller the particle size, the higher the reduction rate. In low concentration events, the ratio of coarse mode particles (>0.5㎛) among forest PNC distributions was similar to that of urban, but the reduction rate of coarse mode particles was 20% in the high concentration event. For accumulation mode particles (< 0.5㎛), forests were 18% lower in low concentration events and 11.5% lower in high concentration events. These results indicate the forest can have the capacity to reduce the accumulation mode particles during high concentrations of PM.
Keywords:
urban forest
; particulate matter
; aerodynamic particle sizer
; particle number concentration
1. Introduction
Recently, the event day of high concentration particulate matter (PM) has gradually emerged as a social concern. Particulate matter is an air pollutant that originates in urban and industrial areas that often exceeds the limit, which has detrimental effects on human health, causing severe problems [1]. Particles are made of various sizes and shapes and can be made from many different chemicals. Direct emissions emitted from construction sites, unpaved roads, fields, and chimney fires, and a combination of sulfur dioxide and pollutants emitted from nitrogen oxides, power plants, industries, and cars form particles in the atmosphere [2]. Particulate matter size is classified as ultrafine (<0.1㎛), fine (0.1~2.5㎛), coarse (2.5~10㎛), and super coarse (>10㎛) [2] and is directly linked to potential health risks. The ultrafine and fine particulates can be inhaled into the lungs and hence are particularly harmful. Effects of coarse airborne particles on health are gaining increasing attention, as there is reason to believe the related health effects may have been under-appreciated in the past [3,4,5]. According to a study report by the Korea Centers for Disease Control and Prevention, the symptoms of asthma deterioration increased 29% in the 10㎍ increase in particulate matter, while visits and hospitalizations to emergency rooms due to worsening asthma also increased 29% [6].
The management of airborne particulate matter diversified around emission sources. To reduce health risks from PM pollution sources must be controlled, but the effect of reducing particulate matter by plants also has potential. The forests have the effect of PM reduction that can improve air quality by providing filter functions through adsorbing and absorbing. The complex surface of the leaves and the stems or branches can hold the particulate matter, helping to precipitate it into the ground inside the forest [7,8,9,10]. In Korea, PM-related research has been conducted mainly on cities and industrial complexes. The potential in reducing fine dust in forests has been well explored in terms of PM mass [11,12] rather than particle number concentration (PNC), so there is a lack of understanding of the reducing mechanism of PM by trees in the field condition through practical observations. However, the PNC modeling and vertical distribution [13] were reported at a national and international scale in Asia [14] and the UK [15]. Moreover, the role of tree and forests was not yet discovered from the viewpoints of distribution pattern of PNC at a living space of citizen in a mega city. Therefore, it is necessary to understand the process of fine particles growing and settling inside the forest more accurately when particles inflow the forest at the high event of particulate matter. This study investigates the changing process of the particles’ size in forest by the comparison of PNC between urban and forest.
2. Methods
2.1. Study Area
This study selected two pine forests of Hongneung (HN; forest) and Cheongnyangni (CN; urban) located at dongdaemungu, Seoul, Korea. Hongneung site (HN, 37°35’56.53”N, 127° 2’54.93”E) was located about 50 m above sea level and surrounded by an urban forest. Cheongnyangni site (CN, 37°34’50.37”N, 127°2’43.26”E) was located in front of Cheongnyangni subway station at the direct distance of 2km from HN. The CN site was located about 10m above sea level and surrounded by a road and residential areas (Figure 1).
2.2. Particulate Matter Measurement Data
An aerosol sampler had been placed and operated at pine forests at Hongneung (HN; forest) and Cheongnyangni (CN; urban) since 2019. We selected the data at the high episodes of particulate matter from April 22 to 30, 2019. The PM values and particle size distribution in the range of 0.25-32㎛ in diameter were observed simultaneously using a multi-channel Grimm aerosol spectrometer (Environmental Dust Monitor #164, GRIMM Aerosol Technic, EDM164). The instrument was able to 1 min measurements, in this study, 5 min measurements were taken. Ambient air is directly fed into the measuring cell at a rate of 1.2 L per minute using a volume-controlled pump. All aerosol particles passing through the measurement cell are classified by its 31 size distribution channels. In the sampling data, mass concentrations of PMs by site and hour were compared, and distribution characteristics of particle concentrations were compared using the particle number concentration (PNC) in 23 sections of 10㎛ or less. Furthermore, the contribution of PNC size distribution to change in concentration of PM was analyzed and particle distribution was confirmed according to regional characteristics. For data analysis, PNC data is subdivided into two categories to represent various models. However, there are various opinions about the different sizes of particles [17,18,19,20,21]. In the PNC data 99% of the particles were assigned to the accumulation mode (<0.5㎛), and only 1% of the particles were assigned to the coarse mode (>0.5㎛). Thus, in this study PNC cut-off points of accumulation mode and coarse mode was selected as 0.5㎛ [20].
2.3. Statistical Analysis
Tree density, diameter at breast height, canopy & shrub coverage percentage were tested by t-test, and the mass concentration and particulate number concentration were analyzed with the correlation equations. Statistical analysis was performed using the statistical software R 4.2.0 [22].
3. Results
3.1. Concentration of Particulate Matter in Urban Forest
The time series plots, as shown in Figure 2. The two target areas showed similar trends. The PM concentrations in the forest were lower than urban, with 9.88% lower PM10, 14.46% lower PM2.5. The urban forest shows a low concentration of PM because of absorbed by leaves and branches [10] and particulate matter under the canopy is removed by deposition due to low wind velocity and high humidity. To compare the particle properties of the two sites, we compare the PM2.5/ PM10 ratio. The forest is 0.58 and urban is 0.59, both similar to the characteristics of residential areas [23].
Figure 3 illustrates the diurnal variation of PM10 concentration. The highest concentration was observed between 8:00 and 9:00 in both sites that are assumed to be due to increased traffic during rush hour from nearby road sources. The forest has the lowest concentration of particulate matter between 18:00 and 20:00. The urban has the lowest concentration between 11:00 and 14:00. In the urban, PM concentration is relatively low due to air diffusion, but in the forest, PM concentration was brought in by low wind speeds is not spreading and is stagnant, which is assumed to have been higher during the day.
The mean concentration of aerosol particles from April 22 to April 30 is shown in Table 2. The mean reduction rate of PM10, PM2.5, and PM1.0 during high concentration event days was 9.2% and 13%, and 13%, respectively. The mean reduction rate of PM10, PM2.5, and PM1.0 during low-concentration event days was 19%, 16%, and 15%, respectively. PM concentration comparison results showed that the forest reduced the concentration of PM in the air. PM concentration comparison results show that forests have lower PM mass concentrations than urban. On the high concentration event day, the smaller the particle size, the greater the reduction effect, and on the low concentration event day, the larger particle size has a greater PM reduction effect.
The average of total particle number concentration data and classified by particle size data measured from April 22 to April 30 is shown in Table 3. On the high concentration event day, in the forest total average of PNC is 16.9㎤. The maximum and minimum average PNC are 43.1㎤ and 6.9 ㎤, respectively. The total average PNC in urban is 19.1㎤, the maximum and minimum average PNC are 36.8㎤ and 8.6㎤, respectively. The mean reduction rate of PNC total was 11.5%, accumulation mode PNC was 11.5%, and coarse mode PNC was 20%.
On the low concentration event day, in the forest total average of PNC is 6.6 ㎤. The maximum and minimum average PNC are 20.0㎤ and 0.3㎤, respectively. The total average PNC in urban areas is 8.0㎤, the maximum and minimum average PNC are 19.0㎤ and 0.6㎤, respectively. The mean reduction rate of PNC total was 17.5%, the accumulation mode PNC reduction rate was 17.9%, and the coarse mode PNC was the same.
3.2. Size Distribution of Aerosol Particle Number Concentration
Figure 4 shows the PM10 mass concentration, aerosol mass size distribution during the high concentration event day. On April 22nd, the maximum concentration was over 200 (yellow rectangle in Figure 4a, b), and among them, the coarse mode particle mass distribution was very high in both sites. And the high value of concentration of coarse particles at the mass concentration graph was related to high concentrations due to the inflow of yellow dust mist [24,25]. On April 24th, there was a very high concentration of accumulation particles (red rectangle in Figure 4a, b) and a different pattern of PNC than the yellow dust period. The mass concentration of particle matter, which has accumulation mode particles, was high, and coarse mode particles were low. This is a similar result to the highest mass concentration reported in the 0.3 - 0.4㎛ range along the road, and the effects of road pollution sources might be influenced by the occurrence of high concentrations of particulate matter [26]. In the case of a low concentration event day, PM trends were similar in urban and forest.
Aerosol mass size distribution was different at the coarse mode of PNC and the accumulation mode of PNC between HN (forest) and CN (urban) during the high PM event day (Figure 4). Among the observed PNC data, 99% of the particles are less than 1㎛, and only 1% have particle diameters greater than 1㎛. And this clearly shows a sharp unimodal distribution in the accumulation mode. To compare the size distribution of aerosol, PNCs by the diameter of particles are compared. Particle number concentration (y) is plotted based on a logarithmic scale of diameter (㎛).
Comparing the particle size distribution when high concentrations event day, the particle size lognormal distribution was calculated as an equation, y=-75.68ln(x) +17.56 at the urban, and the particle size lognormal distribution was done as an equation, y=-68.19ln(x) +15.70 at the forest (Figure 5a). At the equation between aerodynamic diameter and particulate number concentration, the urban site showed the lower value of slope than at the forest. The accumulation mode particle concentrations were higher in urban and coarse mode particles were similar. Comparing the particle size distribution when a low concentration event day (Figure 5b), the particle size lognormal distribution was calculated as an equation, y=-33.12ln(x) + 73.35 at urban, and the equation was done as, y=-28.85ln(x) + 63.28 at forest. Also, the urban site showed a lower value of slope than the forest. The urban has a greater slope than forests, which means that there are more small-sized particles in urban than in forests, and this is related to the capacity of attachment and sedimentation of small-sized particles by leaves, twigs, and branches at forests.
4. Discussion
4.1. Why PM Concentrations Are Low in Forests?
The PM concentration trend between forests and urban areas showed a similar pattern, and the concentration of PM was low in the forest site. However, compared to the time average PM concentration between urban and forest, the urban tends to be removed during daytime due to the active diffusion. But the forest is relatively slow diffusion, so the fine dust that came into the forest was not eliminated during the day and showed the lowest PM concentration after 18:00. Comparing PNC values by particle size, the coarse mode PNC values in forest and urban are similar during low concentrations, but when high concentrations such as yellow dust occurred, the coarse mode PNC concentration was 20% lower than that of urban. The diurnal differences in pollutant concentrations were pronounced in high traffic–concentrated areas with high-rise buildings as opposed to the areas characterized by a larger fraction of residential apartment complexes in Seoul [27]. Our study showed a similar pattern, and it would be explained from the PNC concentration and PM mass data although the measurement was a short time window between urban and forest.
Also, urban areas do have active processes that affect PM, forests are more effective at removing PM from the atmosphere than urban areas during the day. Forests act as a barrier, trapping and removing particles through processes like dry deposition on leaves and branches, leading to lower PM concentrations compared to urban areas [28], which often have higher and more consistent pollution level urban areas do have active processes that affect PM, forests are more effective at removing PM from the atmosphere than urban areas during the day [29]. Forests act as a barrier, trapping and removing particles through processes like dry deposition on leaves and branches, leading to lower PM concentrations compared to urban areas, which often have higher and more consistent pollution level [28].
4.2. What Affect the Growth Rate of PM Concentrations Between Urban and Forests?
Forests have a blocking effect, and the forest is expected to grow and remove particles faster due to high relative humidity and low temperatures. To analyze this, we compare the PNC distribution of cities and forests. Of the total PNC data, accumulation mode particles account for 99% of the total particle distribution, and this shows a sharp uni-modal distribution in the accumulation mode(250㎚). Expressing the lognormal distribution of the observed PNCs, the slope of urban is higher than the forest because the PNC distribution is more small size particles in the urban and coarse mode particles are similar concentrations in the forest and urban. We suppose that the concentration of particles smaller than that urban is lower because particles from the same inflow source are removed faster through absorption and growth processes inside the forest due to the high relative humidity and low temperatures. High relative humidity can affect aerosol movement by increasing particle size through water absorption, which can decrease Brownian motion due to increased inertia, while low temperature can affect aerosol movement indirectly by promoting aqueous phase reactions and affecting particle deposition rates [30,31]. Therefore, high relative humidity and low temperature can lead to the formation of secondary aerosols, which may be larger and exhibit different deposition behaviors compared to their dry, primary counterparts.
At forest, a high humidity can provide the vapors have a liquid bridging forces to induce the cohesive and viscous forces that act between two wet particles or surfaces connected by a liquid bridge. So, these forces cause adhesion between vapors and micro structure of hair, trichome and resins at the micro scale of trees. Ultimate process in reducing the PM concentrations not only the structure of leaf, twig, branch and trunk, the micro-meteorological factors of air temperature and relative humidity could assist the interaction between vapors and leaves.
Urban site showed the low percentage of shrub coverage than forest site did (Table 1). This could be well reflected the high occurrence rate of resuspension of particulate matter at urban [32]. The leaf biomass at shrubs could attach and settle down the particulate matters at forest. It represents the importance of size of forest, also vertical green at the same size of lands.
4.3. Implication for Management of Urban Forests and Research Limitations
Although small-sized urban forests can have the potential to not only provide shade but also reduce air pollutants. However, the surroundings of the road and building could provide a low possibility of PM settling down on the ground, the resuspension could occur in an urban setting dominated by pollutants. From this viewpoint, this study has a short and localized measurement on the effect of PM in the dimension of PM mass and PNC. Long-term monitoring could reduce the biased interpretation of trees and forests in a city region, also the duration of the dry period (low relative humidity) and resistance to the urban dry condition should be fully addressed in the near future.
The effect of green in reducing the PM has been debated at the specific condition of street trees, such as isolated patches of green space, and the vertical greens [33], however, the mechanistic approaches with the application of nano-scale measurement devices will address not only the concentration but also the speciation issues important to human health in the near future.
5. Conclusions
This study examined the particulate matter reduction effects and characteristics of size distribution by measuring the particulate matter in April 2019 with EDM 164 in the Hongneung forest and Cheongnyangni urban sites. Hongneung Forest, the forest, and Cheongnyangni, the urban area, show similar trends in particulate matter concentration over time as particulate matter occurs from the same type of pollutant. The high concentration days, forest showed that the mean reduction rates of PM10, PM2.5, and PM1.0 were 9.2%, 13.0%, and 13.0%, respectively. In the low concentration days, the forest showed that mean reduction rates of PM10, PM2.5, and PM1.0 were 19.0%, 15.9%, and 15.0%, respectively. Particles in the accumulation mode(<0.5um) most portioned the overall total particle number concentrations (99%). The high concentration event day’s PNC data in the forest represent accumulation mode particle 11.5% and coarse mode particle 20% lower than the urban. When the low-concentration event days occur, coarse-mode particles have little difference between forests and cities, but in the high-concentration event days, forests reduce PM levels by 20% by blocking yellow dust particles from the inflow.
Comparing the ratio of fine particles that affect the PM10 concentration increase, both sites feature residential areas. We believe that the change in the daily particulate matter concentration began to increase at 7 a.m. and was the highest concentration at 9 a.m., as the increase in traffic during rush hour produces a lot of particulate matter from road sources.
Comparing the distribution of PNCs by particle size, the PNCs in the accumulation mode, which are small particles, are low in the forest, which are removed by growth and absorption, and appear lower than in the city center. When high concentrations of fine dust are introduced, fine dust with a large particle size of particles is removed due to the forest’s blocking effect, and small particles are removed by growth and absorption to clear the air quality inside the forest.
Our results showed urban forests absorb, adsorb, and block and remove particulate matter from inside the forest. The urban forest is as effective in reducing particulate matter in the urban atmosphere. It would be necessary to observe the chemical composition of particulate matter at the site and analyze the chemical composition of particulate matter generated inside urban forests.
We recommend that continued monitoring of forests aid a comprehensive understanding of the aerosol system, including aerosols with BVOCs speciation and general characteristics of particle generation and growth within forests.
Author Contributions
Conceptualization and methodology, T.K., S.C. and C-R.P.; data curation, T.K. and S.C.; formal analysis, T.K., S.C. and C-R.P.; investigation and visualization, T.K., S.C. and C-R.P.; funding acquisition, project administration, and resources, S.C. and C-R.P.; supervision, S.C. and C-R.P.; writing—original draft preparation, T.K., S.C. and C-R.P.; validation and writing—review and editing, C-R.P and S.C. All authors have read and agreed to the published version of the manuscript.
Funding
This work was supported by the National Institute of Forest Science (NIFoS) of Korea (Project No. FM0500-2022-01-2025).
Data Availability Statement
Data supporting the findings of this study can be provided upon reasonable request to the corresponding author.
Acknowledgments
We would like to thank the anonymous reviewers for their helpful comments.
Conflicts of Interest
The authors declare no conflicts of interest. The funders had no role in the design of the study; in the collection, analyses, or interpretation of the data; in the writing of the manuscript; or in the decision to publish the results.
References
- Pope, C.A.; Dockery, D.W. Health Effects of Fine Particulate Air Pollution: Lines that Connect. Journal of the Air & Waste Management Association 2006, 56, 709–742, . [CrossRef]
- EPA in 2009: Progress Report. 2009. https://www.epa.gov.
- Popek, R.; Gawrońska, H.; Wrochna, M.; Gawroński, S.W.; Sæbø, A. Particulate Matter on Foliage of 13 Woody Species: Deposition on Surfaces and Phytostabilisation in Waxes - a 3-Year Study. International Journal of Phytoremediation, 2013, 15, 245–256. [CrossRef]
- Josephine T. Bates; Rodney J. Weber; Joseph Abrams; Vishal Verma; Ting Fang; Mitchel Klein; Matthew J. Strickland; Stefanie Ebelt Sarnat; Howard H. Chang; James A. Mulholland; Paige E. Tolbert; Armistead G. Russell. Reactive Oxygen Species Generation Linked to Sources of Atmospheric Particulate Matter and Cardiorespiratory Effects. Environmental Science & Technology, 2015, 49, 13605-13612. [CrossRef]
- Kyung, S.Y.; Kim, Y.S.; Kim, W.J.; Park, M.S.; Song, J.W.; Yum, H.; Yoon, H.K.; Rhee, C.K.; Jeong, S.H. Guideline for the prevention and management of particulate matter/Asian dust particleinduced adverse health effect on the patients with pulmonary diseases. Journal of the Korean Medical Association, 2015, 58, 1060–1069. [CrossRef]
- Korea Centers for Disease Control and Prevention(KCDC) Committed to Eradicate Tuberculosis in 2014. Ministry of Health and Welfare, 2014. https://www.mohw.go.kr.
- Beckett K.; Freer-Smith P.; Taylor G. Effective tree species for local air quality management. J Arboric, 2000, 26, 12-19.
- Dzierzanowski, K.; Popek, R.; Gawrońska, H.; Saebø, A.; Gawroński, S.W. Deposition of particulate matter of different size fractions on leaf surfaces and in waxes of urban forest species. International Journal of Phytoremediation, 2011, 13, 1037–1046. [CrossRef]
- Sæbø, A.; Popek, R.; Nawrot, B.; Hanslin, H.M.; Gawronska, H.; Gawronski, S.W. Plant species differences in particulate matter accumulation on leaf surfaces. Science of the Total Environment, 2012, 427–428, 347–354. [CrossRef]
- Nowak, D.J.; Crane, D.E.; Stevens, J.C. Air pollution removal by urban trees and shrubs in the United States. Urban Forestry and Urban Greening, 2006, 4, 115–123. [CrossRef]
- Kowsalya Vellingiri , Kim, , K.H.; Ma, C.J.; Kang, C.H.; Lee, J.H.; Kim, I.s.; Richard J.C. Brown. Ambient particulate matter in a central urban area of Seoul, Korea. 2015. Chemosphere 119 (2015) 812–819. [CrossRef]
- Sou, H.D.; Kim, P.R.; Hwang B.M.; Oh, J.H. Diurnal and Seasonal Variations of Particulate Matter Concentrations in the Urban Forests of Saetgang Ecological Park in Seoul, Korea. Land 2021, 10, 1213. [CrossRef]
- Vahid Roostaei, Atefeh Abbasi, Farzaneh Gharibzadeh, Sasan Faridi, Kazem Naddafi, Masud Yunesian, Mohammad Sadegh Hassanvand. Vertical Distribution of Air Particulate Matter (PM1, PM2.5, and PM10) in Different Regions of Tehran. Aerosol and Air Quality Research 24(10), 2024. [CrossRef]
- Song, M.J.; Jeong R.N.; Kim, D.U.; Yanting Qiu; Xiangxinyue Meng; Zhijun Wu; Andreas Zuend; Ha, Y.K.; Kim, C.H.; Kim,H.R; Sanjit Gaikwad; Jang, K.S.; Lee, J.Y.; Ahn, J.Y. Comparison of Phase States of PM2.5 over Megacities, Seoul and Beijing, and Their Implications on Particle Size Distribution. Environmental Science & Technology, 2022, 56, 17581-17590. [CrossRef]
- Ann L. Power; Richard K. Tennant; Alex G. Stewart; Christine Gosden; Annie T. Worsley; Richard Jones; John Love. The evolution of atmospheric particulate matter in an urban landscape since the Industrial Revolution. Scientific Reports, 2023, 13:8964. [CrossRef]
- Choi, S.M.; Park, C.R.; Park, W.H.; Yeo, J.H.; Yoo, S.Y.; Oh, S.R.; Joe, J.H. The Greeninfra Survey Report of AiCAN sites 2021. National Institute of Forest Science Research Report No. 952.
- Rimnácová, D.; Ždímal, V.; Schwarz, J.; Smolík, J.; Rimnác, M. Atmospheric aerosols in suburb of Prague: The dynamics of particle size distributions. Atmospheric Research, 2011, 101, 539–552. [CrossRef]
- Kittelson, D.B.; Watts, W.F.; Johnson, J.P. Nanoparticle emissions on Minnesota highways. Atmospheric Environment, 2004, 38, 9–19. [CrossRef]
- Kittelson, D.B.; Watts, W.F.; Johnson, J.P. On-road and laboratory evaluation of combustion aerosols-Part1: Summary of diesel engine results. Journal of Aerosol Science, 2006, 37, 913–930. [CrossRef]
- Khan, M.F.; Latif, M.T.; Amil, N.; Juneng, L.; Mohamad, N.; Nadzir, M.S.M.; Hoque, H.M.S. Characterization and source apportionment of particle number concentration at a semi-urban tropical environment. Environmental Science and Pollution Research, 2015, 22, 13111–13126. [CrossRef]
- Qian Zhang; Zhenxing Shen; Yali Lei; Yueshe Wan;, Yaling Zeng; Qiyuan Wang; Zhi Ning; Junji Cao; Linqing Wang; Hongmei Xu. Variations of Particle Size Distribution, Black Carbon, and Brown Carbon during a Severe Winter Pollution Event over Xi’an, China. Aerosol and Air Quality Research, 2018, 18: 1419-1430. [CrossRef]
- R Core Team. R: A Language and Environment for Statistical Computing; R Foundation for Statistical Computing: Vienna, Austria, 2023.
- Lee, Y.-K.; Lee, K.-J.; Lee, J.-S.; Shin, E.-S. Regional Characteristics of Particle Size Distribution of PM 10. Journal of Korean Society for Atmospheric Environment, 2012, 28, 666–674. [CrossRef]
- Kim, J.A.; Jin, H.-A.; Kim, C.-H. Characteristics of Time Variations of PM10 Concentrations in Busan and Interpreting Its Generation Mechanism Using Meteorological Variables. Journal of the Environmental Sciences, 2007, 16(10): 1157-1167.
- Jungang Chen; Xinxiao Yu; Fenbing Sun; Xiaoxiu Lun; Yanlin Fu; Guadong Jia; Zhengming Zhang; Xuhui Liu; Li Mo; Huaxing Bi. The Concentrations and Reduction of Airborne Particulate Matter(PM10, PM2.5, PM1) at Shelterbelt Site in Beijing. Atmosphere, 2015, 6, 650-676; [CrossRef]
- Cho, B.-Y.; Shin, S.-H.; Jung, C.-S.; Ju, M.-H.; Yoon, M.-H.; Ahn, J.-E.; Bae, G.-S. Characteristics of Particle Size Distribution at the Roadside of Daegu. Journal of Korean Society for Atmospheric Environment, 2019, 35, 16–26. [CrossRef]
- Ahn, H.; Lee J; Hong A. Urban form and air pollution: Clustering patterns of urban form factors related to particulate matter in Seoul, Korea. Sustainable Cities and Society, 2022, 81,1-15. [CrossRef]
- Park, S.; Kwak, M.J.; Lee, J.; Lim, Y.J.; Kim, H.; Jeong, S.G.; Son, J.-A.; Chang, H.; Je, S.M.; Oh, C.-Y.; Kim, K.; Woo, S.Y. Urban Greening: A Sustainable Method for Particulate Matter (PM) Reduction. J. Korean Soc. For. Sci., 2023. 112(1),1-10. [CrossRef]
- Seo, J.; Oh, H.-R.; Park, D.-S.R.; Kim, J.Y.; Chang, D.Y.; Park, C.R.; Sou, H,-D.; Jeong, S. The role of urban forests in mitigation of particulate air pollution: Evidence from ground observations in South Korea. Urban Climate, 2025, 59(102264), 1-14. [CrossRef]
- McRee, M.M.;Moschos, V.; Fiddler, M.N.; Massabò. D.; Surratt, J.D.; Bililign, S. Influence of relative humidity and aging on the optical properties of organic aerosols from burning African biomass fuels, Aerosol Science and Technology, 2025, 59(5), 544-566. [CrossRef]
- He, Y., Gu, Z.; Lu, W.; Zhang, L.; Okuda, T.; Fujioka, K.; Luo, H.; Yu, C.W. Atmospheric humidity and particle charging state on agglomeration of aerosol particles. Atmospheric Environment, 2019, 197,141-149. [CrossRef]
- Seo, I.; Park, C.R.; Yoo, G. Particulate matter resuspension from simulated urban green floors using a wind tunnel-mounted closed chamber. PeerJ, 2023, 11:e14674. [CrossRef]
- Liu, J.; Zheng, B.; Li, J. The Positive and Negative Effects of Green Space on PM2.5 Concentrations: A Review. Atmosphere 2025, 16, 1235. [CrossRef]
Figure 1.
The map of the study area showing particulate matter monitoring site at Hongneung (HN; forests, green dot) and Cheongnyangni (CN; urban, red dot) at a mega city of Seoul, Korea.
Figure 1.
The map of the study area showing particulate matter monitoring site at Hongneung (HN; forests, green dot) and Cheongnyangni (CN; urban, red dot) at a mega city of Seoul, Korea.
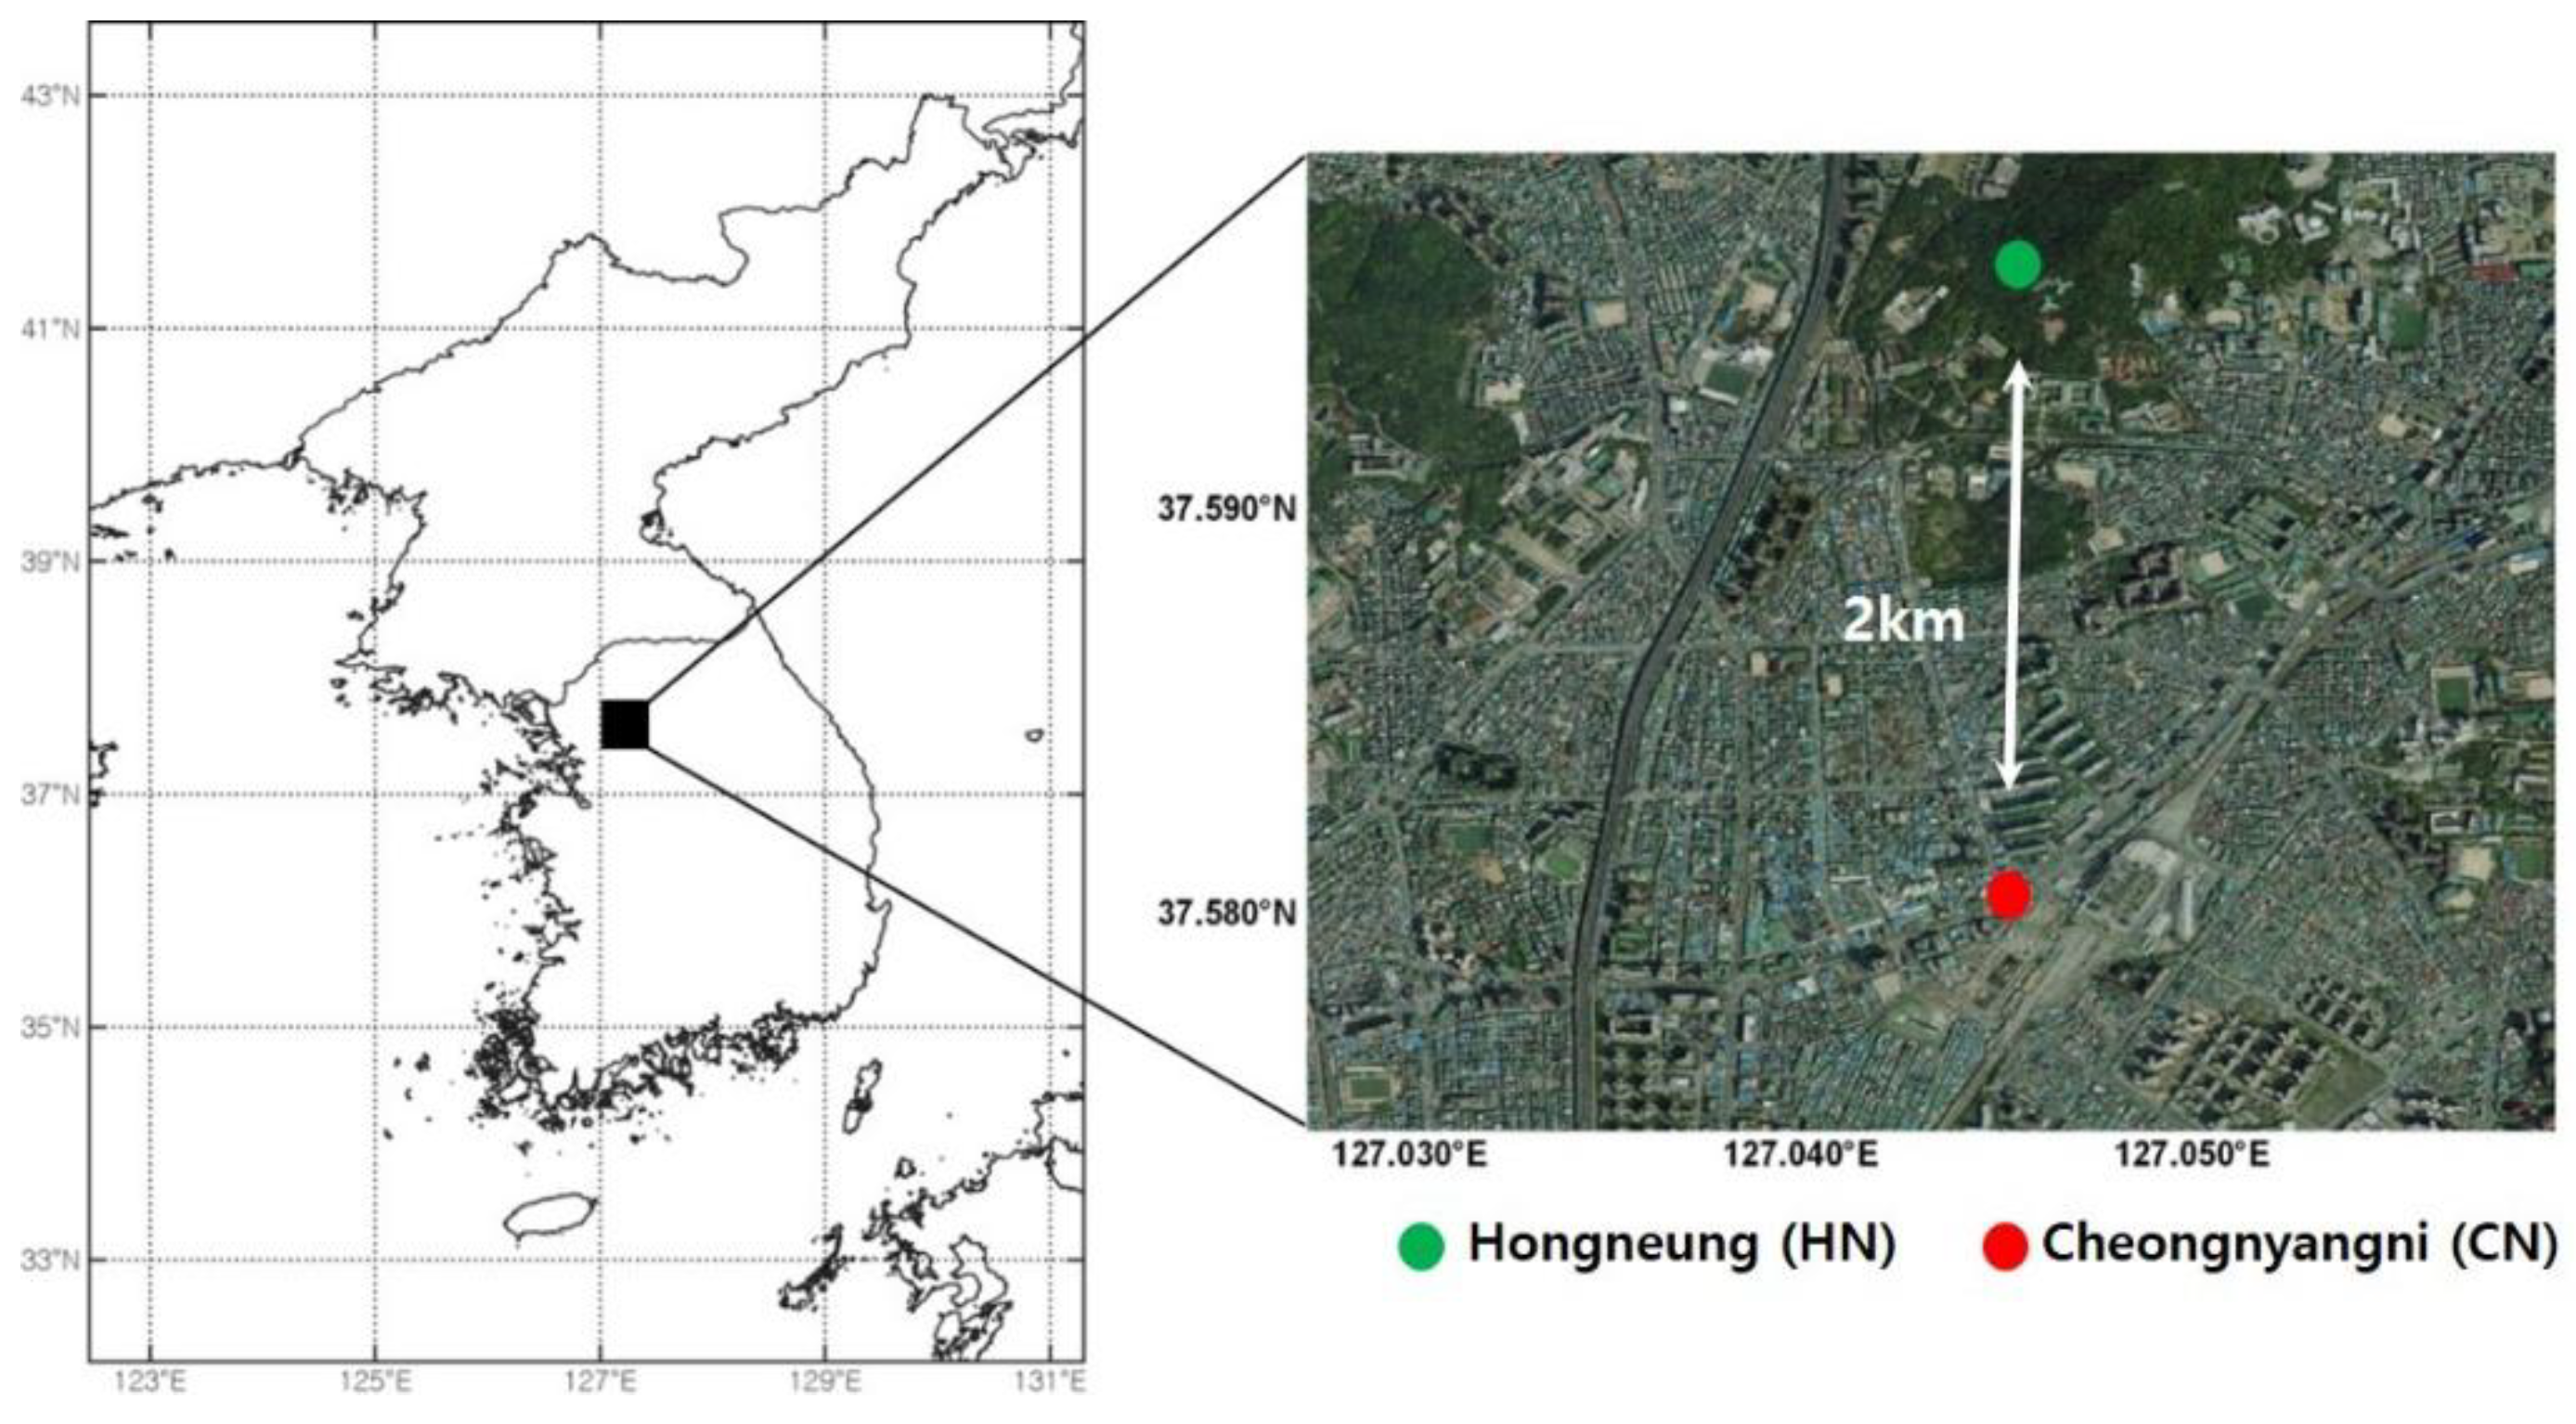
Figure 2.
Time series of PM10, PM2.5 from April 20 to May 10, 2019.
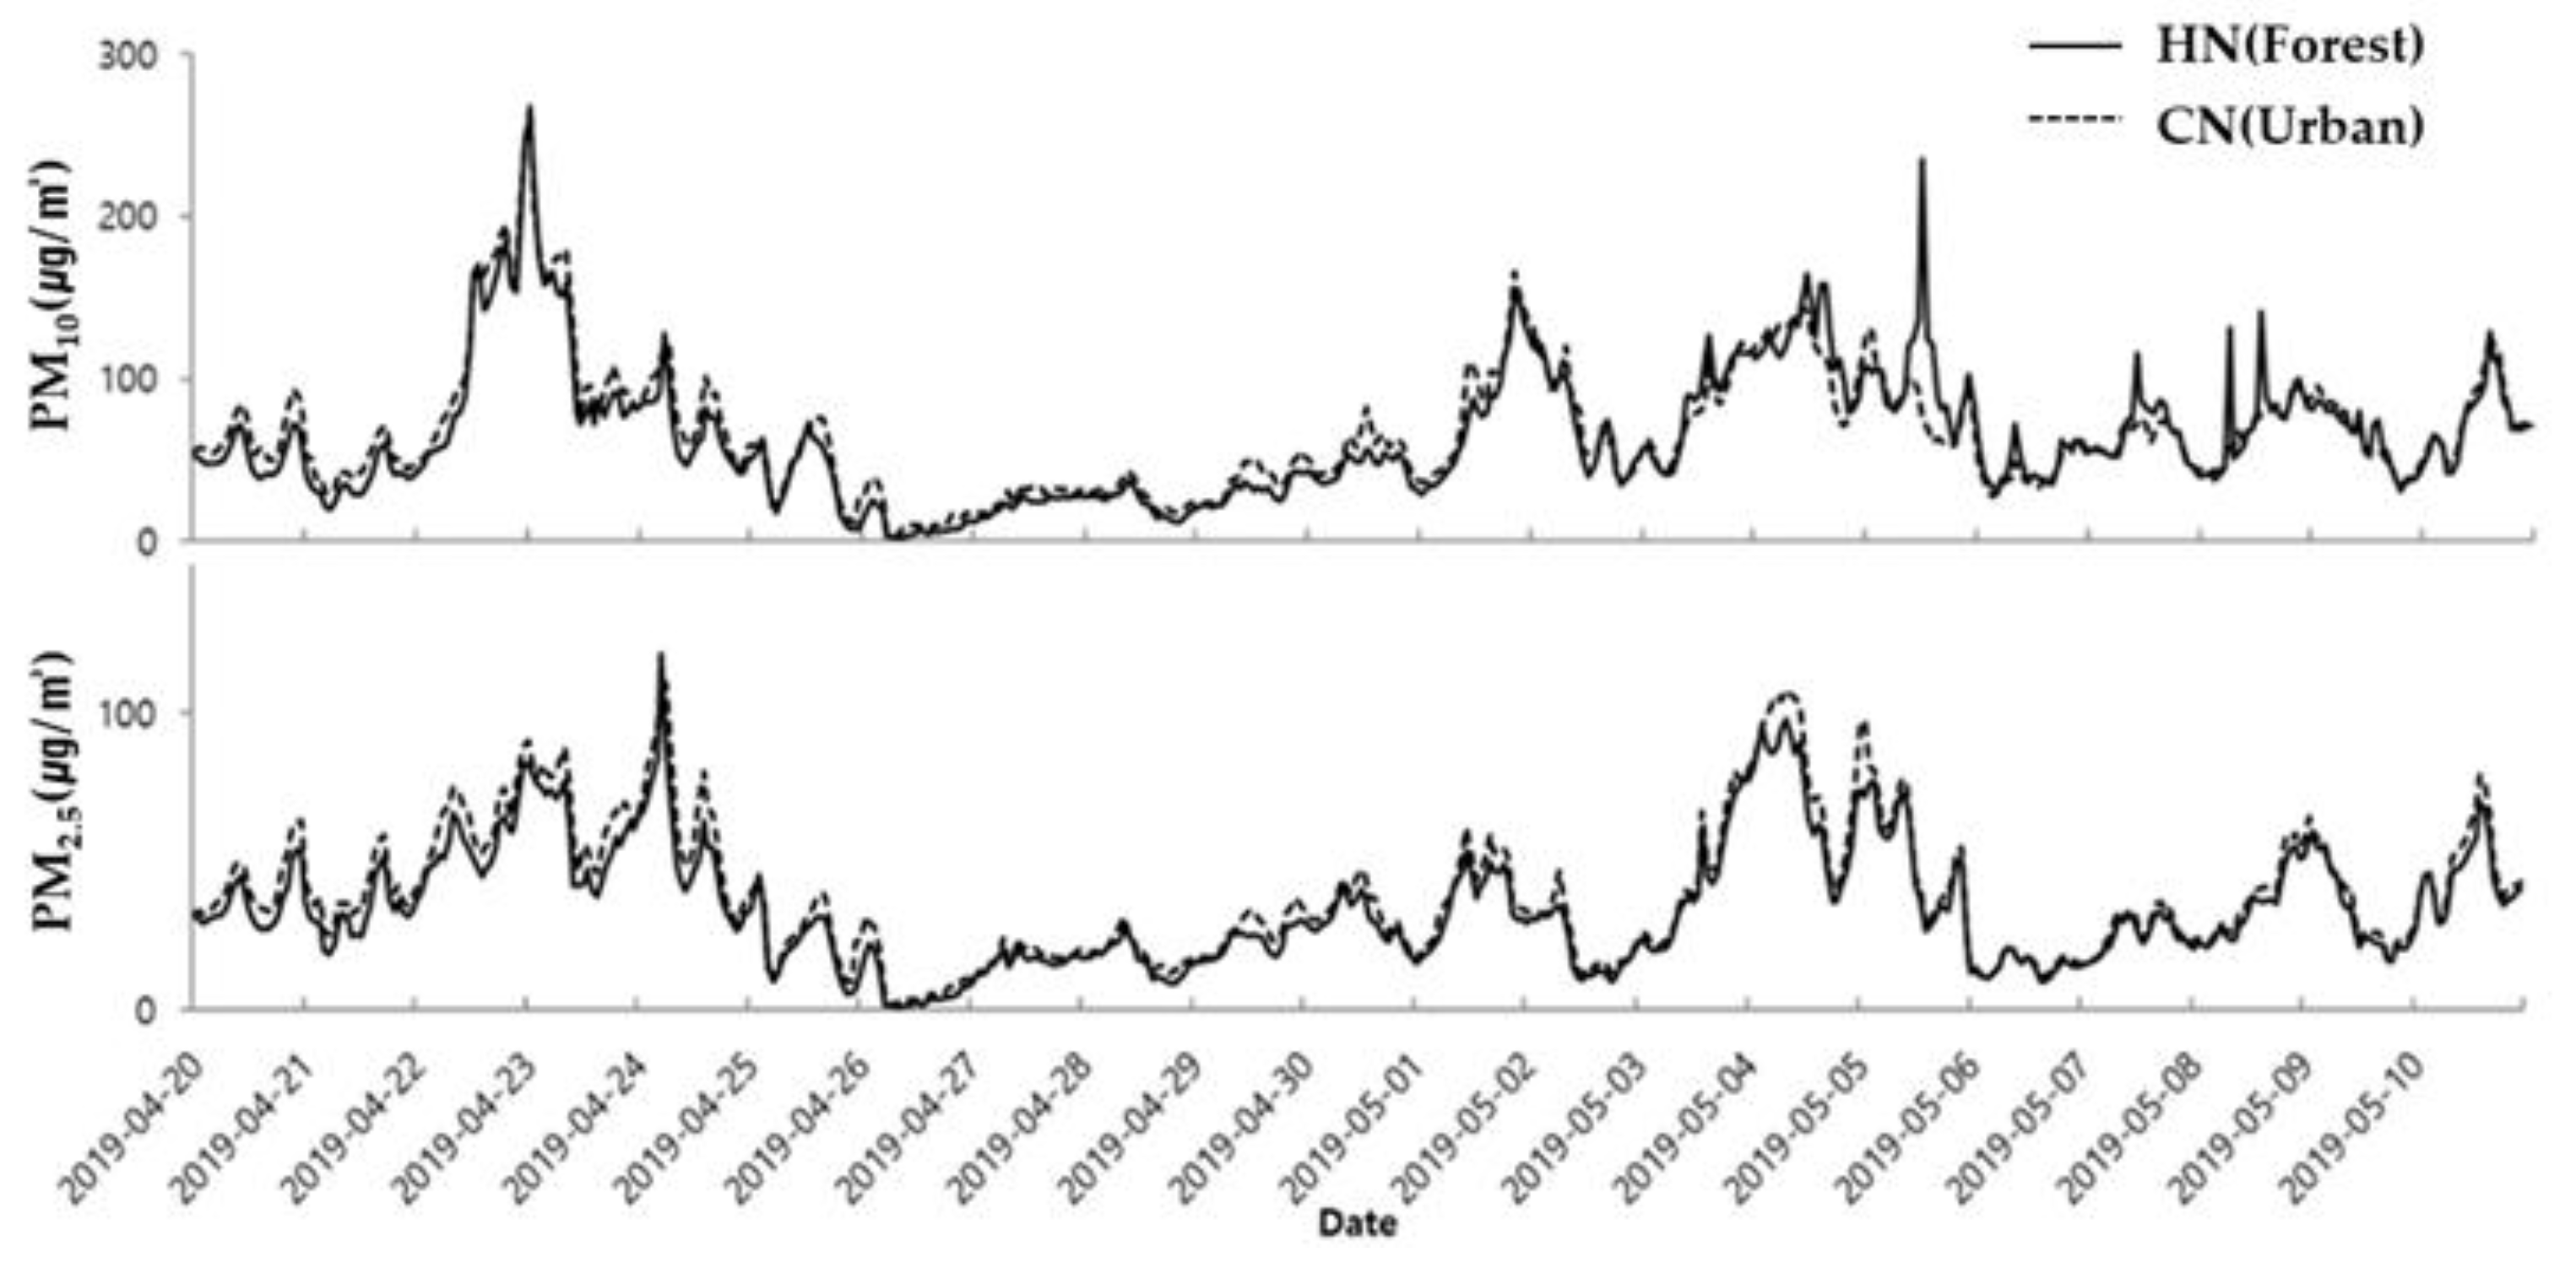
Figure 3.
Diurnal variation of PM10 concentration in the HN (forest) and CN (urban) during the high concentration event day.
Figure 3.
Diurnal variation of PM10 concentration in the HN (forest) and CN (urban) during the high concentration event day.
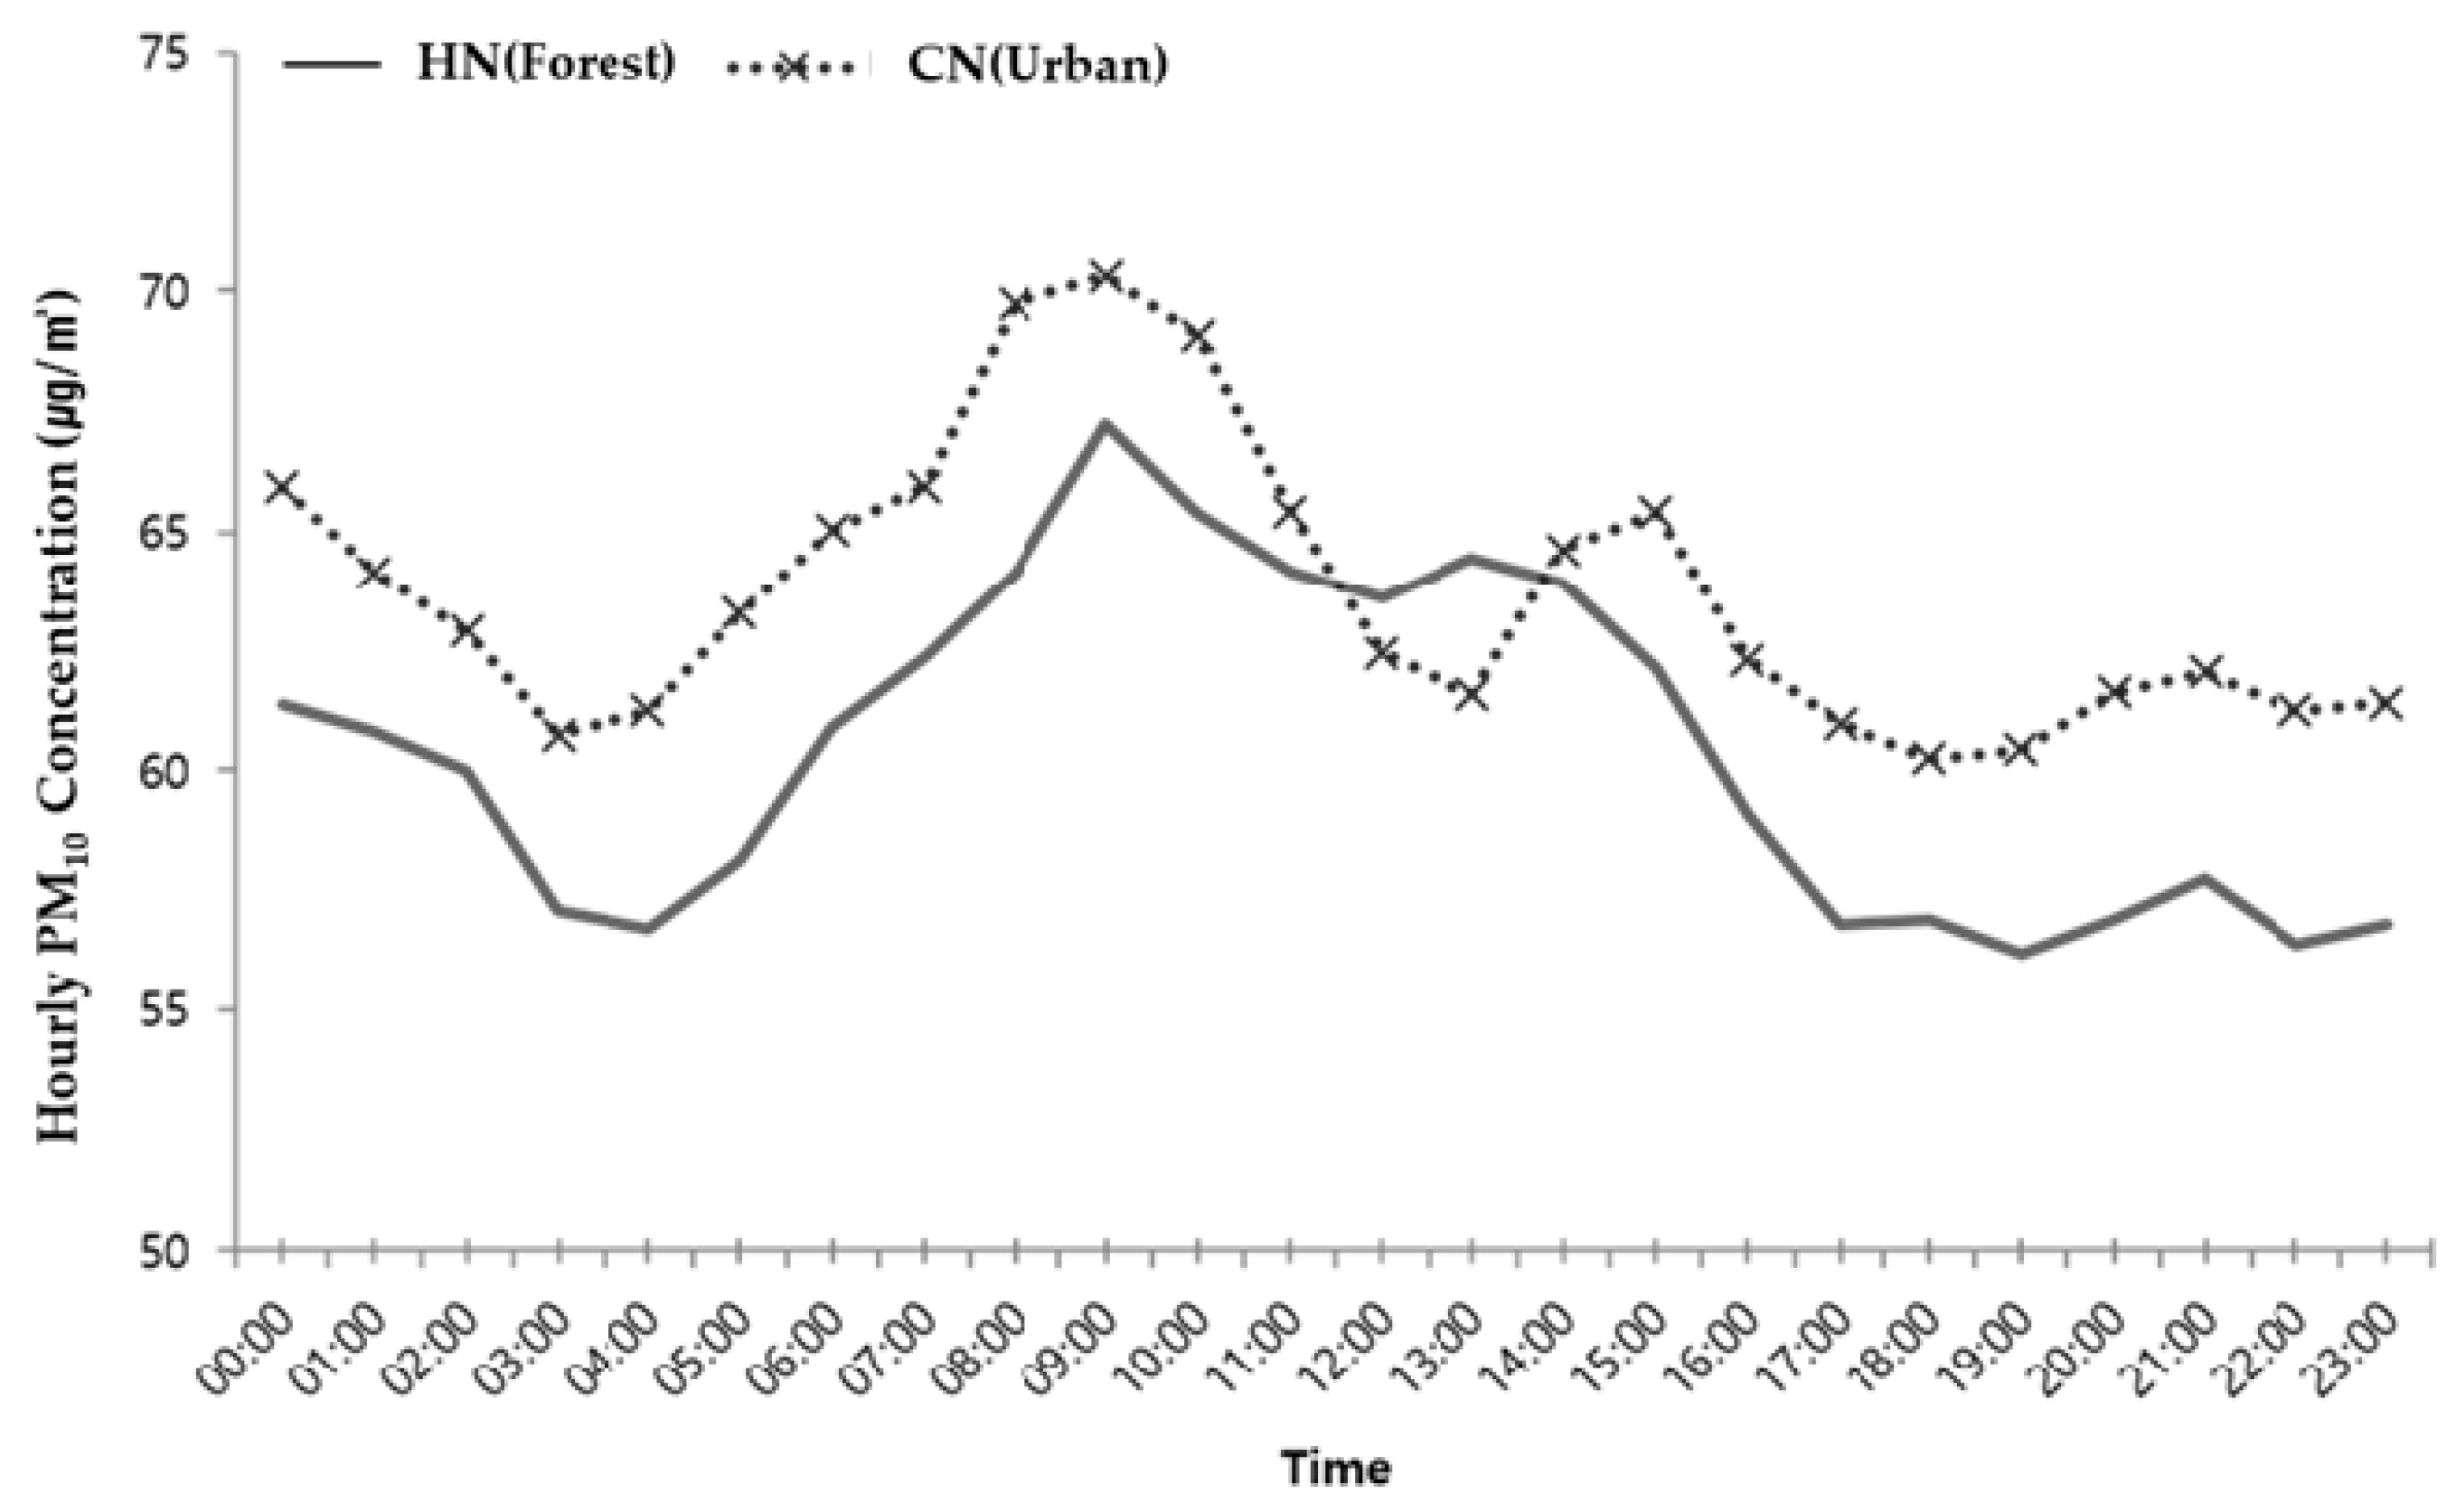
Figure 4.
Aerosol mass size distribution at forest (HN, a) and urban (CN, b) at the high PM10 event day, the yellow rectangle represents the coarse mode of PNC, and red rectangle shows the accumulation mode of PNC.
Figure 4.
Aerosol mass size distribution at forest (HN, a) and urban (CN, b) at the high PM10 event day, the yellow rectangle represents the coarse mode of PNC, and red rectangle shows the accumulation mode of PNC.
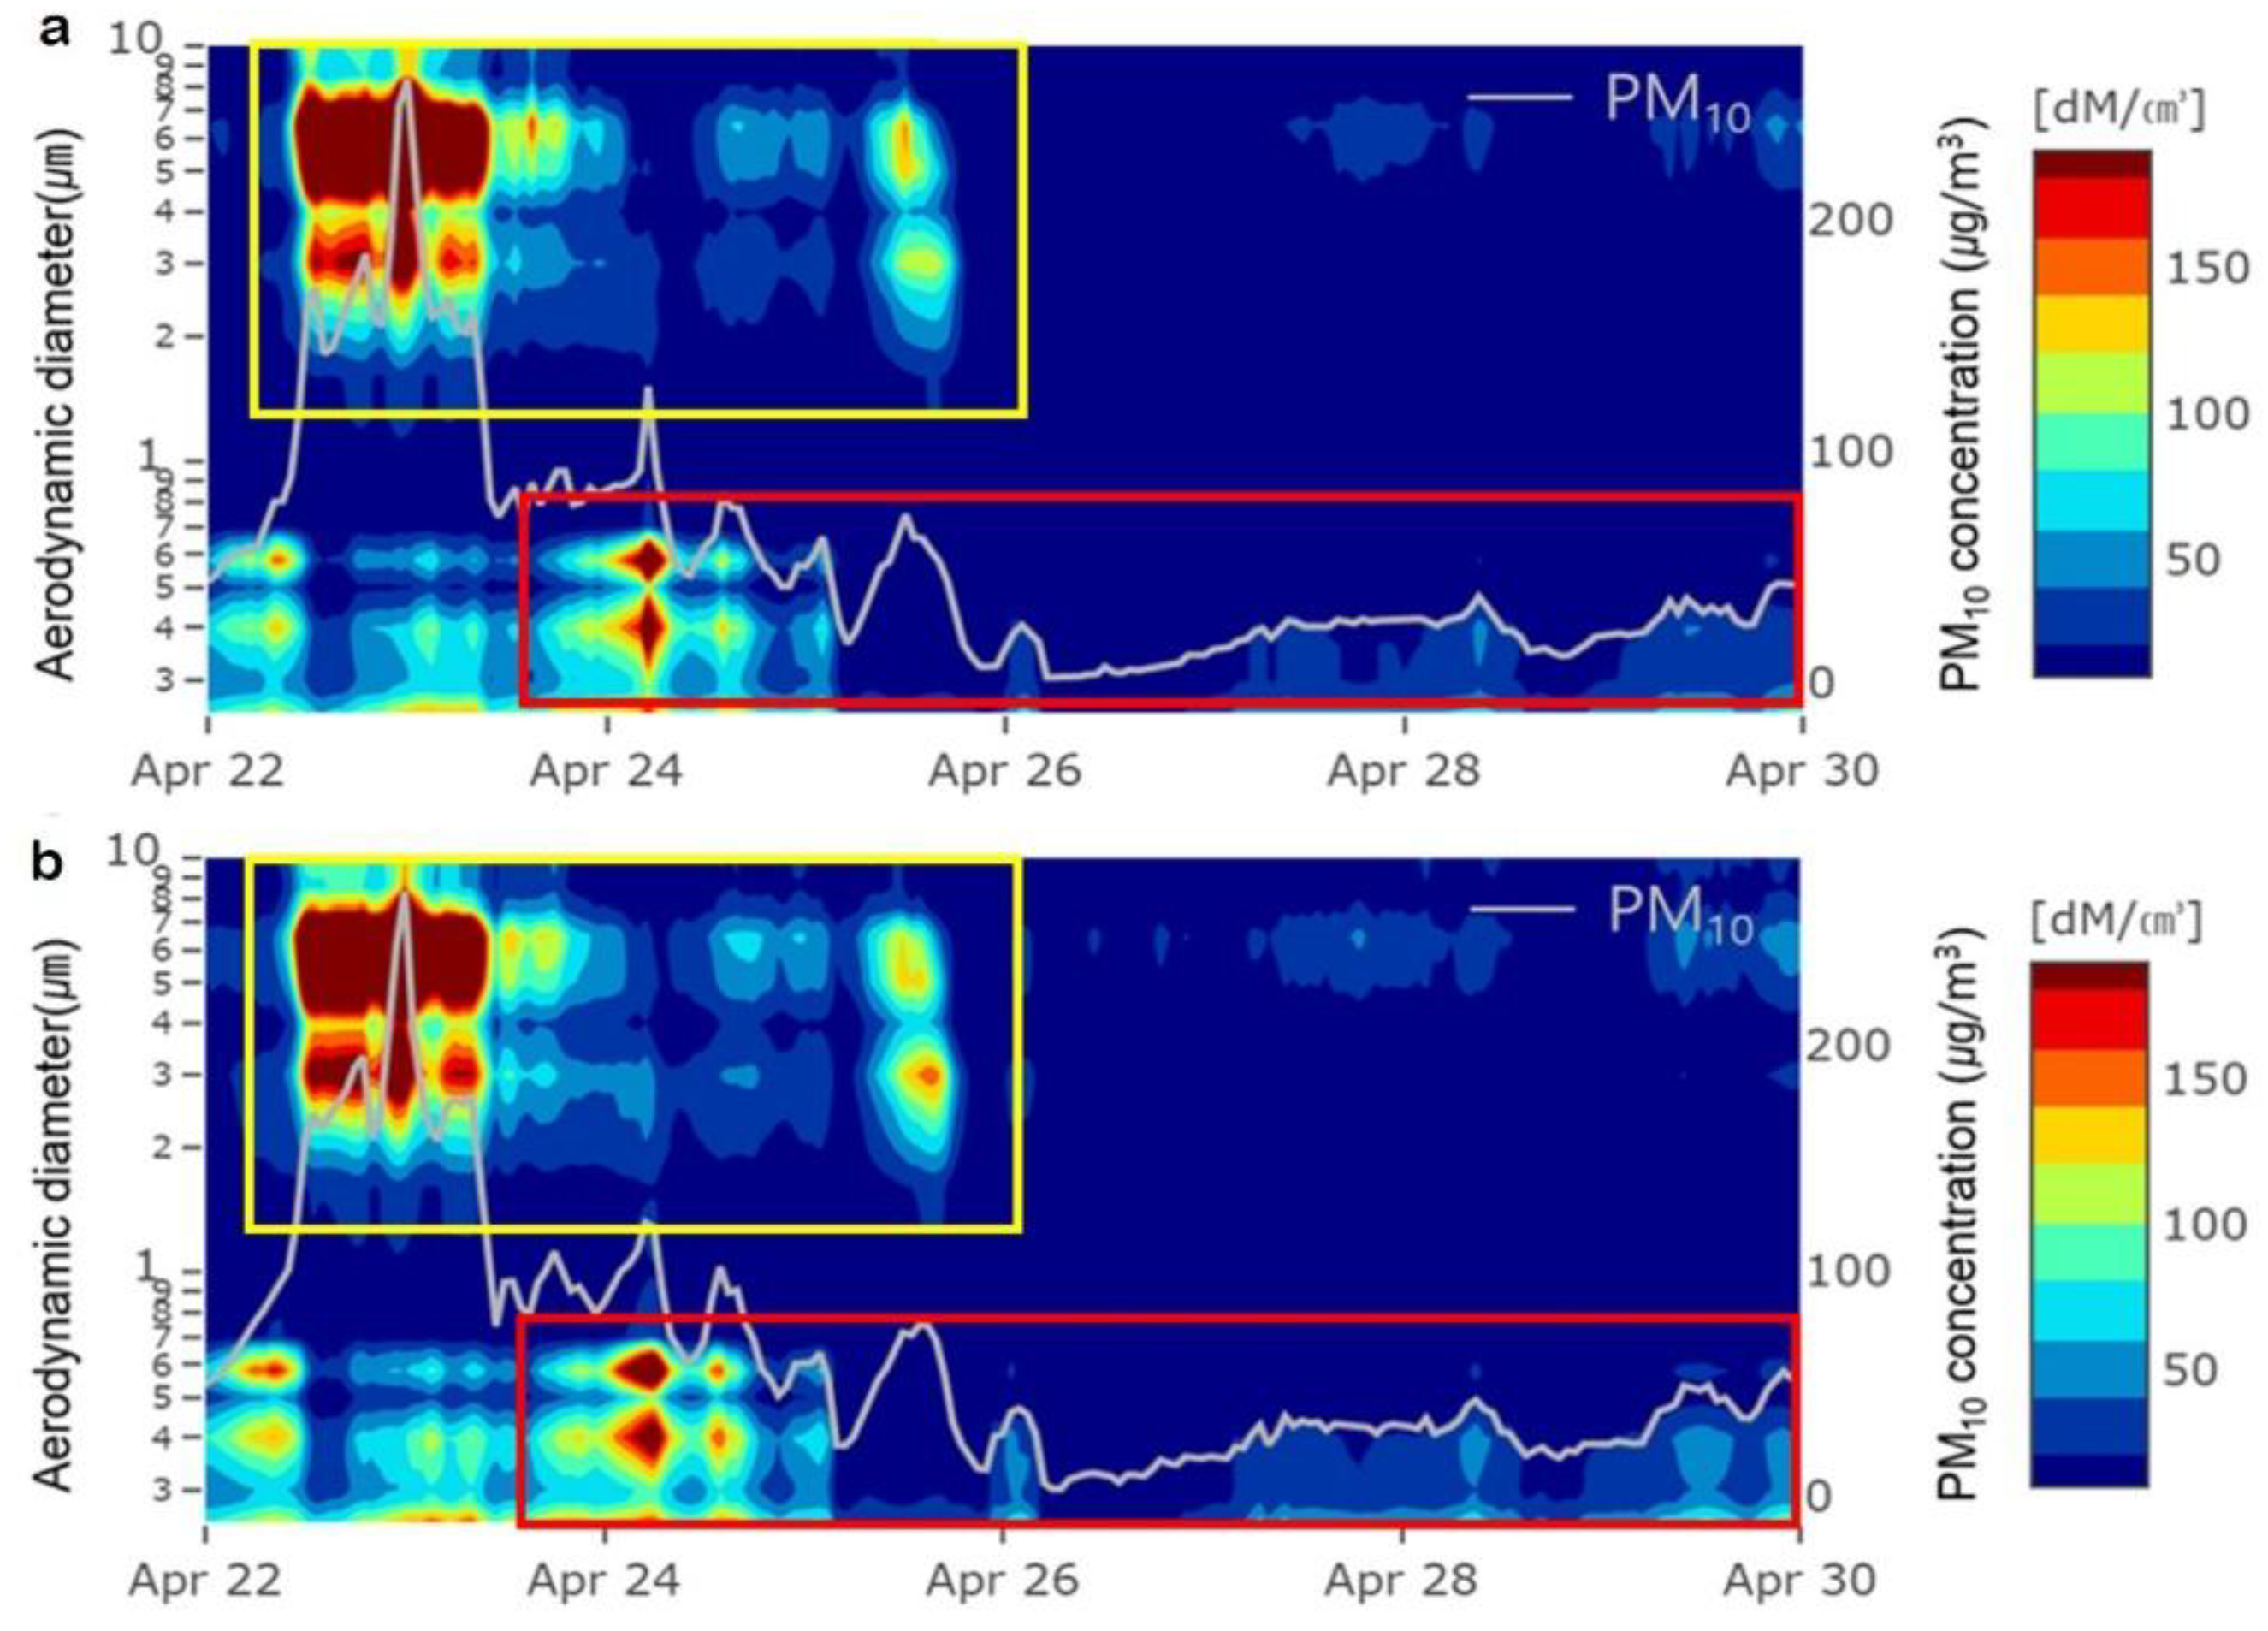
Figure 5.
Size distribution of aerosol particle number concentration at forest (black) and urban (gray) during (a) high concentration event day, (b) low concentration event day.
Figure 5.
Size distribution of aerosol particle number concentration at forest (black) and urban (gray) during (a) high concentration event day, (b) low concentration event day.
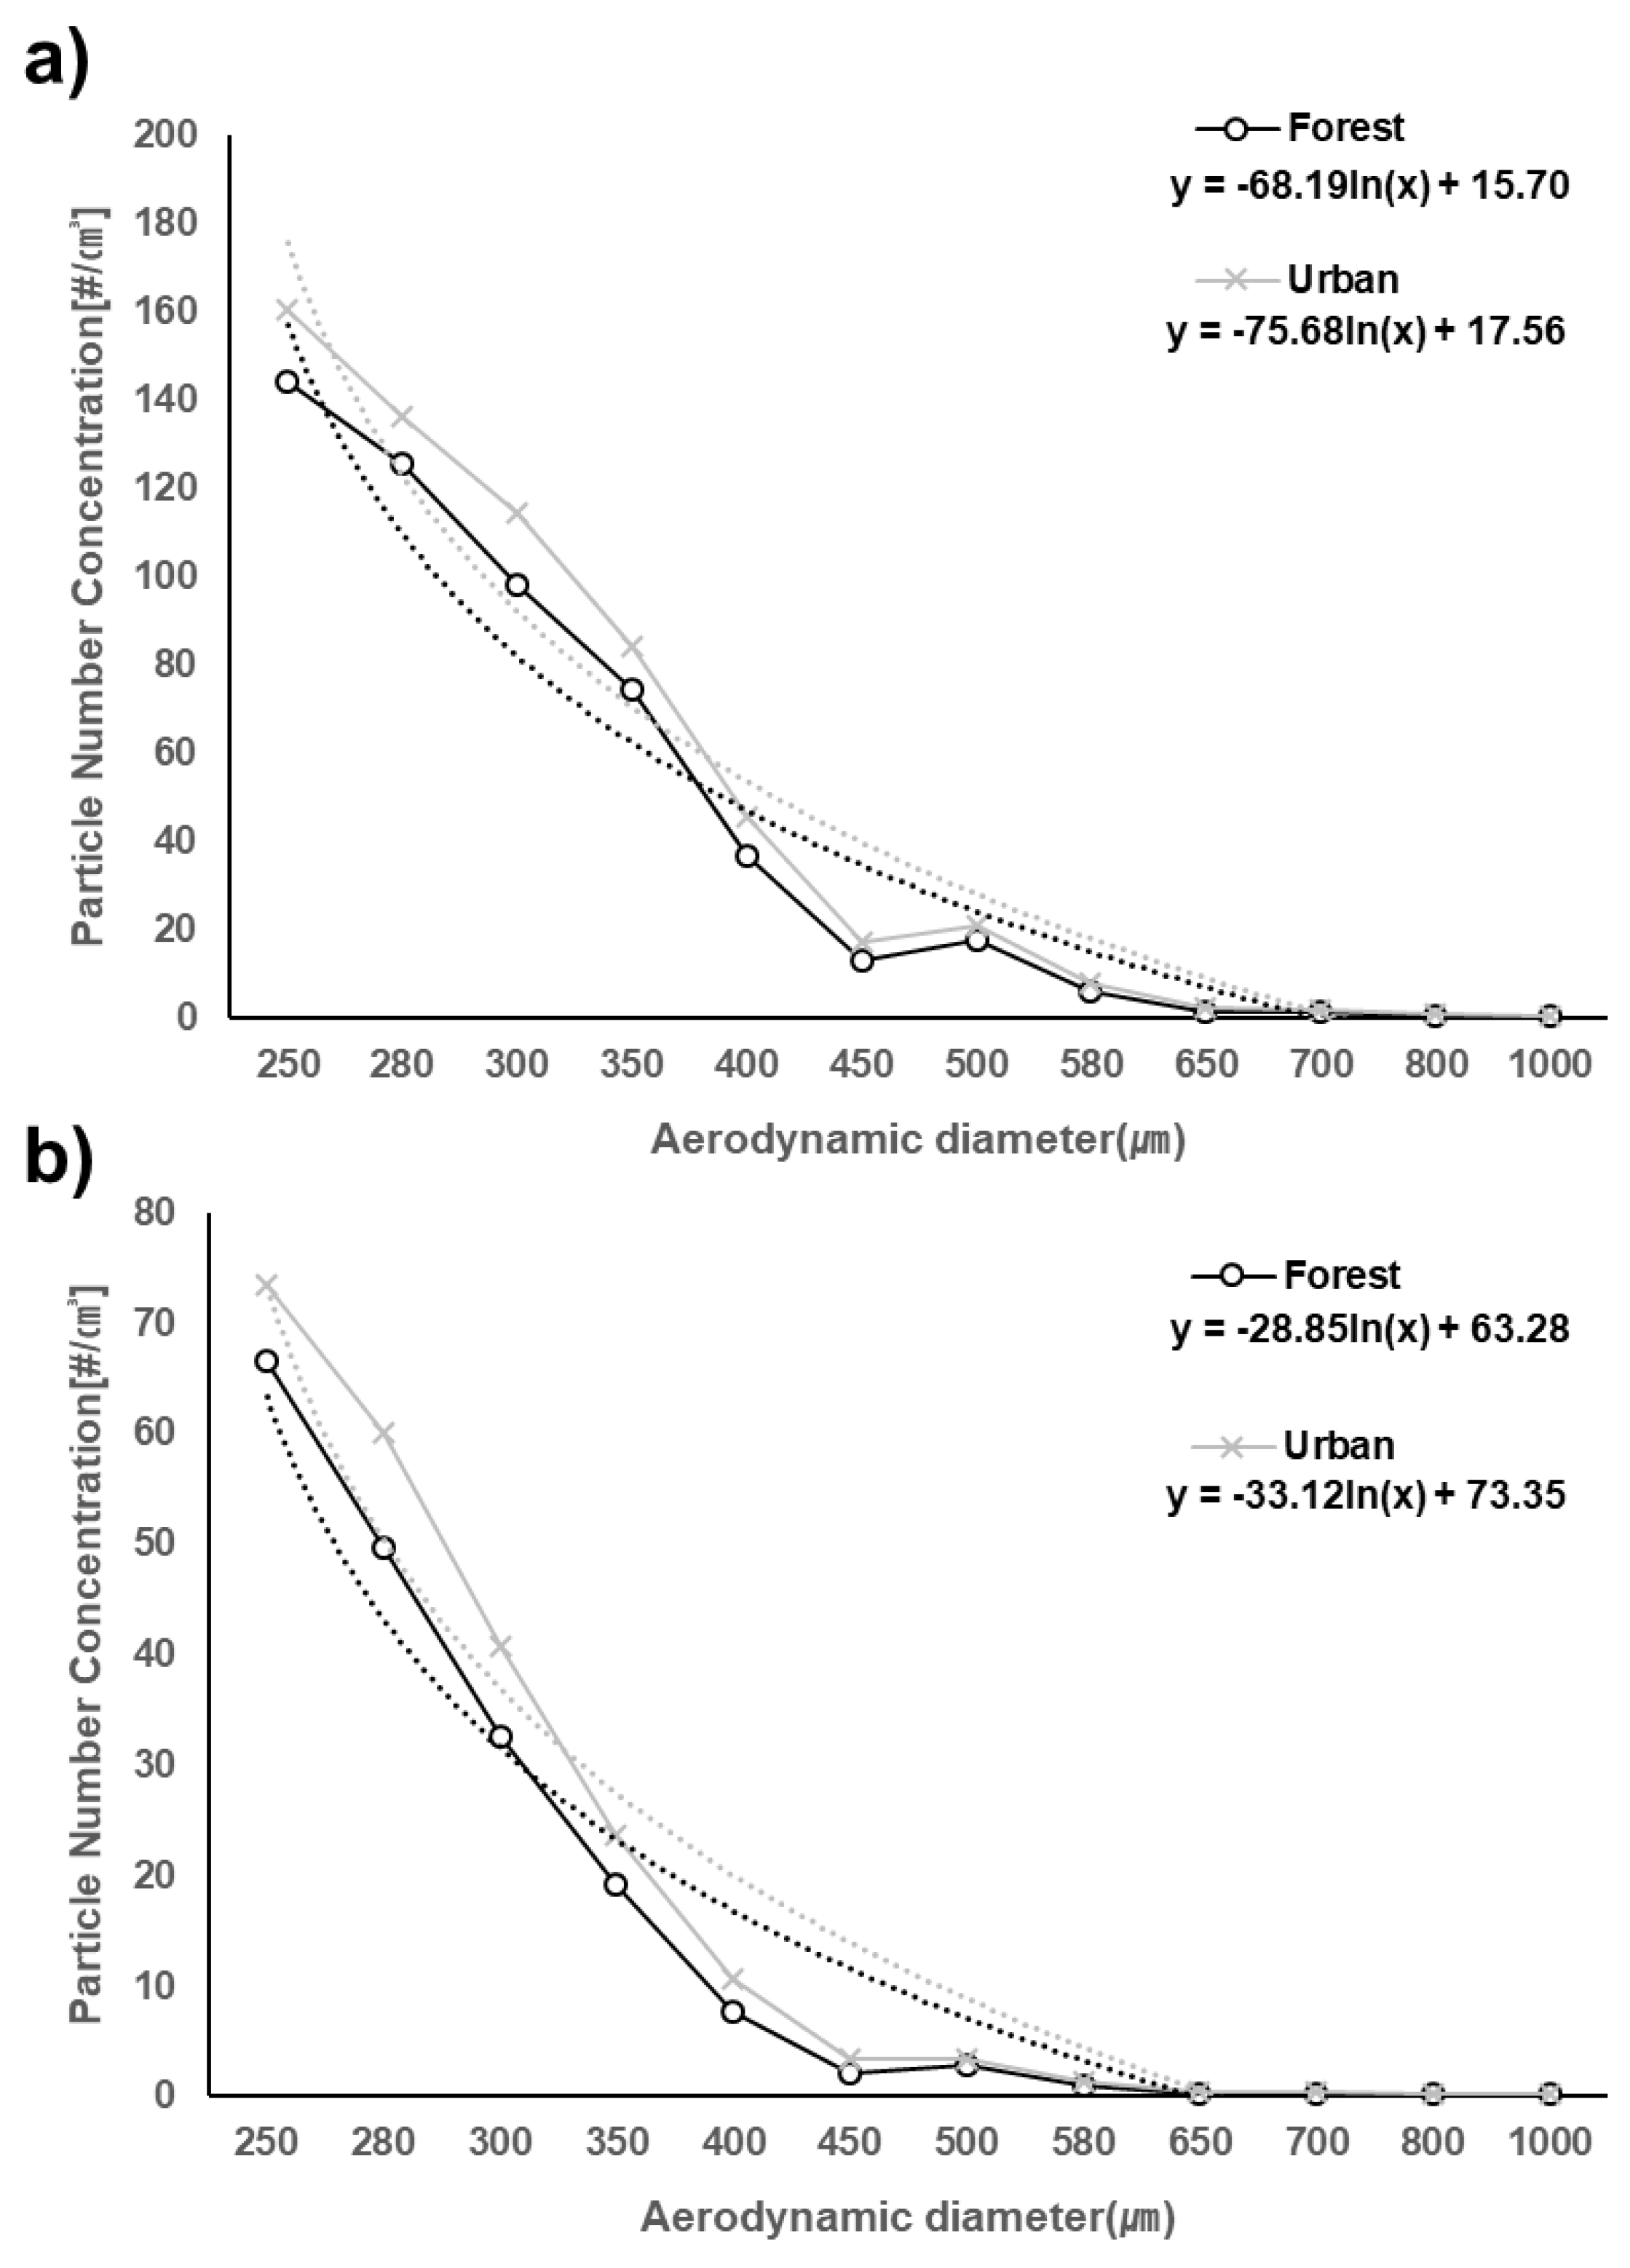

Table 1.
The status of upper trees at the dimensions of tree density (ea/100㎡), tree height (m), diameter at breast height (cm), and canopy & shrub coverage percentages (%) at two sites of HN(forest) and CN(urban).
Table 1.
The status of upper trees at the dimensions of tree density (ea/100㎡), tree height (m), diameter at breast height (cm), and canopy & shrub coverage percentages (%) at two sites of HN(forest) and CN(urban).
| Sites | Upper trees | Density | Tree height |
Diameter at breast height | Canopy coverage percentage (>6m) | Shrub coverage percentage (<2m) |
| ea/100㎡ | m | cm | % | % | ||
| Hongneung (HN) | Pinus densiflora | 13 | 12.4±3.7 | 35.3±11.0 | 61~80 | 60 |
| Cheongyangni (CN) | Pinus densiflora | 15 | 10.6±2.6 | 23.7± 2.8 | 61~80 | 0 |
| t-Test | ns | P<0.01 | P<0.01 | ns | P<0.01 | |
1Data are presented as mean ±SD. An independent samples t-test was used to assess the differences between the HN and CN sites. ns, not significant; *p<0.05; **p<0.01.
Table 2.
Statistical value of average PM10, PM2.5 and PM1.0 concentrations measured at CN (urban) and HN (forest).
Table 2.
Statistical value of average PM10, PM2.5 and PM1.0 concentrations measured at CN (urban) and HN (forest).
| Episode | Variables (㎍/㎥) |
Mean | Median | Minimum | Maximum | Std. dev. | Reduction rate (%) |
|||||
| CN | HN | CN | HN | CN | HN | CN | HN | CN | HN | |||
| High Conc. |
PM10 | 112.8 | 102.3 | 94.7 | 83.8 | 44.7 | 41.9 | 268.0 | 260.3 | 51.2 | 52.4 | 9.2 |
| PM2.5 | 65.2 | 56.7 | 66.4 | 54.6 | 29.0 | 27.0 | 110.0 | 119.9 | 16.8 | 16.4 | 13.0 | |
| PM1.0 | 51.7 | 45.0 | 52.7 | 44.4 | 24.1 | 21.5 | 100.1 | 111.8 | 15.5 | 15.1 | 13.0 | |
| Low Conc. |
PM10 | 31.1 | 25.2 | 29.8 | 24.6 | 3.2 | 2.0 | 76.0 | 72.9 | 16.2 | 14.9 | 19.0 |
| PM2.5 | 20.1 | 16.9 | 19.4 | 17.2 | 2.1 | 1.2 | 44.5 | 45.5 | 9.7 | 8.8 | 15.9 | |
| PM1.0 | 16.7 | 14.2 | 16.3 | 14.5 | 1.5 | 0.8 | 38.3 | 39.9 | 8.2 | 7.6 | 15.0 | |
Table 3.
Statistical value of particle number concentration measured at CN (urban) and HN (forest).
| Episode | Variables (#/㎤) |
Mean | Median | Minimum | Maximum | Std. dev. | Reduction rate (%) |
|||||
| CN | HN | CN | HN | CN | HN | CN | HN | CN | HN | |||
| High Conc. |
PNC (total) | 19.1 | 16.9 | 19.4 | 16.5 | 8.6 | 6.9 | 36.8 | 43.1 | 5.9 | 6.0 | 11.5 |
| PNC(≤0.5㎛) | 82.4 | 72.9 | 83.4 | 70.8 | 36.4 | 29.4 | 156.9 | 185.3 | 25.0 | 25.6 | 11.5 | |
| PNC(>0.5㎛) | 1.5 | 1.2 | 1.3 | 1.1 | 0.4 | 0.4 | 4.3 | 4.4 | 0.8 | 0.7 | 20.0 | |
| Low Conc. |
PNC (total) | 8.0 | 6.6 | 7.6 | 6.6 | 0.6 | 0.3 | 19.0 | 20.0 | 4.3 | 3.8 | 17.5 |
| PNC(≤0.5㎛) | 31.2 | 25.6 | 29.7 | 25.7 | 2.3 | 1.2 | 72.2 | 76.2 | 16.7 | 15.0 | 17.9 | |
| PNC(>0.5㎛) | 0.3 | 0.3 | 0.3 | 0.2 | 0.1 | 0.0 | 1.3 | 1.3 | 0.2 | 0.2 | 0.0 | |
Disclaimer/Publisher’s Note: The statements, opinions and data contained in all publications are solely those of the individual author(s) and contributor(s) and not of MDPI and/or the editor(s). MDPI and/or the editor(s) disclaim responsibility for any injury to people or property resulting from any ideas, methods, instructions or products referred to in the content. |
© 2025 by the authors. Licensee MDPI, Basel, Switzerland. This article is an open access article distributed under the terms and conditions of the Creative Commons Attribution (CC BY) license (http://creativecommons.org/licenses/by/4.0/).
Copyright: This open access article is published under a Creative Commons CC BY 4.0 license, which permit the free download, distribution, and reuse, provided that the author and preprint are cited in any reuse.


