
Submitted:
19 November 2025
Posted:
20 November 2025
You are already at the latest version
Abstract
This study examines the determinants of renewable energy consumption among BRICS countries (Brazil, Russia, India, China, South Africa, Saudi Arabia, Egypt, the United Arab Emirates, Ethiopia, Iran, and Indonesia) between 2000 and 2022. Using static (Fixed and Random Effects) and dynamic (First-Difference GMM) panel data models, the research investigates how economic, institutional, and social factors influence renewable energy transition. The results reveal structural heterogeneity within the bloc. Among the founding members, renewable energy consumption is positively associated with governance quality and trade openness, while GDP per capita exhibits a negative relationship, consistent with the Environmental Kuznets Curve hypothesis. In contrast, the new members show strong energy dependence and limited institutional capacity, with dynamic models confirming high persistence in energy consumption and weak responsiveness to economic and policy changes. Variables such as education and life expectancy were omitted in the dynamic specification due to limited temporal variation, without compromising model consistency. Diagnostic tests (Hansen, Sargan, and AR(2)) confirm the robustness of the estimates. Overall, the findings highlight the importance of strengthening institutional governance, technological innovation, and intra-bloc cooperation to advance energy transition and achieve sustainable development across the BRICS economies.

Keywords:
BRICS
; renewable energy consumption
; energy transition
; governance index
; dynamic panel models
; FD-GMM
; institutional quality
; sustainable development
1. Introduction
The growing urgency of climate change and the need to reshape energy systems toward cleaner and more sustainable sources have intensified global debates on the energy transition. Within this context, the BRICS bloc, currently comprising Brazil, Russia, India, China, South Africa, and, more recently, Saudi Arabia, Egypt, the United Arab Emirates, Ethiopia, Indonesia, and Iran, plays an especially relevant role.
These countries combine demographic weight, vast territories, high energy production, and remarkable political coordination capacity [1,2]. Moreover, many of them rank among the world’s largest emitters of greenhouse gases (GHG) and hold significant fossil fuel reserves, making the shift toward renewable energy systems both a strategic and institutional challenge.
Contemporary literature emphasizes that the energy transition is a multicausal phenomenon, conditioned by economic, institutional, and social factors [3,4,5]. On one hand, economic growth and rising income levels tend to increase energy demand, yet they may also generate the financial capacity and incentives for investment in cleaner technologies. On the other hand, factors such as education, technological innovation, and trade openness influence the diffusion of sustainable practices and the absorptive capacity for new technologies [6,7].
In addition, the role of institutions and governance has gained prominence over the past two decades [7,8,9]. Studies indicate that higher levels of governance, reflected in political stability, government effectiveness, regulatory quality, and control of corruption, are associated with more favorable environments for investment in energy infrastructure and green innovation [10,11,12]. Countries with robust institutional systems tend to provide regulatory predictability and lower political risk, both essential conditions for the expansion of renewable energy sources.
Despite the expanding body of research on energy transition, the literature still reveals substantial gaps in understanding the determinants of renewable energy consumption in emerging economies, particularly in comparative contexts [13]. Most studies focus on developed nations or employ aggregate measures of energy production, overlooking effective consumption, which is a more accurate indicator of renewable integration into the energy mix [14,15]. Furthermore, few analyses jointly examine institutional governance variables alongside socioeconomic and environmental factors within geopolitical blocs such as BRICS [15,16].
The recent expansion of the group reinforces the pertinence of this approach. While the original members (Brazil, Russia, India, China, and South Africa) share a more consolidated trajectory of economic and political cooperation, the new members (Saudi Arabia, Egypt, the United Arab Emirates, Ethiopia, Indonesia, and Iran) increase the bloc’s structural diversity, particularly regarding energy sources and climate policies. Understanding the differences between the founding and the newly admitted members may thus provide valuable insights into the factors that facilitate or hinder energy transition across the Global South.
Building upon this discussion, the present study formulates the following hypotheses:
- H1: Countries with higher levels of institutional governance (measured by a composite governance index) tend to exhibit greater renewable energy consumption, ceteris paribus.
- H2: Economic factors (GDP per capita, foreign direct investment, trade openness) and social factors (education, life expectancy) positively influence renewable energy consumption.
- H3: Structural differences exist between the founding and the newly admitted BRICS members in terms of renewable energy consumption behavior.
- H4: Renewable energy consumption exhibits temporal persistence, indicating path dependence.
Following these hypotheses, the general objective of this article is to investigate the determinants of renewable energy consumption in BRICS countries between 2000 and 2022, with special attention to the differences between founding and newly admitted members. The specific objectives are:
(i) to estimate the impact of economic, social, and governance variables on renewable energy consumption;
(ii) to compare the consumption patterns between the founding and new members of the bloc; and
(iii) to assess temporal persistence through dynamic panel models (GMM).
Accordingly, this study aims to contribute to the literature on energy economics by providing comparative empirical evidence on the energy transition in emerging economies and by offering insights for public policy design aimed at promoting energy sustainability across diverse institutional contexts.
2. Materials and Methods
This section presents the databases used in the study, as well as the econometric techniques employed to achieve the proposed objectives. First, the sources of information, the criteria for variable selection, and the temporal scope of the analysis are described. Next, the procedures for data cleaning and standardization are outlined, ensuring comparability across countries and over time. Finally, the econometric methods adopted in the empirical assessment are detailed, including the estimation procedures, robustness checks, and strategies to control for heterogeneity, thereby ensuring the consistency and validity of the results obtained.
2.1. Data
This study examines the 11 countries that currently comprise the BRICS. The analysis covers the period from 2000 to 2022. The final year was selected because the databases employed (IEA and the World Bank) make most of the indicators used in this research available only up to this point at the time of data collection and manuscript preparation.
The dependent variable is the percentage share of renewable energy consumption in total final energy consumption (re). The explanatory variables include: gross domestic product per capita (gdppp), net foreign direct investment (fdi), trade openness (trade), the educational index (educ), the life expectancy index (life), and the governance index (gi). The dataset is structured as a panel composed of 11 countries observed over 23 years, totaling 253 observations.
To reduce asymmetries and improve interpretability of the coefficients, all variables were transformed into natural logarithms. For the governance index (gi), the transformation ln(gi + 3) was employed to retain observations with zero or negative values without significant loss of information [17,18,19].
The dependent variable (re) was obtained from the IEA database [20]. From an economic standpoint, three variables were considered: gdppp, fdi, and trade. The GDP per capita series, expressed in constant 2015 prices [21], reflects economic growth and its distribution across countries. The fdi indicator, also sourced from the World Bank, is defined as net inflows of foreign investment undertaken to gain a lasting managerial interest in domestic investment projects (through the acquisition of at least 10% of voting capital) in enterprises of an economy different from that of the investor.
The indicator is calculated based on the sum of equity capital, reinvested earnings, and both long- and short-term capital, as reported in the balance of payments [21]. The fdi variable is widely used in economic and environmental impact studies, although empirical findings remain mixed. Studies such as [22,23] report negative effects on energy use, whereas [24,25,26] find positive effects.
The third economic variable is trade openness (trade). Although multiple approaches exist to measure this indicator, the present study adopts the definition provided by the World Bank, which expresses trade as the percentage of total trade flows (the sum of imports and exports of goods and services) relative to GDP [21].
In addition to the economic variables, this research examines the influence of socioeconomic factors on renewable energy consumption. For this purpose, two indicators with these characteristics are included: the education index (educ) and the life expectancy index (life). These measures correspond to the dimensions used to construct the Human Development Index (HDI), proposed by the United Nations.
The HDI, developed by the United Nations Development Programme (UNDP), comprises three dimensions: access to knowledge; a long and healthy life; and a decent standard of living. The latter is measured by gross national income per capita. Since GDP per capita is already included in the model as an independent variable, and to avoid potential multicollinearity issues, only the dimensions related to access to knowledge and longevity were incorporated into the analysis. Accordingly, educ and life are used as independent variables in this study.
These two HDI dimensions have been widely employed in previous research, albeit in different contexts. For instance, [27] analyzed the relationship between environmental conditions, human development, and economic growth; [28] examined how the use of fossil-fuel-based energy sources contributes to environmental degradation; and [29,30] investigated the association between renewable energy consumption and entrepreneurial activity.
The governance index (gi), an institutional variable, is a multidimensional indicator constructed from six governance dimensions. It was generated through Principal Component Analysis (PCA), a multivariate statistical technique that synthesizes a set of correlated variables into independent components that retain most of the system’s total variance [31,32,33]. As previously noted, the indicator was built from six governance measures obtained from the World Bank database [21]:
- Voice and accountability (va): the extent to which a country’s citizens are able to participate in selecting their government, as well as freedom of expression, freedom of association, and a free media.
- Political stability (ps): the likelihood that the government will be destabilized or overthrown by unconstitutional or violent means, including terrorism.
- Government effectiveness (ge): the quality of public services, the capacity of the civil service and its independence from political pressures, and the quality of policy formulation and implementation.
- Regulatory quality (rq): the government’s ability to formulate and implement sound policies and regulations that enable and promote private sector development.
- Rule of law (rl): the degree to which agents have confidence in and abide by the rules of society—particularly the quality of contract enforcement, property rights, police, and courts, as well as the likelihood of crime and violence.
- Control of corruption (cc): the extent to which public power is exercised for private gain, including both petty and grand forms of corruption, as well as state capture by elites and private interests.
Before applying PCA, the variables were normalized to eliminate scale differences and ensure that each contributed proportionally to the formation of the components. The first principal component, which explained the largest share of variance (va = 0.9556), was selected as the synthetic governance index (gi) and subsequently normalized to range between 0 and 1. This procedure allowed for the creation of a comparable measure across countries and over time, reflecting the institutional capacity of each economy.
In addition to the variables described above, a dummy variable (old_brics) was created to distinguish founding BRICS members (Brazil, Russia, India, China, and South Africa) from the new members incorporated in later periods (Egypt, Ethiopia, Iran, Indonesia, Saudi Arabia, and the United Arab Emirates). To control for potential macroeconomic shocks, a linear time trend was included in the model, supplemented by annual dummy variables (yn).
Table 1 summarizes all variables used in the study, indicating their category, acronym, description, and data source.
2.2. Econometric Modeling
Before selecting the most appropriate models for data analysis, we tested whether the dependent variable exhibits a unit root using the panel unit root test proposed by Pesaran [34]. The presence of non-stationarity creates disadvantages for static models, such as Fixed and Random Effects, as well as for the First-Difference Generalized Method of Moments (FD-GMM). In such cases, the lagged dependent variable becomes correlated with the fixed effect, which in turn is part of the error component, resulting in dynamic panel bias in the estimator [35]. In other words, it is necessary to verify whether cross-sectional dependence exists among countries.
According to [36,37], there are two versions of the Pesaran test: first- and second-generation unit root tests. In the first case, the null hypothesis states that there is no cross-sectional dependence (i.e., the units are independent), whereas the second-generation test is robust to this condition. Accordingly, we applied both the first- and second-generation Pesaran tests, with and without trend, to determine the presence or absence of cross-sectional dependence for all variables in the study (Table 2).
According to Table 2, the first- and second-generation cross-sectional dependence tests [34,38] indicate that, although most variables do not exhibit significant interdependence among BRICS countries, some of them—particularly fdi and gi—show contemporaneous correlation, suggesting the partial presence of common shocks across the panel, a pattern expected in economically integrated blocs. Given this result, the empirical strategy adopted in this study involved two stages.
First, static panel models with Fixed Effects (FE) and Random Effects (RE) were estimated to capture unobserved heterogeneity across countries and to assess the robustness of the coefficients under different assumptions regarding the correlation between individual effects and the explanatory variables. This approach is widely recommended for comparative analyses across units with distinct structural characteristics [19,39].
In the second stage, the analysis was extended to a dynamic panel specification using the first-difference Arellano–Bond estimator (FD-GMM). This technique addresses potential issues of endogeneity, autocorrelation, and heteroskedasticity, while also accounting for the temporal persistence of the dependent variable (ln_re). The use of FD-GMM is particularly suitable for contexts with a relatively small number of cross-sectional units (N) and a moderate time dimension (T), as in this study, and is widely applied in empirical research on economic growth, governance, and energy [35,40,41].
Thus, the combined use of static and dynamic models enables a more robust assessment of the determinants of renewable energy consumption in the BRICS, integrating both cross-country comparisons and the temporal dynamics of the energy transition process.
Therefore, the data were modeled according to Equation 1:
where (i), i= 1, 2, 3 ..., 11, denotes the countries and t represents the annual time dimension. The β coefficients are the model parameters, which represent the elasticities capturing the impact of the independent variables (previously defined) on renewable energy consumption in each country over time. The vector differentiates countries according to founding members, new members, and associated members of the bloc, while represents the linear time trend, controlled by annual dummy variables that capture potential macroeconomic shocks.
Subsequently, to incorporate the temporal dynamics of renewable energy consumption and to address potential endogeneity and persistence effects, the model was extended to a dynamic specification, as presented in Equation 2:
where represents the lagged renewable energy consumption, allowing the model to capture temporal persistence and the path dependence of clean energy use. The coefficient α measures the degree of this dependence, with values close to 1 indicating high inertia in the energy transition process.
The static models (Eq. 1) were estimated using Fixed Effects (FE) and Random Effects (RE) estimators, following the Hausman specification tests, which assess the presence of correlation between individual effects and the explanatory variables. For the dynamic models (Eq. 2), the first-difference Generalized Method of Moments (FD-GMM), as proposed by [35], was employed. This technique is suitable for panels with relatively short time dimensions (T) and a larger number of cross-sectional units (N), and it effectively addresses endogeneity arising from lagged variables and unobserved country-specific heterogeneity.
Arellano–Bond autocorrelation tests (AR(1) and AR(2)), along with the Hansen and Sargan tests for instrument validity, were applied to verify, respectively, the absence of second-order serial correlation in the residuals and the exogeneity of the instruments used.
In addition to the joint analysis for the BRICS as a whole, the same modeling strategy was applied separately to the founding members (Brazil, Russia, India, China, and South Africa) and the new members (Saudi Arabia, Egypt, Ethiopia, Iran, Indonesia, and the United Arab Emirates), allowing the identification of potential structural heterogeneities in renewable energy consumption trajectories across groups.
All estimations were performed using Stata 15, a software widely used in empirical research involving panel data. Prior to estimation, the series were examined for stationarity and multicollinearity to ensure the robustness of the results. Based on the modeling procedures described above, the study aims to identify the economic, social, and institutional determinants of renewable energy consumption in BRICS countries, as well as the structural differences between founding members and recently incorporated nations. The empirical results and their implications for the energy transition are presented and discussed in the next section.
3. Results and Discussion
This section discusses the main results derived from the econometric modeling. We begin with the descriptive analysis and the correlation structure among the variables, followed by the presentation of the stationarity and cointegration tests which, together with the first- and second-generation Pesaran tests detailed in the methodological section, guided the selection of the econometric models employed in the study. Subsequently, the results of the static and dynamic models are presented, along with the interpretation of the key coefficients.
Next, a comparative analysis between the founding and new BRICS members is provided, with the results examined separately to highlight structural differences between the groups. Finally, a general discussion is offered, including the broader policy implications for the energy transition process within the bloc.
3.1. Descriptive Analysis and Correlation Between Variables
We begin the econometric analysis by examining the key characteristics of the sample. Table 3 presents the descriptive statistics for the variables selected for the BRICS countries over the study period. The sample consists of 253 country–year observations, although some variables contain fewer observations due to data availability constraints and the loss of information during the transformation process. All variables were converted into natural logarithms to smooth their distribution and to allow the regression coefficients to be interpreted as elasticities.
The dependent variable, ln_re, which represents the share of renewable energy in the total energy mix, has a mean value of –3.27. This negative value is expected, as it reflects the logarithm of a proportion (a number between 0 and 1). The average suggests that the contribution of renewable sources to total energy consumption within the BRICS bloc remains relatively low overall. Moreover, the high standard deviation (2.56) and the wide range between the minimum and maximum values (–9.31 to –0.04) indicate substantial heterogeneity across countries and over time, reflecting markedly different stages of energy transition among the member states. This dynamic can be visualized in Figure 1, which presents the average share of renewable energy in the energy mix for each country in the bloc. Notably, Ethiopia and Brazil stand out with the highest shares, 92.9% and 42.5%, respectively.
The logarithm of GDP per capita (ln_gdppp) has a mean of 9.53, while the human development variables—years of schooling (ln_educ) and life expectancy (ln_life)—show mean values of 2.50 and 4.24, respectively. It is noteworthy that the social variables (ln_educ and ln_life) display the lowest standard deviations (0.21 and 0.10), suggesting greater convergence or lower variability in these indicators across the countries in the sample when compared with the economic variables.
Foreign Direct Investment (ln_fdi) and the governance index (ln_gi) exhibit considerably larger standard deviations (1.81 and 0.89, respectively), reflecting the substantial institutional disparities and differences in external capital attractiveness that characterize the diverse group of BRICS countries.
To deepen the preliminary analysis, Table 4 presents the Pearson correlation matrix for all variables included in the study. This matrix provides an initial overview of the direction and strength of the linear relationships, which will be examined in greater detail in the section dedicated to the econometric models.
The correlation analysis reveals several noteworthy findings. The dependent variable, ln_re, exhibits a strong and negative correlation with GDP per capita (ln_gdppp) of, 0.7827. Although this result may initially appear counterintuitive, particularly because it contradicts the Environmental Kuznets Curve hypothesis [42,43], it suggests that, for BRICS countries, economic growth has historically been closely associated with an energy matrix dominated by fossil fuels. This interpretation is consistent with studies indicating a persistent path dependence in fossil fuel use among emerging economies [44,45].
Similarly, the negative and strong correlation with trade openness (ln_trade) of 0.6569 may indicate that greater integration of these countries into global trade is linked to economic sectors that rely heavily on non-renewable energy sources. This finding aligns with the “Pollution Haven” hypothesis [46,47]. The magnitude of the correlation suggests that increased commercial integration within the BRICS has likely occurred through specialization in energy-intensive and polluting sectors that have been relocated from countries with stricter environmental regulations. Thus, higher trade levels appear to correspond to production structures more reliant on non-renewable sources, reducing the relative share of renewables [48,49].
By contrast, foreign direct investment demonstrates a positive, although weak, correlation (0.2178) with renewable energy participation. This may indicate that part of the foreign capital entering these economies is being directed toward clean-energy projects, consistent with the hypothesis that fdi can serve as a channel for green technology transfer. Previous studies have reported similar results and show that foreign investment can finance both renewable and non-renewable energy projects, whether in the BRICS or in other regions such as Sub-Saharan Africa [50,51], which is consistent with the modest correlation observed.
Finally, the correlation between ln_re and its own lag (ln_rela1l) is nearly perfect (0.9988), suggesting strong temporal persistence in the structure of the energy matrix. This behavior is expected and reinforces the relevance of employing dynamic econometric models in the analysis. Among the independent variables, moderate and positive correlations are observed between the development indicators (ln_gdppp, ln_educ, ln_life), as anticipated by human capital theory, but without signs of severe multicollinearity that could jeopardize subsequent estimations.
3.2. Stationarity and Dependence Tests Between Series
Before estimating the proposed models, an analysis of the stochastic properties of the series was conducted to verify the presence of unit roots and long-run dependence among the variables. This step is essential to avoid spurious inference and to define the most appropriate modeling strategies for the subsequent stages of the analysis.
The panel unit root tests (LLC, IPS, ADF-Fisher, and PP-Fisher) revealed mixed evidence of stationarity across the variables. Some series, such as ln_life (life expectancy) and ln_trade (trade openness), displayed p-values below 0.05 in the level tests, indicating rejection of the unit root null hypothesis and, therefore, stationary behavior. In contrast, variables such as ln_re (renewable energy consumption), ln_gdppp (GDP per capita in PPP), ln_fdi (foreign direct investment), ln_educ (education), and ln_gi (governance) exhibited p-values above 0.05 in levels, suggesting non-stationarity. For these variables, stationarity was achieved after first differencing, implying that they are integrated of order one, I(1). The results are presented in Table 5.
This pattern indicates that the panel is composed of a combination of I(0) and I(1) series, that is, a partially stationary set. Subsequently, the Kao panel cointegration test was applied. The results showed p-values greater than 0.05 for all reported statistics, meaning that the null hypothesis of no cointegration could not be rejected (Table 6). In practical terms, this implies that although some variables are I(1), there is no statistical evidence of a common long-run equilibrium relationship between renewable energy consumption and its determinants across the countries in the sample. This outcome is typical in economic panels composed of countries with heterogeneous structural characteristics, as is the case of the BRICS.
These findings have two empirical implications. First, they suggest that the relationships between renewable energy consumption and the explanatory variables are predominantly short- and medium-term in nature, rather than anchored in a long-run equilibrium process. Second, they justify the adoption of two empirical approaches in the article: (i) static panel models, such as Fixed Effects and Random Effects, to capture cross-country heterogeneity and contemporaneous associations among the variables; and (ii) a dynamic panel model using FD-GMM, to account for the temporal persistence in ln_re and to address potential endogeneity issues.
3.3. Results of Static and Dynamic Models for the Entire Sample
3.3.1. Results of Static Tests – Fixed and Random Effects
The estimation results for the Fixed Effects (FE) and Random Effects (RE) models are presented in Table 7. In both specifications, the dependent variable (ln_re) represents renewable energy consumption in the BRICS countries, while the explanatory variables capture economic, social, and institutional factors.
In the FE model, the within-group coefficient of determination (within R² = 0.3854) indicates that approximately 38.5% of the variation in renewable energy consumption is explained by changes in the explanatory variables over time within each country. The global F-test is highly significant (p < 0.001), suggesting a strong overall model fit.
The variable ln_gdppp exhibits a negative and statistically significant coefficient (β = –0.907, p < 0.001), indicating that increases in per capita income are associated with a reduction in the share of renewable sources in total energy consumption. This result is consistent with prior evidence on the Environmental Kuznets Curve [52,53], according to which early stages of economic growth tend to intensify the use of fossil fuels, reducing the relative participation of clean energy until a higher income level that supports an energy transition is reached.
The variable ln_educ displays a positive and highly significant coefficient (β = 2.319, p < 0.001), suggesting that improvements in average educational attainment foster the adoption of renewable sources. This reinforces the idea that human capital and environmental awareness play essential roles in technological diffusion and the demand for clean energy [4,54].
In contrast, ln_life has a negative and significant coefficient (β = –2.663, p < 0.001). Although seemingly counterintuitive, this result may reflect that countries with higher life expectancy tend to have more mature economic and energy structures that remain dependent on fossil fuels, thereby slowing the relative advance of renewables [45].
Foreign direct investment (ln_fdi) shows a positive and significant coefficient (β = 0.037, p < 0.05), suggesting that international capital inflows may encourage investment in modern energy infrastructure, including renewable sources. This finding is aligned with studies indicating that, in emerging economies, fdi may play a dual role of technological diffusion and stimulation of renewable energy sectors, particularly when adequate environmental regulation is present [55,56].
Trade openness (ln_trade) presents a negative and marginally significant coefficient (β = –0.087, p ≈ 0.09), indicating that increases in trade flows may be associated with expansion of sectors that rely heavily on non-renewable energy. Although only weakly significant, this result is consistent with the “Pollution Haven” hypothesis, which argues that developing countries tend to attract pollution-intensive industries as they integrate into global markets [57,58].
Finally, the governance index (ln_gi) is not statistically significant (p > 0.4), suggesting that, at the aggregate BRICS level, political institutions do not yet exert a direct influence on renewable energy consumption, likely a consequence of pronounced institutional heterogeneity among member states [59].
The Random Effects model yields coefficients similar in magnitude and direction to the FE model, reinforcing the robustness of the estimated signs. The Hausman statistic (χ² = 12.25; p = 0.0566), which lies close to the 5% significance threshold, provides marginal evidence that differences between the estimators are not entirely systematic. Although the RE model is not statistically rejected, the FE specification is considered more appropriate for analytical purposes, as it better captures the unobserved heterogeneity specific to each country. This result is consistent with empirical literature on the BRICS, where institutional structures and energy patterns vary substantially across members [60,61].
Overall, the results indicate that economic and human factors, such as income and education, play central roles in the energy transition of BRICS countries, whereas governance and trade openness still exhibit limited or ambiguous effects. These findings underscore the need for integrated public policies that reconcile economic growth, environmental education, and institutional strengthening to accelerate the adoption of renewable sources and, consequently, expedite the energy transition within the bloc.
The results obtained from the fixed- and random-effects estimations provide valuable insights into the contemporaneous relationships between renewable energy consumption and its main economic, social, and institutional determinants within the BRICS group. However, these static models do not fully capture the dynamic nature of energy consumption, which tends to exhibit temporal persistence and potential endogeneity among the explanatory variables.
In particular, renewable energy demand is often influenced by its own past behavior, as investments in renewable infrastructure, technological diffusion, and policy implementation occur gradually over time [5,37]. Moreover, reverse causality may exist between some regressors, for instance, higher renewable energy penetration can also stimulate economic activity or attract foreign investment.
To address these issues, the next step involves estimating a dynamic panel data model using the First-Difference Generalized Method of Moments (FD-GMM) estimator proposed by Arellano and Bond [35]. This estimator allows for the inclusion of the lagged dependent variable (ln_re₍ₜ₋₁₎) as an additional explanatory factor, while controlling for unobserved heterogeneity and potential endogeneity bias. The FD-GMM approach is particularly suited for panels with a relatively short time dimension and a moderate number of cross-sectional units, as in the present case.
3.3.2. Results of the Dynamic Panel Test – FD Application – GMM
Table 8 reports the estimation results of the dynamic panel model using FD-GMM for the BRICS countries. The inclusion of the lagged dependent variable ln re₍ₜ₋₁₎ accounts for the temporal persistence of renewable energy consumption, while the GMM structure controls for endogeneity and unobserved heterogeneity across countries. The diagnostic tests confirm the adequacy of the specification: the Sargan (p = 0.535) and Hansen (p = 0.704) statistics fail to reject the null hypothesis of instrument validity, and the Arellano-Bond tests indicate first-order serial correlation [AR(1), p = 0.046] but no second-order correlation [AR(2), p = 0.224], satisfying the consistency conditions of the GMM estimator [35].
The coefficient of ln re₍ₜ₋₁₎ is positive and highly significant (β = 0.867, p < 0.01), with a 95 % confidence interval between 0.73 and 1.00. This result confirms the strong inertia and persistence of renewable energy use within the BRICS economies. In other words, countries that already consume larger shares of renewables tend to maintain or further expand this trajectory, consistent with path-dependence effects reported by Apergis and Payne [5,62].
The coefficient of ln gdppp remains negative and significant (β = –0.2897, p < 0.01), with the 95 % confidence interval (–0.48; –0.10) confirming robustness. This result mirrors the findings of the fixed- and random-effects estimations, reinforcing the inverse short-run relationship between income growth and renewable energy share. It supports the Environmental Kuznets Curve hypothesis; whereby early stages of economic expansion are typically driven by fossil-intensive growth before environmental awareness and technological change shift demand toward renewables.
Education variable remains statistically insignificant (p > 0.10) and its confidence interval (–0.47; 0.61) includes zero, suggesting that the short-run effects of education on renewable adoption may take longer to materialize through structural and behavioral channels.
The coefficient for ln_life (life expectancy) is positive and highly significant (β = 1.835, p < 0.01; CI = 1.26–2.41), implying that improvements in human development and living standards are positively associated with renewable energy use. This finding contrasts with the negative static association observed under FE and RE models, highlighting a dynamic reversal effect: in the short- to medium-term, countries achieving higher life expectancy are likely implementing broader welfare and sustainability agendas that favor clean energy transitions.
The effect of ln fdi remains positive and significant (β = 0.0262, p < 0.01; CI = 0.0047–0.0477), corroborating earlier findings that external capital inflows foster renewable energy development through technology transfer and financing of infrastructure.
Trade openness retains a negative but non-significant coefficient (β = –0.054, p > 0.10; CI = –0.20; 0.09). This again aligns with the static estimates and partially supports the Pollution Haven Hypothesis, suggesting that, in the short run, greater openness may encourage energy-intensive production that offsets renewable gains.
Governance quality displays a small but statistically significant negative coefficient (β = –0.0419, p < 0.10; CI = –0.093; –0.009). Although the magnitude is modest, this result may indicate that improvements in governance are not yet systematically linked to renewable energy expansion across the BRICS bloc. In several, and important member states, as China and Russian, for example, policy frameworks remain focused on economic growth and energy security rather than sustainability governance [63].
Comparing these dynamic results with the static estimations reveals several important patterns. First, the significance and positive sign of ln re₍ₜ₋₁₎ confirm the presence of strong temporal dependence, an aspect that the static FE and RE models could not capture. Second, while the direction of most coefficients remains consistent across specifications, their magnitudes are generally smaller in the dynamic model, reflecting the adjustment of short-run elasticities after accounting for persistence and endogeneity. Third, the dynamic framework clarifies that social development (captured by ln life) and foreign investment exert more immediate effects on renewable energy adoption than governance quality or trade exposure.
Overall, the FD-GMM results highlight that renewable energy consumption in the BRICS countries is characterized by significant persistence, modest sensitivity to income growth, and positive responses to human development and international capital flows. These findings emphasize the need for integrated policies that combine investment incentives, technological cooperation, and social development strategies to sustain renewable energy transitions in emerging economies.
The joint analysis of the static (FE/RE) and dynamic (FD-GMM) estimations provides a comprehensive understanding of the determinants of renewable energy consumption in the BRICS countries. Across all specifications, economic activity, education, human development, and foreign investment emerge as central drivers of renewable energy dynamics, although their effects vary depending on the temporal and structural context.
The static estimations (FE and RE) primarily capture average cross-country differences and contemporaneous associations. In this setting, higher income levels and trade openness appear to constrain renewable energy use, while education and foreign investment exert positive effects. Conversely, the dynamic model (FD-GMM) reveals how these relationships evolve over time: renewable energy use is highly persistent, and improvements in life expectancy and capital inflows play a stronger role in sustaining renewable growth trajectories. The reversal of the life expectancy effect, from negative in the static models to positive in the dynamic estimation, highlights the importance of temporal feedback mechanisms, where socio-demographic progress eventually reinforces sustainability efforts.
Furthermore, the statistical adequacy of the FD-GMM model, as indicated by valid instruments and the absence of second-order serial correlation, strengthens the robustness of the dynamic findings. Together, these results underscore that the energy transition in the BRICS is not merely a function of current economic conditions but also of cumulative socio-institutional and investment processes that unfold gradually over time.
These results reinforce the importance of understanding not only the macroeconomic determinants but also the internal structure of the energy matrix and the origin of the energy sources. In the case of Brazil, for instance, [64] demonstrate that total energy use results from the interaction between domestic and foreign sources, highlighting that energy policies should account for both structural dependence and the domestic potential for renewables.
Overall, the evidence suggests that accelerating renewable energy adoption within the BRICS requires policies that integrate economic growth, human capital formation, and international cooperation while fostering institutional environments conducive to sustainable investment. The following section deepens this analysis by examining whether these relationships differ between the founding members of the BRICS and the new member countries, allowing for a more nuanced understanding of the heterogeneous pathways toward energy transition within the expanded bloc.
3.4. Comparative Results Between Old and New Members of BRICS
Continuing the analysis conducted for the full panel, this section seeks to identify potential heterogeneities in the determinants of renewable energy consumption between two subgroups within the expanded BRICS bloc: the founding members (Brazil, Russia, India, China, and South Africa) and the newly incorporated countries (Saudi Arabia, Egypt, the United Arab Emirates, Ethiopia, Iran, and Indonesia). To capture these structural differences, a dummy variable (old_brics) was created to distinguish founding members from new entrants, in addition to interaction terms, when necessary, to assess whether the effects of the explanatory variables differ significantly between groups.
This comparative approach is justified by the increasing diversity within the BRICS, not only in terms of economic size and industrial structure, but also with respect to institutional maturity, energy mix composition, and public policy orientation. The founding members, particularly China and India, have historically driven the expansion of renewable energy sources through large-scale investments and technological diffusion [65,66], whereas several of the recently admitted countries remain highly dependent on fossil fuels or are in the early stages of their energy transition.
The estimations follow the same econometric specifications adopted in the previous section: static panel models (Fixed and Random Effects) and dynamic models (FD-GMM), applied separately to each subgroup and, additionally, to the pooled panel with the interaction of the old_brics dummy. This methodological strategy allows for a direct comparison of the magnitude, sign, and statistical significance of the coefficients across groups, while controlling for unobserved heterogeneity and temporal persistence in the series.
The comparison between the founding and new BRICS members therefore aims to determine whether the determinants identified in the aggregate model are uniformly relevant across the bloc, or whether structural, institutional, and developmental asymmetries produce distinct energy transition trajectories. Accordingly, the results presented below offer a deeper understanding of how the recent enlargement of the bloc may influence the global landscape of the energy transition and the internal coherence of the BRICS sustainability agenda.
3.4.1. Application and Analysis of Static Modeling for the Original and New Members of BRICS
Table 9 presents the estimation results for the Fixed Effects (FE) and Random Effects (RE) models for the founding BRICS members (Brazil, Russia, India, China, and South Africa). The FE model shows a within R² of 0.59, indicating that approximately 59% of the variation in renewable energy consumption over time is explained by the independent variables within countries. The F-test (Prob > F = 0.000) confirms the joint significance of the model, suggesting that country-specific effects are indeed relevant.
Among the explanatory variables, GDP per capita exhibits a negative coefficient (–0.20) and is marginally significant (p = 0.084), indicating that economic growth, particularly in its initial stages, remains associated with increased reliance on fossil fuel consumption. Once again, this finding is consistent with the Environmental Kuznets Curve hypothesis, which posits that economic expansion intensifies emissions and the use of non-renewable energy sources until a turning point is reached.
The coefficient for education is positive and statistically significant (p = 0.048), indicating that higher levels of human capital contribute to the expansion of renewable energy consumption. This result reinforces the importance of socio-educational variables in the energy transition process, as highlighted by [60], which identify education as a driver of environmental awareness and technological diffusion.
In contrast, life expectancy and foreign direct investment were not statistically significant, whereas international trade showed a negative coefficient (–0.10; p = 0.11), suggesting that trade openness may be associated, in the short term, with specialization in energy-intensive sectors. This result, consistent with the full-panel analysis, aligns with the Pollution Haven hypothesis [46,47]. The variable capturing institutional governance did not present statistical significance, although its positive sign remains coherent with theoretical expectations.
In the Random Effects (RE) model, the results differ substantially from those obtained under the fixed-effects specification. GDP per capita retains its negative sign but becomes considerably stronger (–1.87; p < 0.01), suggesting that structural differences across countries strongly shape the relationship between economic growth and renewable energy consumption. The education variable remains highly significant and positive (5.34; p < 0.01), reinforcing its central role as a key determinant of the energy transition. In contrast, governance and international trade exhibit negative and statistically significant coefficients, indicating that economic liberalization and institutional fragilities may still constrain the expansion of clean energy sources.
The Hausman test could not be interpreted conclusively, as the result (χ² < 0; negative value) indicates that the variance–covariance matrix is not positive definite. This is a common outcome when strong collinearity exists or when the number of cross-sectional units is small. In such cases, as suggested by [19,67], the choice between FE and RE should rely on theoretical considerations regarding the plausibility of correlation between unobserved heterogeneity and the explanatory variables. Given the substantial structural and institutional heterogeneity within the founding BRICS members, we adopt the fixed-effects (FE) model as the most appropriate specification, as it better captures country-specific dynamics without imposing the assumption of independence between unit-specific effects and the regressors.
Overall, the results for the founding members indicate that the advancement of renewable energy consumption is primarily driven by educational improvements and economic growth patterns, while trade openness and institutional governance still pose challenges. These findings are consistent with previous evidence in the literature [32,62], which highlights the role of structural and social determinants in shaping the energy transition in large and emerging economies.
Applying the same methodology to the recently incorporated members (Saudi Arabia, Egypt, the United Arab Emirates, Ethiopia, Iran, and Indonesia), the fixed-effects model (FE) reports a within R² of 0.49, indicating that approximately 49% of the within-country variation in renewable energy consumption over time is explained by the included explanatory variables. The global F-test (Prob > F = 0.000) confirms the joint significance of the model and supports its statistical adequacy (Table 10).
GDP per capita maintains a negative coefficient (–0.48) and is marginally significant (p = 0.06), suggesting that rising income levels remain associated with higher consumption of fossil-based energy. As observed for the founding members, the results indicate that emerging members still treat energy demand as a strategic priority, often favoring economic expansion over sustainability considerations. Such behavior is consistent with the early phase of the Environmental Kuznets Curve.
The education variable exhibits a strong and highly significant positive effect (3.20; p < 0.01), indicating that improvements in human capital substantially promote the use of renewable energy sources. This result reinforces the literature identifying education as a central driver of technological innovation and the adoption of cleaner energy practices, showing that the population’s educational attainment is closely linked to environmental awareness [68].
Life expectancy displays a negative and statistically significant coefficient (–4.94; p < 0.01), a pattern that diverges from that observed among the founding members. This suggests that, for the new entrants, rising longevity remains tied to total energy consumption, predominantly fossil-based, rather than to a cleaner energy structure. This tendency is typical of petroleum-producing economies such as Saudi Arabia, the United Arab Emirates, and Iran, where social welfare and longevity have historically been achieved through energy subsidies and low fossil fuel prices [69].
Foreign direct investment and international trade both exhibit positive coefficients (0.017 and 0.375, respectively), but neither is statistically significant (p > 0.10), indicating that, although capital flows and trade integration may foster economic interconnectedness, they have not yet produced a discernible impact on the renewable energy mix of these countries. Governance presents a negative but statistically insignificant coefficient (–0.015), reflecting institutional constraints and the still-developing energy policy frameworks present in most of the new BRICS members.
In the Random Effects (RE) model, the results change substantially. GDP per capita becomes strongly negative (–2.56; p < 0.01), while the education variable assumes a negative sign (–1.70; p < 0.10). The sign reversal for education, combined with the increased magnitude of the coefficients, suggests that structural differences across countries, such as whether they are net energy exporters or importers, play a decisive role in shaping the aggregate behavior of these variables. Similarly, life expectancy becomes positive, although not statistically significant, reinforcing that the relationship between human development and sustainability remains unstable within this subgroup.
Once again, the Hausman test produced an inconclusive result (χ² < 0), which prevents direct statistical interpretation and indicates that the model does not satisfy the asymptotic assumptions required by the test. Given this outcome, and considering the structural heterogeneity of the countries in this group, the fixed-effects (FE) specification is adopted for analytical and theoretical coherence, as it more effectively controls for unobserved country-specific effects. This choice is consistent with the literature on heterogeneous energy panels [19,39,67].
Overall, the results for the new BRICS members reveal an energy transition that remains incipient, in which traditional socioeconomic determinants (GDP, trade, investment) do not yet significantly drive the expansion of renewable energy. Education emerges as the principal positive factor, indicating that policies aimed at human capital formation and technological transfer may play a crucial role in building national capacities for sustainability. These findings reinforce the view that the transition trajectory among the new BRICS members is still at an earlier stage than that of the founding countries, characterized by strong fossil-fuel dependence, fragmented institutional frameworks, and limited energy diversification.
3.4.2. Analysis of the Dynamic Model Regarding the Original and New Members of BRICS
From this subsection onward, the results derived from the application of the dynamic panel model (FD–GMM) to the BRICS members, subdivided into founding and newly admitted countries, are presented and analyzed. Table 11 reports the estimates of the first-difference GMM model, computed separately for the founding members and the new members. The objective is to capture the temporal dynamics of renewable energy consumption while controlling for endogeneity among the explanatory variables and the persistence of the dependent variable.
For the founding members, the lagged dependent variable, ln_re(t–1), presents a positive and significant coefficient (0.7882; p < 0.05), confirming the strong temporal inertia of renewable energy consumption. In practice, this indicates that countries that already exhibit higher shares of renewable energy tend to maintain and reinforce this trajectory over time. This finding is consistent with the cumulative nature of clean-energy investments and the transition costs associated with restructuring the energy matrix. Countries such as Brazil and India, for instance, which already exhibit higher shares of renewable sources, continue to expand their renewable capacity over time, thereby accelerating their transition process [63,70,71].
GDP per capita (–0.9331; p < 0.10) retains a negative sign, reinforcing the Environmental Kuznets Curve hypothesis: in intermediate stages of development, economic growth remains largely dependent on fossil-fuel consumption. However, the marginal significance suggests that part of the founding group may be approaching the “descending phase” of the curve, in which higher income levels begin to facilitate the adoption of cleaner technologies.
International trade (ln_trade) exhibits a positive and statistically significant effect (2.1560; p < 0.05), indicating that trade openness and integration into global value chains promote technological diffusion and investment in renewable energy. This result aligns with evidence reported by [72,73], which highlight trade openness as a catalyst for the energy transition in G7 economies. Foreign direct investment (ln_fdi), in turn, shows a positive but statistically insignificant coefficient, suggesting a potential, but still conditional, role depending on domestic institutional environments.
Finally, the governance index (ln_gi) exhibits a positive and significant impact (1.7689; p < 0.05), demonstrating that institutional quality is a key driver of the energy transition. Stronger institutions and stable regulatory frameworks reduce uncertainty, stimulate private investment, and enhance the effectiveness of environmental policies. Founding BRICS members exemplify this profile: Brazil has one of the cleanest energy matrices in the world, while China and India have implemented large-scale renewable investment strategies [1,4,63].
The diagnostic tests indicate no evidence of second-order serial correlation (AR(2) = 0.089 > 0.05) and confirm the validity of the instruments (Hansen = 0.978 > 0.05), supporting the consistency of the model.
Despite the robustness of the estimates, special attention must be given to the omitted variables (ln_educ and ln_life) in the model estimated for the founding members. These variables were automatically dropped by the estimator, a common outcome in first-difference GMM. The omission results from insufficient within-panel variation for these indicators, leading to collinearity between the transformed variables and the generated instruments, an expected behavior in small and relatively homogeneous subpanels. This does not compromise the interpretation of the remaining coefficients nor the validity of the model, provided that the diagnostic tests (Hansen/Sargan and Arellano-Bond) remain satisfactory, as is the case here. Indeed, when the FD–GMM model was re-estimated excluding the omitted variables, the results remained robust, with stable coefficient magnitudes, signs, and diagnostic statistics, reinforcing the reliability of the findings.
Regarding the newly admitted members of the BRICS, the coefficient of the lagged dependent variable, ln_re(t–1), is even higher (1.0014; p < 0.01), indicating an almost perfect persistence in the trajectory of renewable energy consumption. This reflects the strong dependence of these countries’ productive structures on fossil fuels and the slow pace of energy diversification. It is worth noting that most countries in this subgroup are major producers, exporters, and consumers of fossil fuels, such as Saudi Arabia, the United Arab Emirates, and Iran. The remaining countries, with the exception of Ethiopia, also maintain energy matrices heavily dependent on non-renewable sources.
GDP per capita exhibits a positive but statistically insignificant coefficient (0.107), showing that economic growth has not yet translated into an expansion of renewable energy use. In contrast to the founding members, the absence of significance suggests that the new members remain in the early stages of their energy transition, where sustainability policies are not yet integrated into their economic development strategies.
International trade shows a positive but non-significant coefficient (0.1207; p > 0.10), reinforcing the notion that external trade, although relevant, has not yet been sufficient to drive technological diffusion in a manner capable of altering the energy mix. The governance index (–0.0004; p > 0.10) remains negative and insignificant, reflecting institutional fragility and a weak alignment between economic and energy policies.
The diagnostic tests (Sargan = 0.111; Hansen = 0.777; AR(2) = 0.067) indicate that the model is statistically consistent, with no evidence of overidentification or second-order serial correlation.
In summary, the empirical results obtained from the static (Fixed and Random Effects) and dynamic (FD–GMM) models reveal distinct behavioral patterns between the founding members and the newly admitted members of the BRICS. These differences reflect structural asymmetries in economic development, institutional quality, and capacity to advance an energy transition.
In the static models, GDP per capita exhibited a negative and significant relationship with renewable energy consumption, indicating that economic expansion in emerging economies is still strongly tied to fossil-fuel use. This pattern is consistent with the Environmental Kuznets Curve hypothesis, which posits that rising income initially increases environmental degradation before eventually promoting cleaner technologies.
Education and governance displayed significant positive effects in the static models, reinforcing the role of human capital and institutional performance in shaping sustainable energy policies. In contrast, foreign direct investment and international trade showed heterogeneous effects across the two groups, suggesting that their influence depends on the degree of economic openness and institutional maturity in each country.
When temporal dynamics are introduced through the FD–GMM model, results confirm a strong persistence in renewable energy consumption. The coefficient of the lagged dependent variable is positive and highly significant in both groups but is stronger among the new members (1.0014; p < 0.01), indicating pronounced energy inertia and structural dependence on fossil fuels, especially in major oil-exporting economies such as Saudi Arabia, Iran, and the United Arab Emirates.
Among the founding members, international trade and governance exerted positive and significant effects, indicating that institutional performance and trade integration play central roles in advancing renewable energy use. Among the new members, these same variables were positive but statistically insignificant, highlighting institutional and technological gaps that challenge their ability to accelerate the energy transition.
GDP per capita remained negative and marginally significant among the founding members, reinforcing the argument that economic growth alone does not guarantee decarbonization. Among the new members, the coefficient was insignificant, reflecting limited decoupling between growth and emissions.
4. Conclusions
This study examined the determinants of renewable energy consumption in the BRICS, distinguishing the effects between founding members and newly admitted countries through static and dynamic panel models covering the period from 2000 to 2022. The analysis investigated how economic, social, and institutional factors influence the energy transition within the bloc.
The results reveal marked structural differences between the two groups. Among the founding members, economic growth, although still associated with the use of fossil fuels, shows early signs of environmental decoupling, indicating the beginning of the downward phase of the Environmental Kuznets Curve. Institutional governance and trade integration emerged as key drivers of renewable energy expansion, underscoring the role of institutional quality and openness policies in supporting a more sustainable energy model.
Among the new members, the energy transition remains incipient and structurally dependent on fossil fuels. The high persistence of the dependent variable in the dynamic models (coefficient close to 1) indicates strong energy inertia, reflecting economies heavily concentrated in oil and natural gas. Furthermore, governance and international trade do not yet exert a significant influence, suggesting that the institutional and technological conditions required for an effective transition are still under development.
The dynamic estimations also showed that structural variables with low temporal variability, such as education and life expectancy, were automatically omitted by the FD-GMM estimator. Rather than indicating model inconsistency, this behavior reflects the temporal stability of these indicators and their limited explanatory power in the short term. Similar empirical studies confirm that such variables are more appropriately captured in static models, while dynamic models primarily identify short- and medium-term adjustments.
From a methodological standpoint, the diagnostic tests (Hansen, Sargan, and Arellano–Bond) validated the statistical consistency of the estimated models, confirming the robustness of the results.
From a policy perspective, the findings indicate that the advancement of the energy transition within the BRICS depends on institutional strengthening and coordinated public policies that integrate economic development, technological innovation, and environmental sustainability. Strengthening institutional frameworks and expanding intra-bloc cooperation may accelerate the diffusion of renewable technologies and reduce structural asymmetries among countries.
Finally, this study contributes to the literature by providing an unprecedented comparative approach between the founding and newly admitted BRICS members, highlighting the differentiated challenges of the energy transition in emerging economies with distinct productive structures and institutional capacities. Future research may explore the impact of specific policy instruments to promote clean energy, the dynamics of international fossil fuel prices, and the influence of geopolitical variables, further expanding the understanding of the BRICS' role in the global energy transition.
Supplementary Materials
The following supporting information can be downloaded at the website of this paper posted on Preprints.org. a) Supplementary File S1: Complete panel dataset (2000–2022) used in the econometric analysis, including all transformed variables (logarithmic specifications and governance index); b) Supplementary File S2: Stata do-files containing data cleaning, variable construction, descriptive analysis, panel unit root tests, cointegration tests, fixed- and random-effects estimations, and FD-GMM procedures; c) Supplementary File S3: Metadata file describing variable definitions, data sources, and preprocessing procedures. All supplementary materials are hosted in Mendeley Data and can be accessed via the dataset DOI: 10.17632/khcfcsdzrc.1.
Author Contributions
For research articles with several authors, a short paragraph specifying their individual contributions must be provided. The following statements should be used “Conceptualization, M.S.S. and L.O.S.M.; methodology, L.O.S.M.; software, L.O.S.M.; validation, M.S.S. and F.M.F.; formal analysis, F.M.F. and R.G.B.P.; investigation, M.S.S. and E.A.T..; resources, M.S.S.; data curation, L.O.S.M.; writing—original draft preparation, L.O.S.M..; writing—review and editing, M.S.S. and E.A.T..; visualization, M.C.A.M.M. and R.G.B.P.; supervision, E.A.T.; project administration, M.S.S.; funding acquisition, M.S.S. All authors have read and agreed to the published version of the manuscript.
Funding
This research was funded by National Council for Scientific and Technological Development (CNPq), grant number 101803/2024-9. The APC was funded by Federal Institute of Education, Science and Technology of Bahia (IFBA).
Data Availability Statement
The dataset and Stata scripts used in this study are openly available in Mendeley Data at the following DOI: 10.17632/khcfcsdzrc.1. All data employed in the empirical analysis, including the processed panel dataset (2000–2022), variable descriptions, and the complete set of Stata do-files used for the estimation procedures, can be accessed at the link provided. This repository ensures full transparency and reproducibility of the results presented in this article.
Conflicts of Interest
The authors declare no conflicts of interest. The funders had no role in the design of the study; in the collection, analyses, or interpretation of data; in the writing of the manuscript; or in the decision to publish the results.
Abbreviations
The following abbreviations are used in this manuscript:
| CNPq | National Council for Scientific and Technological Development |
| FD-GMM | First-Difference Generalized Method of Moments |
| GDP | Gross Domestic Product |
| PCA | Principal Component Analysis |
| SY-GMM | System Generalized Method of Moments |
References
- Losekann, L.; Tavares, A. ENERGY TRANSITION IN THE BRICS; 2019.
- Pathak, L.; Shah, K. Renewable Energy Resources, Policies and Gaps in BRICS Countries and the Global Impact. Frontiers in Energy 2019, 13, 506–521. [CrossRef]
- Sadorsky, P. Wind Energy for Sustainable Development: Driving Factors and Future Outlook. 2020. [CrossRef]
- Alves, C.T.; Hocevar, L.S.; Martins, L.O.S.; Fernandes, F.M.; Coelho, R.S. Evaluation of Energetic Matrix Scenario Between Brazil, Germany, France and UK to Attend NetZero Expectation: A Bibliometric Analysis. Chem Eng Trans 2023, 100, 583–588. [CrossRef]
- Apergis, N.; Payne, J.E. Renewable and Non-Renewable Energy Consumption-Growth Nexus: Evidence from a Panel Error Correction Model. Energy Econ 2012. [CrossRef]
- Wang, H.; Peng, G.; Luo, Y.; Du, H. Asymmetric Influence of Renewable Energy, Ecological Governance, and Human Development on Green Growth of BRICS Countries. Renew Energy 2023, 206, 1007–1019. [CrossRef]
- Liu, Y.; Xue, S.; Guo, X.; Zhang, B.; Sun, X.; Zhang, Q.; Wang, Y.; Dong, Y. Towards the Goal of Zero-Carbon Building Retrofitting with Variant Application Degrees of Low-Carbon Technologies: Mitigation Potential and Cost-Benefit Analysis for a Kindergarten in Beijing. J Clean Prod 2023, 393. [CrossRef]
- Uddin, I.; Usman, M.; Saqib, N.; Makhdum, M.S.A. The Impact of Geopolitical Risk, Governance, Technological Innovations, Energy Use, and Foreign Direct Investment on CO2 Emissions in the BRICS Region. Environmental Science and Pollution Research 2023, 30, 73714–73729. [CrossRef]
- Ahuja, S.; Kumar, A. How Public Debt and Renewable Energy Influence International Clean Energy Finance: Insights from Low- and Middle-Income Countries with Governance Considerations. Financ Res Lett 2025, 86, 108529. [CrossRef]
- Gyimah, J.; Han, Y.; Yao, X. Renewable Energy Consumption, Good Governance System, Economic Growth, and FDI: The Pathway towards Environmental Quality in European Countries. Energy 2025, 337, 138708. [CrossRef]
- Lubinga, M.H.; Mazenda, A. Empirical Analysis of the Effect of Institutional Governance Indicators on Climate Financing. Economies 2024, 12. [CrossRef]
- Zhao, W.; Gyimah, J.; Yao, X.; Ismaail, M.G.A. Investigating the Role of Good Governance System in Renewable Energy Transition in China and USA. Sustainable Futures 2025, 10, 100943. [CrossRef]
- Nergui, O.; Park, S.; Cho, K.W. Comparative Policy Analysis of Renewable Energy Expansion in Mongolia and Other Relevant Countries. Energies 2024, Vol. 17, Page 5131 2024, 17, 5131. [CrossRef]
- Przychodzen, W.; Przychodzen, J. Determinants of Renewable Energy Production in Transition Economies: A Panel Data Approach. Energy 2020, 191, 116583. [CrossRef]
- Chen, C.; Pinar, M.; Stengos, T. Determinants of Renewable Energy Consumption: Importance of Democratic Institutions. Renew Energy 2021, 179, 75–83. [CrossRef]
- Yadav, A.; Gyamfi, B.A.; Asongu, S.A.; Behera, D.K. The Role of Green Finance and Governance Effectiveness in the Impact of Renewable Energy Investment on CO2 Emissions in BRICS Economies. J Environ Manage 2024, 358, 120906. [CrossRef]
- Feng, C.; Wnag, H.; Lu, N.; Chen, T.; He, H.; Lu, Y.; MTU, X. Correction: Log-Transformation and Its Implications for Data Analysis. Gen Psychiatr 2019, 32, e100146corr1. [CrossRef]
- Benatia, D.; Bellégo, C.; Pape, L. Dealing with Logs and Zeros in Regression Models. 2025.
- Wooldridge, J.M. Introdução à Econometria; Learning, C., Ed.; 4th ed.; Cencage: São Paulo, 2012; ISBN 978-85-221-0446-8.
- IEA Renewables 2025 Dataset; Paris, 2025.
- World Bank Open Data | Data Available online: https://data.worldbank.org/ (accessed on 20 October 2025).
- Jensen, V.M.H. Trade and the Environment : : The Pollution Haven Hypothesis and the Industrial Flight Hypothesis : Some Perspectives on Theory and Empirics; Working paper / Centre for Development and the Environment, University of Oslo ; 1996.5; Oslo, 1996.
- Xing, Y.; Kolstad, C. Environment and Trade: A Review of Theory and Issues. 1996.
- Birdsall, N.; Wheeler, D. Trade Policy and Industrial Pollution in Latin America: Where Are the Pollution Havens? J Environ Dev 1993, 2, 137–149. [CrossRef]
- Zarsky, L. Havens, Halos and Spaghetti: Untangling the Evidence about Foreign Direct Investment and the Environment. In Foreign Direct Investment and the Environment; OECD: Paris, 1999; pp. 47–74 ISBN 9789264171275.
- Eskeland, G.S.; Harrison, A.E. Moving to Greener Pastures? Multinationals and the Pollution Haven Hypothesis. J Dev Econ 2003, 70, 1–23. [CrossRef]
- Costantini, V.; Monni, S. Environment, Human Development and Economic Growth. Ecological Economics 2008, 64, 867–880. [CrossRef]
- Gürlük, S. Economic Growth, Industrial Pollution and Human Development in the Mediterranean Region. Ecological Economics 2009, 68, 2327–2335. [CrossRef]
- EFECTOS DEL DESARROLLO HUMANO EN EL EMPRENDIMIENTO... - REVISTA DYNA MANAGEMENT Available online: https://www.dyna-management.com/busqueda-MN/efectos-del-desarrollo-humano-en-emprendimiento-un-analisis-internacional (accessed on 20 October 2025).
- Dhahri, S.; Omri, A. Entrepreneurship Contribution to the Three Pillars of Sustainable Development: What Does the Evidence Really Say? World Dev 2018, 106, 64–77. [CrossRef]
- Kaufmann, D.; Kraay, A.; Mastruzzi, M. The Worldwide Governance Indicators: Methodology and Analytical Issues. Hague Journal on the Rule of Law 2011, 3, 220–246. [CrossRef]
- Da Silva Almeida, L. Determinantes Del Consumo de Energía Renovable En La Unión Europea: Un Análisis Entre Ue-15 y Los 13 Nuevos Miembros. Revista de Estudios Empresariales. Segunda Época 2022, 94–116. [CrossRef]
- Camacho Ballesta, J.A.; da Silva Almeida, L.; Rodríguez, M. An Analysis of the Main Driving Factors of Renewable Energy Consumption in the European Union. Environmental Science and Pollution Research 2022 29:23 2022, 29, 35110–35123. [CrossRef]
- Pesaran, M.H. A Simple Panel Unit Root Test in the Presence of Cross-Section Dependence. Journal of Applied Econometrics 2007, 22, 265–312. [CrossRef]
- Arellano, M.; Bond, S. Some Tests of Specification for Panel Data: Monte Carlo Evidence and an Application to Employment Equations. Rev Econ Stud 1991, 58, 277. [CrossRef]
- Okajima, S.; Okajima, H. Estimation of Japanese Price Elasticities of Residential Electricity. Energy Econ 2013, 40, 433–440. [CrossRef]
- Martins, L.O.S.; Amorim, I.R. de; Mendes, V. de A.; Silva, M.S.; Mendonça Freires, F.G.; Torres, E.A. Price and Income Elasticities of Industrial Electricity Demand in Brazil: Estimates and Implications of COVID-19. International Journal of Energy Sector Management 2023. [CrossRef]
- Pesaran, M.H. Estimation and Inference in Large Heterogeneous Panels with a Multifactor Error Structure. Econometrica 2006, 74, 967–1012. [CrossRef]
- Baltagi, B.H.; Griffin, J.M. Short and Long Run Effects in Pooled Models. Int Econ Rev (Philadelphia) 1984, 25, 631. [CrossRef]
- Blundell, R.; Bond, S. Initial Conditions and Moment Restrictions in Dynamic Panel Data Models; 1998; Vol. 87.
- Roodman, D. How to Do Xtabond2: An Introduction to Difference and System GMM in Stata; 2009; Vol. 9.
- Hettige, H.; Mani, M.; Wheeler, D. Industrial Pollution in Economic Development: The Environmental Kuznets Curve Revisited. J Dev Econ 2000, 62, 445–476. [CrossRef]
- Stern, D.I. Progress on the Environmental Kuznets Curve? Environ Dev Econ 1998, 3, 173–196. [CrossRef]
- Sadorsky, P. Renewable Energy Consumption and Income in Emerging Economies. Energy Policy 2009, 37, 4021–4028. [CrossRef]
- Aydin, M. Renewable and Non-Renewable Electricity Consumption–Economic Growth Nexus: Evidence from OECD Countries. Renew Energy 2019, 136, 599–606. [CrossRef]
- Birdsall, N.; Wheeler, D. Trade Policy and Industrial Pollution in Latin America: Where Are the Pollution Havens? J Environ Dev 1993, 2, 137–149. [CrossRef]
- Cole, M.A. Trade, the Pollution Haven Hypothesis and the Environmental Kuznets Curve: Examining the Linkages. Ecological Economics 2004, 48, 71–81. [CrossRef]
- Cole, M.A.; Elliott, R.J.R. Determining the Trade–Environment Composition Effect: The Role of Capital, Labor and Environmental Regulations. J Environ Econ Manage 2003, 46, 363–383. [CrossRef]
- Shahbaz, M.; Nasreen, S.; Ahmed, K.; Hammoudeh, S. Trade Openness–Carbon Emissions Nexus: The Importance of Turning Points of Trade Openness for Country Panels. Energy Econ 2017, 61, 221–232. [CrossRef]
- Dossou, T.A.M.; Ndomandji Kambaye, E.; Asongu, S.A.; Alinsato, A.S.; Berhe, M.W.; Dossou, K.P. Foreign Direct Investment and Renewable Energy Development in Sub-Saharan Africa: Does Governance Quality Matter? Renew Energy 2023, 219, 119403. [CrossRef]
- Yan, C.; Ahmed, S.; Solangi, Y.A.; Alyamani, R.; Khoso, W.M. The Nexus between Foreign Direct Investment, Economic Progress, and Quality of Institutions in Fostering Sustainable Energy Efficiency: Evidence from BRICS Economies. Heliyon 2024, 10, e34222. [CrossRef]
- Apergis, N.; Payne, J.E. Renewable Energy Consumption and Growth in Eurasia. Energy Econ 2010, 32, 1392–1397. [CrossRef]
- Inglesi-Lotz, R. The Impact of Renewable Energy Consumption to Economic Growth: A Panel Data Application. Energy Econ 2016, 53, 58–63. [CrossRef]
- Omri, A.; Nguyen, D.K.; Rault, C. Causal Interactions between CO2 Emissions, FDI, and Economic Growth: Evidence from Dynamic Simultaneous-Equation Models. Econ Model 2014, 42, 382–389. [CrossRef]
- Addis, A.K.; Cheng, S. The Nexus between Renewable Energy, Environmental Pollution, and Economic Growth across BRICS and OECD Countries: A Comparative Empirical Study. Energy Reports 2023, 10, 3800–3813. [CrossRef]
- Hlongwane, N.W.; Khobai, H. The Impact of the Renewable Energy Transition on Economic Growth in BRICS Nations. Energies 2025, Vol. 18, Page 4318 2025, 18, 4318. [CrossRef]
- Sinha, A.; Shahbaz, M.; Sengupta, T. Renewable Energy Policies and Contradictions in Causality: A Case of Next 11 Countries. J Clean Prod 2018, 197, 73–84. [CrossRef]
- Shahbaz, M.; Loganathan, N.; Zeshan, M.; Zaman, K. Does Renewable Energy Consumption Add in Economic Growth? An Application of Auto-Regressive Distributed Lag Model in Pakistan. Renewable and Sustainable Energy Reviews 2015, 44, 576–585. [CrossRef]
- Zhao, W.; Gyimah, J.; Yao, X.; Ismaail, M.G.A. Investigating the Role of Good Governance System in Renewable Energy Transition in China and USA. Sustainable Futures 2025, 10, 100943. [CrossRef]
- Michailidis, M.; Zafeiriou, E.; Kantartzis, A.; Galatsidas, S.; Arabatzis, G. Governance, Energy Policy, and Sustainable Development: Renewable Energy Infrastructure Transition in Developing MENA Countries. Energies 2025, Vol. 18, Page 2759 2025, 18, 2759. [CrossRef]
- Wang, Q.; Li, Y.; Li, R. Rethinking the Environmental Kuznets Curve Hypothesis across 214 Countries: The Impacts of 12 Economic, Institutional, Technological, Resource, and Social Factors. Humanit Soc Sci Commun 2024, 11. [CrossRef]
- Apergis, N.; Payne, J.E. Renewable Energy Consumption and Economic Growth: Evidence from a Panel of OECD Countries. Energy Policy 2010, 38, 656–660. [CrossRef]
- Miranda, I.T.P.; Moletta, J.; Pedroso, B.; Pilatti, L.A.; Picinin, C.T. A Review on Green Technology Practices at BRICS Countries: Brazil, Russia, India, China, and South Africa. Sage Open 2021, 11. [CrossRef]
- Rodríguez, M.; Camacho, J.A.; Almeida, L. da S.; Molina, J. Domestic versus Foreign Origin of Total Energy Use: An Analysis for Brazil. Energy Reports 2021, 7, 6327–6337. [CrossRef]
- Inglesi-lotz, R. The Impact of Renewable Energy Consumption to Economic Growth : A Panel Data Application. Energy Econ 2016, 53, 58–63. [CrossRef]
- Ali, S.; Hussain, T.; Zhang, G.; Nurunnabi, M.; Li, B. The Implementation of Sustainable Development Goals in “BRICS” Countries. Sustainability (Switzerland) 2018, 10. [CrossRef]
- Greene, W.H. Econometric Analysis; 8 th ed.; Pearson: New York, 2018; Vol. 1.
- Martins, L.O.S.; Mendes, V. de A.; Silva, M.S.; Hocevar, L.S.; Torres, E.A. Modeling Electricity Consumption from Sugarcane Bagasse in Brazil: 2013 to 2021. Environ Dev Sustain 2024. [CrossRef]
- Al-Mulali, U.; Ozturk, I. The Investigation of Environmental Kuznets Curve Hypothesis in the Advanced Economies: The Role of Energy Prices. Renewable and Sustainable Energy Reviews 2016, 54, 1622–1631. [CrossRef]
- Marques, R.S.; Martins, L.O.S.; Fernandes, F.M.; Silva, M.S.; Freires, F.G.M. Wind Power and Competitiveness: A Bibliometric Analysis. Inf. & Soc.:Est 2020, 30, 1–37.
- Fernandes, F.M.; Martins, L.O.S.; Marques, R.S.; Cunha, F.B.F.; Silva, M.S.; Freires, F.G.M. Metric Studies of Information in Animal Fat Research for Biodiesel Production in Brazil between 2008 and 2019 in the Scope of Web of Science. Revista Gestão Inovação e Tecnologias 2021, 11, 5880–5892. [CrossRef]
- Jiang, Y.; Sharif, A.; Anwar, A.; The Cong, P.; Lelchumanan, B.; Thi Yen, V.; Thi Thuy Vinh, N. Does Green Growth in E-7 Countries Depend on Economic Policy Uncertainty, Institutional Quality, and Renewable Energy? Evidence from Quantile-Based Regression. Geoscience Frontiers 2023, 14. [CrossRef]
- Waseem, M.; Khurshid, N.; Egbe, C.E.; Rashid, M. Energy Transition and Institutional Quality in E-7 Economies: Unveiling Paths to Sustainable Development with CS-ARDL Analysis. Sustainability 2025, Vol. 17, Page 4321 2025, 17, 4321. [CrossRef]
Figure 1.
Average share of renewable energy in the energy mix of BRICS countries. Source: IEA (2025).
Figure 1.
Average share of renewable energy in the energy mix of BRICS countries. Source: IEA (2025).
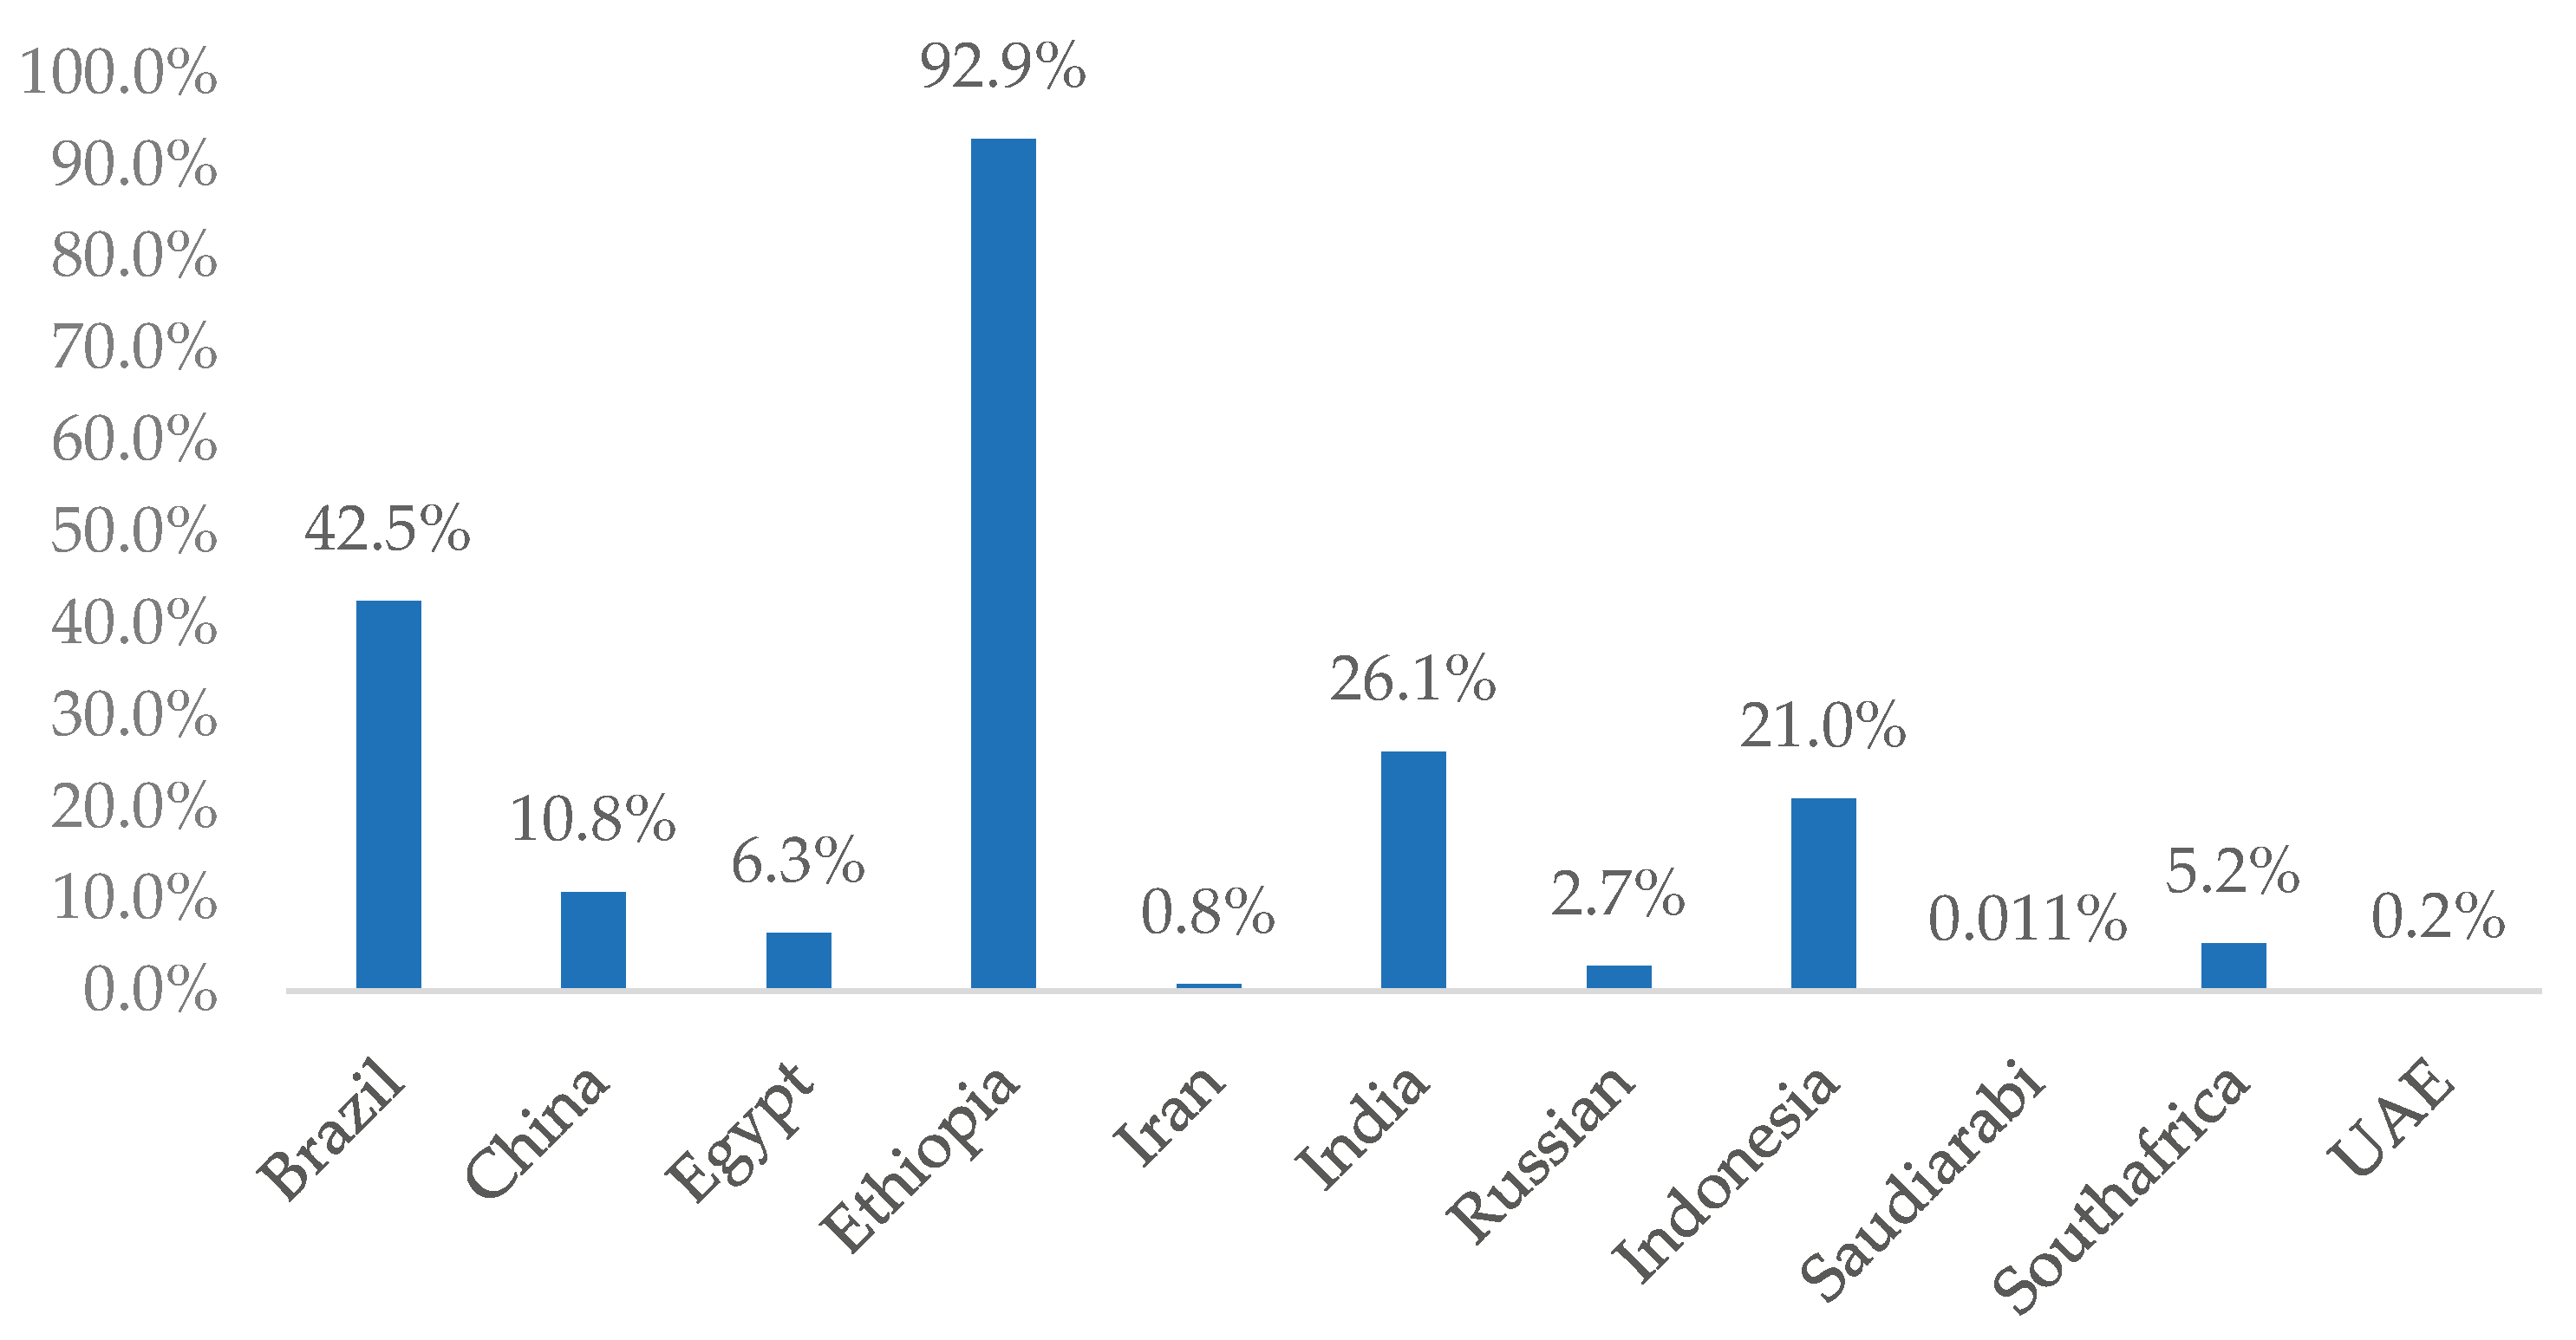

Table 1.
Economic, Social, and Institutional Variables Used in the Analysis of the Energy Transition Process in the BRICS.
Table 1.
Economic, Social, and Institutional Variables Used in the Analysis of the Energy Transition Process in the BRICS.
| Category | Variable | Description | Source |
|---|---|---|---|
| Dependent | ln_re | Natural logarithm of the percentage of renewable energy in total energy consumption. | IEA |
| Economic | ln_gdppp | GDP per capita (in purchasing power parity, constant 2015 prices). | World Bank |
| Economic | ln_fdi | Foreign direct investment (% of GDP). | World Bank |
| Economic | ln_trade | Trade openness (exports + imports / GDP). | World Bank |
| Social | ln_educ | Average years of study. | World Bank |
| Social | ln_life | Life expectancy. | World Bank |
| Institutional | ln_gi | Composite Governance Index (obtained by PCA of the six dimensions). | World Bank |
| Structural | old_brics | Dummy variable: 1 = original BRICS countries; 0 = new members. | Own elaboration |
| Structural | yn | Time trend. | Own elaboration |
Source: IEA (2025) and World Bank (2025).
Table 2.
Results of the First- and Second-Generation Pesaran Tests.
| Second generation | |||
|---|---|---|---|
| Variable | First generation | With trend | Without trend |
| ln_re | -0.8109 (0.2087) | 1.3238 (0.9072) | 1.1325 (0.8713) |
| ln_gdppp | -0.5582 (0.2880) | 0.4378 (0.6692) | 2.9266 (0.9983) |
| ln_fdi | -2.3322 (0.0098) | -2.5586 (0.0053) | -3.4734 (0.0003) |
| ln_trade | -1.2998 (0.0968) | -1.6872 (0.0458) | -0.5325 (0.2972) |
| ln_educ | 2.1756 (0.9852) | 2.9911 (0.9986) | -0.2592 (0.3978) |
| ln_life | -1.2234 (0.1106) | -2.5935 (0.0048) | 1.0616 (0.8558) |
| ln_gi | 0.3560 (0.6391) | -2.4832 (0.0065) | -3.0205 (0.0013) |
Source: Survey data. The values in the table represent the test statistic values and the P-values (in parentheses).
Table 3.
Descriptive statistics of the study variables.
| Variable | Observations | Mean | Std. Error | Min. | Max. |
|---|---|---|---|---|---|
| ln_re | 253 | -3.276 | 2.569 | -9.315 | -0.045 |
| ln_gdppp | 253 | 9.530 | 1.053 | 6.690 | 11.464 |
| ln_educ | 253 | 2.500 | 218 | 1.439 | 2.830 |
| ln_life | 253 | 4.248 | 101 | 3.929 | 4.413 |
| ln_fdi | 243 | 22.821 | 1.811 | 16.793 | 26.564 |
| ln_trade | 253 | -667 | 438 | -1.509 | 0.636 |
| ln_gi | 245 | 848 | 893 | -2.780 | 2.103 |
| ln_relag1 | 242 | -3.283 | 2.579 | -9.315 | -0.044 |
Source: Original elaboration based on research data.
Table 4.
Correlation matrix between the research variables.
| ln_re | ln_gdppp | ln_educ | ln_life | ln_fdi | ln_trade | ln_gi | ln_relag1 | |
|---|---|---|---|---|---|---|---|---|
| ln_re | 1 | |||||||
| ln_gdppp | -0.7827 | 1 | ||||||
| ln_educ | -0.2801 | 0.6225 | 1 | |||||
| ln_life | -0.5304 | 0.6968 | 0.4855 | 1 | ||||
| ln_fdi | 0.2178 | 0.1435 | 0.5161 | 0.3729 | 1 | |||
| ln_trade | -0.6569 | 0.5043 | -0.1547 | 0.2964 | -0.2673 | 1 | ||
| ln_gi | -0.2853 | 0.4846 | 0.3359 | 0.3243 | 0.2753 | 0.2973 | 1 | |
| ln_relag1 | 0.9988 | -0.7862 | -0.2819 | -0.5362 | 0.2158 | -0.6619 | -0.2903 | 1 |
Source: Research data.
Table 5.
Stationarity tests (BRICS panel – 2000 to 2022).
| Variable | LLC (t) | IPS (z) | ADF-Fisher (p) | PP-Fisher (p) | Integration order |
|---|---|---|---|---|---|
| ln_re | -1.3591 (0.0871) | 1.8121 (0.9650) | 16.4955 (0.7906) |
13.8046 (0.9385) |
(|(0)) |
| ln_gdppp | -1.5406 (0.0617) | 0.6069 (0.7280) | 22.2509 (0.4450) |
9.1140 (0.9927) |
(|(0)) |
| ln_educ | -0.6072 (0.2719) | 2.5511 (0.9946) | 13.0195 (0.9326) |
7.9301 (0.9973) |
(|(0)) |
| ln_life | -16.9945 (0.0000) | -5.5717 (0.0000) |
124.8200 (0.0000) |
18.9201 (0.6503) |
(|(0)) |
| ln_fdi | -1.095 (0.1316) | -0.7299 (0.2327) |
33.5008 (0.0552) |
75.1535 (0.0000) |
(|(0)) |
| ln_trade | -3.2291 (0.0006) | -2.1714 (0.0149) |
49.9854 (0.0006) |
24.6897 (0.3121) |
(|(0)) |
| ln_gi | -0.9840 (0.1623) | -0.5045 (0.3070) |
31.0801 (0.0945) |
24.4906 (0.3220) |
(|(0)) |
Source: Research data. The results of the LLC, IPS, ADF-Fisher and PP-Fisher tests indicate that most variables have a unit root at level (p > 0.05) and become stationary after the first differentiation (p < 0.05), characterizing them as integrated of order one, I(1).
Table 6.
Kao test for cointegration (BRICS panel – 2000 to 2022).
| Statistics | p-value | |
|---|---|---|
| Modified Dickey-Fuller t | -0.6727 | 0.2506 |
| Dickey-Fuller t | -0.7408 | 0.2294 |
| Augmented Dickey-Fuller t | -0.7909 | 0.2145 |
| Unadjusted modified Dickey-Fuller t | -0.9421 | 0.1731 |
| Unadjusted Dickey-Fuller t | -0.9021 | 0.1835 |
Source: Research data. The cointegration test (Kao) did not indicate evidence of a long-term equilibrium relationship between the series (p > 0.05). Therefore, the variables are treated as non-cointegrated I(1) processes, and subsequent estimations were conducted using dynamic static panel models (FD-GMM), suitable for capturing short- and medium-term effects.
Table 7.
Results of static models (Fixed Effects vs. Random Effects) in the BRICS countries.
| Variable | FE – Coef. | Std. Error | RE – Coef. | Std. Error |
|---|---|---|---|---|
| ln_gdppp | -0.9070*** | 0.0991 | -0.9569*** | 0.0983 |
| ln_educ | 2.3197*** | 0.2482 | 2.3625*** | 0.2494 |
| ln_life | -2.6636*** | 0.5946 | -2.6954*** | 0.6213 |
| ln_fdi | 0.03676** | 0.0182 | -0.0429** | 0.0483 |
| ln_trade | -0.0871* | 0.0474 | -0.1192* | 0.0512 |
| ln_gi | 0.0299 | 0.0379 | 0.0286 | 0.0371 |
| Constant | 10.0138*** | 2 | 10.3070*** | 2.1477 |
| Model Statistics | FE | RE | ||
| R2 (Within) | 0.3854 | 0.3849 | ||
| R2 (Between) | 0.6917 | 0.6976 | ||
| Observations | 235 | 235 | ||
| Number of countries | 11 | 11 | ||
| F – test (FE model) | 22.78*** | - | ||
| Wald χ2 (RE model) | - | 147.33*** | ||
| Hausman test | χ2(Ϭ)=12.25*** | - | ||
Source: Data of research. The regressions were estimated using panel data for each country from 2000 to 2022. The coefficients are significant at the level of 1% (***), 5% (**), and 10% (*).
Table 8.
Results of the dynamic model (FD - GMM) in the BRICS countries.
| Variable | Coef. | Std. Error | Conf. Interval (95%) |
|---|---|---|---|
| ln_re₍ₜ₋₁₎ | 0.8674*** | 0.0678 | 0.7344 to 1.000 |
| ln_gdppp | -0.2897*** | 0.0950 | -0.4760 to – 0.1035 |
| ln_educ | 0.0695 | 0.2771 | -0.4736 to 0.6128 |
| ln_life | 1.8353*** | 0.2926 | 1.2618 to 2.4088 |
| ln_fdi | 0.0262*** | 0.0109 | 0.0047 to 0.0477 |
| ln_trade | -0.0544 | 0.0755 | -0.2025 to 0.0937 |
| ln_gi | -0.0419* | 0.0261 | -0.0931 to 0.0092 |
| Observations | 209 | ||
| Sargan test | 0.535 | ||
| Hansen test | 0.704 | ||
| AR(1) | 0.046 | ||
| AR(2) | 0.224 |
Source: Data of research. The regression were estimated using panel data for each country from 2000 to 2022. The coefficients are significant at the level of 1% (***), 5% (**), and 10% (*).
Table 9.
Results of static models (Fixed Effects vs. Random Effects) for the original BRICS members (Brazil, Russia, India, China, and South Africa).
Table 9.
Results of static models (Fixed Effects vs. Random Effects) for the original BRICS members (Brazil, Russia, India, China, and South Africa).
| Variable | FE – Coef. | Std. Error | RE – Coef. | Std. Error |
|---|---|---|---|---|
| ln_gdppp | -0.2002* | 0.1147 | -1.8788*** | 0.1428 |
| ln_educ | -0.7680** | 0.3830 | 5.3430*** | 0.6609 |
| ln_life | -0.2368 | 0.3935 | -2.0112** | 0.8507 |
| ln_fdi | 0.0024 | 0.0173 | 0.0819** | 0.0400 |
| ln_trade | -0.1026 | 0.0921 | -2.3011*** | 0.1333 |
| ln_gi | 0.1304 | 0.0812 | -0.4539*** | 0.1187 |
| Constant | 2.3832* | 1.3469 | 6.8448** | 2.7228 |
| Model Statistics | FE | RE | ||
| R2 (Within) | 0.5901 | 0.1067 | ||
| R2 (Between) | 0.2718 | 0.9872 | ||
| Observations | 114 | 114 | ||
| Number of countries | 5 | 5 | ||
| F – test (FE model) | 194.44*** | - | ||
| Wald χ2 (RE model) | - | 975.08*** | ||
| Hausman test | - | - | ||
Source: Data of research. The regressions were estimated using panel data for each country (old members) from 2000 to 2022. The coefficients are significant at the level of 1% (***), 5% (**), and 10% (*).
Table 10.
Results of static models (Fixed Effects vs. Random Effects) for the emerging members of BRICS (Saudi Arabia, Egypt, United Arab Emirates, Ethiopia, Iran, and Indonesia).
Table 10.
Results of static models (Fixed Effects vs. Random Effects) for the emerging members of BRICS (Saudi Arabia, Egypt, United Arab Emirates, Ethiopia, Iran, and Indonesia).
| Variable | FE – Coef. | Std. Error | RE – Coef. | Std. Error |
|---|---|---|---|---|
| ln_gdppp | -0.4838* | 0.2548 | -2.5626*** | 0.3766 |
| ln_educ | 3.2082*** | 0.3516 | -1.7001 | 1.0752 |
| ln_life | -4.9456*** | 1.2790 | 6.0383 | 4.3589 |
| ln_fdi | 0.0177 | 0.2757 | 0.4496*** | 0.1071 |
| ln_trade | 0.3756** | 0.1791 | -0.5752 | 0.4507 |
| ln_gi | -0.0152 | 0.0496 | 0.3921** | 0.1746 |
| Constant | 13.6576*** | 4.3530 | -11.4432 | 14.9152 |
| Model Statistics | FE | RE | ||
| R2 (Within) | 0.4940 | 0.0132 | ||
| R2 (Between) | 0.4404 | 0.8444 | ||
| Observations | 121 | 121 | ||
| Number of countries | 6 | 6 | ||
| F – test (FE model) | 543.97*** | - | ||
| Wald χ2 (RE model) | - | 489.89*** | ||
| Hausman test | - | - | ||
Source: Data of research. The regressions were estimated using panel data for each country (new members) from 2000 to 2022. The coefficients are significant at the level of 1% (***), 5% (**), and 10% (*).
Table 11.
Results of the dynamic model (FD – GMM) for the BRICS countries (old and new members).
| Variable | Old members | New members | ||
|---|---|---|---|---|
| Coef. /Std. Error | Conf. Interval (95%) | Coef. /Std. Error | Conf. Interval (95%) | |
| ln_re₍ₜ₋₁₎ | 0.7882** (0.3522) |
0.0978 to 1.4785 | 1.0014*** (0.0305) |
0.9414 to 1.0613 |
| ln_gdppp | -0.9331* (0.5397) |
-1.9909 to 0.1246 | -0.0517 (0.1172) |
-0.2815 to 0.1781 |
| ln_educ | 0 | omitted | 0.0670 (0.1446) |
-0,2165 to 0.3505 |
| ln_life | 0 | omitted | 0.4277 (0.8990) |
-1.3342 to 2.1897 |
| ln_fdi | 0.2101 (0.1290) |
-0.0428 to 0.4631 | 0.0201 (0.0684) |
-0.0134 to 0.2549 |
| ln_trade | 2.1560** (1.0472) |
0.1034 to 4.2087 | 0.1207* (0.0284) |
-0.0134 to 0.2549 |
| ln_gi | 1.7689** (0.8532) |
0.0966 to 3.4412 | -0.0004 (2.9896) |
-7.7047 to 4.0143 |
| Observations | 104 | 117 | ||
| Sargan test | 0.111 | 0.777 | ||
| Hansen test | 0.978 | 0.406 | ||
| AR(1) | 0.003 | 0.000 | ||
| AR(2) | 0.089 | 0.067 | ||
Source: Data of research. The regressions were estimated using panel data for each country (old members and new members) from 2000 to 2022. The coefficients are significant at the level of 1% (***), 5% (**), and 10% (*). The standard error results are shown in parentheses.
Disclaimer/Publisher’s Note: The statements, opinions and data contained in all publications are solely those of the individual author(s) and contributor(s) and not of MDPI and/or the editor(s). MDPI and/or the editor(s) disclaim responsibility for any injury to people or property resulting from any ideas, methods, instructions or products referred to in the content. |
© 2025 by the authors. Licensee MDPI, Basel, Switzerland. This article is an open access article distributed under the terms and conditions of the Creative Commons Attribution (CC BY) license (http://creativecommons.org/licenses/by/4.0/).
Copyright: This open access article is published under a Creative Commons CC BY 4.0 license, which permit the free download, distribution, and reuse, provided that the author and preprint are cited in any reuse.


