
Submitted:
19 November 2025
Posted:
21 November 2025
You are already at the latest version
Abstract
Aquaculture plays a crucial role in ensuring global food security; however, it continues to face persistent challenges, including water quality degradation, delayed disease detection, and inefficient manual monitoring practices. To address these limitations, this study presents an intelligent aquaculture monitoring system that integrates Internet of Things (IoT) and Artificial Intelligence (AI) technologies to enable real-time, data-driven management of aquaculture environments. The system architecture combines ESP32-CAM microcontrollers equipped with temperature and pH sensors for continuous environmental monitoring and a mobile application for visualization and alerts. A lightweight YOLOv8n model was trained on a publicly available fish disease dataset to automatically detect six common fish diseases, achieving an overall mean Average Precision (mAP@0.5) of 0.983, with balanced precision and recall across all categories. Experimental results demonstrate the system’s ability to provide timely alerts, reliable sensing, and accurate disease classification in resource-constrained environments. By uniting IoT-based sensing with AI-driven diagnostics, the proposed system enhances operational efficiency, supports early intervention, and contributes to more sustainable and resilient aquaculture practices.
Keywords:
aquaculture monitoring
; Internet of Things (IoT)
; Artificial Intelligence (AI)
; fish disease detection
; YOLOv8n
1. Introduction
Aquaculture is one of the fastest-growing food production sectors, crucial for meeting global protein demand and strengthening food security [1,2]. Yet, traditional practices remain constrained by labor-intensive monitoring, inconsistent water-quality control, and delayed responses to environmental changes [3,4], increasing disease risk and resource inefficiency [5].
Manual visual inspection of fish health is subjective and costly [6], while intermittent water-quality checks overlook rapid parameter shifts such as pH or temperature fluctuations [7]. Moreover, the lack of integrated data management limits long-term analysis and proactive decision-making [3], leading to stock losses and reduced efficiency, particularly in small- and medium-scale farms.
Recent advancements in the IoT have revolutionized aquaculture through real-time, data-driven monitoring and control of aquatic environments. IoT-based systems integrate sensor networks, actuators, and cloud or edge analytics to continuously track key water quality parameters, including temperature, dissolved oxygen, pH, turbidity, and ammonia.
These systems enable early anomaly detection and automated responses, improving operational efficiency and sustainability. The integration of Artificial Intelligence and Edge Computing known as the Artificial Intelligence of Things (AIoT) further enhances system intelligence and responsiveness. AI models support water quality prediction, feeding optimization, and early disease detection, while edge processing reduces latency and dependence on cloud connectivity, which is crucial in remote settings. However, challenges remain in scalability, energy efficiency, sensor precision, and AI model generalize on across species and environments. To address these limitations, this study develops and evaluates an IoT-based intelligent aquaculture monitoring system combining real-time sensing, AI-driven decision-making, and automated actuation.
The proposed system employs industrial-grade pH and temperature sensors linked to ESP32-CAM microcontrollers with Wi-Fi transmission to a cloud backend at five-minute intervals. A threshold-based alert mechanism identifies critical deviations, while an integrated vision module captures fish images analyzed in real time using an optimized YOLOv8n model trained on seven common diseases. This modular, low-cost, and scalable framework demonstrates a practical solution for sustainable aquaculture through enhanced environmental monitoring and early disease detection.
The remainder of this paper is organized as follows: Section 2 provides a review of relevant prior work in the field of aquaculture monitoring, highlighting key contributions and existing challenges. Section 3 offers a concise overview of the proposed aquaculture monitoring system, outlining its main components and functionalities. In Section 4, we detail the implementation of the system and present the validation results, accompanied by critical analysis and discussion. Finally, the paper concludes with Section 5, where we summarize the main findings and suggest potential directions for future research.
2. Related Works
In recent years, the convergence of Internet of Things, artificial intelligence and edge computing technologies has significantly advanced intelligent aquaculture monitoring systems, aiming to enhance productivity, optimize environmental conditions and reduce manual labour and resource waste. Tsai et al. [8] developed an IoT-based smart aquaculture system integrating wireless sensors for temperature, pH, dissolved oxygen and water hardness with fuzzy-logic-based aeration and feeding control, achieving a 33.3% increase in shrimp survival compared with conventional systems. Jais et al. [9] improved the accuracy of low-cost IoT sensors for Asian seabass aquaculture through simple linear regression calibration, obtaining accuracies from 76% to 97% and relative errors from 0.27% to 4%. In resource-constrained settings, Nguyen et al. [10] introduced an edge computing model combining IoT sensors (temperature and pH) with an LSTM algorithm for real-time water quality forecasting, emphasising high reliability and responsiveness. Saosing and Nattawuttisit [11] designed a vision-based monitoring system for red claw crayfish post-larvae using ESP32 cameras and YOLOv5s on Raspberry Pi, achieving F1 scores from 0.85 to 0.93 depending on lighting and molting conditions. Wan et al. [12] proposed a modular, low-cost IoT system for aquaponic farming using environmental sensors and a smart camera within a three-tier edge-cloud architecture, focusing on scalability and cost effectiveness. Huang and Khabusi [13] reviewed “AIoT” applications in aquaculture, identifying challenges such as species-specific models, sensor degradation, lack of multimodal data and standard benchmarks. Razali [14] combined IoT sensors (temperature, turbidity, dissolved oxygen and water level) with a Random Forest classifier to categorise pond water conditions, reaching 92.3% accuracy and enabling automated aeration and water exchange. Eso et al. [15] implemented an IoT-based system for Litopenaeus vannamei ponds, with sensors yielding accuracies of 98.30–99.71% and real-time monitoring via MQTT dashboards. Temilolorun and Singh [16] developed a low-cost unmanned surface vehicle (USV) for shallow-water aquaculture, integrating GPS, IMU, GNSS and water sensors under ROS and EKF-based fusion, validated for manoeuvrability and low-cost operation.
Collectively, these works illustrate promising directions embedding ML models within IoT infrastructures, improving sensor precision, and adopting autonomous platforms yet highlight the need for scalable, multimodal, and standardized approaches across diverse aquaculture contexts. Building upon these advancements, the proposed system addresses remaining gaps by integrating IoT sensing and AI-driven vision analytics within a modular edge cloud architecture to enhance real-time decision-making, disease detection, and operational sustainability.
3. Aquaculture Monitoring System
The proposed intelligent aquaculture monitoring system is developed to address two fundamental challenges in contemporary fish farming: real-time water quality management and early detection of disease outbreaks. This integrated approach leverages Internet of Things sensing technologies in conjunction with artificial intelligence algorithms to establish a proactive, data-driven monitoring framework. By automating processes that have traditionally relied on manual observation, the system significantly reduces labor requirements while improving the accuracy and responsiveness of interventions to critical environmental changes.
3.1. System Overview
The aquaculture monitoring system employs a three-tiered architecture combining edge sensing, cloud analytics, and mobile visualization.
As depicted in Figure 1, the system features:
- Continuous monitoring of environmental conditions (pH, temperature via ESP32- CAM)
- Vision-based disease detection (YOLOv8n model processing ESP32-camera feeds)
- Centralized data management (Node.js backend with MongoDB storage)
- Mobile access (React Native dashboard for operational alerts)
3.2. AI Model Development
The YOLOv8n (nano) model is a real-time object detection architecture derived from the broader YOLO (You Only Look Once) family of models, which are designed to detect and classify objects within a single forward pass of the input image [17]. This approach enables efficient inference by eliminating the need for multiple passes or region proposal steps, making it particularly suitable for deployment in resource-constrained environments [18]. YOLOv8n was selected in this context following a thorough benchmarking process, primarily due to its edge-optimized design, with a quantized TensorFlow Lite model size of only 2.3MB [19]. Despite its lightweight nature, the model achieves a competitive accuracy, reporting 91% mean Average Precision (mAP) at an Intersection over Union (IoU) threshold of 0.5, while maintaining real-time performance at 22 frames per second (FPS) on an ESP32-CAM [19,20]. Furthermore, the model was adapted specifically for aquaculture applications through the integration of custom anchor boxes tailored to fish morphology and the use of a class-balanced dataset, enhancing its detection capabilities for domain-specific tasks [21]. Among its key advantages, YOLOv8n also features improved architectural components such as decoupled head design for separate classification and regression tasks, native support for quantization and ONNX export, and a modular, PyTorch-based codebase that facilitates rapid customization and deployment [22,23]. Its robustness, versatility across platforms, and reduced computational footprint make it a strong candidate for intelligent sensing systems in embedded and edge AI applications [24].The Freshwater Fish Disease Aquaculture in South Asia dataset, available on Kaggle, is a comprehensive collection of annotated images designed to support the development and evaluation of machine learning models for fish disease detection.This dataset includes high-quality images categorized into several classes representing common fish health conditions such as bacterial diseases (Aeromoniasis, Gill disease, Red disease), fungal diseases (Saprolegniasis), parasitic diseases, viral diseases (White tail disease), and healthy fish (Figure 2).
The dataset’s diversity in disease types and fish species is particularly valuable for aquaculture applications, enabling robust training of object detection and classification models tailored to aquatic environments.
With its extensive annotations and class balance, this dataset provides a vital resource for advancing automated fish health monitoring systems, particularly in resource-constrained settings common in South Asia. The dataset is publicly accessible via Kaggle [25].
The fish disease detection module employs the YOLOv8n (Nano) variant, a lightweight and efficient object detection model specifically optimized for real-time classification tasks in aquaculture settings. To ensure optimal detection performance while maintaining low computational overhead, the model was trained using a tailored configuration. The training setup utilized the pre-trained weights, with a total of 70 trainings epochs and an input image resolution of 640× 640 pixels. Model training and validation were conducted on a Tesla T4 GPU, allowing for accelerated processing and improved convergence. This configuration balances detection accuracy with computational efficiency, making it suitable for deployment in edge-based aquaculture monitoring systems.
3.3. UML Design
To ensure clear and effective communication among hardware developers, software engineers, and other project stakeholders, the system architecture was modeled using the Unified Modeling Language (UML). UML provides a standardized visual representation that facilitates the understanding of complex system components and their interactions. In this context, three core UML diagrams were developed to capture the essential aspects of system functionality: a use case diagram to outline user interactions, a sequence diagram to represent dynamic behavior over time, and a class diagram to illustrate the system’s static structure. These diagrams collectively support interdisciplinary collaboration and serve as a foundational reference throughout the system development life cycle.
The Use Case Diagram (Figure 3) depicts the primary interactions between farm managers and the aquaculture monitoring platform. The system supports several core functionalities designed to assist in daily operational decision-making. First, managers can monitor water quality by accessing real-time pH and temperature data collected from environmental sensors.
Second, the platform leverages an integrated AI-based detection module to automatically identify six common fish diseases, reducing the need for manual inspection.
Third, users can review historical data, including sensor readings from the past 30 days, enabling trend analysis and retrospective assessment.
Lastly, the platform provides passive alert notifications, whereby localized warning such as abnormal water conditions or disease risk are automatically displayed when the user opens the application. These use cases collectively demonstrate how the system enhances responsiveness and decision support in aquaculture environments. The Class Diagram (Figure 4) presents the structural architecture and core components of the aquaculture monitoring system, emphasizing the roles and relationships among the system’s primary entities. At the edge level, the ESP32 device is responsible for environmental sensing and image acquisition; it measures key water quality parameters such as pH and temperature, captures images of fish within the tank, and transmits all collected data to the cloud infrastructure. The Cloud Server acts as the central processing unit of the system: it receives sensor readings and image data from the ESP32, executes automated disease detection using an integrated AI model, and stores the results in a MongoDB database for persistence and future access. The AI Model deployed within the cloud analyzes incoming images to detect six common fish diseases and returns diagnostic results to the server. Finally, the Farmer’s Mobile Application retrieves these results, providing real-time alerts and visual notifications related to water quality anomalies or signs of fish illness. This object-oriented structure ensures modularity, scalability, and seamless communication across system components.
The Sequence Diagram (Figure 5) illustrates the sequential flow of interactions that culminate in the delivery of alert notifications to the farmer. The process begins with environmental sensors collecting real-time water quality data, such as pH and temperature. Simultaneously, images of the fish are captured and analyzed by the AI model to detect signs of six common diseases. The outcomes of both the sensor readings and image-based diagnostics are stored in a centralized cloud database.
The farmer’s mobile application is configured to periodically query the cloud server at five-minute intervals to retrieve any newly generated alerts. Upon retrieval, these alerts are immediately displayed within the application interface, allowing the farmer to receive timely warnings regarding abnormal water conditions or potential disease outbreaks. This workflow ensures proactive farm management through automated, near real time monitoring and decision support.
4. System Implementation and Validation
4.1. Hardware Design
The ESP32-CAM collects sensor data and images, transmitting them via WiFi to a Node.js backend. The server processes the data and runs fish disease detection using an optimized YOLOv8n (TFLite) model. Results are then delivered to a React Native mobile application for real-time visualization and alert notifications, completing the integrated workflow (Figure 6) from sensors to user interface.
4.1. Hardware Setup
The hardware subsystem is built around the ESP32-CAM module, which combines a microcontroller, camera, and sensor interfaces for environmental monitoring. Due to the unavailability of a physical pH sensor during development, a potentiometer was used to simulate analog pH sensor input for testing and calibration purposes. Figure 7 illustrates this provisional setup, including connections to the potentiometer (pH simulation) and DHT11 temperature sensor.
5. Results and Discussions
The serial monitor output (Figure 8) provides a detailed account of the system’s initialization and operational sequence, capturing the real-time log of events from boot to full connectivity. The process begins with the boot sequence, where firmware loading is verified (load:0x40080400, len:4), followed by confirmation of successful entry into the main execution program (entry 0x40080504). Subsequently, the system proceeds to the hardware initialization phase. During this stage, the onboard camera module is initialized and confirmed to be operational, as indicated by the message “Camera initialized successfully.” The device then initiates a Wi-Fi connection procedure, displaying progressive status updates: an initial connection attempt (“Connecting to WiFi..”), successful network access (“Connected to WiFi”), and finally the assignment of a local IP address (“IP address: 192.168.2.133”). These outputs collectively validate the correct functioning of the embedded system components and establish readiness for data acquisition and transmission.
The performance metrics presented in Table 1 offer a comprehensive evaluation of the YOLOv8n model’s effectiveness in detecting various fish diseases under real-world aquaculture conditions. The overall mean Average Precision at IoU threshold 0.5 (mAP@0.5) of 0.983 indicates that the model is highly accurate in localizing disease regions within the images.
Moreover, the high overall precision (0.969) suggests that the model produces very few false positives, while the recall (0.912) confirms its ability to identify most disease instances present in the dataset. At the class level, the model exhibits notably strong generalization across diverse pathological conditions, which often differ in visual manifestation, scale, and contrast.
For instance, Bacterial Gill Disease recorded the highest mAP@0.5 (0.993), along with balanced precision (0.952) and recall (0.971), indicating that the model not only detects this condition with excellent accuracy but does so consistently across multiple samples. Similarly, Fungal Saprolegniasis yielded a mAP@0.5 of 0.991, further affirming the model’s robustness in identifying morphologically distinct fungalinfections.
Although Bacterial Aeromoniasis achieved the highest precision (0.992), it showed a comparatively lower recall (0.866), implying that while most of its detections were accurate, some true cases went undetected potentially due to intra-class variability or occlusion in the dataset. Viral White Tail Disease and Parasitic Infections also maintained high precision (>0.94) but showed slightly reduced recall values (<0.91), suggesting the need for additional training samples or improved augmentation strategies to further enhance sensitivity. Interestingly, the Healthy Fish class achieved relatively lower precision (0.930) and recall (0.889) compared to disease classes. This may be attributed to subtle visual differences between early-stage infections and healthy tissue, making it more difficult for the model to draw a clear distinction. In practical terms, a slight over-detection of disease in healthy specimens is preferable in early-warning systems, as it favors sensitivity over specificity, aligning with preventive goals in aquaculture health management.
Overall, the class-wise performance distribution underscores the model’s effectiveness in handling multi-class detection tasks, even in resource-constrained environments.
The combination of high mAP and balanced precision-recall trade-offs across categories confirms that YOLOv8n is well-suited for deployment in real-time fish health monitoring applications, where both accuracy and responsiveness are critical.
Where :
TP (True Positives): Number of correctly predicted positive instances.
FN (False Negatives): Number of actual positive instances that were missed by the model.
The Dashboard screen displays real-time environmental parameters captured by the sensors, such as temperature and pH level. These values are retrieved from the cloud and updated dynamically in the mobile application.
The User Interface (UI) is designed to be clean and intuitive, with visual indicators to help users quickly assess the current state of the aquaculture environment. A screenshot of the dashboard is included below (Figure 9) to illustrate the layout and data presentation.
The serial monitor output documents the system’s initialization and operation, from firmware loading and program entry to hardware setup and network connectivity.
The camera module initializes successfully, followed by Wi-Fi connection and IP assignment (“IP address: 192.168.2.133”), confirming system readiness for data acquisition and transmission. The alert system notifies users when thresholds are exceeded such as abnormal temperature or disease detection through on-screen and push notifications, enabling rapid corrective action to prevent water imbalance and fish health deterioration.
The alert screen screenshot (Figure 10) demonstrates how critical and non-critical alerts are visually differentiated to draw attention to the most urgent issues. One of the key features of the application is the Fish Disease Detection module. This screen shows the output from the AI model, which analyzes images or data patterns to determine whether fish might be suffering from specific illnesses.
Users can view recent analysis results, confidence scores, and suggested actions. The detection results are synced from the backend and presented in a structured format, often accompanied by visuals. A screenshot of this feature is provided (Figure 11) to demonstrate how predictions are displayed, including the type of disease (if detected), the AI confidence level, and timestamps of detection events.
Table 2 presents a comparative summary of recent intelligent aquaculture monitoring systems, highlighting their technological frameworks, monitored parameters, applied models, and performance indicators. Early works, such as Tsai et al. [9], primarily focused on IoT-integrated fuzzy control systems for regulating environmental parameters (temperature, pH, DO, and hardness). Their approach improved shrimp survival rates by 33%, emphasizing process automation (feeding and aeration). However, the absence of AI-based health or disease detection limited the system’s diagnostic capability. Subsequently, Nguyen et al. [11] incorporated edge IoT with LSTM forecasting to predict water quality trends. While this method offered high reliability and rapid response, it remained constrained to temporal predictions without visual analytics or disease recognition.
Advancements toward vision-based monitoring were introduced by Saosing and Nattawuttisit [12], who employed YOLOv5s for fish behavior and counting. Despite achieving strong F1-scores (0.85–0.93), performance was sensitive to illumination variations, suggesting a need for more robust detection models under dynamic lighting conditions. In Razali et al. [15], an IoT and Random Forest integration enhanced classification accuracy (92.3%) for water quality assessment. Yet, this model was limited to one-dimensional sensor data, excluding multimodal or visual information essential for comprehensive farm management. Similarly, Eso et al. [16] developed an MQTT-based IoT dashboard enabling real-time monitoring and alerts with over 98% sensor accuracy. Nonetheless, its reliance on threshold-based logic prevented adaptive learning or automated disease diagnosis. In contrast, the proposed system introduces an IoT–AI hybrid framework integrating YOLOv8n (TFLite) for both environmental monitoring and image-based fish health detection. The model achieved high precision (0.969), recall (0.912), and mAP@0.5 (0.983), outperforming prior studies in accuracy and functional scope. Key innovations include real-time disease detection, cloud synchronization, and mobile alerting, enabling practical deployment in smart aquaculture environments.
The only noted limitation is a minor recall drop in detecting Aeromoniasis, potentially due to dataset imbalance or subtle visual cues. Overall, the proposed system demonstrates superior multimodal capability, real-time adaptability, and diagnostic intelligence, addressing major limitations of earlier sensor- or rule-based solutions.
The implementation of the intelligent aquaculture monitoring system demonstrates the successful integration of IoT and AI technologies in a real-world aquatic environment. Through structured hardware deployment, efficient backend processing, and a user-friendly mobile application, the system delivers reliable data acquisition and real-time insights.
6. Conclusions
This study presented an intelligent aquaculture monitoring system that integrates Internet of Things and Artificial Intelligence technologies to enhance real-time water quality management and fish disease detection. The system demonstrated reliable performance in sensing, data transmission, and automated analysis, with the YOLOv8n model achieving high detection accuracy (mAP@0.5 = 0.983). By combining environmental sensing and vision-based diagnostics, the proposed solution offers a scalable, low-cost, and energy-efficient approach to improving aquaculture productivity an sustainability. Future work will focus on expanding the system’s sensing capabilities to include additional parameters such as dissolved oxygen and turbidity, as well as integrating predictive analytics for early risk forecasting. Further optimization of the AI model using larger and more diverse datasets, along with field deployment in different aquaculture environments, will strengthen its robustness and adaptability. Ultimately, this work contributes toward the realization of intelligent, data-driven, and sustainable aquaculture ecosystems.
Author Contributions
Conceptualization, M.B.M.; methodology, M.B.M, D.B; software, M.B.M, D.B, A.A.J.A.-A. and M.K.I.; validation, A.F.; formal analysis, A.A.J.A.-A and M.K.I.; investigation, M.B.M, D.B; resources, M.B.M.; data curation, M.B.M.; writing—original draft preparation, M.B.M, D.B; writing—review and editing, D.B, A.A.J.A.-A. and M.K.I.; visualization, M.B.M.; supervision, A.F.; project administration, A.F.; funding acquisition, M.B.M, D.B, A.A.J.A.-A. and M.K.I. All authors have read and agreed to the published version of the manuscript.
Funding
This research received no external funding.
Data Availability Statement
The Freshwater Fish Disease Aquaculture in South Asia dataset is available on Kaggle (accessed on 05 April 2025).
Conflicts of Interest
The authors declare no conflict of interest.
Abbreviations
| AI | Artificial Intelligence |
| AIoT | Artificial Intelligence of Things |
| FPS | Frame Per Seconde |
| IoT | Internet of Things |
| mAP | mean Average Precesion |
| MQTT | Message Queuing Telemetry Transport. |
| UI | User Interface |
| UML | Unified Modeling Language |
| USV | Unmanned Surface Vehicle |
| YOLOV8n | You Only Look Once Version 8 nano |
References
- FAO, The State of World Fisheries and Aquaculture 2022: Towards Blue Transformation, Food and Agriculture Organization of the United Nations, Rome, 2022. [CrossRef]
- R. L. Naylor, R. W. Hardy, A. H. Buschmann et al., “A 20-year retrospective review of global aquaculture,” Nature, Vol. 591, No. 7851, pp. 551–563, March 2021. [CrossRef]
- E. Misimi, J. R. Mathiassen, M. Bondø, “Big data in aquaculture: Revolutionizing fish farming through intelligent data management,” Information Systems in Aquaculture, Vol. 27, No. 6, pp. 579–591, June 2020. [CrossRef]
- J. Bostock, A. Lane, C. Hough, K. Yamamoto, “An assessment of the economic contribution of EU aquaculture production and the influence of policies for its sustainable development,” Aquaculture International, Vol. 24, No. 3, pp. 699–733, May 2016.
- R. Subasinghe, “Disease control in aquaculture and the responsible use of veterinary drugs and vaccines: the issues, prospects and challenges,” Options Méditerranéennes, Vol. 86, pp. 5–11, 2009.
- H. Moghadam, R. Salte, B. Robertsen, “Genomics and fish health: Applications for aquaculture,” Journal of Fish Diseases, Vol. 38, No. 11, pp. 927–935, November 2015. [CrossRef]
- M. Abdel-Tawwab, M. N. Monier, S. H. Hoseinifar, C. Faggio, “Fish response to hypoxia stress: Growth, physiological, and immunological biomarkers,” Fish Physiology and Biochemistry, Vol. 45, No. 3, pp. 997–1013, June 2019. [CrossRef]
- K. L. Tsai, L. W. Chen, L. J. Yang, H. J. Shiu, H. W. Chen, “IoT-based Smart Aquaculture System with Automatic Aerating and Water Quality Monitoring,” Journal of Internet Technology, Vol. 23, No. 1, pp. 177–184, January 2022.
- N. A. M. Jais, A. F. Abdullah, M. S. M. Kassim, M. M. A. Karim, M. Abdulsalam, N. ‘A. Muhadi, “Improved accuracy in IoT-based water quality monitoring for aquaculture tanks using low-cost sensors: Asian seabass fish farming,” Heliyon, Vol. 10, No. 8, e29022, August 2024.
- T. V. Nguyen et al., “Monitoring water quality parameters in aquaculture using edge computing,” Vietnam Journal of Catalysis and Adsorption, 2024. [CrossRef]
- R. Saosing, S. Nattawuttisit, “Smart IoT-based visual detection system for aquaculture monitoring using YOLO and edge computing,” International Journal of Innovative Research and Scientific Studies, Vol. 8, No. 6, pp. 1278–1287, June 2025.
- W. Wan et al., “Modular low-cost IoT system for aquaponic farming: integration of fish and plant monitoring,” Sensors, 22(23), 9260. [CrossRef]
- Y. P. Huang, S. P. Khabusi, “Artificial Intelligence of Things (AIoT) Advances in Aquaculture: A Review,” Processes, Vol. 13, No. 1, p. 73, January 2025.
- R. M. Razali, “Predictive Water Quality Monitoring in Aquaculture Using Machine Learning and IoT Automation,” Advances in Computational and Intelligent Systems, Vol. 1, No. 1, 2025.
- R. Eso, H. T. Mokui, A. Arman, L. Safiuddin, H. Husein, “Water Quality Monitoring System Based on the Internet of Things (IoT) for Vannamei Shrimp Farming,” ComTech: Computer, Mathematics and Engineering Applications, Vol. 15, No. 1, pp. 53–63, 2024. [CrossRef]
- A. Temilolorun, Y. Singh, “Towards Design and Development of a Low-Cost Unmanned Surface Vehicle for Aquaculture Water Quality Monitoring in Shallow Water Environments,” arXiv preprint, October 2024. [CrossRef]
- J. Redmon, S. Divvala, R. Girshick, A. Farhadi, “You Only Look Once: Unified, Real-Time Object Detection,” Proceedings of the IEEE Conference on Computer Vision and Pattern Recognition (CVPR), Las Vegas, NV, 2016, pp. 779–788.
- A. Bochkovskiy, C.-Y. Wang, H.-Y. M. Liao, “YOLOv4: Optimal Speed and Accuracy of Object Detection,” arXiv preprint, arXiv: 2004.10934, April 2020.
- G. Jocher et al., YOLOv8 Documentation, Ultralytics, 2023. https://docs.ultralytics.com.
- R. Smith et al., “Edge Deployment of Lightweight Neural Networks for Real-Time Object Detection,” Sensors, Vol. 22, No. 5, 2022.
- M. Chen et al., “Domain-Specific Object Detection in Aquaculture Using Deep Learning,” Computers and Electronics in Agriculture, Vol. 185, 2021.
- Ultralytics, YOLOv8 Release Notes, GitHub, 2023. https://github.com/ultralytics/ultralytics.
- A. Patel, L. Zhou, “Lightweight Object Detection with YOLOv8n on Edge Devices,” IEEE Embedded Systems Letters, Vol. 16, No. 3, pp. 112–115, September 2024.
- T. Nguyen et al., “Optimizing TinyML Models for Real-Time Detection in Aquatic Environments,” ACM Transactions on Embedded Computing Systems, Vol. 23, No. 1, 2024.
- S. Biswas, Freshwater Fish Disease Aquaculture in South Asia – Kaggle Dataset, Kaggle Datasets, 2023. https://www.kaggle.com/datasets/subirbiswas19/freshwater-fish-disease-aquaculture-in-south-asia.
Figure 1.
System overview.
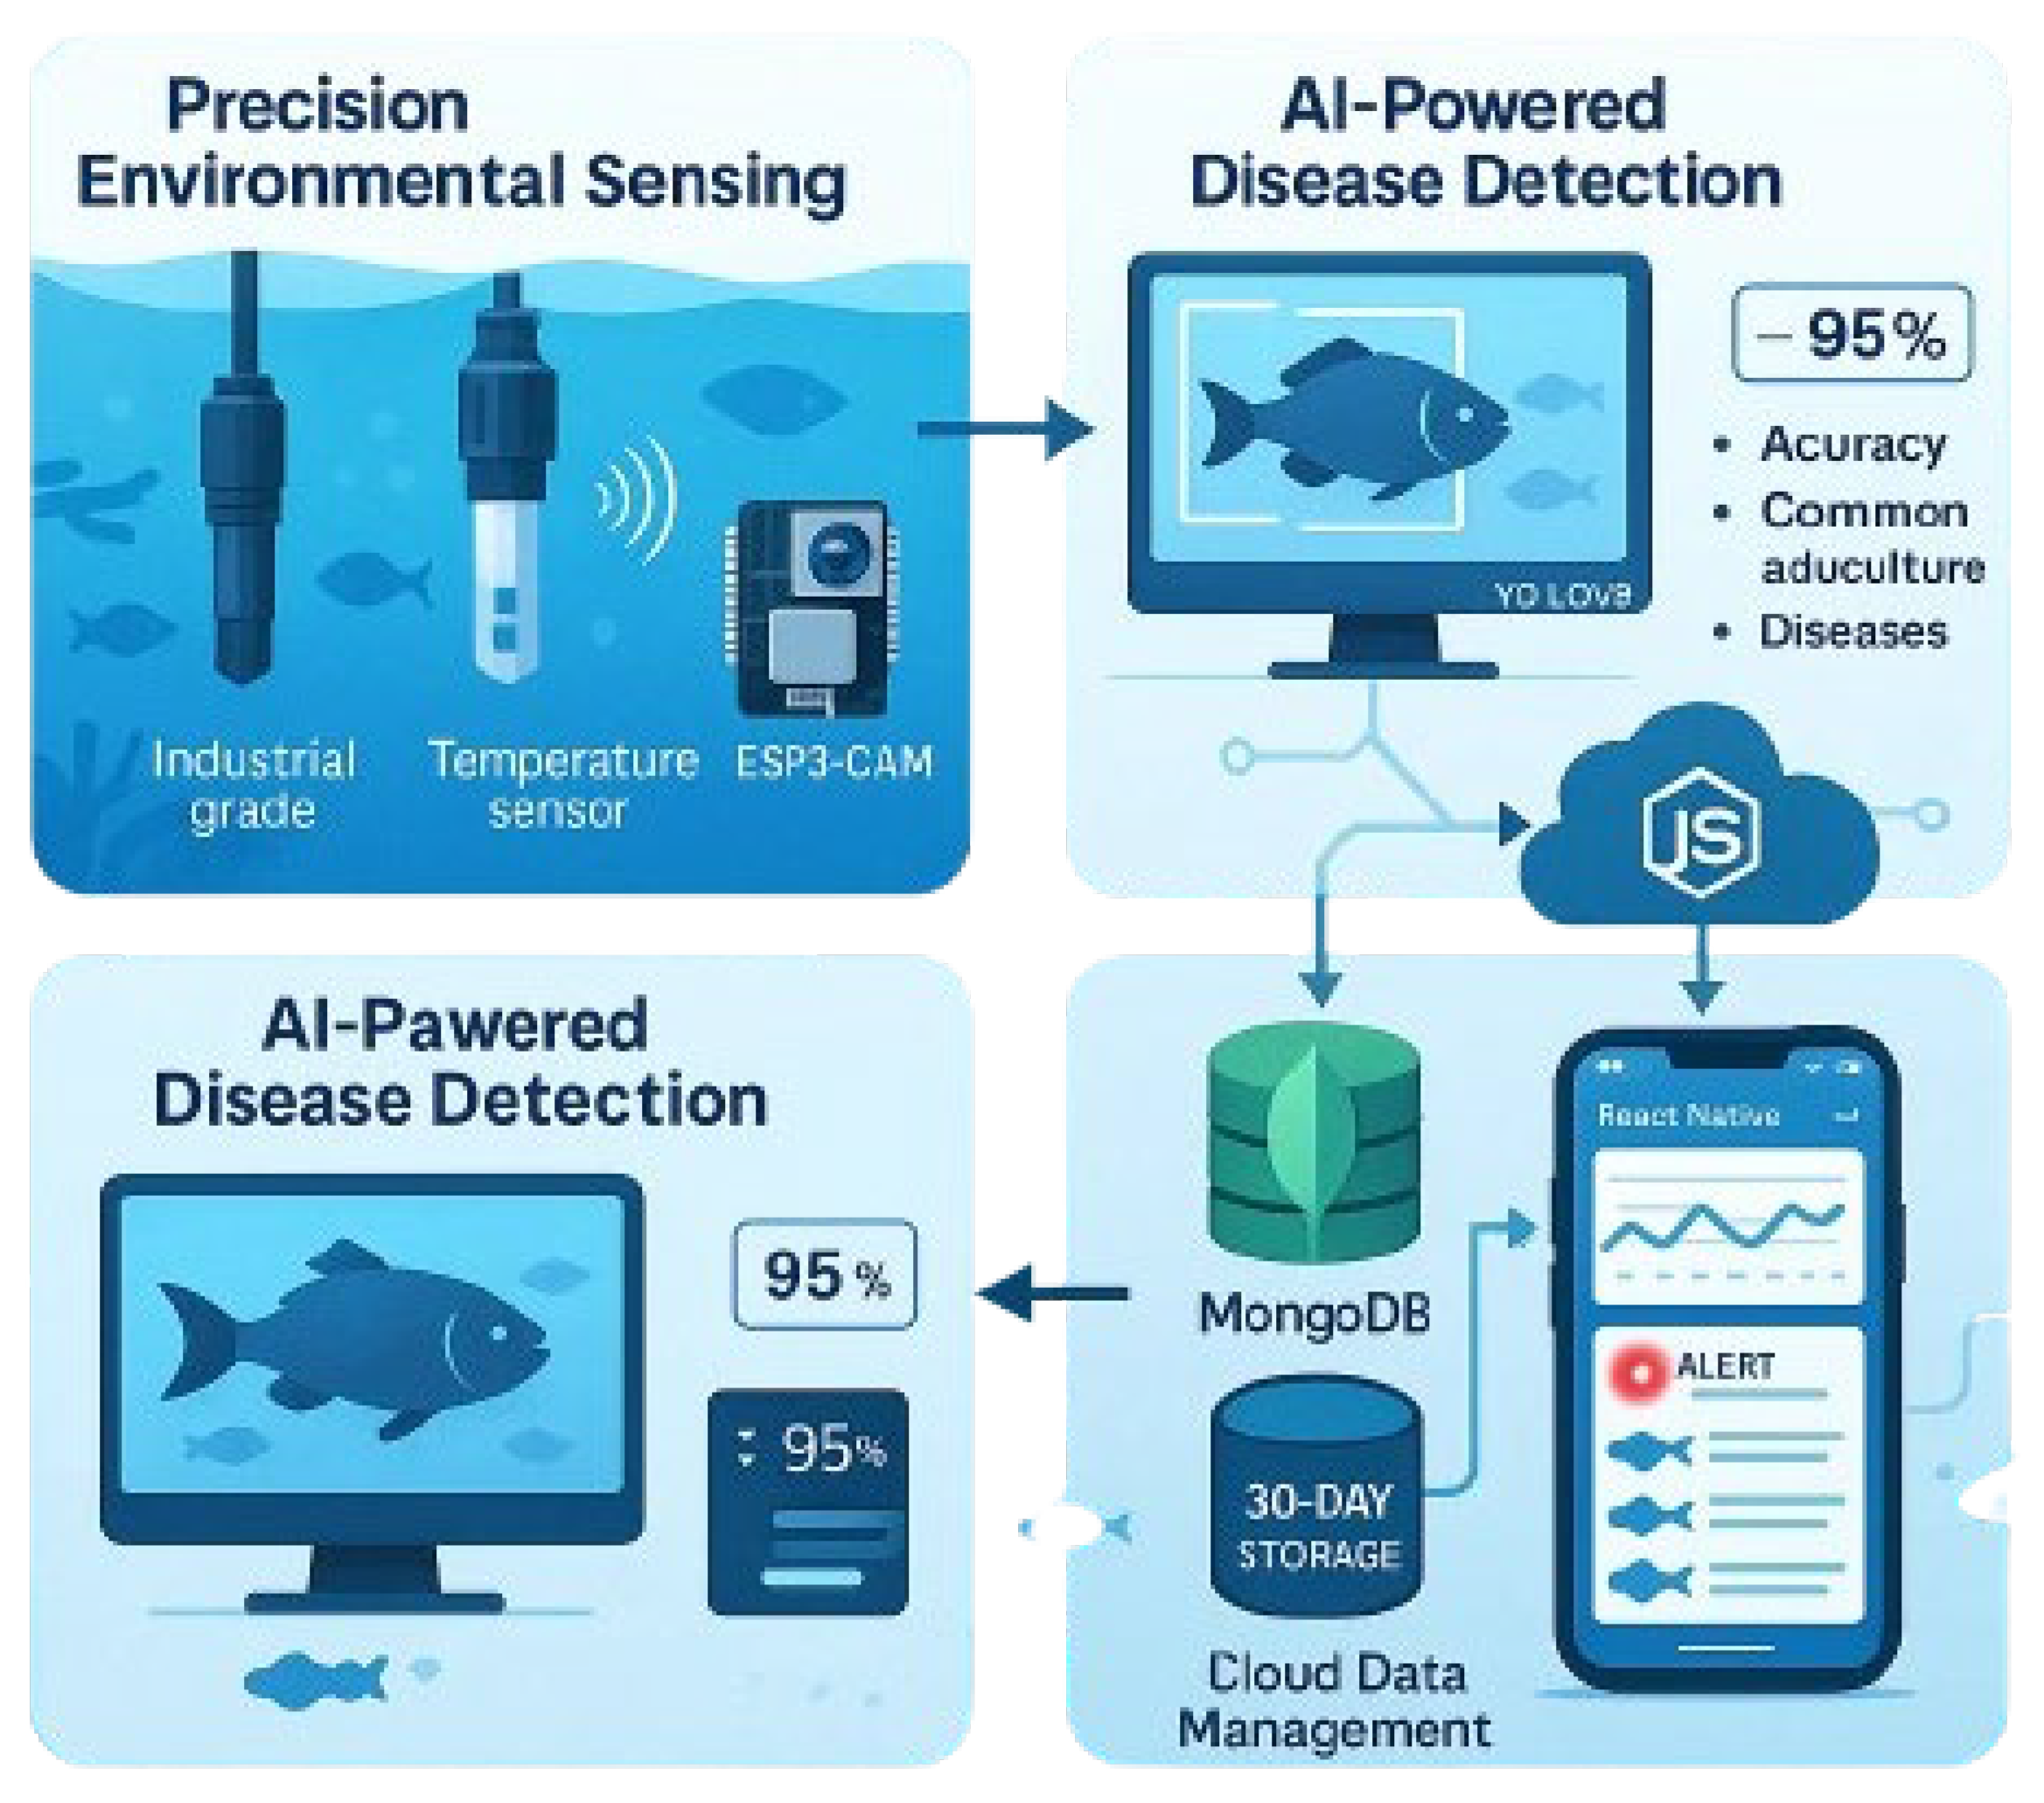
Figure 2.
Fish Disease Dataset.
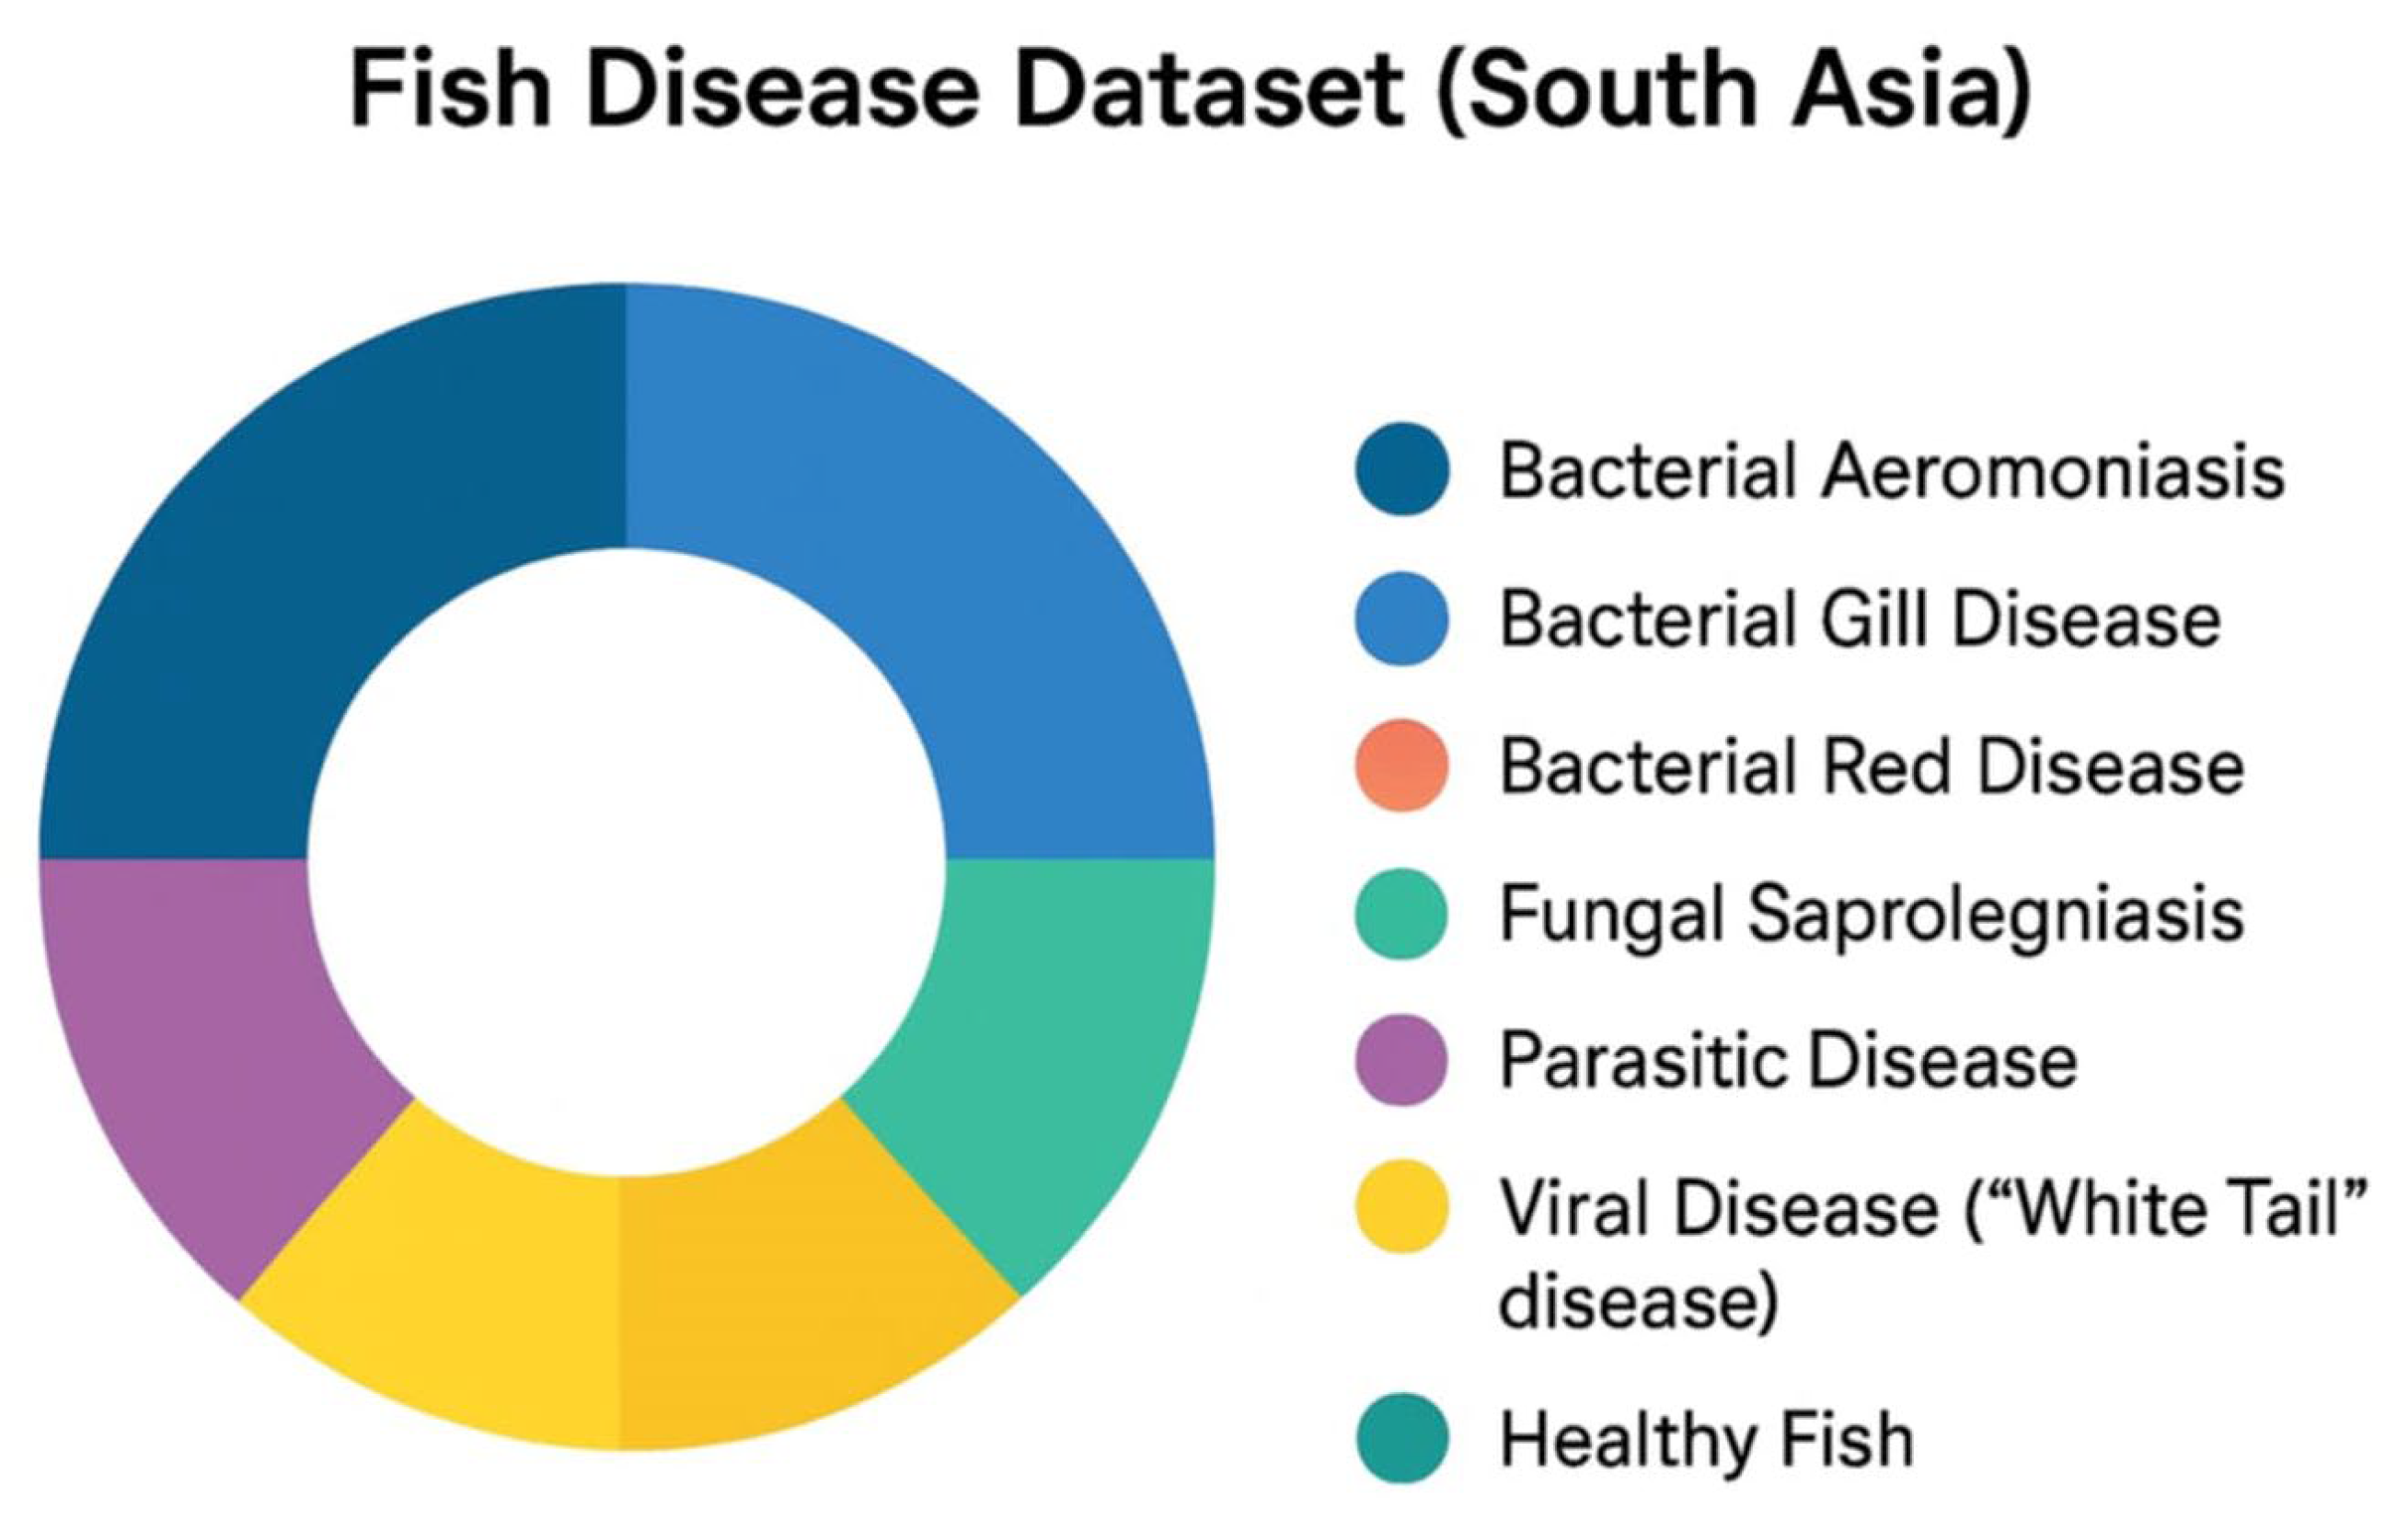
Figure 3.
Use Case Diagram.
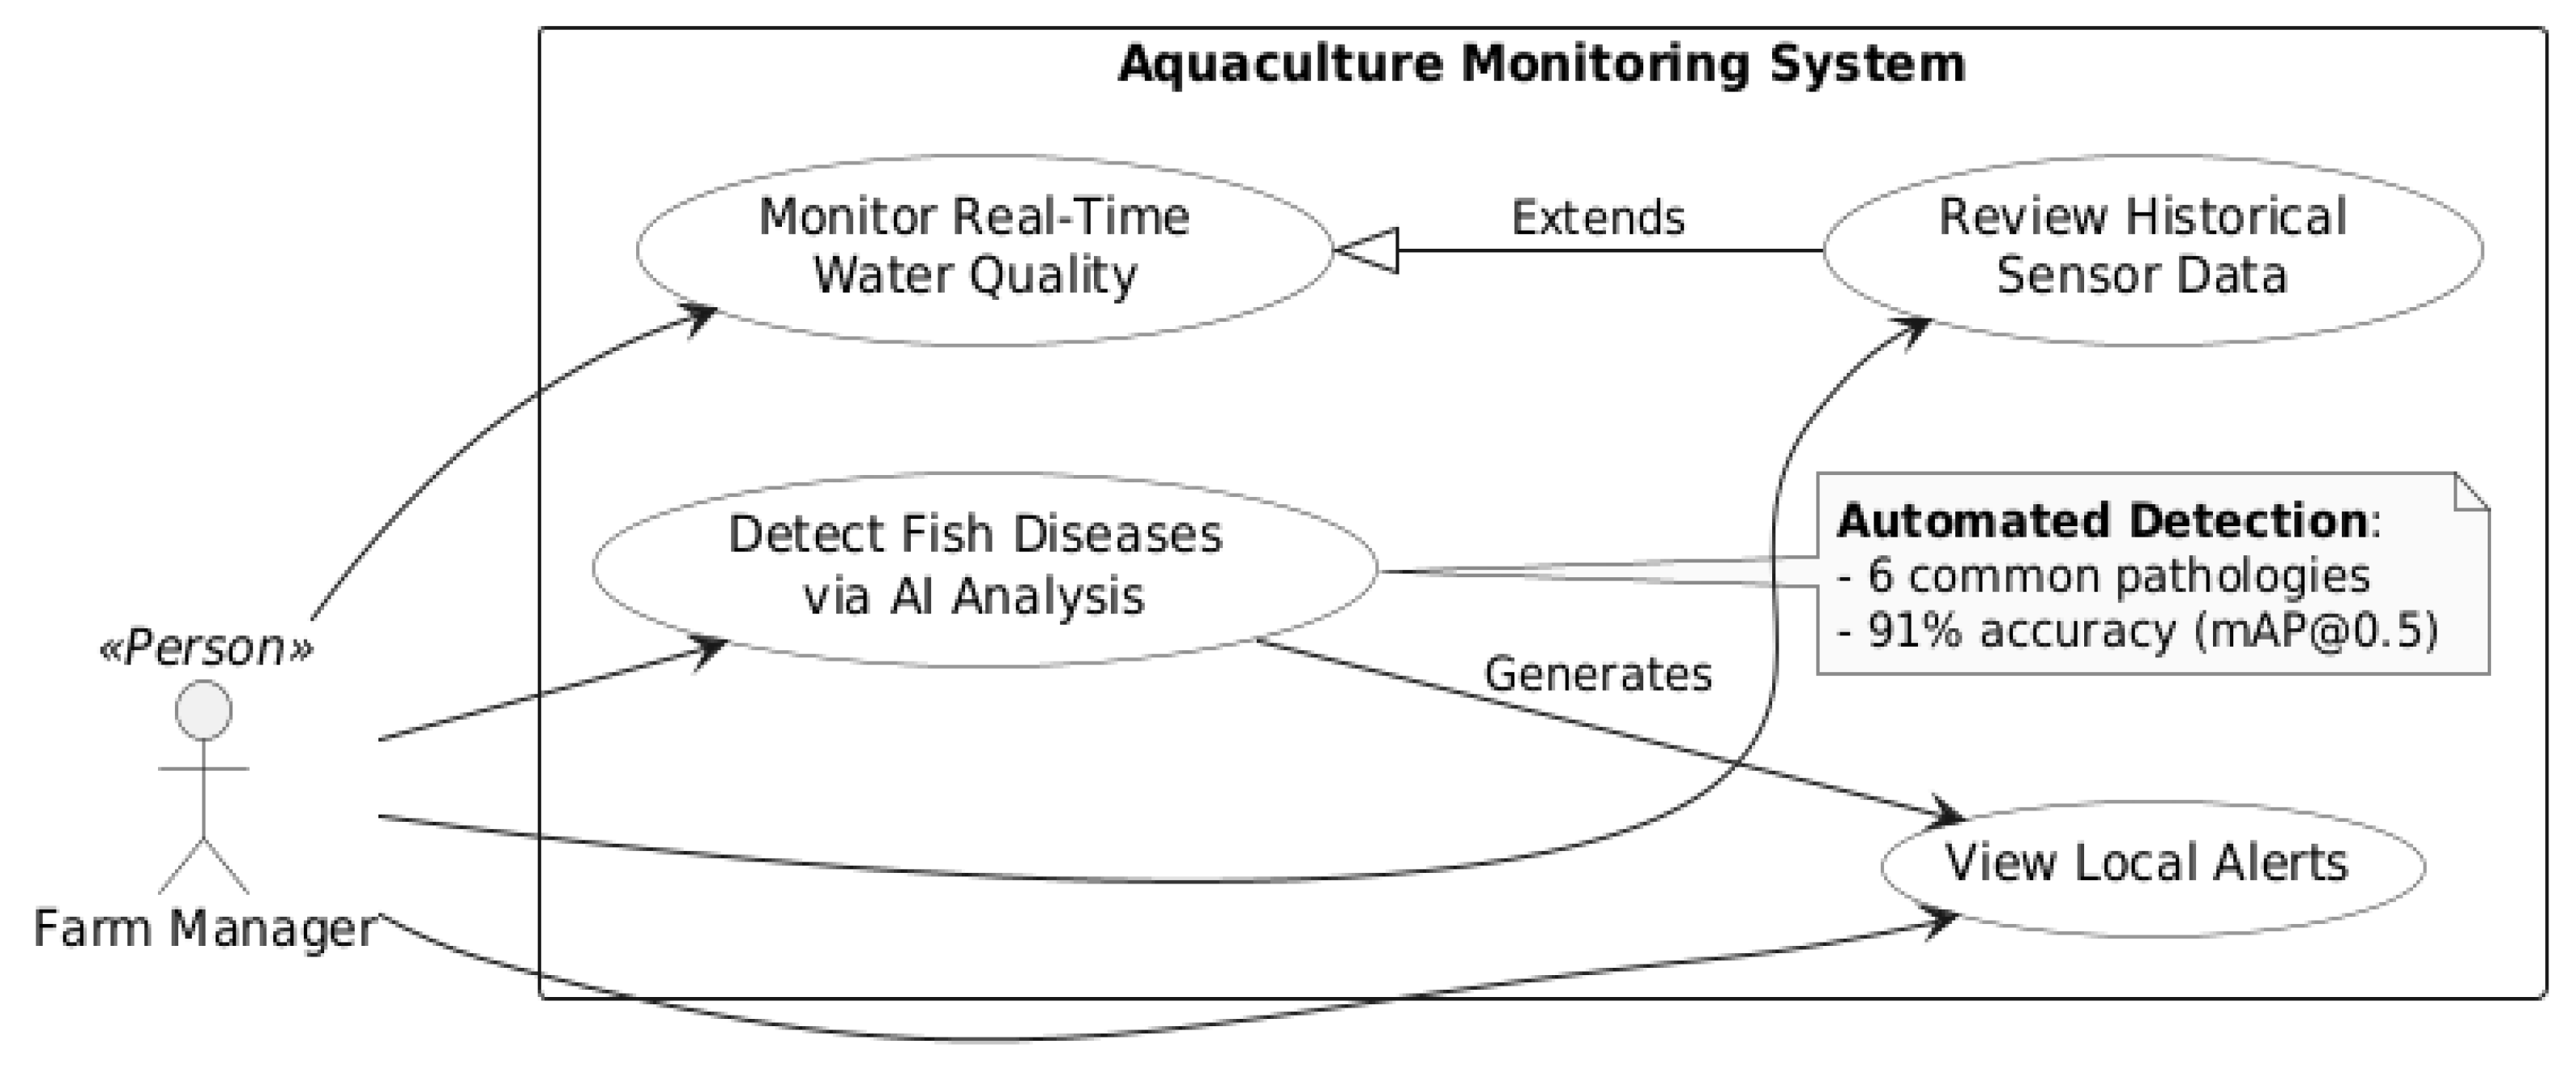
Figure 4.
Class Diagram.
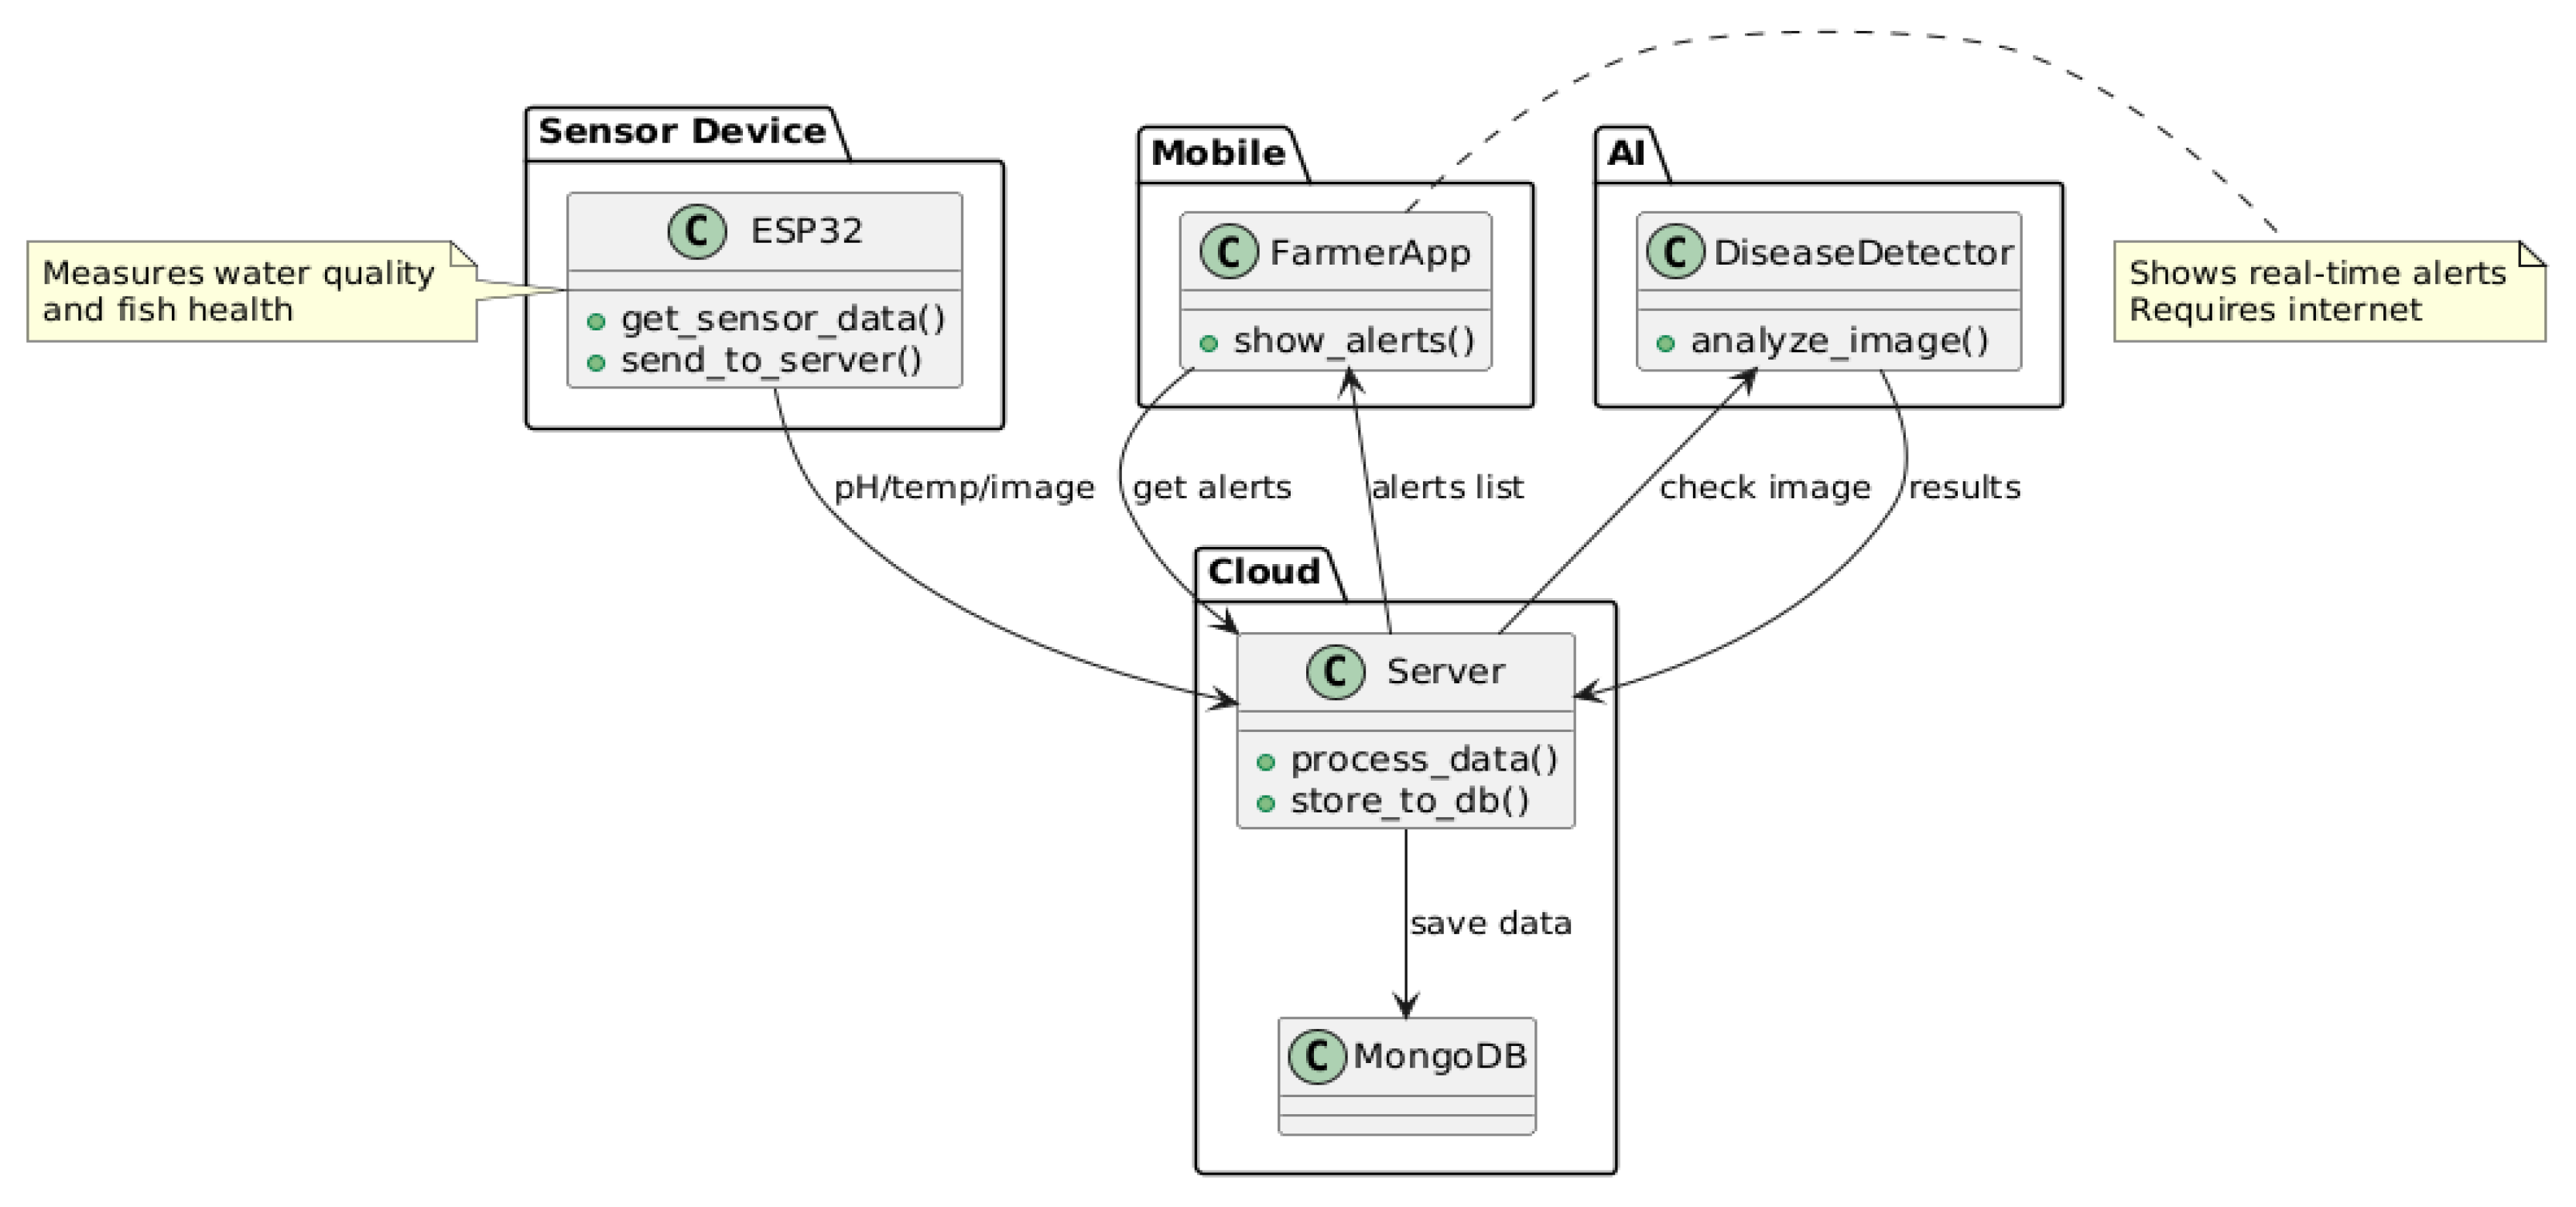
Figure 5.
Sequence Diagram.
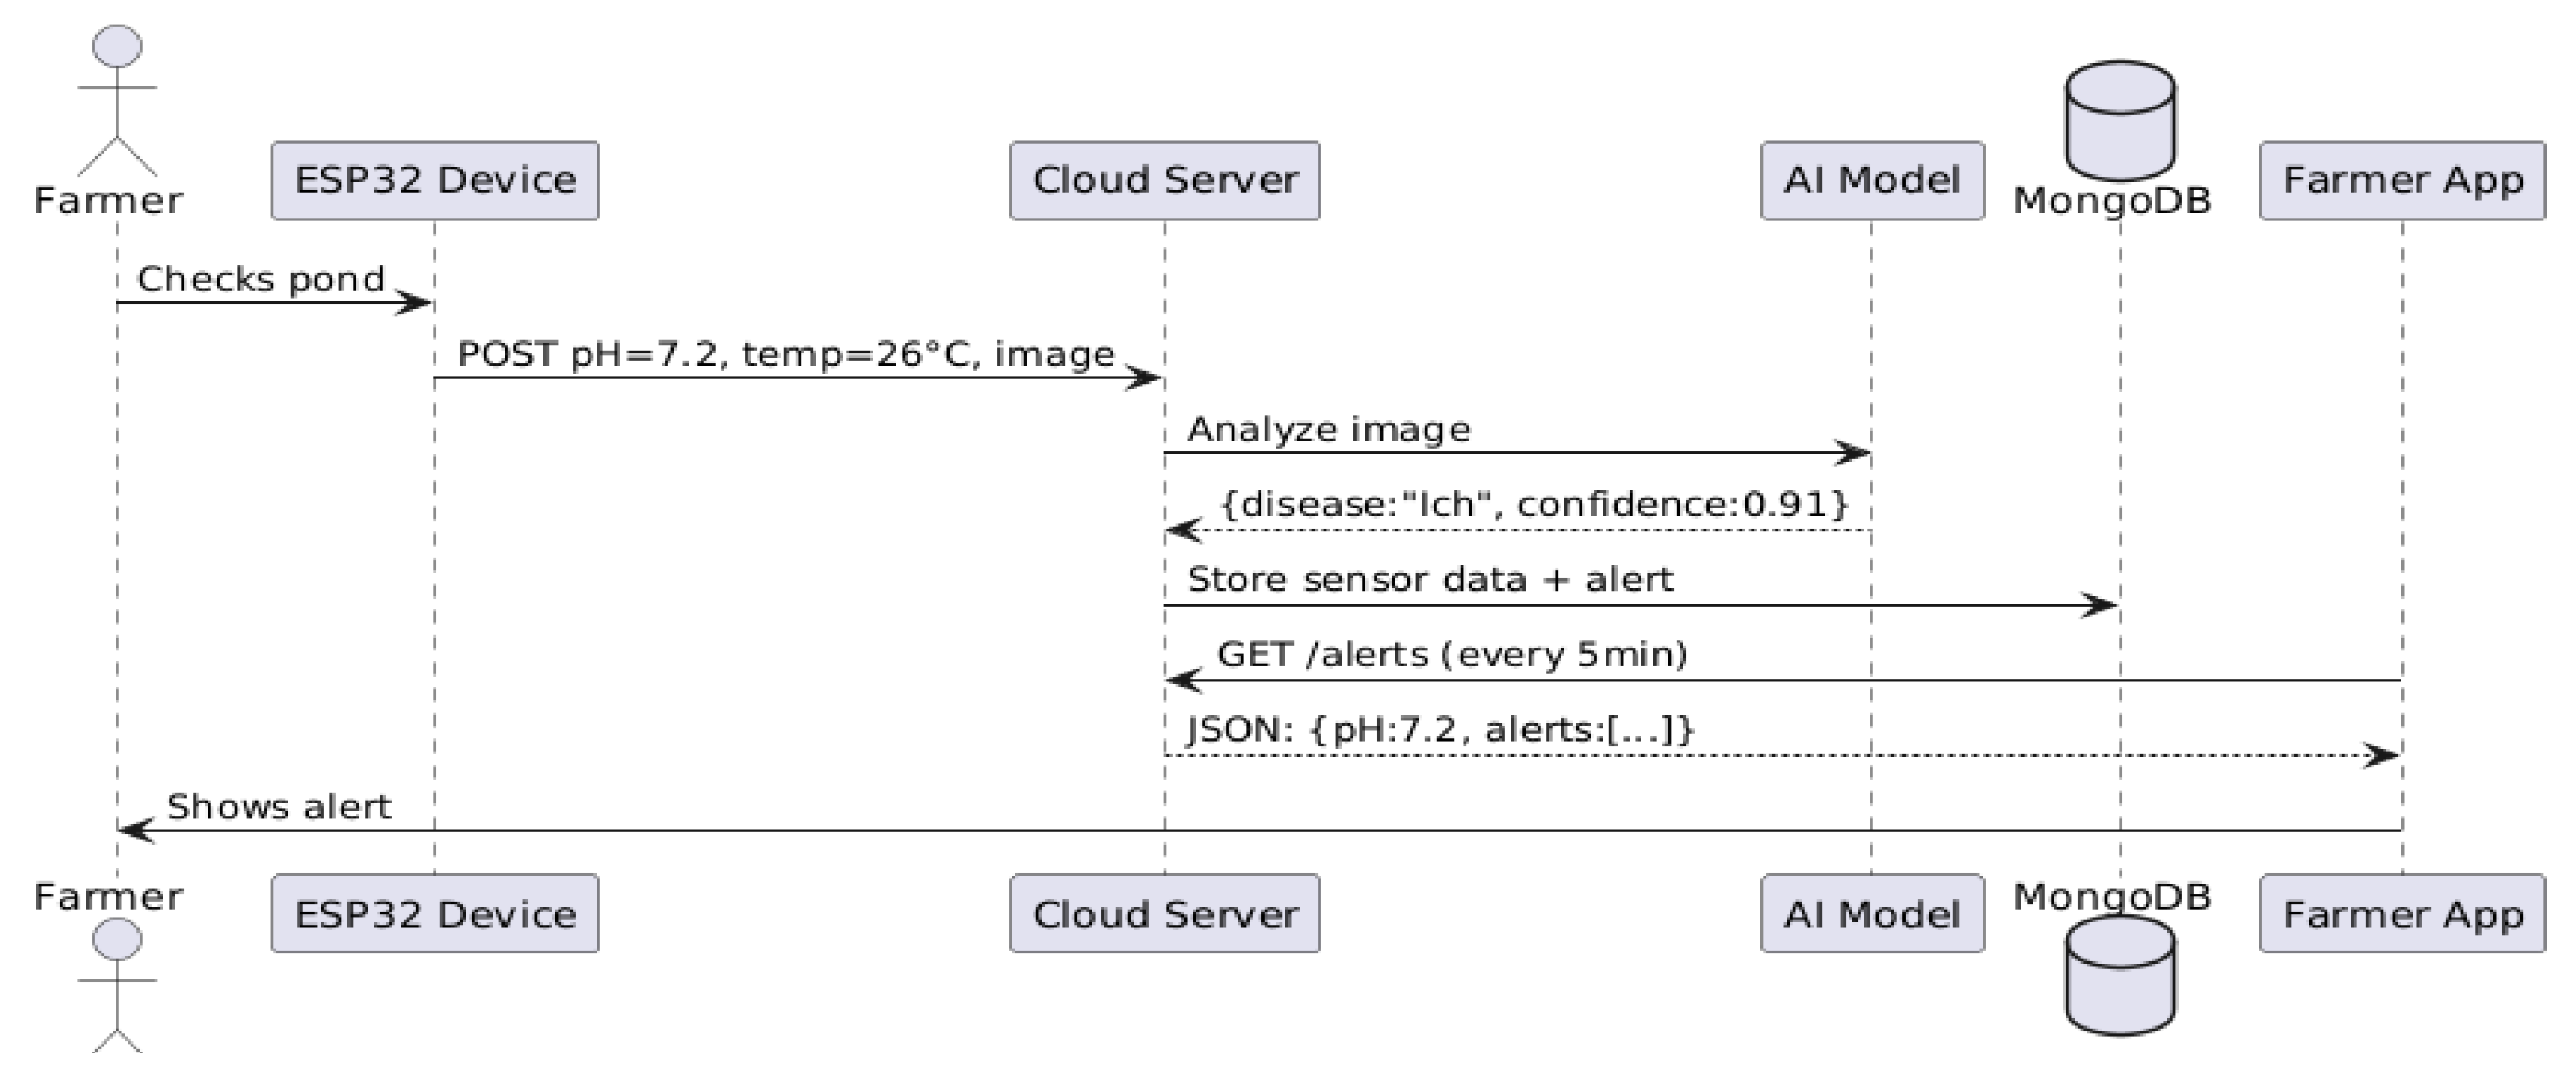
Figure 6.
Project Workflow.
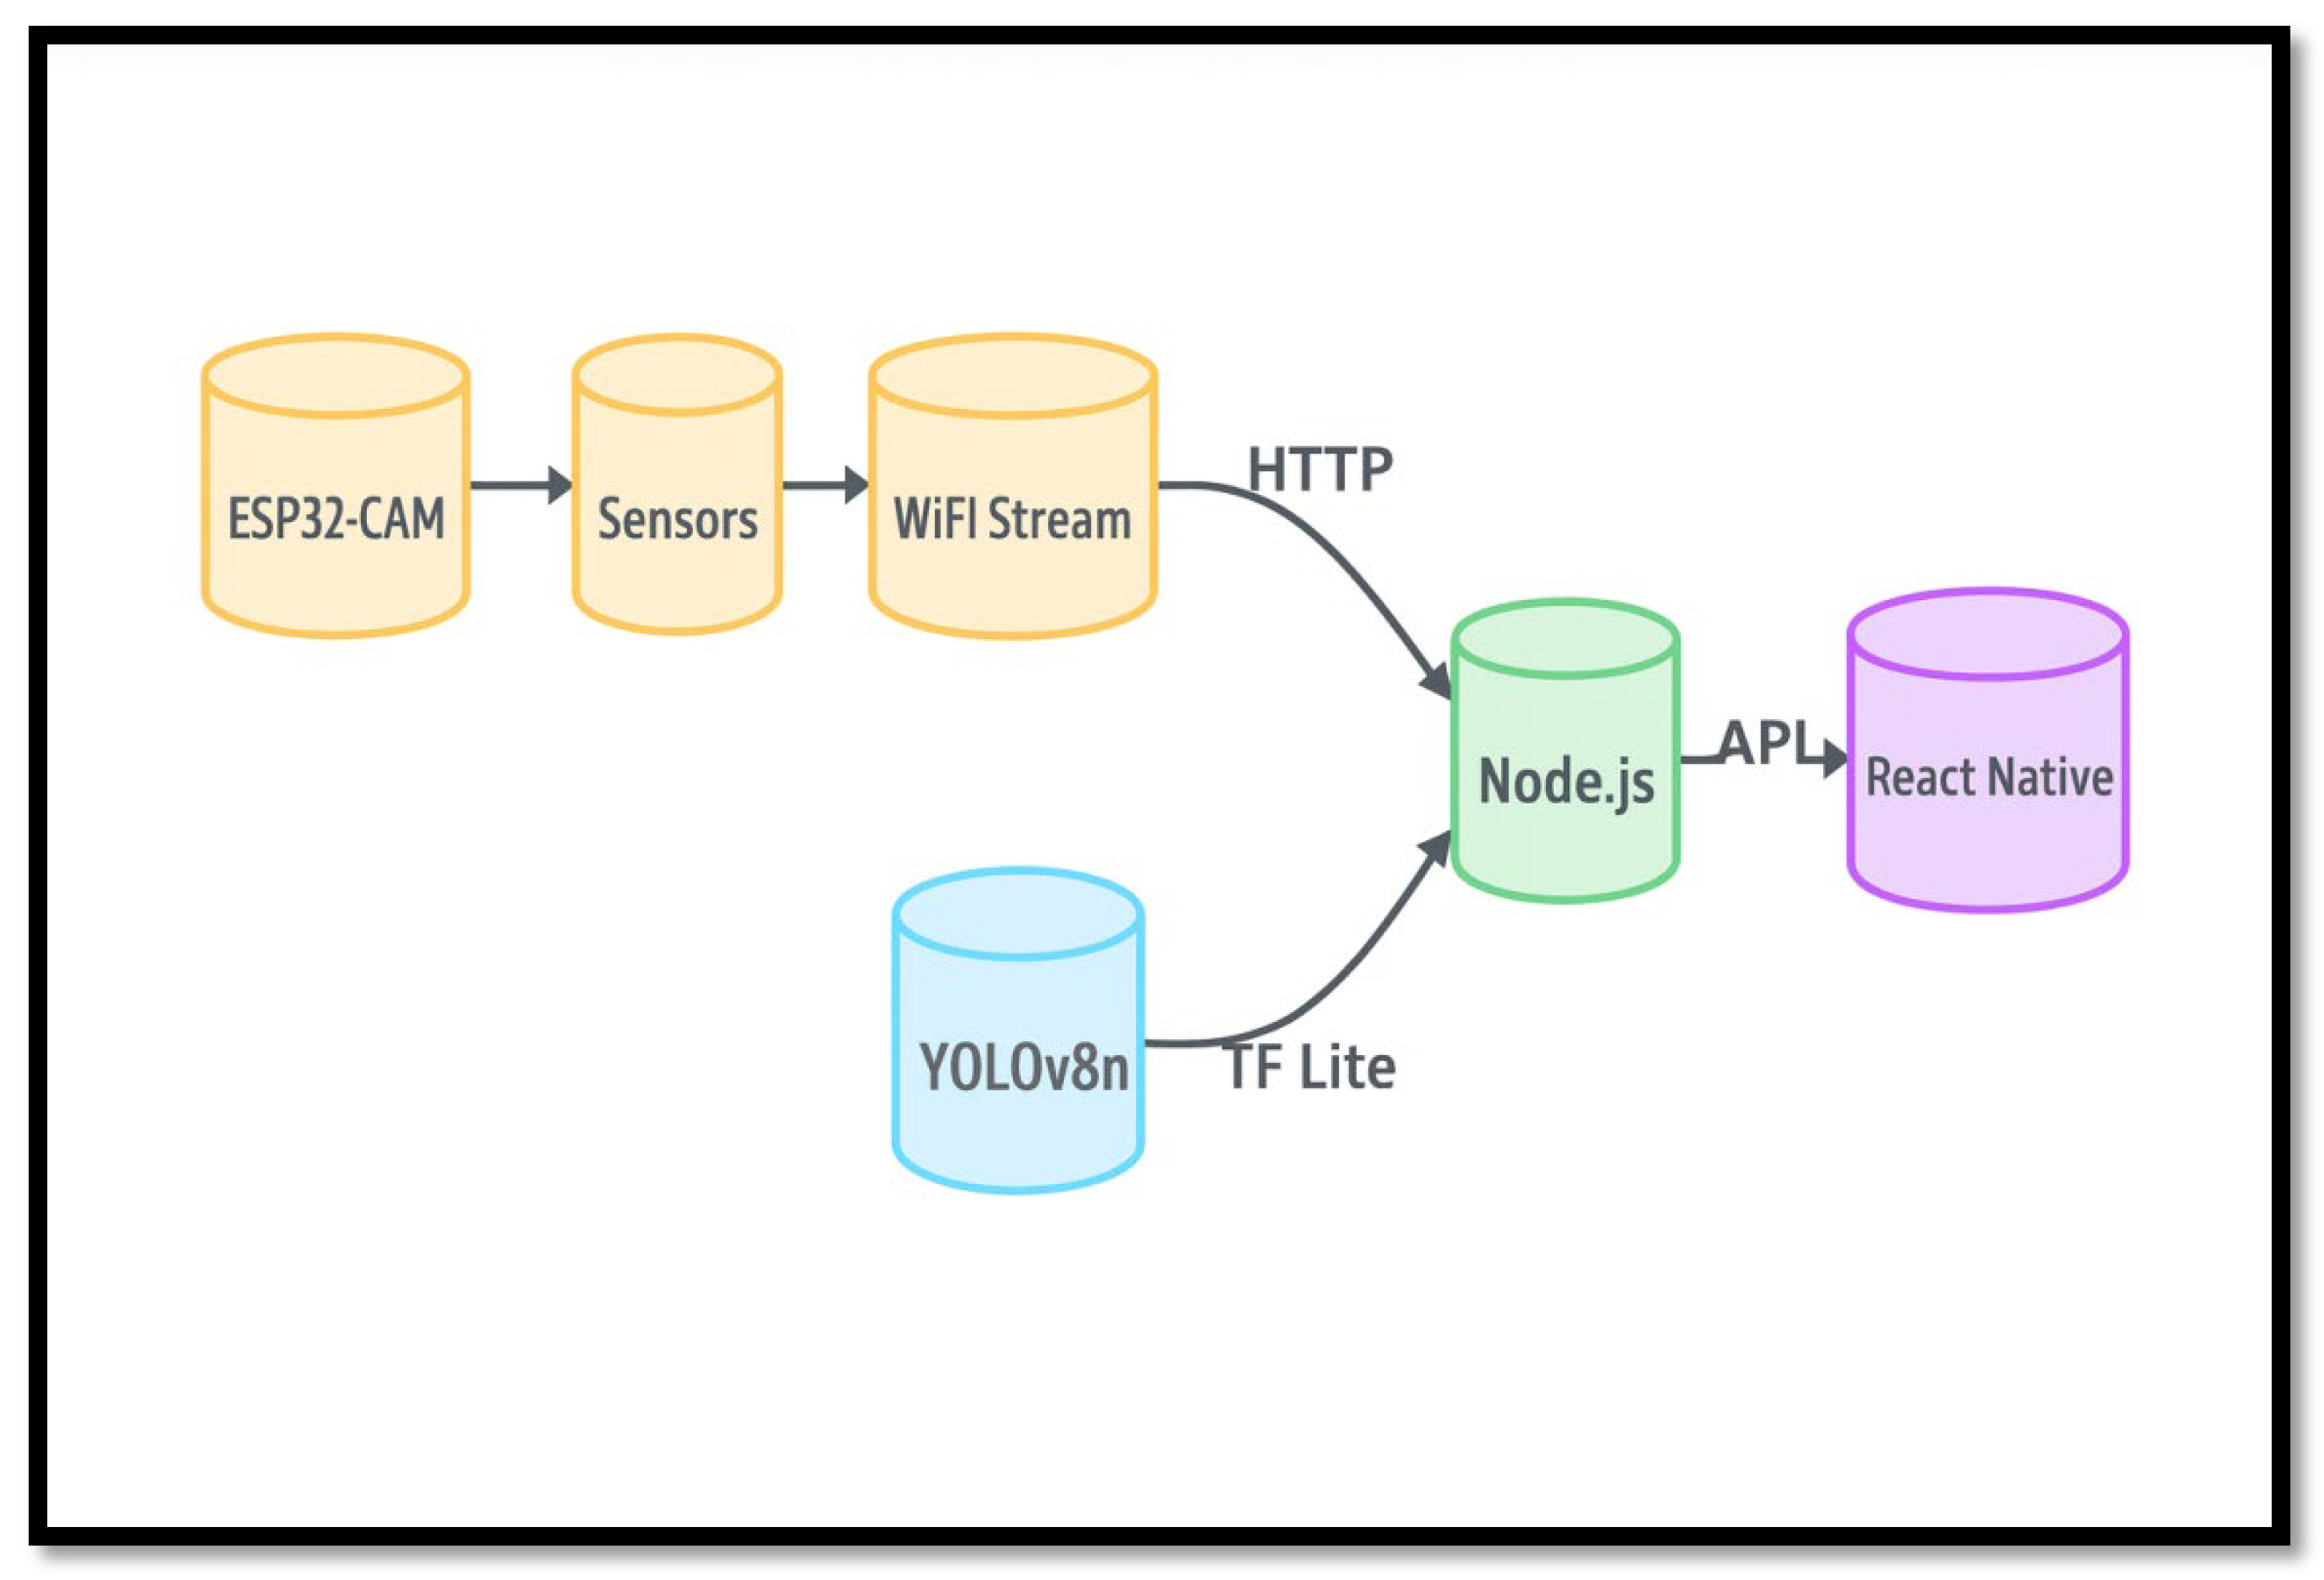
Figure 7.
Hardware Setup.
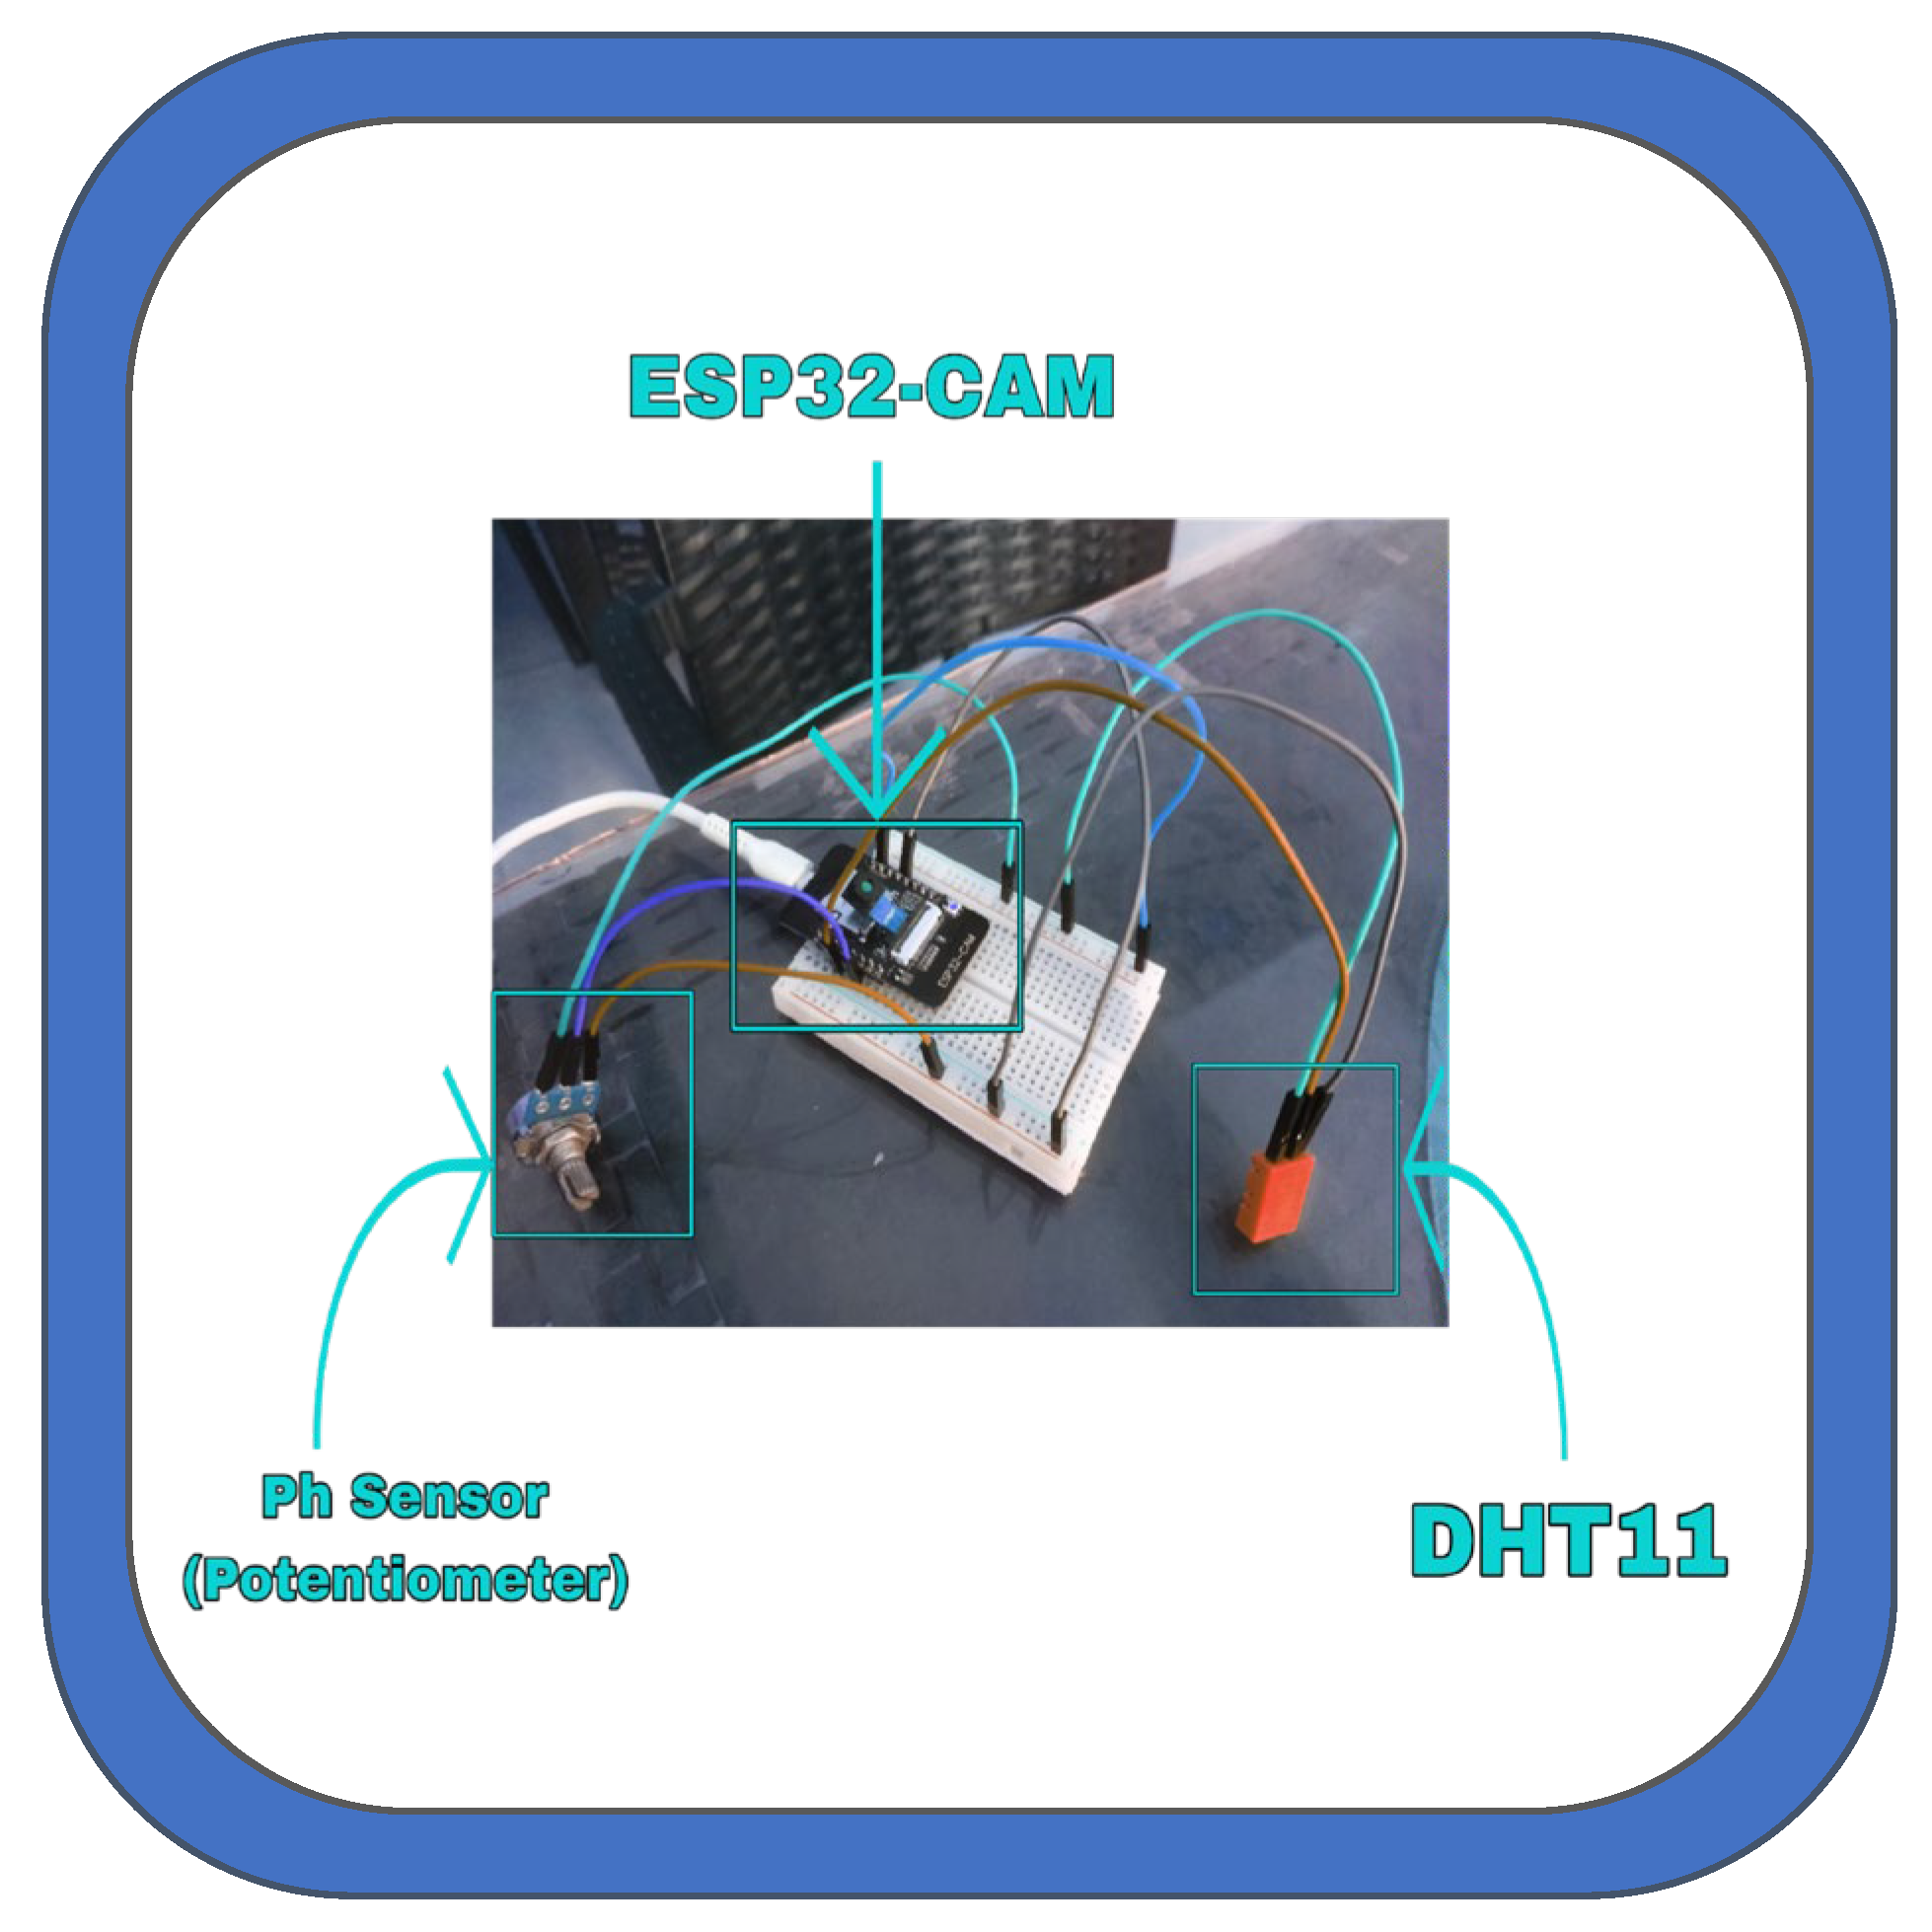
Figure 8.
Serial Monitor Output.
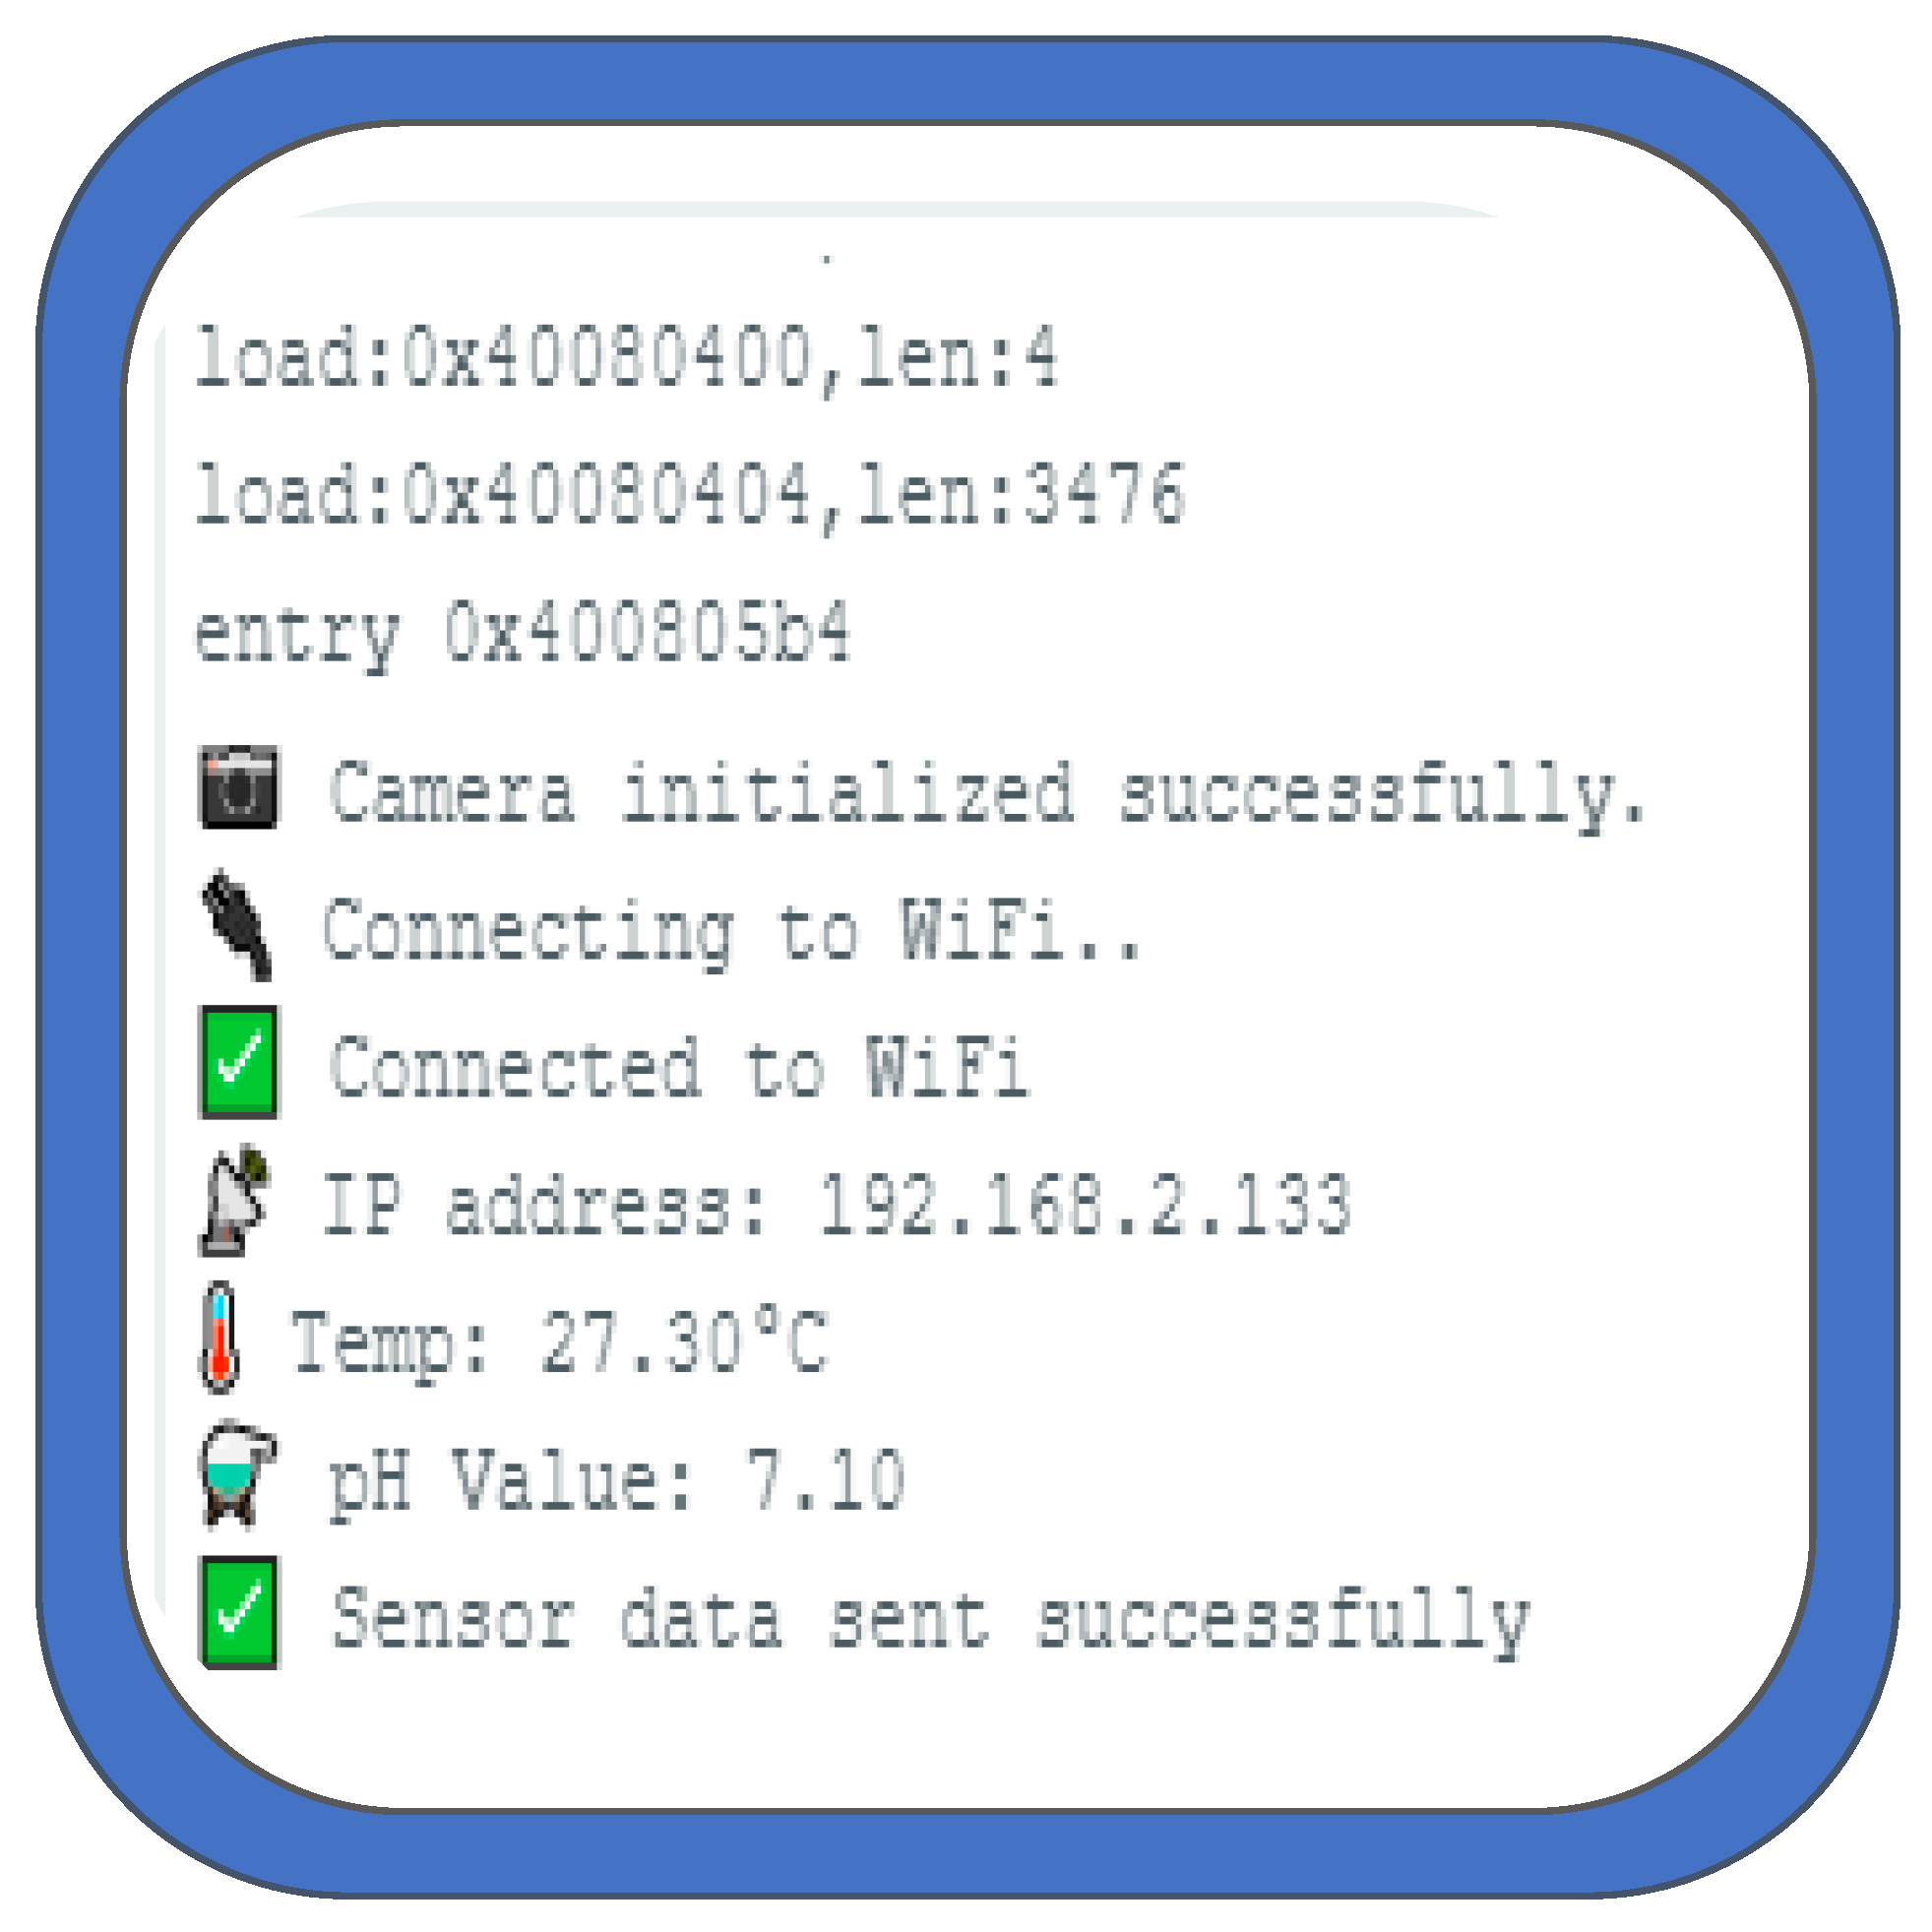
Figure 9.
Dashboard Page.
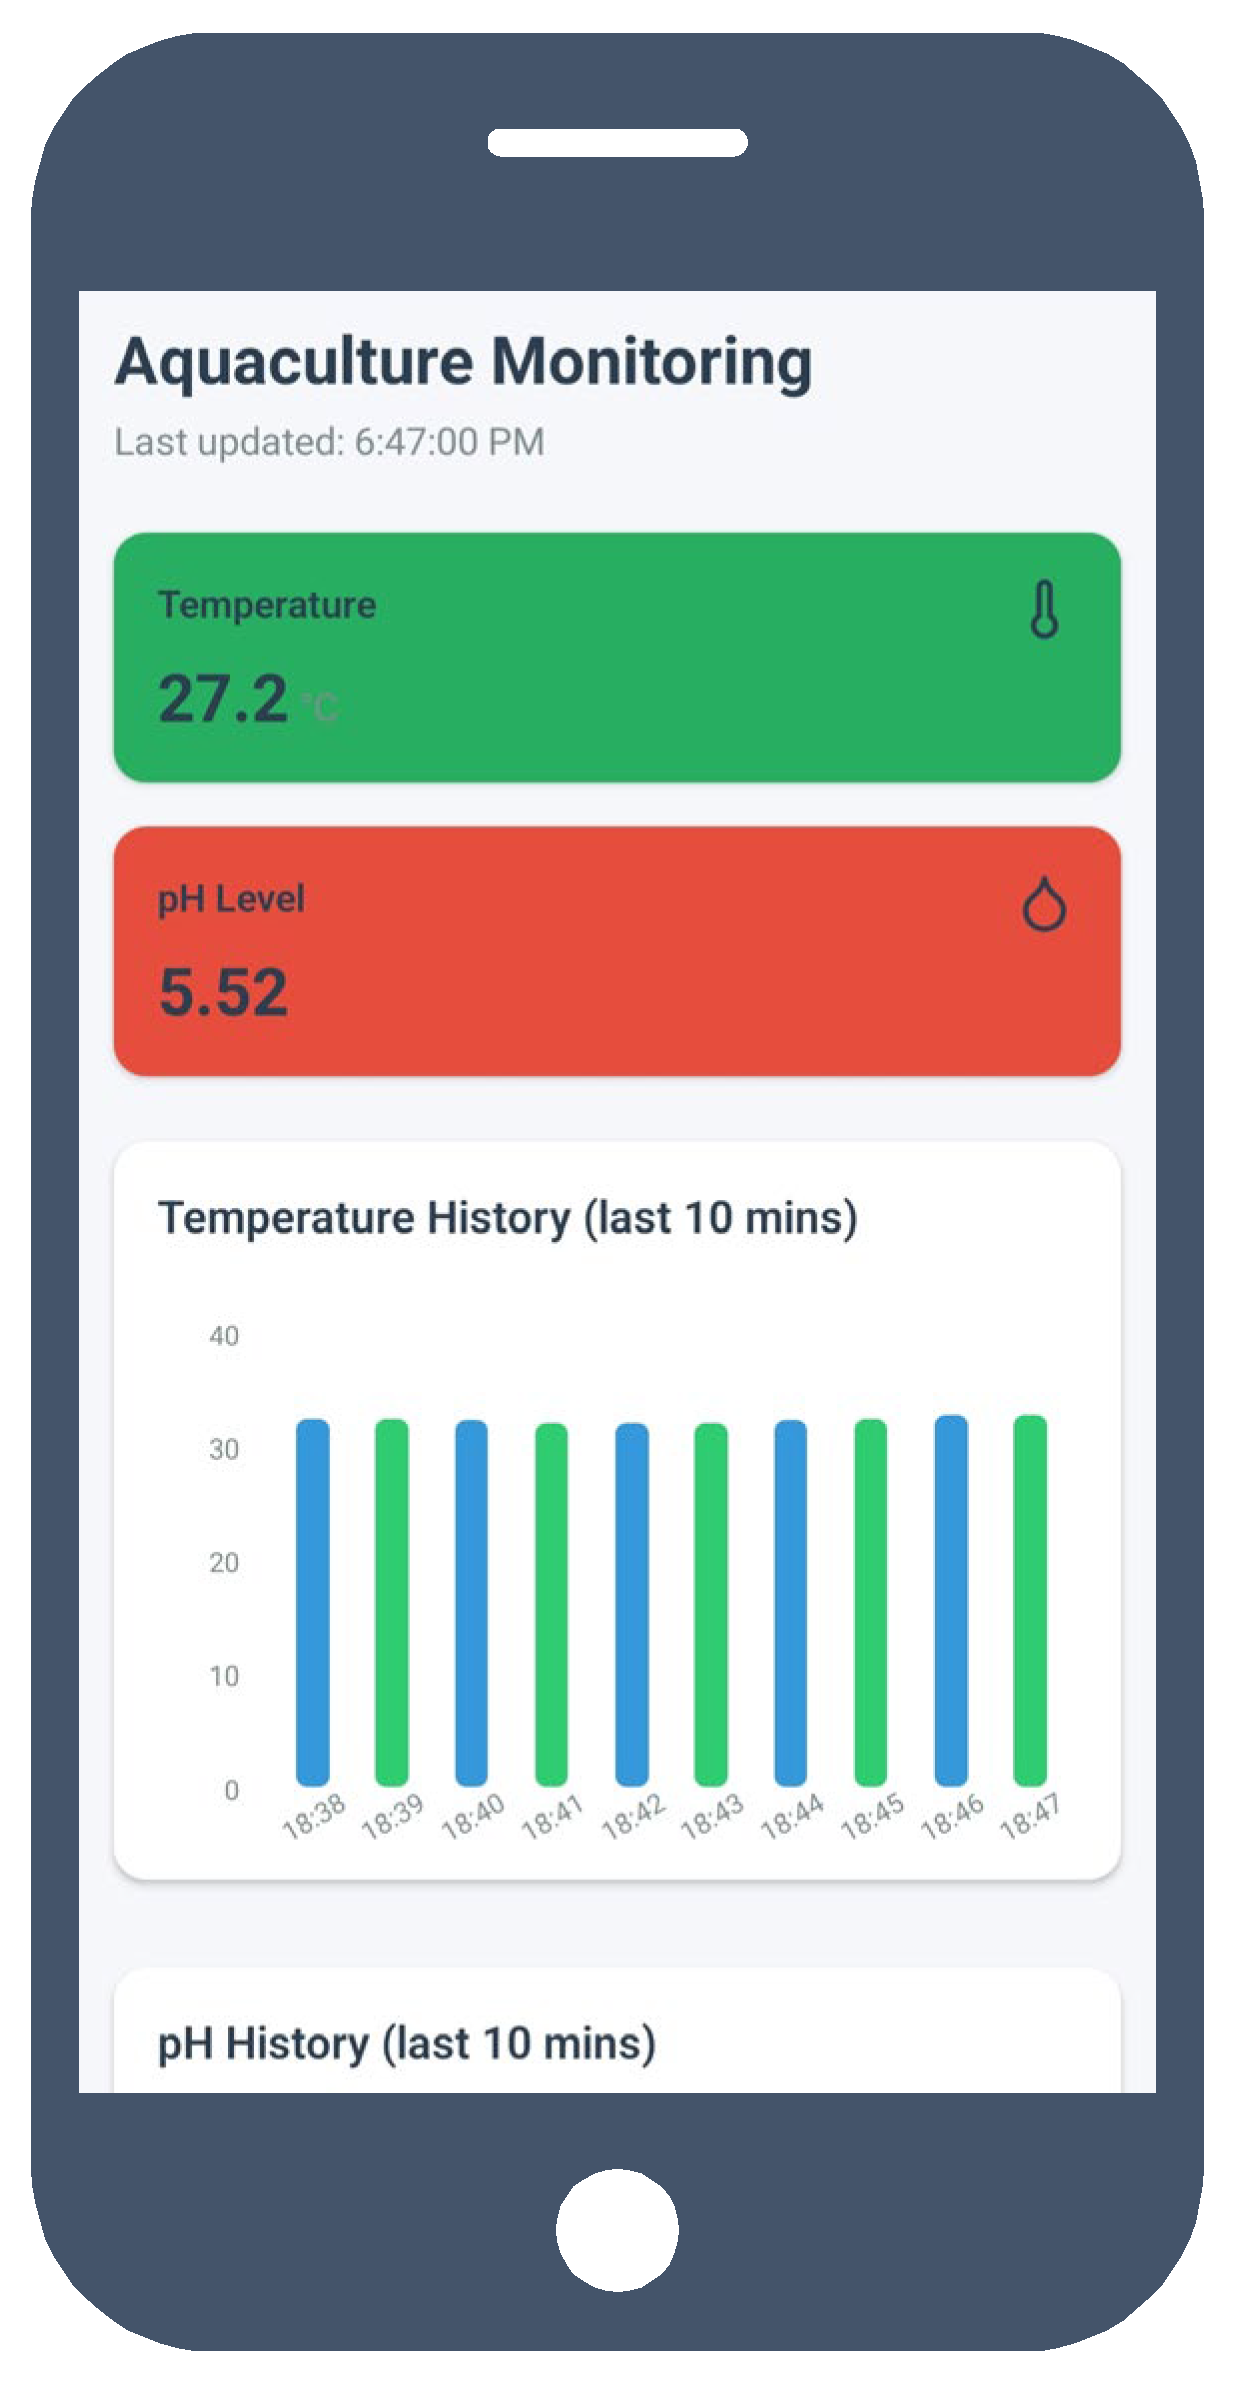
Figure 10.
Alert System Page.
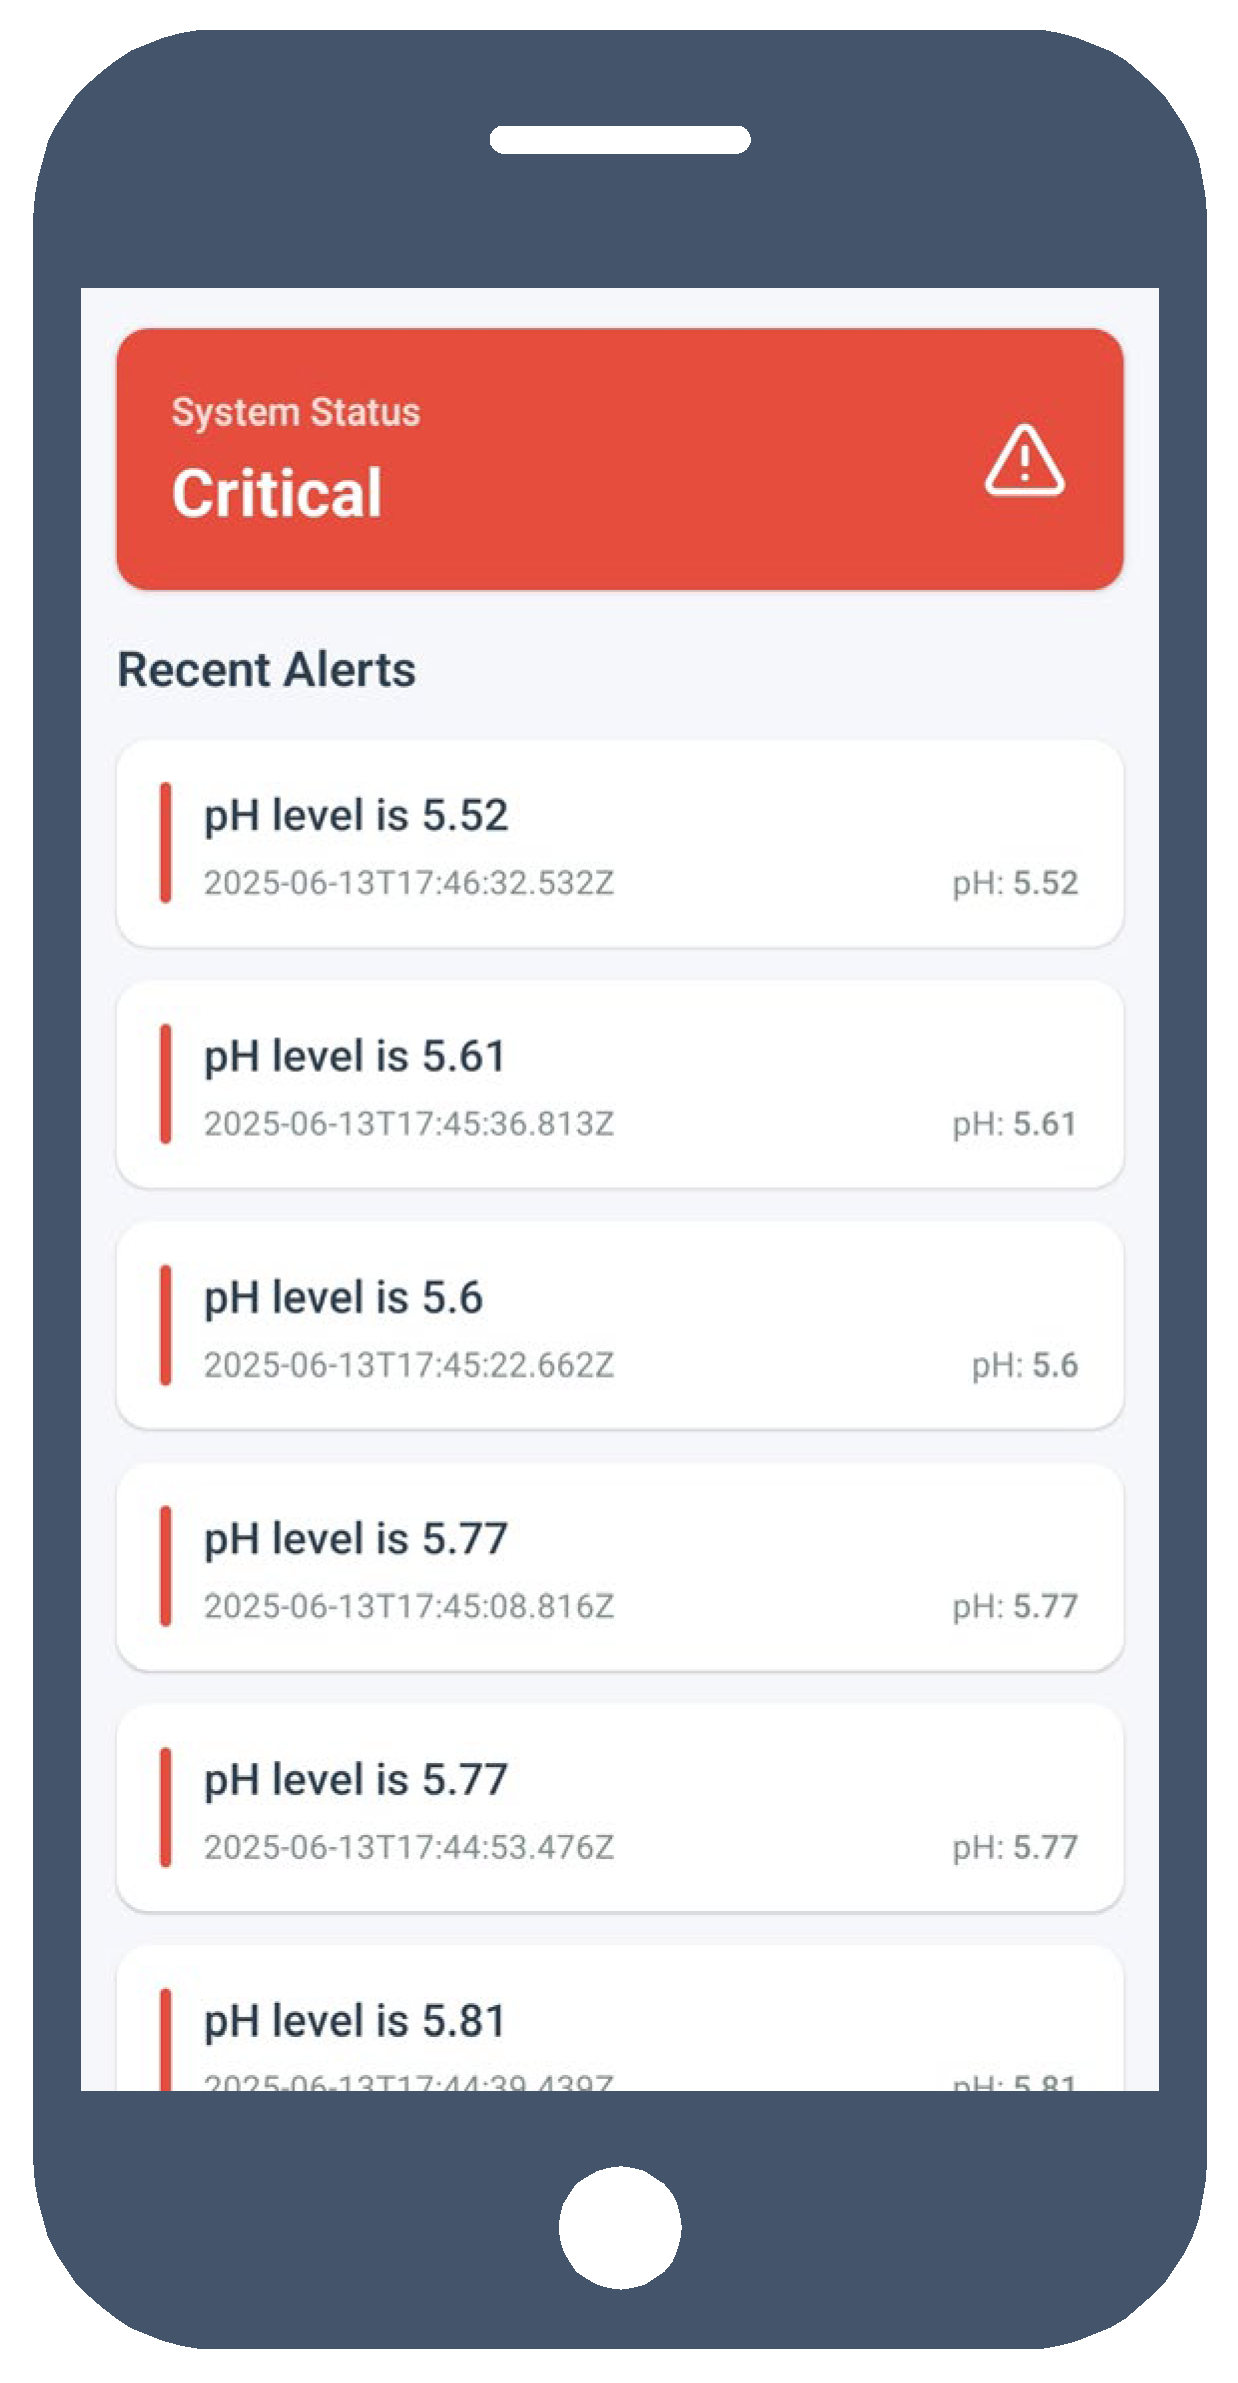
Figure 11.
Disease Detection Page.
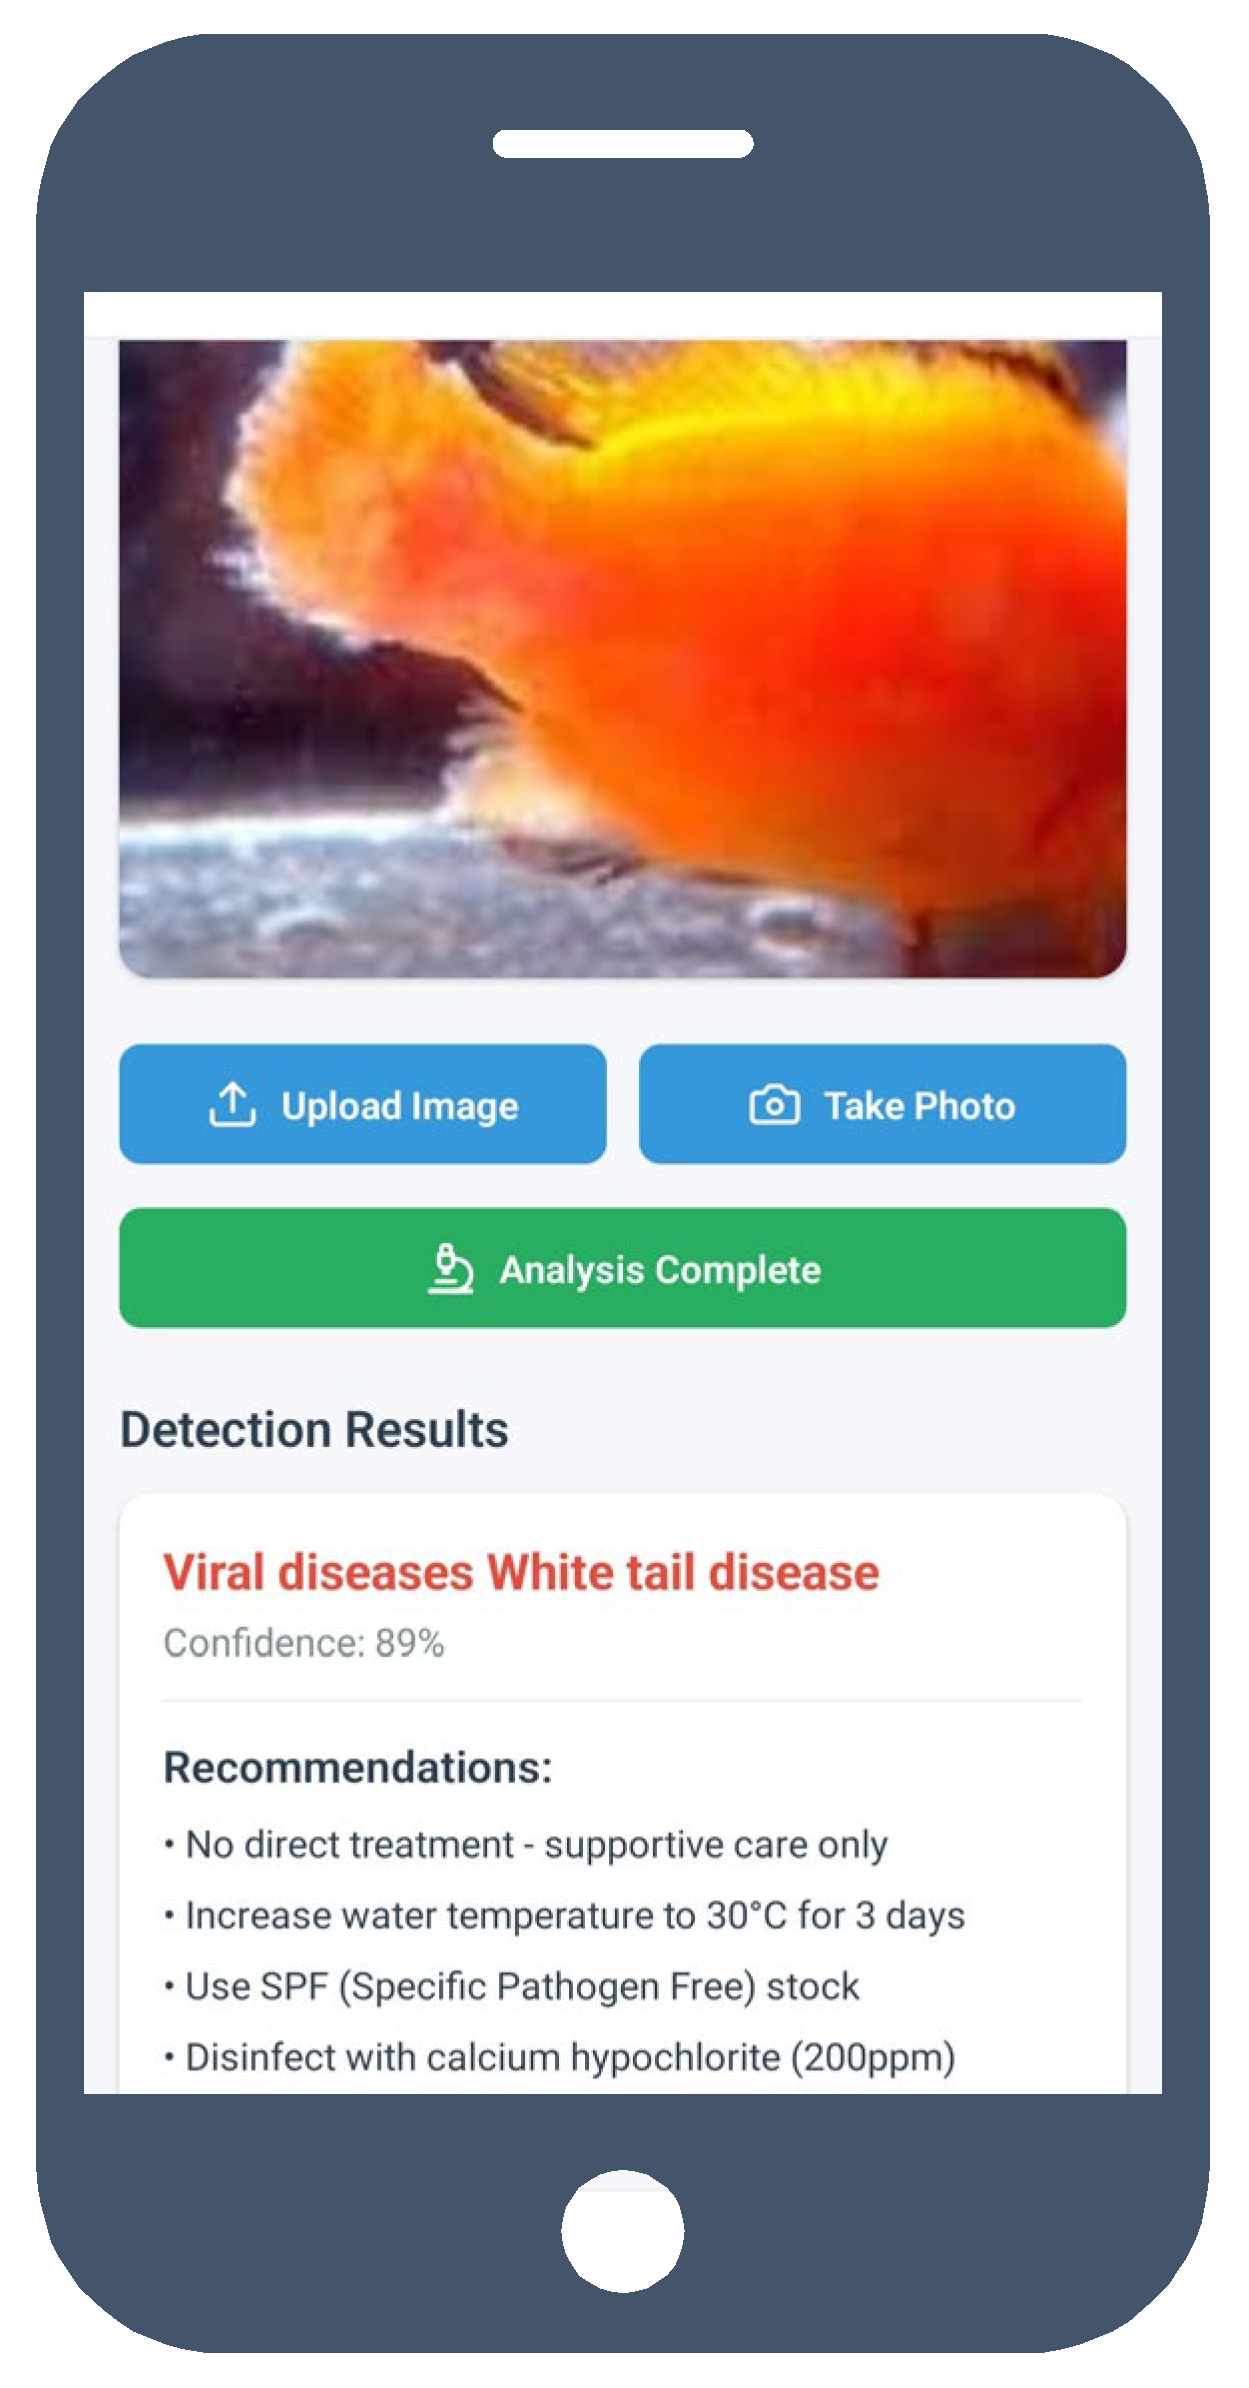

Table 1.
Model performance.
| Disease Class | Precision | Recall | mAP50 |
|---|---|---|---|
| All Classes | 0.969 | 0.912 | 0.983 |
| Bacterial Red disease | 0.975 | 0.945 | 0.988 |
| Bacterial diseases-Aeromoniasis | 0.992 | 0.866 | 0.979 |
| Bacterial gill disease | 0.952 | 0.971 | 0.993 |
| Fungal diseases Saprolegniasis | 0.985 | 0.910 | 0.991 |
| Healthy Fish | 0.930 | 0.889 | 0.975 |
| Parasitic diseases | 0.945 | 0.909 | 0.978 |
| Viral diseases White tail disease | 0.979 | 0.894 | 0.977 |
Table 2.
Comparative Analysis of Existing Approaches.
| Study / Reference | Technology Focus | Parameters Monitored | AI / Model Used | Reported Accuracy / mAP | Key Features | Limitations |
|---|---|---|---|---|---|---|
| Tsai et al. [9] (2021) | IoT + Fuzzy Logic | Temp., pH, DO, Hardness | Fuzzy Control System | Improved shrimp survival +33% | Automated feeding & aeration | No AI-based disease detection |
| Nguyen et al. [11] (2022) | Edge IoT + LSTM | Temp., pH | LSTM Forecasting | – (High reliability, fast response) | Predictive water quality trends | No image-based diagnostics |
| Saosing & Nattawuttisit [12] (2023) | Vision-based YOLOv5s | Visual monitoring | YOLOv5s | F1-score: 0.85–0.93 | Fish counting & behavior analysis | Sensitive to lighting conditions |
| Razali et al. [15] (2024) | IoT + ML (Random Forest) | Temp., DO, Turbidity, Water Level | Random Forest Classifier | Accuracy: 92.3% | Water quality classification | Limited to 1D sensor data |
| Eso et al. [16] (2024) | IoT + MQTT Dashboard | pH, Temp., Salinity | Threshold-based logic | Sensor accuracy: >98% | Real-time alerts | No AI / disease detection |
| Proposed System (2025) | IoT + AI (YOLOv8n) | pH, Temp., Fish Health (Image) | YOLOv8n (TFLite) | Precision: 0.969, Recall: 0.912, mAP@0.5: 0.983 | Real-time disease detection, cloud dashboard, mobile alerts | Slight recall drop in Aeromoniasis class |
Disclaimer/Publisher’s Note: The statements, opinions and data contained in all publications are solely those of the individual author(s) and contributor(s) and not of MDPI and/or the editor(s). MDPI and/or the editor(s) disclaim responsibility for any injury to people or property resulting from any ideas, methods, instructions or products referred to in the content. |
© 2025 by the authors. Licensee MDPI, Basel, Switzerland. This article is an open access article distributed under the terms and conditions of the Creative Commons Attribution (CC BY) license (http://creativecommons.org/licenses/by/4.0/).
Copyright: This open access article is published under a Creative Commons CC BY 4.0 license, which permit the free download, distribution, and reuse, provided that the author and preprint are cited in any reuse.


