Submitted:
19 November 2025
Posted:
20 November 2025
You are already at the latest version
Abstract
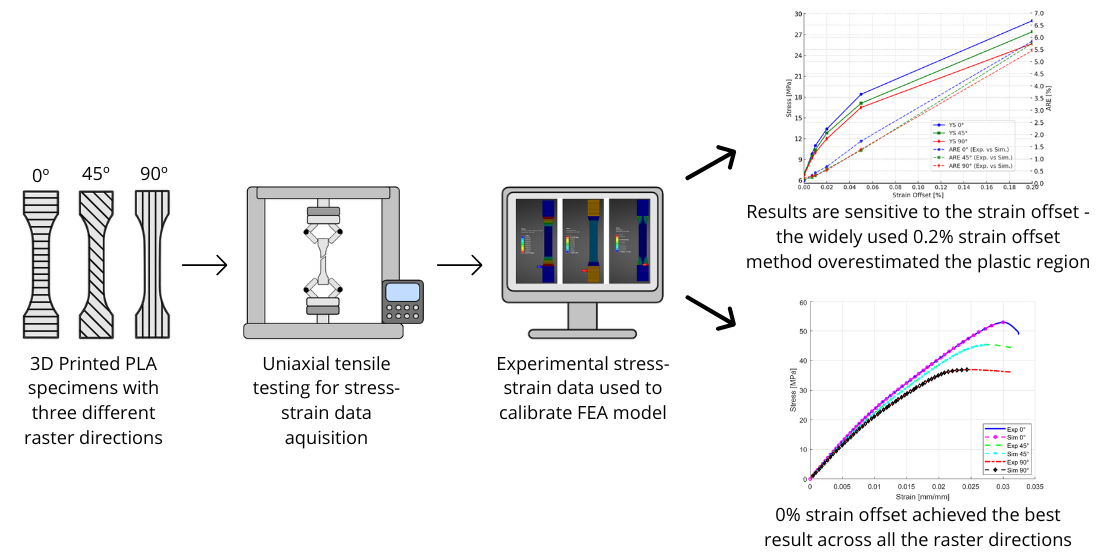
Computational mechanics is one of the techniques used to predict and optimize material behavior and structural performance. However, modeling a complex material model and achieving an accurate response in finite element analysis (FEA) remains a challenge. This study investigates the mechanical material properties of 3D-printed polylactic acid (PLA) by integrating tensile testing and FEA to optimize material behavior. The tensile testing was conducted on three different raster orientations (0°, 45°, and 90°) and the resultant stress-strain data were used to calibrate FEA models. For FEA non-linear material model-ing, isotropic elasticity combined with a multilinear plasticity model was used, where the yield stress values were determined by using the strain offset method. Six different strain offsets (SO), i.e., 0%, 0.007%, 0.01%, 0.02%, 0,05%, and 0,2%, were analyzed to evaluate their impact on the accuracy of FEA results against experimental results. The results high-light a significant influence of strain offset selection on the plastic region estimation and overall accuracy. The commonly used 0.2% strain offset method (SOM) significantly over-estimated the plastic region, while 0% strain offset provided the most accurate simulation response. These results emphasize the importance of selecting the correct yield stress val-ue for 3D-printed nonlinear material modeling in FEA simulations.
Keywords:
additive manufacturing
; finite element analysis (FEA)
; non-linear material modeling
; polylactic acid (PLA)
; strain offset method
1. Introduction
3D printing is one of the most promising and rapid prototyping technologies that offers a great benefit in production cost reduction, material waste, and labor requirements [1]. Initially, 3D printing was only restricted to testing and experimental purposes [2], but nowadays, due to its ability to manufacture a complex geometry and ease of processing, it is widely used in many areas like aerospace, construction, civil engineering, industrial design, education, medical research, automotive industry, and robotics [3,4,5,6,7,8,9,10,11].
Polymers are the most commonly used materials in 3D printing and can be processed with various printing technologies. Among these, one of the most promising techniques is the fused deposition method (FDM) [2]. There are many materials available in the market for 3D printing like polylactic acid (PLA), acrylonitrile butadiene styrene (ABS), thermoplastic polyurethane (TPU), nylon, polycarbonate (PC), polyethylene terephthalate (PET), polypropylene (PP), polyethylene (PE), polycaprolactone (PCL), polyether ether ketone (PEEK), etc. [12,13,14,15]. Among these, PLA is the most popular one due to its properties. It is cheap, easy to print, biodegradable and stable during the printing process [2,12]. However, the challenge of using 3D printed PLA is the change in mechanical properties when compared to bulk PLA, due to its dependency on printing parameters, such as infill density, infill orientation, infill pattern, printer nozzle, printer type, bed temperature, printing orientation, printing speed, etc. [16,17,18,19,20,21]. This issue is particularly critical when designing 3D-printed parts for load-bearing applications [22]. Therefore, to optimize its performance it is important to understand the material behavior under mechanical load for structural load-bearing applications.
Tensile testing is a common experimental method to evaluate the key mechanical parameters, such as Young’s modulus, yield stress, ultimate tensile stress, Poisson's ratio, and elongation strain at break. Several studies can be found in the literature that investigate the tensile properties of 3D printed PLA [1,2,12,15,19,22,23]. Most of the studies are focused on tensile properties because they provide a good understanding of the elastic coefficient of the printed material. It was reported that infill density and raster orientation play a significant role in the tensile strength of the material [24,25]. It was also reported that choosing different raster angles during 3D printing, such as 0°, 45° and 90° has a significant impact on the mechanical properties [18]. Furthermore, numerous research focused on infill density which is directly proportional to tensile loading and plays a significant role in the strength of 3D-printed materials. In general, a higher infill density results in a higher ultimate tensile strength [26,27]. Therefore, characterizing these parameters and material properties through experiments and computational approaches is essential and crucial for the effective material model.
Due to the strong dependency of the manufacturing parameters of 3D printed PLA on its mechanical behavior, the integration of finite element tools can be a good choice to characterize the material properties [28]. Other researchers conducted an FEA study to find von Misses stresses, which focused on 3D printed polymers by using 100% infill and comparing the tensile and compression results for better characterization [29]. Because of the complexity and high dependency on the currently used procedure, the evaluation of material properties does not ensure a consistent result that could be used in numerical simulation effectively [2]. Other studies attempted the mechanical simulation of 3D printed parts [30,31]. However, all of them found challenges to get an accurate simulation response against experimental response, which highlights the need for further research in FEA simulation for 3D printed parts to analyze the non-linear behavior under tensile loading [2,32,33,34,35].
To define the non-linear behavior in FEA, the yield stress value calculation method plays a critical role. Most of the studies have used the 0.2% SOM to determine the yield stress from experimental data [2,35,36]. Because of PLA brittle behavior, a 0.2% SO can overestimate the plastic region which may lead to a wrong simulation response. A study focused on the FE simulation model for human bone concluded that 0.2% strain offset value for yield stress caused the FE model to over-predict force-displacement simulation response compared to the experimental response due to the brittle behavior of bone [37].
Therefore, in this study, a non-linear FEA model is developed to simulate the stress-strain response of 3D printed PLA to investigate the mechanical behavior under tension. Also, different strain offsets were tested to determine the yield stress values and define their effect on the simulation response. Different infill orientations, i.e., 0°, 45° and 90° were tested to ensure and validate the simulation model against different SO´s yield stress values. The goal is to achieve the appropriate yield stress value that accurately represents the experimental data in FE simulation models. Furthermore, the FEA model was validated against the experimental data, which was also conducted for this study. It is expected that this research provides a better understanding into improving the FEA models for 3D printed materials to improve the design and performance in additive manufacturing applications.
2. Materials and Methods
2.1. Experimental Procedure
The test specimens using in this work were 3D printed on a BambuLab X1C and the material used was Flashforged PLA filament. Three different raster orientations, i.e., 0°, 45° and 90°, were printed as shown in Figure 1. The key process parameters of the 3D printed specimens are shown in Table 1.
Tensile testing was conducted on a Instron 5969 universal tensile testing machine. Specimens were prepared and tested according to the ASTM D638 standard test methods for tensile properties of materials [38]. To ensure a consistent experimental response, a total of five specimens were printed for each orientation. The tensile testing machine grips were displaced at the speed of 5 mm/min and the force-displacement data was recorded. The testing setup for the tensile testing can be seen in Figure 2. The specimen geometry, designed using SolidWorks 2025, is shown in Figure 3.
2.2. Finite Element Analysis
Regarding the computational technique, FEA was used to simulate the tensile loading on the 3D printed PLA specimen until the ultimate tensile stress, just before the necking or failure. Ansys Mechanical Enterprise 2024 R2 was the software used to create those simulations. The same geometry as in the tensile testing experiments was used to capture a similar simulation behavior.
Figure 4 shows the mesh sensitivity analysis performed to make the FEA mesh-independent model achieve discrete results only based on boundary conditions, geometry, and material properties. The graph shows that the stress remained unchanged until the element size reached 1 mm, indicating that it did not affect the results and that they were independent of the mesh. Figure 5 shows the mesh configuration and boundary condition (BC) used in FEA. The finer mesh was used in the strain gauge area compared to the grip area to account for higher stress concentration in the middle of the specimen while optimizing computational efficiency and ensuring accurate results.
For further validation of the mesh quality, mesh metrics were also analyzed in Ansys. As shown in Figure 6, the values of the Jacobian ratio are close to 1 for all the elements, which indicates minimum element distortion and less deviation in simulation results [39]. An aspect ratio of less than 3, along with skewness lower than 0.25 ensures solver stability and reliable results.
2.2.1. Material Properties and Yield Stress Calculation
For the FEA setup and to accurately capture the material’s nonlinear behavior, isotropic elasticity combined with a multilinear plasticity model was used for each infill raster orientation, previously shown in Figure 1. To ensure an accurate elastic response and material initial stiffness, Young’s modulus (E) was calculated from the linear region of the experimental stress-strain data. However, Poisson’s ratio (v) was adopted from literature with a value of 0.33, as commonly reported for 3D printed PLA with 100% infill [40,41]. Table 2 summarizes the material properties obtained from experiments for FEA material modeling.
To model material plasticity in Ansys, multilinear stress-strain curves were obtained from experimental data by using equations 1-3 [42,43]. The yield stress values were determined using the SOM, where different SO percentages i.e., 0%, 0.007%, 0.01%, 0.02%, 0.05%, and 0.2% (as shown in Figure 7) were analyzed to find the most suitable offset that optimized the simulation response against the experimental response. During the material modeling, it was noticed that yield stress values significantly influence the simulation response. To improve accuracy, different SO values were evaluated to obtain a close correlation between FEA response and experimental response.
whereas , , , , and E represent true stress, engineering stress, engineering strain, true strain, true plastic strain, and Young’s modulus respectively.
3. Results and Discussions
This section presents and analyses experimental and simulation results. A comparison between both results is conducted by evaluating different SO values to determine the most accurate correlation.
3.1. Tensile Testing Results
A total of five specimens were tested at each raster orientation angle. Figure 8 presents the true stress-strain representative curves for each raster orientation, as true stress-strain data is required in Ansys Workbench 2022 R2 for accurate simulation setup [43].
The curve shows that 0° raster orientation produced the strongest specimen with the ultimate tensile stress (UTS) of 52.93 MPa. The 45° raster orientation produced the second strongest specimen and 90° was the weakest (considering the specific manufacturing parameters stated previously in Table 1).
3.2. FEA Simulation Results
To investigate the impact of SO selection on the yield stress values across different raster orientations, an FEA model was developed. Additionally, as previously discussed in Section 2.2., mesh sensitivity test and mesh metrics were evaluated to ensure that the simulation results were independent of element size. The conventional 0.2% strain offset method [36,37], which is commonly used to find yield stress values, was initially applied in material modeling for all raster orientations. Figure 9 shows a comparison between experimental and simulation results, where 0.2% SO yield stress values overestimate the plastic region resulting in inconsistent simulation and experimental responses with the approximate absolute relative error (ARE) of 5.84%, 5.75% and 5.46%, respectively.
To optimize the material model and achieve less absolute relative error (ARE) between simulations and experimental responses, the optimization methodology presented in Figure 10 was applied. Apart from 0.2% SO, lower SO´s of 0%, 0.007%, 0.01%, 0.02%, and 0.05% were tested. As shown in Figure 11, the ARE of the simulation response compared to the experimental response is presented alongside the yield stress values at different strain offset percentages. The comparison between experimental and simulation results across various strain offset points reveals that a 0.2% strain offset leads to an overestimation of the plastic region. However, reducing the offset values results in improved consistency between the simulation and experimental responses.
3.3. Validation and Discussion
The results obtained in Figure 11 highlight the importance of selecting the accurate value of the yield stress to perform precise FEA simulations. The results show that the conventional 0.2% SOM may not always provide accurate material representation, especially for 3D printed material like PLA. It can be seen that reducing the strain offset values also reduces the ARE, which demonstrates the ARE and SO values are directly proportional to each other for the current case scenario. Table 3 presents data corresponding to Figure 11, which shows a comparison between the yield stress values for different strain offsets and ARE (%) between experimental and simulation responses.
Table 3 shows that 0% SO provides the best result with ARE of 0.1%, 0.16%, and 0.21% for 0°, 45°, and 90° raster orientations, respectively. Notably, by using 0% SO the value of yield stress is very low compared to the other studies found in the literature [2,12,15,44]. However, it accurately reflects the specific manufacturing parameters used during 3D printing [26,45,46]. Table 4 summarizes the final findings, including the optimized material properties extracted using the 0% strain offset method for FEA material modeling. Additionally, Figure 12 shows the comparison between the optimized simulation response and the experimental response, demonstrating the improved accuracy achieved through this approach.
Since this study did not focus on the fracture behavior of PLA, Figure 13 presents the von Mises stress distribution for 0°, 45°, and 90° raster orientations, highlighting the maximum stress region before failure. These stress distributions can help predict potential crack initiation points and serve as a validation tool for the simulation model when compared with the experimental maximum stress values listed in Table 4.
4. Conclusions
This study underlines that selecting the appropriate yield stress value to define the plasticity model in FEA plays a significant role in the accuracy of simulation results. The widely used 0.2% SOM led to overestimating the plastic region and inaccurate simulation response. Based on our findings, the SOM with an offset of 0% is recommended for calculating yield stress in tensile tests under specific manufacturing parameters. It is also recommended that the choice of strain offset totally depends on the manufacturing parameters and should be optimized accordingly.
As shown in this work, PLA exhibits orientation-dependent mechanical properties including variations in Young’s modulus, and ultimate tensile strength against different raster orientations (0°, 45°, and 90°). This study highlights that while an isotropic material model can approximate the response for each raster orientation, considering the anisotropic material model leads to more realistic results. However, this study only focuses on the isotropic material model to understand the fundamental material behavior based on manufacturing parameters and working conditions. The isotropic material approach can be used to predict material properties while optimizing computational efficiency. Therefore, the isotropic material approach is essential before developing a more complex model such as the anisotropic.
Future work may include different test types such as three-point bending tests and different materials like PC, PET, or TPU, and even different 3D printing manufacturing parameters and techniques (SLA). Additionally, different strain rates can be explored to investigate the material responses and the influence of different SO% on simulation responses.
Author Contributions
Conceptualization, M.M.; methodology, M.M. and R.S.; software, M.M. and R.S.; validation, M.M., R.S. and P.P.; formal analysis, M.M.; investigation, M.M.; resources, P.P.; data curation, M.M., R.S.; writing—original draft preparation, M.M.; writing—review and editing, R.S., D-.N.F., and P.P.; visualization, M.M..; supervision, P.P.; project administration, P.P.; funding acquisition, P.P. All authors have read and agreed to the published version of the manuscript.
Funding
This work has been supported by the European Union under the NextGenerationEU, through a grant of the Portuguese Republic's Recovery and Resilience Plan (PRR) Partnership Agreement, within the scope of the project BE.NEUTRAL – Agenda da Mobilidade para a neutralidade carbónica das cidades (Project ref. nr. 35 - C644874240-00000016).
Institutional Review Board Statement
Not applicable.
Data Availability Statement
Data are available upon request to the corresponding authors.
Conflicts of Interest
The authors declare no conflicts of interest. The funders had no role in the design of the study; in the collection, analyses, or interpretation of data; in the writing of the manuscript; or in the decision to publish the results.
References
- H. Gonabadi, A. Yadav, and S. J. Bull, “The effect of processing parameters on the mechanical characteristics of PLA produced by a 3D FFF printer,” International Journal of Advanced Manufacturing Technology, vol. 111, no. 3–4, pp. 695–709, Nov. 2020. [CrossRef]
- M. Alharbi, I. Kong, and V. I. Patel, “Simulation of uniaxial stress–strain response of 3D-printed polylactic acid by nonlinear finite element analysis,” Applied Adhesion Science, vol. 8, no. 1, pp. 1–10, Dec. 2020. [CrossRef]
- J. C. Vasco, “Additive manufacturing for the automotive industry,” Addit Manuf, pp. 505–530, Jan. 2021. [CrossRef]
- S. Ji and M. Guvendiren, “Recent Advances in Bioink Design for 3D Bioprinting of Tissues and Organs,” Front Bioeng Biotechnol, vol. 5, no. APR, p. 256815, Apr. 2017. [CrossRef]
- S. Knowlton, B. Yenilmez, and S. Tasoglu, “Towards Single-Step Biofabrication of Organs on a Chip via 3D Printing,” Trends Biotechnol, vol. 34, no. 9, pp. 685–688, Sep. 2016. [CrossRef]
- S. Ghaffar and P. Mullett, “Commentary: 3D printing set to transform the construction industry,” https://doi.org/10.1680/jstbu.18.00136, vol. 171, no. 10, pp. 737–738, Sep. 2018. [CrossRef]
- N. Labonnote, A. Rønnquist, B. Manum, and P. Rüther, “Additive construction: State-of-the-art, challenges and opportunities,” Autom Constr, vol. 72, pp. 347–366, Dec. 2016. 2016. [CrossRef]
- W. C. Tse and Y. H. Chen, “Robotic system for rapid prototyping,” Proc IEEE Int Conf Robot Autom, vol. 3, pp. 1815–1820, 1997. [CrossRef]
- C. Lee Ventola, “Medical Applications for 3D Printing: Current and Projected Uses,” Pharmacy and Therapeutics, vol. 39, no. 10, p. 704, Oct. 2014, Accessed: Feb. 18, 2025. [Online]. Available: https://pmc.ncbi.nlm.nih.gov/articles/PMC4189697/.
- S. Ford and T. Minshall, “Invited review article: Where and how 3D printing is used in teaching and education,” Addit Manuf, vol. 25, pp. 131–150, Jan. 2019. [CrossRef]
- L. E. Murr, “Frontiers of 3D Printing/Additive Manufacturing: from Human Organs to Aircraft Fabrication,” J Mater Sci Technol, vol. 32, no. 10, pp. 987–995, Oct. 2016. [CrossRef]
- E. Monaldo, M. Ricci, and S. Marfia, “Mechanical properties of 3D printed polylactic acid elements: Experimental and numerical insights,” Mechanics of Materials, vol. 177, p. 104551, Feb. 2023. [CrossRef]
- Y. Wang and X. Li, “An accurate finite element approach for programming 4D-printed self-morphing structures produced by fused deposition modeling,” Mechanics of Materials, vol. 151, p. 103628, Dec. 2020. [CrossRef]
- B. Hu et al., “Improved design of fused deposition modeling equipment for 3D printing of high-performance PEEK parts,” Mechanics of Materials, vol. 137, p. 103139, Oct. 2019. [CrossRef]
- N. G. Tanikella, B. Wittbrodt, and J. M. Pearce, “Tensile strength of commercial polymer materials for fused filament fabrication 3D printing,” Addit Manuf, vol. 15, pp. 40–47, May 2017. 20 May. [CrossRef]
- K. Ozsoy, I. Un, I. Uygulamalı, B. Üniversitesi, and K. Özsoy, “A Comparative Finite Element Stress Analysis Of Isotropic Matrix And 3D Printed PLA Material,” Isparta, Turkey, Nov. 2019. [Online]. Available: https://www.researchgate.net/publication/338385354.
- Y. H. Huang and C. Y. Lin, “Measurement of Orthotropic Material Constants and Discussion on 3D Printing Parameters in Additive Manufacturing,” Applied Sciences (Switzerland), vol. 12, no. 13, p. 6812, Jul. 2022. [CrossRef]
- T. Letcher and M. Waytashek, “Material property testing of 3D-printed specimen in pla on an entry-level 3D printer,” ASME International Mechanical Engineering Congress and Exposition, Proceedings (IMECE), vol. 2A, 2014. [CrossRef]
- Y. Song, Y. Li, W. Song, K. Yee, K. Y. Lee, and V. L. Tagarielli, “Measurements of the mechanical response of unidirectional 3D-printed PLA,” Mater Des, vol. 123, pp. 154–164, Jun. 2017. [CrossRef]
- H. Gonabadi, A. Yadav, and S. J. Bull, “The effect of processing parameters on the mechanical characteristics of PLA produced by a 3D FFF printer,” International Journal of Advanced Manufacturing Technology, vol. 111, no. 3–4, pp. 695–709, Nov. 2020. [CrossRef]
- S. Pham, V.-T. Minh, T. Nguyen, T. J. Suteja, and A. Soesanti, “Mechanical Properties of 3D Printed Polylactic Acid Product for Various Infill Design Parameters: A Review,” J Phys Conf Ser, vol. 1569, no. 4, p. 042010, Jul. 2020. [CrossRef]
- S. Petersmann et al., “Mechanical properties of polymeric implant materials produced by extrusion-based additive manufacturing,” J Mech Behav Biomed Mater, vol. 104, Apr. 2020. [CrossRef]
- A. Sabik, M. Rucka, A. Andrzejewska, and E. Wojtczak, “Tensile failure study of 3D printed PLA using DIC technique and FEM analysis,” Mechanics of Materials, vol. 175, p. 104506, Dec. 2022. [CrossRef]
- C. Lubombo and M. A. Huneault, “Effect of infill patterns on the mechanical performance of lightweight 3D-printed cellular PLA parts,” Mater Today Commun, vol. 17, pp. 214–228, Dec. [CrossRef]
- C. Abeykoon, P. Sri-Amphorn, and A. Fernando, “Optimization of fused deposition modeling parameters for improved PLA and ABS 3D printed structures,” International Journal of Lightweight Materials and Manufacture, vol. 3, no. 3, pp. 284–297, Sep. 2020. [CrossRef]
- A. Rodríguez-Panes, J. Claver, and A. M. Camacho, “The Influence of Manufacturing Parameters on the Mechanical Behaviour of PLA and ABS Pieces Manufactured by FDM: A Comparative Analysis,” Materials 2018, Vol. 11, Page 1333, vol. 11, no. 8, p. 1333, Aug. 2018. [CrossRef]
- S. C. Ligon, R. Liska, J. Stampfl, M. Gurr, and R. Mülhaupt, “Polymers for 3D Printing and Customized Additive Manufacturing,” Chem Rev, vol. 117, no. 15, pp. 10212–10290, Aug. 2017. [CrossRef]
- E. Provaggi, C. Capelli, B. Rahmani, G. Burriesci, and D. M. Kalaskar, “3D printing assisted finite element analysis for optimising the manufacturing parameters of a lumbar fusion cage,” Mater Des, vol. 163, p. 107540, Feb. 2019. [CrossRef]
- M. M. Pastor-Artigues, F. Roure-Fernández, X. Ayneto-Gubert, J. Bonada-Bo, E. Pérez-Guindal, and I. Buj-Corral, “Elastic Asymmetry of PLA Material in FDM-Printed Parts: Considerations Concerning Experimental Characterisation for Use in Numerical Simulations,” Materials 2020, Vol. 13, Page 15, vol. 13, no. 1, p. 15, Dec. 2019. [CrossRef]
- D. Calneryte et al., “Multi-scale finite element modeling of 3D printed structures subjected to mechanical loads,” Rapid Prototyp J, vol. 24, no. 1, pp. 177–187, 2018. [CrossRef]
- M. H. Ali, G. Yerbolat, and S. Amangeldi, “Material Optimization Method in 3D Printing,” Proceedings of the 2018 IEEE International Conference on Advanced Manufacturing, ICAM 2018, pp. 365–368, Jul. 2018. [CrossRef]
- M. Majeed and R. Venkata Teja Geesala, “Characterization of thin laminate interface by using Double Cantilever Beam and End Notched Flexure tests,” 2020, Accessed: Feb. 19, 2025. [Online]. Available: https://urn.kb.se/resolve?urn=urn:nbn:se:bth-20852.
- L. Geng, W. Wu, L. Sun, and D. Fang, “Damage characterizations and simulation of selective laser melting fabricated 3D re-entrant lattices based on in-situ CT testing and geometric reconstruction,” Int J Mech Sci, vol. 157–158, pp. 231–242, Jul. 2019. [CrossRef]
- S. Bhandari and R. Lopez-Anido, “Finite element analysis of thermoplastic polymer extrusion 3D printed material for mechanical property prediction,” Addit Manuf, vol. 22, pp. 187–196, Aug. 2018. [CrossRef]
- S. Bhandari and R. Lopez-Anido, “Finite element modeling of 3D-printed part with cellular internal structure using homogenized properties,” Progress in Additive Manufacturing, vol. 4, no. 2, pp. 143–154, Jun. 2019. [CrossRef]
- C. Henry et al., “Evaluation of an Alternate Method for Determining Yield Strength Offset Values for Selective Laser Sintered Polymeric Materials,” 2019.
- G. Zhang, J. Luo, G. Zheng, Z. Bai, L. Cao, and H. Mao, “Is the 0.2%-Strain-Offset Approach Appropriate for Calculating the Yield Stress of Cortical Bone?,” Ann Biomed Eng, vol. 49, no. 7, pp. 1747–1760, Jul. 2021. [CrossRef]
- “Standard Test Method for Tensile Properties of Plastics 1”, doi: 10.1520/D0638-14. [CrossRef]
- P. M. Knupp, “Achieving ÿnite element mesh quality via optimization of the Jacobian matrix norm and associated quantities. Part I-a framework for surface mesh optimization ‡,” INTERNATIONAL JOURNAL FOR NUMERICAL METHODS IN ENGINEERING Int. J. Numer. Meth. Engng, vol. 48, pp. 401–420, 2000. [CrossRef]
- A. Liber-Kneć and S. Łagan, “Effect of Mass Reduction of 3D-Printed PLA on Load Transfer Capacity—A Circular Economy Perspective,” Materials, vol. 18, no. 14, Jul. 2025. [CrossRef]
- X. Wang, L. Zhao, J. Y. H. Fuh, and H. P. Lee, “Effect of porosity on mechanical properties of 3D printed polymers: Experiments and micromechanical modeling based on X-ray computed tomography analysis,” Polymers (Basel), vol. 11, no. 7, 2019. [CrossRef]
- “Defining plasticity in Abaqus.” Accessed: Feb. 27, 2025. [Online]. Available: https://abaqus-docs.mit.edu/2017/English/SIMACAEGSARefMap/simagsa-c-matdefining.htm#simagsa-c-matdefining__simagsa-c-mat-stress-table.
- I. Ansys, “LSDYNA From engineering to true strain, true stress.” Accessed: Feb. 20, 2025. [Online]. Available: https://lsdyna.ansys.com/from-engineering-to-true-strain-true-stress/.
- M. Zouaoui, J. Gardan, P. Lafon, A. Makke, C. Labergere, and N. Recho, “A Finite Element Method to Predict the Mechanical Behavior of a Pre-Structured Material Manufactured by Fused Filament Fabrication in 3D Printing,” Applied Sciences 2021, Vol. 11, Page 5075, vol. 11, no. 11, p. 5075, May 2021. [CrossRef]
- M. R. Khosravani, F. Berto, M. R. Ayatollahi, and T. Reinicke, “Characterization of 3D-printed PLA parts with different raster orientations and printing speeds,” Sci Rep, vol. 12, no. 1, p. 1016, Dec. 2022. [CrossRef]
- J. A. Travieso-Rodriguez, R. Jerez-Mesa, J. Llumà, O. Traver-Ramos, G. Gomez-Gras, and J. J. R. Rovira, “Mechanical Properties of 3D-Printing Polylactic Acid Parts subjected to Bending Stress and Fatigue Testing,” Materials, vol. 12, no. 23, p. 3859, Dec. 2019. [CrossRef]
Figure 1.
Raster orientation representation, top 0°, middle 45°, and bottom 90°.
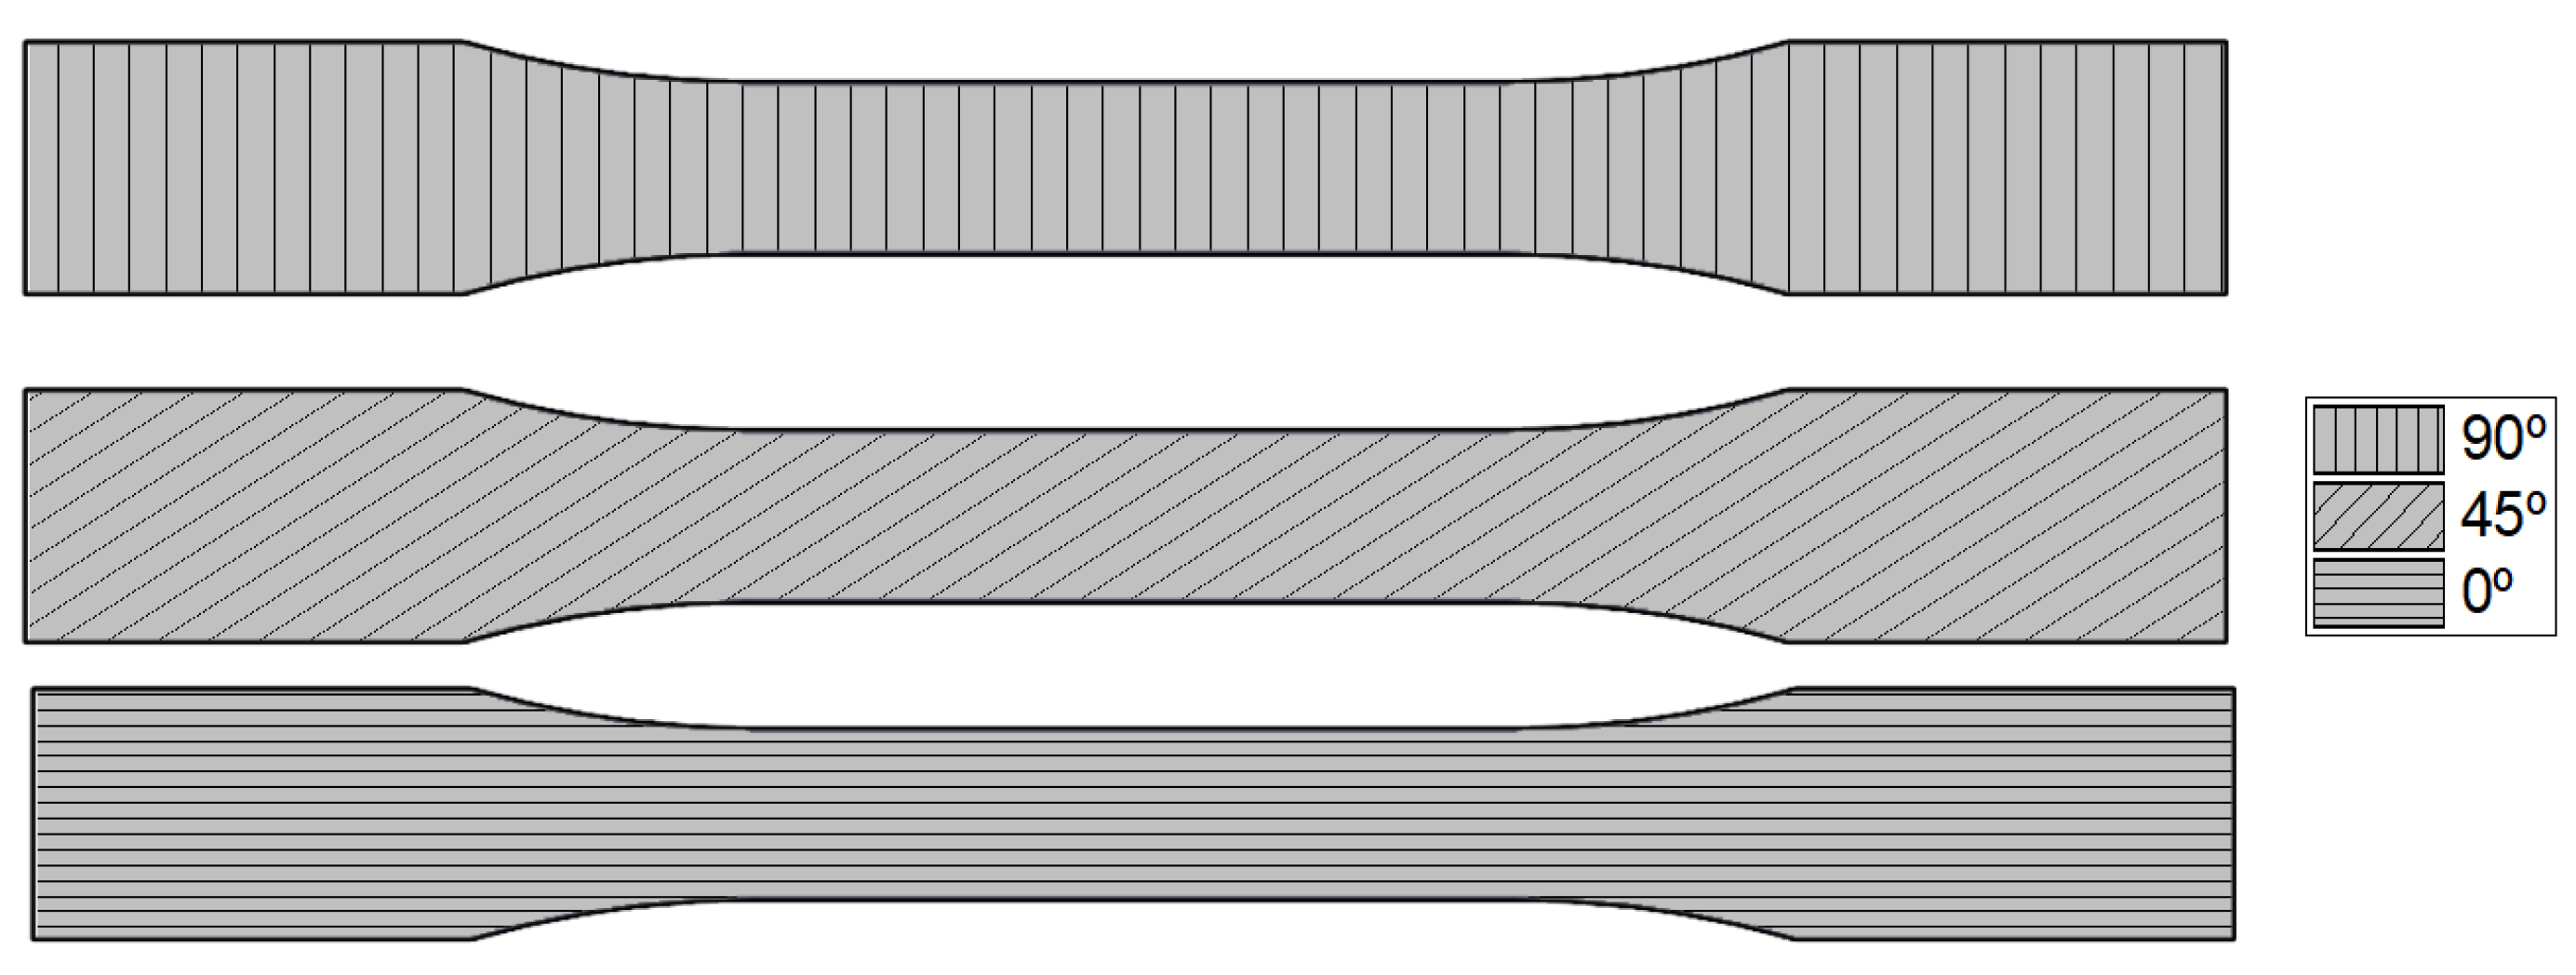
Figure 2.
Experimental setup: (a) set of five ASTM D638 dog-bone-shaped specimens; (b) Tensile testing setup; (c) Specimen under tensile loading; (d) Failure of the specimen after reaching the breaking point.
Figure 2.
Experimental setup: (a) set of five ASTM D638 dog-bone-shaped specimens; (b) Tensile testing setup; (c) Specimen under tensile loading; (d) Failure of the specimen after reaching the breaking point.
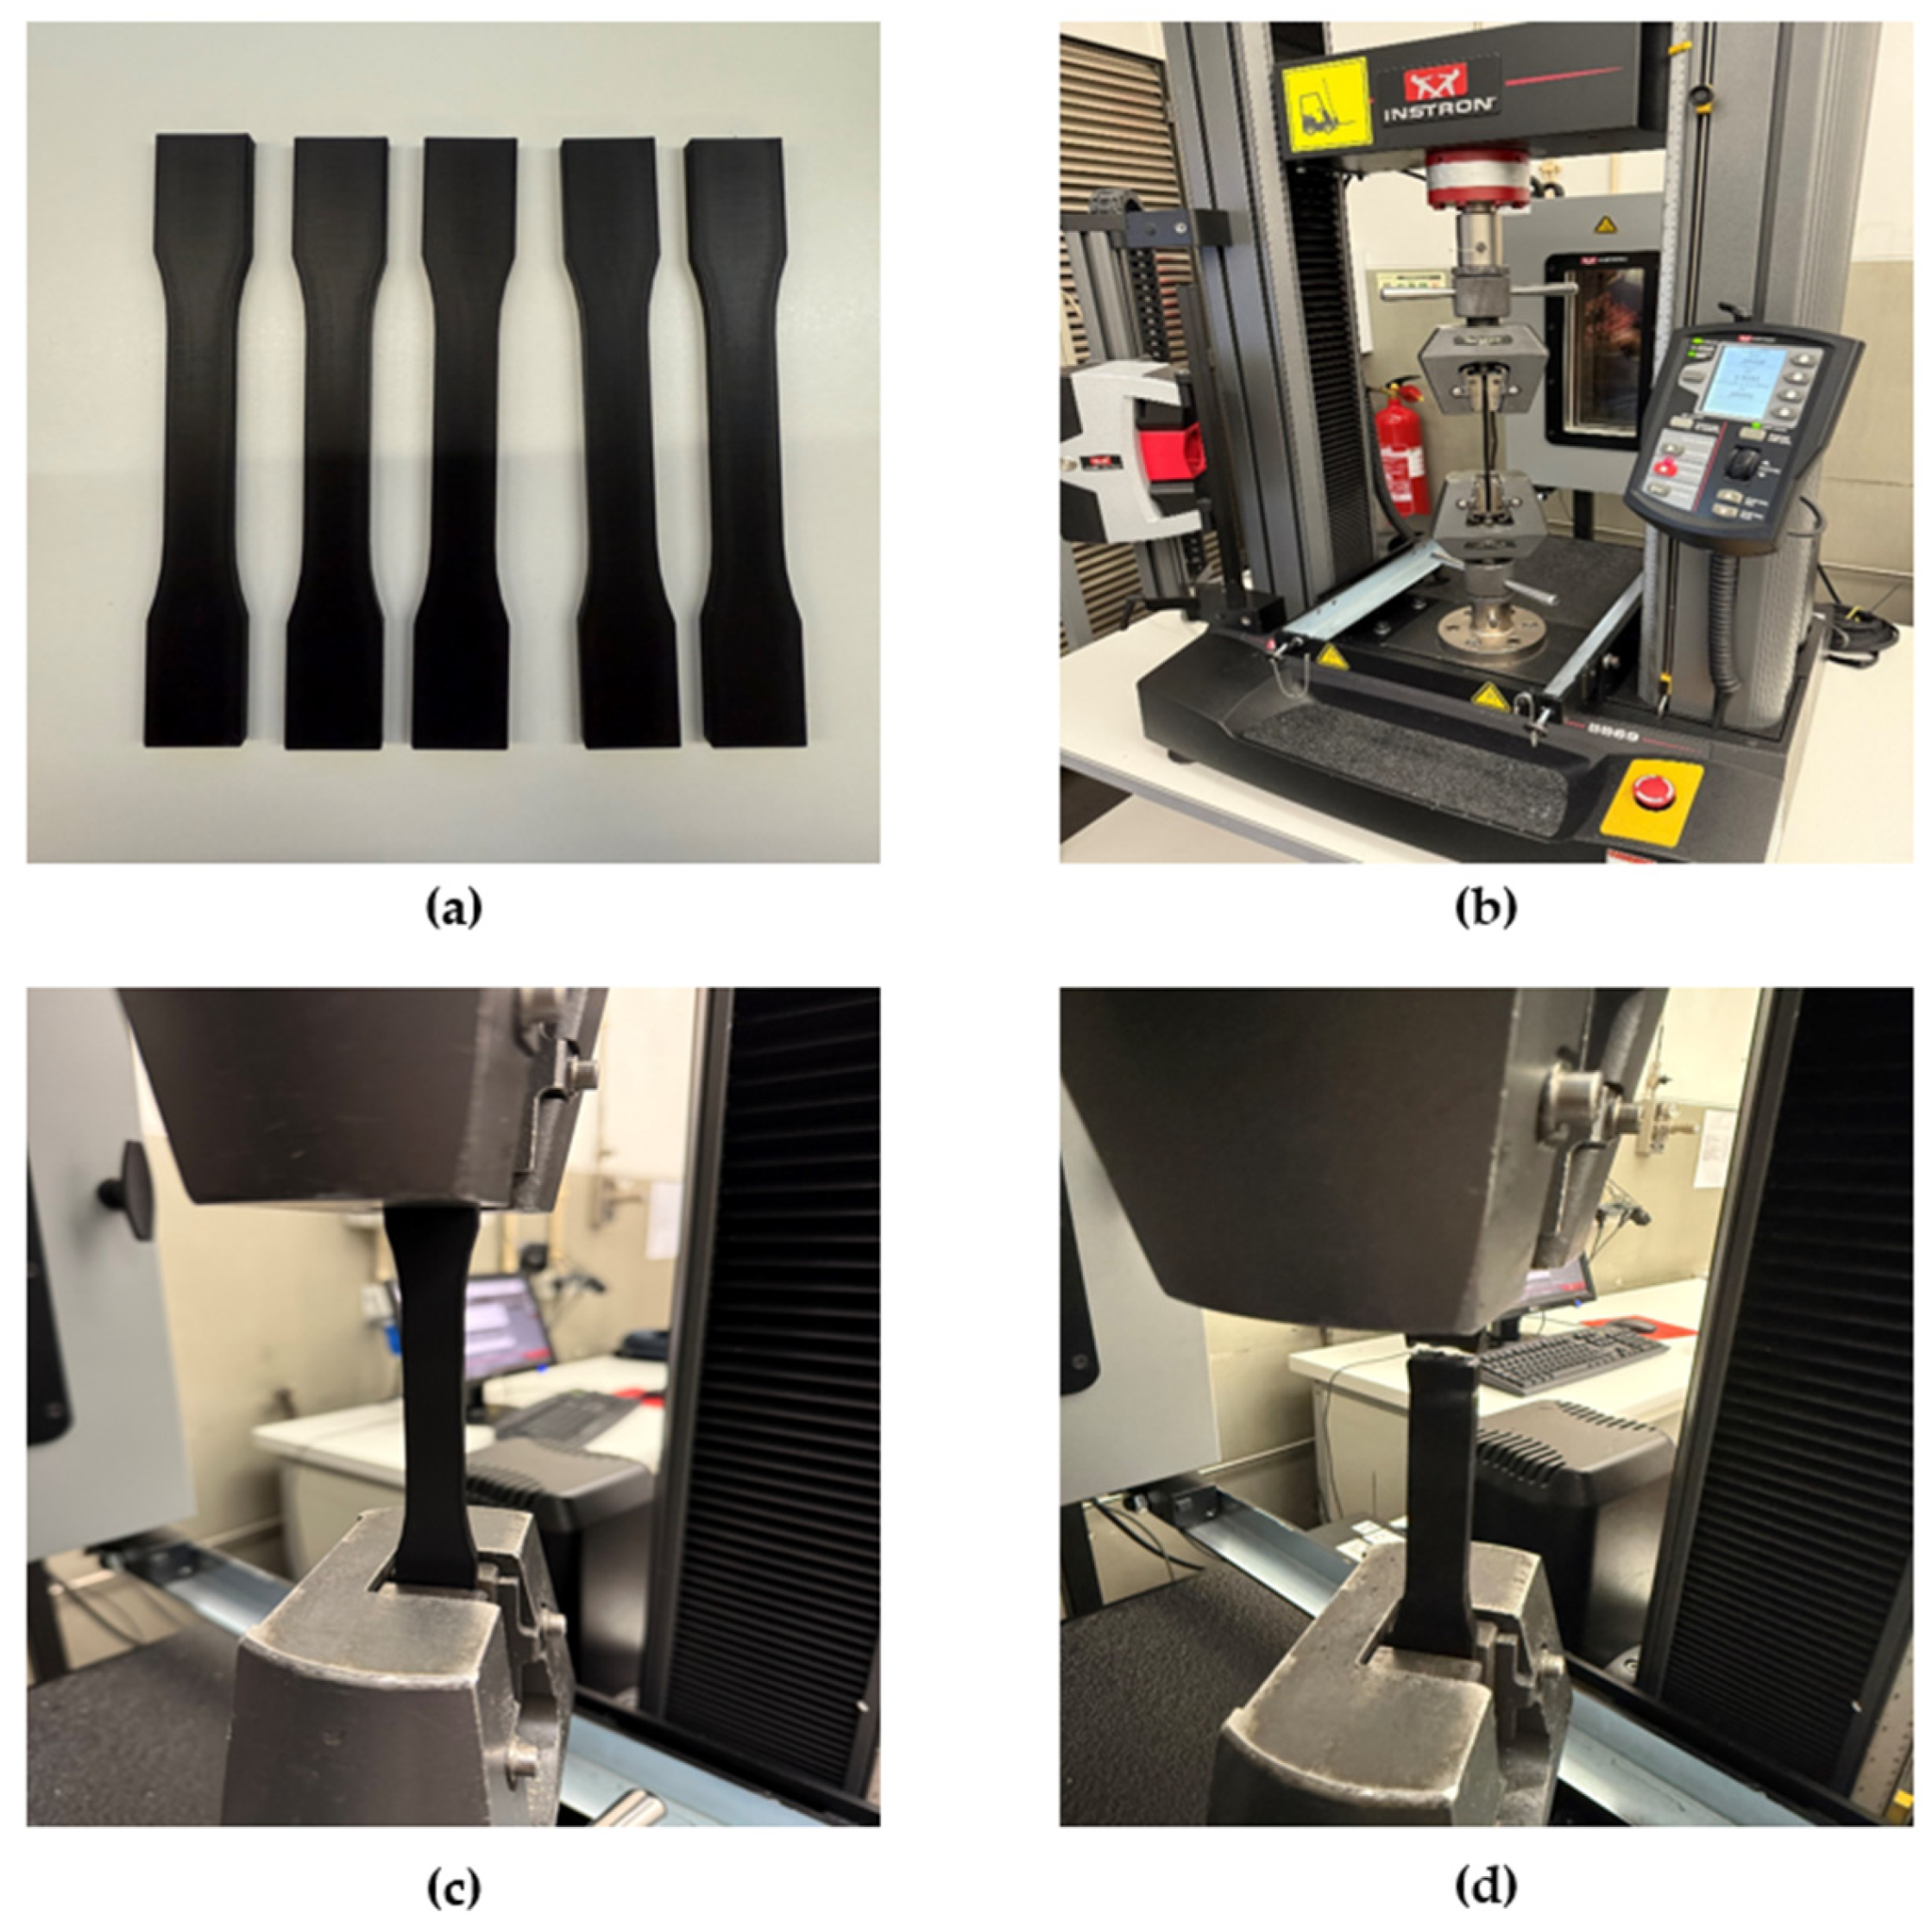
Figure 3.
3D printed specimen dimensions [mm] – ASTM D638 – Type 1.
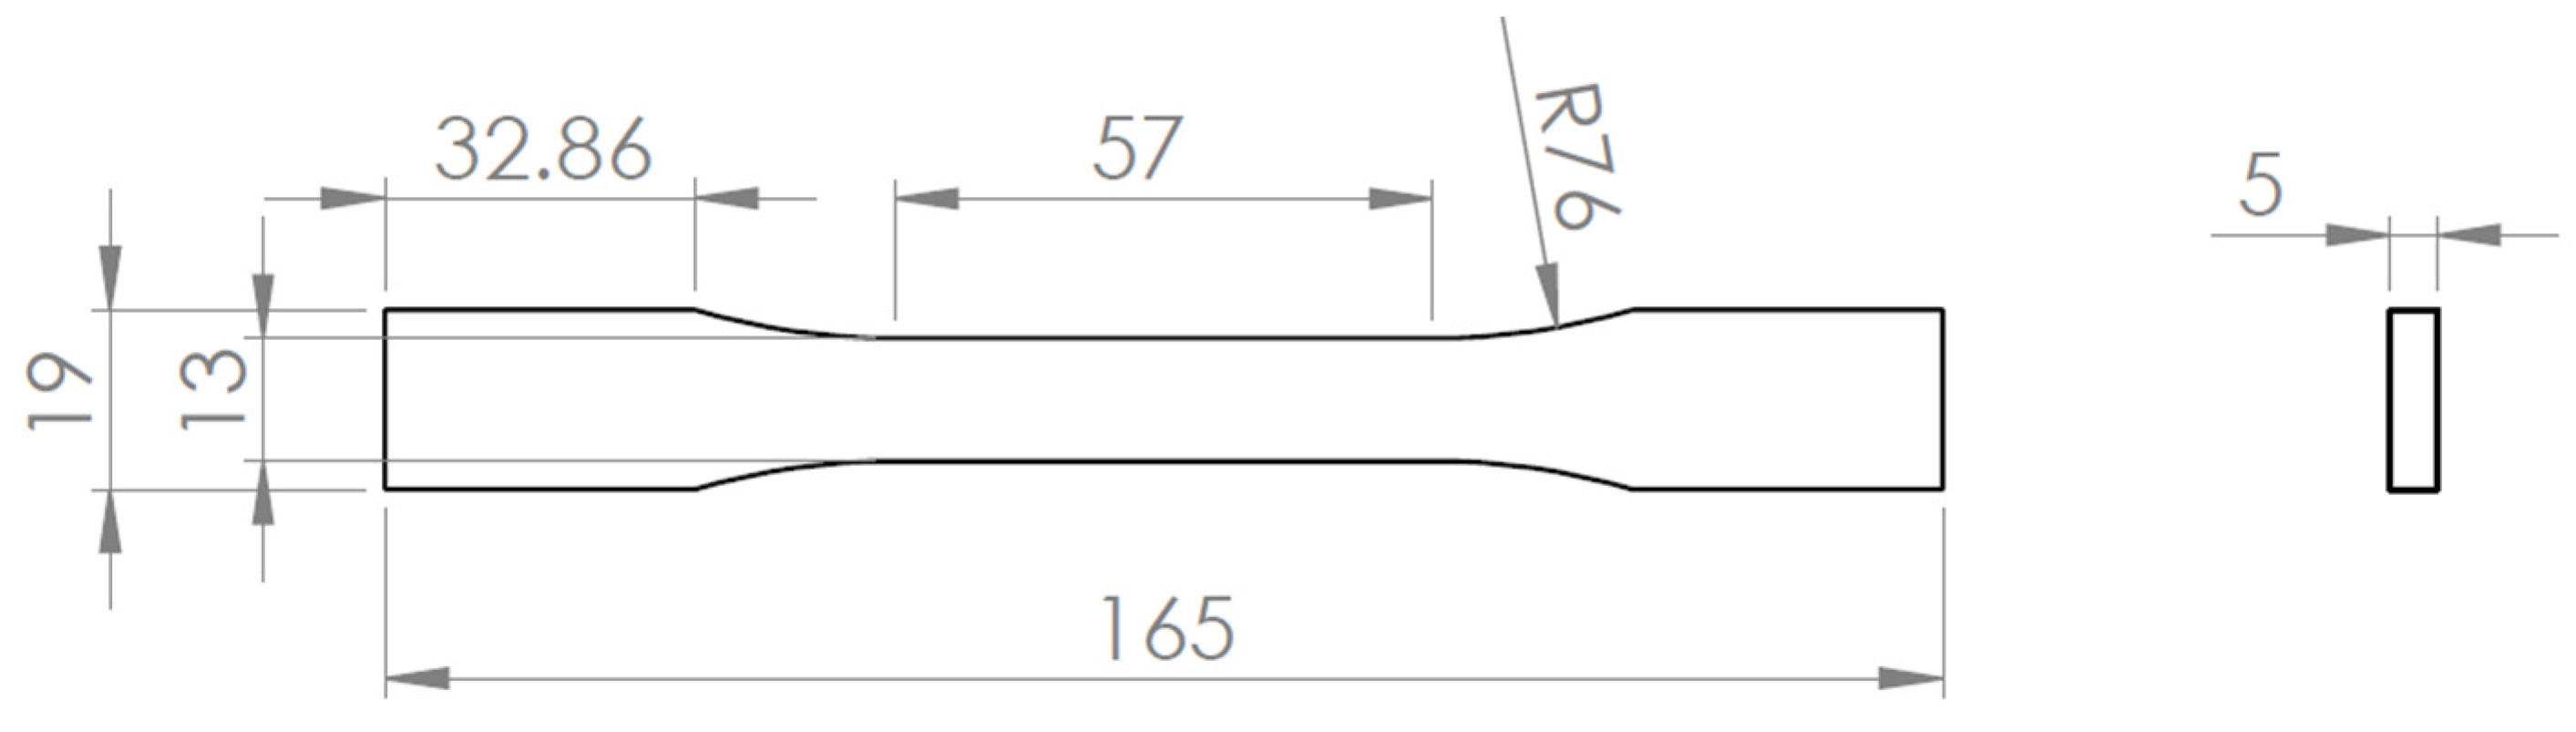
Figure 4.
Mesh sensitivity results for FEA setup: Maximum von mises stress for different element sizes.
Figure 4.
Mesh sensitivity results for FEA setup: Maximum von mises stress for different element sizes.
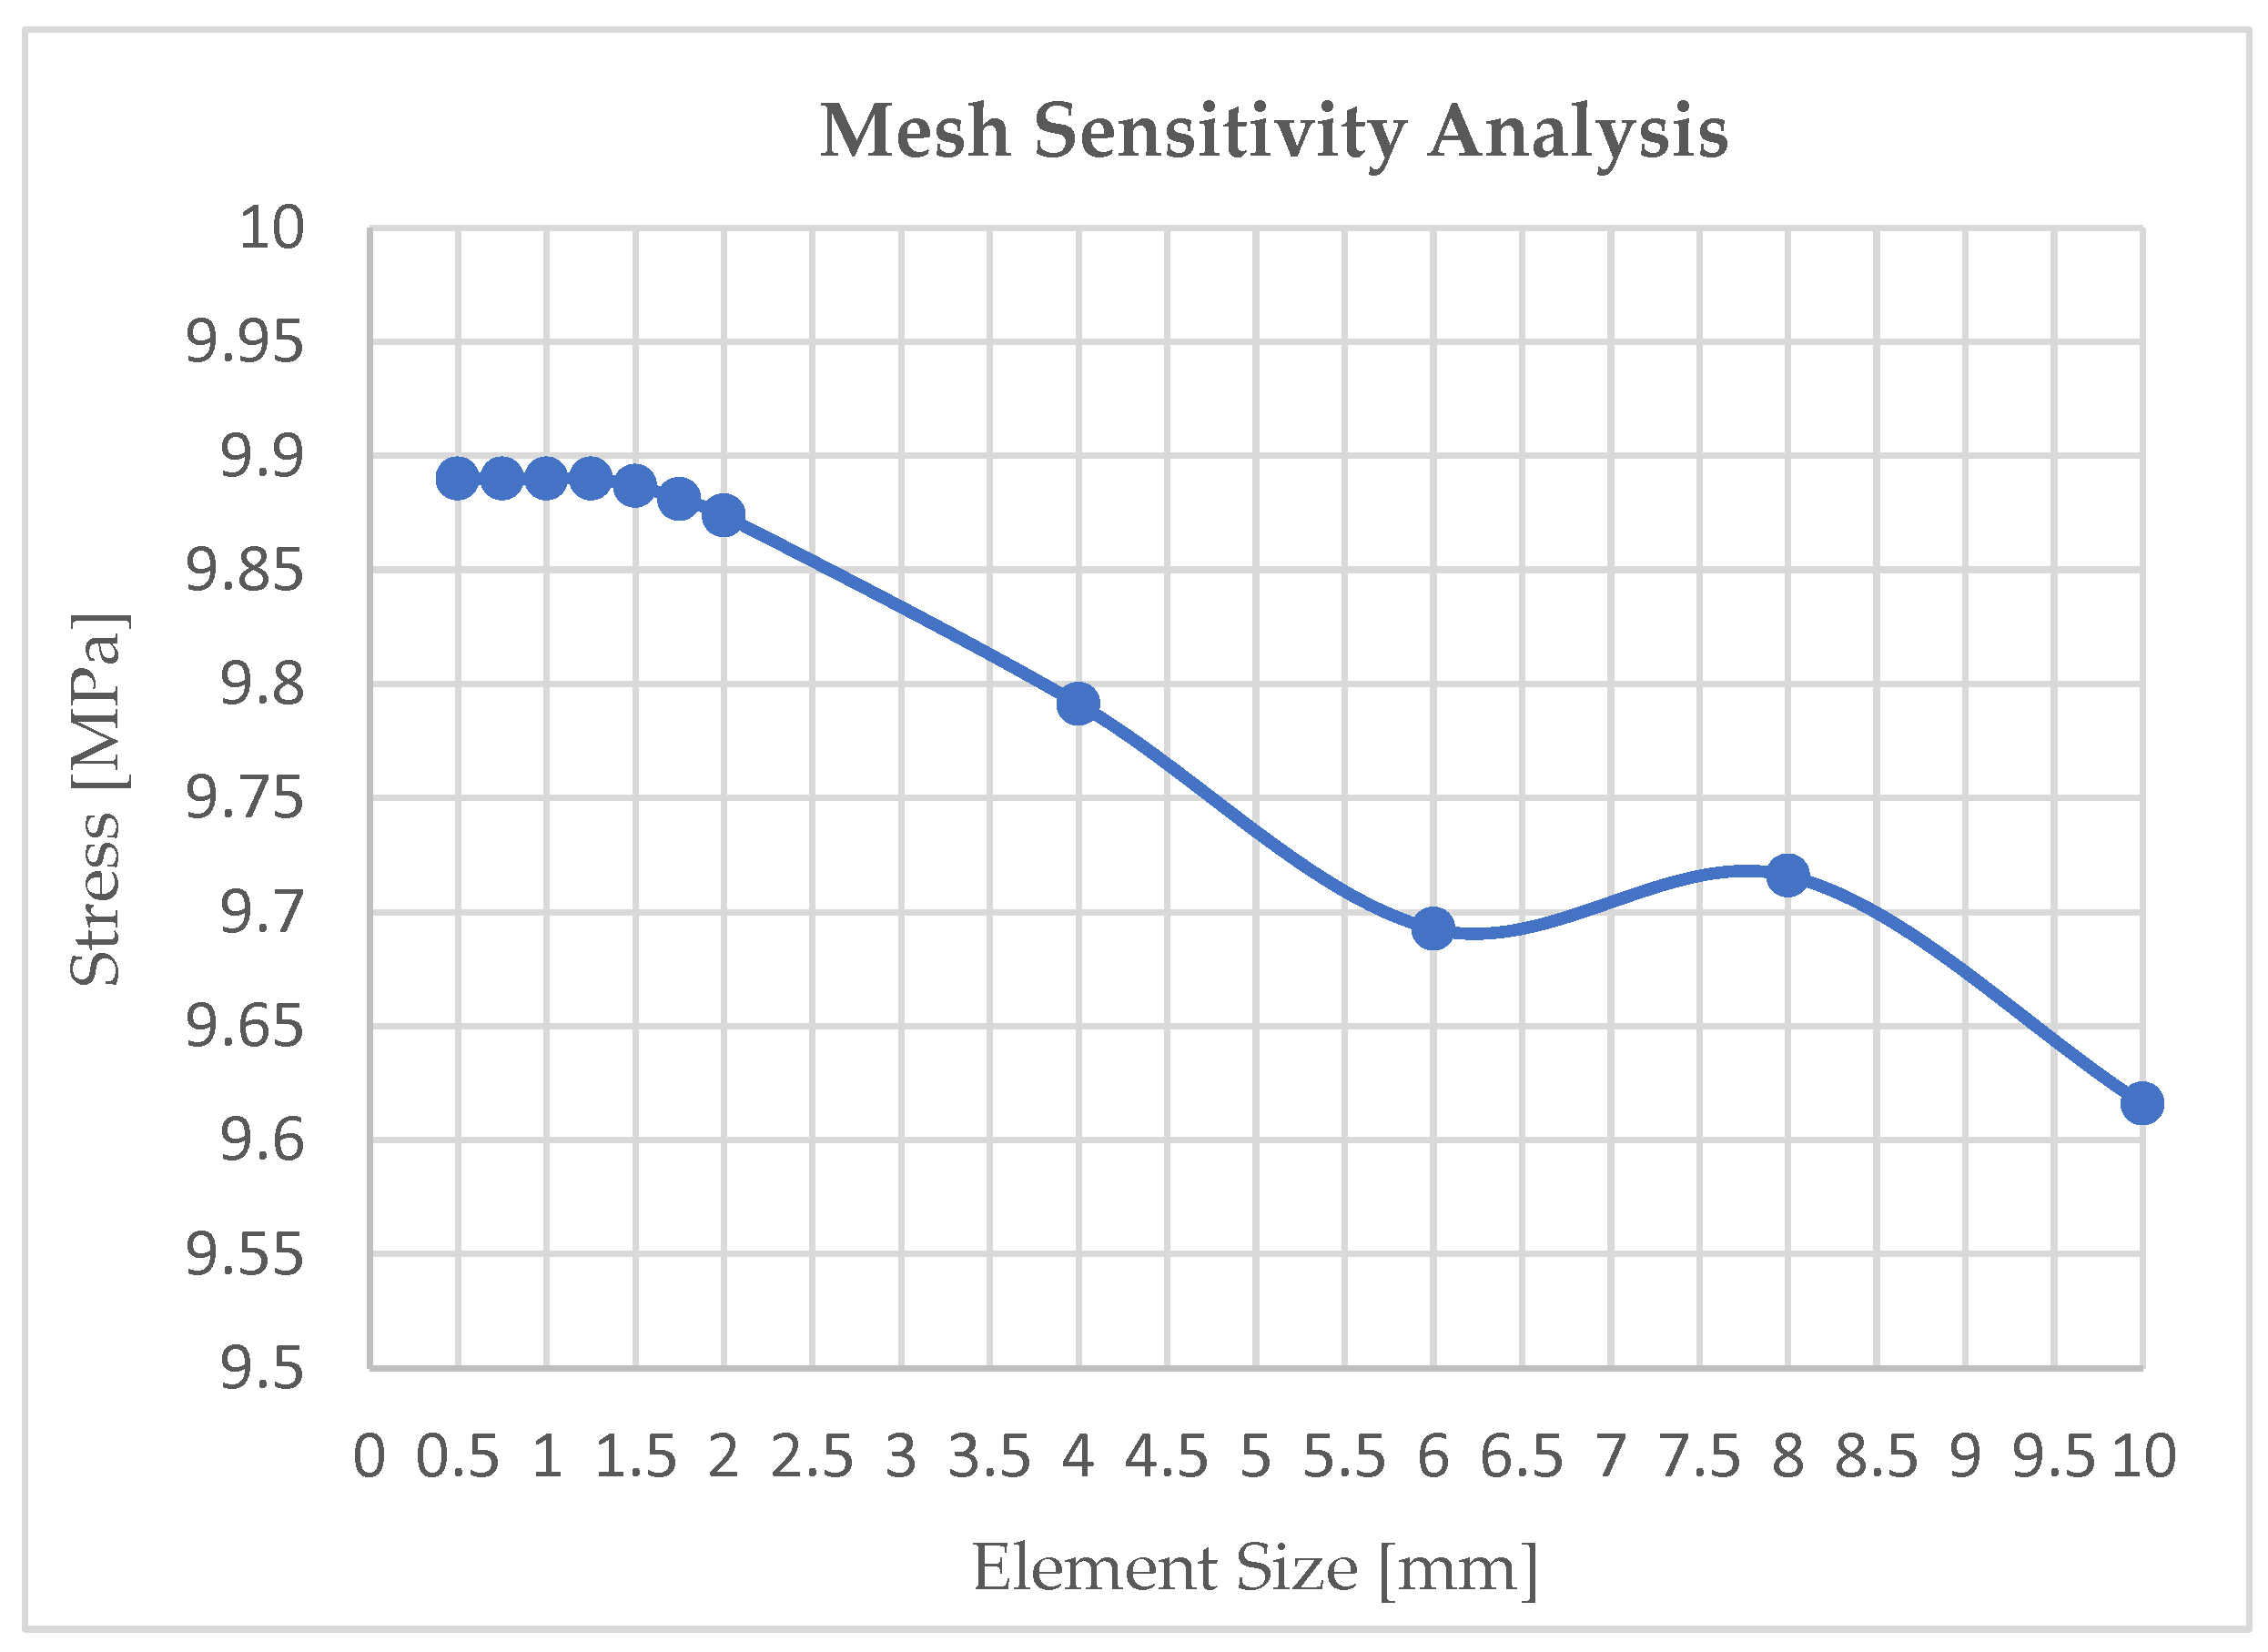
Figure 5.
Mesh configuration and boundary condition (BC) used for FEA. The left side (yellow) represents the applied displacement BC while the right side (blue) represents the fixed support.
Figure 5.
Mesh configuration and boundary condition (BC) used for FEA. The left side (yellow) represents the applied displacement BC while the right side (blue) represents the fixed support.
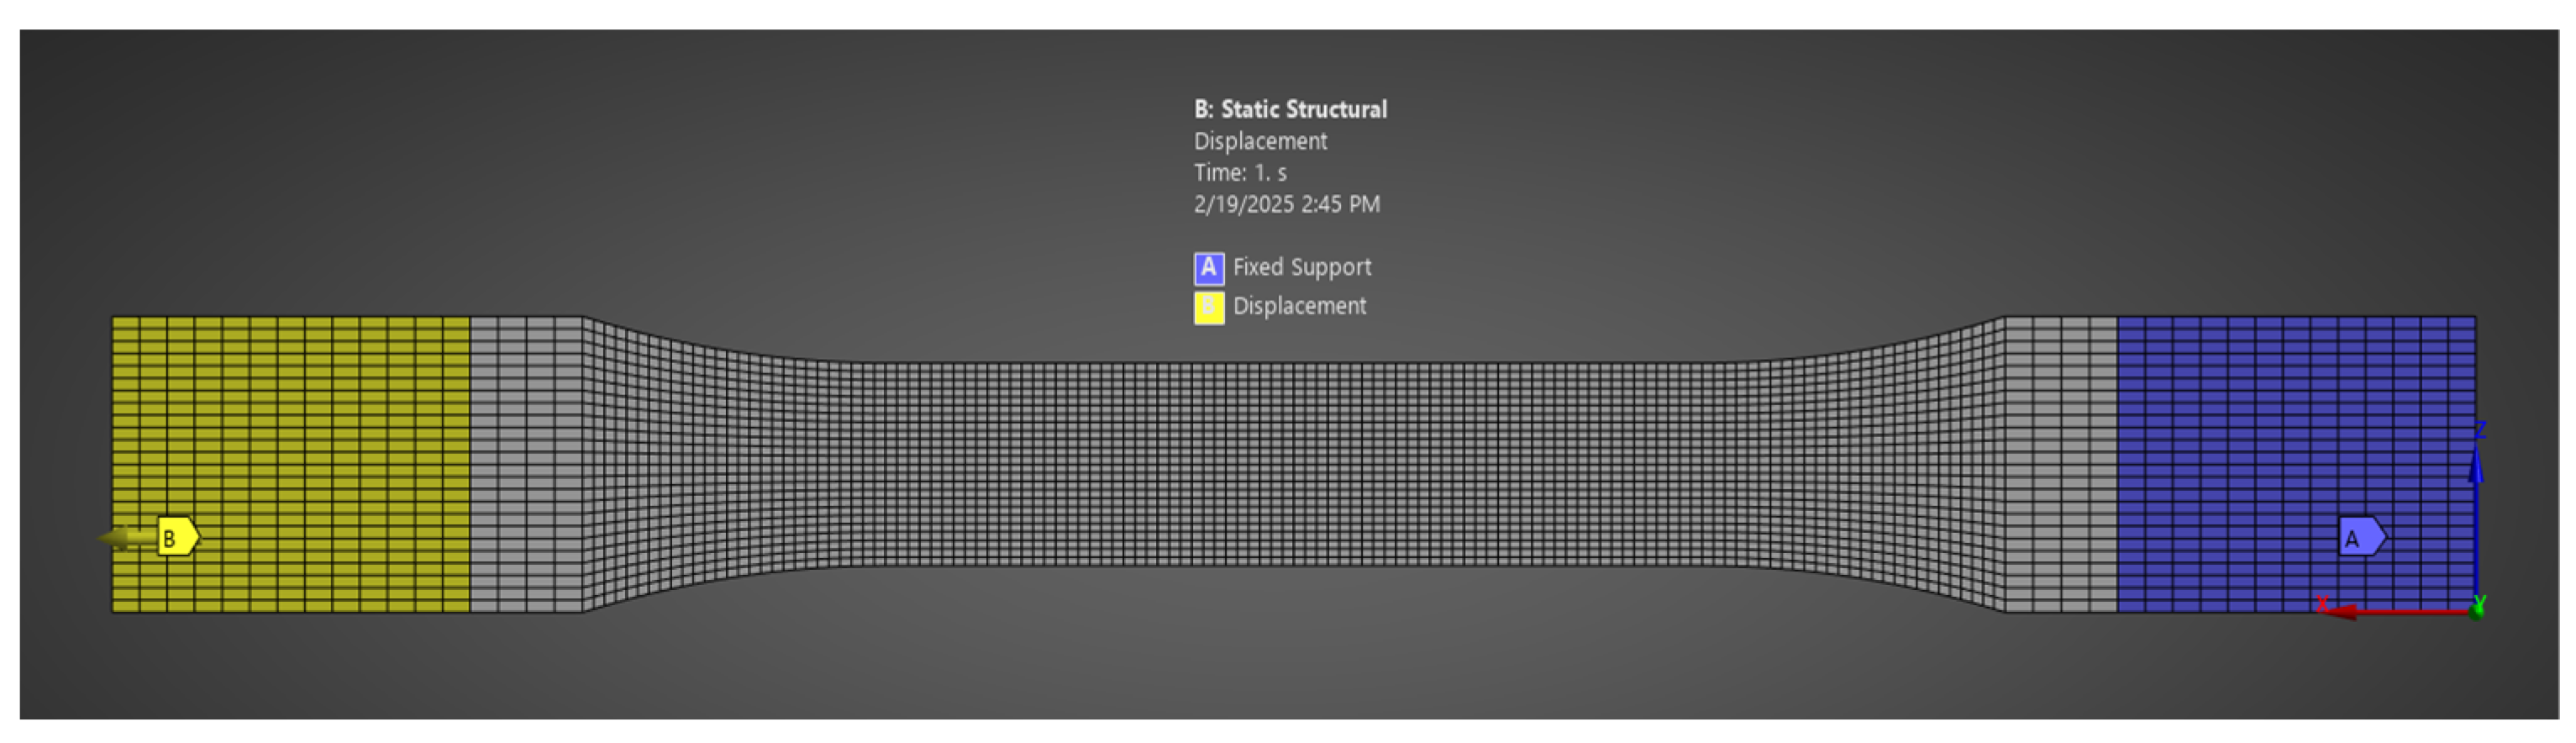
Figure 6.
Mesh metrics parameters: (a) Jacobian ratio; (b) Aspect ratio; (c) Skewness.
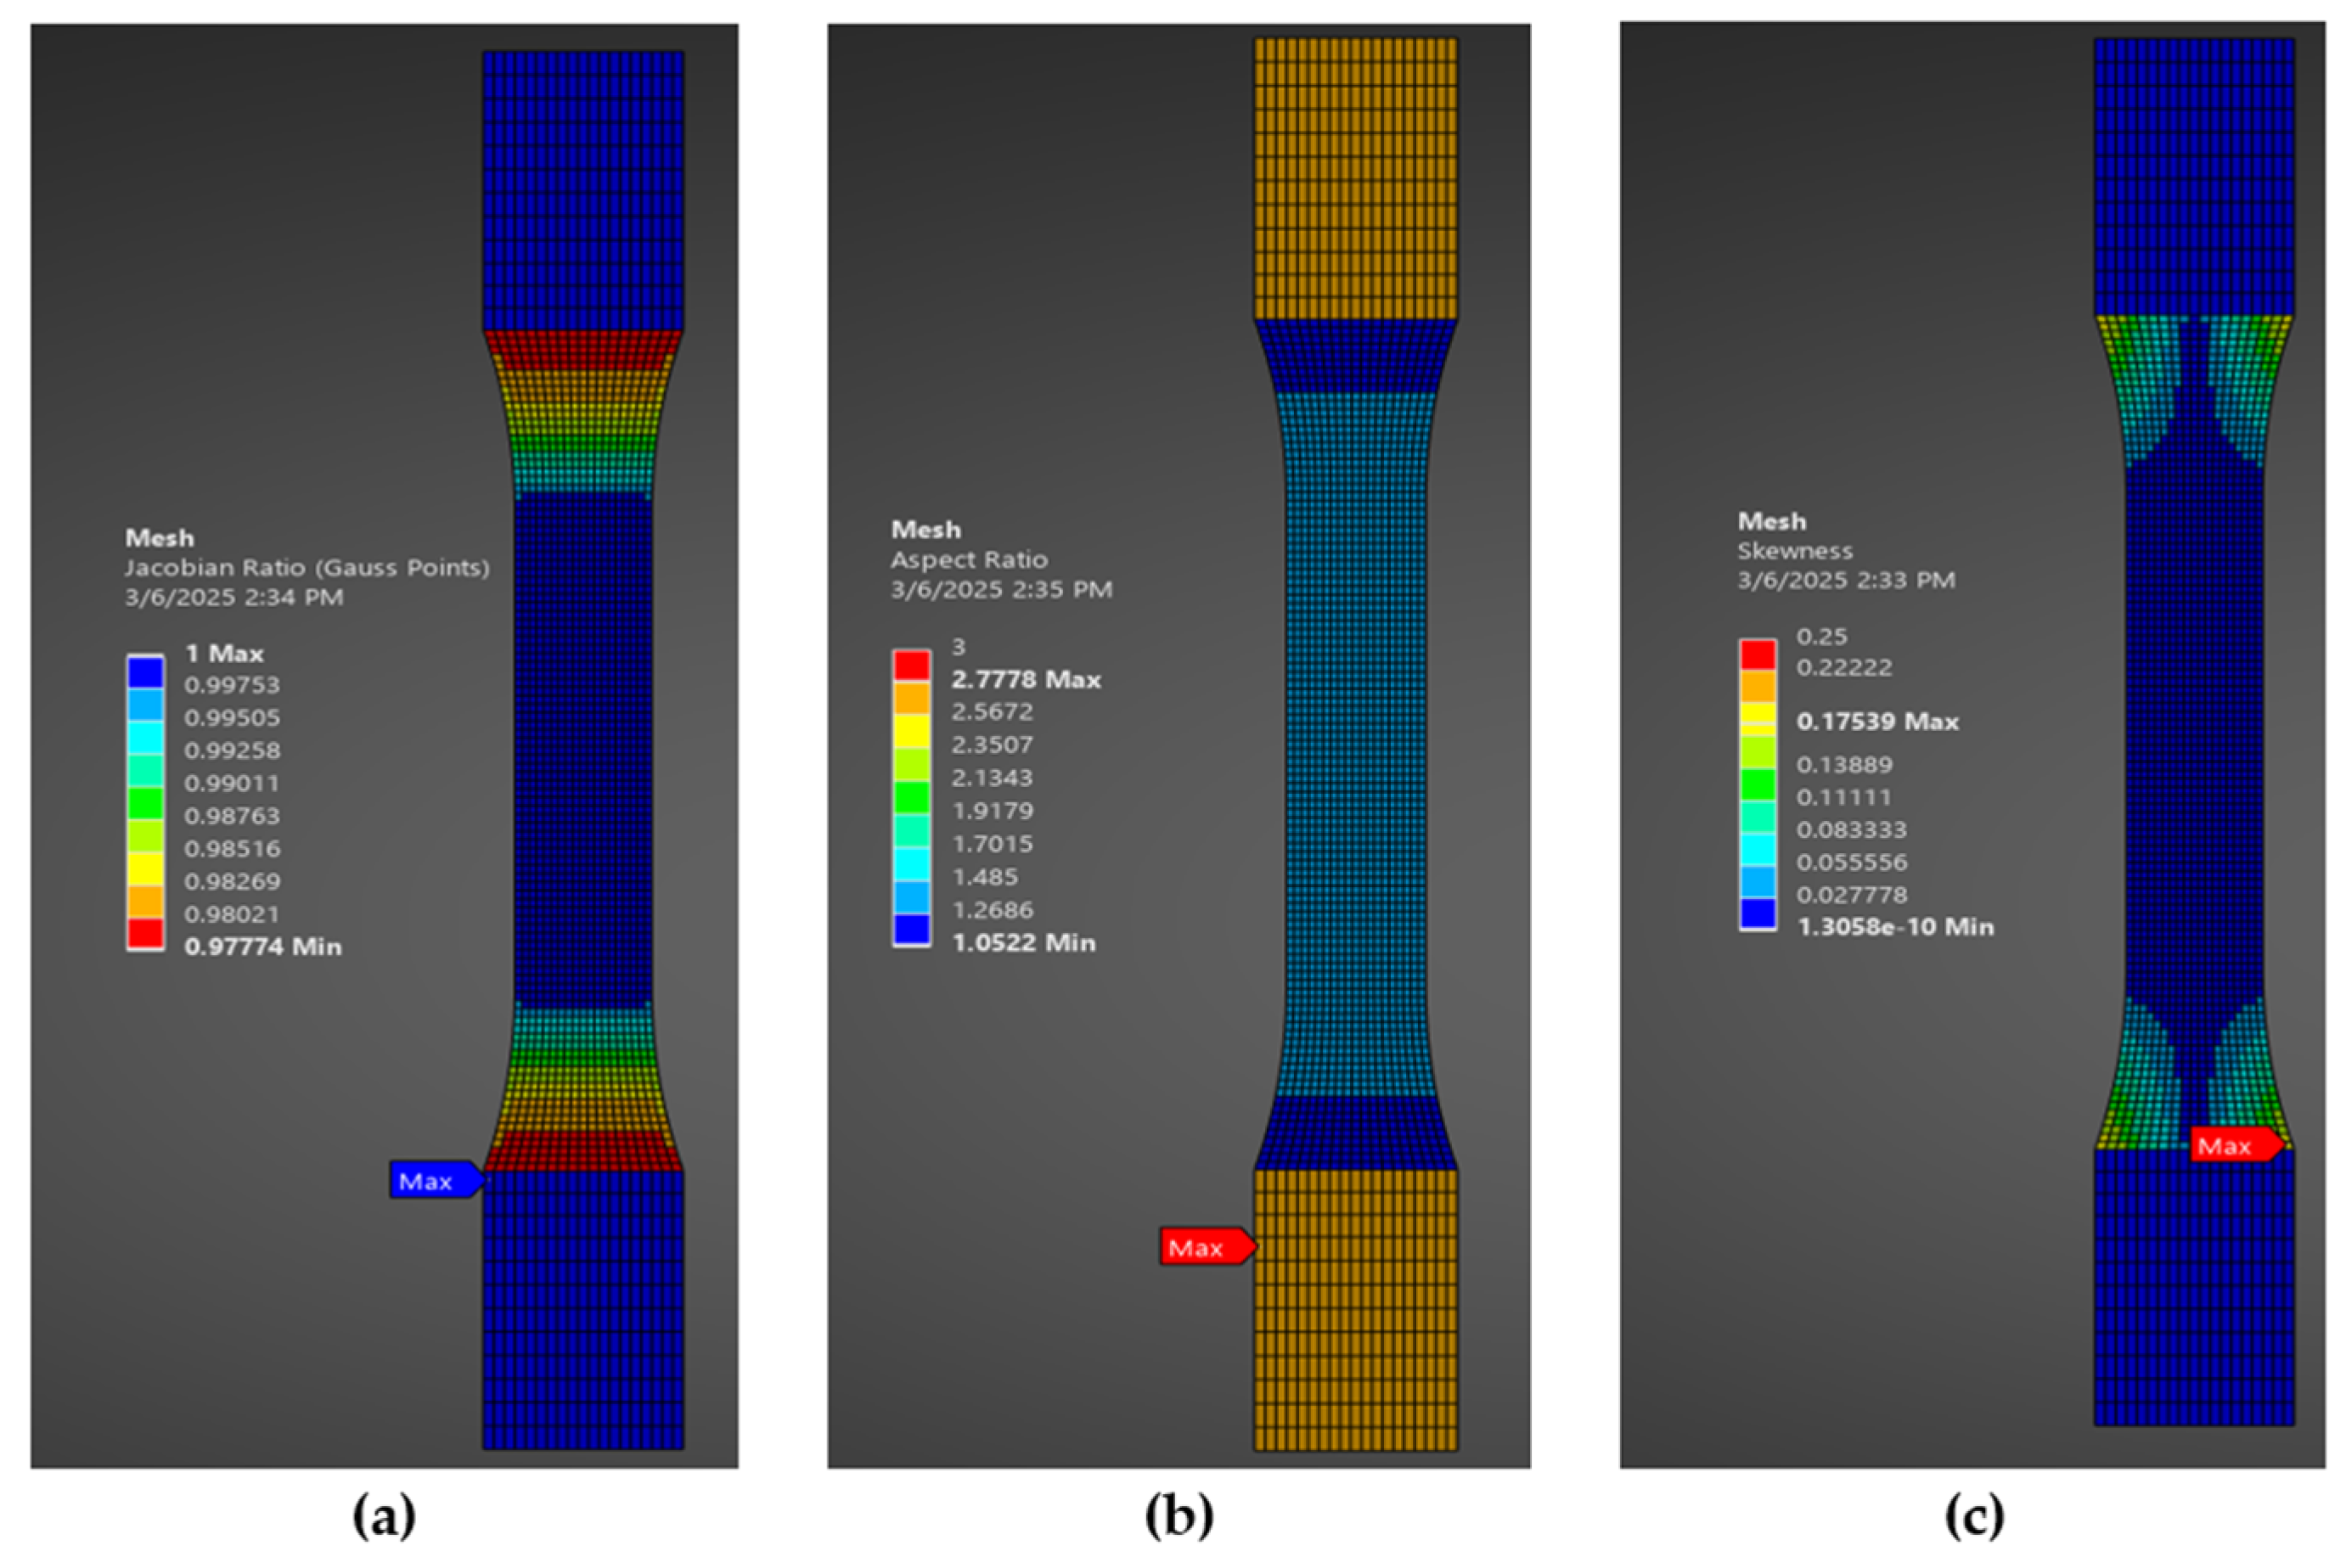
Figure 7.
Yield stress estimation using SOM: Stress strain curves with different SO values (0%, 0.007%, 0.01%, 0.02%, 0.05%, and 0.2%). The intersection points indicate the corresponding yield stress values for each offset.
Figure 7.
Yield stress estimation using SOM: Stress strain curves with different SO values (0%, 0.007%, 0.01%, 0.02%, 0.05%, and 0.2%). The intersection points indicate the corresponding yield stress values for each offset.
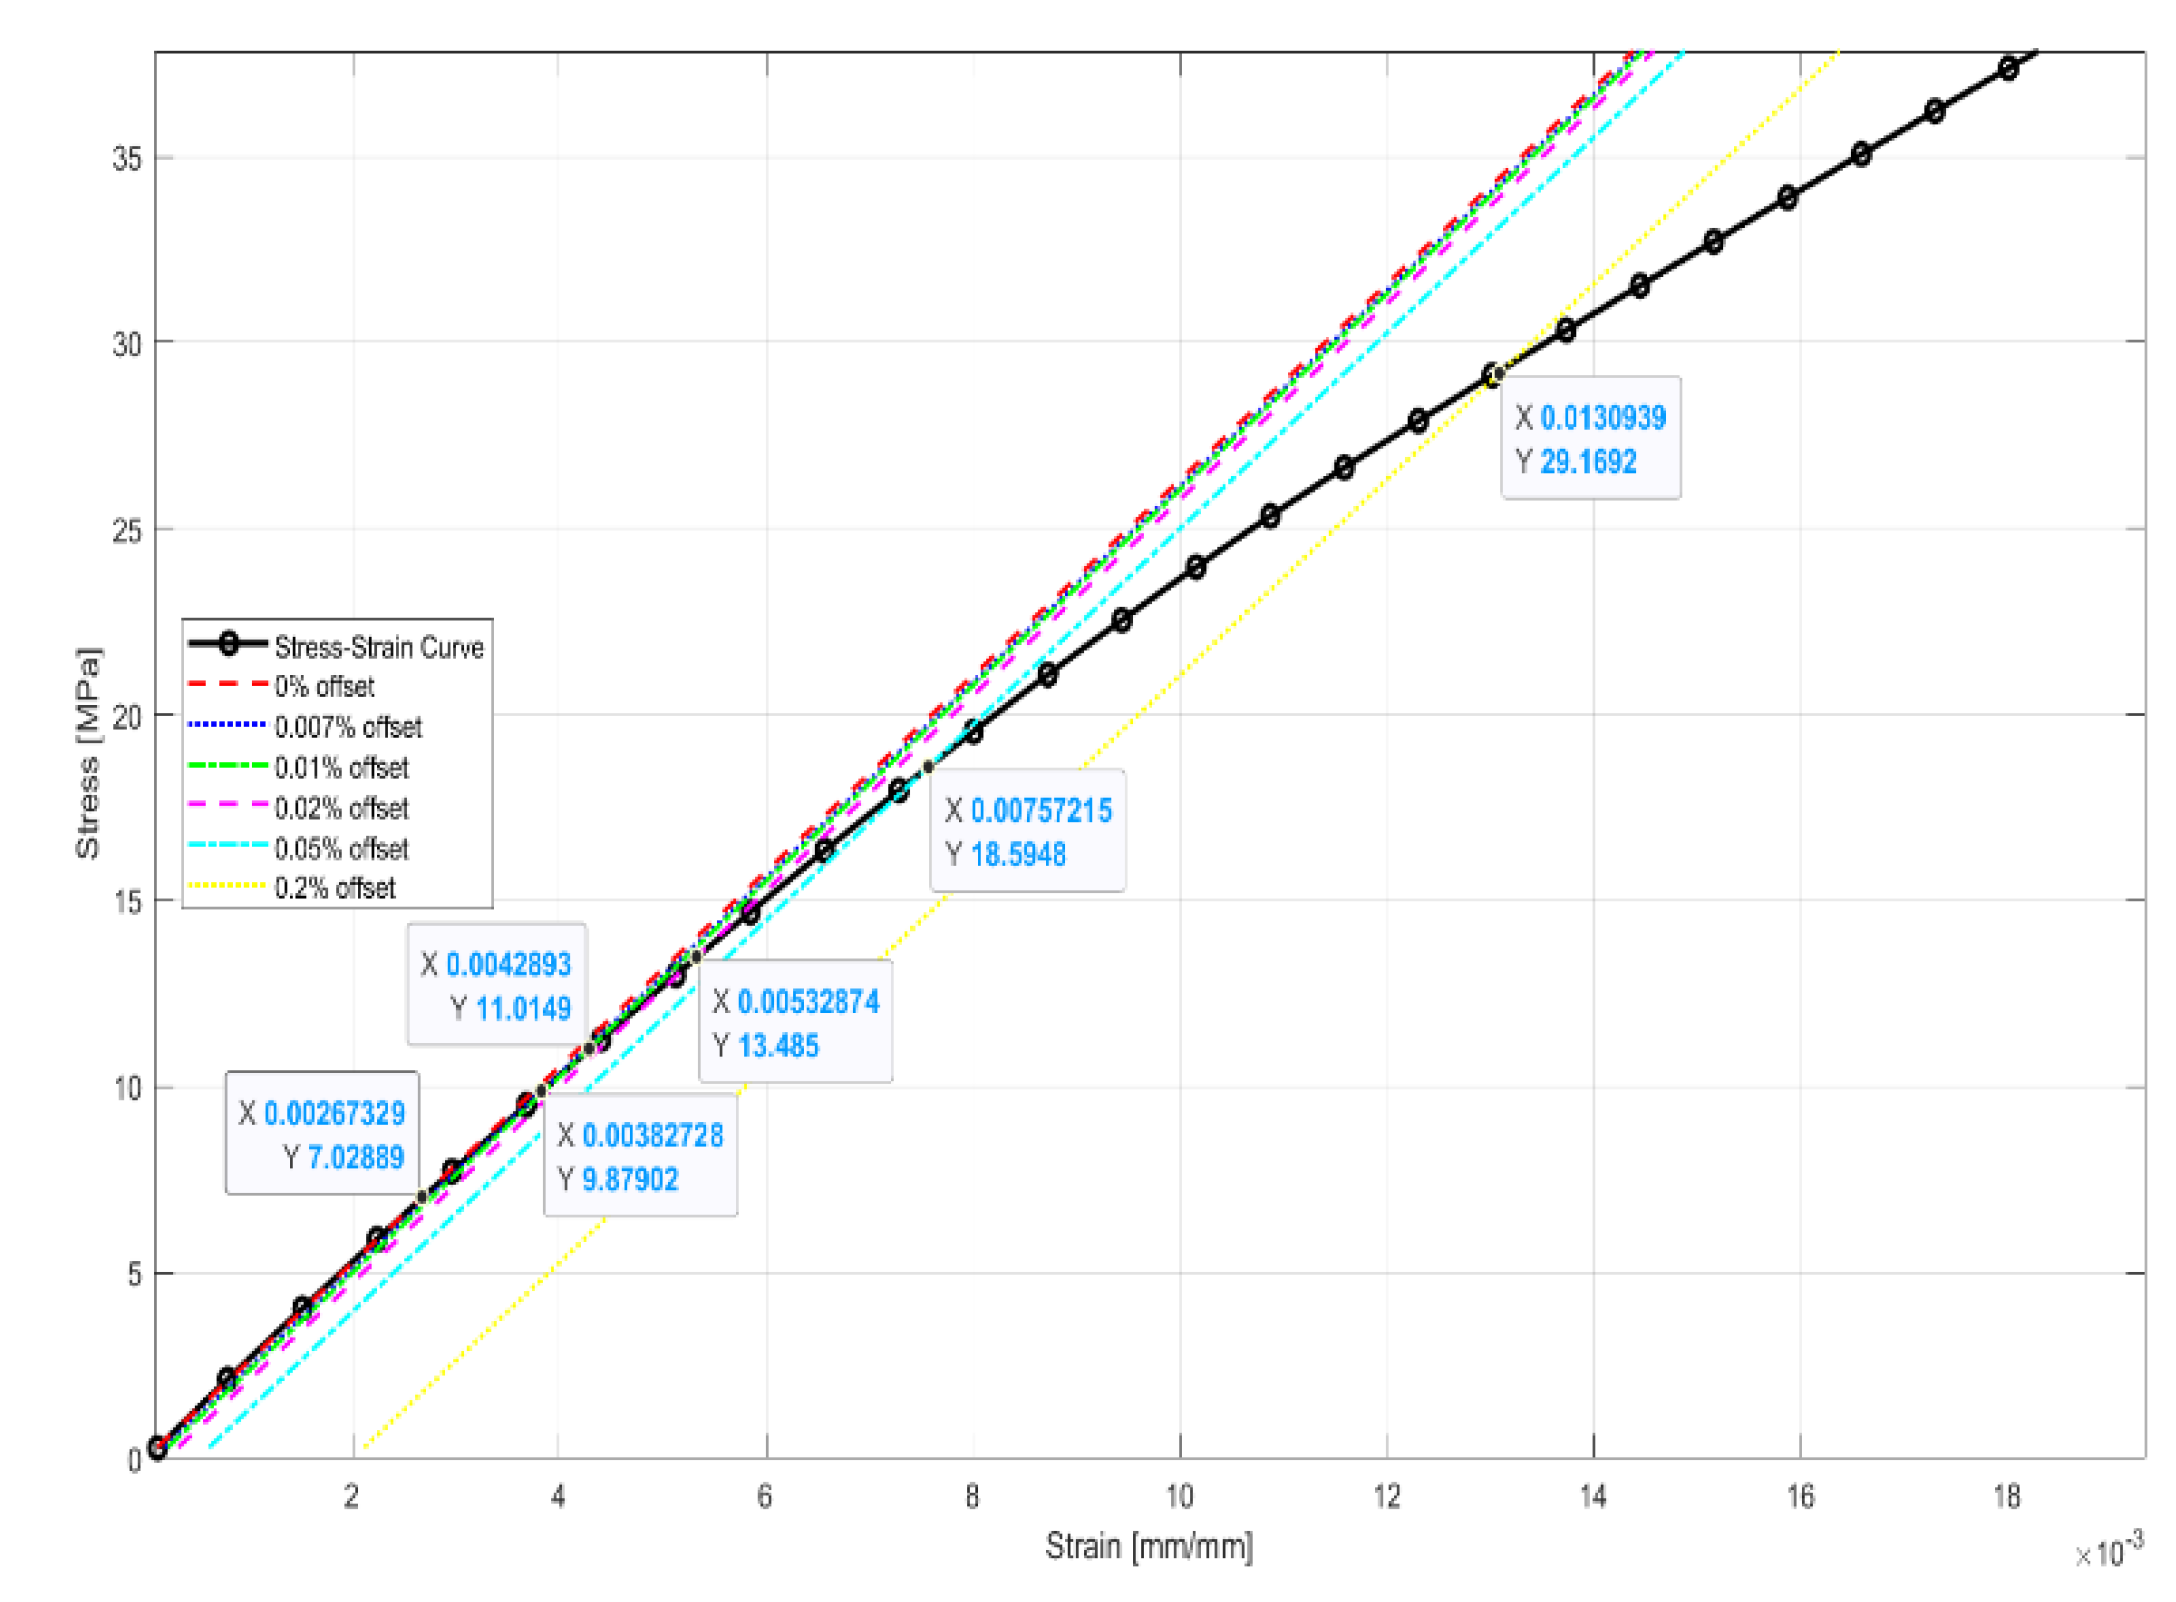
Figure 8.
True stress-strain representative curve for different raster orientation i.e. blue 0°, red 45°, and green 90°.
Figure 8.
True stress-strain representative curve for different raster orientation i.e. blue 0°, red 45°, and green 90°.
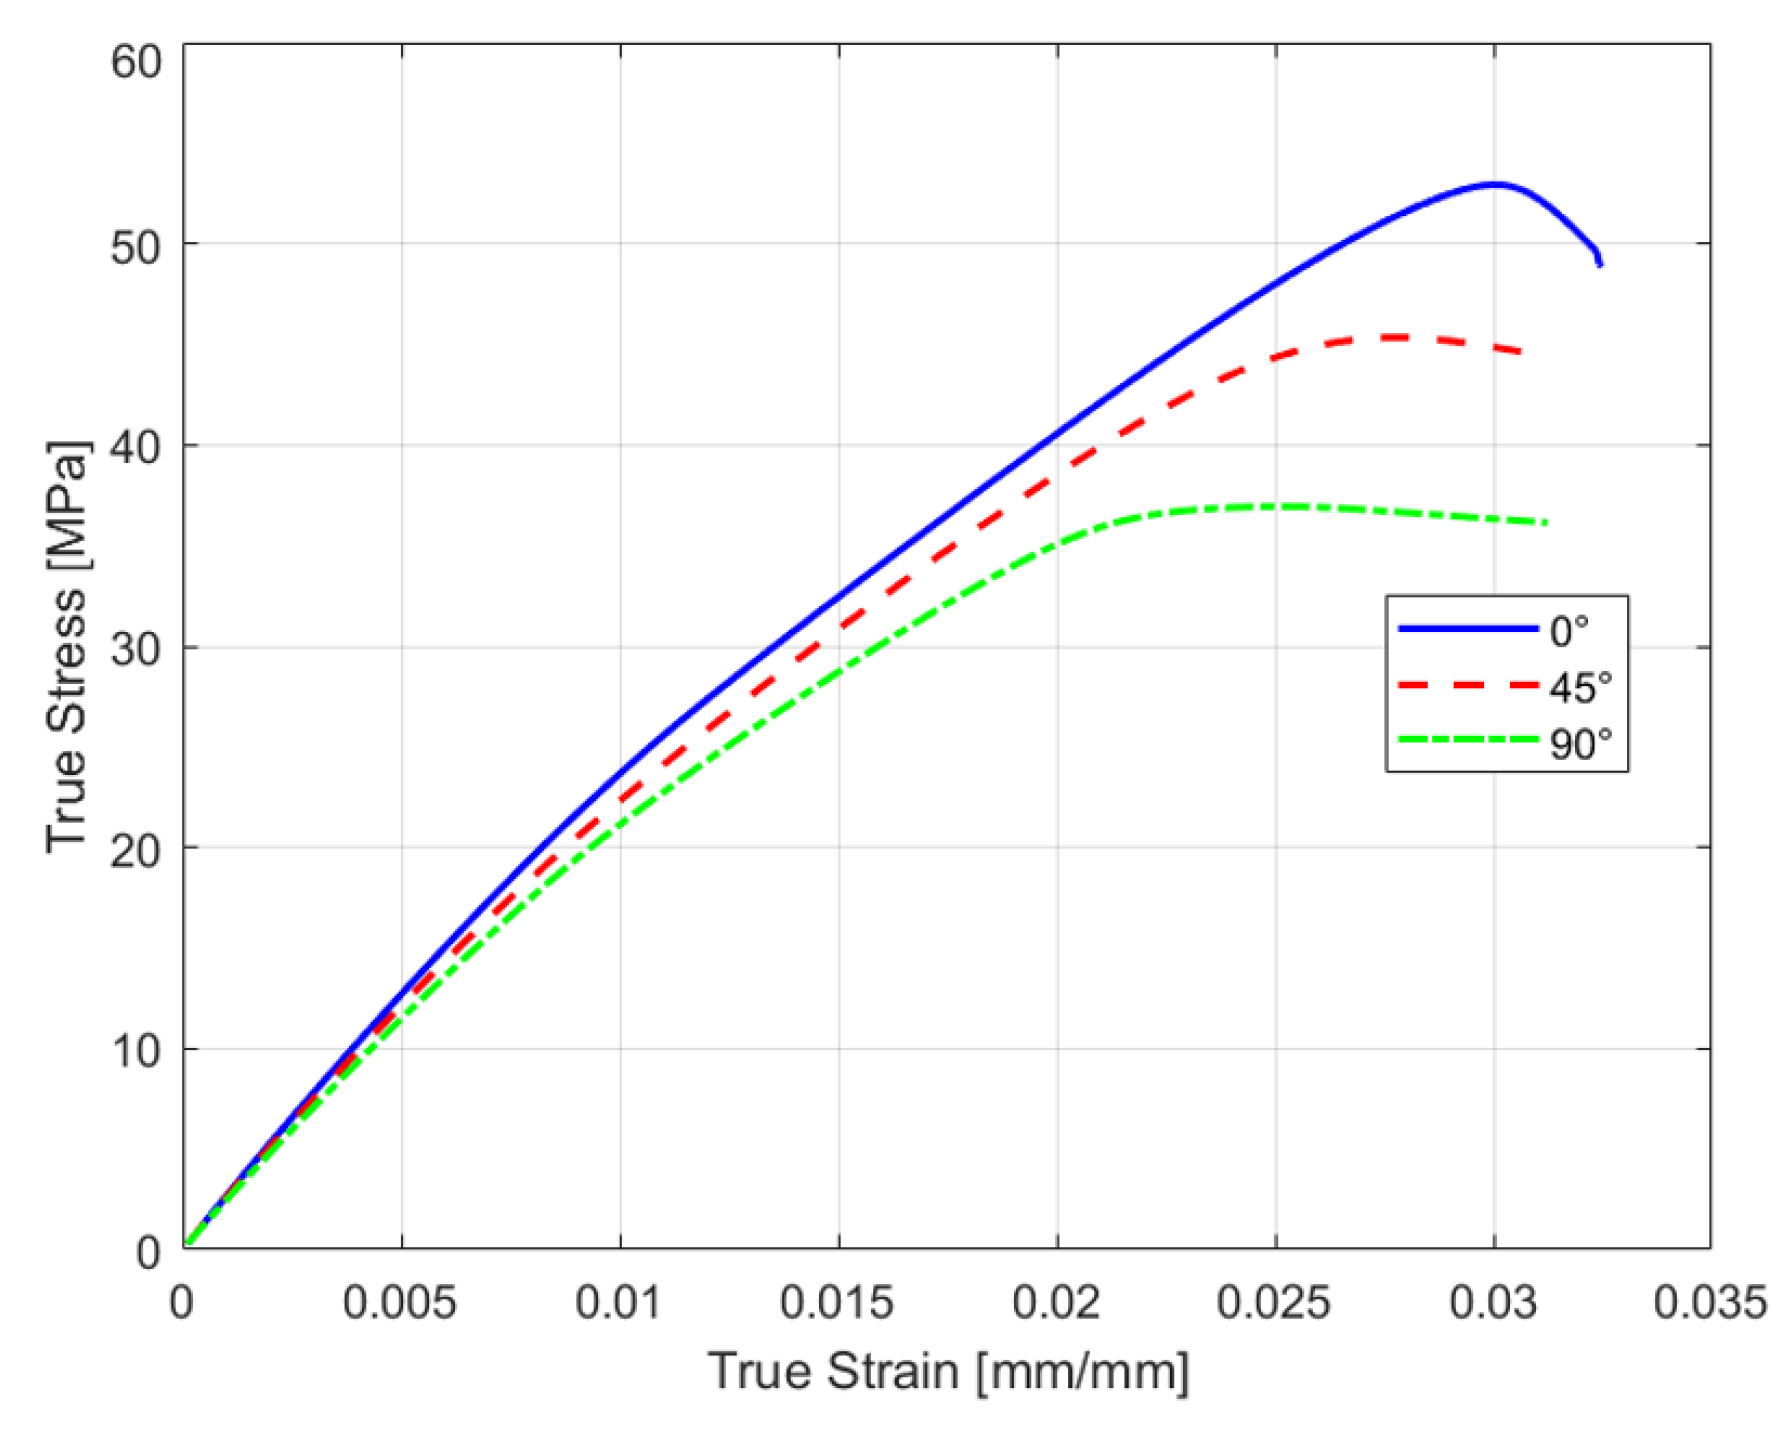
Figure 9.
Comparison between experimental and simulation response against 0.2% SO yield stress value for 0, 45 and 90° raster orientation.
Figure 9.
Comparison between experimental and simulation response against 0.2% SO yield stress value for 0, 45 and 90° raster orientation.
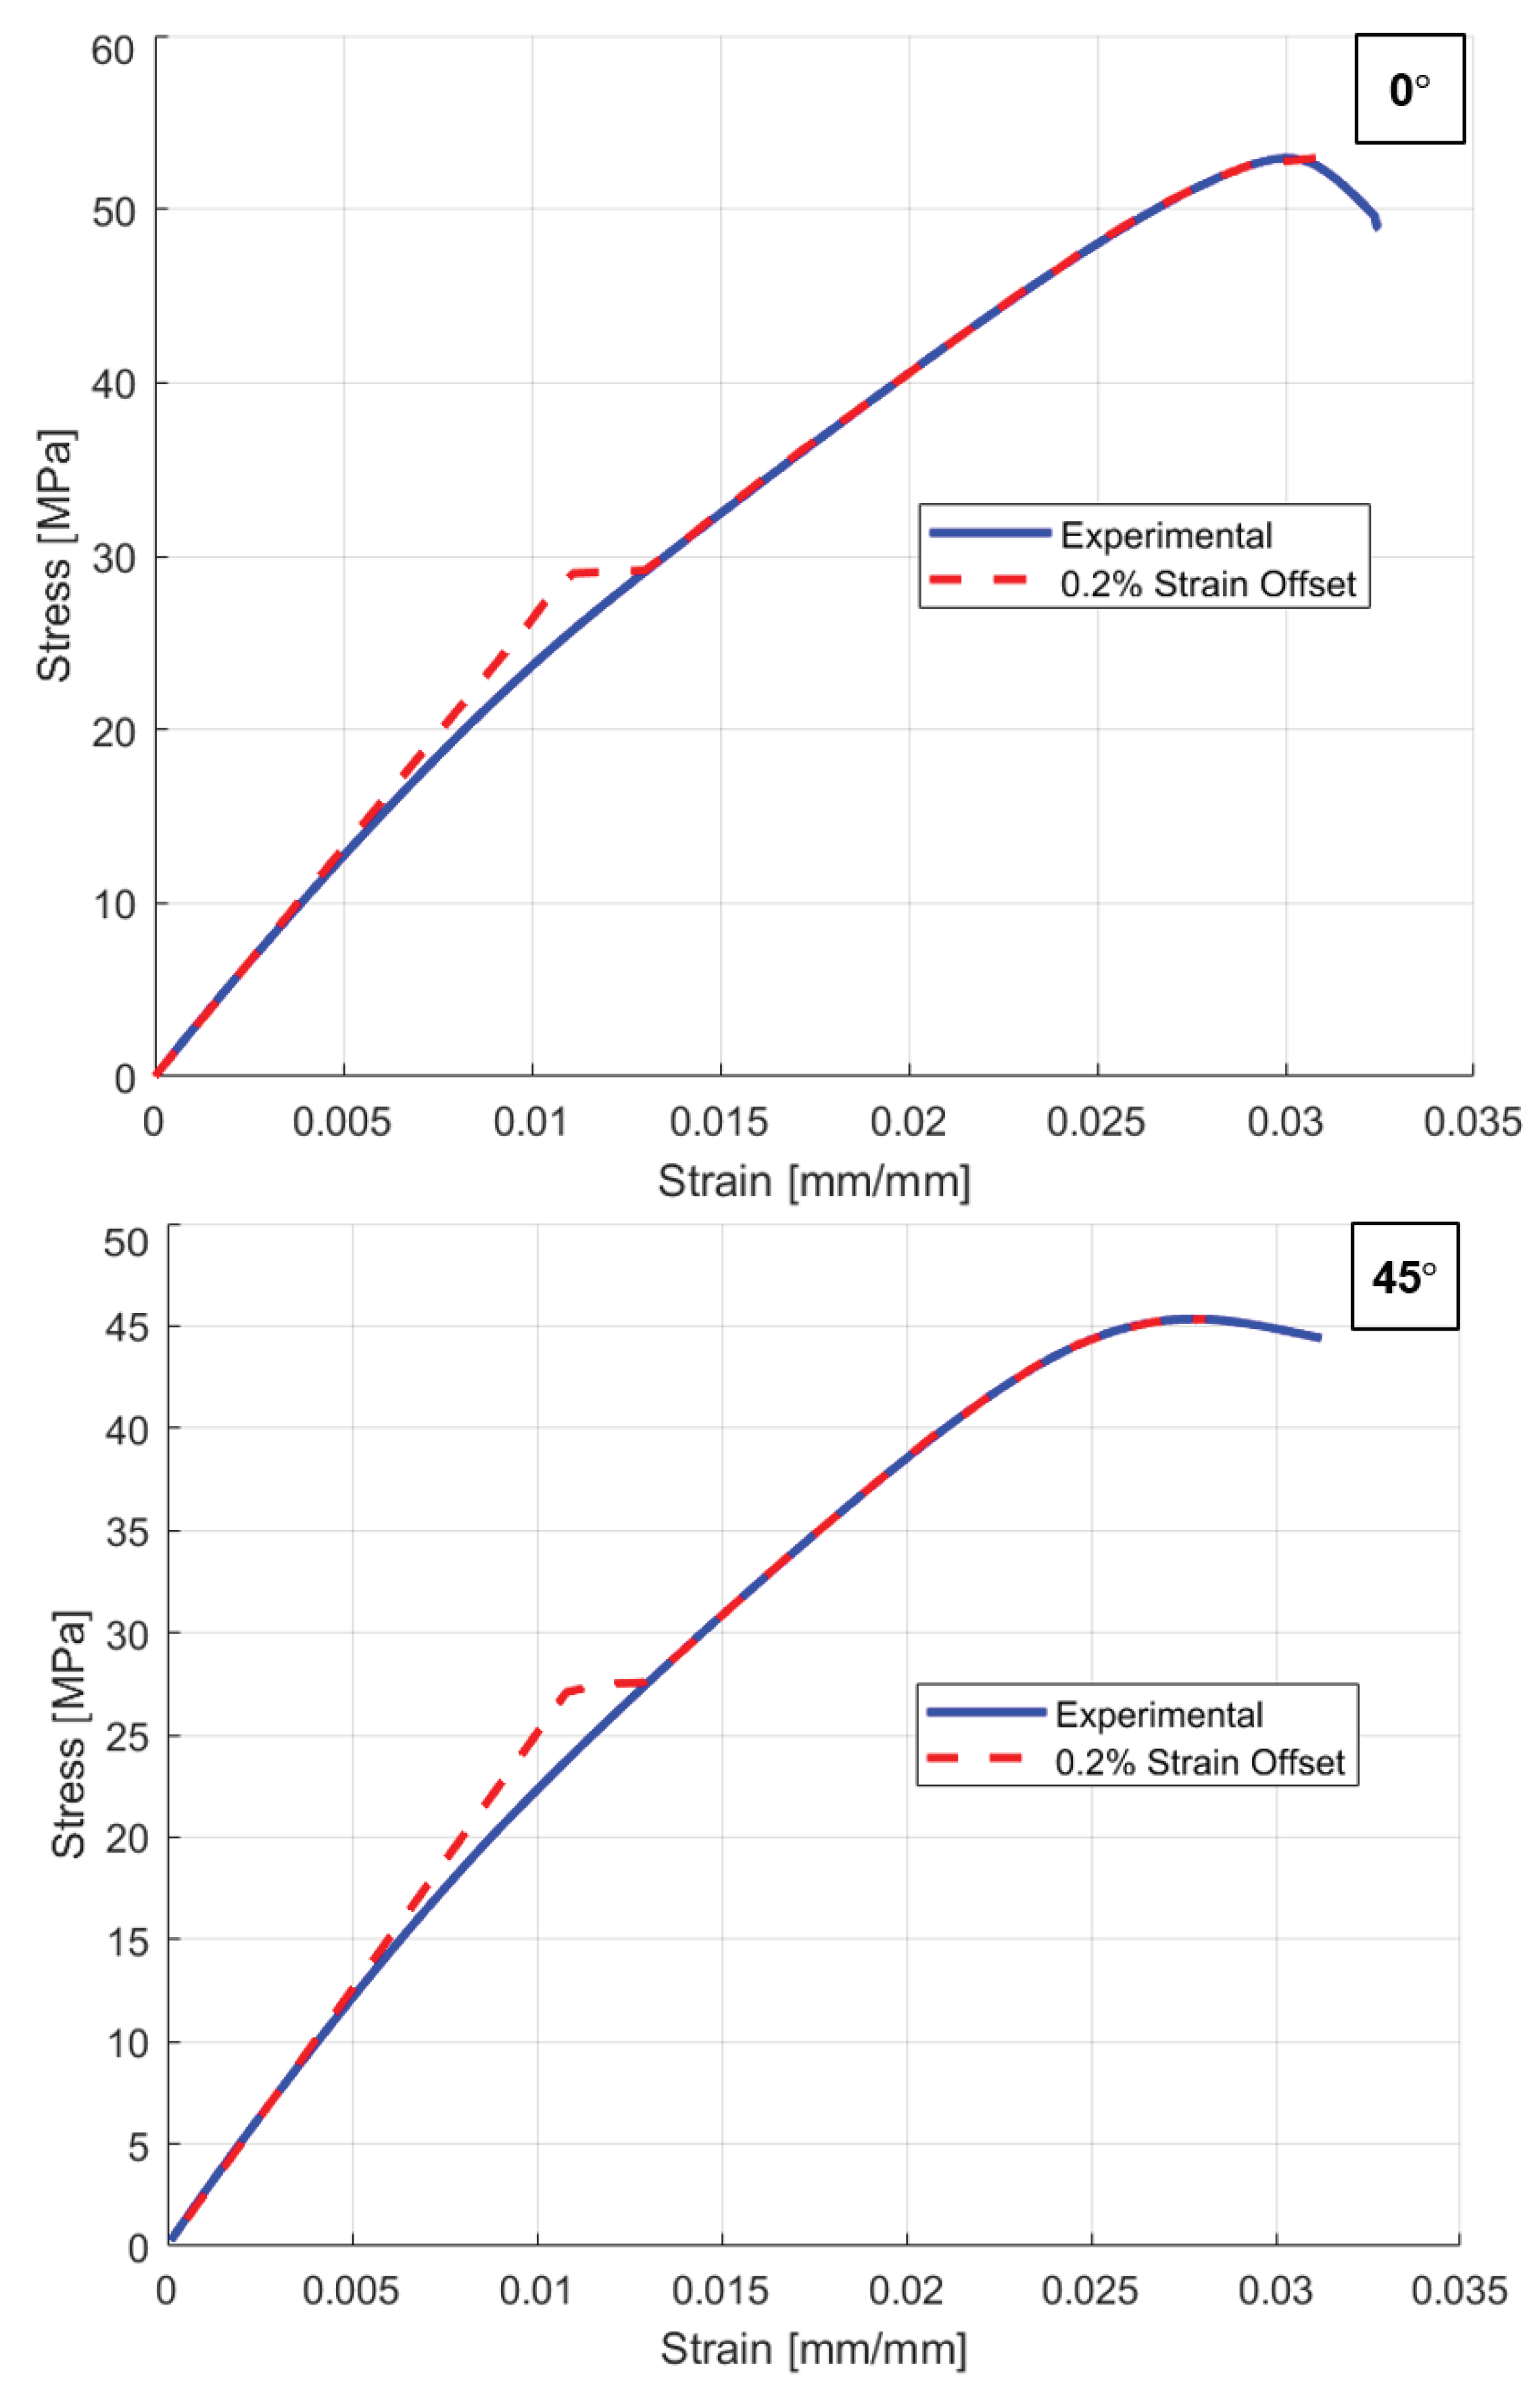
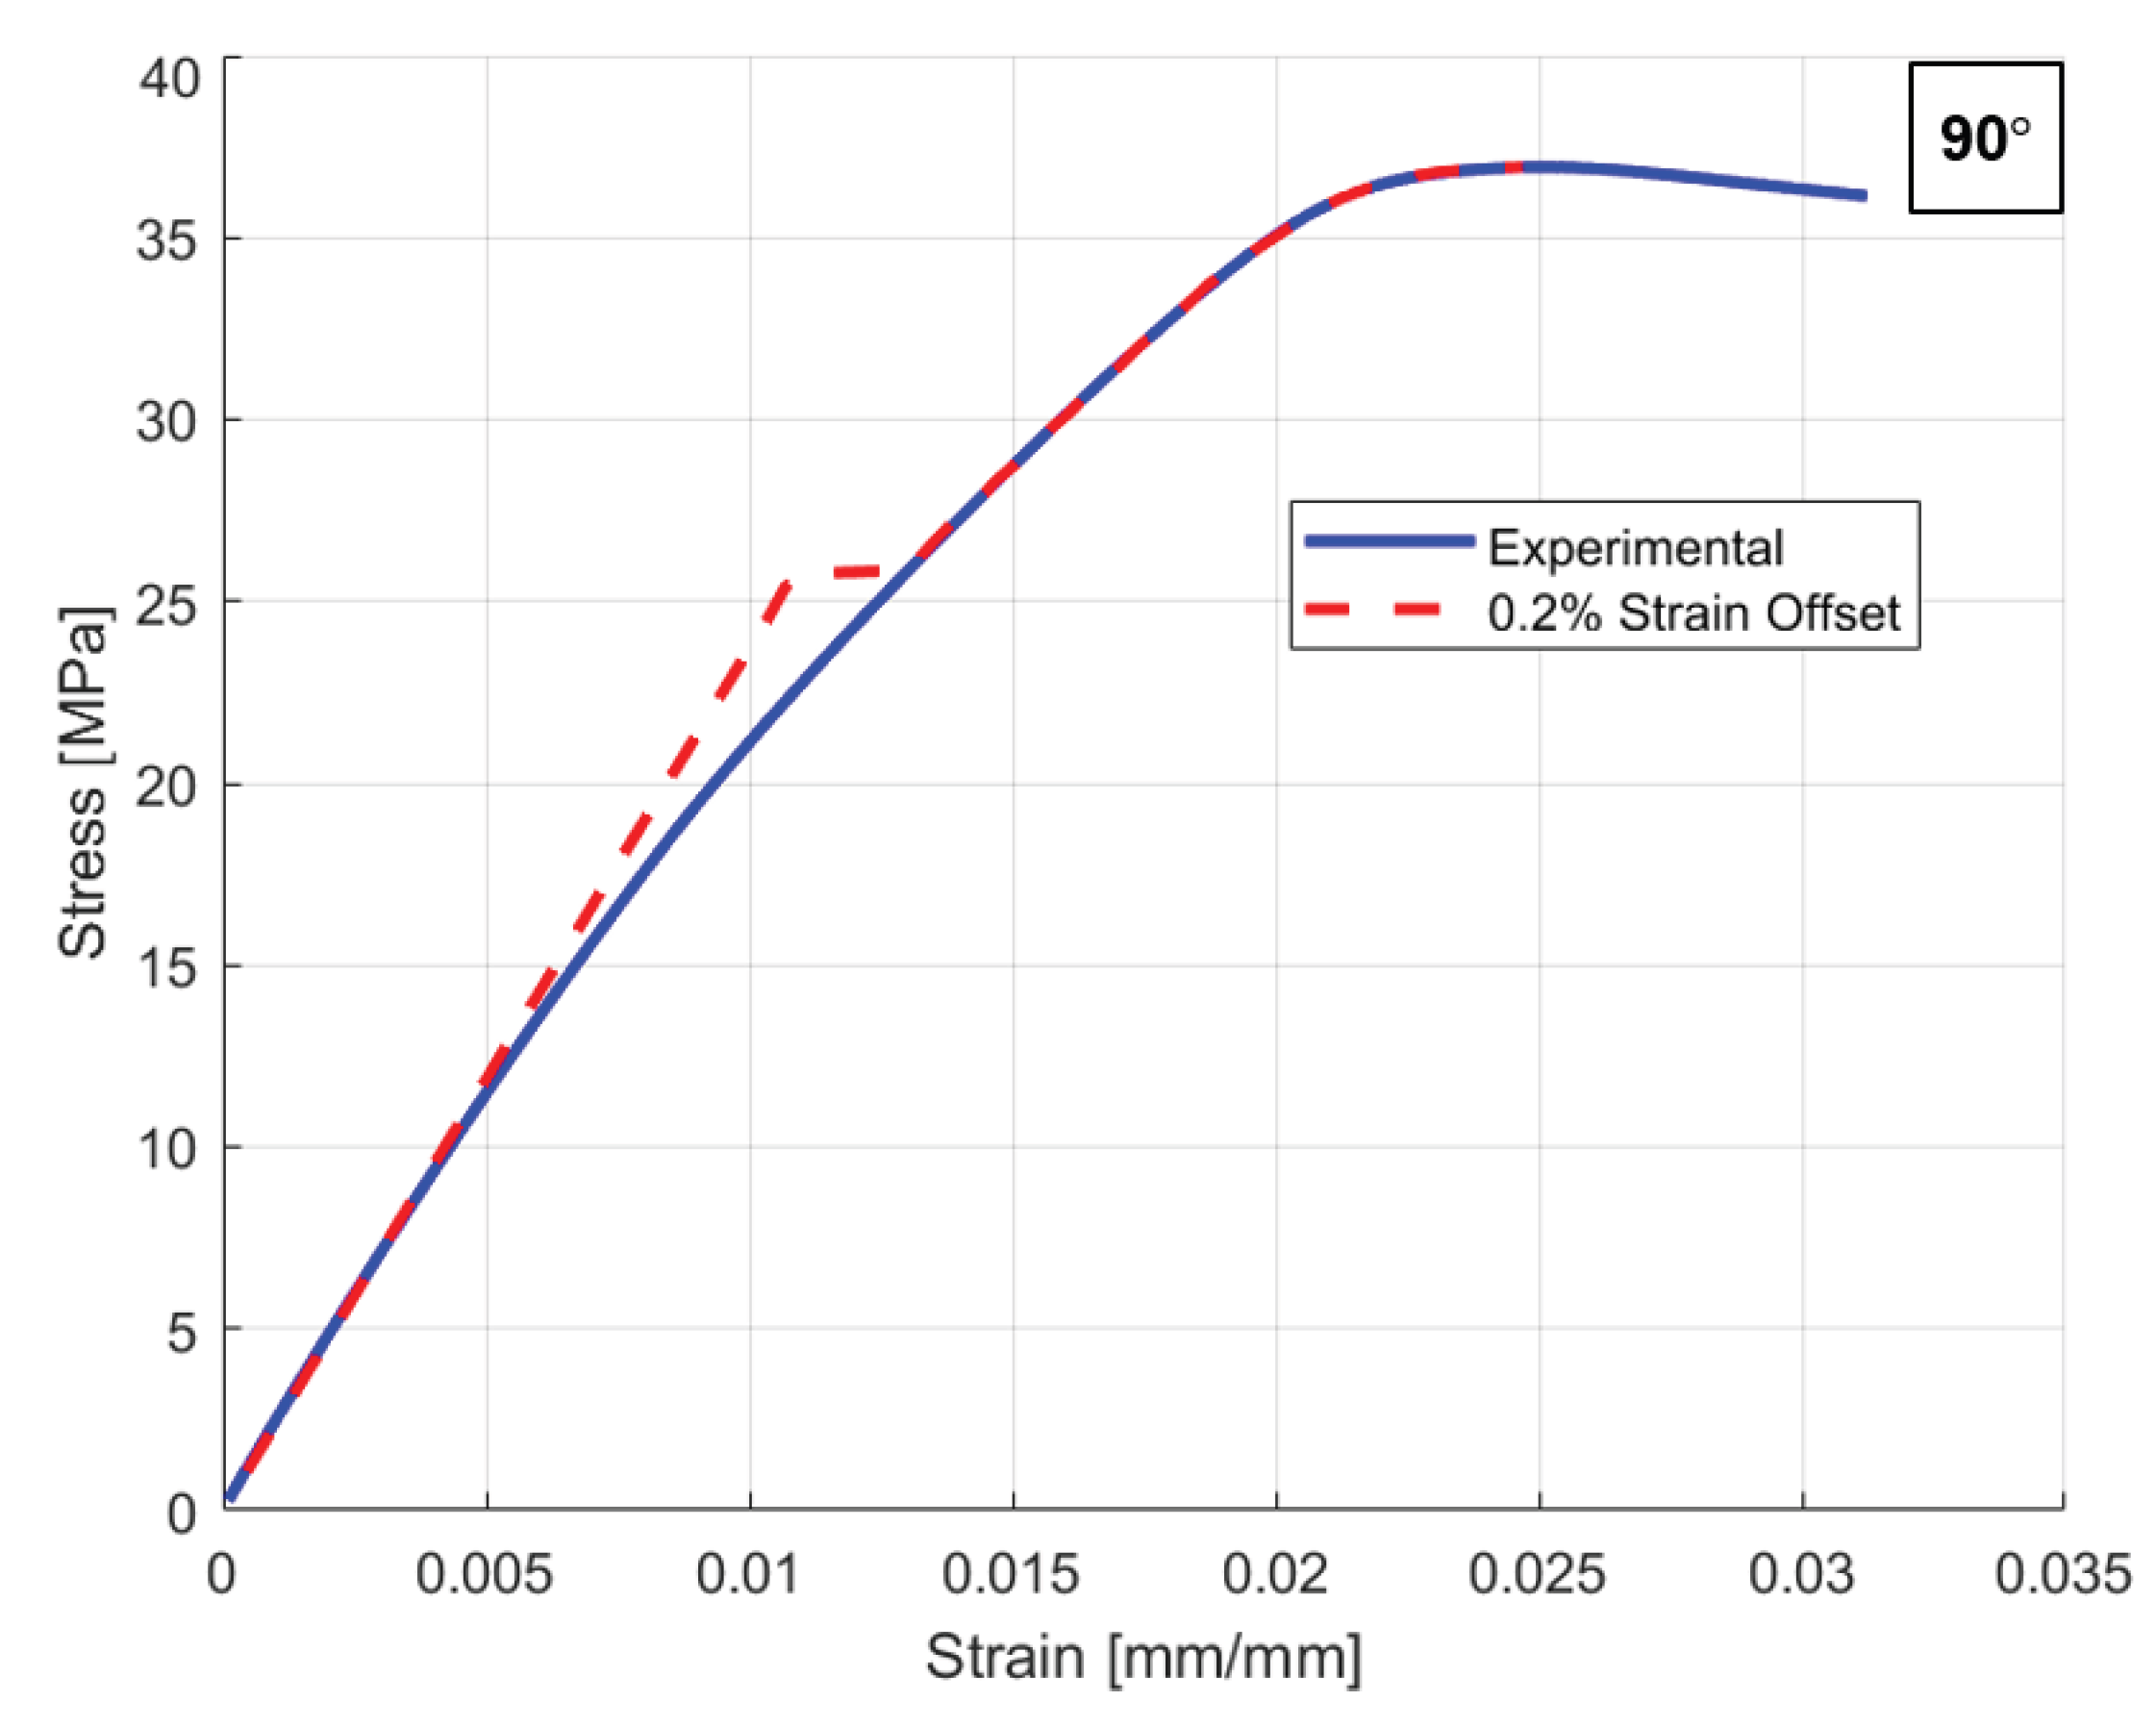
Figure 10.
Optimization flow chart.
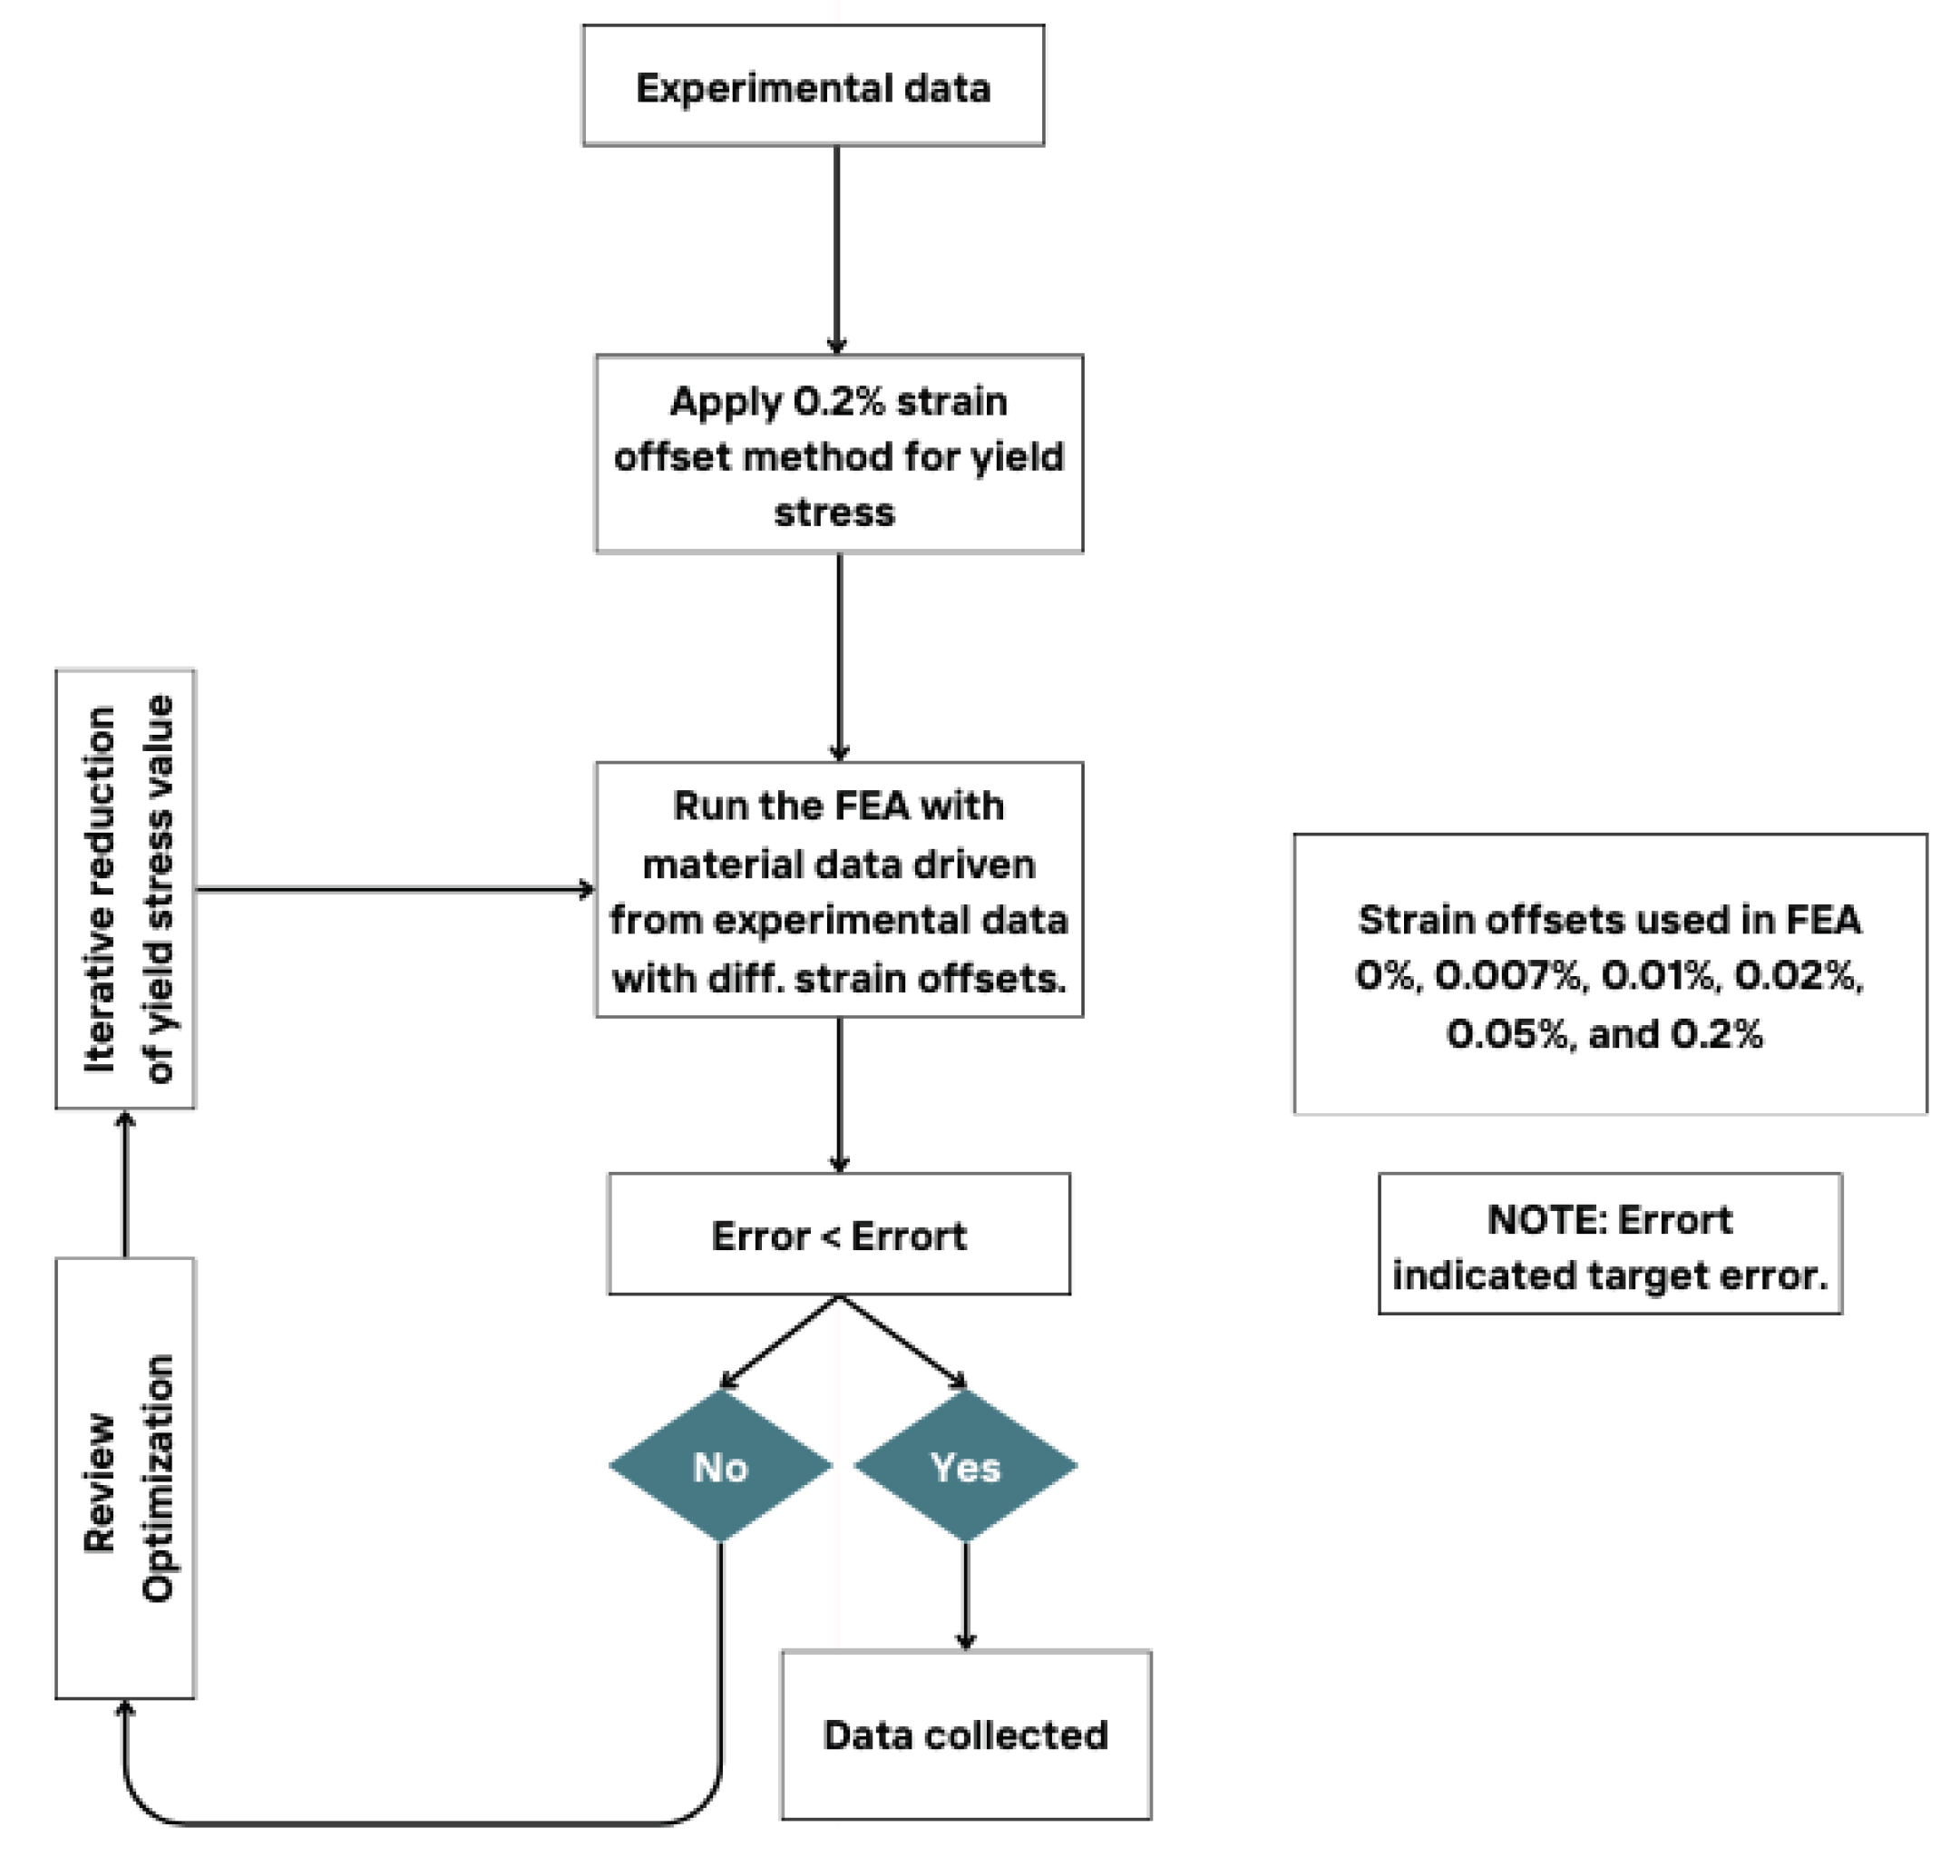
Figure 11.
Yield stress values and absolute relative error (ARE) calculation against different strain offsets i.e., 0%, 0.007%, 0.01%, 0.02%, 0.05%, and 0.2 (right), for 0°, 45°, and 90° raster orientations.
Figure 11.
Yield stress values and absolute relative error (ARE) calculation against different strain offsets i.e., 0%, 0.007%, 0.01%, 0.02%, 0.05%, and 0.2 (right), for 0°, 45°, and 90° raster orientations.
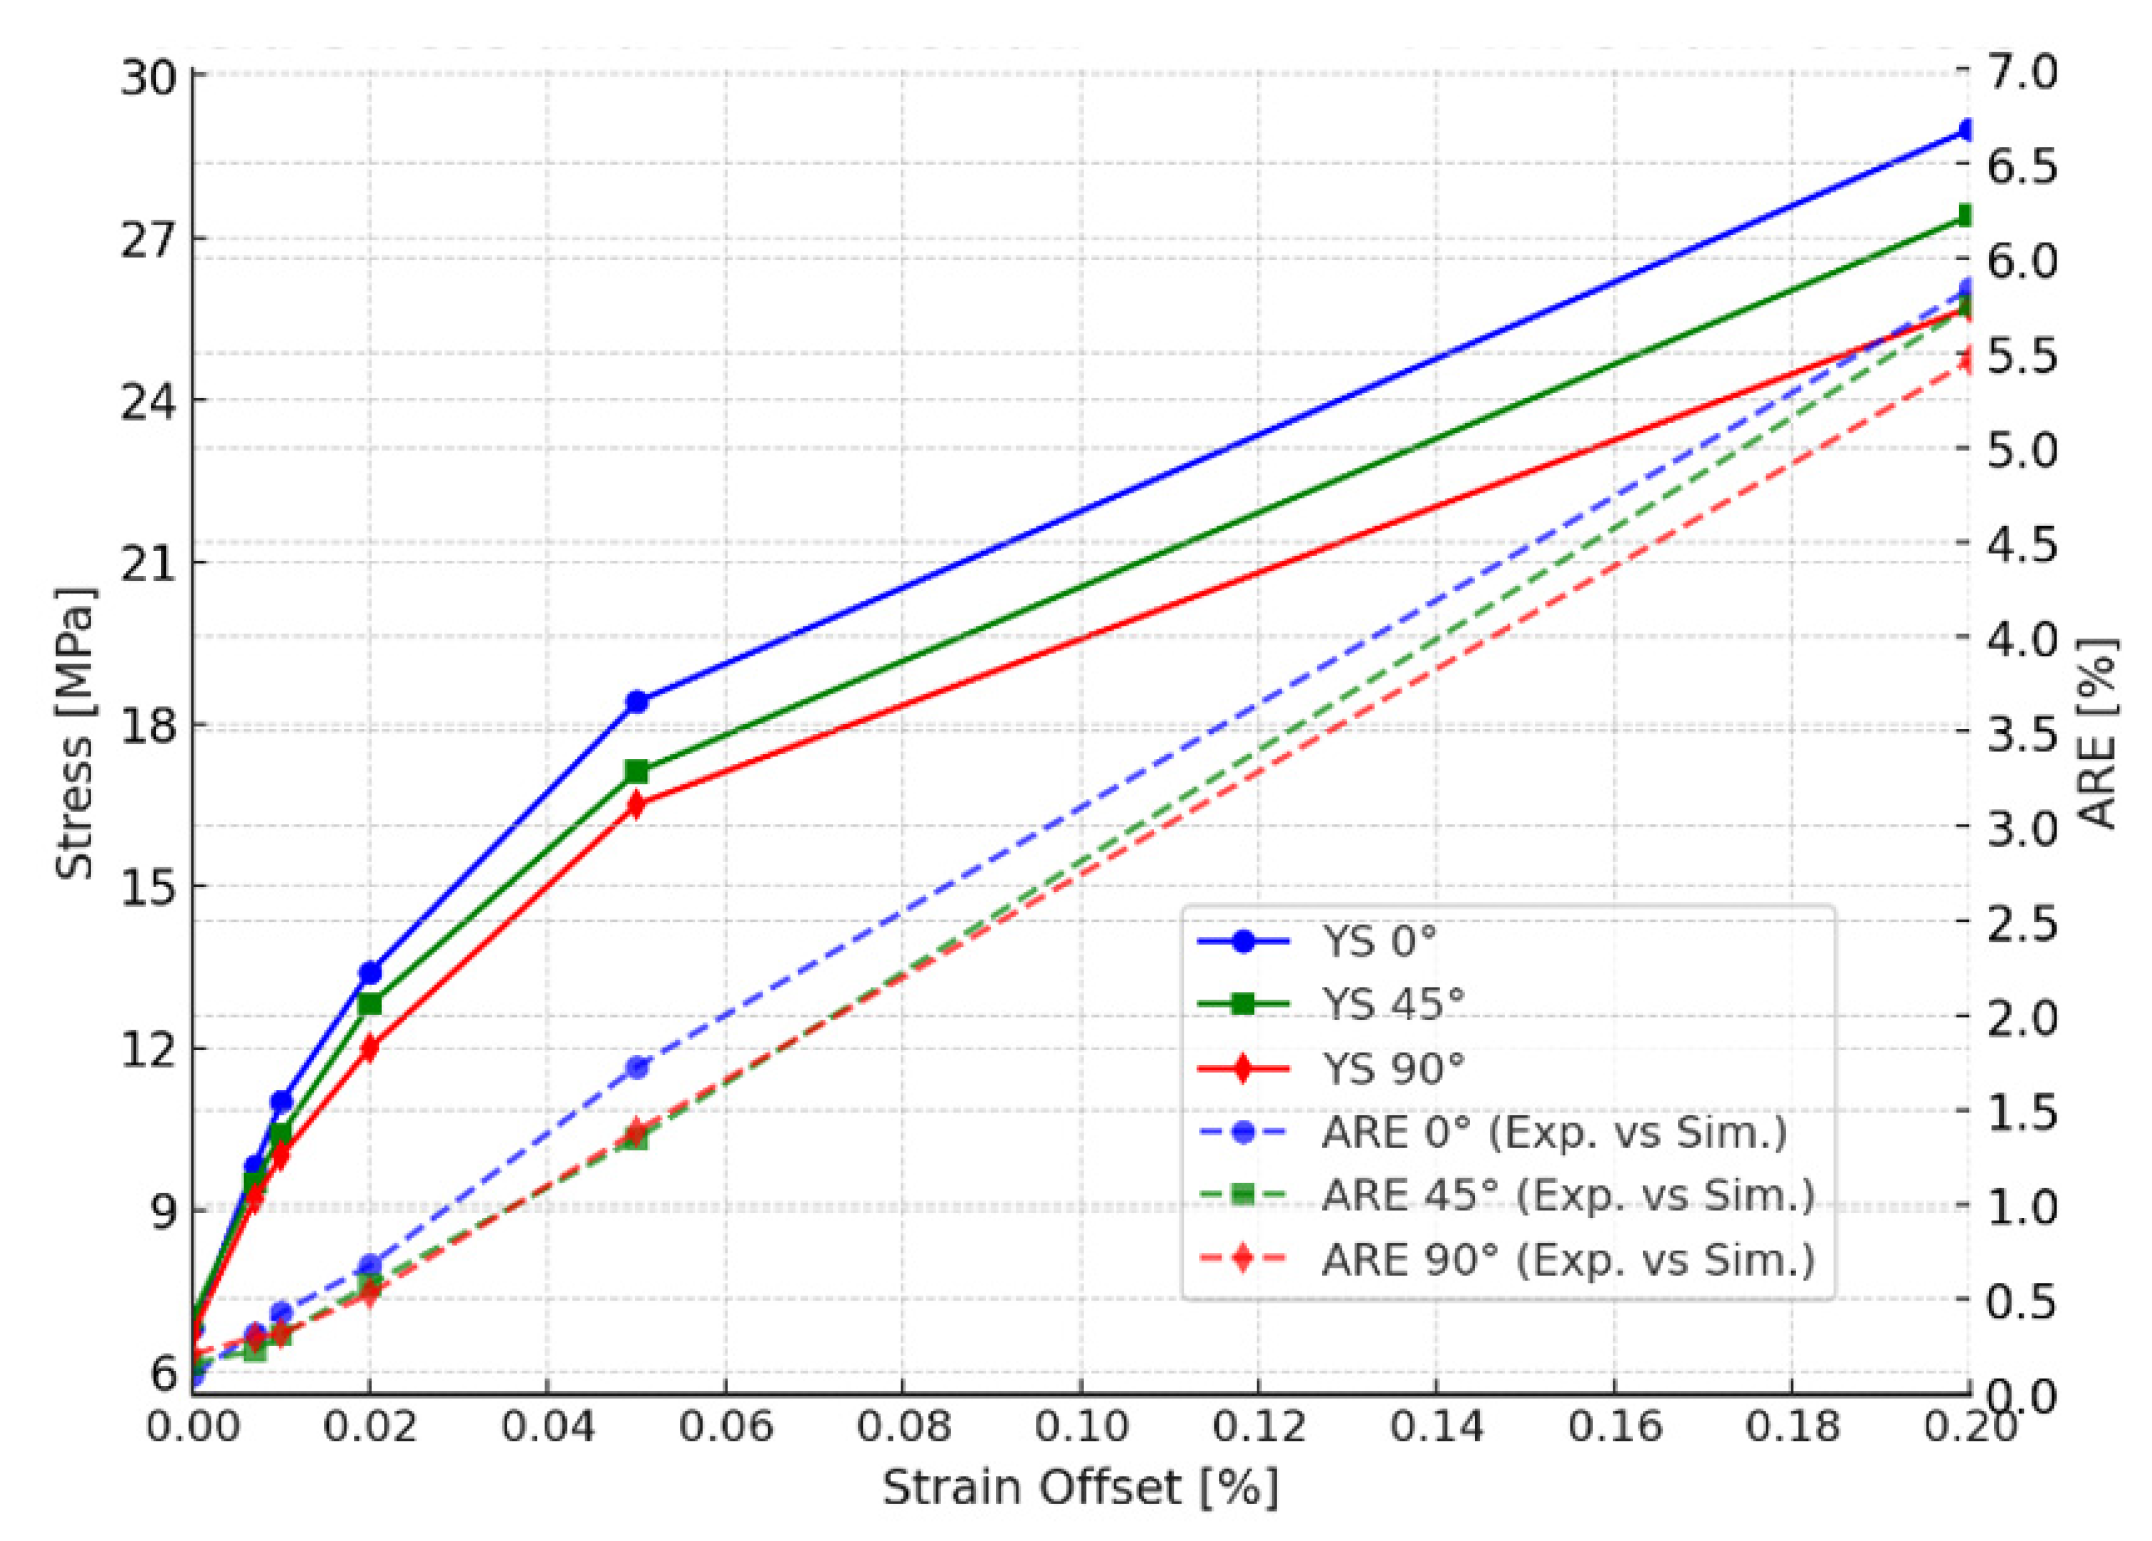
Figure 12.
Comparison between optimized simulation response against experimental response by using 0% strain offset for 0°, 45°, and 90° raster orientation.
Figure 12.
Comparison between optimized simulation response against experimental response by using 0% strain offset for 0°, 45°, and 90° raster orientation.
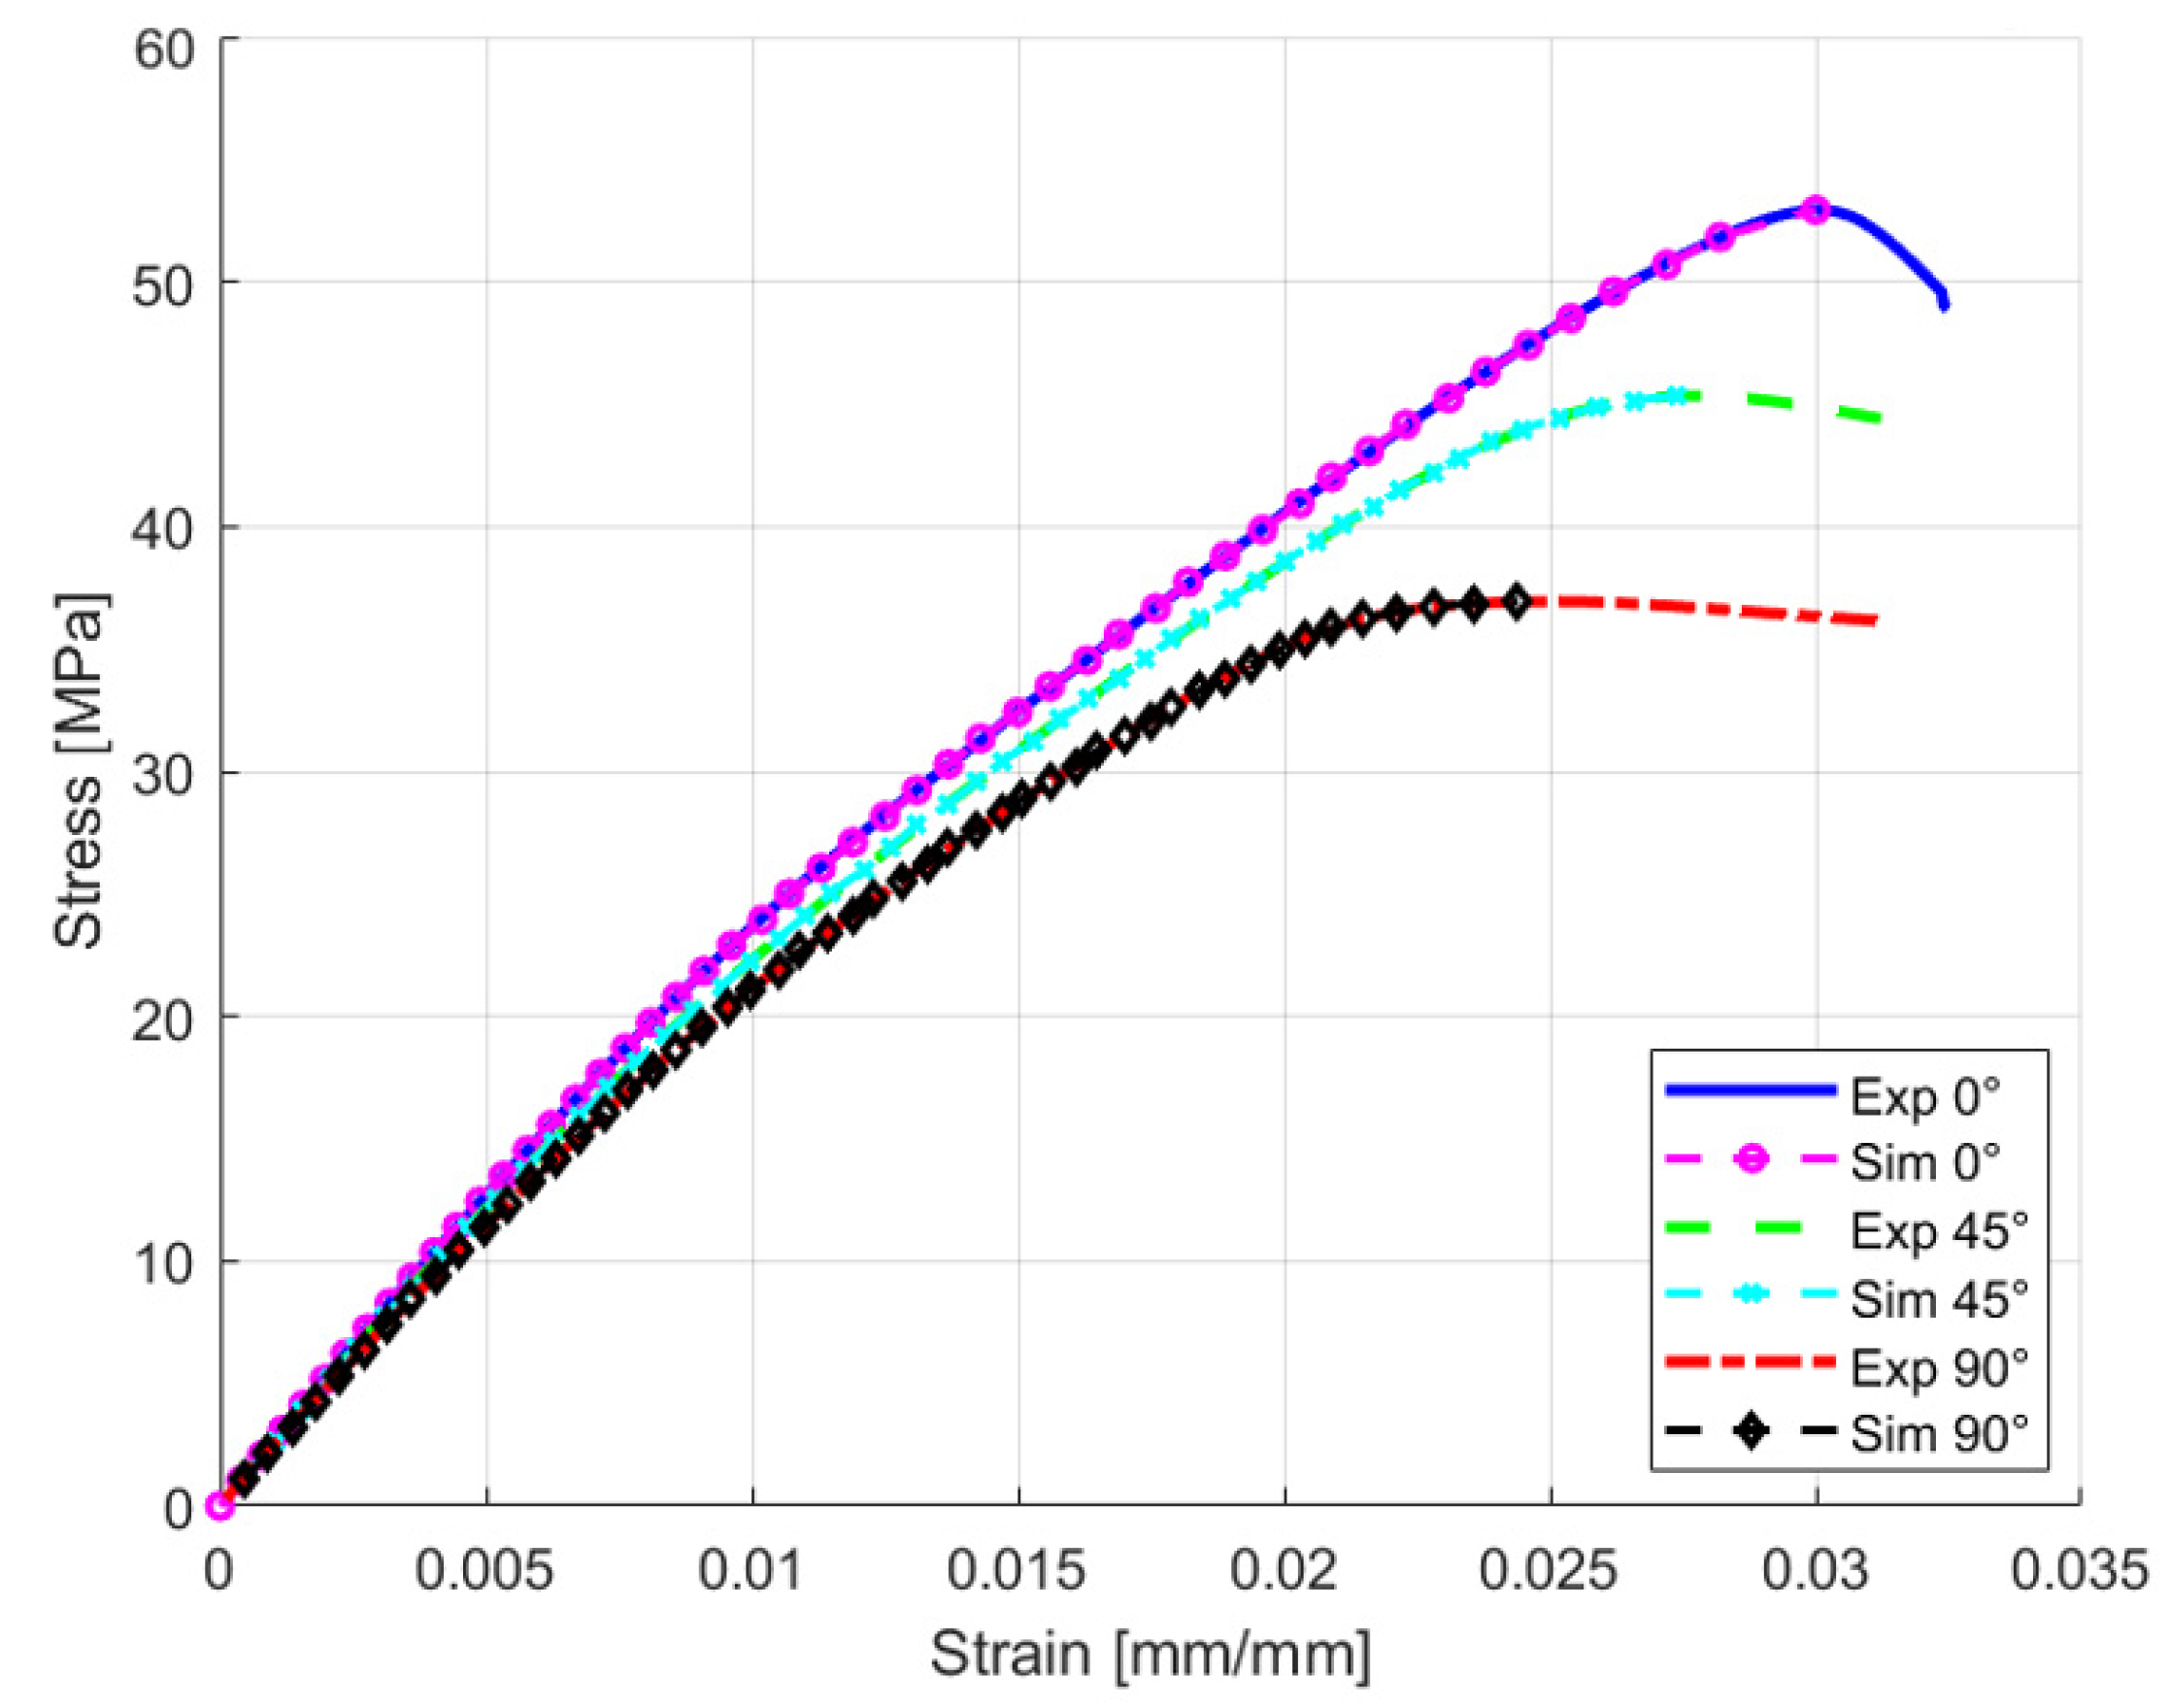
Figure 13.
Von mises stress distribution: (a) 0° of raster orientation; (b) 45° of raster orientation; (c) 90° of raster orientation.
Figure 13.
Von mises stress distribution: (a) 0° of raster orientation; (b) 45° of raster orientation; (c) 90° of raster orientation.
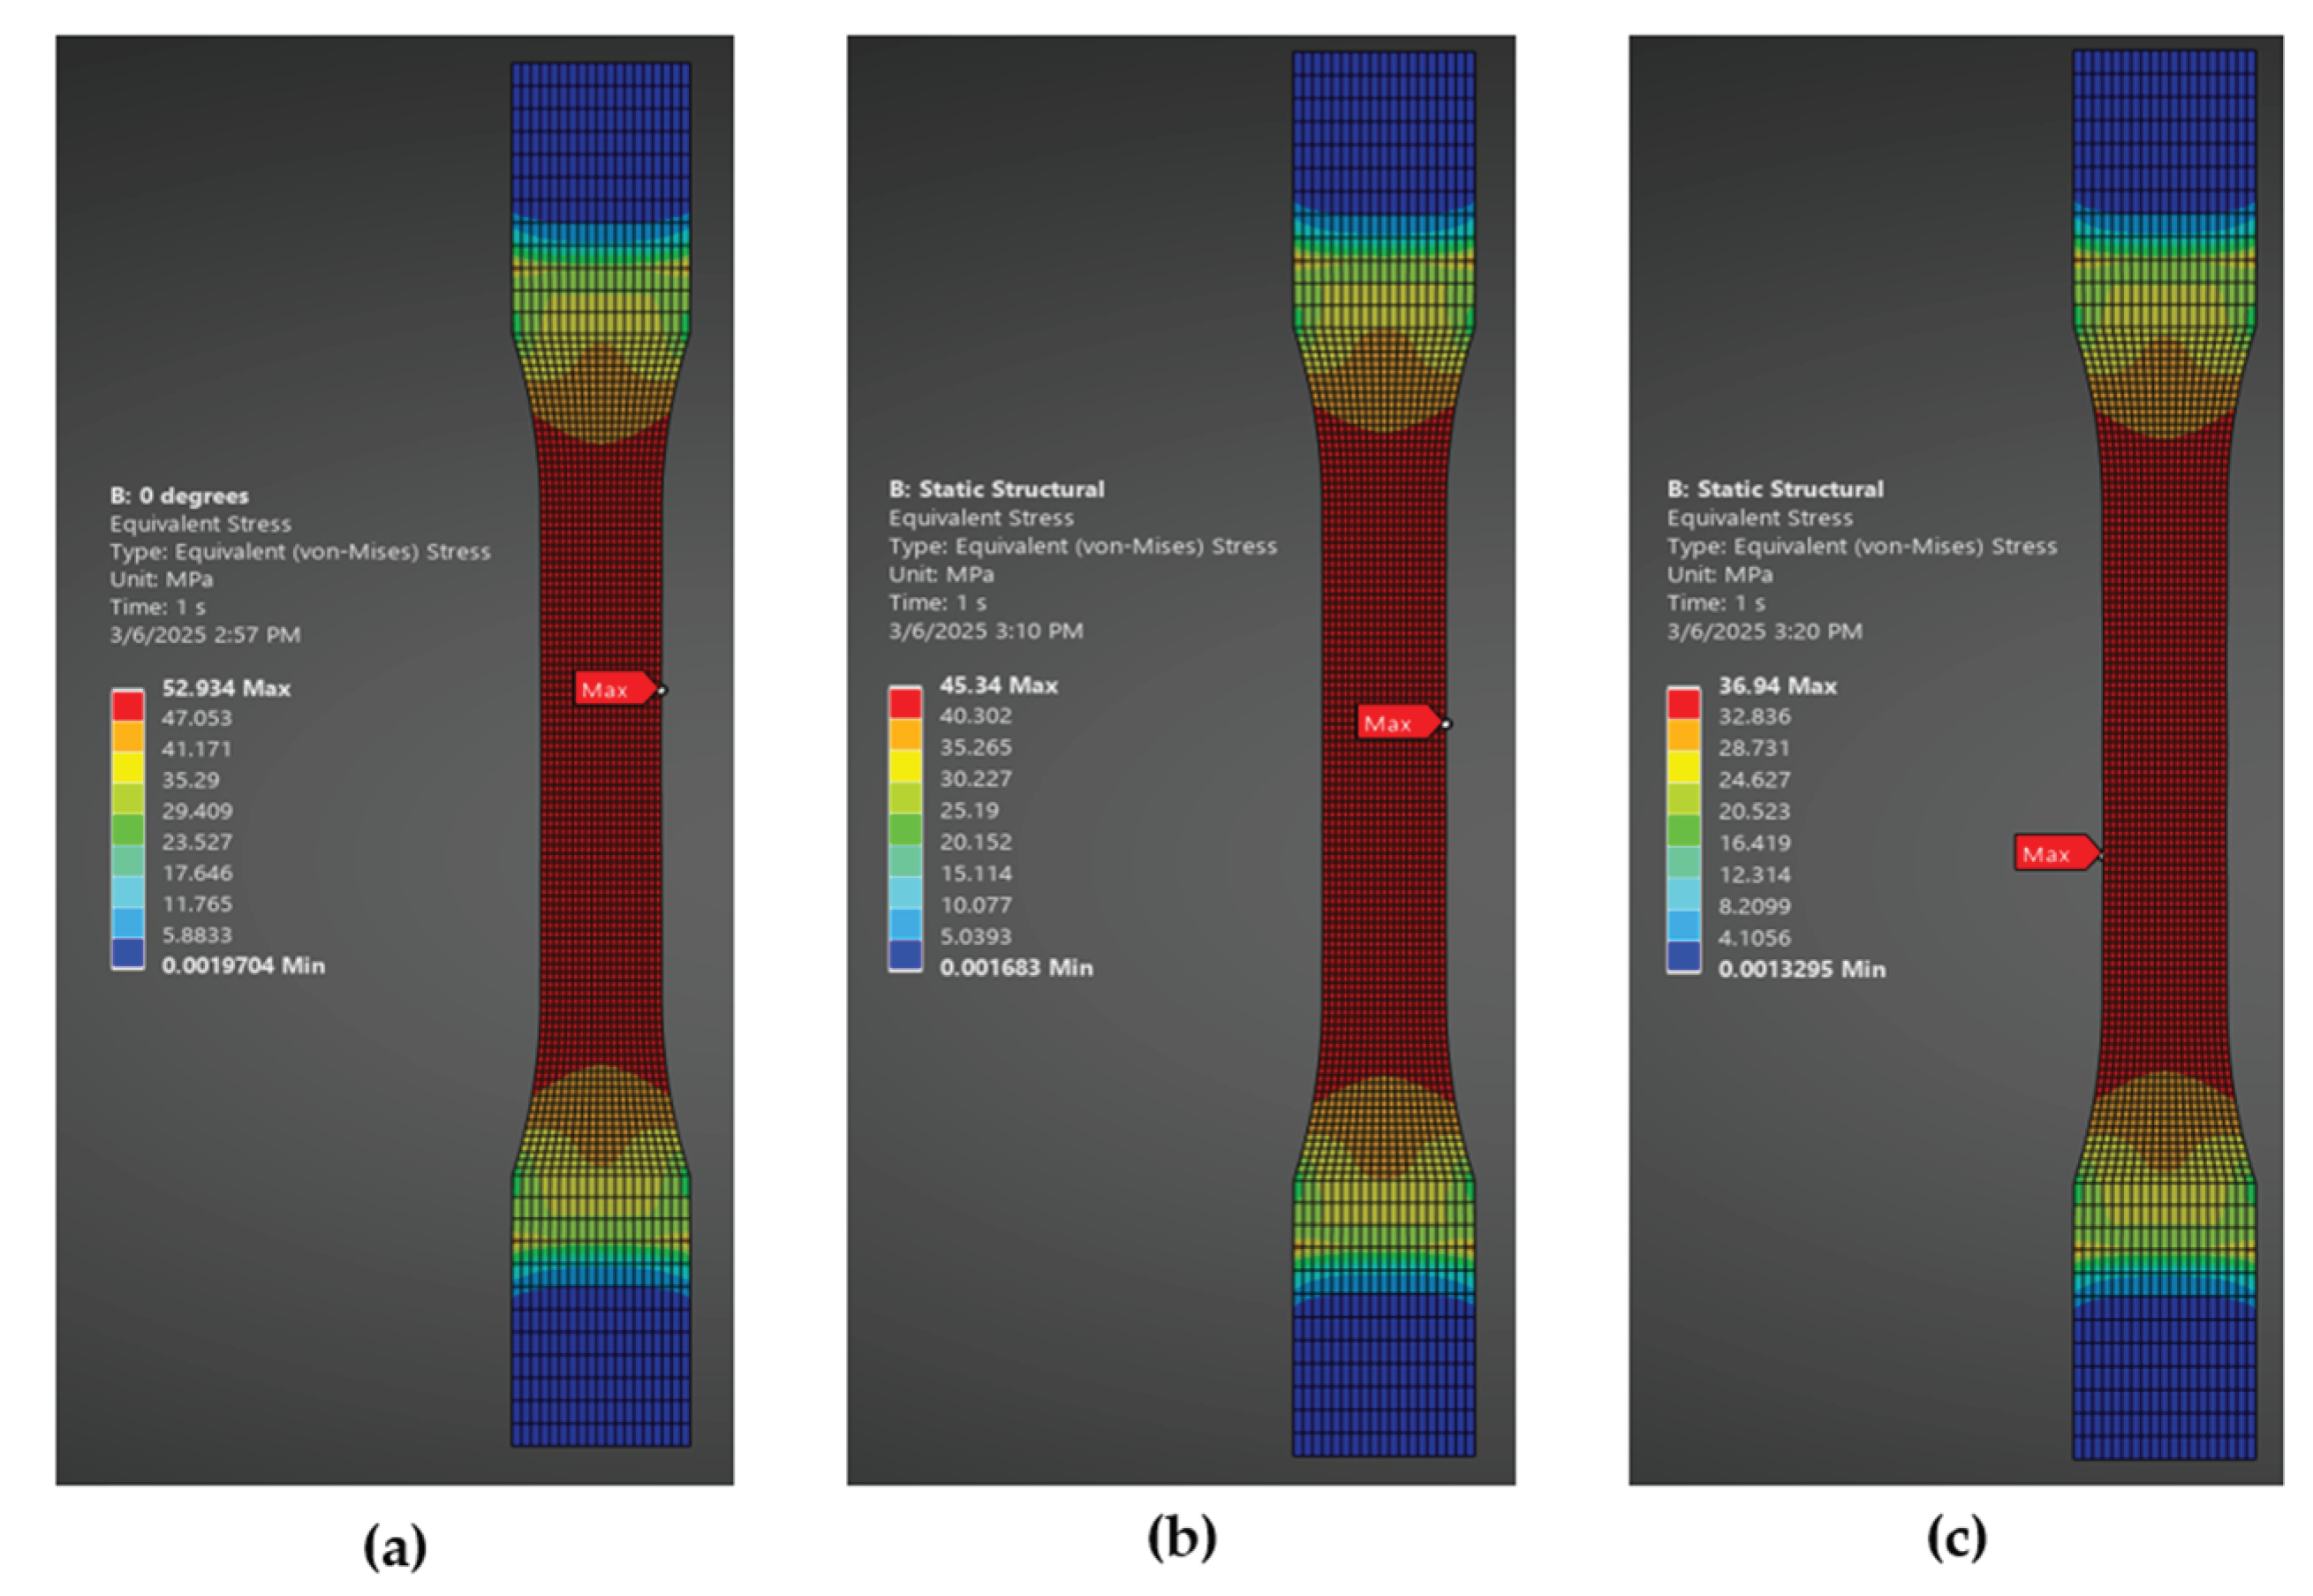

Table 1.
3D printer – Processing parameters.
| Processing Parameters | Value |
|---|---|
| Nozzle diameter | 0.4 mm |
| Layer height | 0.2 mm |
| Layer width | 0.4 mm |
| Infill pattern | Aligned rectilinear |
| Infill density | 100 % |
| Nozzle temperature | 220 ºC |
| Building temperature | 55ºC |
| Printing speed | ~ 250 mm/s |
Table 2.
Material properties of 3D-printed PLA used in FEA for different raster orientation (0°, 45°, and 90°).
Table 2.
Material properties of 3D-printed PLA used in FEA for different raster orientation (0°, 45°, and 90°).
| Properties | 0° raster orientation | 45° raster orientation | 90° raster orientation |
|---|---|---|---|
| E [MPa] | 2629.30 | 2507.10 | 2368.9 |
| UTS [MPa] | 52.93 | 45.33 | 36.94 |
Table 3.
Data corresponding to Figure 11. Yield stress values and absolute relative error (ARE) calculation against different strain offsets i.e., 0%, 0.007%, 0.01%, 0.02%, 0.05%, and 0.2 (right), for 0°, 45°, and 90° raster orientations.
Table 3.
Data corresponding to Figure 11. Yield stress values and absolute relative error (ARE) calculation against different strain offsets i.e., 0%, 0.007%, 0.01%, 0.02%, 0.05%, and 0.2 (right), for 0°, 45°, and 90° raster orientations.
| Raster Orientation | Strain offset % | Yield Stress [MPa] | ARE % exp. vs sim. |
|---|---|---|---|
| 0° | 0 | 6.8 | 0.10 |
| 0.007 | 9.8 | 0.32 | |
| 0.01 | 11 | 0.43 | |
| 0.02 | 13.4 | 0.68 | |
| 0.05 | 18.4 | 1.73 | |
| 0.2 | 29 | 5.84 | |
| 45° | 0 | 7 | 0.16 |
| 0.007 | 9.5 | 0.23 | |
| 0.01 | 10.4 | 0.31 | |
| 0.02 | 12.8 | 0.58 | |
| 0.05 | 17.1 | 1.35 | |
| 0.2 | 27.4 | 5.75 | |
| 90° | 0 | 6.7 | 0.21 |
| 0.007 | 9.2 | 0.30 | |
| 0.01 | 10 | 0.32 | |
| 0.02 | 12 | 0.53 | |
| 0.05 | 16.5 | 1.39 | |
| 0.2 | 25.7 | 5.46 |
Table 4.
Optimized material properties at 0% SO for 0°, 45°, and 90° raster orientation.
| Properties | 0° raster orientation | 45° raster orientation | 90° raster orientation |
|---|---|---|---|
| E [MPa] | 2629.30 | 2507.10 | 2368.9 |
| YS [MPa] | 6.8 | 7 | 6.7 |
| UTS [MPa] | 52.93 | 45.33 | 36.94 |
Disclaimer/Publisher’s Note: The statements, opinions and data contained in all publications are solely those of the individual author(s) and contributor(s) and not of MDPI and/or the editor(s). MDPI and/or the editor(s) disclaim responsibility for any injury to people or property resulting from any ideas, methods, instructions or products referred to in the content. |
© 2025 by the authors. Licensee MDPI, Basel, Switzerland. This article is an open access article distributed under the terms and conditions of the Creative Commons Attribution (CC BY) license (https://creativecommons.org/licenses/by/4.0/).
Copyright: This open access article is published under a Creative Commons CC BY 4.0 license, which permit the free download, distribution, and reuse, provided that the author and preprint are cited in any reuse.


