Submitted:
19 November 2025
Posted:
19 November 2025
You are already at the latest version
Abstract
Online asynchronous learning offers flexibility but often struggles to sustain engagement and interactivity across diverse learner populations. This study introduces an integrated design framework that systematically aligns pedagogical principles (Universal Design for Learning, active learning, constructive alignment), technology integration models (TPACK, PICRAT), and a microcurricula-as-a-service architecture to enable interactive and inclusive learning at scale. A three-year longitudinal case study examined a Data Literacy and Analytics module reaching over 5,220 students across more than 15 programs and five faculties. The module design constructively aligned outcomes, content, assessment, and technology to support multiple learning pathways, co-created formative assessments, and transdisciplinary collaboration, deliberately fostering Interactive and Transformative uses of technology. Mixed-methods evaluation—combining learning analytics, surveys (n = 1,743), and qualitative feedback—showed sustained positive outcomes, including 95–99% completion rates, consistently high satisfaction, and longitudinal gains in engagement. The findings demonstrate how the deliberate integration of pedagogical theory, technological frameworks, and modular architecture can deliver scalable, inclusive, and high-engagement online education, offering a transferable model for educators and robust longitudinal evidence for researchers.
Keywords:
inclusive education
; universal design for learning
; UDL
; online asynchronous learning
; technology integration
; microcurricula
; educational technology
; transformative learning active learning
; data literacy
1. Introduction
The rapid expansion of online asynchronous learning in higher education has created unprecedented opportunities to reach diverse student populations at scale [1,2]. However, this expansion has simultaneously exposed critical challenges in designing learning experiences that are truly interactive, inclusive, and accessible to learners with varied social, cultural, psychological, and economic backgrounds [3,4]. While educational institutions increasingly serve thousands of students through online platforms, many struggle to move beyond passive content delivery toward transformative learning experiences that accommodate diverse learning needs and foster meaningful engagement [5]. This challenge is particularly acute in transdisciplinary modules such as data literacy and analytics, where students from multiple academic programs with heterogeneous prior knowledge and skills must develop both technical competencies and critical analytical attitudes [6].
The post-pandemic educational landscape has accelerated hybrid and fully online learning, increasing the demand for scalable, inclusive, and effective online education. As data literacy emerges among the fundamental 21st-century transversal skills across disciplines [6], universities need to deliver high-quality instruction while ensuring accessibility for diverse learners. Student-centred pedagogies, including Universal Design for Learning (UDL) [3,7] and active learning strategies such as Problem-Based Learning (PBL) [8,9], Project-Based Learning (PjBL) [10], and Inquiry-Based Learning (IBL) [11,12], have proven effective in face-to-face contexts, yet their systematic adaptation to large-scale, asynchronous environments remains underexplored.
Despite the proliferation of educational technologies—including Learning Management Systems (LMS), interactive content tools, adaptive platforms, and AI-based systems [13,14,15]—integration of pedagogy, technology, and content design to support interactivity and inclusivity at scale remains limited. Many implementations are fragmented, dispersing key functionalities across tools and undermining coherence [16]. While technologies claim alignment with UDL principles [3], evidence of their structured integration in large-scale asynchronous curricula is scarce, limiting potential for transformative, inclusive learning for thousands of diverse students.
This paper presents a comprehensive case study of a Data Literacy and Analytics module that integrates pedagogy, technology, and inclusive curriculum design via a microcurricula-as-a-service model [17]. Microcurricula decomposes traditional modules into granular, self-contained units (0.5–1 ECTS) focused on a single learning outcome with complete content, assessment, and instructional activities. This design provides flexibility and personalisation while maintaining coherence and constructive alignment across outcomes, activities, and assessments. The module serves 5,220+ first- and second-year students across 15+ programs at DCU, delivered asynchronously over three academic years.
The approach integrates UDL, active learning, and constructive alignment with technology frameworks (TPACK [18], PICRAT [16]) and strategically exploits the Moodle Learning Management System (LMS)—aka Loop—and H5P interactive content [19]. Constructive alignment is applied at three levels: curriculum design connecting competencies, outcomes, assessments, and activities; technology selection emphasizing interactive and transformative affordances; and content development supporting multiple means of representation, engagement, and expression.
The study asks: Can the constructive alignment of pedagogy, technology, and content via microcurricula deliver an interactive and inclusive module at scale, enhancing learning for diverse students? Using mixed-methods, we analyse quantitative performance and survey data alongside qualitative student feedback collected over three years. The paper makes the following contributions to the fields of educational technology and inclusive online learning:
- Integrated Design Framework: Presents an evidence-based framework synthesizing pedagogical theories (UDL, active learning, constructive alignment), technology integration models (TPACK, PICRAT), and microcurricula design to support interactive and inclusive online learning at scale.
- Microcurricula-as-a-Service Model: Introduces and demonstrates a novel modular curriculum design approach that enhances flexibility, personalisation, and accessibility while maintaining coherent learning pathways for diverse student populations.
- Systematic Technology Integration: Documents the strategic selection and exploitation of educational technologies (Moodle/Loop, H5P) guided by explicit integration frameworks, demonstrating how specific technological affordances support UDL principles and active learning strategies in asynchronous environments.
- Longitudinal Evidence at Scale: Provides empirical evidence from a three-year implementation serving students across multiple disciplines, demonstrating sustained effectiveness in supporting learning outcomes, engagement, and inclusive practices in large-scale online education.
- Practical Implementation Guidelines: Offers transferable insights for educators and curriculum designers seeking to integrate pedagogy, technology, and content in online learning contexts.
The remainder of the paper is structured as follows. Section 2 reviews theoretical foundations, technology frameworks, and related online learning approaches. Section 3 presents the integrated design framework and case study context. Section 4 describes data collection and analysis. Section 5 reports three years of quantitative and qualitative findings. Section 6 interprets results, examines implications, and notes limitations. Section 7 summarises contributions and outlines directions for future research.
2. Background: Theoretical Framework and Related Work
The design of interactive and inclusive online learning experiences requires the systematic integration of pedagogical theories, technology integration frameworks, and educational content design. This section reviews the theoretical foundations that informed our approach, examines frameworks for technology integration in educational contexts, explores the capabilities of relevant educational technologies, and situates this work within the broader landscape of online learning design research.
2.1. Pedagogical Foundations for Inclusive Online Learning
Learning theories provide the foundation for effective curriculum design in higher education. Behaviourism emphasises learning through stimulus and response [20], while cognitivism focuses on mental processes of understanding and memory. Constructivism, which underpins this work, views learning as an active process where students construct knowledge through experience and reflection [21,22,23,24]. In asynchronous online environments, constructivist approaches are especially valuable as they support learners with diverse backgrounds, allowing them to engage meaningfully, progress at their own pace, and connect new ideas to prior knowledge.
2.1.1. Active Learning Strategies
Active learning shifts focus from passive reception to active engagement, where students construct understanding through doing [8]. Strategies such as Problem-Based Learning (PBL) encourage inquiry and collaboration around authentic problems [9,25,26], while Project-Based Learning (PjBL) extends this through sustained work that produces real outcomes [10,27]. Inquiry-Based Learning (IBL) nurtures curiosity and independence [11,12], and Mastery Learning emphasises gradual progress through feedback and scaffolding [28,29,30]. When supported by educational technology, these strategies transform online learning into an interactive, reflective, and learner-centred experience.
2.1.2. Universal Design for Learning
Universal Design for Learning (UDL) provides a proactive framework for creating inclusive learning environments that serve all students from the outset [3]. It is built on three principles—Multiple Means of Representation (MMR), Multiple Means of Engagement (MME), and Multiple Means of Action and Expression (MMAE) [1,7,31]. These encourage varied content formats, flexible learning pathways, and multiple ways for students to demonstrate understanding. In large-scale online settings, applying UDL principles ensures accessibility, fosters autonomy, and enhances motivation. Achieving this requires thoughtful technology design that combines flexibility with clear structure, creating experiences that accommodate difference without compromising coherence.
2.1.3. Constructive Alignment
Constructive alignment ensures that learning outcomes, activities, and assessments work together coherently to achieve educational goals [32,33]. In online contexts, it extends to technology selection—tools must serve learning purposes rather than novelty. Well-aligned designs help students understand what is expected, how to achieve it, and how their progress is assessed. When applied effectively, constructive alignment brings together pedagogy, technology, and assessment into a unified structure that supports purposeful, transparent, and engaging online learning.
2.2. Technology Integration Frameworks
While pedagogical theories provide foundations for learning design, systematic integration of educational technologies requires explicit frameworks that guide selection and implementation decisions. Two complementary frameworks—TPACK and PICRAT—inform our approach to technology integration in this work.
2.3. Technological Pedagogical Content Knowledge (TPACK)
The TPACK framework extends Shulman’s concept of Pedagogical Content Knowledge (PCK) [34,35] by explicitly incorporating technological knowledge as a key dimension of effective teaching in digital environments [36,37]. It highlights the interplay of content, pedagogy, and technology, emphasizing their intersections: PCK concerns how to teach specific content; TCK focuses on how technology reshapes content representation; and TPK examines how teaching evolves with technology. The integrated TPACK (See Figure 1.a) domain represents knowledge required to teach specific content using appropriate technologies in pedagogically sound ways. Although criticised for unclear boundaries [16] and limited adaptability to rapid technological change [38], TPACK provides framework guiding technology selection and implementation grounded in pedagogical and content relevance.
2.3.1. Passive, Interactive, Creative and Replace, Amplify, Transform ( PICRAT)
While TPACK guides the knowledge required for integrating technology, the PICRAT framework (See Figure 1.b) evaluates its impact on student engagement and learning transformation [16]. It combines two dimensions: the PIC model—categorizing student interaction as Passive (consuming content), Interactive (manipulating or responding), or Creative (producing new artefacts)—and the RAT model, which assesses technology’s pedagogical function as Replacement, Amplification, or Transformation. Replacement substitutes traditional tools, Amplification enhances efficiency or accessibility, and Transformation enables novel learning experiences. Kimmons et al. [16] emphasize that true transformation occurs when technology facilitates otherwise impossible learning activities. The combined PICRAT matrix thus guides educators toward Interactive and Creative–Transformative applications that maximise technology’s potential, particularly in online asynchronous environments.
Together, TPACK and PICRAT provide complementary frameworks: TPACK guides the integration of technological, pedagogical, and content knowledge, while PICRAT offers criteria for evaluating whether specific implementations effectively engage students and transform learning experiences. Both frameworks informed the technology selection and implementation decisions in this work.
2.4. Educational Technologies for Online Learning
The educational technology landscape has evolved rapidly, encompassing LMS platforms, interactive tools, adaptive systems, and emerging AI-based solutions [13,14,15]. Yet, many remain resource-intensive or untested at scale. This study focuses on two mature, accessible technologies—Moodle-based LMS and H5P interactive content—that effectively operationalise UDL and active learning at scale in online asynchronous environments.
2.4.1. Learning Management Systems: Moodle/Loop
Learning Management Systems (LMS) form the foundation of online and blended learning by centralizing course delivery, communication, and assessment [40]. Moodle/Loop provides modular course structures, multi-format content, discussion tools, assessment systems, analytics, and integration capabilities supporting inclusive, student-centered learning. These affordances align with UDL principles and enable flexible, scalable course designs. While LMS platforms provide structure and analytics, achieving higher interactivity and creativity requires complementary tools that move practice from Passive-Replace toward Interactive-Amplify or Creative-Transform dimension within the PICRAT framework.
2.4.2. H5P: Interactive Content Creation and Delivery
H5P is an open-source framework that integrates with LMS platforms to create engaging, interactive HTML5 content [19]. Offering over 50 activity types—from interactive presentations and multimedia enhancements to embedded assessments—H5P supports multiple means of representation, engagement, and expression. Its integration with Moodle transforms static materials into dynamic learning experiences while preserving analytics and feedback. This synergy enables sustainable, scalable, and transformative online learning, fostering active engagement and measurable learning gains.
2.5. Related Work and Research Gap
While educational technology integration in higher education has been widely studied, key gaps persist that this work addresses. Studies on UDL [5], active learning [9], or educational technologies [19,40] often examine isolated dimensions—pedagogy, technology, or content—without demonstrating their systematic alignment. This fragmentation limits practitioners’ ability to translate theory into coherent, scalable learning designs. Further, existing research draws on small-scale pilots or single-semester implementations [41,42]. Few studies evaluate inclusive online learning across large cohorts or multiple programs, leaving questions about scalability, sustainability, and long-term impact unanswered.
Considering theory and practice, frameworks such as TPACK and PICRAT [16,36] are conceptually appropriate but rarely operationalised in real-world course design or evaluation, making their practical implications and transferability unclear. Although competency-based microcredential approaches are growing [6], limited research explores how modular “microcurricula” structures can balance flexibility, coherence, and accessibility in asynchronous environments. Last, but not least, data literacy research remains discipline-specific [6], with little focus on transdisciplinary designs that support diverse learners across academic programs. Understanding how to maintain coherence and relevance across such breadth remains a critical research need.
3. Integrated Design Framework and Case Study Implementation
This section presents the integrated design framework that synthesises pedagogical foundations, technology integration models, and educational technologies from Section 2, followed by its application in a large-scale data literacy and analytics module.
3.1. The Integrated Design Framework
The framework (Figure 2) integrates four interconnected dimensions that enable interactive, inclusive online learning at scale: (1) competency-driven curriculum design, (2) Microcurricula as a Service architecture, (3) pedagogical integration, and (4) systematic technology selection and evaluation.
3.1.1. Competency-Driven Design and Microcurricula Architecture
The framework begins with systematic identification of learning competencies using established frameworks (e.g., DigComp 2.2 for data literacy [6]), stakeholder input, and alignment with program requirements. These competencies are then structured into Microcurricula as a Service (MaaS) [17,43]—a modular architecture that decomposes monolithic modules into granular, self-contained learning units (0.5–1.0 ECTS each).
Each microcurriculum functions as an independent service with: (1) specific learning outcome(s) aligned to competencies, (2) complete instructional content and activities, (3) aligned assessment measuring outcome achievement, (4) dedicated delivery infrastructure (LMS course page), and (5) independent progress tracking. This architecture, derived from software engineering principles (microservices, service-oriented architecture [43]), enables multiple forms of flexibility: structural (combining into varied module sizes or embedding across programs), temporal (asynchronous year-round access), pathway (multiple tool/context implementations), and pedagogical (personalised sequences, mastery-based progression).
The MaaS approach directly supports UDL principles: multiple means of engagement through learner choice and pacing, multiple means of representation through varied pathway implementations, and multiple means of action and expression through diverse assessment approaches across microcurricula. This modular architecture is essential for delivering personalised, inclusive learning at scale while maintaining coherence and constructive alignment.
3.1.2. Pedagogical Integration
The framework systematically integrates UDL, active learning, and constructive alignment through structured design processes. UDL’s three principles are embedded from inception: content designed multimodally (MMR), modular structure enabling choice and autonomy (MME), and varied assessment formats (MMAE). Active learning is operationalised through ABC Learning Design [44,45], which structures experiences across six learning types: Acquisition, Investigation, Practice, Discussion, Collaboration, and Production. Each microcurriculum explicitly plans activities across these types, ensuring students move beyond passive consumption toward investigation, application, and creation.
Constructive alignment extends beyond traditional outcome-activity-assessment alignment to encompass technology selection (technologies chosen for their capacity to support planned activities) and content design (formats enabling intended interactions). The granular microcurricula structure inherently supports mastery learning—students demonstrate achievement before progressing, with formative feedback informing readiness and enabling targeted support.
3.1.3. Systematic Technology Selection and Evaluation
The framework employs TPACK to guide technology selection, ensuring choices emerge from the intersection of pedagogical requirements, content characteristics, and learning contexts rather than from feature lists or popularity. Technologies are selected by asking: “Does this support our pedagogical strategies?”, “Can it represent content effectively?”, “ Is it accessible for diverse learners?”, and “Does it integrate with institutional infrastructure?”
PICRAT serves dual purposes: as a design tool guiding decisions toward Interactive and Creative uses with Amplification or Transformation effects, and as an evaluation tool assessing implemented designs. During design, PICRAT prompts: Will students interact passively, actively, or creatively? Does technology merely replace, amplify, or transform practices? These questions deliberately move designs away from Passive-Replacement toward higher-impact quadrants. During evaluation, PICRAT provides structured analysis of actual student engagement and technology effects, informing iterative refinements.
3.1.4. Implementation Process
The typical design process proceeds: (1) define competencies using frameworks and stakeholder input, (2) structure competencies into focused microcurricula, (3) apply UDL and design experiences across ABC learning types ensuring constructive alignment, (4) select technologies using TPACK criteria, (5) design implementations using PICRAT to maximise interactivity and transformation, and (6) evaluate and iterate based on evidence. This systematic approach, adaptable to diverse contexts, is demonstrated in the following case study.
3.2. Case Study: Data Literacy and Analytics Module
The framework was applied in designing and delivering a Data Literacy and Analytics module at Dublin City University delivered entirely online and asynchronously.
3.2.1. Module Structure and Competency Mapping
The module structure emerged from design-thinking workshops with program chairs, industry partners, and students, benchmarked against literature and best practices, and formalised using DigComp 2.2 [6]. Seven core topics (Figure 3. b) address intermediate- and high-level competencies: four knowledge/attitudes topics (Data Literacy and Analytics, Big Data Analytics, Data Protection and Ethics, Database Modelling) and three skill related topics (Introductory Spreadsheet, Intermediate Spreadsheet, Data Visualisation and Communication).
Each Data Literacy and Analytics Topic (DLAT) is implemented as an independent microcurriculum with dedicated Moodle/Loop page, content, assessment, and progress tracking (Figure 3.b). Skill related topics are delivered through three tool pathways—Spreadsheets, R, and Python—with identical learning outcomes but different implementation tools, resulting in nine distinct microcurricula accommodating diverse program requirements. The MaaS model flexibly combines microcurricula into 5.0, 7.5, or 10.0 ECTS stand-alone modules or embed them individually in other program-specific modules. Around 26 module coordinators have embedded one or more microcurricula in their module with out recreating the resources or the assessment.
Students access content asynchronously throughout the semester or the academic year according to their program preference, progress at their own pace, and attempt assessments upon completion. For students taking 5-ECTS module, they are required to pass each microcurricula successfully to pas the module. This structure provides student agency, supports mastery learning, and accommodates diverse circumstances—critical for full-time and part-time students, those with caring responsibilities, and international students managing time zones.
3.2.2. Content Development and Pedagogical Implementation
Content within each microcurriculum applies UDL principles and ABC Learning Design, incorporating all six learning types: Acquisition (H5P interactive books with multimodal content), Investigation (formative questions, interactive videos), Practice (peer-learning activities, case studies), Discussion (open-ended forum questions), Collaboration (peer-learning activities), and Production (assignments creating artefacts). Table 1 maps learning types to technologies, UDL principles, strategies, and rationales.
UDL implementation includes: multimodal content (text, video, audio, interactive elements) for MMR; learner choice in pathways/pacing and varied activities for MME; and diverse assessment formats (quizzes, projects, discussions, peer activities) for MMAE. With continuous design and integration, 350 FACCtS—Formative Assessments Co-Created with Students provide extensive low-stakes practice with immediate feedback, supporting mastery learning and reducing assessment anxiety.
3.2.3. Technology Integration: PICRAT Analysis
The systematic application of PICRAT during design ensured technology use genuinely enhanced learning.
Passive Dimension: Technology replaces print media with accessible digital content (Figure 4 left), amplifies through multimodal organisation and expert interviews (Figure 4 middle), and transforms via comprehensive analytics enabling individual progress tracking and instructor insights at scale (Figure 4 right).
Interactive Dimension: Digital formats replace traditional assessments with immediate feedback (Figure 5 left). Amplification occurs through detailed, customised feedback linking to content sections, interactive videos requiring active engagement, and automated guidance for thousands of practice attempts (Figure 5 right). Transformation emerges through transdisciplinary peer discussions where students from 15+ programs contribute diverse perspectives, peer-learning activities enabling scaled collaboration, and adaptive scaffolding providing personalized support based on individual responses—coordination at this scale impossible without technology.
Creative Dimension: Students create digital artefacts (datasets, visualisations, ER diagrams) demonstrating authentic application (Figure 6 left). Sharing via Loop boards amplifies learning—students see diverse design approaches from peers, raising quality standards and expanding understanding of possibilities. Transformation occurs through integrated competency projects requiring data collection, analysis, visualisation, and communication with iterative peer refinement (Figure 6 right), and through student co-creation of 350+ formative questions (FACCtS), shifting from consumers to co-creators—cyclical improvement enabled by technology at scale.
The deliberate design emphasis on Create-Transform, Create-Amplify, Interact-Transform, and Interact-Amplify quadrants ensured technology genuinely enhanced learning rather than merely automating traditional approaches. Each activity was explicitly evaluated using PICRAT criteria during design, with designers asking “Can this be more interactive?” and “Does this transform what’s possible?” This resulted is a module where students experience active engagement through interactive content, extensive peer interaction across disciplines, and creative production opportunities—all delivered asynchronously at scale to thousands of diverse students, representing fundamental transformation enabled by systematic technology integration aligned with pedagogical principles.
4. Methodology
The research is grounded in a pragmatic paradigm [46,47], emphasizing practical utility and integrating diverse forms of evidence to address real-world educational challenges. This study employs a mixed method to capture the complexity of integrating technology, pedagogy, and content in the creation of an interactive and inclusive university module. Case study is particularly exploited for in-depth exploration of bounded contexts, enabling examination of the interplay among multiple design elements in authentic educational practice [48].
To evaluate the module’s effectiveness in supporting student learning and engagement, data were collected through annual end-of-module questionnaires, providing systematic longitudinal insights into student experiences over three academic years. These self-report data were complemented by system-generated learning analytics from the Moodle/Loop platform, providing objective measures of engagement to triangulate with students’ perceptions. A mixed-methods approach combining quantitative and qualitative analyses was necessary to capture both measurable patterns of student interaction and the nuanced perspectives that illuminate how and why students experienced the module as they did. This methodological integration provides a comprehensive account of the module’s impact on diverse student populations.
4.1. Participants
All students enrolled in one or more Data Literacy and Analytics for the 21st Century microcurricula over three academic years were invited to participate in an optional end-of-semester online survey administered through the learning platform. Participation was voluntary and anonymous, with no personally identifiable data collected. Students were informed of the study’s purpose and their right to withdraw at any stage before proceeding to the questionnaire.
The target population comprised approximately 5,220+ students enrolled in DLAT microcurricula across three cohorts: 2022/23 (n≈805, 15%), 2023/24 (n≈2,224, 43%), and 2024/25 (n≈2190, 42%). Students represented 15+ academic programs from five faculties, spanning disciplines including business, computing, science, engineering, and humanities. This diversity reflects the transdisciplinary nature of the module and ensures findings capture experiences across varied academic backgrounds and prior knowledge levels.
A total of 1,743 students provided complete responses to all survey items, yielding a 32% response rate. This rate is comparable to similar end-of-module surveys in higher education settings [49] and represents a substantial sample for examining student perceptions across a large-scale online module. The distribution of respondents across years roughly paralleled enrolment patterns, ensuring longitudinal representativeness.
4.2. Ethical Considerations and Procedures
The study was conducted in full compliance with ethical and data protection regulations, including the General Data Protection Regulation (GDPR, 2016 [50]). Ethical approval for all procedures was granted by the Dublin City University Research Ethics Committee (Approval No. DCUREC/2024/181 and DCUREC/2025/007). Informed consent was obtained from all participants prior to data collection through an information sheet presented before survey access.
The survey was administered anonymously through Moodle/Loop at the conclusion of each semester, accessible to students upon completing their registered microcurricula. This timing ensured responses captured summative reflections on the complete module experience rather than partial or in-progress impressions. Students received detailed information outlining the study’s purpose, voluntary nature of participation, anonymity of responses, and their right to discontinue at any stage. All data were stored securely on university servers and processed following institutional data integrity and quality assurance procedures.
4.3. Instruments
Survey items were developed in accordance with Quality and Qualifications Ireland (QQI) standards [51] for programme design and evaluation, ensuring coherence among learning outcomes, teaching activities, assessments, and student experience. Guided by the constructive alignment framework [33], items were reviewed by educational practice experts to verify clarity, construct relevance, and pedagogical alignment.
The questionnaire consisted of 11 five-point Likert-type items ranging from Strongly Disagree (1) to Strongly Agree (5), organised into four dimensions aligned with the study’s evaluation focus:
- Satisfaction (Q1–Q3): Module design clarity, structure, and overall satisfaction with learning experience
- Content Quality (Q4–Q5, Q7–Q8): Resource quality and diversity, disciplinary relevance, and content appropriateness
- Engagement (Q6, Q10): Platform-mediated interaction, intellectual stimulation, and cognitive challenge
- Learning Outcomes (Q9, Q11): Perceived knowledge gain, skill development, and transferability to other contexts
Additionally, three open-ended questions invited students to: (Q12) describe features they found particularly engaging or effective, (Q13) identify challenges encountered during the module, and (Q14) recommend improvements or additional features. R responses (<0.01%) that contained “Not Applicable” answers were excluded from analysis.
To ensure measurement consistency, internal reliability analyses were conducted for each dimension using both Cronbach’s and McDonald’s (Table 2). All dimensions demonstrated strong internal consistency across the three years, with values ranging from 0.78 to 0.89 and values from 0.78 to 0.90. The consistently good reliability coefficients confirm that the survey instrument maintained good internal consistency and conceptual coherence throughout the longitudinal study period. The slightly higher values in some categories suggest latent multidimensionality within construct structures, likely attributable to the integration of diverse interactive learning elements within the module design.
4.4. Data Analysis
Quantitative data were analysed using descriptive statistics including mean, median, mode, standard deviation, and quartile distributions to summarise student responses across the three academic years. The 11 Likert-type items were analysed both individually and grouped by their four conceptual dimensions (Satisfaction, Content Quality, Engagement, Learning Outcomes) based on thematic alignment. Response distributions were visualised using stacked horizontal bar charts showing percentage distributions across all response categories (1–5), enabling clear identification of patterns and trends over time.
Qualitative responses to the three open-ended questions underwent structured thematic analysis [52,53]. Preprocessing involved removing short, non-informative entries (e.g., “No”, “None”, “N/A”) that provided no substantive feedback. The remaining responses were coded inductively to identify recurring themes related to effective module features, experienced challenges, and suggested improvements. Themes were iteratively refined through comparison across responses and years, with attention to both dominant patterns and significant minority perspectives that might inform design improvements.
Learning analytics data from Moodle/Loop platform, including content access patterns, formative assessment completion rates, and discussion forum participation metrics provided complementary quantitative evidence of student engagement. These objective behavioural measures were analysed descriptively and triangulated with survey responses to corroborate or contextualise self-reported perceptions of engagement and learning.
Data from the three academic years were analysed both individually to capture year-specific patterns and aggregated to provide a comprehensive longitudinal view of student perceptions and engagement trends over the sustained implementation period. This dual approach enabled identification of both stable characteristics of the module design and evolutionary patterns reflecting iterative improvements based on ongoing evaluation.
5. Results
This section presents findings from learning analytics and student survey data collected over three academic years (2022/23–2024/25), evaluating the effectiveness of the integrated design framework in supporting student engagement, content quality, learning outcomes, and experiences. Results are organised into four subsections: engagement and completion patterns from learning analytics, quantitative survey findings across four dimensions (satisfaction, content quality, engagement, learning outcomes), longitudinal trends, and qualitative insights from open-ended responses.
5.1. Engagement and Completion Patterns
Over the three-year implementation period, cumulative enrolment reached more than 5,220+ students across 15+ academic programs and five faculties, demonstrating the module’s extensive reach and transdisciplinary scope. Table 3 presents enrolment, engagement, and completion data for each of the seven DLAT microcurricula across the three cohorts.
Engagement rates, calculated as the percentage of enrolled students who attempted final assessments, varied across microcurricula and years. In 2022/23, DLAT2, DLAT3, and DLAT7 showed lower engagement (47.15–48.82%) due to several programs deferring these topics to subsequent semesters, resulting in inflated enrolment figures relative to active participation. This administrative artefact does not reflect student disengagement but rather programmatic scheduling decisions. In subsequent years, engagement rates for these microcurricula normalised, with the overall average increasing from 68.58% (2022/23) to 74.38% (2023/24) and 78.09% (2024/25).
It is important to note that engagement rates are calculated using total enrolled students as the denominator, including those who dropped courses, became inactive, or deferred participation—a conservative approach that yields lower percentages than calculations based solely on active students. This method provides a realistic assessment of actual participation relative to initial registrations. The engagement metric is reliable because, by mastery learning design, students must complete core content and activities to access final assessments; reaching assessment indicates substantive engagement with instructional materials rather than merely superficial access.
Pass rates, calculated as the percentage of students who attempted assessments and successfully completed them, were consistently high across all years and microcurricula, exceeding 95% in nearly all cases. Average pass rates increased from 95.70% (2022/23) to 96.92% (2023/24) and 99.27% (2024/25), with several microcurricula achieving 100% pass rates in later years. These rates substantially exceed typical completion rates for voluntary non-credit online courses and MOOCs, which often range from 5–15% [54,55], and compare favourably even with mandatory credit-bearing online courses in higher education.
While direct comparisons require caution due to differences in context, incentive structures, and completion definitions, the DLAT module’s sustained high completion rates are notable. Similar high rates (≥90%) have been reported for mandatory faculty development programs with strong institutional support [56], suggesting that credit-bearing status, assessment requirements, and embedded support mechanisms—all features of the DLAT design—contribute significantly to completion. The combination of microcurricula modularity, extensive formative assessment with feedback, interactive content, mastery learning support, and constructive alignment likely accounts for these exceptionally strong outcomes.
5.2. Survey Responses: Quantitative Findings
The end-of-module survey yielded 1,743 complete responses across three years, representing a 33% response rate relative to total enrolment. The following subsections present findings organised by the four survey dimensions: Satisfaction, Content Quality, Engagement, and Learning Outcomes.
5.2.1. Satisfaction with Module Design and Delivery
Students consistently reported high satisfaction with the module’s design, clarity of learning outcomes, and alignment between stated objectives and actual instruction (Table 4). In 2022/23, the inaugural year with smaller cohorts and response samples, mean satisfaction across the three items was 3.85 (between “Neutral” and “Agree”). Satisfaction increased in subsequent years to means of 3.94 (2023/24) and 4.08 (2024/25), with the aggregated three-year mean reaching 4.02 (“Agree”).
The progressive improvement in satisfaction scores across years likely reflects iterative refinements to module design based on ongoing evaluation and student feedback. By 2024/25, over 85% of respondents agreed or strongly agreed that learning outcomes were clearly stated (Q1), expectations were clear (Q2), and outcomes aligned with instruction (Q3). These findings suggest that the constructive alignment framework—explicitly linking outcomes, activities, and assessments—was effectively communicated to students and perceived as coherent.
5.2.2. Content Quality, Diversity, and Relevance
Students evaluated content positively across all quality dimensions, including preparation, quality, format diversity, and disciplinary relevance (Table 5). Mean scores increased from 3.74 (2022/23) to 3.99 (2023/24) and 4.03(2024/25), with the aggregated three-year mean of 3.99 indicating consistent agreement that content met quality standards.
Particularly strong agreement emerged for items regarding material preparation (Q4, M=4.09) and quality (Q5, M=4.07), suggesting that the H5P interactive books, multimodal resources, and structured content design met students’ expectations. Format diversity (Q7, M=3.96) was also positively evaluated, reflecting the UDL principle of multiple means of representation through varied content types including text, videos, interactive elements, and expert interviews (“fireside chats”).
Disciplinary relevance (Q8, M=3.87) showed the lowest mean among content items but still reflected agreement. This is notable given the module’s transdisciplinary nature—serving 15+ programs with diverse content emphases. That students across varied disciplines generally found content relevant speaks to the effectiveness of the microcurricula pathway structure (Spreadsheets, R, Python) and the incorporation of domain-agnostic foundational topics alongside tool-specific skills development.
Qualitative feedback corroborated these findings, with students praising “the structure, the mix between text, slides, questions, practical tasks, and quizzes.” However, some students reported challenges navigating multiple course pages—an artefact of the microcurricula modular structure—suggesting an area for interface design improvement. Additionally, in 2022/23, some students found the 80% passing threshold challenging for certain assessments, prompting subsequent adjustments to assessment difficulty calibration and provision of additional formative practice opportunities.
5.2.3. Engagement and Intellectual Stimulation
Student engagement with the module, as measured by perceptions of content presentation effectiveness and intellectual stimulation, showed progressive improvement across years (Table 6). Mean engagement scores increased from 3.11 (2022/23) to 3.70 (2023/24) and 3.82 (2024/25), with the aggregated mean of 3.75 indicating agreement that the module engaged attention and provided intellectual challenge.
The lower engagement scores in 2022/23, particularly for intellectual stimulation (Q10, M=3.00, “Neutral”), likely reflect multiple factors: the module’s novelty for both students and instructors, minor technical issues during initial deployment (particularly first semester), and students’ unfamiliarity with fully asynchronous online learning formats. The substantial improvement in subsequent years (Q6: +0.68 points; Q10: +0.75 points from 2022/23 to 2024/25) aligns with the introduction of enhanced interactive H5P activities, refined formative assessment integration, and increased peer collaboration opportunities through discussion forums and peer-learning activities.
Qualitative responses provided additional context. While many students praised interactive elements and engagement features, a recurring challenge was the absence of face-to-face instruction—a preference expressed by students accustomed to synchronous, lecture-based formats. Time management emerged as the most frequently reported challenge, particularly for students new to asynchronous learning who struggled with self-pacing and deadlines. Students noted difficulties including “too much new information”, “lack of face-to-face interaction,” and “text-heavy content” in some sections. However, almost all students indicated experiencing no major difficulties completing the module, suggesting these concerns represented minority perspectives rather than systemic barriers.
5.2.4. Learning Outcomes and Knowledge Gains
Students consistently reported strong perceived learning outcomes, including knowledge transferability to their disciplines and increased data literacy competencies (Table 7). Mean scores were 3.64 (2022/23), 4.01 (2023/24), and 4.06 (2024/25), with an aggregated mean of 4.03 indicating agreement that the module enhanced their knowledge and skills.
Students particularly strongly endorsed knowledge increase (Q11, M=4.10), with over 80% agreeing or strongly agreeing across all years. Transferability to disciplinary contexts (Q9, M=3.95) also received strong endorsement, though slightly lower—likely reflecting variability in how directly different programs apply data literacy skills. These self-reported learning gains align with the objective pass rates (>95%) discussed in Section 5.1, suggesting convergence between perceived and demonstrated competency achievement.
Qualitative responses reinforced these findings. Students frequently cited practical skills—particularly spreadsheet functions, data visualisation, and programming basics—as valuable learning outcomes with clear applicability: “The EXCEL functions were pretty useful”, “Learning the broad variety of uses Python has”, “It was very informative while providing supportive services for us as first years.” The integration of formative assessments with immediate feedback was repeatedly highlighted as supporting learning: “I enjoyed the formative assessments as they gave you an indication of your level of knowledge.”
However, students reported cognitive load challenges: “The amount of new terminology took some time to process” and “There was too much to do.” These comments suggest that for some learners, particularly those with limited prior technical experience, the breadth of content represented a significant challenge despite scaffolding and support mechanisms in place via weekly synchronous drop-in sessions. This points to a tension inherent in comprehensive data literacy education: balancing thorough coverage with manageable cognitive demands for diverse learners.
5.3. Longitudinal Trends Across Three Years
Aggregating data across all survey dimensions reveals consistent positive trends over the three-year implementation. Satisfaction scores increased modestly from 3.85 to 4.08 (+0.23 points), reflecting iterative design improvements and clarification of learning expectations. Content quality ratings improved from 3.66 to 3.99 (+0.33 points), suggesting refinements to materials, enhanced multimodal integration, and improved disciplinary relevance through pathway development.
Engagement demonstrated the most substantial improvement, increasing from 3.11 to 3.82 (+0.71 points)—a notable shift from neutral to agreement. This improvement aligns temporally with the expansion of interactive H5P content types, introduction of additional collaborative peer-learning activities, and inclusion of several formative assessments co-created with students. The engagement gains suggest that deliberate application of the PICRAT framework to enhance interactivity and creativity in technology use translated into measurably improved student perceptions.
Learning outcome perceptions remained consistently high throughout (), indicating sustained effectiveness of the pedagogical approach regardless of iterative refinements. The stability of learning outcome scores, combined with increasing satisfaction, content, and engagement ratings, suggests that the foundational design—grounded in UDL, constructive alignment, and active learning—was sound from inception, with improvements addressing experience quality rather than fundamental effectiveness.
Collectively, these longitudinal patterns demonstrate that ongoing refinements guided by the integrated framework and informed by continuous evaluation contributed to improved learner experiences while maintaining consistent learning outcomes. The positive trajectory across all dimensions provides evidence that the systematic approach to integrating pedagogy, technology, and content produced a sustainable, improvable design rather than a static implementation.
5.4. Qualitative Insights from Open-Ended Responses
Analysis of open-ended responses (excluding short non-informative entries such as “No,” “None”) revealed predominantly positive sentiment (approximately 82% positive polarity), with neutral comments accounting for most remaining responses and negative comments representing a small minority.
5.4.1. Valued Features and Effective Design Elements
Students consistently praised several features aligned with the integrated framework’s design principles:
Interactivity and Immediate Feedback: The extensive formative assessment questions (350+ distributed in seven DLATs) with immediate, detailed feedback were frequently cited as particularly valuable: “I enjoyed the formative assessments as they gave you an indication of your level of knowledge”, “The immediate feedback helped me understand where I went wrong.” This aligns with the framework’s emphasis on Interactive-Amplification (PICRAT), where technology enables rapid feedback loops impossible at scale without automation.
Multimodal Content and Accessibility: Students appreciated the variety of content formats—interactive books, videos, expert interviews, quizzes, etc. —reflecting successful implementation of UDL’s multiple means of representation: “The mix between text, slides, practical tasks, and quizzes”, “Different styles such as videos and fireside chats made topics more engaging.” The ability to access content flexibly across devices and revisit materials supported diverse learning preferences and schedules.
Tool Choice and Practical Application: Students valued the ability to select tool pathways (Spreadsheets, R, Python) aligned with their program requirements and interests, exemplifying UDL’s multiple means of engagement: “Being able to choose Python was great for my major”, “Excel skills will be directly useful in my career.” The emphasis on practical, applicable skills resonated strongly: “Learning the broad variety of uses Python has”, “The EXCEL functions were pretty useful in the lab.”
Self-Paced Asynchronous Structure: Many students appreciated the flexibility of asynchronous access and self-pacing, particularly beneficial for managing diverse schedules: “I could work through content when it suited my timetable”, “The ability to go at my own pace helped me really understand concepts”. However, this same flexibility posed challenges for some students (discussed below), illustrating the double-edged nature of learner autonomy.
5.4.2. Challenges and Suggested Improvements
Students identified several challenges, providing valuable insights for ongoing refinement:
Time Management and Self-Regulation: The most frequently mentioned challenge was managing time effectively in an asynchronous format, particularly for students new to fully online learning: “Time management was difficult without set lecture times”, “I left things too late because there weren’t weekly deadlines.” This suggests that while asynchronous flexibility benefits many learners, some require additional scaffolding for self-regulation—an area for potential enhancement through progress reminders or optional milestone structures.
Cognitive Load and Content Volume: Some students found the breadth and depth of content overwhelming, particularly when tackling multiple microcurricula simultaneously: “Too much new terminology took time to process”, “There was too much to do.” These comments highlight a tension between comprehensive coverage and manageable cognitive demands, suggesting potential value in clearer guidance about content prioritisation or staged engagement strategies.
Absence of Face-to-Face Interaction: A recurring request was for synchronous lecture components or optional face-to-face sessions, reflecting some students’ preference for traditional instructional formats: “I missed having lectures to ask questions in real-time”, “Face-to-face would help with difficult concepts.” While the module’s fully asynchronous design serves scaling and accessibility needs, incorporating optional synchronous support sessions (office hours, drop-in clinics) were added to address this concern without compromising the asynchronous core.
Navigation and Module Structure: Some students found navigating across multiple microcurricula course pages challenging: “It was confusing having so many separate pages”, “Navigation between topics could be clearer.” This feedback points to potential improvements in interface design, course organisation, or provision of clearer navigation aids—addressing usability without altering pedagogical fundamentals.
Requests for Domain-Specific Examples: Students across disciplines requested more examples directly tied to their specific fields: “More business-related data examples would help”, “Case studies from health sciences would make it more relevant”. While the transdisciplinary nature necessitates balance, strategic incorporation of pathway-specific case studies or optional discipline-aligned examples were already included but additional example might enhance perceived relevance without fragmenting core content.
5.4.3. Synthesis of Qualitative Findings
The convergence between positive sentiment and constructive feedback demonstrates students’ reflective engagement with the module and perceived relevance to their learning goals. The features students valued most—interactivity, feedback, multimodality, flexibility, practical application—directly map onto the integrated framework’s design principles (PICRAT Interactive/Creative uses, UDL multiple means, constructive alignment of authentic tasks). Conversely, challenges identified—time management, cognitive load, desire for synchronous interaction, navigation complexity—reveal areas where additional scaffolding, clearer guidance, or optional supplementary support might enhance the experience for learners who struggle with fully asynchronous, self-directed formats.
Importantly, the qualitative data contextualise the quantitative findings: high pass rates and positive survey responses do not imply universal ease or absence of struggle. Rather, they suggest that the design successfully supports diverse learners in achieving outcomes despite varied challenges. The minority of students who found content overwhelming or missed face-to-face interaction still generally completed successfully, indicating that the extensive formative support, interactive elements, and flexible pacing provided sufficient scaffolding even when the learning experience felt demanding.
The qualitative insights also validate the framework’s theoretical foundations. Students’ explicit appreciation for features aligned with UDL principles (choice, multimodality, flexibility), active learning strategies (practical application, problem-solving), and technology integration (interactivity, immediate feedback, creative production) provides direct evidence that these pedagogical approaches were not merely implemented but meaningfully experienced and valued by learners. The alignment between design intentions and student perceptions suggests fidelity of implementation and validates the framework’s applicability to large-scale online education contexts.
5.5. Summary of Results
The results from three years of implementation demonstrate that the integrated design framework successfully supported interactive and inclusive online learning at substantial scale. Learning analytics revealed high engagement rates (69–78% of enrolled students attempting assessments) and exceptional pass rates (95–99%), substantially exceeding typical online course completion rates. Quantitative survey data showed consistently positive student perceptions across all dimensions—satisfaction (M=4.02), content quality (M=3.96), engagement (M=3.75), and learning outcomes (M=4.03)—with notable improvements over time, particularly in engagement (+0.71 points). Qualitative feedback corroborated these findings, with students praising interactive features, multimodal content, practical applicability, and flexibility while identifying time management, cognitive load, and preference for synchronous interaction as challenges for some learners.
The longitudinal trends demonstrate not only initial effectiveness but also sustained improvement through iterative refinement guided by ongoing evaluation and the integrated framework’s principles. The convergence of objective completion data, self-reported perceptions, and qualitative insights provides robust triangulated evidence that the systematic integration of pedagogy, technology, and content design produced measurable benefits for diverse student populations in an online asynchronous environment.
6. Discussion
This study investigated whether the constructive alignment of technology, pedagogy, and content through a microcurricula approach could deliver an interactive and inclusive online asynchronous module at scale, thereby improving learning experiences and outcomes for diverse student populations. The findings across three years provide strong affirmative evidence: high completion rates (95–99%), positive student perceptions across all dimensions (M=3.75–4.10), and longitudinal improvement trends validate the integrated framework’s effectiveness.
6.1. Interpreting Framework Effectiveness Through PICRAT
The observed improvements can be interpreted through the PICRAT framework, which positions technology use along Passive, Interactive, Creative and Replacement, Amplification,Transformation axes. The module’s deliberate design to interactive and transformative practices corresponds directly with engagement improvements from M=3.11 to M=3.82. Activities implemented using H5P amplified learning through immediate, customized feedback at scale—impossible manually for thousands of students. The formative assessments transformed students’ roles from passive recipients to active collaborators, fostering ownership and deeper engagement as evidenced by qualitative feedback.
The microcurricula-as-a-service architecture operationalized UDL principles by enabling flexibility (multiple pathways, self-pacing) while maintaining coherence through constructive alignment. The sustained high pass rates across diverse programs demonstrate that flexibility did not compromise rigour. TPACK-guided technology selection ensured tools supported pedagogical strategies rather than driving them, while systematic PICRAT evaluation guided designs toward Interactive-Amplification and Creative-Transformation quadrants.
6.2. Implications for Practice
This longitudinal, large-scale, transdisciplinary implementation offers several actionable insights for educators and institutions:
- Framework over tools: Pedagogically-informed design processes (UDL, TPACK, PICRAT) proved more critical than specific technologies. Effectiveness emerged from systematic integration, not tool features alone.
- Modular architecture enables flexibility: The MaaS approach demonstrates that granular, self-contained units can support diverse contexts (embedded in programs, stand-alone modules, varied credit sizes) while maintaining quality and alignment.
- Invest in formative assessment: Extensive formative resources with immediate feedback, including student co-creation models, yielded substantial returns in engagement and learning outcomes.
- Design for iteration: Treating implementation as iterative rather than fixed enabled targeted refinements (e.g., enhanced interactivity, indicative timelines for time management) that improved experiences while maintaining pedagogical foundations. Further, MaaS enables fast redesign and deployment requiring only a change in one microcurricula with out affecting others.
- Pathway approach for transdisciplinary skills: Shared outcomes with tool-specific implementations balanced consistency and customization, offering a scalable model for institution-wide skill development.
6.3. Limitations and Threats to Validity
Several limitations warrant consideration: The 33% survey response rate introduces potential self-selection bias, though learning analytics from all students partially mitigate this. Implementation at a single institution with specific resources and support structures limits generalizability—transferability to different contexts requires further investigation. Student perceptions and completion rates, while important, do not directly measure deep learning or long-term transfer; future research incorporating performance analytics and longitudinal follow-up would strengthen understanding of learning depth. The case study design precludes definitive causal claims—while design features align coherently with outcomes, multiple factors influence results. The exceptionally high pass rates may partly reflect flexible summative assessment giving opportunities for students to practice before test and an opportunity to revise and re-take the assessment, credit-bearing mandatory status, and assessment design features, limiting comparisons with voluntary courses. Finally, implementation fidelity when adopted by others with less expertise or institutional support remains uncertain, though detailed documentation (Section 3 and Section 4) aims to support replication.
Despite these limitations, the study’s scale, duration, mixed methods, triangulation, and transdisciplinary scope provide substantial evidence supporting the framework’s effectiveness in the studied context and offer a foundation for continued investigation across diverse settings, deeper learning analytics, and systematic variations of design features to refine understanding of which elements most influence outcomes.
7. Conclusions
This study demonstrates that systematic integration of pedagogical theory, technology frameworks, and modular curriculum design achieves interactive and inclusive online education at scale. The integrated framework—synthesizing UDL, active learning, constructive alignment, TPACK, and PICRAT within a microcurricula-as-a-service architecture—addresses a critical gap in educational technology research by moving beyond fragmented, tool-centric approaches toward theoretically-grounded, systematically-designed implementations.
Evidence from three years validates the framework’s effectiveness: completion rates of 95–99%, positive student perceptions (M=3.75–4.10), and longitudinal improvements demonstrate sustained success. The microcurricula-as-a-service architecture emerges as a key innovation, operationalizing flexibility and personalisation at scale while maintaining coherence through constructive alignment. This modular approach, combined with extensive formative assessment and deliberate progression toward Interactive-Transformation technology uses, transformed student experiences from passive consumption to active collaboration.
For practitioners, this work offers a replicable model grounded in widely-available technologies and established principles, with explicit guidance beyond tool recommendations. For researchers, it contributes longitudinal, large-scale evidence demonstrating how theoretical frameworks guide practical design and evaluation. As higher education increasingly relies on online delivery for diverse populations, this study provides both evidence and methodology for systematic integration of theory and practice at scale.
Funding
This research received no external funding, however benefited from an internal funding
Institutional Review Board Statement
“The study was conducted in accordance with the Declaration of Helsinki, and approved by the Institutional Review Board (or Ethics Committee) of Dublin City University (protocol code DCUREC/2024/181, 13/11/2024 and DCUREC/2025/007 27/1/2025).” for studies involving student respondents.
Informed Consent Statement
Informed consent was obtained from all subjects involved in the study.
Data Availability Statement
The raw data collected from the survey is not available publicly to comply with the ethical guideline that restrict us from sharing raw data.
References
- Levey, S. Universal Design for Learning. Journal of Education 2023, 203, 479–487 Publisher: SAGE Publications Inc. [Google Scholar] [CrossRef]
- Varkey, T.C.; Varkey, J.A.; Ding, J.B.; Varkey, P.K.; Zeitler, C.; Nguyen, A.M.; Merhavy, Z.I.; Thomas, C.R. Asynchronous learning: a general review of best practices for the 21st century. Journal of Research in Innovative Teaching & Learning 2022, 16, 4–16. [Google Scholar] [CrossRef]
- CAST. Universal Design for Learning Guidelines version 2.2. Available online: https://udlguidelines.cast.org/ (accessed on 2025-9-30).
- Dean, T.; Lee-Post, A.; Hapke, H. Universal Design for Learning in Teaching Large Lecture Classes. Journal of Marketing Education 2017, 39, 5–16. [Google Scholar] [CrossRef]
- Emmers, E.; Schrooten, M.; Pulinx, R. Using UDL to redesign education in response to diversity. The Ahead journal, Type: Discussion. 2022. [Google Scholar]
- Vuorikari, R.; Kluzer, S.; Punie, Y. DigComp 2.2: The Digital Competence Framework for Citizens - With new examples of knowledge, skills and attitudes, 2022. 1: ISBN: 9789276488828 9789276488835 ISSN, 9789. [Google Scholar] [CrossRef]
- Buckland, P.H. Learning Starts with Design: Using Universal Design for Learning (UDL) in Higher Education Course Redesign. In Transforming Learning Environments: Strategies to Shape the Next Generation; S. Miller, F., Ed.; Emerald Group Publishing Limited, 2012; Vol. 16, Advances in Educational Administration, pp. 109–136. [CrossRef]
- Christersson, C.; Staaf, P.; Braekhus, S.; Stjernqvist, R.; Pusineri, A.G.; Giovani, C.; Sancassani, S.; Corti, P.; Lebigot, G.; Biri, V.; et al. Promoting active learning in universities 2019. Publisher: European University Association.
- Eison, J. Using Active Learning Instructional Strategies to Create Excitement and Enhance Learning. 2010.
- Guo, P.; Saab, N.; Post, L.S.; Admiraal, W. A review of project-based learning in higher education: Student outcomes and measures. International Journal of Educational Research 2020, 102, 101586. [Google Scholar] [CrossRef]
- Lee, V.S. What is inquiry-guided learning? New Directions for Teaching and Learning 2012, 2012, 5–14. [Google Scholar] [CrossRef]
- Spronken-Smith, R.; Walker, R. Can inquiry-based learning strengthen the links between teaching and disciplinary research? Studies in higher education 2010, 35, 723–740. [Google Scholar] [CrossRef]
- Haleem, A.; Javaid, M.; Qadri, M.A.; Suman, R. Understanding the role of digital technologies in education: A review. Sustainable Operations and Computers 2022, 3, 275–285. [Google Scholar] [CrossRef]
- Kang, B. How the COVID-19 pandemic is reshaping the education service. The Future of Service Post-COVID-19 Pandemic, Volume 1: Rapid Adoption of Digital Service Technology, 2021 S: 15–36. Publisher Springer Singapore.
- Mahmud, M.M.; Wong, S.F.; Ismail, O. Emerging Learning Environments and Technologies Post Covid-19 Pandemic: What’s Next? In Proceedings of the Advances in Information, Communication and Cybersecurity; Maleh, Y.; Alazab, M.; Gherabi, N.; Tawalbeh, L.; Abd El-Latif, A.A., Eds., Cham; 2022; pp. 308–319. [Google Scholar]
- Kimmons, R.; Graham, C.R.; West, R. The PICRAT Model for Technology Integration in Teacher Preparation. Contemporary Issues in Technology and Teacher Education 2020, 20. [Google Scholar]
- Abgaz, Y.; Dunne, C. Designing Microcurricula-as-a-service: The case of large class, cross programme, and online asynchronous module. In Proceedings of the Pedagogy for Higher Education Large Classes (PHELC23). Zenodo; 2023. [Google Scholar] [CrossRef]
- Mishra, P.; Koehler, M.J. Technological Pedagogical Content Knowledge: A Framework for Teacher Knowledge. Teachers College Record 2006, 108, 1017–1054. [Google Scholar] [CrossRef]
- Magro, J. H5P. Journal of the Medical Library Association 2021, 109, 351–354. [Google Scholar] [CrossRef]
- Carlile, O.; Jordan, A. It Works in Practice but Will It Work in Theory? The Theoretical Underpinnings of Pedagogy. 2005.
- Dewey, J. My Pedagogic Creed. Journal of Education 1926, 104, 542–542. [Google Scholar] [CrossRef]
- Dewey, J.; Montessori, M.; Strzemiński, W.; Piaget, J.; Vygotsky, L.; von Foerster, H.; Bruner, J.; Simon, H.; Watzlawick, P.; von Glasersfeld, E.; et al. Constructivism (learning theory). Journal of Social Sciences, Literature and Languages, 1997; 9–16. [Google Scholar]
- Dewey, J. Experience and Education; Kappa Delta Pi: West Lafayette, Ind, 1938. [Google Scholar]
- Vygotsky, L.S. Mind in Society; Harvard University Press, 1978. [CrossRef]
- Ryan, M.F. Compendium of Active Learning Strategies for Student Engagement. Strategies for Student Engagement. 2022. Publisher: Technological University of the Shannon Midlands Midwest.
- Trullàs, J.C.; Blay, C.; Sarri, E.; Pujol, R. Effectiveness of problem-based learning methodology in undergraduate medical education: a scoping review. BMC Medical Education 2022, 22, 104. [Google Scholar] [CrossRef]
- Schneider, M.; Preckel, F. Variables associated with achievement in higher education: A systematic review of meta-analyses. Psychological Bulletin 2017, 143, 565–600. [Google Scholar] [CrossRef]
- Bloom, B.S. Learning for Mastery. Instruction and Curriculum. Regional Education Laboratory for the Carolinas and Virginia, Topical Papers and Reprints, Number 1. 1968, 1. Publisher: Regional Education Laboratory for the Carolinas and Virginia, Mutual Plaza (Chapel Hill and Duke Sts.), Durham, N.C. 27701.
- Krathwohl, D.R. A revision of Bloom’s taxonomy: An overview. Theory into practice 2002, 41, 212–218. [Google Scholar] [CrossRef]
- Guskey, T. Closing Achievement Gaps: Revisiting Benjamin S. Bloom’s “Learning for Mastery”. Journal of Advanced Academics 2007, 19, 8–31. [Google Scholar] [CrossRef]
- Rose, D.; Meyer, A.; Gordon, D. Universal Design for Learning: Theory and practice.; 2013.
- Biggs, J.; Tang, C. Teaching For Quality Learning At University; SRHE and Open University Press Imprint, McGraw-Hill Education, 2011.
- Biggs, J. Aligning Teaching for Constructing Learning. Higher Education Academy 2003, 1, 1–4. [Google Scholar]
- Shulman, L. Knowledge and teaching: Foundations of the new reform. Harvard educational review 1987, 57, 1–23. [Google Scholar] [CrossRef]
- Shulman, L.S. Those who understand: Knowledge growth in teaching. Educational researcher 1986, 15, 4–14. [Google Scholar] [CrossRef]
- Koehler, M.J.; Mishra, P. (Eds.) Handbook of Technological Pedagogical Content Knowledge (TPACK) for Educators, 2 ed.; Routledge: New York, 2016. [Google Scholar] [CrossRef]
- Koehler, M.J.; Mishra, P.; Cain, W. What is Technological Pedagogical Content Knowledge (TPACK)? Journal of Education 2013, 193, 13–19. [Google Scholar] [CrossRef]
- Tseng, J.J.; Chai, C.; Tan, L.; Park, M. A critical review of research on technological pedagogical and content knowledge (TPACK) in language teaching. Computer Assisted Language Learning 2020, 35. [Google Scholar] [CrossRef]
- Warr, M.; Mishra, P. TPACK: The TPACK Technology Integration Framework. EdTechnica: The Open Encyclopedia of Educational Technology, 2022; 261–267. [Google Scholar] [CrossRef]
- Gamage, S.H.P.W.; Ayres, J.R.; Behrend, M.B. A systematic review on trends in using Moodle for teaching and learning. International Journal of STEM Education 2022, 9, 9. [Google Scholar] [CrossRef]
- Yang, H.; Romero-Hall, E. A Pilot Study Exploring Interaction and Student Satisfaction in Asynchronous Courses in Higher Education. TechTrends 2024, 68, 761–770. [Google Scholar] [CrossRef]
- Md Osman, S.Z. Combining Synchronous and Asynchronous Learning: Student Satisfaction with Online Learning using Learning Management Systems. Journal of Education and e-Learning Research 2022, 9, 147–154. [Google Scholar] [CrossRef]
- Abgaz, Y.; McCarren, A.; Elger, P.; Solan, D.; Lapuz, N.; Bivol, M.; Jackson, G.; Yilmaz, M.; Buckley, J.; Clarke, P. Decomposition of Monolith Applications Into Microservices Architectures: A Systematic Review. IEEE Transactions on Software Engineering 2023, 49, 4213–4242. [Google Scholar] [CrossRef]
- Gormley, C.; Lowney, R.; Stone, S. Adaptable ABC: Learning design for all 2022. Publisher: University of Cape Town. [CrossRef]
- Ó Súilleabháin, G.; Lanclos, D.; Farrelly, T.; Ó Súilleabháin, G.; Lanclos, D.M.; Farrelly, T. How to use digital learning with confidence and creativity : a practical introduction / edited by Gearóid Ó Súilleabháin, Donna Lanclos, Tom Farrelly.; Edward Elgar: Cheltenham, UK, 2024 - 2024. [Google Scholar]
- Biesta, G. Pragmatism and the Philosophical Foundations of Mixed Methods Research1. In SAGE Handbook of Mixed Methods in Social & Behavioral Research; Tashakkori, A.; Teddlie, C., Eds.; SAGE Publications, Inc., 2010; pp. 95–118. [CrossRef]
- King, R. The Utility of Pragmatism in Educational Research. Creative Education 2022, 13, 3153–3161. Number:10 Publisher: Scientific Research Publishing. [Google Scholar] [CrossRef]
- Nahar, N.; Cross, D. Students as partners in e-contents creation: A case study exploring student-staff partnership for learning and student engagement using digital applications for co-creation of e-learning materials. International Journal for Students as Partners 2020, 4, 109–119. [Google Scholar] [CrossRef]
- Nic Fhlannchadha, S. The results of the StudentSurvey.ie Trends Over Time Research 2016-2021. Journal of Teaching and Learning in Higher Education 2022, 14. [Google Scholar]
- European Parliament.; Council of the European Union. Regulation (EU) 2016/679 of the European Parliament and of the Council. Available online: https://data.europa.eu/eli/reg/2016/679/oj.
- Quality and Qualifications Ireland. Quality in Irish Higher Education 2024. Available online: https://www.qqi.ie/sites/default/files/2025-09/annual-report-2024.pdf (accessed on 2025-10-01).
- Braun, V.; Clarke, V. Using thematic analysis in psychology. Qualitative Research in Psychology 2006, 3, 77–101. [Google Scholar] [CrossRef]
- Naeem, M.; Ozuem, W.; Howell, K.; Ranfagni, S. A Step-by-Step Process of Thematic Analysis to Develop a Conceptual Model in Qualitative Research. International Journal of Qualitative Methods 2023, 22, 16094069231205789. [Google Scholar] [CrossRef]
- Jordan, K. Massive open online course completion rates revisited: Assessment, length and attrition. International Review of Research in Open and Distributed Learning 2015, 16, 341–358. [Google Scholar] [CrossRef]
- Celik, B.; Cagiltay, K. Uncovering MOOC Completion: A Comparative Study of Completion Rates from Different Perspectives. Open Praxis 2024. [Google Scholar] [CrossRef]
- Clay, A.S.; Andolsek, K.M.; Niederhoffer, K.; Kandakatla, A.; Zhang, G.; Price, M.; Alagesan, P.; Jeffs, S.; DeLaura, I.; Nicholson, C.P.; et al. Creation of an asynchronous faculty development curriculum on well-written narrative assessments that avoid bias. BMC Medical Education 2023, 23, 244. [Google Scholar] [CrossRef]
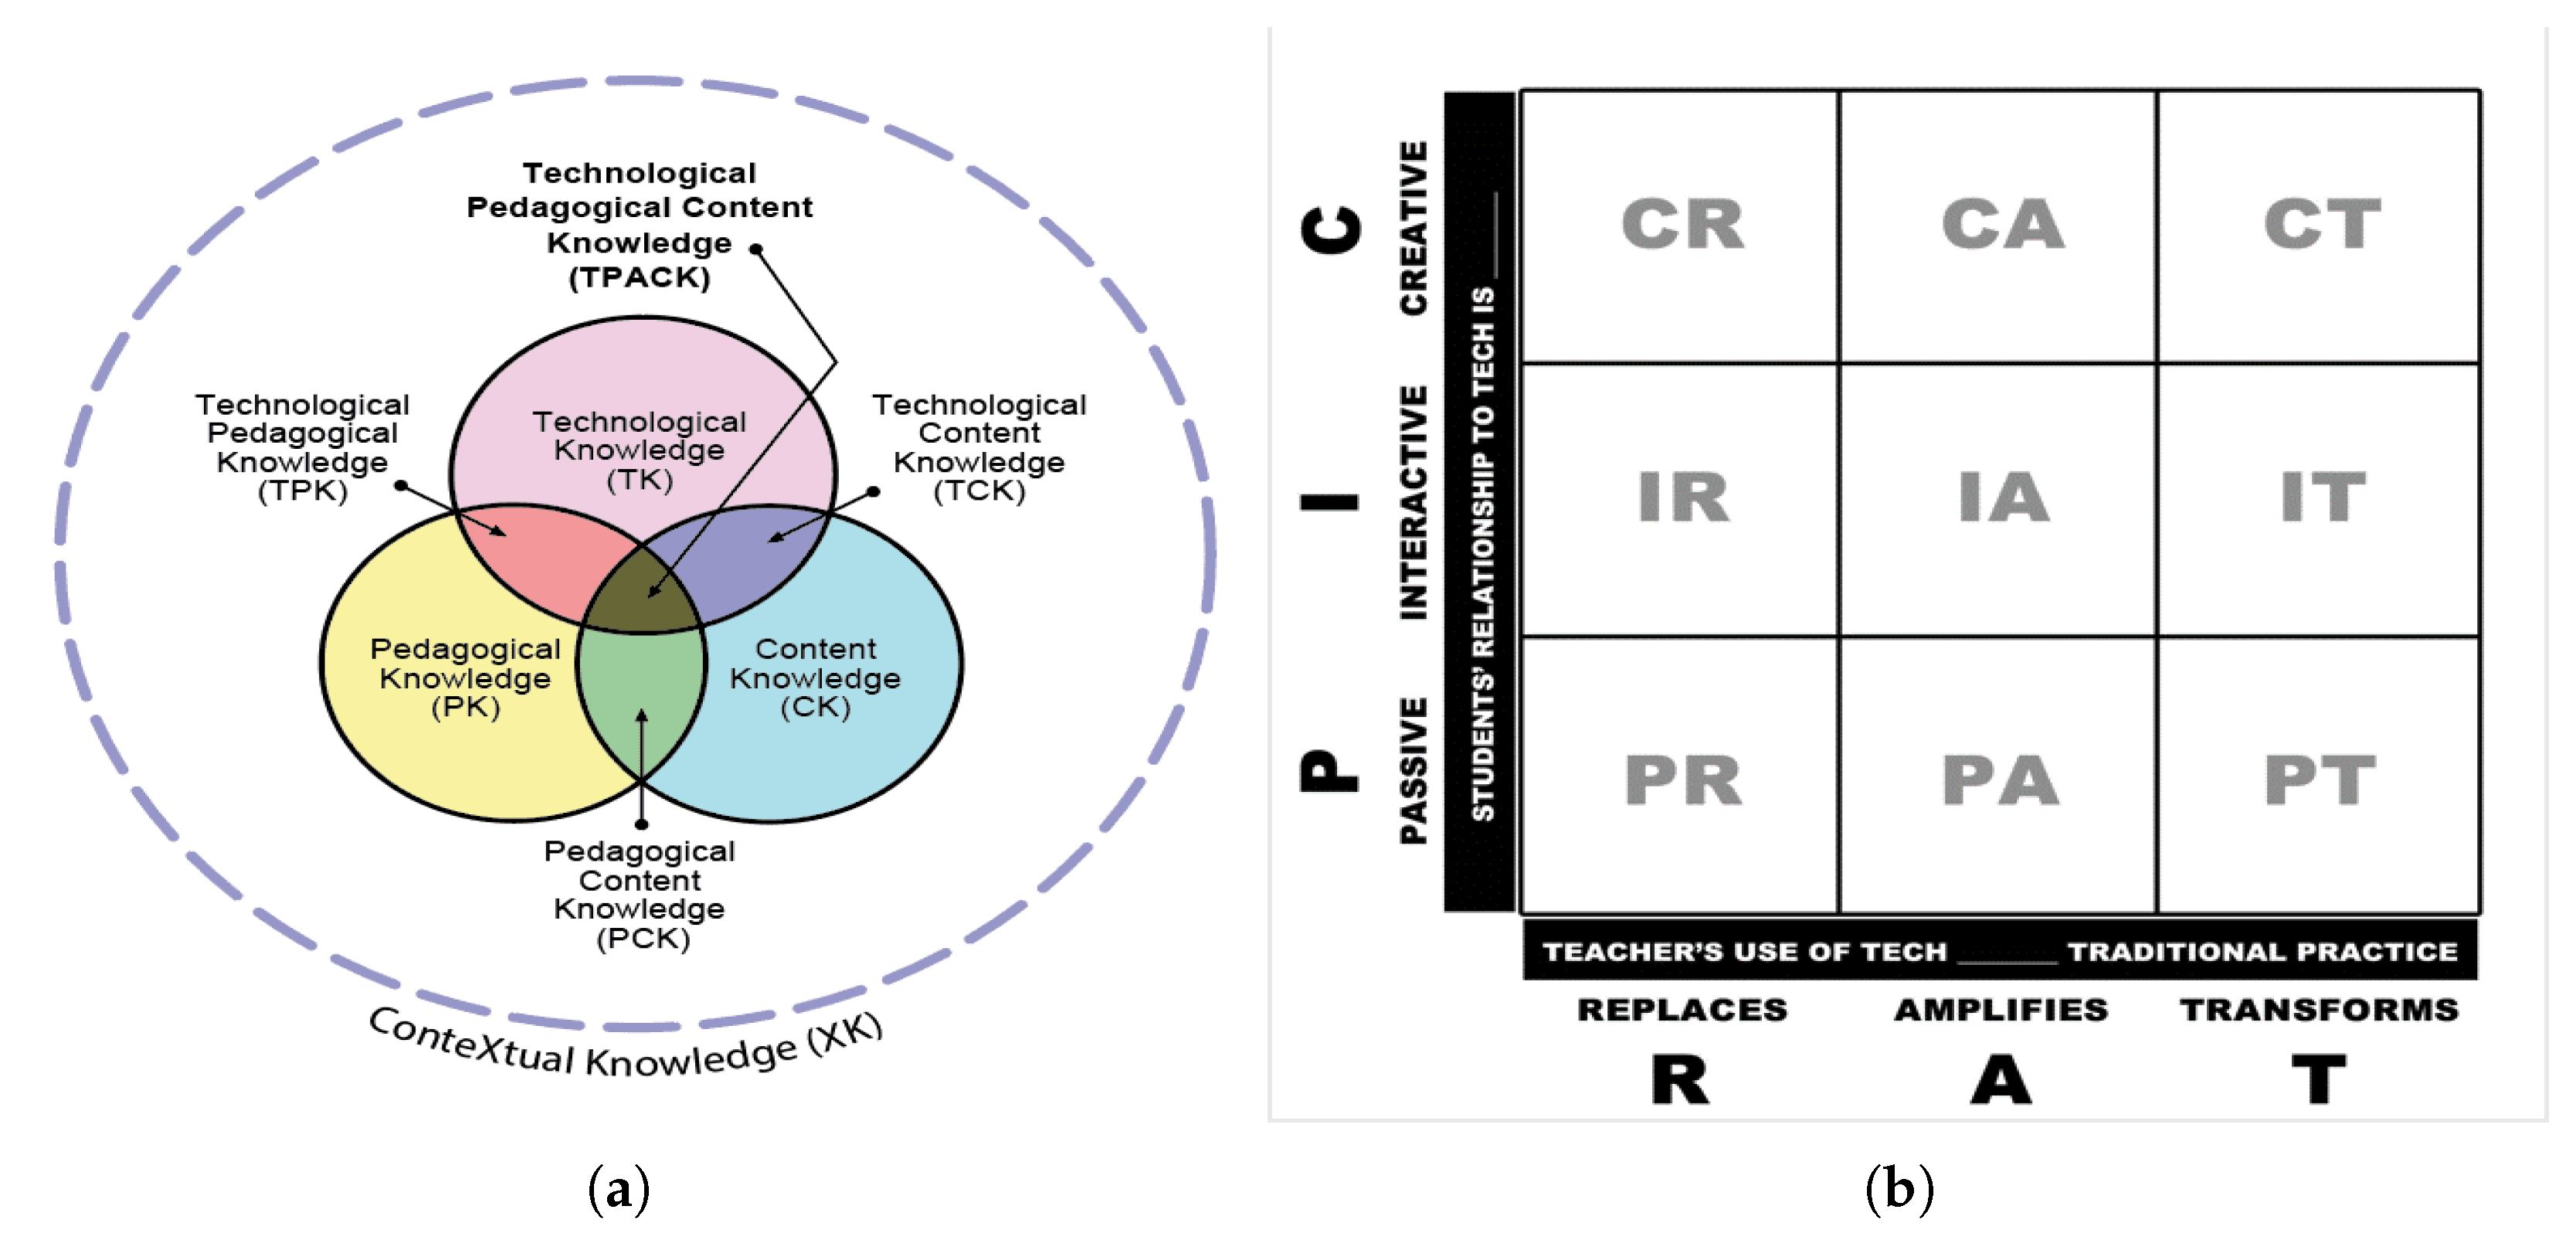
Figure 2.
The integrated design framework representing the core components, transitions and steps for transformative design.
Figure 2.
The integrated design framework representing the core components, transitions and steps for transformative design.
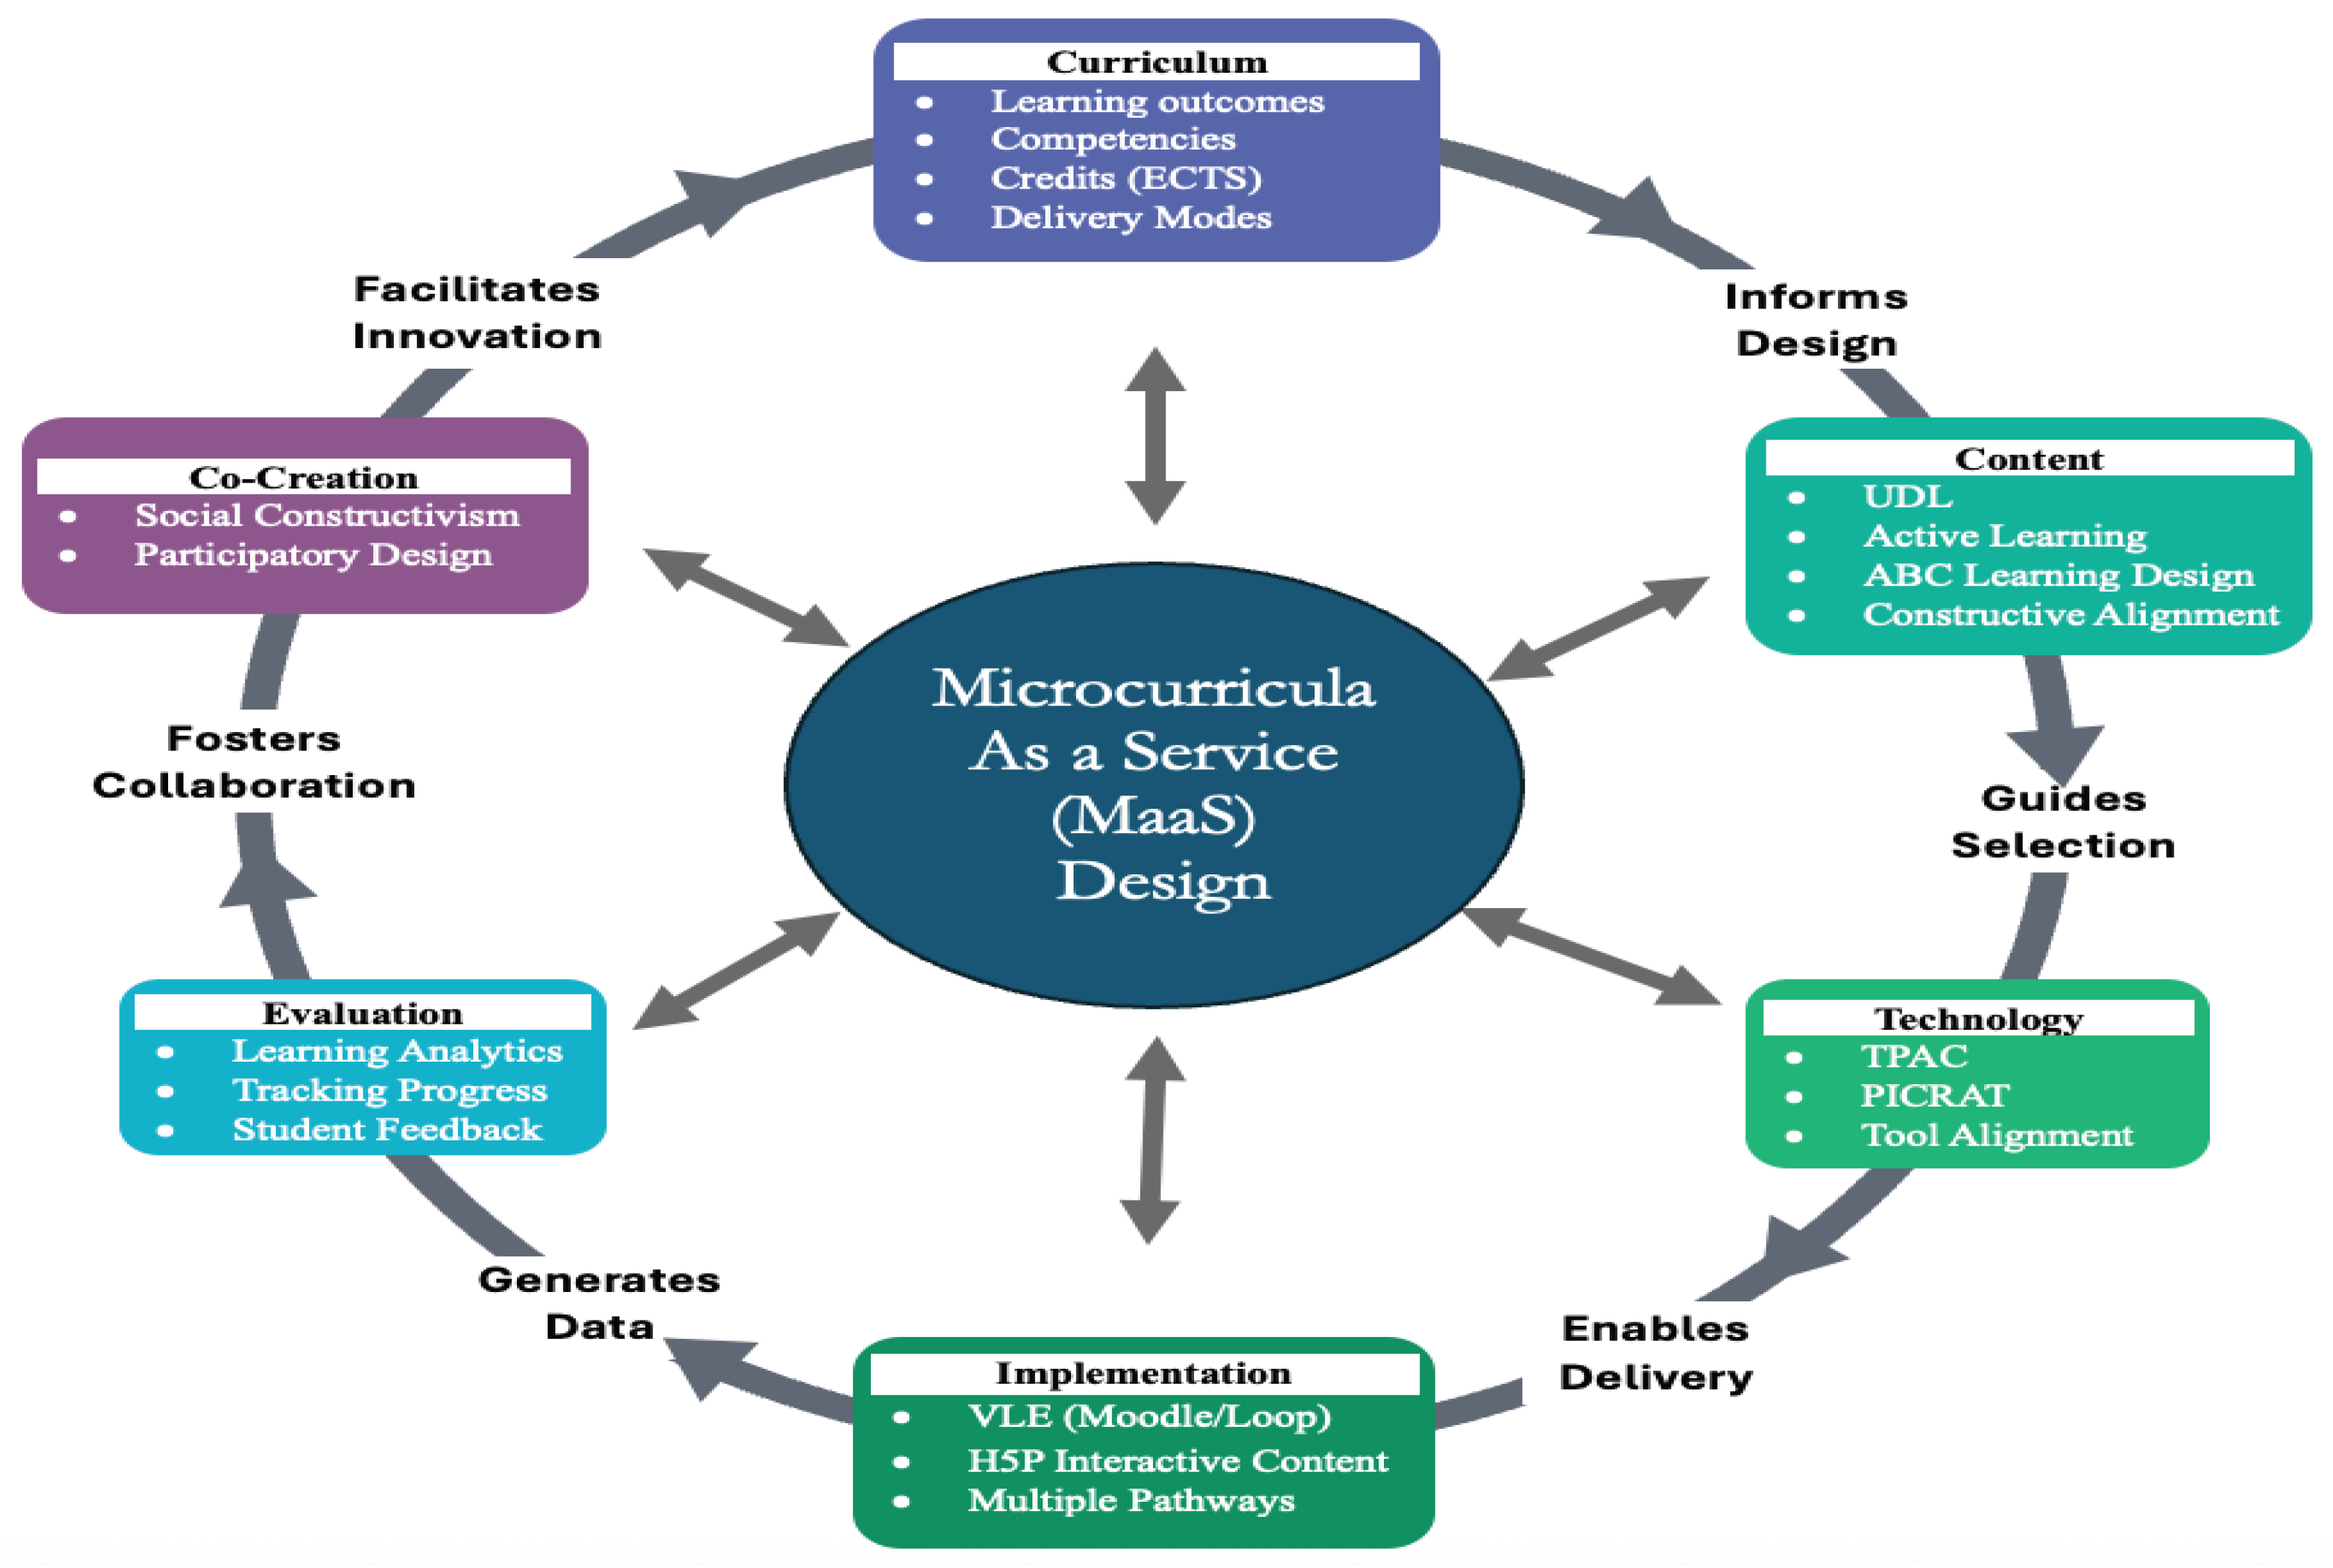
Figure 3.
Microcurriclula implementation of Data Literacy and Analytics: (a) Structure of a microcurriculum as self-contained unit that provides the blueprint. (b) 14 microcurricula topics that can be delivered independently or composed together to make a bigger credit module.
Figure 3.
Microcurriclula implementation of Data Literacy and Analytics: (a) Structure of a microcurriculum as self-contained unit that provides the blueprint. (b) 14 microcurricula topics that can be delivered independently or composed together to make a bigger credit module.
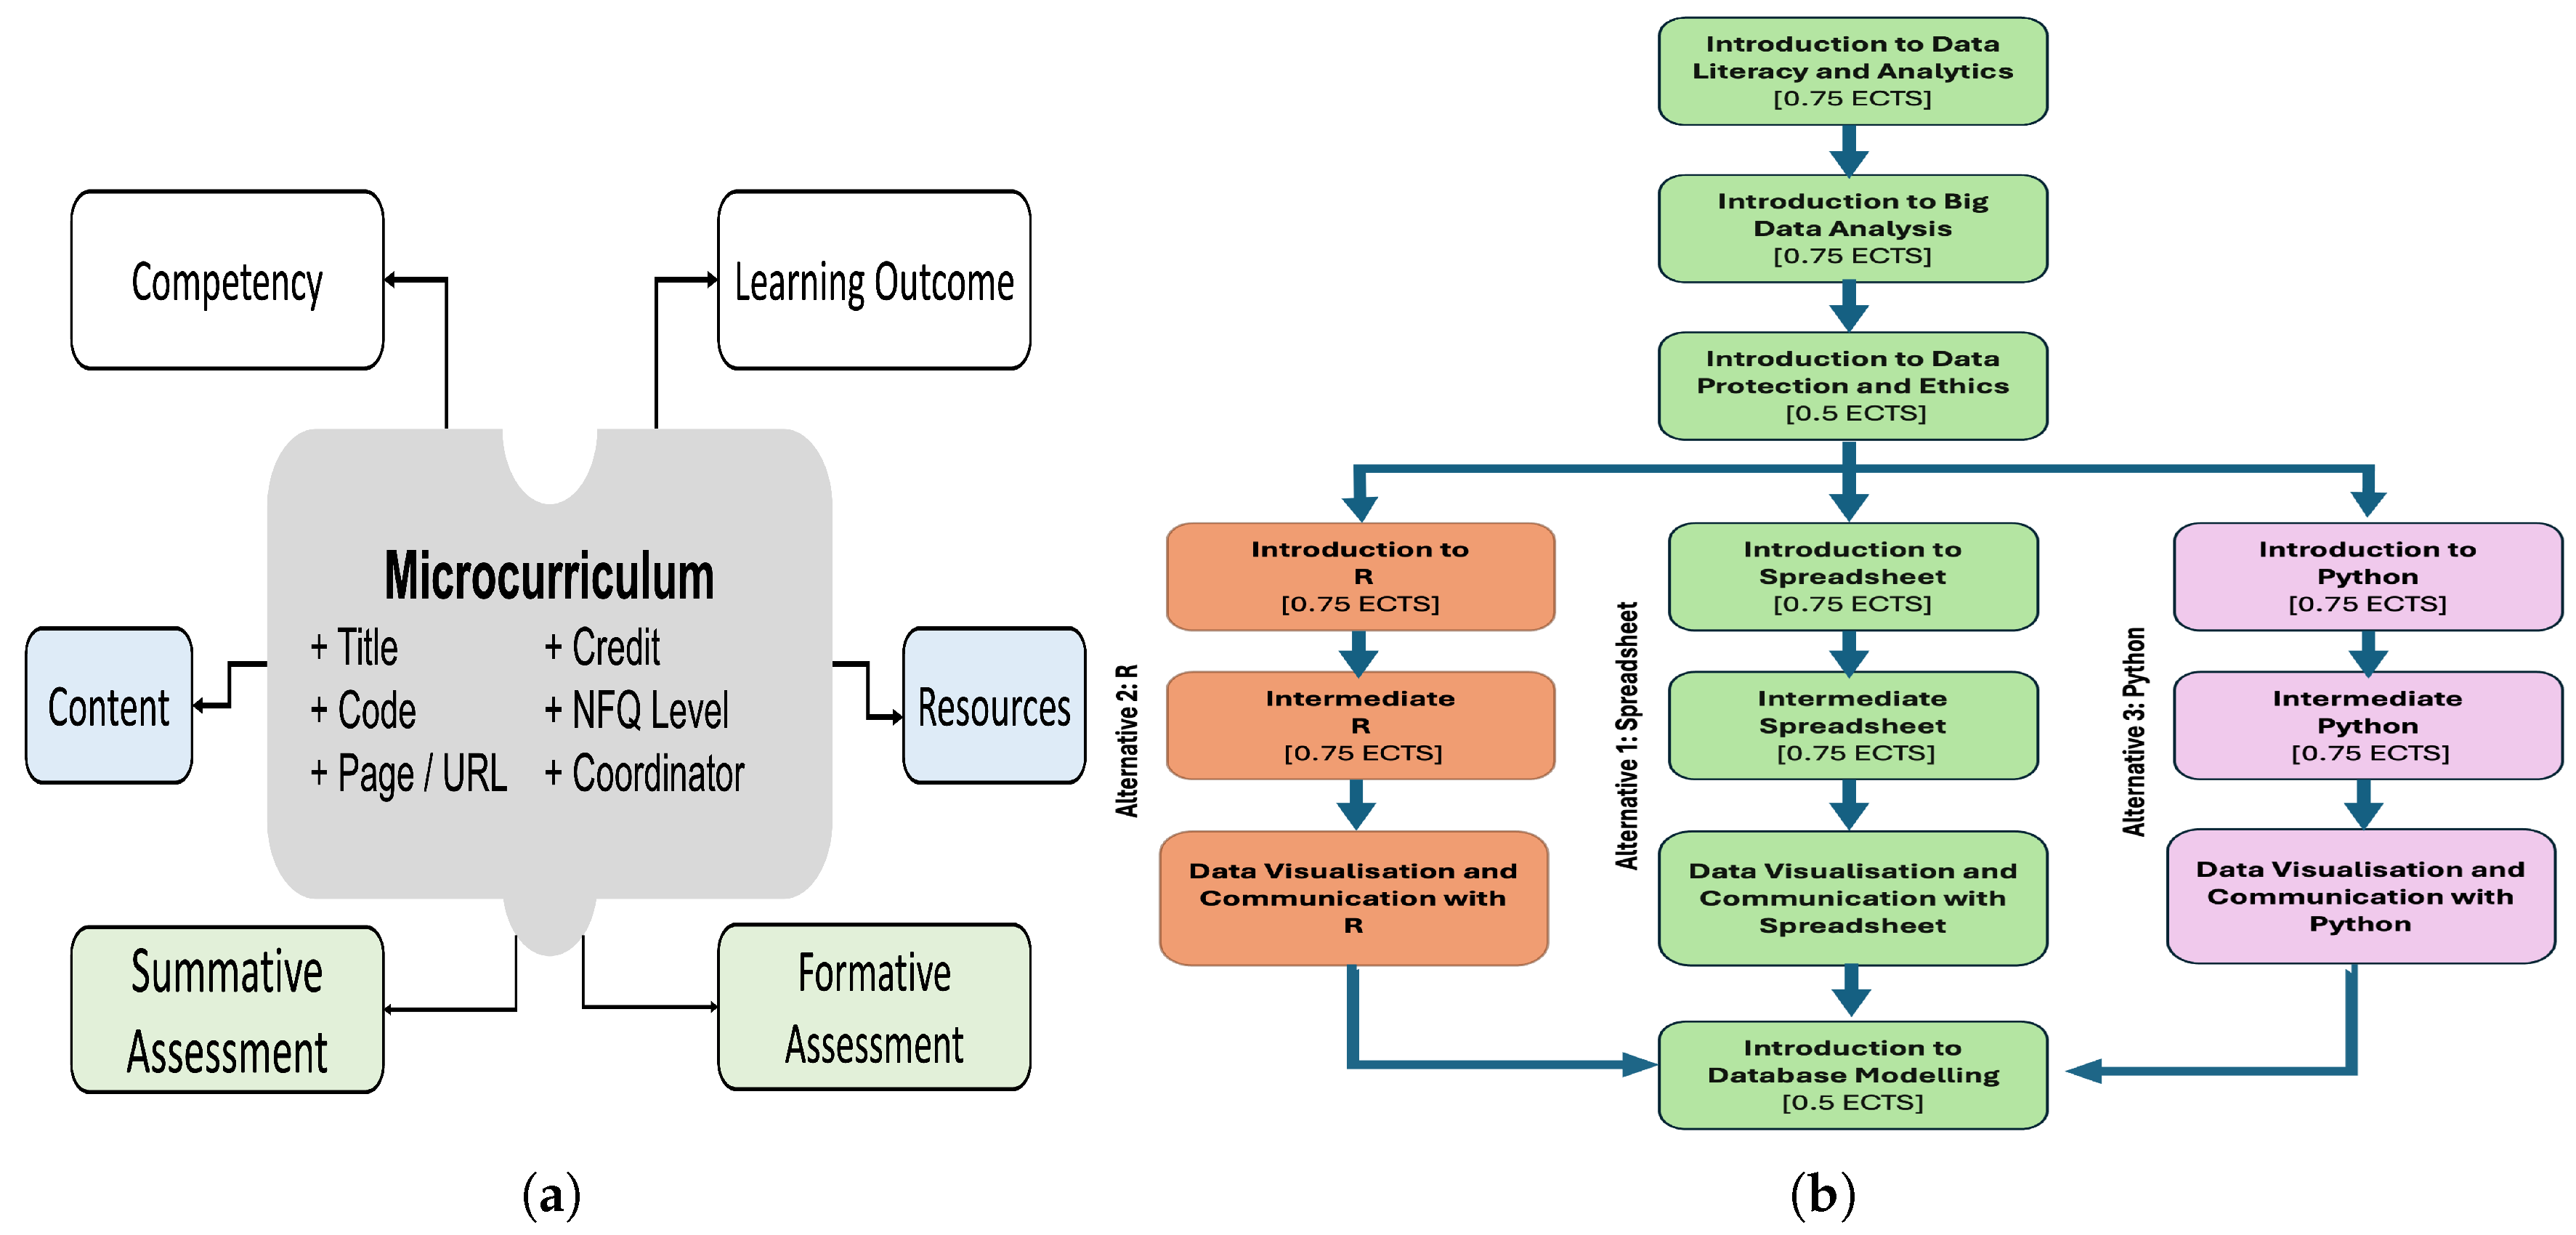
Figure 4.
Passive dimension: (a) digital content delivery, (b) multimedia integration, (c) analytics enabling personalised tracking at scale
Figure 4.
Passive dimension: (a) digital content delivery, (b) multimedia integration, (c) analytics enabling personalised tracking at scale
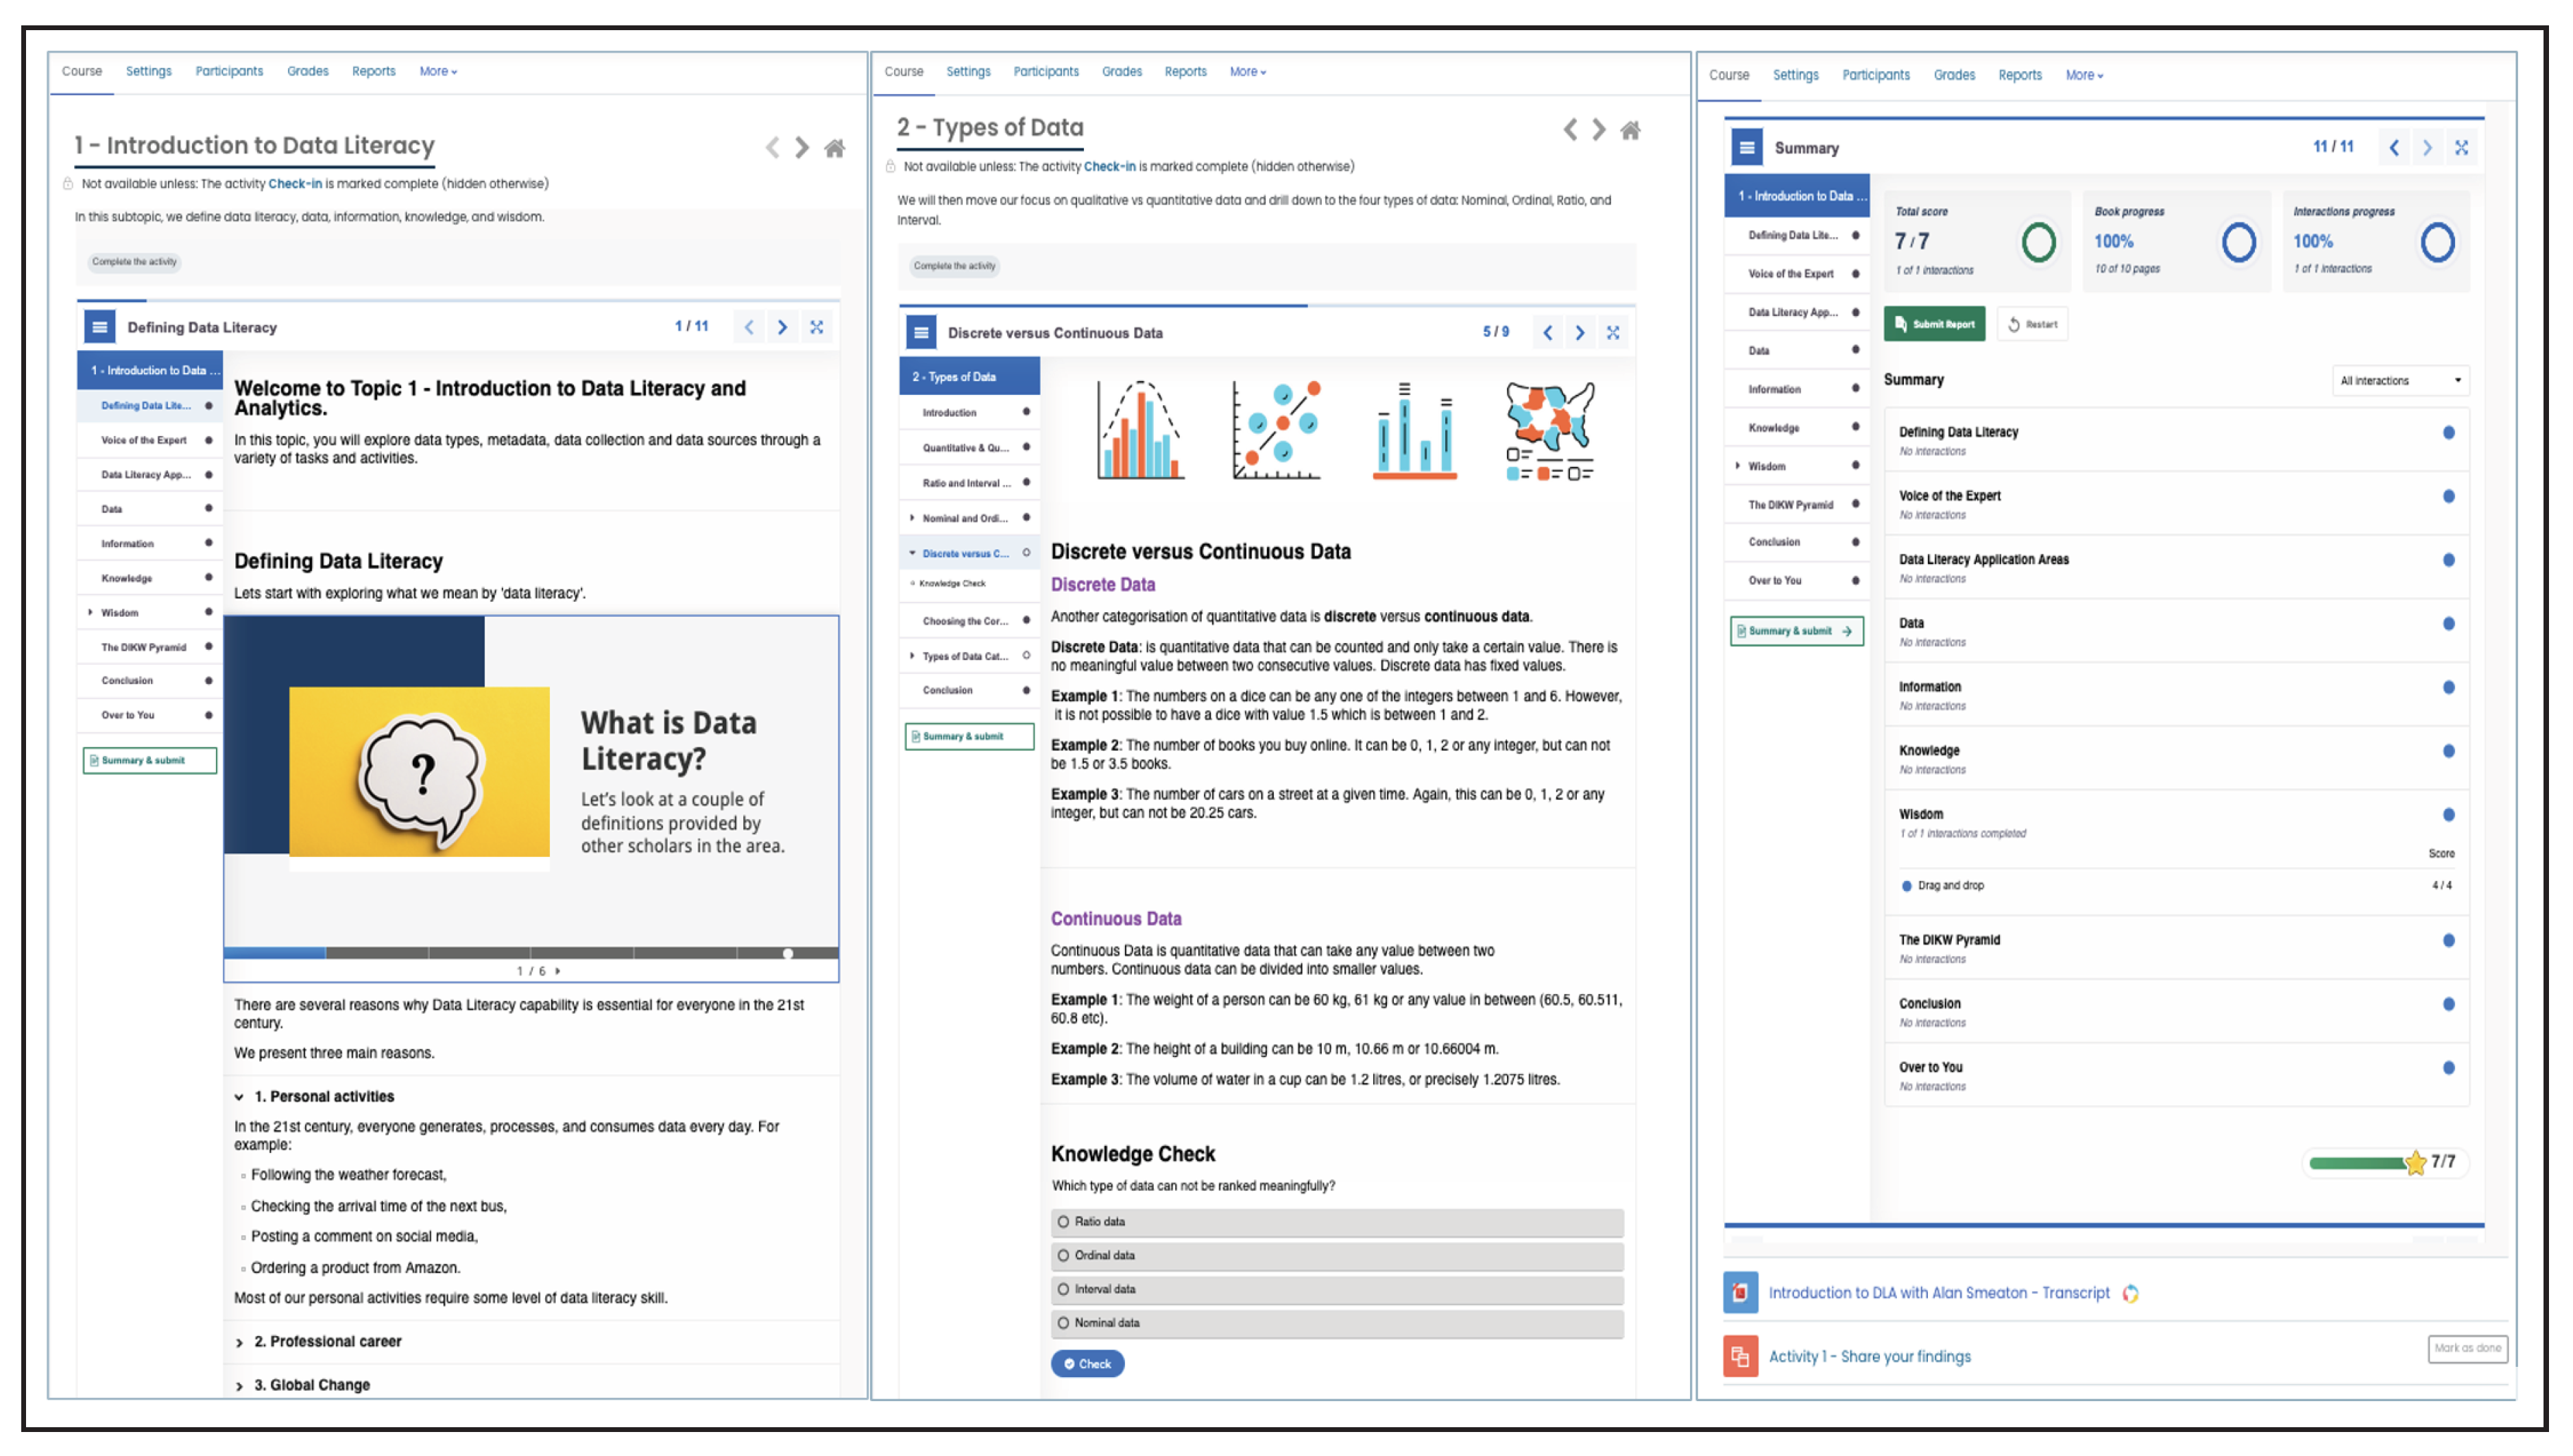
Figure 5.
Interactive dimension: (a) interactive content with embedded guidance, (b) diverse formative assessments with detailed feedback
Figure 5.
Interactive dimension: (a) interactive content with embedded guidance, (b) diverse formative assessments with detailed feedback
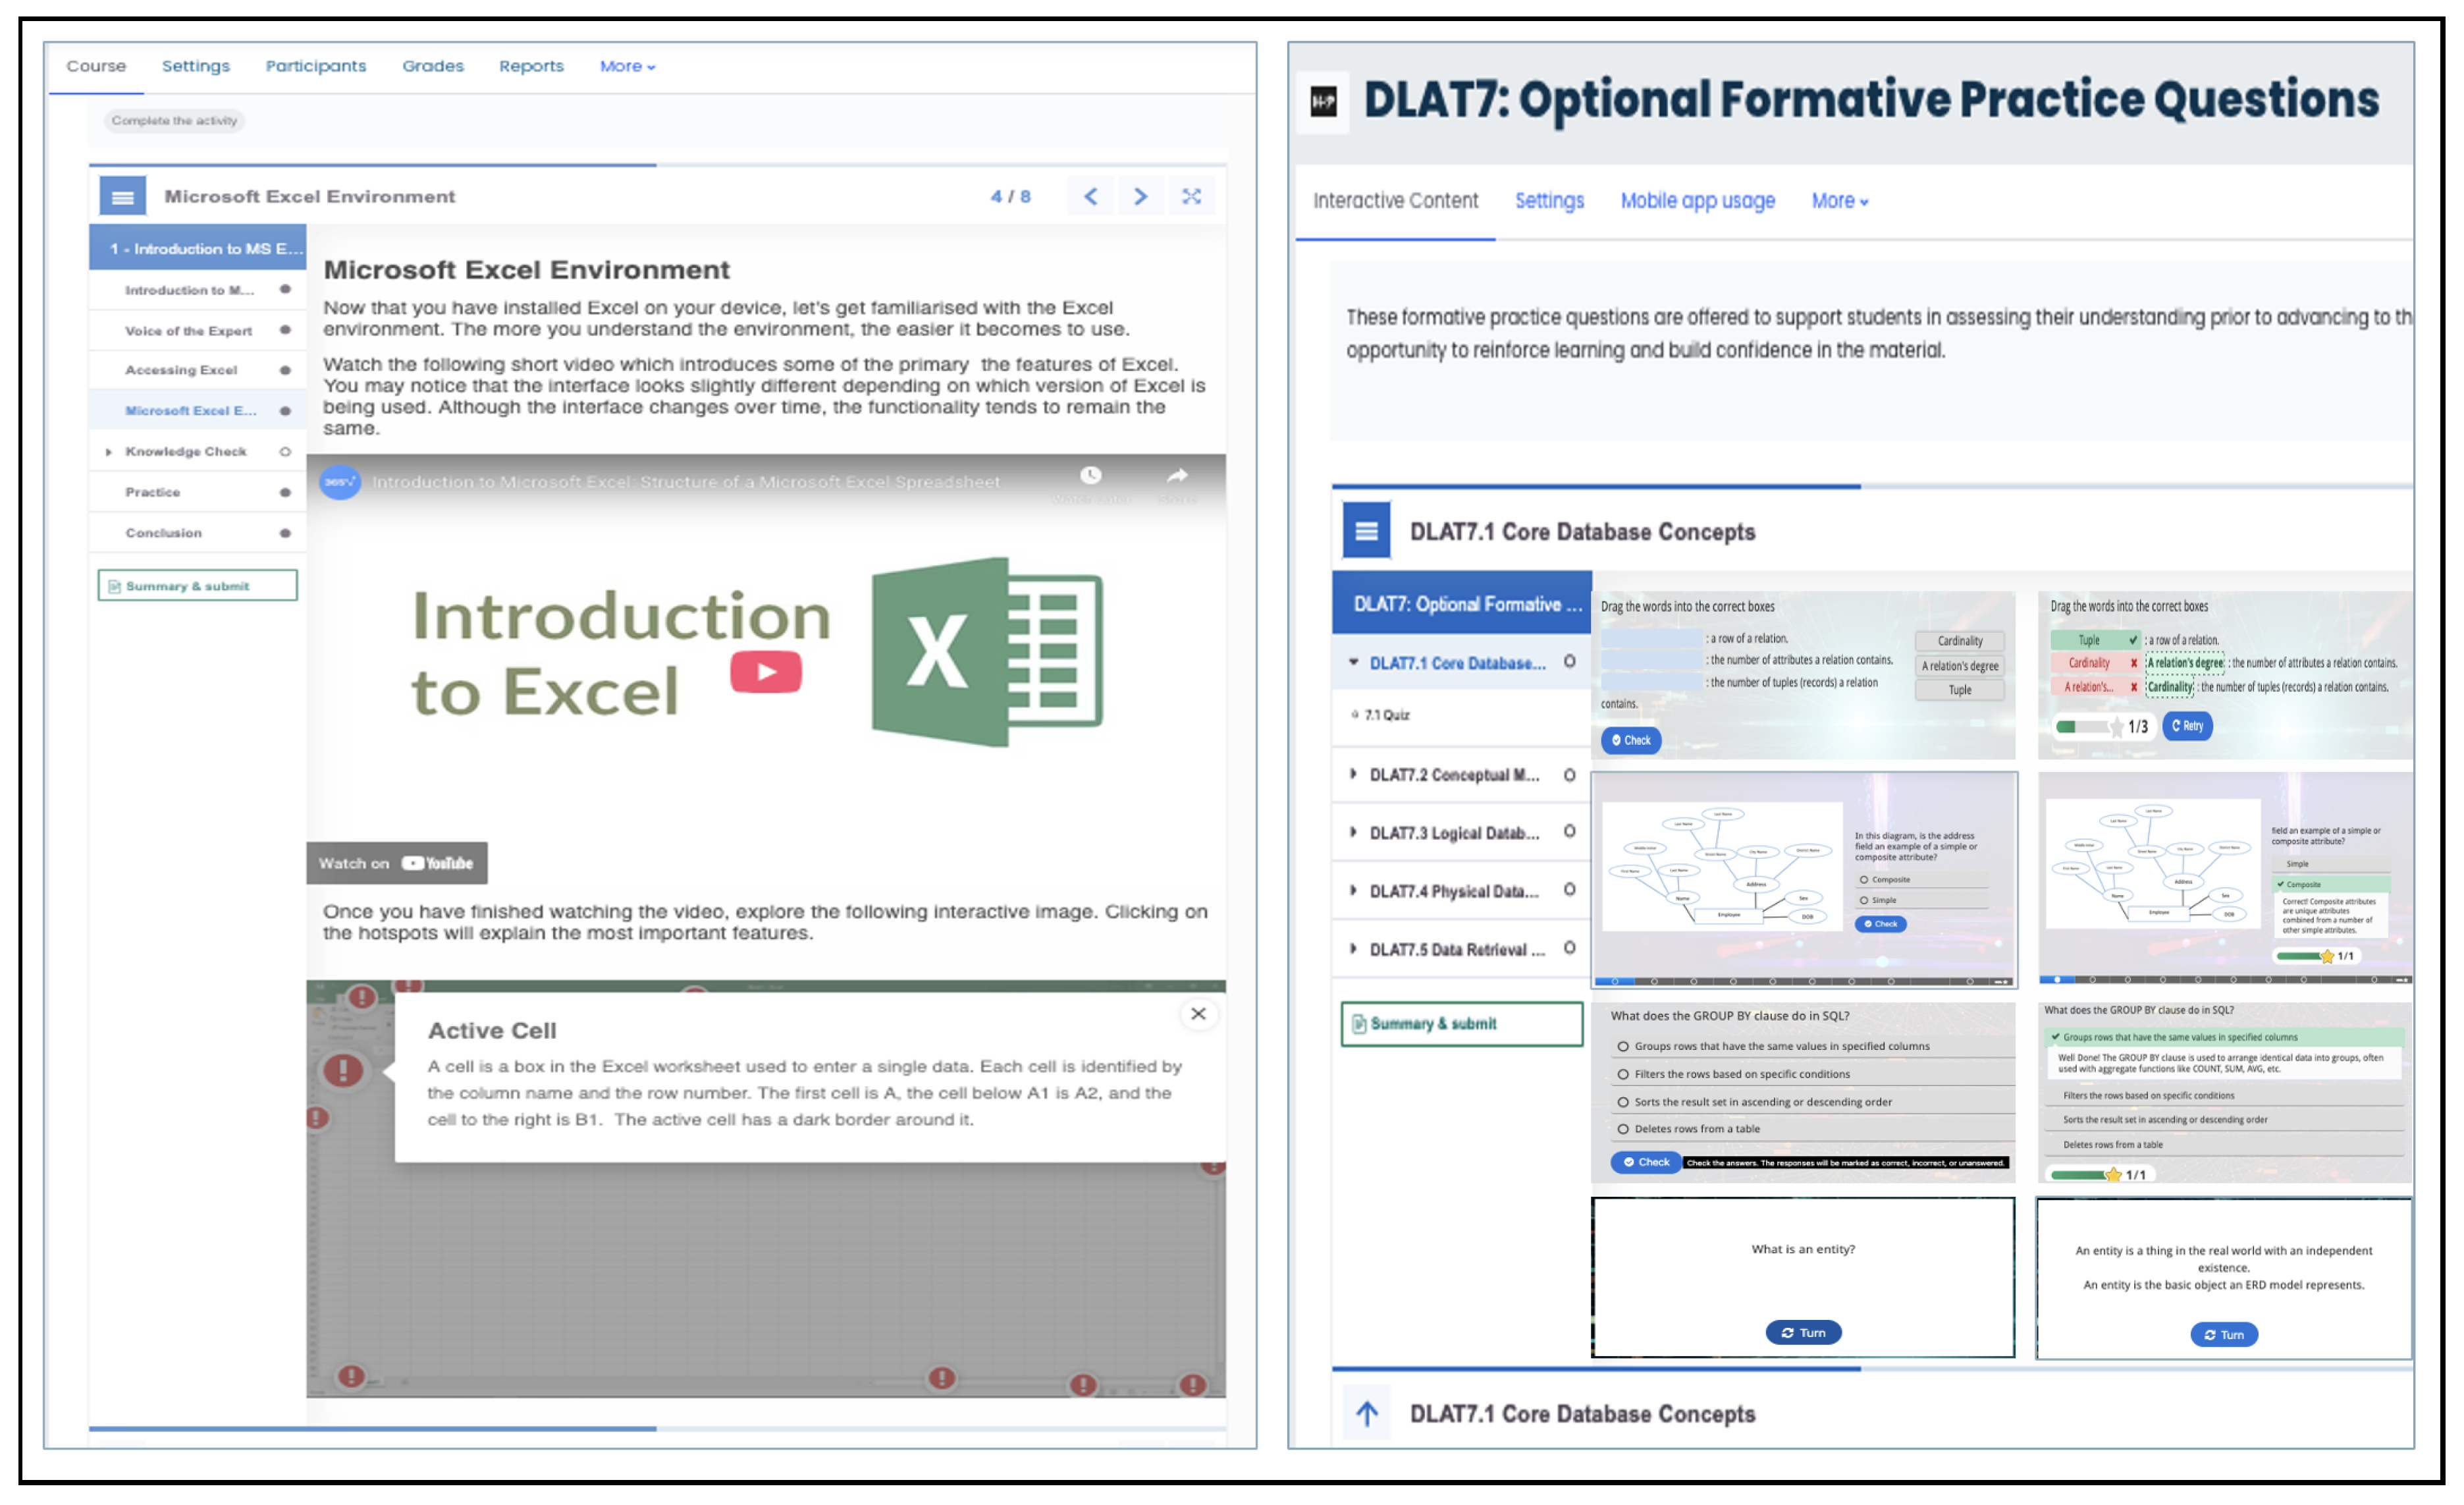
Figure 6.
Creative dimension: (a) case study tasks, (b) peer activity structures, (c) student artefacts, (d) creative visualisations
Figure 6.
Creative dimension: (a) case study tasks, (b) peer activity structures, (c) student artefacts, (d) creative visualisations
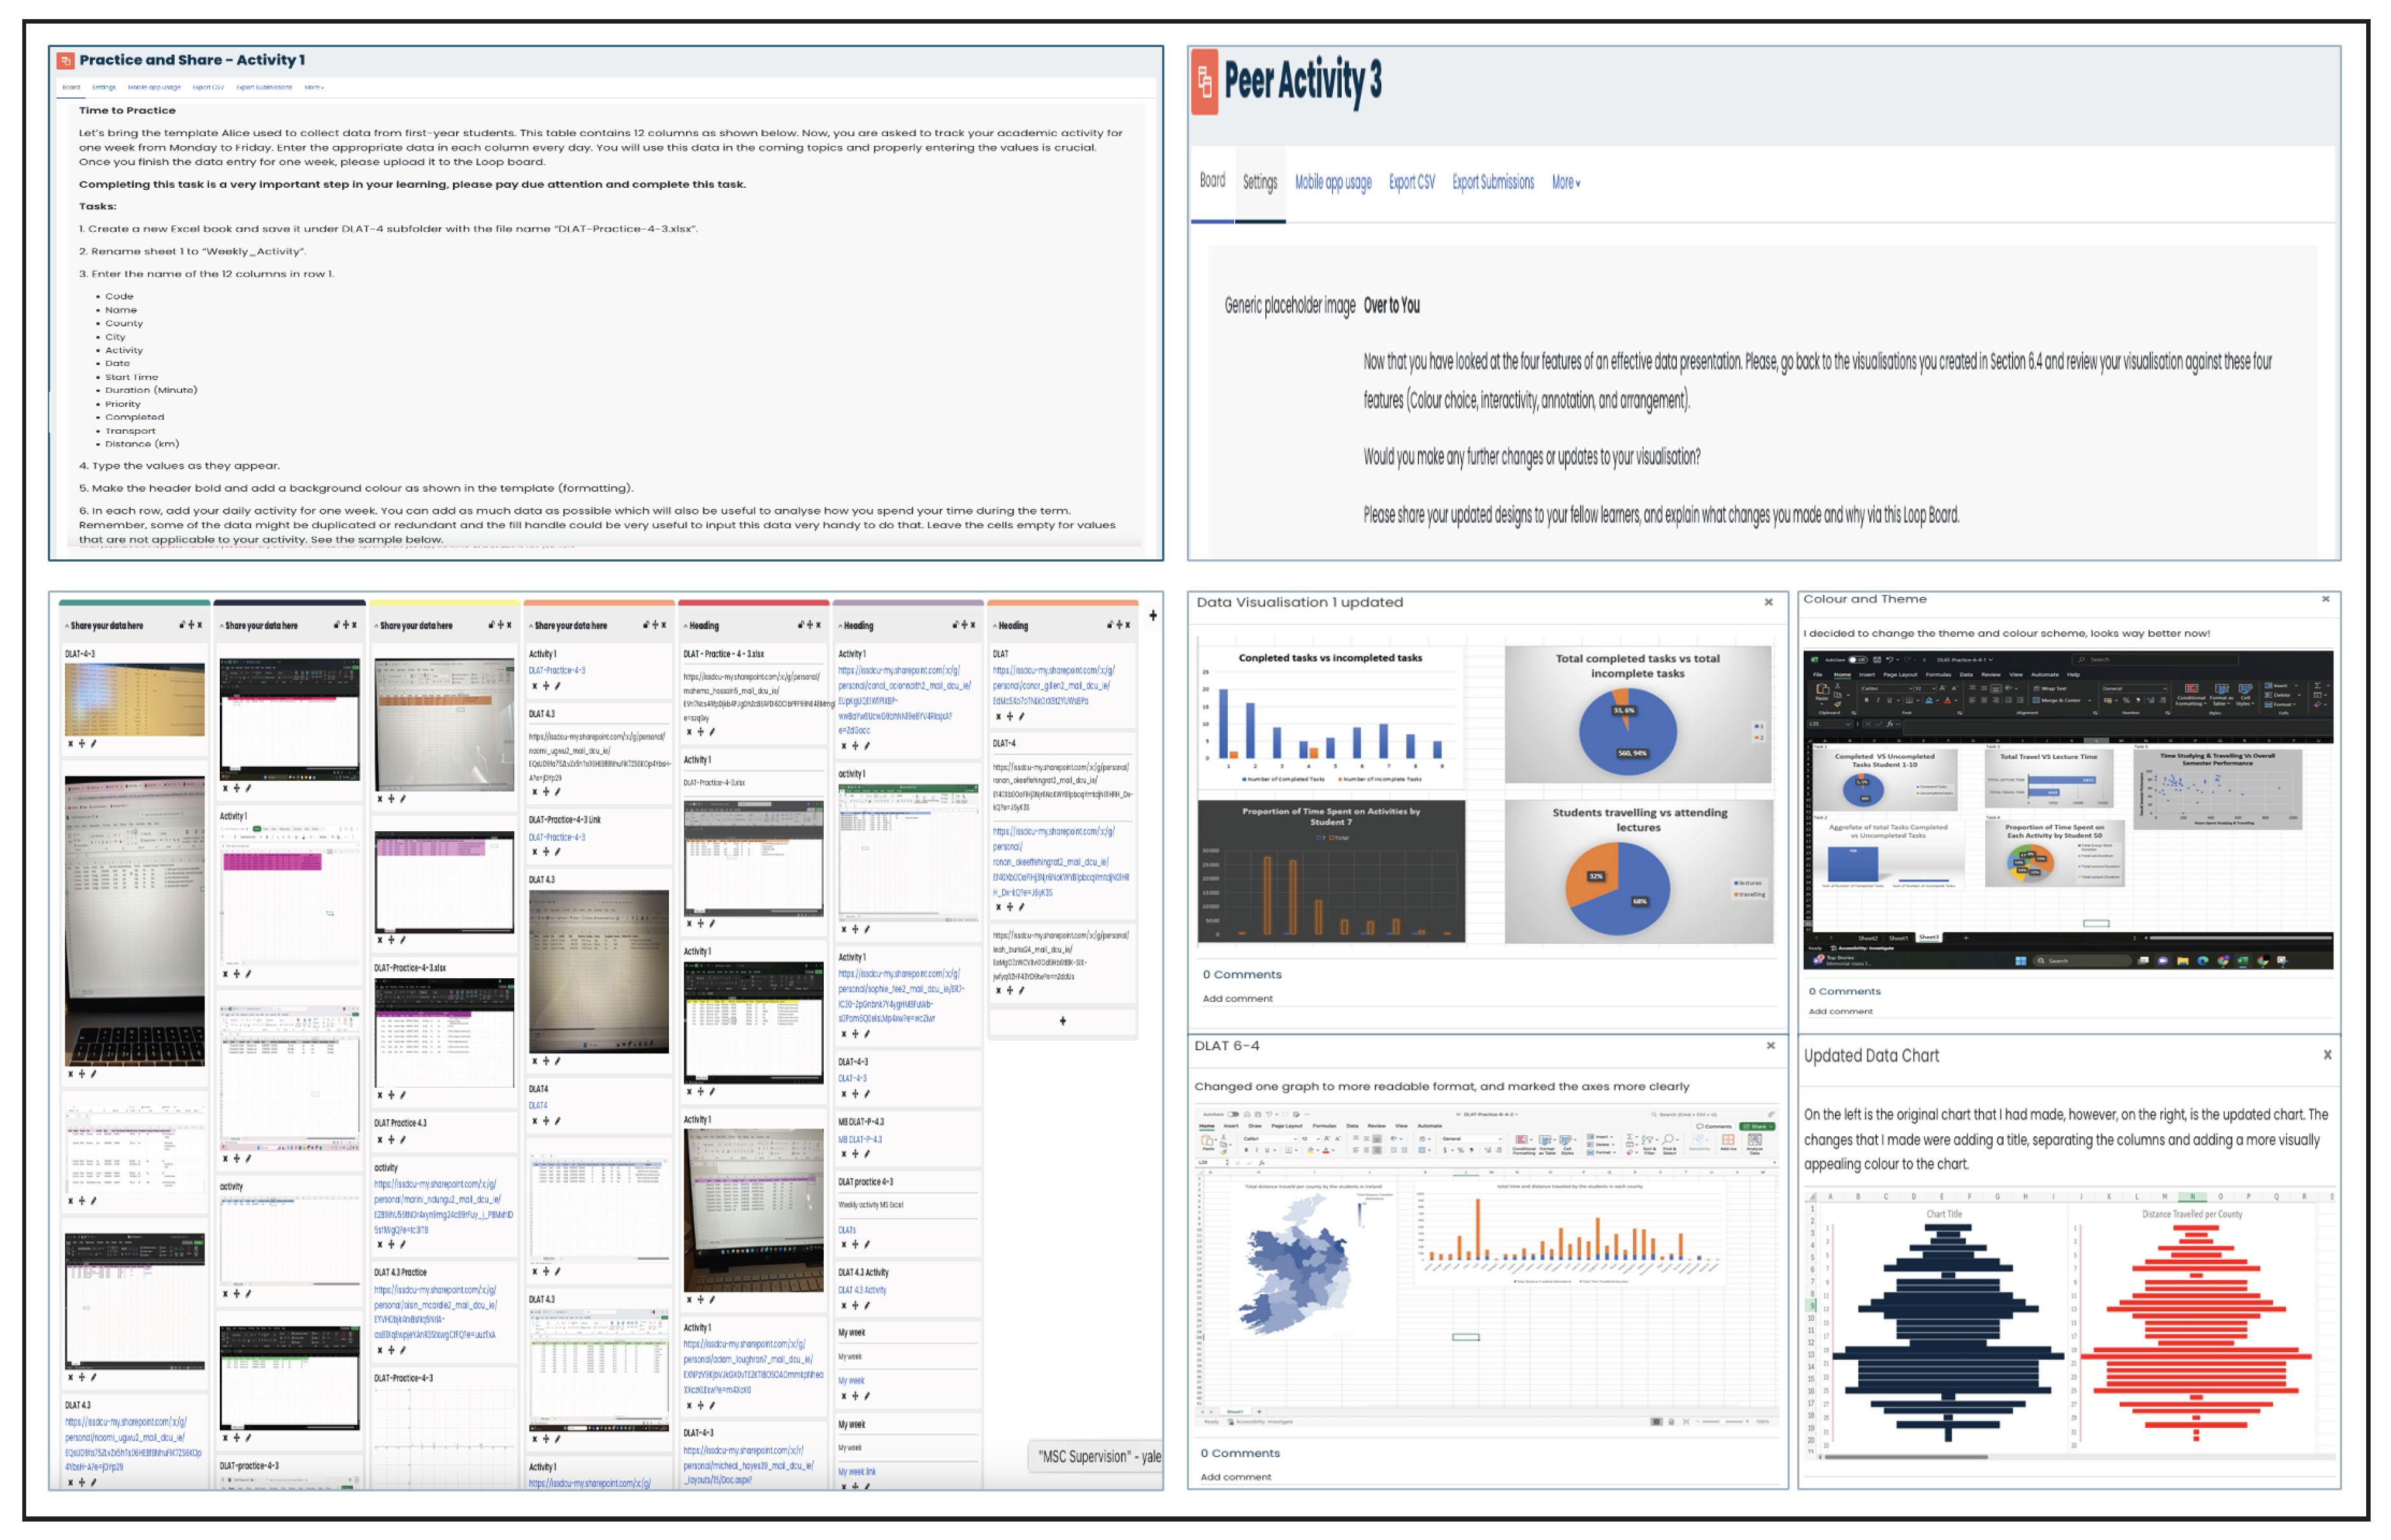

Table 1.
Learning types mapped to selected content, technology, UDL principles, strategies and rationale.
Table 1.
Learning types mapped to selected content, technology, UDL principles, strategies and rationale.
| Learning Type | Content | Technology | UDL | Strategy | Rationale |
|---|---|---|---|---|---|
| Acquisition | Lecture notes and references | H5P books, interactive videos | MMR, MME | Active, Mastery | Consume multimodal content with embedded interactivity |
| Investigation | Knowledge checks, case studies | H5P quizzes, games, case studies | MME, MMAE | IBL,PBL, | Encourage inquiry of core concepts and self-directed learning |
| Practice | Projects, homeworks | Loop boards, forums | MME, MMAE | PjBL, PBL | Apply learned knowledge practically in one’s discipline |
| Discussion | Open-ended questions, experience sharing | Loop forums, boards | MMR, MME | IBL, PBL, Social Constructivism | Share practical experience and perspectives across disciplines |
| Collaboration | Peer learning activities | Loop forums | MME, MMAE | PjBL,Social Constructivism | Co-construct understanding and peer feedback |
| Production | Assignments, design projects | Loop, H5P quizzes, boards | MME, MMR, MMAE | Student-Centered | Create and share various artefacts with scaffolded guidance |
Table 2.
Internal consistency reliability coefficients (Cronbach’s and McDonald’s ) for survey dimensions across three academic years. Interpretation: Excellent ≥ 0.9; Good: 0.8–0.9; Acceptable: 0.7–0.8.
Table 2.
Internal consistency reliability coefficients (Cronbach’s and McDonald’s ) for survey dimensions across three academic years. Interpretation: Excellent ≥ 0.9; Good: 0.8–0.9; Acceptable: 0.7–0.8.
| 2022/23 | 2023/24 | 2024/25 | |||||
|---|---|---|---|---|---|---|---|
| Dimension | # Items | ||||||
| Satisfaction | 3 | 0.80 | 0.82 | 0.88 | 0.89 | 0.89 | 0.90 |
| Content Quality | 4 | 0.84 | 0.87 | 0.86 | 0.88 | 0.85 | 0.87 |
| Engagement | 2 | 0.79 | 0.79 | 0.80 | 0.80 | 0.78 | 0.78 |
| Learning Outcomes | 2 | 0.82 | 0.82 | 0.81 | 0.81 | 0.78 | 0.78 |
Table 3.
Enrolment, engagement, and pass rates across seven DLAT microcurricula over three years. *Enrolled includes all registry-recorded students, including those who dropped or became inactive. **Attempted represents students who reached final assessments, providing a reliable engagement measure as core content cannot be bypassed.
| Year | Metric | DLAT1 | DLAT2 | DLAT3 | DLAT4 | DLAT5 | DLAT6 | DLAT7 | Average |
|---|---|---|---|---|---|---|---|---|---|
| 2022/23 | Enrolled* | 331 | 637 | 717 | 719 | 717 | 555 | 702 | 625 |
| Attempted** | 300 | 311 | 342 | 600 | 590 | 444 | 331 | 417 | |
| Passed | 274 | 304 | 320 | 584 | 541 | 444 | 325 | 399 | |
| Engagement rate (%) | 90.63 | 48.82 | 47.70 | 83.45 | 82.29 | 80.00 | 47.15 | 68.58 | |
| Pass rate (%) | 91.33 | 97.75 | 93.57 | 97.33 | 91.69 | 100.0 | 98.19 | 95.70 | |
| 2023/24 | Enrolled* | 1,347 | 867 | 738 | 1,277 | 1,269 | 1,270 | 1,274 | 1,149 |
| Attempted** | 1,085 | 528 | 451 | 1,149 | 1,037 | 988 | 874 | 873 | |
| Passed | 1,047 | 517 | 441 | 1,118 | 951 | 970 | 866 | 844 | |
| Engagement rate (%) | 80.55 | 60.90 | 61.11 | 89.98 | 81.72 | 77.80 | 68.60 | 74.38 | |
| Pass rate (%) | 96.50 | 97.92 | 97.78 | 97.30 | 91.71 | 98.18 | 99.08 | 96.92 | |
| 2024/25 | Enrolled* | 1,786 | 1,085 | 992 | 1,885 | 1,881 | 1,880 | 1,805 | 1,616 |
| Attempted** | 1,374 | 899 | 893 | 1,433 | 1,378 | 1,415 | 1,305 | 1,242 | |
| Passed | 1,371 | 899 | 891 | 1,426 | 1,320 | 1,415 | 1,305 | 1,232 | |
| Engagement rate (%) | 76.93 | 82.86 | 90.02 | 76.02 | 73.26 | 75.27 | 72.30 | 78.09 | |
| Pass rate (%) | 99.78 | 100.0 | 99.78 | 99.51 | 95.79 | 100.0 | 100.0 | 99.27 |
Table 4.
Student satisfaction with module design, learning outcomes clarity, and alignment
| Satisfaction Items | Response | 2022/23 | 2023/24 | 2024/25 | All Years |
|---|---|---|---|---|---|
| Q1: The module learning outcomes are clearly stated | Strongly Agree | 26 | 228 | 357 | 611 |
| Agree | 38 | 237 | 547 | 822 | |
| Neutral | 16 | 84 | 125 | 225 | |
| Disagree | 4 | 34 | 17 | 55 | |
| Strongly Disagree | 1 | 17 | 12 | 30 | |
| Mean (SD) | 3.99 (0.89) | 4.04 (1.00) | 4.15 (0.77) | 4.10 (0.87) | |
| Q2: I had a clear idea of what is expected of me in this module | Strongly Agree | 17 | 178 | 308 | 503 |
| Agree | 37 | 215 | 499 | 751 | |
| Neutral | 23 | 134 | 194 | 351 | |
| Disagree | 5 | 51 | 40 | 96 | |
| Strongly Disagree | 3 | 22 | 17 | 42 | |
| Mean (SD) | 3.71 (0.97) | 3.79 (1.07) | 3.98 (0.88) | 3.90 (0.96) | |
| Q3: The module learning outcomes agreed with what was actually taught | Strongly Agree | 18 | 197 | 340 | 555 |
| Agree | 45 | 251 | 533 | 829 | |
| Neutral | 16 | 110 | 157 | 283 | |
| Disagree | 4 | 26 | 18 | 48 | |
| Strongly Disagree | 2 | 16 | 10 | 28 | |
| Mean (SD) | 3.86 (0.89) | 3.98 (0.96) | 4.11 (0.78) | 4.05 (0.86) | |
| Overall | Mean (SD) | 3.85 (0.92) | 3.94(1.01) | 4.08 (0.81) | 4.02 (0.90) |
Table 5.
Perceived content quality, preparation, format diversity, and disciplinary relevance.
| Content Items | Response | 2022/23 | 2023/24 | 2024/25 | All Years |
|---|---|---|---|---|---|
| Q4: The module materials are well prepared | Strongly Agree | 25 | 231 | 378 | 634 |
| Agree | 39 | 231 | 471 | 741 | |
| Neutral | 15 | 98 | 178 | 291 | |
| Disagree | 3 | 24 | 20 | 47 | |
| Strongly Disagree | 3 | 16 | 11 | 30 | |
| Mean (SD) | 3.94 (0.97) | 4.06 (0.97) | 4.12 (0.82) | 4.09 (0.89) | |
| Q5: Module material was of high quality | Strongly Agree | 21 | 252 | 374 | 647 |
| Agree | 36 | 196 | 464 | 696 | |
| Neutral | 19 | 115 | 183 | 317 | |
| Disagree | 3 | 20 | 23 | 46 | |
| Strongly Disagree | 6 | 17 | 14 | 37 | |
| Mean (SD) | 3.75 (1.09) | 4.08 (0.99) | 4.10 (0.85) | 4.07 (0.92) | |
| Q7: Different styles such as books, videos, fireside chats, etc. were used when appropriate | Strongly Agree | 20 | 213 | 312 | 545 |
| Agree | 33 | 207 | 487 | 727 | |
| Neutral | 18 | 127 | 206 | 351 | |
| Disagree | 10 | 36 | 42 | 88 | |
| Strongly Disagree | 4 | 17 | 11 | 32 | |
| Mean (SD) | 3.65 (1.10) | 3.94 (1.03) | 3.99 (0.86) | 3.96 (0.94) | |
| Q8: The module material was relevant to my field of study | Strongly Agree | 16 | 195 | 294 | 505 |
| Agree | 35 | 208 | 450 | 693 | |
| Neutral | 24 | 138 | 249 | 411 | |
| Disagree | 5 | 38 | 43 | 86 | |
| Strongly Disagree | 5 | 21 | 22 | 48 | |
| Mean (SD) | 3.61 (1.05) | 3.86 (1.05) | 3.90 (0.93) | 3.87 (0.98) | |
| Overall | Mean (SD) | 3.74(1.05) | 3.99(1.01) | 4.03 (0.87) | 3.99 (0.93) |
Table 6.
Perceived engagement with content presentation and intellectual stimulation
| Engagement Items | Response | 2022/23 | 2023/24 | 2024/25 | All Years |
|---|---|---|---|---|---|
| Q6: The presentation style of the module content on Loop helped to engage my attention | Strongly Agree | 13 | 184 | 322 | 519 |
| Agree | 29 | 183 | 416 | 628 | |
| Neutral | 18 | 156 | 236 | 410 | |
| Disagree | 13 | 48 | 49 | 110 | |
| Strongly Disagree | 12 | 29 | 35 | 76 | |
| Mean (SD) | 3.21 (1.28) | 3.74 (1.12) | 3.89 (1.00) | 3.81 (1.07) | |
| Q10: I found the module intellectually stimulating | Strongly Agree | 12 | 151 | 270 | 433 |
| Agree | 22 | 202 | 420 | 644 | |
| Neutral | 19 | 170 | 241 | 430 | |
| Disagree | 18 | 47 | 86 | 151 | |
| Strongly Disagree | 14 | 30 | 41 | 85 | |
| Mean (SD) | 3.00 (1.30) | 3.66 (1.09) | 3.75 (1.05) | 3.68 (1.09) | |
| Overall | Mean (SD) | 3.11 (1.29) | 3.70(1.10) | 3.82 (1.02) | 3.74 (1.08) |
Table 7.
Perceived learning outcomes, knowledge transferability, and competency gains
| Learning Outcome Items | Response | 2022/23 | 2023/24 | 2024/25 | All Years |
|---|---|---|---|---|---|
| Q9: I can transfer the knowledge I acquired from this module to solve problems in my field of study | Strongly Agree | 15 | 212 | 322 | 549 |
| Agree | 34 | 212 | 469 | 715 | |
| Neutral | 16 | 126 | 211 | 353 | |
| Disagree | 16 | 30 | 42 | 88 | |
| Strongly Disagree | 4 | 20 | 14 | 38 | |
| Mean (SD) | 3.47 (1.13) | 3.94 (1.03) | 3.98 (0.88) | 3.95 (0.96) | |
| Q11: My knowledge of the subject (Data Literacy and Analytics) has increased as a consequence of this module | Strongly Agree | 24 | 246 | 388 | 658 |
| Agree | 35 | 214 | 472 | 721 | |
| Neutral | 15 | 103 | 158 | 276 | |
| Disagree | 8 | 17 | 26 | 51 | |
| Strongly Disagree | 3 | 20 | 14 | 37 | |
| Mean (SD) | 3.81 (1.06) | 4.08 (0.99) | 4.13 (0.85) | 4.10 (0.91) | |
| Overall | Mean (SD) | 3.64 (1.09) | 4.01(1.01) | 4.06 (0.85) | 4.02 (0.93) |
Disclaimer/Publisher’s Note: The statements, opinions and data contained in all publications are solely those of the individual author(s) and contributor(s) and not of MDPI and/or the editor(s). MDPI and/or the editor(s) disclaim responsibility for any injury to people or property resulting from any ideas, methods, instructions or products referred to in the content. |
© 2025 by the authors. Licensee MDPI, Basel, Switzerland. This article is an open access article distributed under the terms and conditions of the Creative Commons Attribution (CC BY) license (http://creativecommons.org/licenses/by/4.0/).
Copyright: This open access article is published under a Creative Commons CC BY 4.0 license, which permit the free download, distribution, and reuse, provided that the author and preprint are cited in any reuse.


