Submitted:
19 November 2025
Posted:
19 November 2025
You are already at the latest version
Abstract
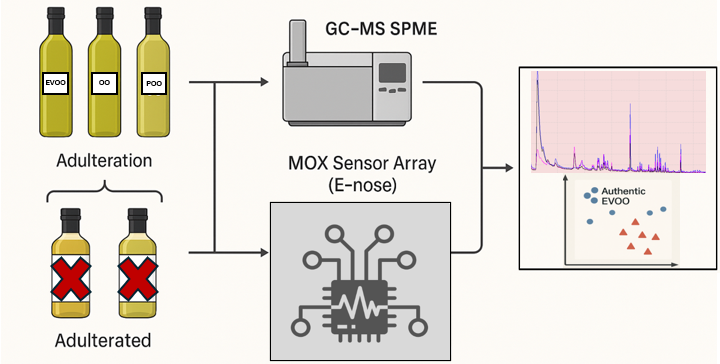
Food fraud, particularly in the olive oil sector, represents a pressing concern within the agri-food industry, with implications for consumer trust and product authenticity. Certified products like Protected Designation of Origin (PDO) extra virgin olive oil (EVOO) are premium products that undergo strict quality controls, must comply with specific production regulations, and generally have a higher market price. These characteristics make them particularly vulnerable to economically motivated adulteration. In this study, the adulteration of PDO EVOO with olive pomace oil and refined olive oil was investigated through a combined analytical approach. A traditional technique, gas chromatography–mass spectrometry with solid-phase micro-extraction detection (GC-MS SPME), was employed alongside an innovative method based on an electronic nose equipped with metal oxide semiconductor (MOX) sensors. GC-MS analysis enabled the identification of characteristic volatile compounds, providing a detailed chemical fingerprint of the different oil samples. Concurrently, the MOX sensor array successfully detected variations in the volatile profiles released by the adulterated oils, demonstrating its potential as a rapid and cost-effective screening tool. The complementary use of both techniques highlighted the reliability of MOX sensors in differentiating authentic PDO EVOO from adulterated samples and underscored their applicability in routine quality control and fraud prevention strategies.
Keywords:
MOX sensors
; food fraud
; electronic nose
; IoT applications
; innovative technology
; certified products
1. Introduction
Olive oil is one of the symbolic foods of the Mediterranean diet, globally appreciated for its nutritional value, distinctive sensory characteristics, and numerous health benefits [1]. Among the main European producing countries are Spain, Italy, and Greece, which together account for approximately 70% of global production. In Europe, the overall annual production of olive oil averages around 2 million tons, although it may fluctuate due to climatic conditions and agronomic factors [2].
Among the various categories, extra virgin olive oil (EVOO) represents the highest quality class. It is obtained exclusively through mechanical processes conducted at low temperatures, without the use of solvents or chemical treatments, thus preserving the phenolic fraction, fat-soluble vitamins (particularly vitamin E), and the volatile compounds responsible for its unique aromatic profile. These sensory and nutritional characteristics make EVOO highly valued not only from a gastronomic perspective but also in the prevention of various chronic and degenerative diseases [3].
Numerous scientific studies support its beneficial effects, including a reduced risk of cardiovascular diseases, anti-inflammatory properties, and modulation of oxidative responses, thanks to its high content of polyphenols and natural antioxidants [4,5]. Beyond its health-promoting properties, certification of origin and quality is a crucial aspect. Protected Designation of Origin (PDO) oils represent the most authentic expression of the link between product and territory. The PDO certification guarantees compliance with strict specifications that regulate, among other aspects, the cultivars used, agronomic practices, harvesting methods, and processing techniques. These oils not only represent a cultural and gastronomic heritage but also play an important economic role for producing areas, contributing to the enhancement of local traditions and the protection of biodiversity. However, the prestige and high market value of PDO oils make them particularly vulnerable to fraud and adulteration [6]. Common fraudulent practices include blending with lower-quality oils, the addition of seed oils, or the use of oils from different harvest years or regions than those indicated on the label [7]. According to the International Olive Council (IOC), approximately 10% of olive oil traded globally shows non-compliance with label claims, with negative consequences for consumers, who risk purchasing inferior products at unjustified prices, and for honest producers, who suffer in terms of reputation and economic return [8].
Considering these critical issues, it is essential to develop authentication methods that are rapid, reliable, and accessible, capable of supporting official controls and providing greater guarantees to consumers. A thorough understanding of the compounds present in extra virgin olive oil (EVOO) makes it possible to detect alterations resulting from degradation processes, as well as potential fraudulent adulterations [9,10,11]. The identification of the aromatic characteristics of extra virgin olive oil (EVOO) can be performed either through sensory evaluation (panel test) or by analyzing its volatile compounds. Although the panel test is an official method, it presents several disadvantages: it is costly, time-consuming, and its results may be influenced by subjective factors, such as the training and individual sensitivity of the panelists [12]. Among instrumental techniques, gas chromatography coupled with mass spectrometry (GC-MS), particularly when combined with headspace solid-phase microextraction (HS-SPME), stands out for its high accuracy in the qualitative and quantitative analysis of the volatile fraction. This approach enables the acquisition of a detailed chemical fingerprint, useful for identifying cultivar, geographical origin, and potential adulterations. However, GC-MS also presents certain practical limitations, including complex sample preparation, lengthy analysis times, high equipment costs, and the requirement for highly specialized technical personnel [13,14]. In this context, the electronic nose (e-nose) emerges as an innovative and complementary tool, capable of providing rapid, non-destructive analyses that can potentially be applied directly in the field [15,16]. Its operation is based on an array of chemical sensors, in this case metal oxide (MOX) sensors, which are sensitive to the presence of volatile compounds. When these molecules interact with the sensitive surface of the MOX sensors, variations in electrical conductivity occur, which are processed to generate a characteristic olfactory fingerprint of the sample. Among the main advantages of MOX sensors are their rapid response, robustness, potential for miniaturization, and ease of integration into automated systems. Moreover, the electronic nose does not require complex pre-treatment steps and can provide real-time results. However, its main limitation lies in the inability to identify individual volatile compounds: the system is designed primarily for discrimination and classification tasks rather than for detailed chemical characterization [17].
The combined use of GC-MS and the electronic nose thus represent a promising approach for olive oil authentication, merging the analytical precision of GC-MS with the operational speed and flexibility of the electronic nose.
The main objectives of this study were to evaluate the discriminative capability of the electronic nose in classifying different types of olive oils (extra virgin olive oil, olive oil, and olive pomace oil), to compare the olfactory fingerprints generated by the MOX sensor system with the detailed chemical profiles obtained through GC-MS, and to explore the development of predictive models for rapid and non-destructive authentication of olive oils.
Protecting authenticity and enhancing the quality of olive oil, particularly those certified as PDO (Protected Designation of Origin), are strategic priorities for the agri-food industry and for consumer protection. The adoption of integrated analytical approaches, combining established techniques such as GC-MS with innovative tools like MOX sensor-based electronic noses, represents a decisive step toward a more modern, efficient, and sustainable control system, in line with market demands and current challenges related to food safety and transparency [18].
2. Materials and Methods
In this study, three types of oils and their respective mixtures were analyzed: certified Protected Designation of Origin extra virgin olive oil (EVOO), olive oil (OO), and olive pomace oil (POO). All samples were purchased from retail outlets in the large-scale distribution sector and stored at room temperature, ranging between 20 and 25 °C, outside of refrigeration. For each biological replicate, three independent measurements were performed for both GC–MS and e-nose analyses. Prior to analysis, the order of sample measurements was randomized using a computer-generated sequence to avoid systematic bias. In addition, the position of samples within the thermostatic bath and on the e-nose measurement platform was varied across replicates to minimize potential position effects.
2.1. Experiment Design
The study was conducted using two complementary approaches. The first involved the characterization of volatile organic compounds (VOCs) present in EVOO, OO, and POO samples through GC-MS SPME analysis. The second approach focused on analyzing the volatile fraction, or olfactory fingerprint, of both pure samples and their mixtures using a device equipped with MOX sensors.
2.2. Sample Preparation and Characterization of Oil Samples
A total of 30 samples were analyzed using the electronic nose (e-nose), including extra virgin olive oil (EVOO), olive pomace oil (POO), olive oil (OO), and their respective mixtures prepared with adulteration percentages of 10%, 30%, and 50%. In addition, 9 pure oil samples (EVOO, POO, OO) were analyzed using the GC-MS technique.
For the characterization of the volatilome, 50 mL of each pure sample were collected, transferred into glass containers, and subsequently analyzed using the electronic nose (e-nose). Measurements were carried out in a thermostatic bath at 30 °C, a condition selected to promote the release of volatile compounds while minimizing oxidation or degradation processes in the sample (Figure 1).
In parallel, the same samples were analyzed using gas chromatography coupled with mass spectrometry (GC-MS), employing solid-phase microextraction (SPME) as the sampling technique. For this purpose, 20 mL of each sample were placed into vials sealed with caps featuring aluminum crimp tops and polyethylene-tetrafluoroethylene/silicone (PTFE/silicone) septa, ensuring tight sealing and preserving the integrity of the volatile profile.
The combined approach, integrating the rapid and non-destructive analysis of the e-nose with the detailed identification and quantification capabilities of GC-MS, allowed for a comprehensive and complementary characterization of the volatile fraction of each oil sample analyzed.
Several mixtures were subsequently prepared with the aim of evaluating the system’s sensitivity in detecting potential adulterations or combinations of different oils.
Specifically:
- 50% mixtures: three samples, obtained by combining 50 mL of POO with 50 mL of EVOO DOP; 50 mL of OO with 50 mL of EVOO DOP; and 50 mL of OO with 50 mL of POO.
- 30% mixtures: two samples, one consisting of 30 mL of POO and 70 mL of EVOO DOP, and the other of 30 mL of POO and 70 mL of OO.
- 10% mixtures: two samples, one containing 10 mL of POO and 90 mL of EVOO DOP, and the other 10 mL of POO and 90 mL of OO.
This experimental approach was designed to assess the ability of metal oxide sensors to detect even minimal variations in composition, simulating real-world adulteration scenarios and evaluating the system’s effectiveness in identifying fraud or quality alterations in olive oil. Table 1 provides a detailed description of the oil samples analyzed, including the number of replicates performed for each type.
2.2. Volatile Organic Compounds (VOCs)
The analysis of volatile organic compounds (VOCs) was conducted using two complementary approaches: (i) identification by gas chromatography coupled with mass spectrometry (GC-MS) using solid-phase microextraction (SPME), and (ii) olfactory profiling through an electronic nose system based on metal oxide semiconductor (MOX) sensors.
For the GC-MS analysis, two grams of oil were placed in hermetically sealed headspace vials and incubated at 40 °C for 10 minutes. A DVB/C-WR/PDMS SPME fiber was then introduced into the vial and exposed in the headspace (4 cm) for 30 minutes under agitation. Subsequently, thermal desorption of volatile compounds was performed in the injector port at 240 °C for 5 minutes. Compound identification was carried out using a gas chromatograph (Agilent Technologies, model 7820A) coupled to a mass spectrometer (5977E MSD). The initial oven temperature was set at 40 °C for 10 minutes, increased to 200 °C at 3 °C/min (held for 3 minutes), and finally raised to 240 °C at 10 °C/min, maintained for 5 minutes. Separation was achieved using an HP-5MS capillary column (30 m × 0.25 mm × 0.25 μm) with helium as the carrier gas at a constant flow of 1 mL/min. Injections were performed in splitless mode at 240 °C, with the transfer line maintained at 250 °C and the ion source at 230 °C. Electron ionization energy was set at 70 eV, and data acquisition was performed in scan mode from 30 m/z to 300 m/z. Qualitative analysis was based on the comparison of the obtained mass spectra with reference spectra available in the NIST Mass Spectral Search Program (version 2.0). This methodology enabled the identification of representative compounds present in the oils, including aldehydes, alcohols, acids, and esters, allowing a precise differentiation of volatilome composition across pomace, virgin, and extra virgin oils, as well as the detection of potential adulteration.
In parallel, a portable electronic nose system based on MOX sensors was employed. This compact device is designed for the rapid detection of volatile profiles by recording impedance changes in the sensing elements upon exposure to VOCs released by the samples. Analyses were conducted at 30 °C using a thermostatic bath, ensuring headspace generation without inducing thermal degradation of the oils. The system captured subtle variations in the volatile profiles, generating characteristic olfactory fingerprints that allowed reliable classification of the samples. The electronic nose integrates a multichannel MOX sensor with four resistive sensing elements, each displaying differential sensitivity to specific chemical families, including alcohols, aldehydes, ketones, and fatty acids. Operating at a controlled working temperature of approximately 400 °C, the sensor ensured stable and reproducible responses. The embedded system incorporates data acquisition electronics and wireless connectivity, facilitating its application as a portable and compact analytical tool. The recorded signals, based on impedance variations of each sensing element, provided unique olfactory patterns for each sample, enabling a robust and non-destructive characterization of the oils.
2.3. Electronic Nose Set Up
The printed circuit board (PCB) of the system integrates various electronic components, as shown in Figure 2. It is powered via a USB port and 3.7 V lithium battery. The voltage supplied by the battery is regulated through a Buck/Boost converter that stabilizes it at 3.3 V, which is used by most of the electronic components. Additionally, a linear regulator reduces this voltage o 1.8 V to supply the ENS160 sensor.
The data acquisition system is based on three different sensors, whose characteristics and measured signals are presented in Table 2. The signals generated by the sensors are transmitted via the I2C protocol to a 32-bit microcontroller, model SM32WB55CGU6 from STMicroelectronics (Geneva, Switzerland). This microcontroller manages both the communication with the sensors and the wireless connection via Bluetooth Low Energy (BLE) with external devices such as smartphones, thanks to the integrated Arm Cortex- MO+ core.
On one hand, Figure 3 (left) shows the layout of the printed circuit board (PCB), designed in a compact circular format with a diameter of 36.4 mm. The components have been strategically placed to maximize space efficiency. Among the key elements are a microcontroller, responsible for managing sensor communication and Bluetooth Low Energy (BLE) connectivity, and an RGB LED used to visually indicate air quality levels.
The sensing system includes three main sensors: the ENS160 gas sensor for air quality evaluation, the STC31 gas sensor for 〖CO〗_2 concentration measurement, and a dedicated temperature, along with a dedicated temperature and relative humidity sensor (SHT40). Communication between the sensors and the microcontroller is handled via the I2C protocol. A BLE antenna is also integrated to allow wireless data transmission to external devices such as smartphones
Figure 3 (right) presents the external casing that encloses the PCB. This protective structure is designed with radial vents that enable air to circulate freely to the terminal sensors. The enclosure is optimized for portability and comfortable everyday use, ensuring that environmental measurements can be carried out reliably while the device is worn or transported.
3. Results and Discussion
3.1. Characterization and Comparison of the Volatile Components of Pure Oils Using SPME-GC-MS
The analysis of the volatile profile of the three oils under investigation (EVOO, OO, POO), performed using gas chromatography–mass spectrometry (GC-MS) coupled with solid-phase microextraction (SPME), enabled the identification of 60 compounds. These were classified into seven main chemical groups: alkanes, alkenes, carboxylic acids, aldehydes, alcohols, ketones, and others (Table 3).
The extra virgin olive oil (EVOO) samples exhibited a rich and complex aromatic profile, characterized by a high abundance of volatile compounds belonging to the C6 family, including aldehydes (hexanal, E-2-hexenal), alcohols (1-hexanol, (Z)-3-hexen-1-ol), and their corresponding esters, such as (Z)-3-hexen-1-yl acetate. These compounds are primarily derived from the enzymatic lipoxygenase (LOX) pathway, which is activated during the processing of fresh and intact olives, converting polyunsaturated fatty acids into volatile metabolites with low odor thresholds. These molecules are responsible for the fresh, green, fruity, and herbaceous sensory notes that are typical of high-quality olive oils. Hexanal is one of the most abundant compounds in the volatile profile of EVOO and significantly contributes to green and freshly cut grass olfactory sensations, as widely reported in the literature [67,68,69]. E-2-hexenal, which is also frequently detected at high concentrations, is associated with a more intense and penetrating fruity aroma. According to García-Vico et al. (2017) [70], this compound is often the most abundant among the C6 volatile organic compounds (VOCs). C6 alcohols, such as 1-hexanol and (Z)-3-hexen-1-ol, also contribute to the aromatic profile by imparting sweet, floral, and slightly fruity notes. In particular, the latter serves as an important precursor of volatile esters such as (Z)-3-hexen-1-yl acetate, which imparts fresh and fruity aromatic nuances (e.g., tomato leaf, green banana), significantly enhancing the overall olfactory complexity of the oil [18]. Overall, aldehydes, alcohols, and their corresponding esters are the main contributors to the aromatic characteristics of EVOO, not only due to their abundance but also because of their low sensory threshold and high sensory impact (Figure 4). Their presence at high concentrations is commonly associated with high-quality raw material and a prompt, well-executed extraction process, thus representing reliable markers of the product’s freshness and integrity [70,71,72].
Although virgin olive oil (OO) shares many volatile compounds with extra virgin olive oil (EVOO), it is characterized by a less intense and less complex aromatic profile, indicative of lower commercial and sensory quality (Figure 5). The reduced presence of key volatile compounds in OO samples suggests a weakening or partial disruption of the main biosynthetic pathways. This is often associated with the use of lower-grade raw materials, longer storage times, or technological treatments such as refining [73].
Principal Component Analysis (PCA) was applied to the volatile compound data obtained by gas chromatography–mass spectrometry (GC–MS) in order to investigate differences among the various types of olive oil analyzed. The resulting two-dimensional projection (Figure 6) shows that the first two principal components account for the total variability of the dataset: PC1 alone explains 82.2% of the variance, while PC2 accounts for 17.8%.
The distribution of the samples along PC1 highlights a clear separation between olive pomace oil and the other two groups. Pomance samples cluster at the far left of the plot, confirming a distinct aromatic profile characterized by the absence of key compounds and the presence of metabolites associated with oxidative and degradative processes.
The second principal component allows for a clear distinction between extra virgin olive oil (EVOO) and virgin olive oil (VOO). EVOO samples group in the upper right quadrant of the plot, suggesting a greater abundance of compounds derived from the enzymatic lipoxygenase (LOX) pathway, typically responsible for fresh and green sensory notes. Conversely, virgin olive oil samples are located in the lower right quadrant, showing an intermediate profile—closer to EVOO than to olive pomace oil—but with quantitative differences in the concentration of the most representative volatiles.
The loading analysis supports these observations: alcohols (e.g., 1-pentanol, isoamyl alcohol), esters (ethyl butanoate, ethyl acetate, esters of butanoic acid), and terpenes (such as limonene and α-pinene) are strongly associated with EVOO, contributing to its distinctive aromatic fingerprint. In contrast, short-chain acids (acetic acid, butanoic acid) and degradation-related molecules (octene, n-octane, styrene) appear more representative of pomance samples, and to a lesser extent of virgin olive oils. Overall, PCA effectively highlighted marked differences among the three olive oil categories, confirming that the volatile profile represents a reliable indicator of both product quality and preservation status.
3.2. Measurement Setup
The results obtained with GC-MS were compared with those acquired using the electronic nose, followed by a PCA to explore group separations and classification capabilities. Similar approaches are widely reported in the literature, where electronic noses, often combined with multivariate statistical tools, have been successfully applied to the discrimination of olive oils according to geographical origin, cultivar, and quality grade, yielding results comparable to those of consolidated analytical platforms such as GC-MS [17,18].
In the present study, measurements on olive oil samples were performed using a dynamic headspace configuration based on cyclic adsorption and desorption, specifically designed to capture the temporal evolution of volatile organic compounds (VOCs). The setup consisted of a cylindrical glass chamber with an internal volume of approximately 265 mL (75 mm diameter × 600 mm height). Pure and blended olive oil samples were introduced in fixed aliquots of 100 mL to ensure experimental reproducibility. The sensing unit was positioned directly above the headspace to maximize exposure to the emitted volatiles.
Each measurement session comprised 18 automated adsorption/desorption cycles. During the adsorption phase (60 s), the sensor was exposed to the headspace, allowing VOCs to accumulate on the sensing surface; during the subsequent desorption phase (60 s), the chamber was flushed with ambient air to restore baseline conditions and minimize hysteresis. This cyclic protocol enabled the acquisition of transient response dynamics while avoiding sensor saturation, a feature that distinguishes it from static headspace measurements commonly adopted in other e-nose studies.
The ENS160 gas sensor, integrated in a custom portable device, provided real-time TVOC values (in ppb) over the 18 cycles, generating robust time-series datasets for each sample. This acquisition strategy not only enhanced the clarity and reproducibility of the signals but also created a suitable framework for advanced data processing, such as temporal pattern recognition and the training of machine learning models (e.g., neural networks). Compared with previous works that have mainly relied on steady-state signals or averaged responses, the proposed cyclic approach offers additional analytical depth, paving the way for the development of portable, cost-effective, and data-driven alternatives to traditional laboratory-based GC-MS analysis.
3.2.1. Temporal Response of the Sensors
Figure 7 displays the temporal evolution of total volatile organic compounds (TVOC) for three pure olive oil categories: extra virgin (V_Extra), virgin (V_Virgin), and pomace (V_pomance). The plotted curves represent the TVOC response over time during alternating adsorption and desorption phases. Extra virgin and virgin oils exhibit distinct and reproducible peak patterns, characterized by sharp rises during the adsorption phases followed by gradual descents in the desorption phases. Notably, extra virgin oil consistently produces the highest TVOC amplitudes, while virgin oil follows a slightly lower profile. In contrast, olive pomace oil shows a markedly flattened response, with minimal peak formation and subdued VOC release. This behavior reflects the reduced content of aroma-active volatiles in lower-quality oils, consistent with their known sensory degradation.
Figure 8 extends the analysis to blended samples created by mixing virgin olive oil with 10%, 30%, and 50% olive pomace oil. The cyclic TVOC patterns reveal a clear gradient in signal amplitude and dynamics associated with the degree of adulteration. The 10% blend (blue curve) maintains a peak structure similar to that of pure virgin oil but with slightly diminished intensities. As pomance content increases to 30% (orange curve) and 50% (green curve), the peaks become broader and less pronounced, indicating significant disruption of the volatile profile. These shifts in amplitude and temporal shape confirm the system’s sensitivity to adulteration, even at low levels, and highlight the diagnostic potential of MOX sensor arrays for real-time detection of olive oil authenticity.
3.3. Discrimination of Oil Samples Using a MOX Sensor-Based Device
The use of Principal Component Analysis (PCA) proved to be a particularly effective approach for exploring and visualizing the discriminative capability of the electronic nose based on MOX sensors in recognizing different types of oil and their mixtures. The plot shown (Figure 9) displays the projection of the data obtained from the electronic nose responses along the first principal components, which account for most of the variability within the dataset. This MOX sensor-based analysis was applied to samples of extra virgin olive oil, olive pomace oil, and virgin olive oil, with the aim of highlighting potential differences in the volatile compound profiles among the various oil types.
To complement the two, dimensional projection, a three-dimensional PCA plot was also generated (Figure 10), offering a more detailed visualization of the clustering patterns among the oil samples. This 3D representation allows for a better assessment of the group separation and distribution in multidimensional space.
In this case, Principal Components 1, 2 and 3 explain 97.32%, 17.4%, and 0.43% of the total variance, respectively, indicating that most of the variability in the dataset is captured by the first component alone. Despite the relatively low contribution of PC2 and PC3, their inclusion enhances the spatial perception of class separability and emphasizes subtle differences among samples, particularly within mixtures and borderline cases.
Together, both PCA plots (Figure 8 and Figure 9) illustrate the strong discriminative power of the MOX-based electronic nose in differentiating olive oil categories. The high variance explained by the first component in both the 2D and 3D analyses demonstrates the consistency and reliability of the sensor responses in capturing the key features that distinguish pomance, virgin, and extra virgin oils.
To further explore the potential of the MOX-based electronic nose to detect and classify adulterated olive oils, an additional Principal Component Analysis (PCA) was performed on a dataset including both pure samples and blends in various proportions. Figure 11 presents the two-dimensional PCA projection, where each point corresponds to a sample measurement, and color-coded ellipses represent the different blend combinations and pure categories.
The analysis reveals a well-defined separation between pure oils (extra virgin, virgin, and pomance) and their respective mixtures. The distribution of the samples in the PC1-PC2 plane reflects a gradient in volatile profile composition according to blend ratios. Notably, Principal Component 1 (PC1) explains 82.04% of the total variance, while PC2 accounts for 16.15%, providing a comprehensive representation of the variability within the dataset. The pure extra virgin olive oil samples (green) appear tightly grouped and are clearly distinct from both pomance (purple) and virgin oils (grey).
Blended samples form intermediate clusters depending on the ratio and type of oils used. For instance, the red cluster (30% pomance + 70% extra) and light green cluster (30% pomance + 70% virgin) are located closer to the extra virgin and virgin oil clusters, respectively. The blue and olive-green cluster (10% pomance + 90% extra / virgin) are more centrally positioned, while the light purple, orange, and brown clusters (50% blends) are placed further away from the pure groups, indicating greater divergence in the volatile profiles. The confidence ellipses illustrate good internal consistency within each group and limited overlap, confirming the system`s sensitivity to subtle changes in composition.
To provide a more nuanced visualization of these complex relationships, a three-dimensional PCA plot was constructed (Figure 12). The inclusion of Principal Component 3 (PC3) which accounts for 1.09% of t he variance, enriches the interpretation by revealing spatial patterns and separations not evident in the 2D representation. The 3D plot maintains the separation among pure and blended oils, further reinforcing the electronic nose`s capability to distinguish not only between different oil categories but also between subtle blend proportions.
3.4. Multilayer Perceptron Analysis
In the Figure 13, shows the confusion matrix obtained for the neuronal network model trained to classify olive oils into three categories: pomance, virgin, and extra virgin. The model achieved an overall accuracy of 84.62%, with perfect classification of olive pomace oil, partial misclassification of extra virgin oils as virgin, and correct classification of virgin samples. These results suggest that while the model robustly identifies olive pomace oil, the classification between extra virgin and virgin oils is more challenging due to their compositional similarity.
The Figure 14 display the evolution of the loss and accuracy during training. As shown in the loss curve, both training and validation loss decrease significantly over the epochs, with the training loss reaching values near 0.2 after 500 epochs. In parallel, training and validation accuracy gradually increase, stabilizing above 90% in the final stages, confirming the convergence and generalization capability of the model.
To further assess the similarity among the oil samples, Figure 15 presents the hierarchical clustering dendrogram. A clear separation between pomance and the other two categories is observed, supporting the findings from PCA and classification results. Extra virgin and virgin oils form distinct subclusters, but with closer proximity, reflecting their overlapping volatile profile.
In Figure 16 and Figure 17, the connection weights of the neuronal network are visualized. Figure 16 shows the weights between the input features (〖eCO〗_2, TVOC, R1, R3, R4) and he first hidden layer. This representation highlights the relative contribution of each sensor to the activation of neurons in the network. For instance, strong positive weights are observed from〖eCO〗_2 and TVOC to neurons N9, N11, and N12, suggesting their relevance in oil type discrimination.
Figure 16 presents the weights from the hidden neurons to the output’s classes (V_Virgin, V_Extra, V_Pomance). Neuron N3 contributes most strongly to the classification of olive pomace oil, while neurons N12, N13, and N2 exhibit higher weights for extra virgin. For the virgin class, important contributions come from neurons N1 and N19. These patterns provide insight into how the network internally represents the decision boundaries between oil categories.
Figure 18 shows the confusion matrix corresponding to the classification of pure and adulterated olive ol samples using the MOX-based electronic nose. The model was trained with 500 epochs and includes 10 distinct classes: pure extra virgin, virgin, and olive pomace oil, as well as binary mixtures adulterated with 10%, 30%, and 50% olive pomace oil. The model achieved an overall accuracy of 77.14%, correctly classifying most pure samples (e.g., extra virgin and pomance) and several of the blended classes. Misclassification primarily occurred among blends with low pomance content (e.g., 10% or 30%), likely due to their similar volatile profiles.
Figure 19 displays the evolution of the training and validation loss (left) and accuracy (right) over the course of 500 training epochs. As observed, both training and validation loss steadily decrease with increasing epochs, while the accuracy curves show a gradual increase and stabilization beyond 400 epochs. The model converges with training accuracy close to 99% and validation accuracy stabilizing around 87% indicating good generalization performance despite the increased number of output classes.
To better understand sample similarities, Figure 20 shows a hierarchical clustering dendrogram generated from the learned features. The pure oil samples form well-defined and coherent clusters, while blended samples are grouped in intermediate positions, reflecting their compositional nature. Notably, mixtures with 50% pomance (such as V_Pomance_Extra and V_Pomance_Virgin) are positioned closer to the pomance cluster, suggesting that even moderate adulteration levels significantly alter the volatile profile.
Figure 21 and Figure 22 provide an interpretation of the model’s internal behaviour by showing the weight matrices of the fully connected layers. Figure X+3 represents the learned weights between the input variables (CO₂, R3, R1, and TVOC) and the neurons in the first hidden layer. Distinct activation patterns emerge for each variable across the 40 hidden neurons, with several neurons showing high positive or negative contributions depending on the input signal. In particular, neurons such as N6, N13, and N33 appear to be strongly activated by combinations of eCO₂ and R3, which are likely crucial in discriminating among pomance and extra virgin profiles.
Figure 22 shows the weights connecting hidden neurons to the final output classes. Here, the importance of specific neurons for oil classes can be visualized. For example, neurons N1, N6, and N19 exhibit strong positive or negative weights for the pomance-related classes, while neurons like N0 and N20 contribute more heavily to predicting extra virgin or its blends. This representation confirms that the network has learned to associate different patterns of sensor responses with specific oil types and blend ratios.
4. Conclusion
The results obtained confirm the effectiveness of the electronic nose in distinguishing between different types of olive oil, demonstrating its ability to detect significant variations in volatile profiles. The comparison with GC-MS data highlighted a strong coherence between the olfactory fingerprints and the chemical profiles, reinforcing the potential of the MOX-based system as a rapid and non-destructive tool for quality control. The integration of advanced chemometric analyses, such as PCA, further enhances the discriminative capabilities of the electronic nose, paving the way for the development of reliable predictive models for oil authentication. These findings underscore the importance of an integrated analytical approach to ensure the protection of authenticity and the enhancement of quality, particularly for certified products such as PDO olive oils. The adoption of innovative and complementary technologies represents a key step in addressing current challenges in the sector, promoting more efficient, sustainable, and transparent control systems to the benefit of both the industry and consumers. Future work will focus on the implementation of in-line monitoring systems, the development of IoT-enabled devices, and the application of real-time detection strategies, aiming to facilitate the integration of MOX-based sensing technologies into industrial production chains.
Author Contributions
Conceptualization, E.P., R.S., E.N.C., V.S. A.B. and J.L.; methodology, E.P., R.S., A.B. and J.L. software, J.L., A.B.; validation, E.P., R.S. and J.L.; formal analysis, E.P. and R.S.; investigation, E.P., R.S. and A.B.; resources, R.S. and J.L.; data curation, E.P., R.S. and A.B.; writing—original draft preparation, E.P., R.S., E.N.C., V.S., A.B. and J.L.; writing—review and editing, E.P., R.S., E.N.C., V.S., A.B. and J.L.; visualization, E.P., R.S., E.N.C., V.S., A.B. and J.L.; supervision, R.S.; project administration, R.S.; funding acquisition, R.S. All authors have read and agreed to the published version of the manuscript.
Funding
This research was funded by the NECA project (Development of new electronic nose prototypes and analysis with artificial intelligence neural networks for food quality monitoring), funded by the Junta de Extremadura. The project is part of the Operational Programme FEDER Extremadura 2021–2027, Action 1A1103 (Development of scientific research, technological development, and innovation capacity), co-financed by the European Regional Development Fund (ERDF) at 85%.
Institutional Review Board Statement
Not applicable
Informed Consent Statement
Not applicable
Data Availability Statement
Data is contained within the article
Acknowledgments
The authors would like to thank the technical staff of CICYTEX–INTAEX and the School of Industrial Engineering of the University of Extremadura for their support in sample handling, laboratory analyses, and the development of the prototype used in this study. The authors are also grateful to Nano Sensor Systems srl (NASYS) and the Università degli Studi di Modena e Reggio Emilia (Italy) for the discussions on MOX sensor technology and for the technical support provided during the design and optimization of the electronic nose system used in this work. This study was carried out within the framework of the NECA project (Development of new electronic nose prototypes and analysis with artificial intelligence neural networks for food quality monitoring), funded by the Regional Government of Extremadura and co-financed by the European Regional Development Fund (ERDF).
Conflicts of Interest
The authors declare no conflicts of interest.
References
- Borzì, A.M.; Biondi, A.; Basile, F.; Luca, S.; Vicari, E.S.D.; Vacante, M. Olive oil effects on colorectal cancer. Nutrients 2019, 11, 32. [Google Scholar] [CrossRef] [PubMed]
- Tomé-Carneiro, J.; Crespo, M.C.; López de Las Hazas, M.C.; Visioli, F.; Dávalos, A. Olive oil consumption and its repercussions on lipid metabolism. Nutr. Rev. 2020, 78, 952–968. [Google Scholar] [CrossRef] [PubMed]
- Gorzynik-Debicka, M.; Przychodzen, P.; Cappello, F.; Kuban-Jankowska, A.; Marino Gammazza, A.; Knap, N.; Wozniak, M.; Gorska-Ponikowska, M. Potential health benefits of olive oil and plant polyphenols. Int. J. Mol. Sci. 2018, 19, 686. [Google Scholar] [CrossRef]
- Yubero-Serrano, E.M.; Lopez-Moreno, J.; Gomez-Delgado, F.; Lopez-Miranda, J. Extra virgin olive oil: More than a healthy fat. Eur. J. Clin. Nutr. 2019, 72 (Suppl 1), 8–17. [Google Scholar] [CrossRef]
- Salis, C.; Papageorgiou, L.; Papakonstantinou, E.; Hagidimitriou, M.; Vlachakis, D. Olive oil polyphenols in neurodegenerative pathologies. Adv. Exp. Med. Biol. 2020, 1195, 77–91. [Google Scholar] [CrossRef] [PubMed]
- Dias, C.; Mendes, L. Protected designation of origin (PDO), protected geographical indication (PGI) and traditional speciality guaranteed (TSG): A bibliometric analysis. Food Res. Int. 2018, 103, 492–508. [Google Scholar] [CrossRef]
- Tarapoulouzi, M.; Agriopoulou, S.; Koidis, A.; Proestos, C.; El Enshasy, H.A.; Varzakas, T. Recent advances in analytical methods for the detection of olive oil oxidation status during storage along with chemometrics, authenticity and fraud studies. Biomolecules 2022, 12, 1180. [Google Scholar] [CrossRef]
- Zarezadeh, M.R.; Aboonajmi, M.; Ghasemi Varnamkhasti, M. Fraud detection and quality assessment of olive oil using ultrasound. Food Sci. Nutr. 2021, 9, 180–189. [Google Scholar] [CrossRef]
- Rocchi, R.; Mascini, M.; Faberi, A.; Sergi, M.; Compagnone, D.; Di Martino, V.; Carradori, S.; Pittia, P. Comparison of IRMS, GC-MS and E-nose data for the discrimination of saffron samples with different origin, process and age. Molecules 2019, 24, 4112. [Google Scholar] [CrossRef]
- Ziółkowska, A.; Wąsowicz, E.; Jeleń, H.H. Differentiation of wines according to grape variety and geographical origin based on volatiles profiling using SPME-MS and SPME-GC/MS methods. Food Chem. 2016, 213, 714–720. [Google Scholar] [CrossRef]
- Olmo-García, L.; Polari, J.J.; Li, X.; Bajoub, A.; Fernández-Gutiérrez, A.; Wang, S.C.; Carrasco-Pancorbo, A. Study of the minor fraction of virgin olive oil by a multi-class GC-MS approach: Comprehensive quantitative characterization and varietal discrimination potential. Food Res. Int. 2019, 125, 108649. [Google Scholar] [CrossRef]
- García-González, D.L.; Morales, M.T.; Aparicio, R. Olive and olive oil. In Handbook of Olive Oil: Analysis and Properties; Hui, Y.H., Ed.; John Wiley & Sons: Hoboken, NJ, USA, 2010; Chapter 43. [Google Scholar] [CrossRef]
- Sales, C.; Portolés, T.; Johnsen, L.G.; Danielsen, M.; Beltran, J. Classification of olive oil quality and organoleptic attributes by untargeted GC-MS and multivariate statistical analysis. Food Chem. 2019, 271, 488–496. [Google Scholar] [CrossRef] [PubMed]
- Aparicio-Ruiz, R.; García-González, D.L.; Morales, M.T.; Lobo-Prieto, A.; Romero, I. Comparison of two validated analytical methods for the determination of volatile compounds in extra virgin olive oil: GC-FID vs. GC-MS. Talanta 2018, 187, 133–141. [Google Scholar] [CrossRef] [PubMed]
- Poeta, E.; Núñez-Carmona, E.; Sberveglieri, V. A review: Applications of MOX sensors from air quality monitoring to biomedical diagnosis and agro-food quality control. J. Sens. Actuator Netw. 2025, 14, 50. [Google Scholar] [CrossRef]
- Poeta, E.; de Chiara, M.L.V.; Cefola, M.; Caruso, I.; Genzardi, D.; Núñez-Carmona, E.; Pace, B.; Palumbo, M.; Sberveglieri, V. Quality monitoring of table grapes stored in controlled atmosphere using an S3+ MOS nanosensor device. Postharvest Biol. Technol. 2025, 227, 113587. [Google Scholar] [CrossRef]
- Abbatangelo, M.; Núñez-Carmona, E.; Duina, G.; Sberveglieri, V. Multidisciplinary approach to characterizing the fingerprint of Italian EVOO. Molecules 2019, 24, 1457. [Google Scholar] [CrossRef]
- Mariotti, R.; Núñez-Carmona, E.; Genzardi, D.; Pandolfi, S.; Sberveglieri, V.; Mousavi, S. Volatile olfactory profiles of Umbrian extra virgin olive oils and their discrimination through MOX chemical sensors. Sensors 2022, 22, 7164. [Google Scholar] [CrossRef]
- Kiritsakis, A.; Markakis, P. Olive oil: A review. Adv. Food Res. 1988, 31, 453–482. [Google Scholar]
- Bulatović, S.; Ilić, M.; Šolević Knudsen, T.; Milić, J.; Pucarević, M.; Jovančićević, B.; Vrvić, M.M. Evaluation of potential human health risks from exposure to volatile organic compounds in contaminated urban groundwater in the Sava River aquifer, Belgrade, Serbia. Environ. Geochem. Health 2022, 44, 3451–3472. [Google Scholar] [CrossRef]
- Yang, J.; Wang, P.; Neumann, H.; Jackstell, R.; Beller, M. Industrially applied and relevant transformations of 1,3-butadiene using homogeneous catalysts. Ind. Chem. Mater. 2023, 1, 155–174. [Google Scholar] [CrossRef]
- Zhao, C.; He, J.; Lemonidou, A.A.; Li, X.; Lercher, J.A. Aqueous-phase hydrodeoxygenation of bio-derived phenols to cycloalkanes. J. Catal. 2011, 280, 8–16. [Google Scholar] [CrossRef]
- National Center for Biotechnology Information. Nonane—Compound summary. PubChem Compound. Available online: https://pubchem.ncbi.nlm.nih.gov/compound/nonane.
- Cilia, G.; Flaminio, S.; Quaranta, M. A novel and non-invasive method for DNA extraction from dry bee specimens. Sci. Rep. 2022, 12, 11679. [Google Scholar] [CrossRef]
- Fritz, K.; Salavastru, C.; Eren, S.; et al. Einfluss von Diabetes auf ästhetische Eingriffe. Dermatologie 2025, 76, 15–20. [Google Scholar] [CrossRef] [PubMed]
- Siegel, H.; Eggersdorfer, M. Ketones. In Ullmann’s Encyclopedia of Industrial Chemistry; Wiley-VCH: Weinheim, Germany, 2000. [Google Scholar] [CrossRef]
- Hernández, D.; Astudillo, C.A.; Fernández-Palacios, E.; Cataldo, F.; Tenreiro, C.; Gabriel, D. Evolution of physico-chemical parameters, microbial diversity and VOC emissions of olive oil mill waste exposed to ambient conditions in open reservoirs. Waste Manag. 2018, 79, 501–509. [Google Scholar] [CrossRef] [PubMed]
- The Good Scents Company. Flavor and fragrance information catalog. The Good Scents Company Database 2009. Available online: http://www.thegoodscentscompany.com/data/rw1042361.html.
- Cserháti, T.; Forgács, E. Flavor (flavour) compounds: Structures and characteristics. In Encyclopedia of Food Sciences and Nutrition, 2nd ed.; Elsevier Science: Amsterdam, The Netherlands, 2003; pp. 2509–2517. [Google Scholar]
- Üçüncüoğlu, D.; Sivri-Özay, D. Geographical origin impact on volatile composition and some quality parameters of virgin olive oils extracted from the “Ayvalık” variety. Heliyon 2020, 6, e05011. [Google Scholar] [CrossRef] [PubMed]
- Wang, Y.; Hua, L.; Fu, Q.; Wu, C.; Zhang, C.; Li, H.; Xu, G.; Ni, Q.; Zhang, Y. Rapid identification of adulteration in extra virgin olive oil via dynamic headspace sampling and high-pressure photoionization time-of-flight mass spectrometry. J. Agric. Food Chem. 2022, 70, 6775–6784. [Google Scholar] [CrossRef]
- Boffa, L.; Binello, A.; Cravotto, G. Efficient capture of cannabis terpenes in olive oil during microwave-assisted cannabinoid decarboxylation. Molecules 2024, 29, 899. [Google Scholar] [CrossRef]
- Sorption of ethyl butyrate and octanal constituents of orange essence by polymeric adsorbents. [da verificare: mancano autori, testata, anno e pagine].
- Ziqiang, C.; Mingtao, M.; Xingguang, C.; Zhengcong, P.; Hua, L.; Jian, L.; Dianhui, W. Characterization of volatile compound differences of Shaoxing Huangjiu aged for different years using GC-E-nose, GC–MS, and GC-IMS. Eur. Food Res. Technol. 2025, 251, 269–282. [Google Scholar] [CrossRef]
- The Good Scents Company. Ethyl isovalerate. The Good Scents Company Database. Available online: http://www.thegoodscentscompany.com.
- Gokbulut, I.; Karabulut, I. SPME–GC–MS detection of volatile compounds in apricot varieties. Food Chem. 2012, 132, 1098–1102. [Google Scholar] [CrossRef]
- Park, E.-R.; Lee, H.-J.; Kim, K.-S. Volatile flavor components in Bogyojosaeng and Suhong cultivars of strawberry (Fragaria ananassa Duch.). Prev. Nutr. Food Sci. 2000, 5, 119–125. [Google Scholar]
- Boch, R.; Shearer, D.A.; Stone, B.C. Identification of isoamyl acetate as an active component in the sting pheromone of the honey bee. Nature 1962, 195, 1018–1020. [Google Scholar] [CrossRef]
- Gopalakrishnan, A.V.; Singh, P.K.; Krishnan, N.; et al. Characterization of phytoconstituents of vital herbal oils by GC–MS and LC–MS/MS and their bioactivities. J. Food Sci. Technol. 2024, 61, 148–159. [Google Scholar] [CrossRef]
- Cui, Y.; Zhu, L.; Shang, H.; Xuan, X.; Lin, X. Effects of combined ε-polylysine and high hydrostatic pressure treatment on microbial qualities, physicochemical properties, taste, and volatile flavor profile of large yellow croaker (Larimichthys crocea). Food Bioprocess Technol. 2025, 18, 3610–3627. [Google Scholar] [CrossRef]
- Konoz, E.; Paraster, H.; Moazeni, R. Analysis of olive fruit essential oil: Application of gas chromatography–mass spectrometry combined with chemometrics. Int. J. Food Prop. 2015, 18, 316–331. [Google Scholar] [CrossRef]
- Burdock, G.A. Fenaroli’s Handbook of Flavor Ingredients, 5th ed.; CRC Press: Boca Raton, FL, USA, 2005; ISBN 0-8493-3034-3. [Google Scholar]
- Hirai, M.; Ota, Y.; Ito, M. Diversity in principal constituents of plants with a lemony scent and the predominance of citral. J. Nat. Med. 2022, 76, 254–258. [Google Scholar] [CrossRef]
- Wilson, C.; Davies, N.; Corkrey, R.; Wilson, A.J.; Mathews, A.M.; Westmore, G.C. ROC curve analysis links volatile organic compounds in potato foliage to thrips preference, cultivar and plant age. PLoS ONE 2017, 12, e0181831. [Google Scholar] [CrossRef] [PubMed]
- Thang, T.D.; Dai, D.O.; Hoi, T.M.; Ogunwande, I.A. Essential oils from five species of Annonaceae from Vietnam. Nat. Prod. Commun. 2013, 8, 1934578X1300800228. [Google Scholar] [CrossRef]
- Weissermel, K.; Arpe, H.-J.; Lindley, C.R. Industrial Organic Chemistry, 4th ed.; Wiley-VCH: Weinheim, Germany, 2003; pp. 341–344. ISBN 3-527-30578-5. [Google Scholar]
- Gómez, E.; Ledbetter, C.A. Comparative study of the aromatic profiles of two different plum species: Prunus salicina Lindl. and Prunus simonii L. J. Sci. Food Agric. 1994, 65, 111–115. [Google Scholar] [CrossRef]
- Kohlpaintner, C.; Schulte, M.; Falbe, J.; Lappe, P.; Weber, J. Aldehydes, aliphatic. In Ullmann’s Encyclopedia of Industrial Chemistry; Wiley-VCH: Weinheim, Germany, 2011. [Google Scholar] [CrossRef]
- Pham, D.L.; Ito, Y.; Yamasaki, M. Response of the oak ambrosia beetle Platypus quercivorus (Coleoptera: Platypodinae) to volatiles from fresh and dried leaves. Arthropod-Plant Interact. 2025, 19, 5. [Google Scholar] [CrossRef]
- Barta, T.; Monsempès, C.; Demondion, E.; Chatterjee, A.; Kostal, L.; Lucas, P. Stimulus duration encoding occurs early in the moth olfactory pathway. Commun. Biol. 2024, 7, 1252. [Google Scholar] [CrossRef]
- National Center for Biotechnology Information. 6-Methyl-5-hepten-2-one. PubChem. Available online: https://pubchem.ncbi.nlm.nih.gov/compound/6-Methyl-5-hepten-2-one.
- Dourou, A.M.; Brizzolara, S.; Famiani, F.; Tonutti, P. Changes in volatile organic composition of olive oil extracted from cv. 'Leccino' fruit subjected to ethylene treatments at different ripening stages. J. Sci. Food Agric. 2021, 101, 3981–3986. [Google Scholar] [CrossRef]
- McRae, J.F.; Mainland, J.D.; Jaeger, S.R.; Adipietro, K.A.; Matsunami, H.; Newcomb, R.D. Genetic variation in the odorant receptor OR2J3 is associated with the ability to detect the “grassy” smelling odor, cis-3-hexen-1-ol. Chem. Senses 2012, 37, 585–593. [Google Scholar] [CrossRef] [PubMed]
- Adiani, V.; Ambolikar, R.; Gupta, S. Utilization of gamma irradiation for development of shelf-stable mint coriander sauce. Food Meas. 2025, 19, 328–340. [Google Scholar] [CrossRef]
- IUPAC. Nomenclature of Organic Chemistry: IUPAC Recommendations and Preferred Names 2013 (Blue Book); The Royal Society of Chemistry: Cambridge, UK, 2014; p. 745. ISBN 978-0-85404-182-4. [Google Scholar] [CrossRef]
- Raymer, R.; Jessa, S.M.; Cooper, W.J.; Olson, M.B. The effects of diatom polyunsaturated aldehydes on embryonic and larval zebrafish (Danio rerio). Ecotoxicology 2025, 34, 292–303. [Google Scholar] [CrossRef] [PubMed]
- Hieu, L.D.; et al. Chemical composition of essential oils from four Vietnamese species of Piper (Piperaceae). J. Oleo Sci. 2014, 63, 211–217. [Google Scholar] [CrossRef]
- Dai, J.-Y.; Zhao, P.; Cheng, X.-L.; Xiu, Z.-L. Enhanced production of 2,3-butanediol from sugarcane molasses. Appl. Biochem. Biotechnol. 2015, 175, 3014–3024. [Google Scholar] [CrossRef]
- Bloch, D.R. Organic Chemistry Demystified; McGraw-Hill: New York, NY, USA, 2006; p. 359. ISBN 0-07-148710-7. [Google Scholar]
- De Conti, A.; Tryndyak, V.; Koturbash, I.; Heidor, R.; Kuroiwa-Trzmielina, J.; Ong, T.P.; Beland, F.A.; Moreno, F.S.; Pogribny, I.P. The chemopreventive activity of the butyric acid prodrug tributyrin in experimental rat hepatocarcinogenesis is associated with p53 acetylation and activation of the p53 apoptotic signaling pathway. Carcinogenesis 2013, 34, 172–180. [Google Scholar] [CrossRef]
- Mostafa, S.; Wang, Y.; Zeng, W. Floral scents and fruit aromas: Functions, compositions, biosynthesis, and regulation. Front. Plant Sci. 2022, 13, 860157. [Google Scholar] [CrossRef]
- Callaway, E. Soapy taste of coriander linked to genetic variants. Nature 2012, 486, 7. [Google Scholar] [CrossRef]
- Basu, S.; Clark, R.E.; Fu, Z.; Lee, B.W.; Crowder, D.W. Insect alarm pheromones in response to predators: Ecological trade-offs and molecular mechanisms. Insect Biochem. Mol. Biol. 2021, 128, 103514. [Google Scholar] [CrossRef] [PubMed]
- Zhao, L.; Pan, X.; Shi, J.; Ye, H.; Guan, H.; Guo, Y.; Zhong, J.-J. Formation of urocanic acid versus histamine from histidine in chub mackerel (Scomber japonicus) fillets as determined by a mixed-mode HPLC method. J. Food Compos. Anal. 2025, 142, 107431. [Google Scholar] [CrossRef]
- Shen, Y.; Bai, X.; Wang, J.; Zhou, X.; Meng, R.; Guo, N. Inhibitory effect of non-Saccharomyces Starmerella bacillaris CC-PT4 isolated from grape on MRSA growth and biofilm. Probiotics Antimicrob. Proteins 2025, 17, 227–239. [Google Scholar] [CrossRef]
- Gamal, M.; Awad, M.A.; Shadidizaji, A.; Ibrahim, M.A.; Ghoneim, M.A.; Warda, M. In vivo and in silico insights into the antidiabetic efficacy of EVOO and hydroxytyrosol in a rat model. J. Nutr. Biochem. 2025, 135, 109775. [Google Scholar] [CrossRef] [PubMed]
- Aprea, E.; Gasperi, F.; Betta, E.; Sani, G.; Cantini, C. Variability in volatile compounds from lipoxygenase pathway in extra virgin olive oils from Tuscan olive germplasm by quantitative SPME/GC-MS. J. Mass Spectrom. 2018, 53, 824–832. [Google Scholar] [CrossRef]
- Procida, G.; Cichelli, A.; Lagazio, C.; Conte, L.S. Relationships between volatile compounds and sensory characteristics in virgin olive oil by analytical and chemometric approaches. J. Sci. Food Agric. 2016, 96, 311–318. [Google Scholar] [CrossRef]
- Reboredo-Rodríguez, P.; González-Barreiro, C.; Cancho-Grande, B.; Simal-Gándara, J. Aroma biogenesis and distribution between olive pulps and seeds with identification of aroma trends among cultivars. Food Chem. 2013, 141, 637–643. [Google Scholar] [CrossRef]
- García-Vico, L.; Belaj, A.; Sánchez-Ortiz, A.; Martínez-Rivas, J.M.; Pérez, A.G.; Sanz, C. Volatile compound profiling by HS-SPME/GC-MS-FID of a core olive cultivar collection as a tool for aroma improvement of virgin olive oil. Molecules 2017, 22, 141. [Google Scholar] [CrossRef]
- Jimenez-Lopez, C.; Carpena, M.; Lourenço-Lopes, C.; Gallardo-Gomez, M.; Lorenzo, J.M.; Barba, F.J.; Pietro, M.A.; Simal-Gandara, J. Bioactive compounds and quality of extra virgin olive oil. Foods 2020, 9, 1014. [Google Scholar] [CrossRef] [PubMed]
- Garcia-Oliveira, P.; Jimenez-Lopez, C.; Lourenço-Lopes, C.; Chamorro, F.; Pereira, A.G.; Carrera-Casais, A.; Fraga-Corral, M.; Carpena, M.; Simal-Gandara, J.; Prieto, M.A. Evolution of flavors in extra virgin olive oil shelf-life. Antioxidants 2021, 10, 368. [Google Scholar] [CrossRef] [PubMed]
- Estruch, R.; Ros, E.; Salas-Salvadó, J.; Covas, M.I.; Corella, D.; Arós, F.; Gómez-Gracia, E.; Ruiz-Gutiérrez, V.; Fiol, M.; Lapetra, J.; et al. Primary prevention of cardiovascular disease with a Mediterranean diet supplemented with extra-virgin olive oil or nuts. N. Engl. J. Med. 2018, 378, e34. [Google Scholar] [CrossRef]
Figure 1.
Analysis of oil samples using an electronic nose.
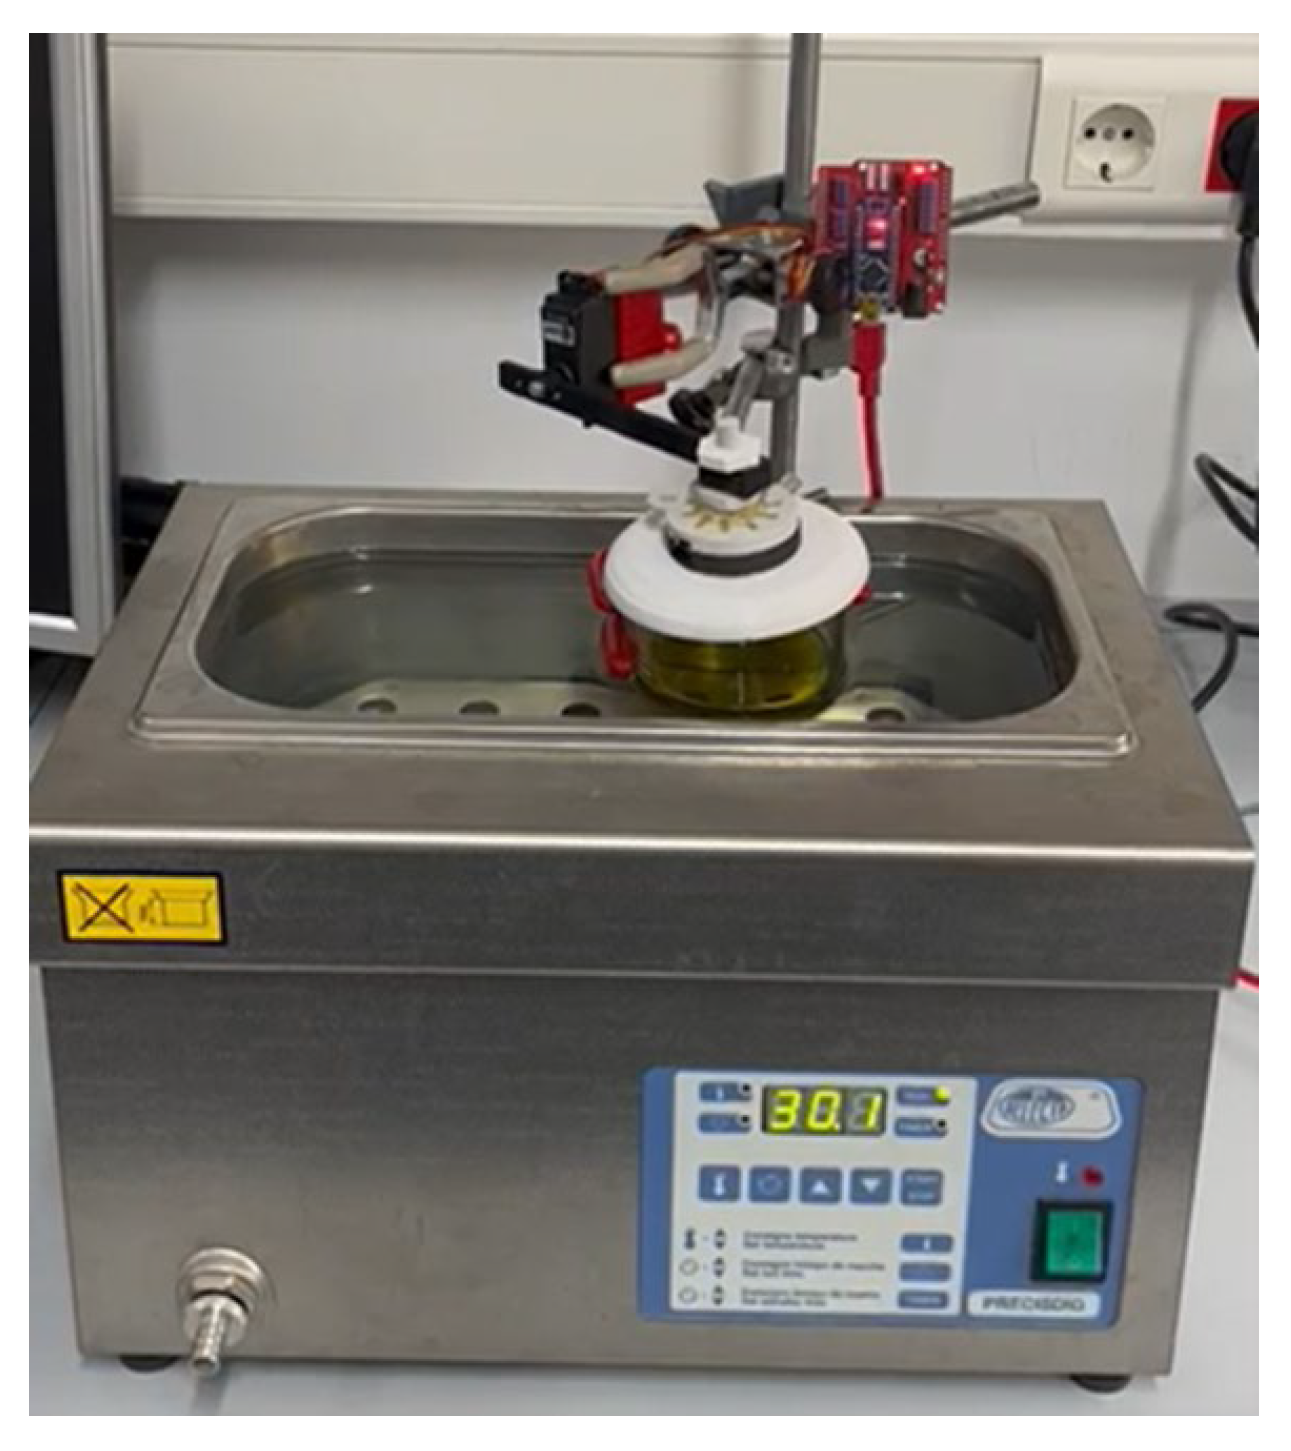
Figure 2.
Block diagram of the device.
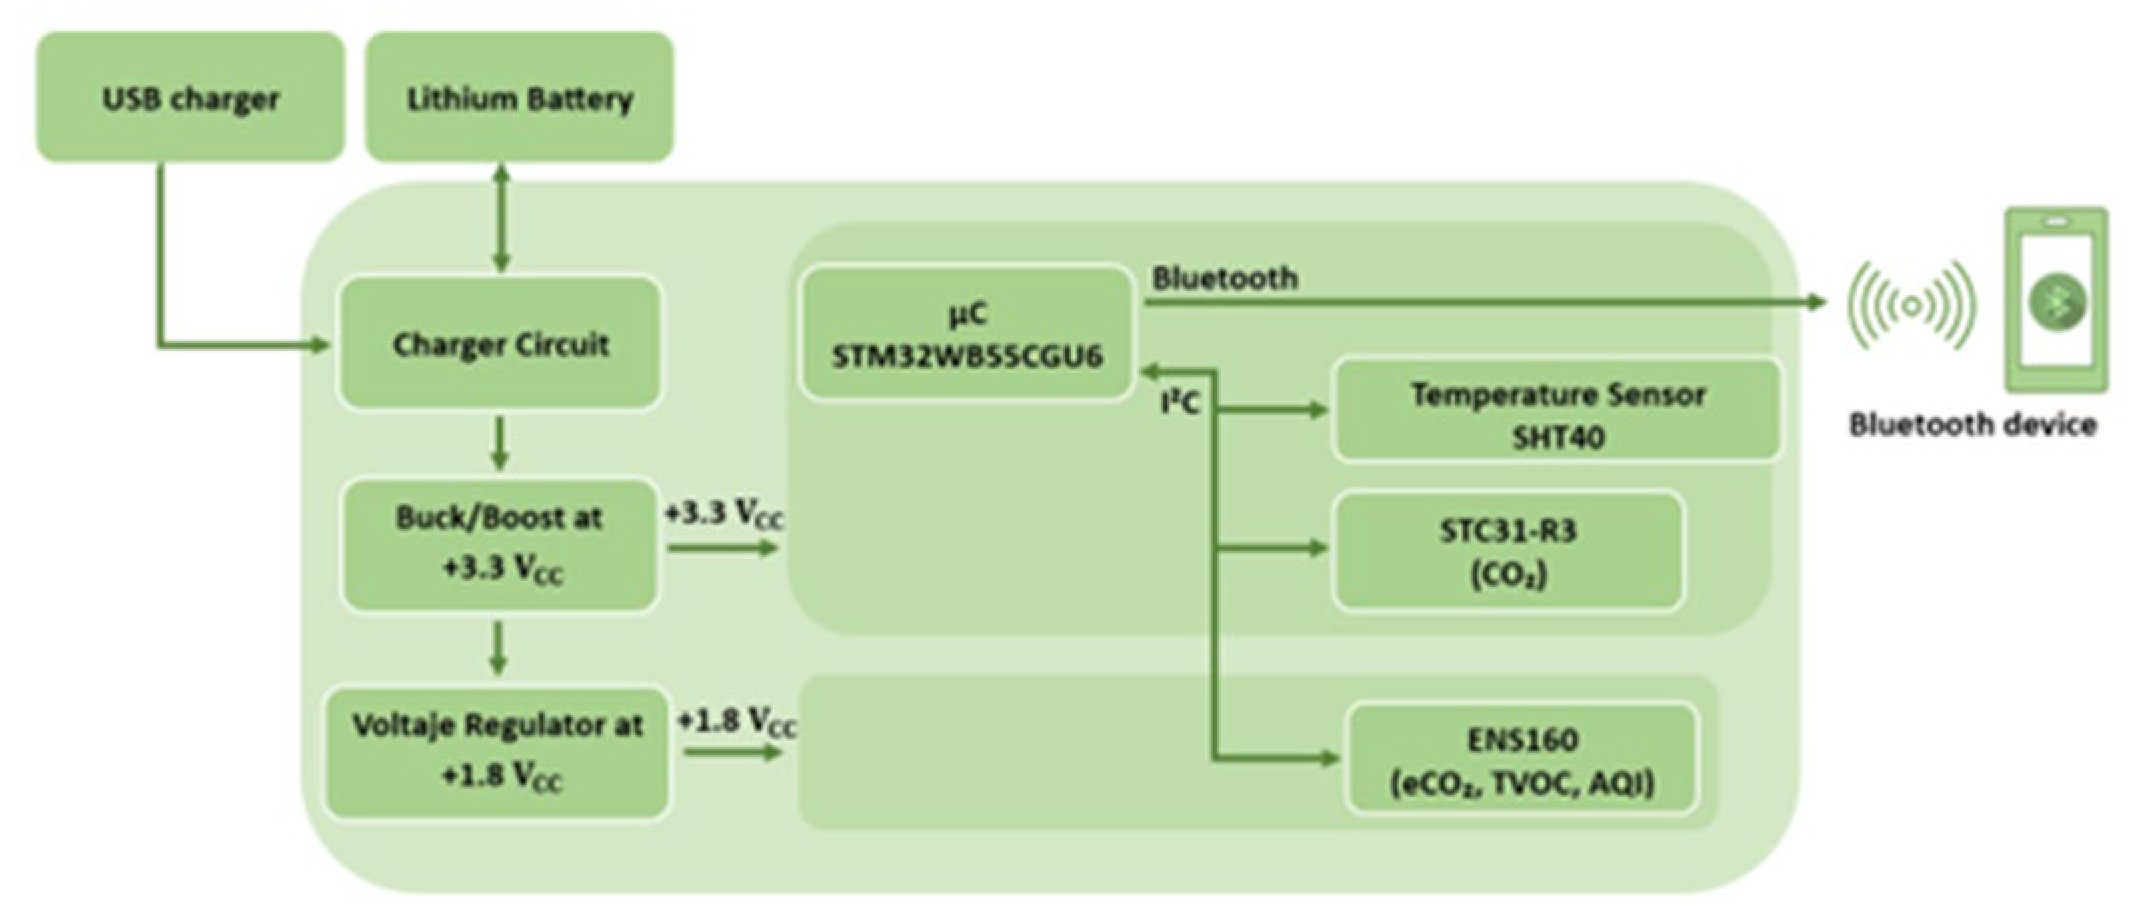
Figure 3.
Electronic board (left) and case (right).
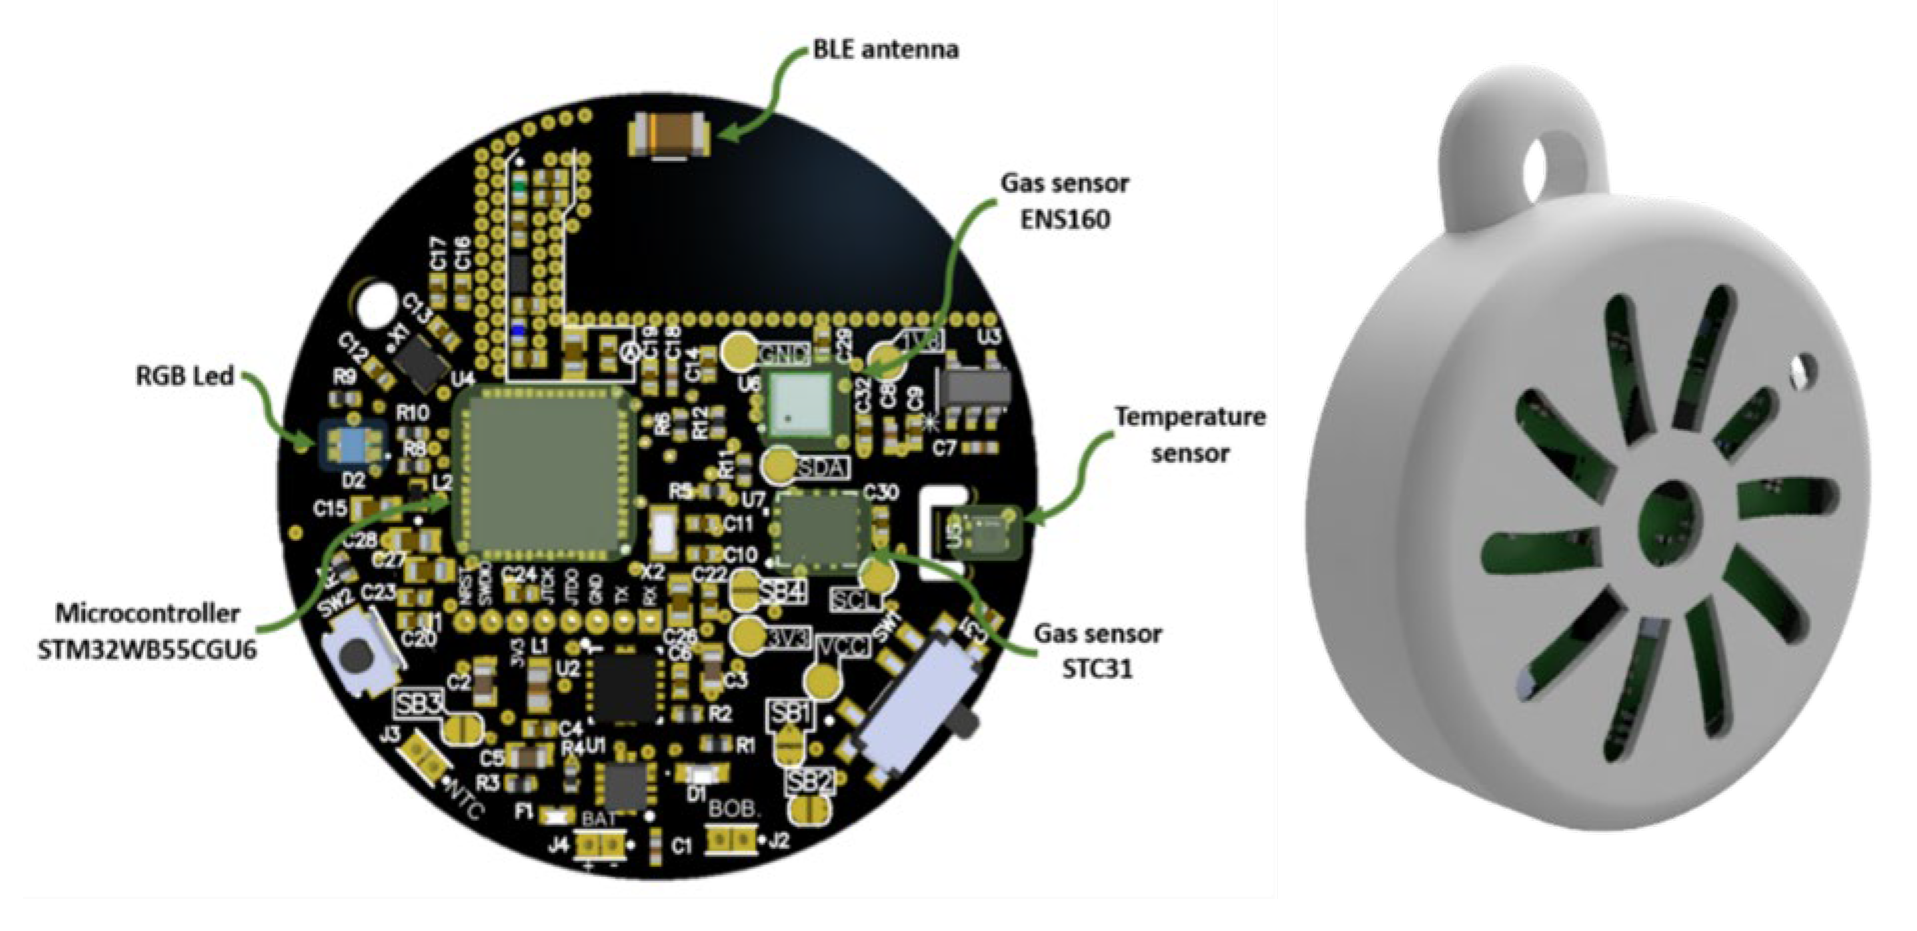
Figure 4.
Chemical classes of extra virgin olive oil (EVOO), virgin olive oil (OO), and olive pomace oil (POO) samples analyzed by gas chromatography–mass spectrometry (GC–MS).
Figure 4.
Chemical classes of extra virgin olive oil (EVOO), virgin olive oil (OO), and olive pomace oil (POO) samples analyzed by gas chromatography–mass spectrometry (GC–MS).
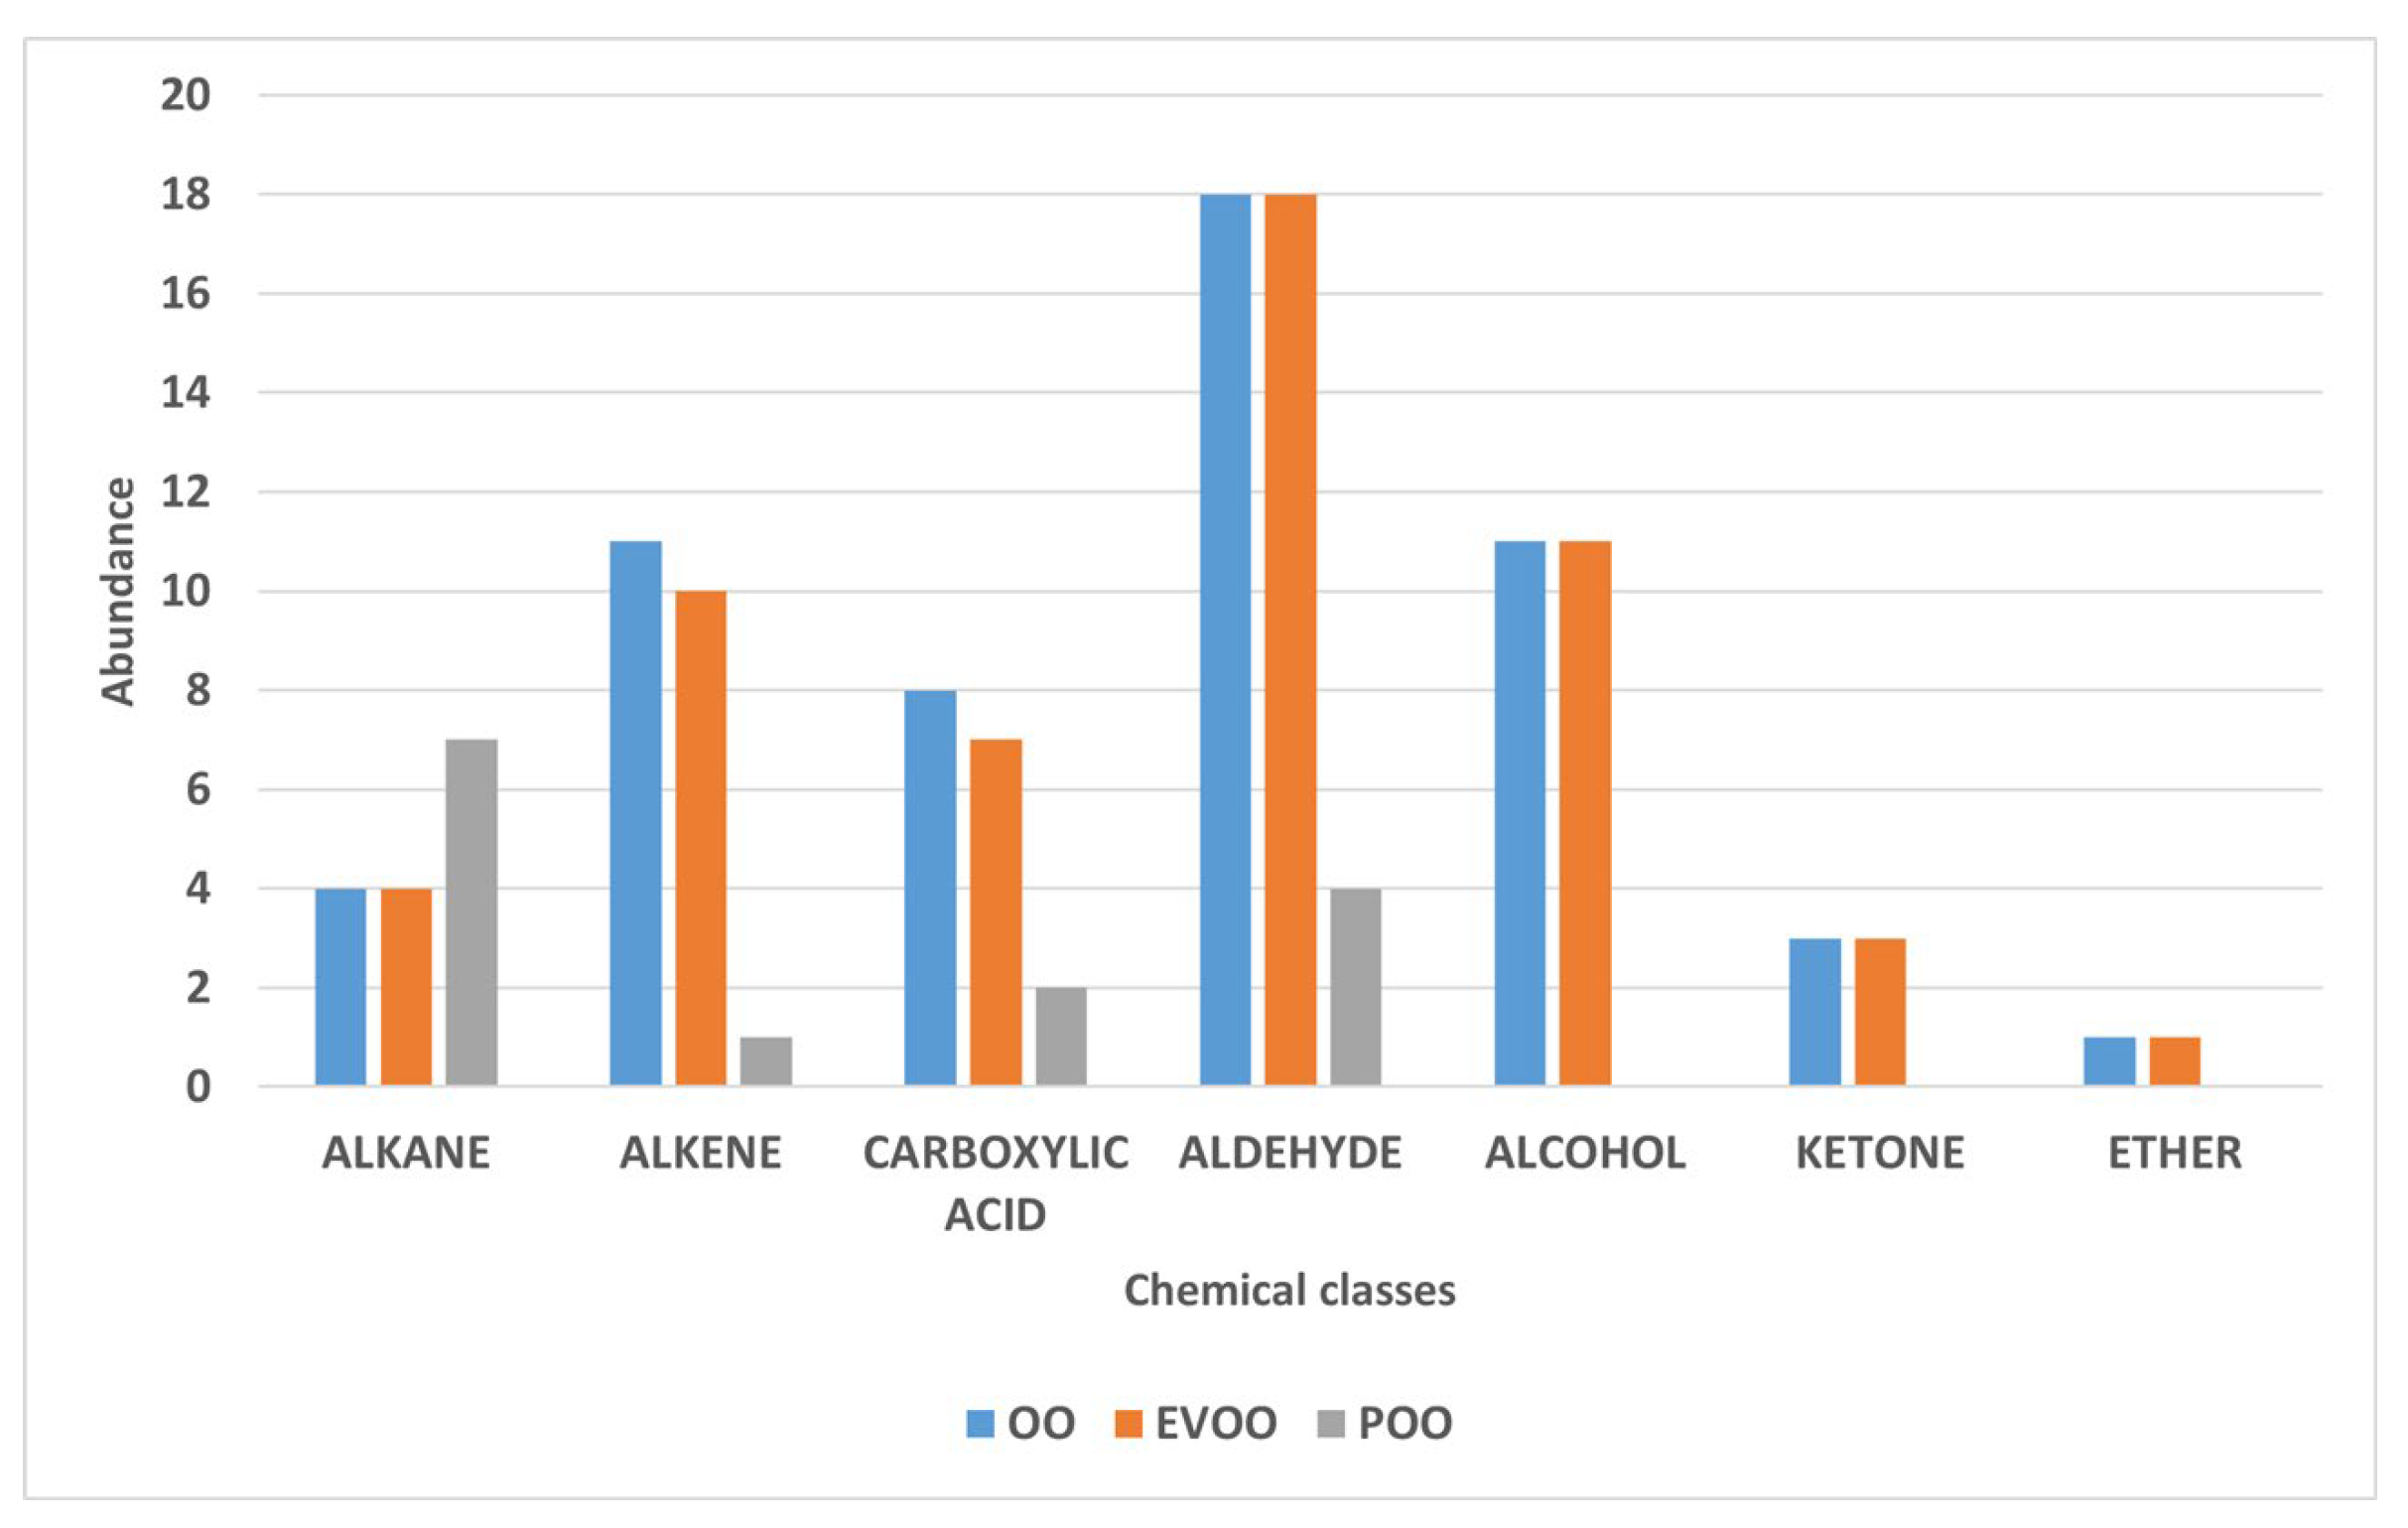
Figure 5.
Total ion chromatograms (TIC) obtained by GC-MS analysis coupled with SPME of OO (A), EVOO (B), and POO (C) samples. The x-axis represents the retention time (min), while the y-axis indicates the relative abundance of the detected volatile compounds.
Figure 5.
Total ion chromatograms (TIC) obtained by GC-MS analysis coupled with SPME of OO (A), EVOO (B), and POO (C) samples. The x-axis represents the retention time (min), while the y-axis indicates the relative abundance of the detected volatile compounds.
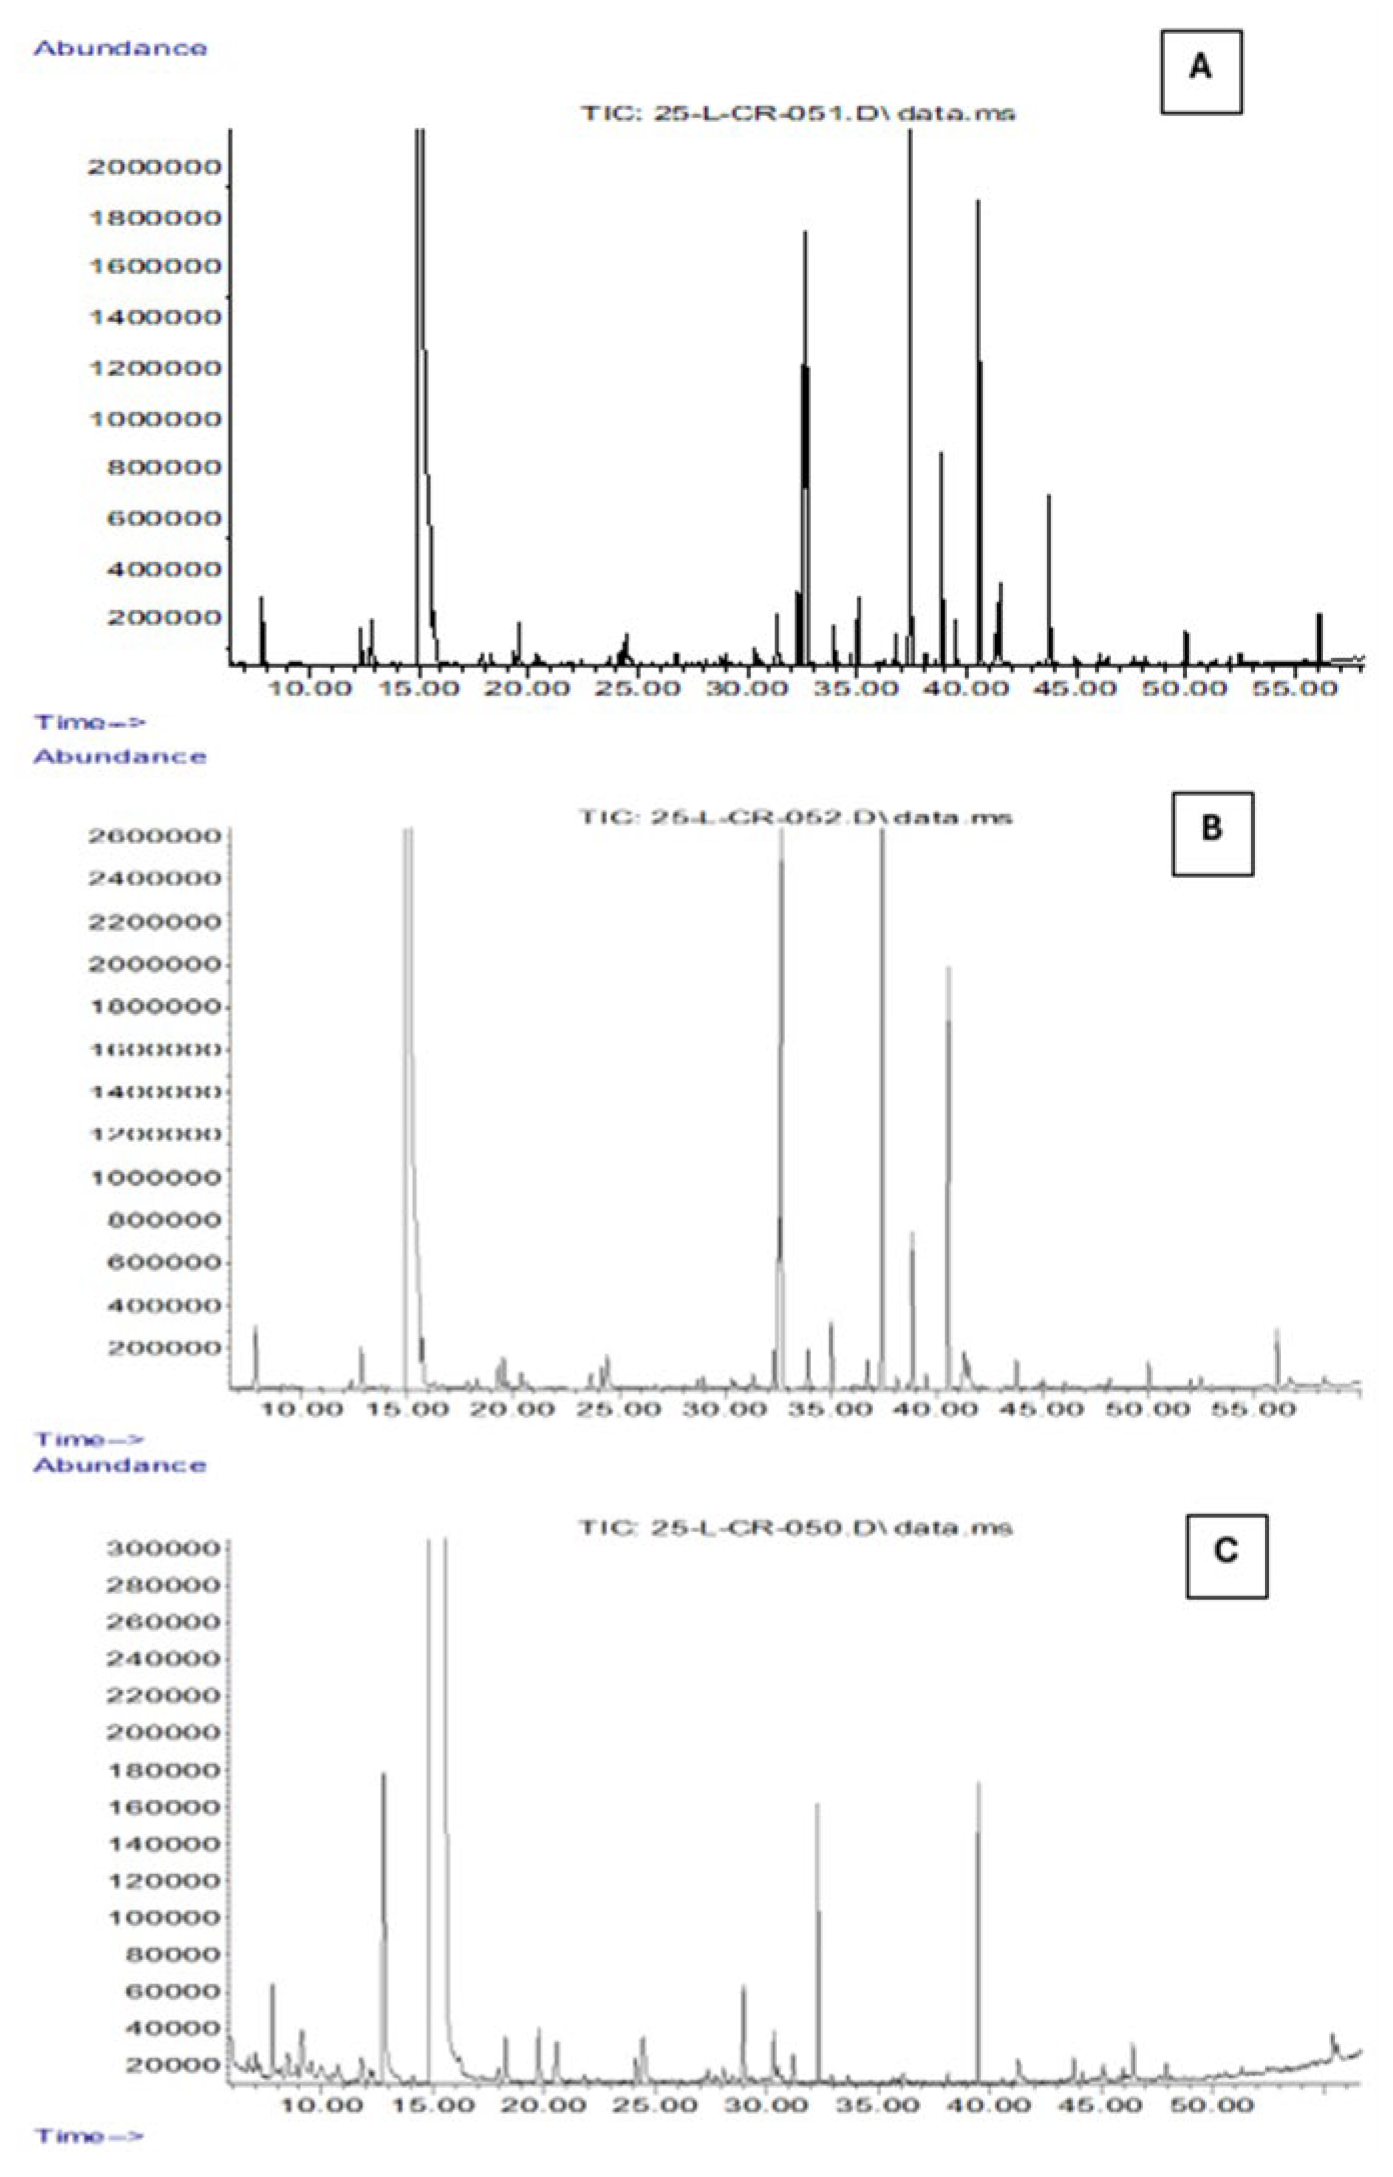
Figure 6.
Interactive 2D PCA plot based on volatile compound data, displaying the 15 most influential loading vectors contributing to sample separation.
Figure 6.
Interactive 2D PCA plot based on volatile compound data, displaying the 15 most influential loading vectors contributing to sample separation.
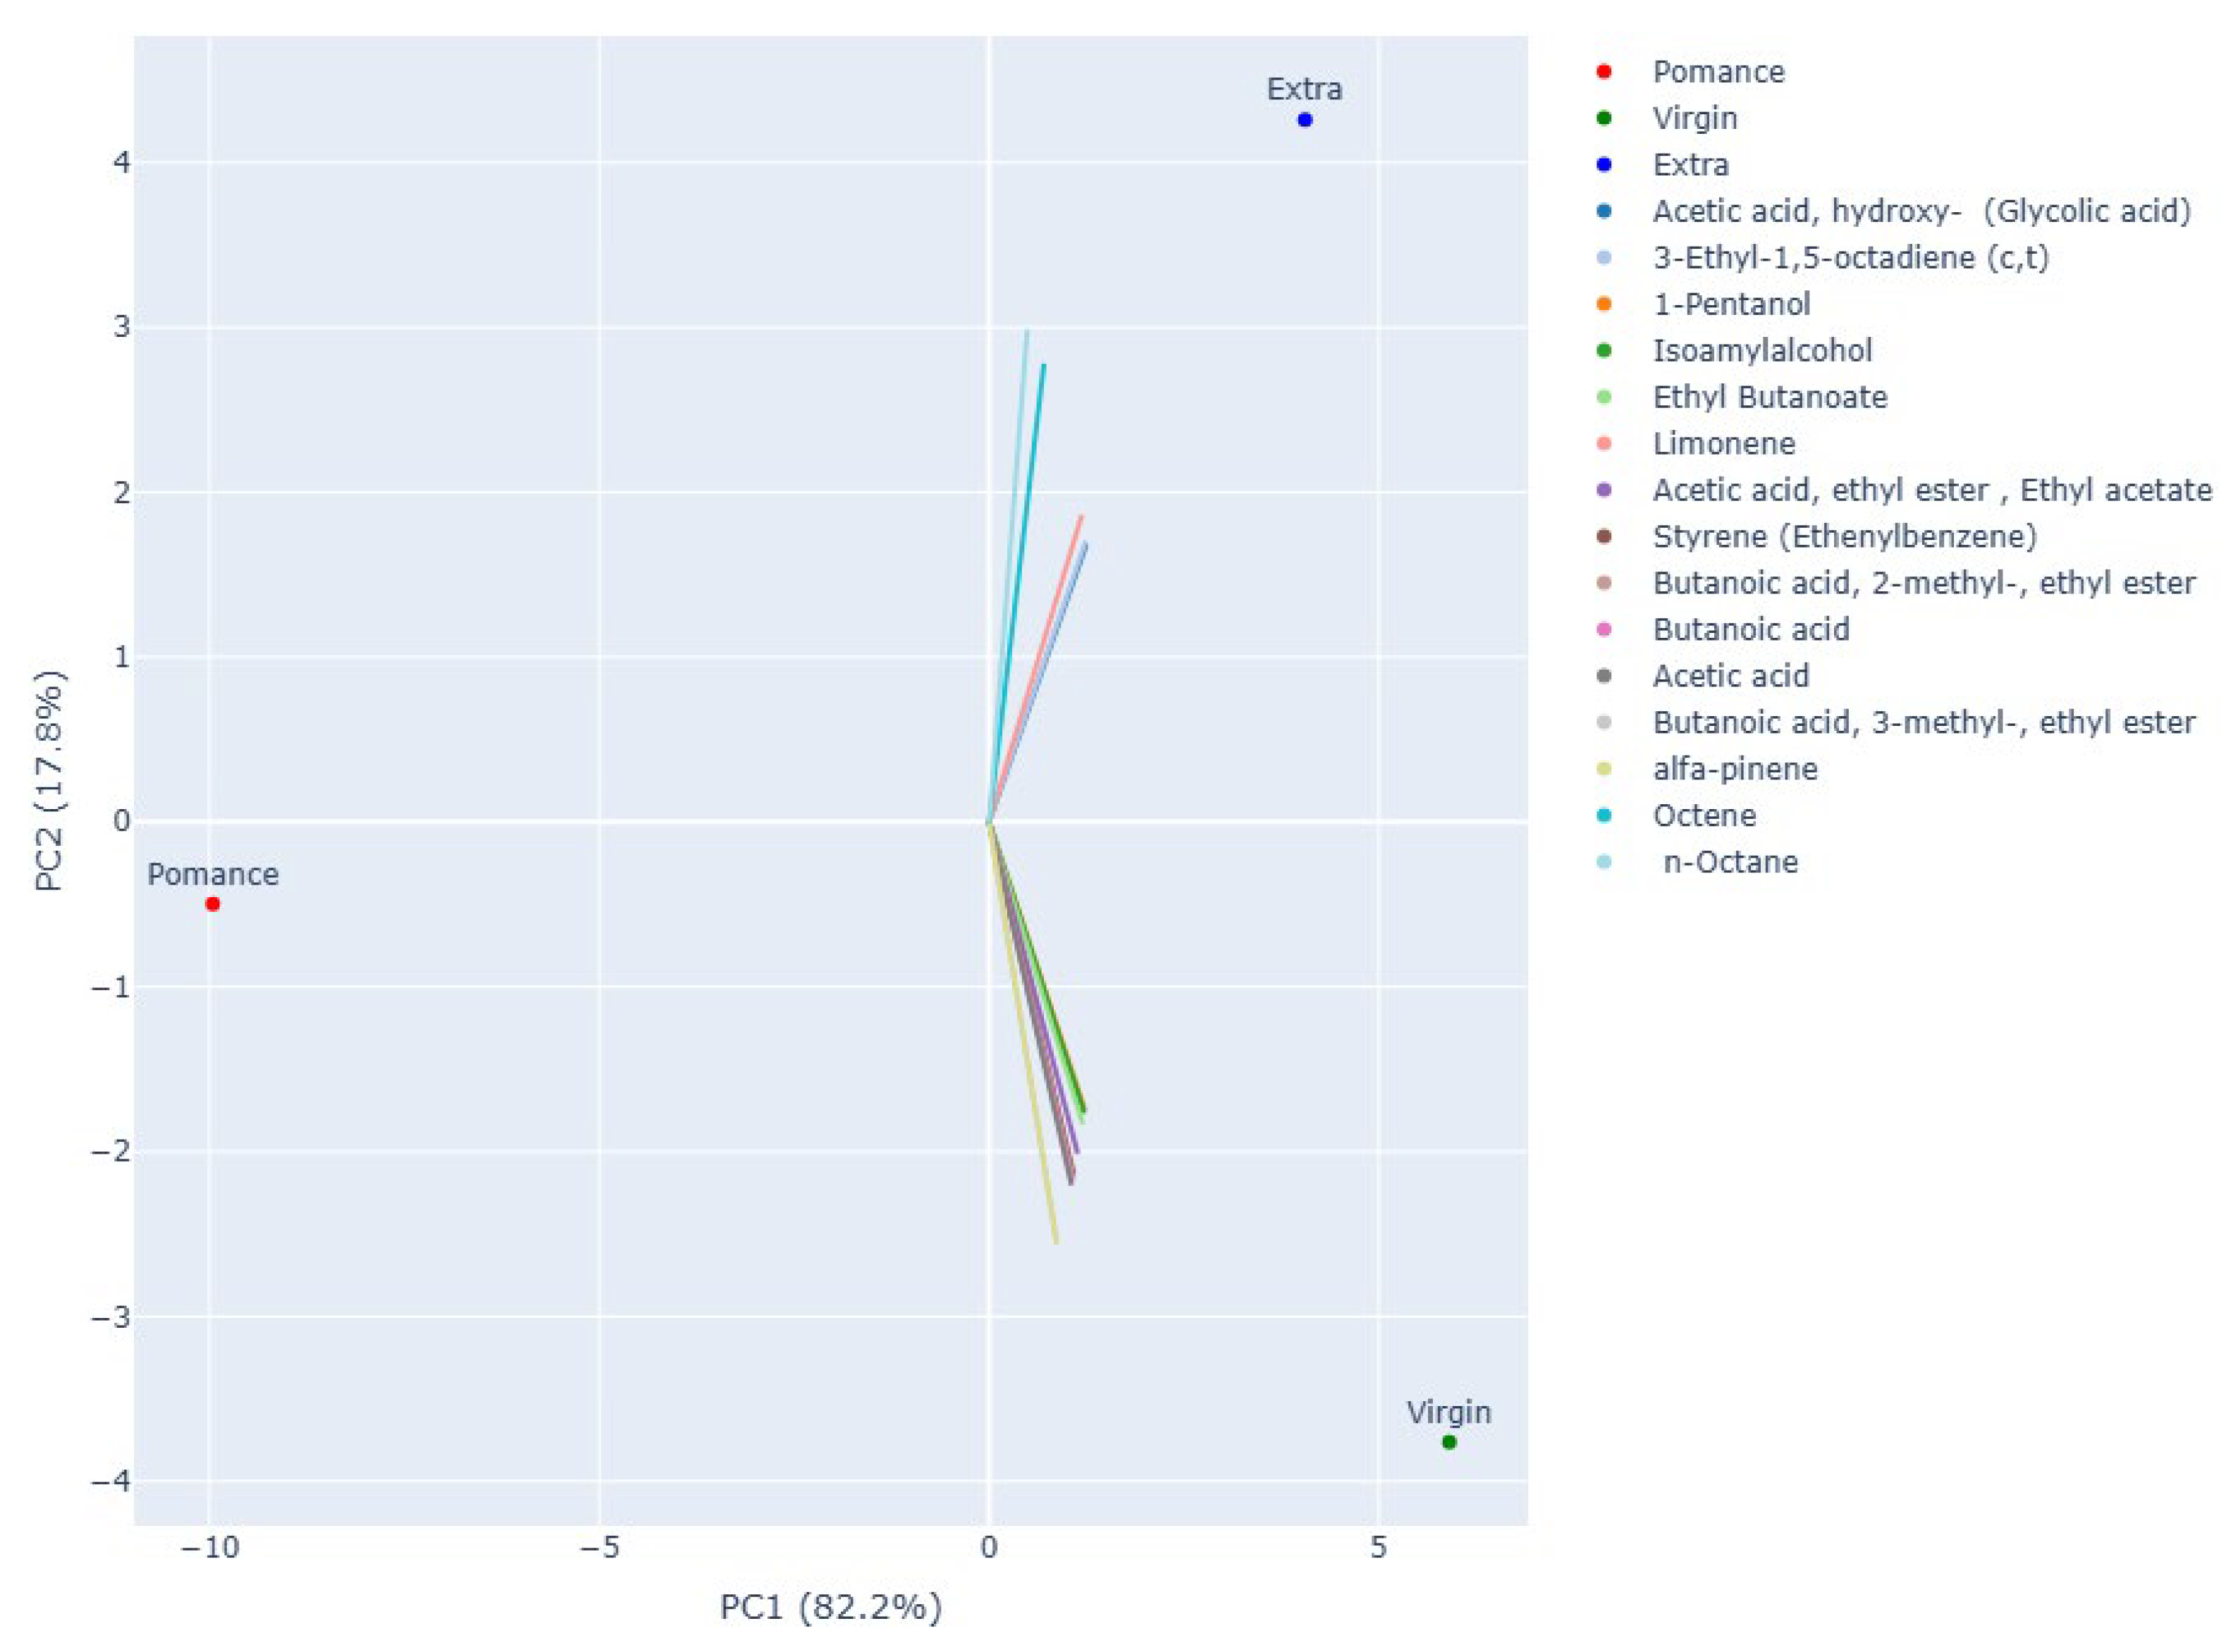
Figure 7.
Temporal TVOC Response Profiles for Pure Olive Oil Samples: Extra Virgin, Virgin, and Pomance.
Figure 7.
Temporal TVOC Response Profiles for Pure Olive Oil Samples: Extra Virgin, Virgin, and Pomance.
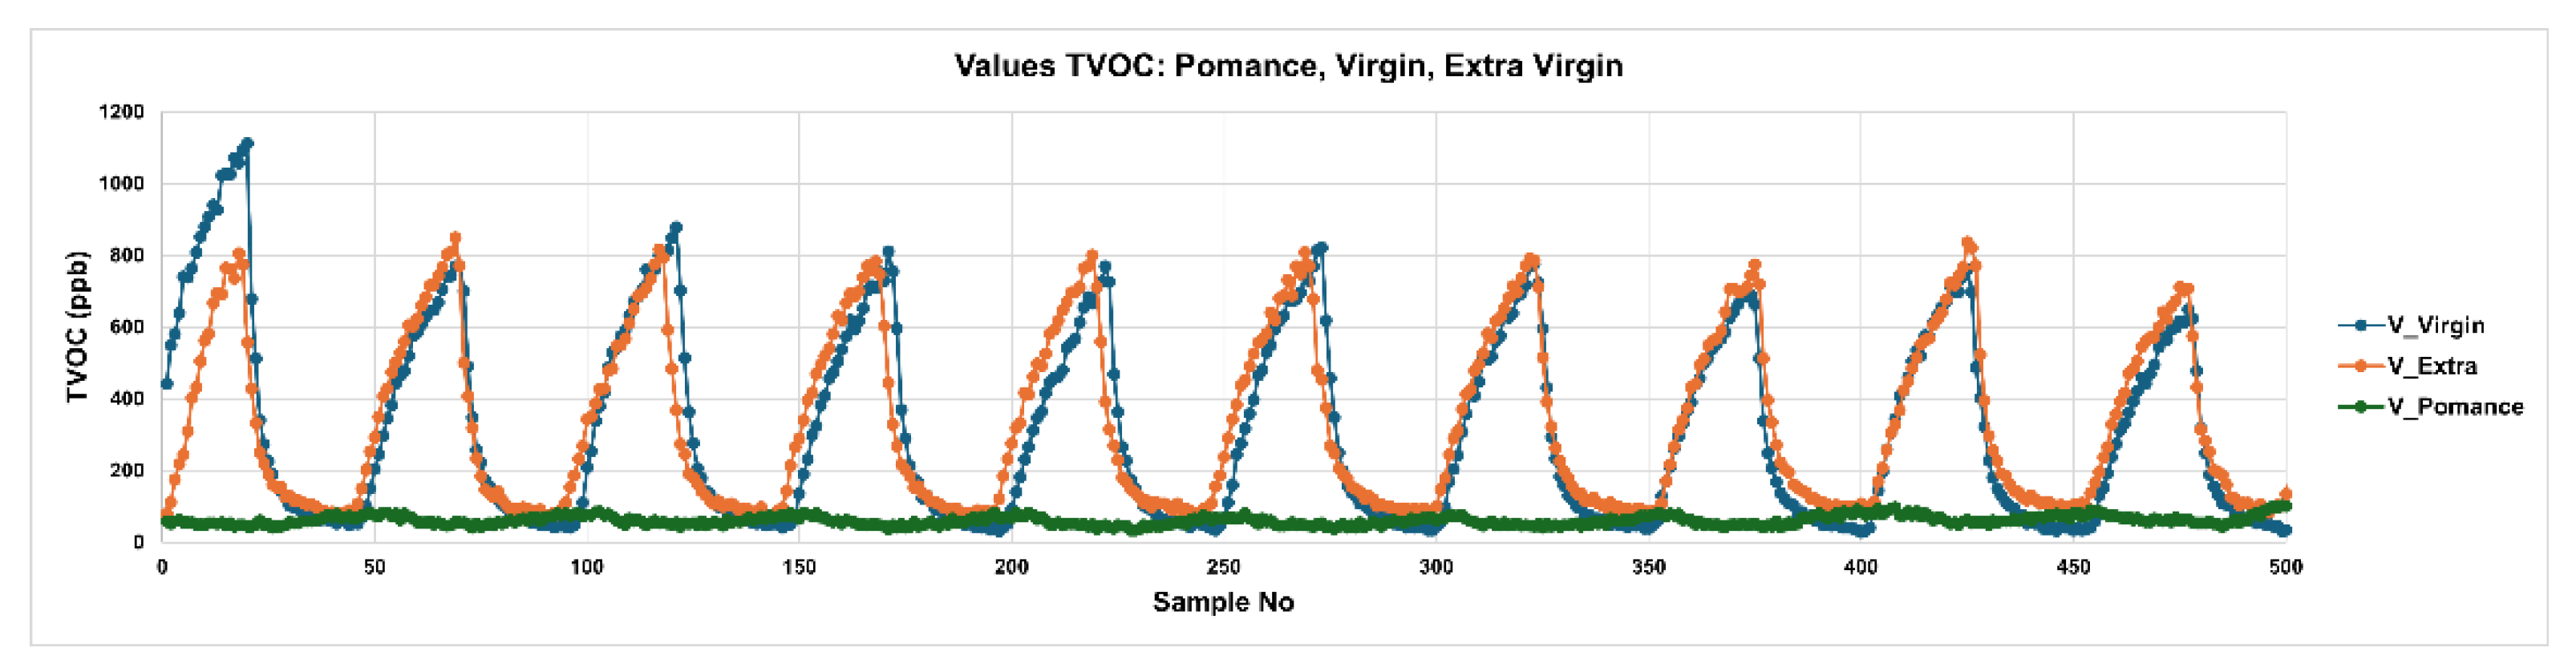
Figure 8.
Temporal TVOC Response Profiles for Adulterated Olive Oils: Virgin Blends with 10%, 30%, and 50% Pomance.
Figure 8.
Temporal TVOC Response Profiles for Adulterated Olive Oils: Virgin Blends with 10%, 30%, and 50% Pomance.
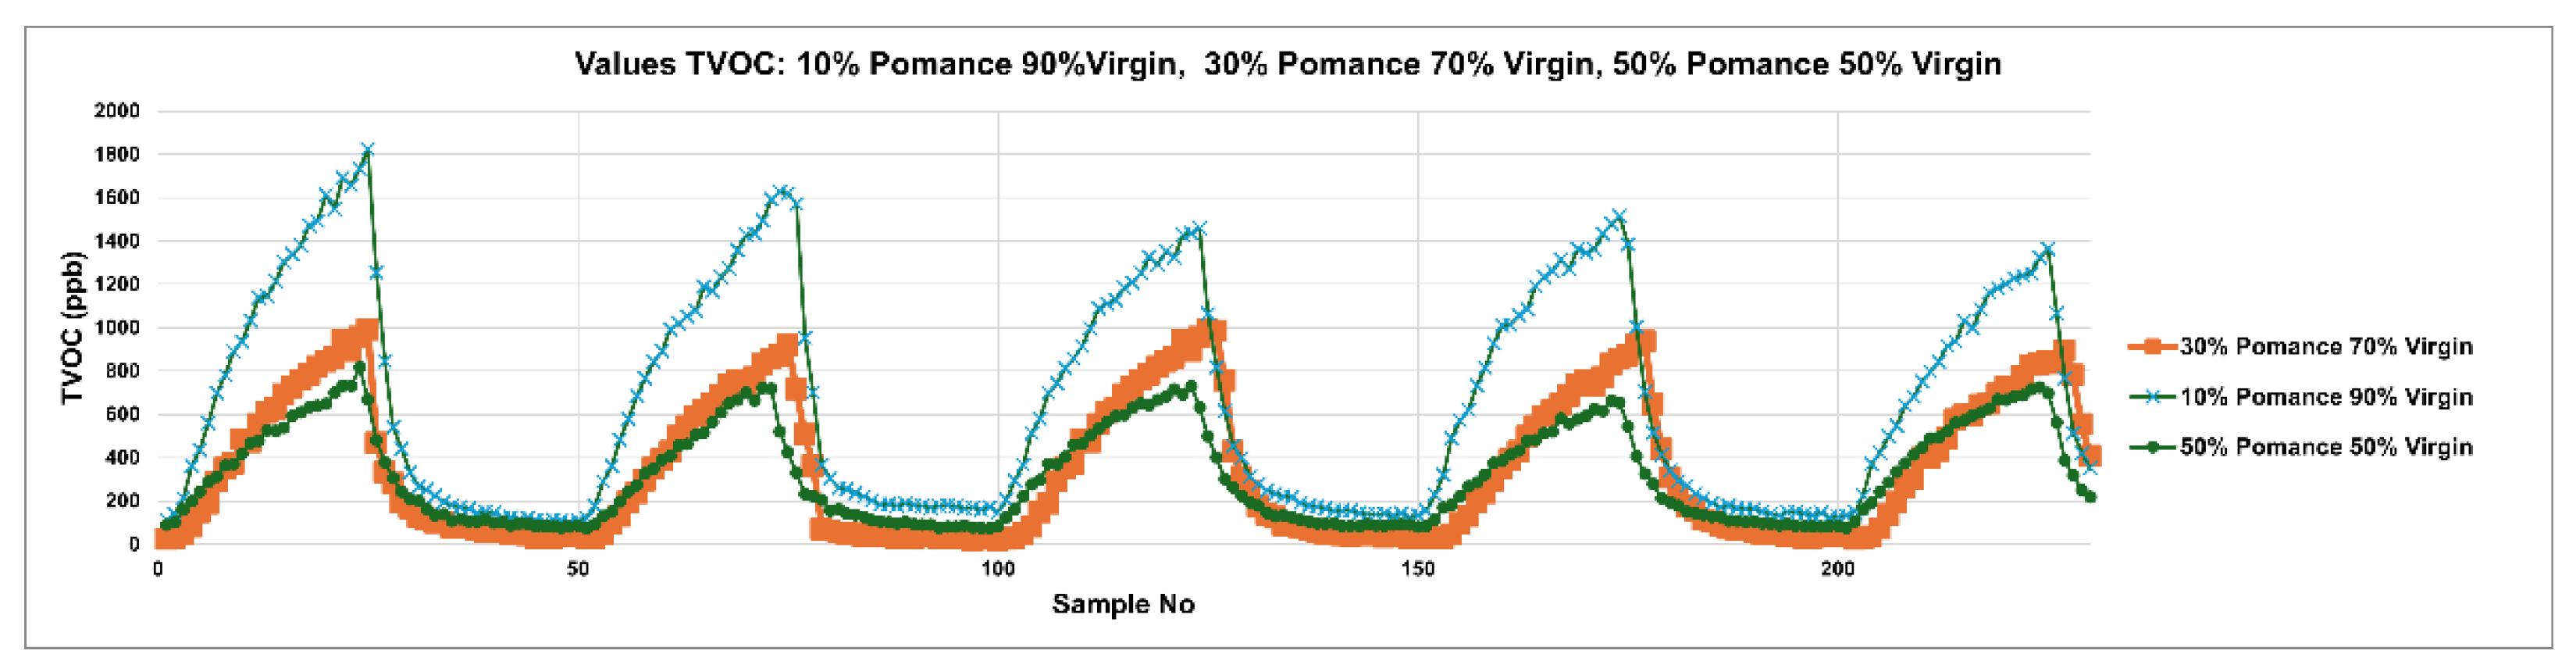
Figure 9.
Three-dimensional Principal Component Analysis (PCA) showing the separation between extra virgin olive oil (green), olive pomace oil (blue), and virgin olive oil (red) samples.
Figure 9.
Three-dimensional Principal Component Analysis (PCA) showing the separation between extra virgin olive oil (green), olive pomace oil (blue), and virgin olive oil (red) samples.
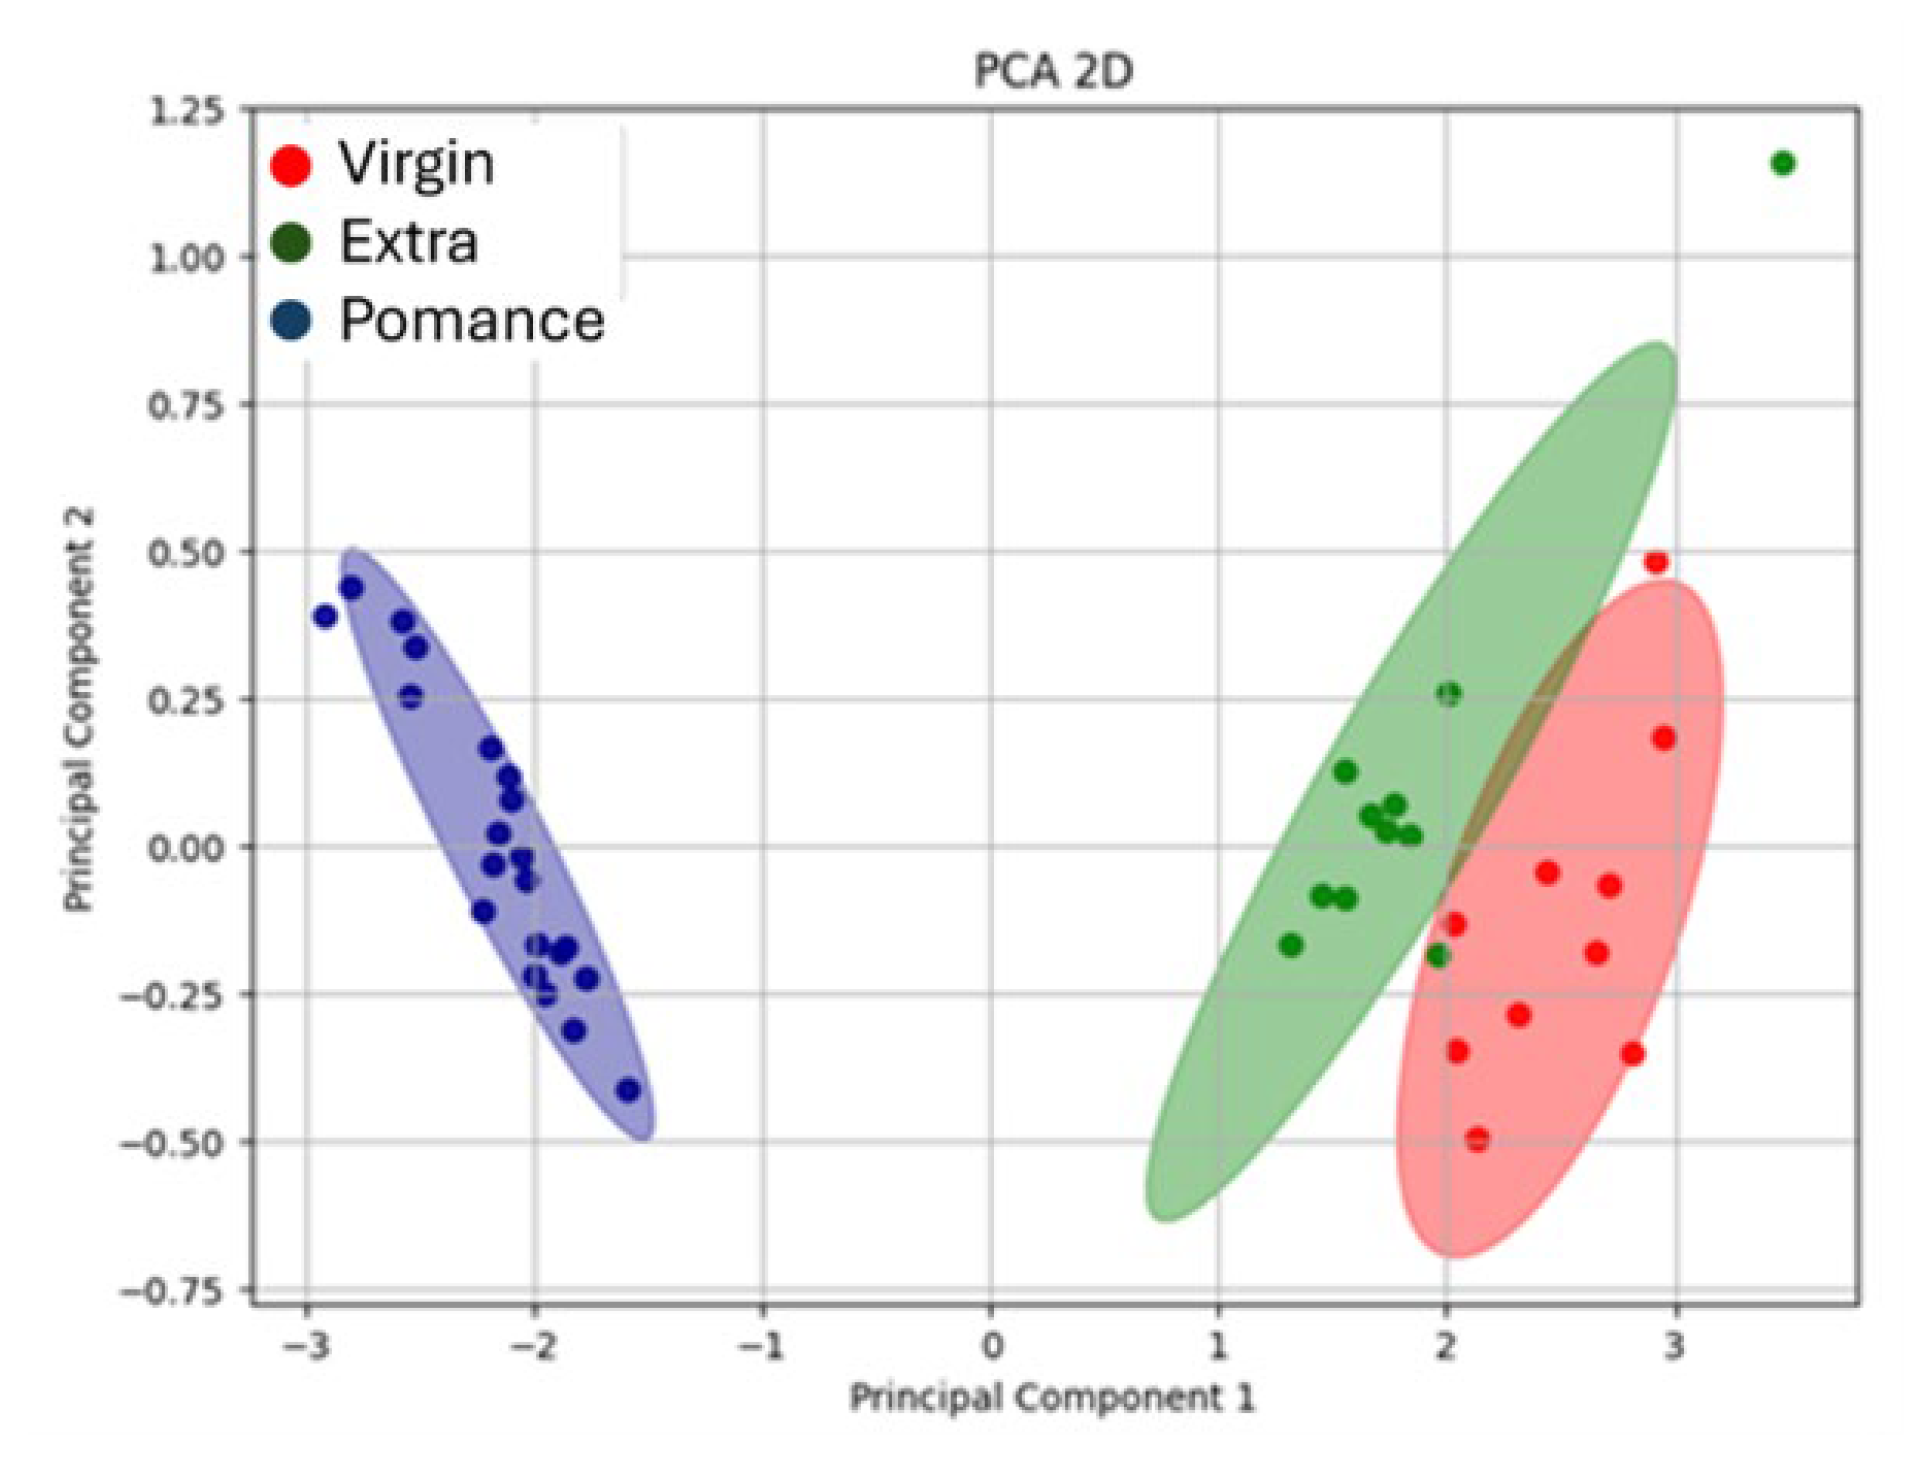
Figure 10.
3D Principal Component Analysis (PCA) of MOX sensor responses for olive oil classification.
Figure 10.
3D Principal Component Analysis (PCA) of MOX sensor responses for olive oil classification.
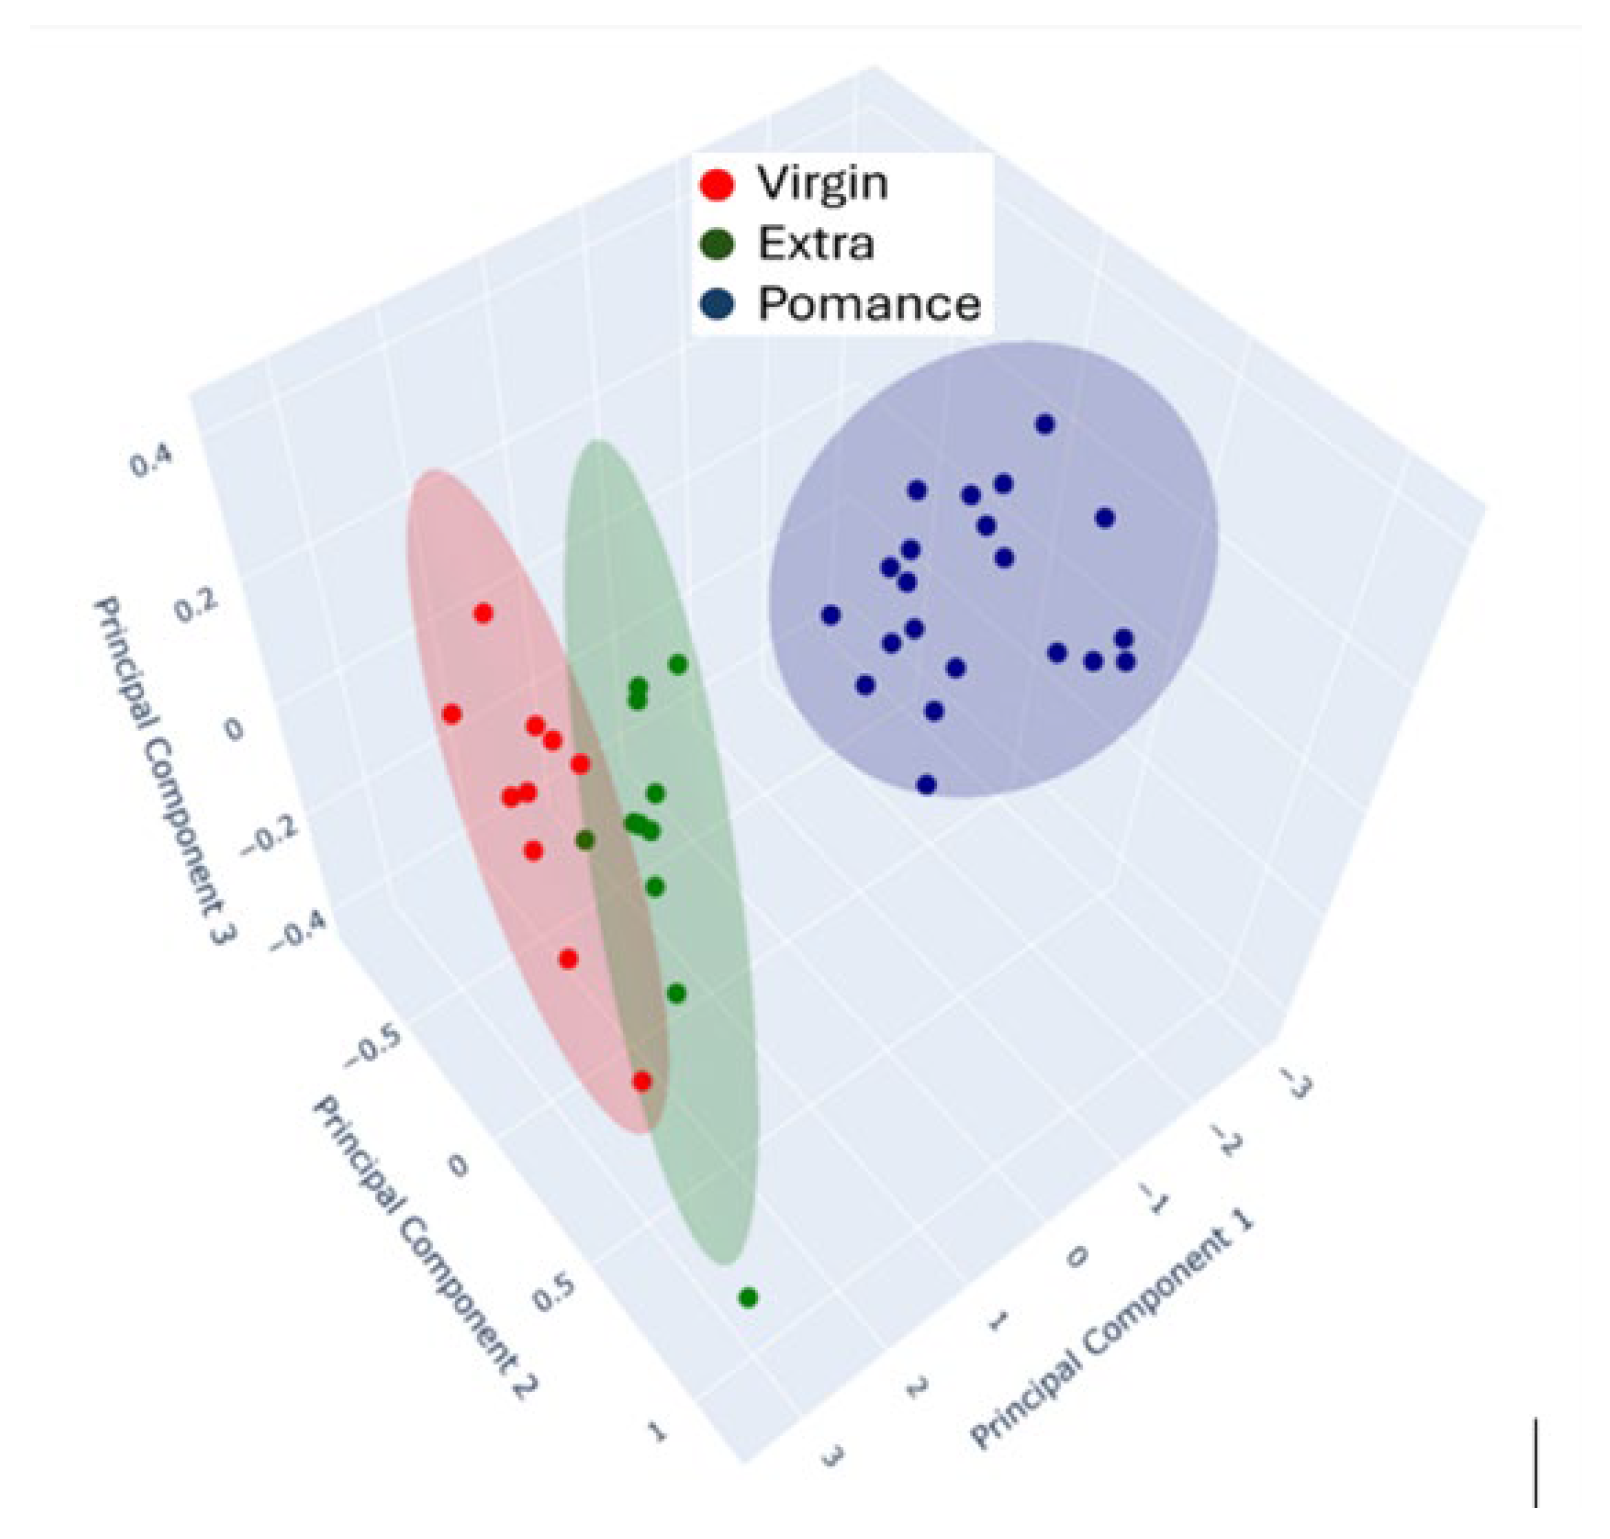
Figure 11.
Two-dimensional Principal Component Analysis (PCA) the separation between pure and blended oil samples in various proportions. Colors indicate the different combinations analyzed: blue for 10% olive pomace oil + 90% extra virgin olive oil, olive-green for 10% olive pomace oil + 90% virgin olive oil, red for 30% olive pomace oil + 70% extra virgin olive oil, light green for 30% olive pomace oil + 70% virgin olive oil, green for pure extra virgin olive oil, purple for pure olive pomace oil, brown for 50% olive pomace oil + 50% extra virgin olive oil, yellow for 50% olive pomace oil + 50% virgin olive oil, grey for pure virgin olive oil, and green for extra virgin olive oil.
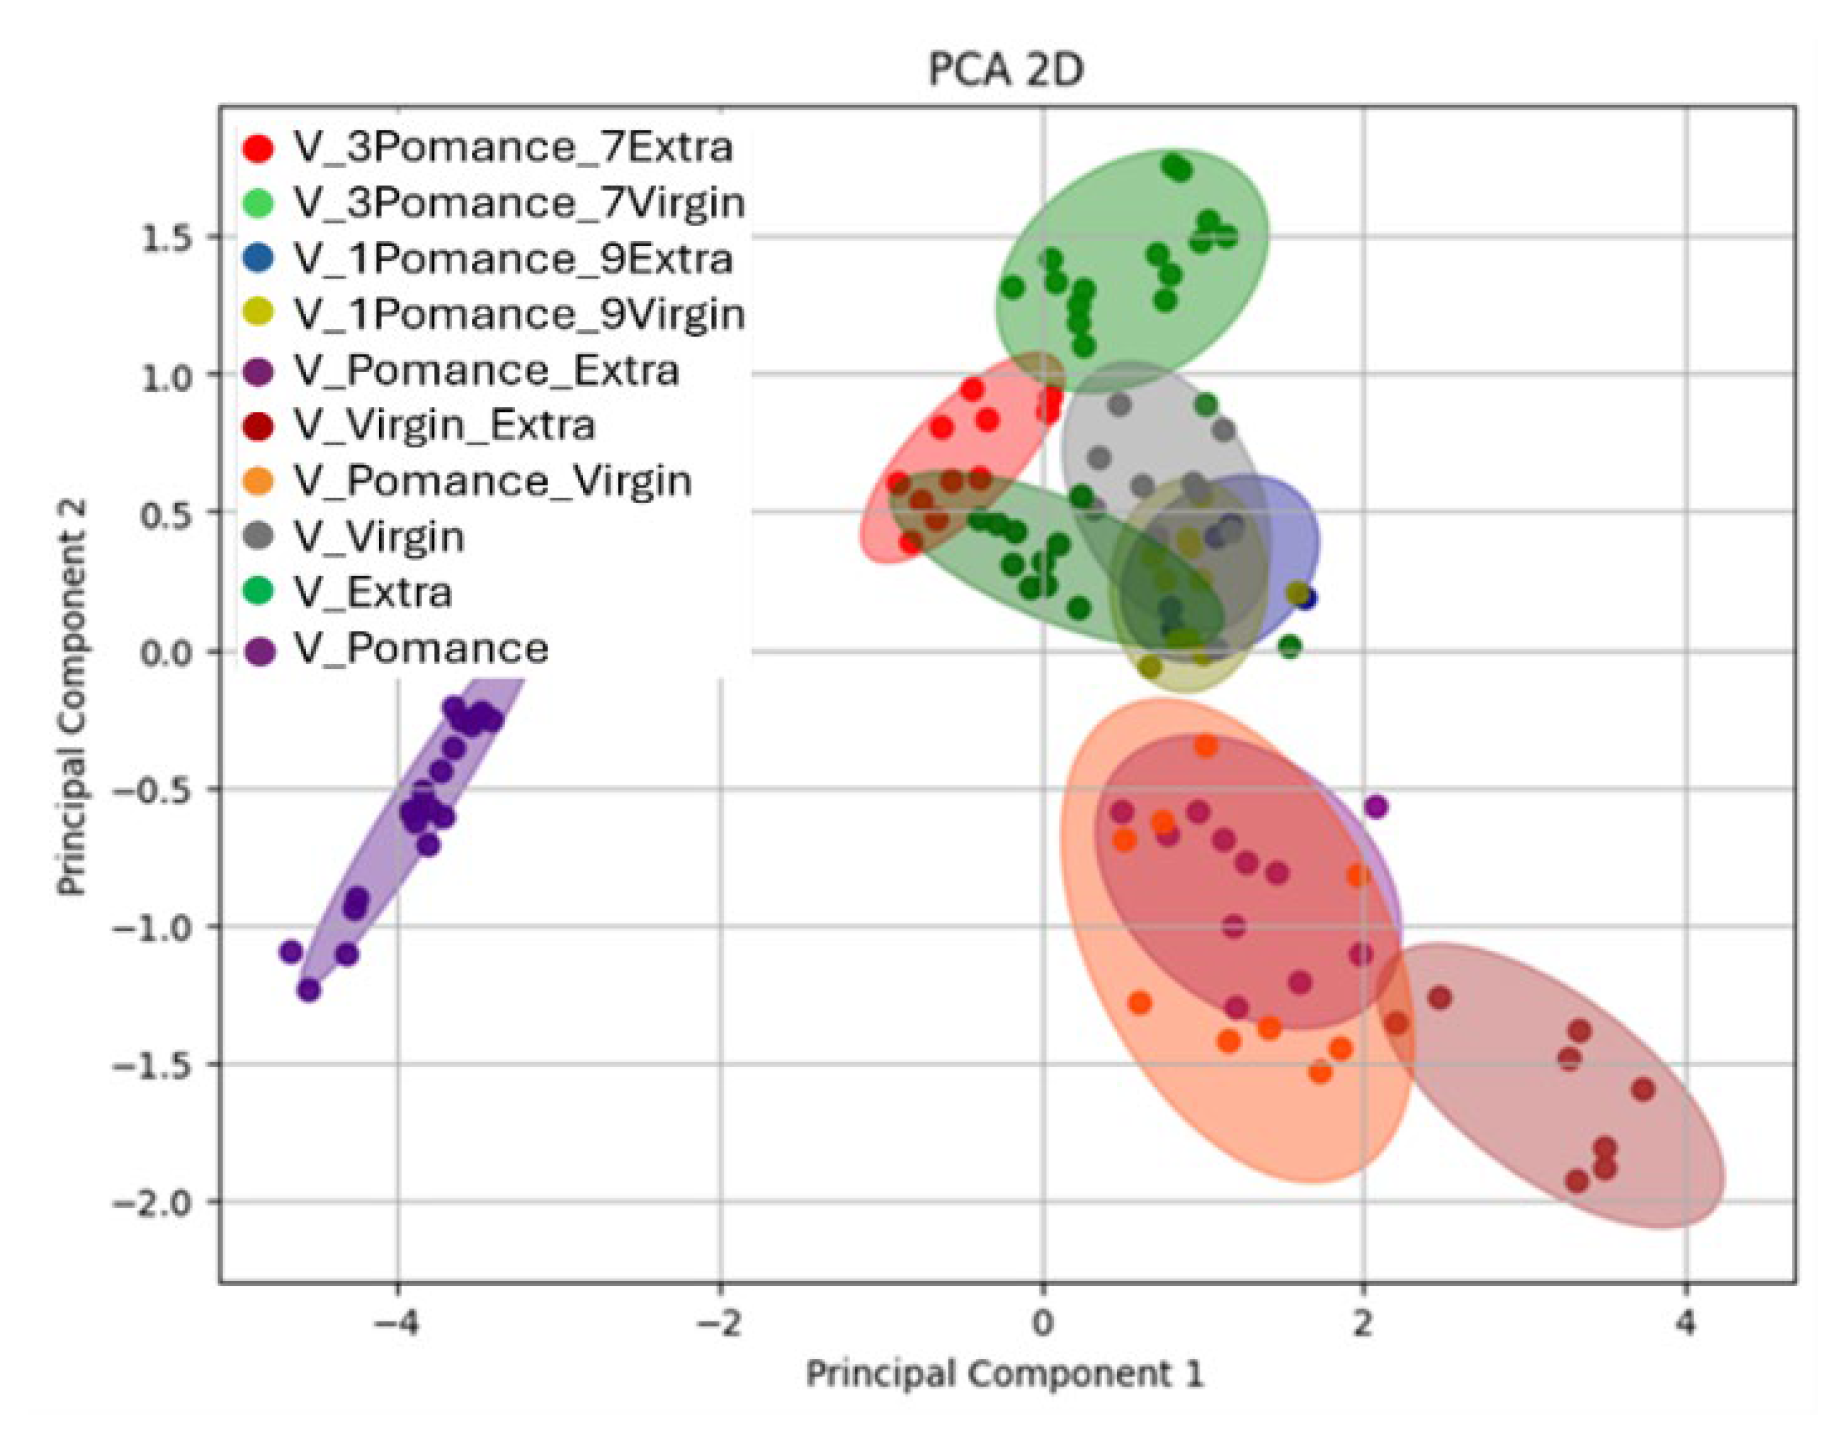
Figure 12.
Three-dimensional Principal Component Analysis (PCA) the separation between pure and blended oil samples in various proportions. Colors indicate the different combinations analyzed: blue for 10% olive pomace oil + 90% extra virgin olive oil, olive-green for 10% olive pomace oil + 90% virgin olive oil, red for 30% olive pomace oil + 70% extra virgin olive oil, light green for 30% olive pomace oil + 70% virgin olive oil, green for pure extra virgin olive oil, purple for pure olive pomace oil, brown for 50% olive pomace oil + 50% extra virgin olive oil, yellow for 50% olive pomace oil + 50% virgin olive oil, grey for pure virgin olive oil, and green for extra virgin olive oil.
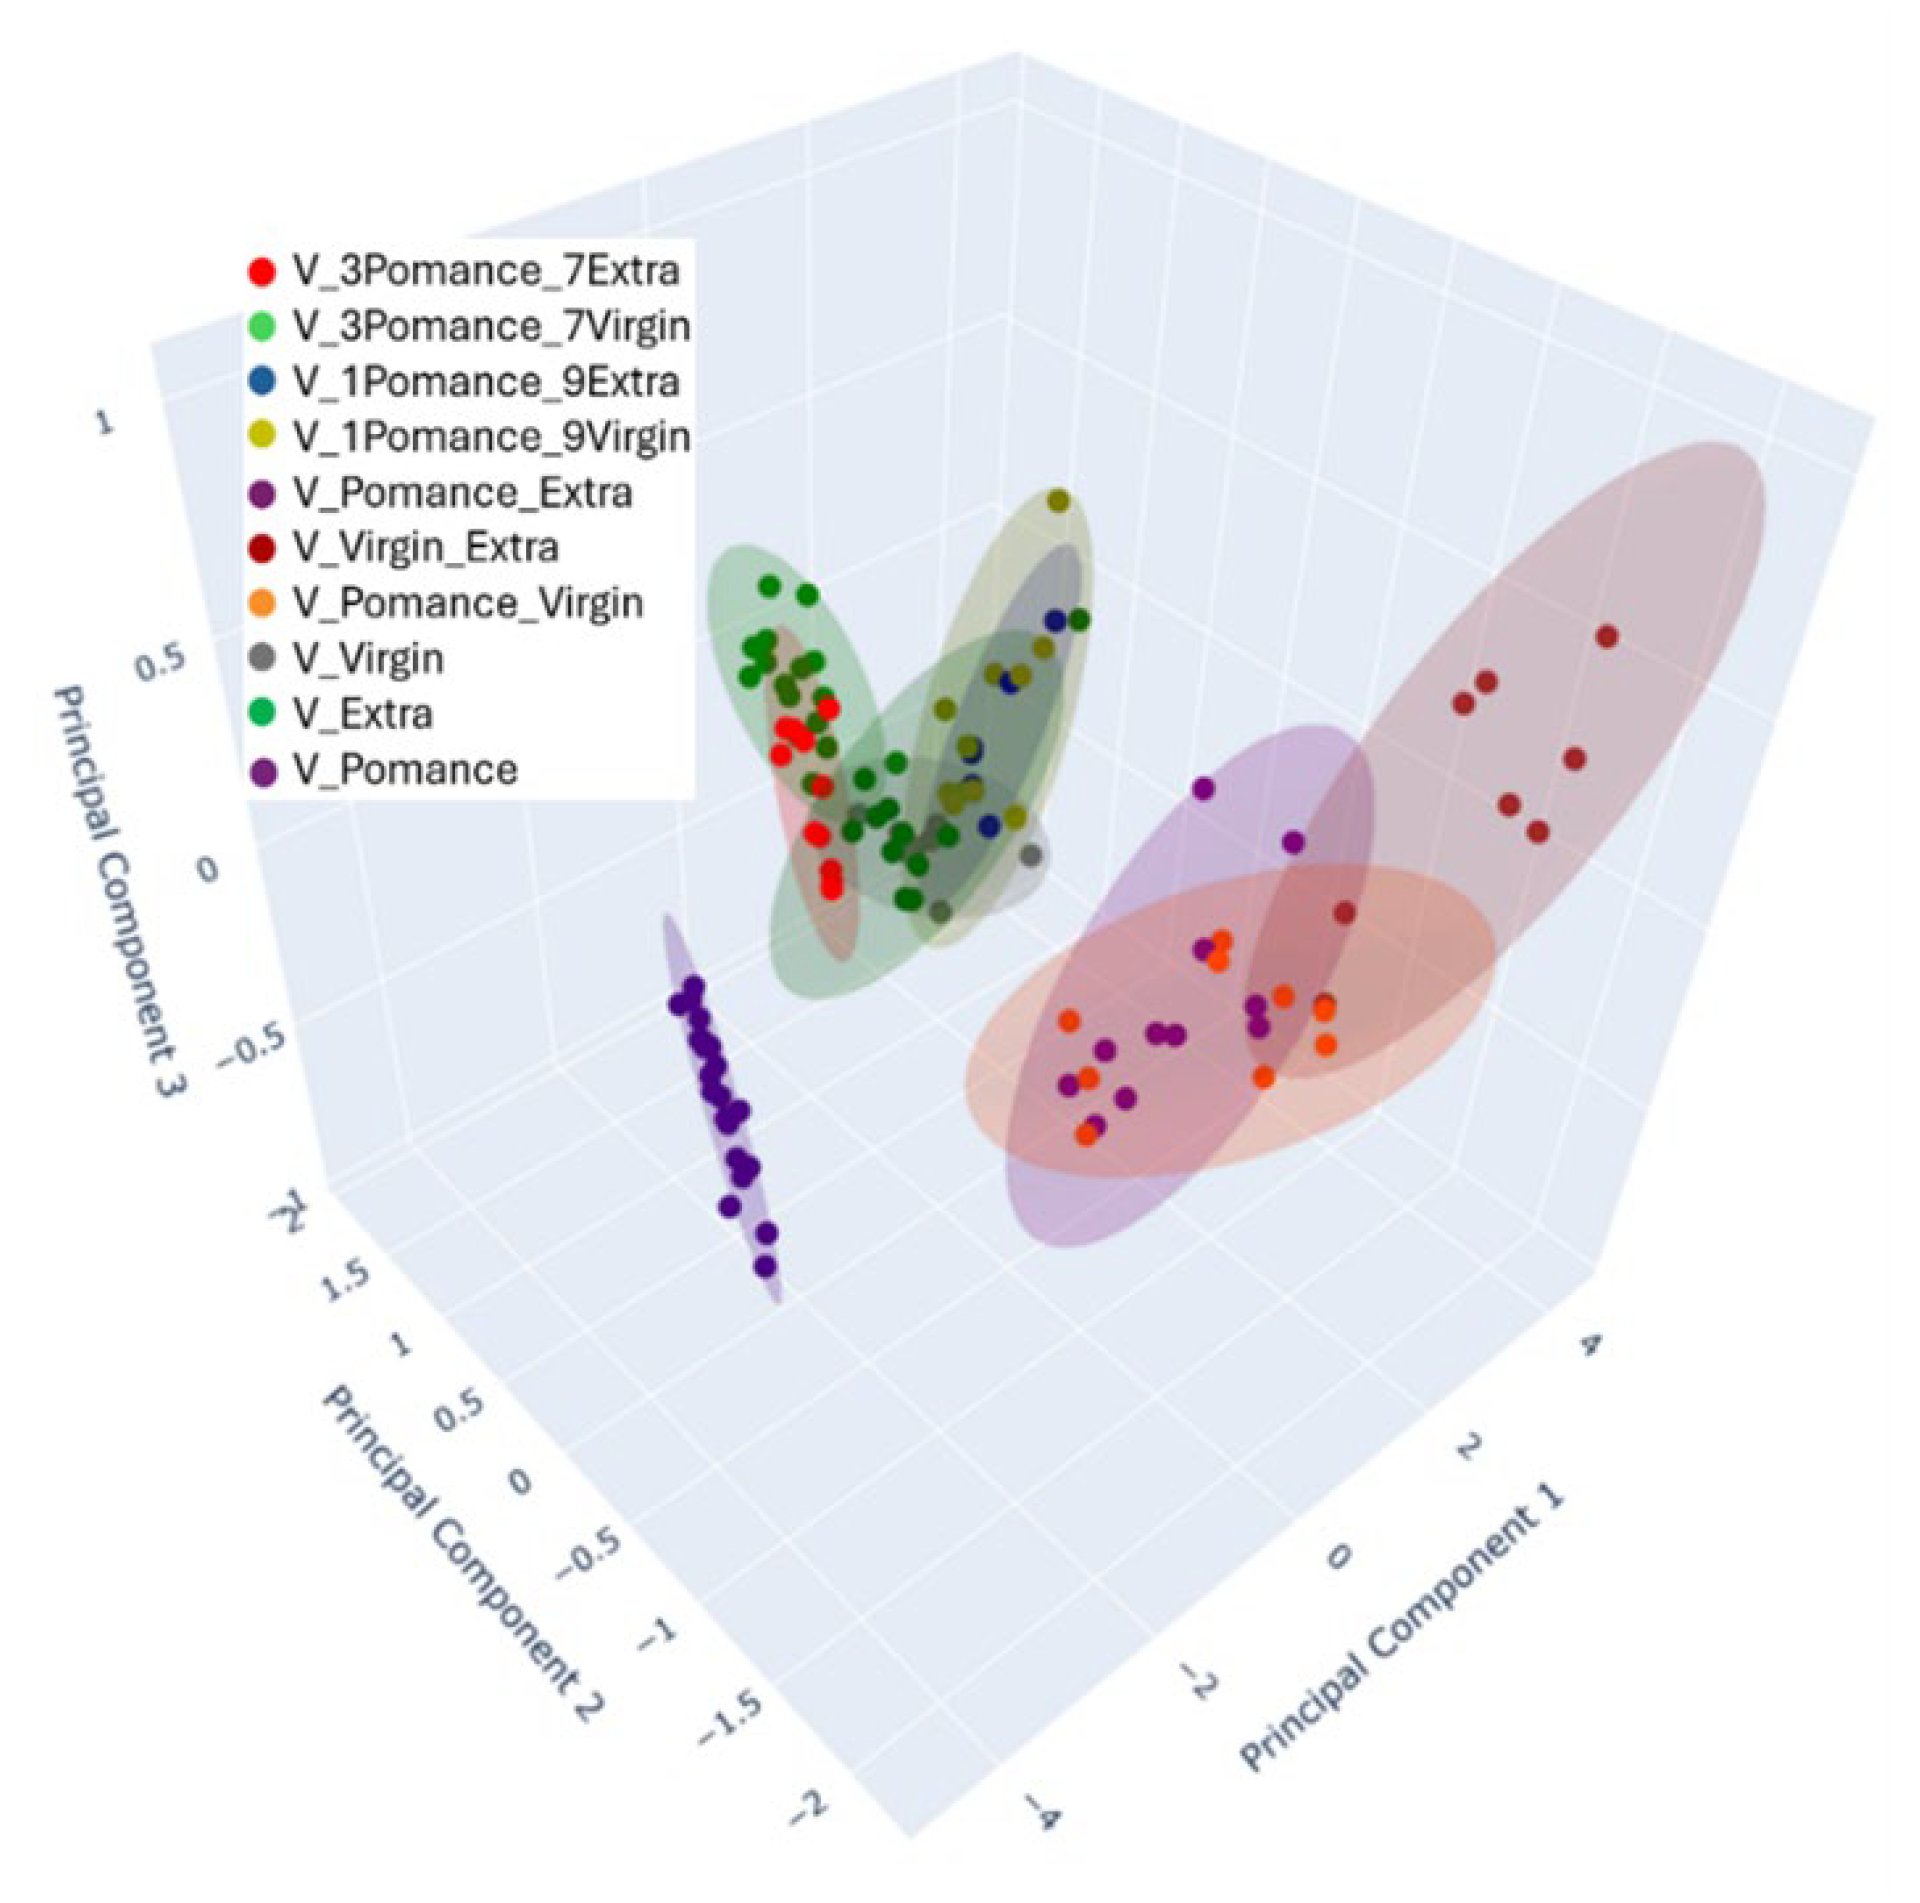
Figure 13.
Confusion Matrix for Classification of Pure Olive Oil Categories: Virgin, Extra Virgin, and Pomance.
Figure 13.
Confusion Matrix for Classification of Pure Olive Oil Categories: Virgin, Extra Virgin, and Pomance.
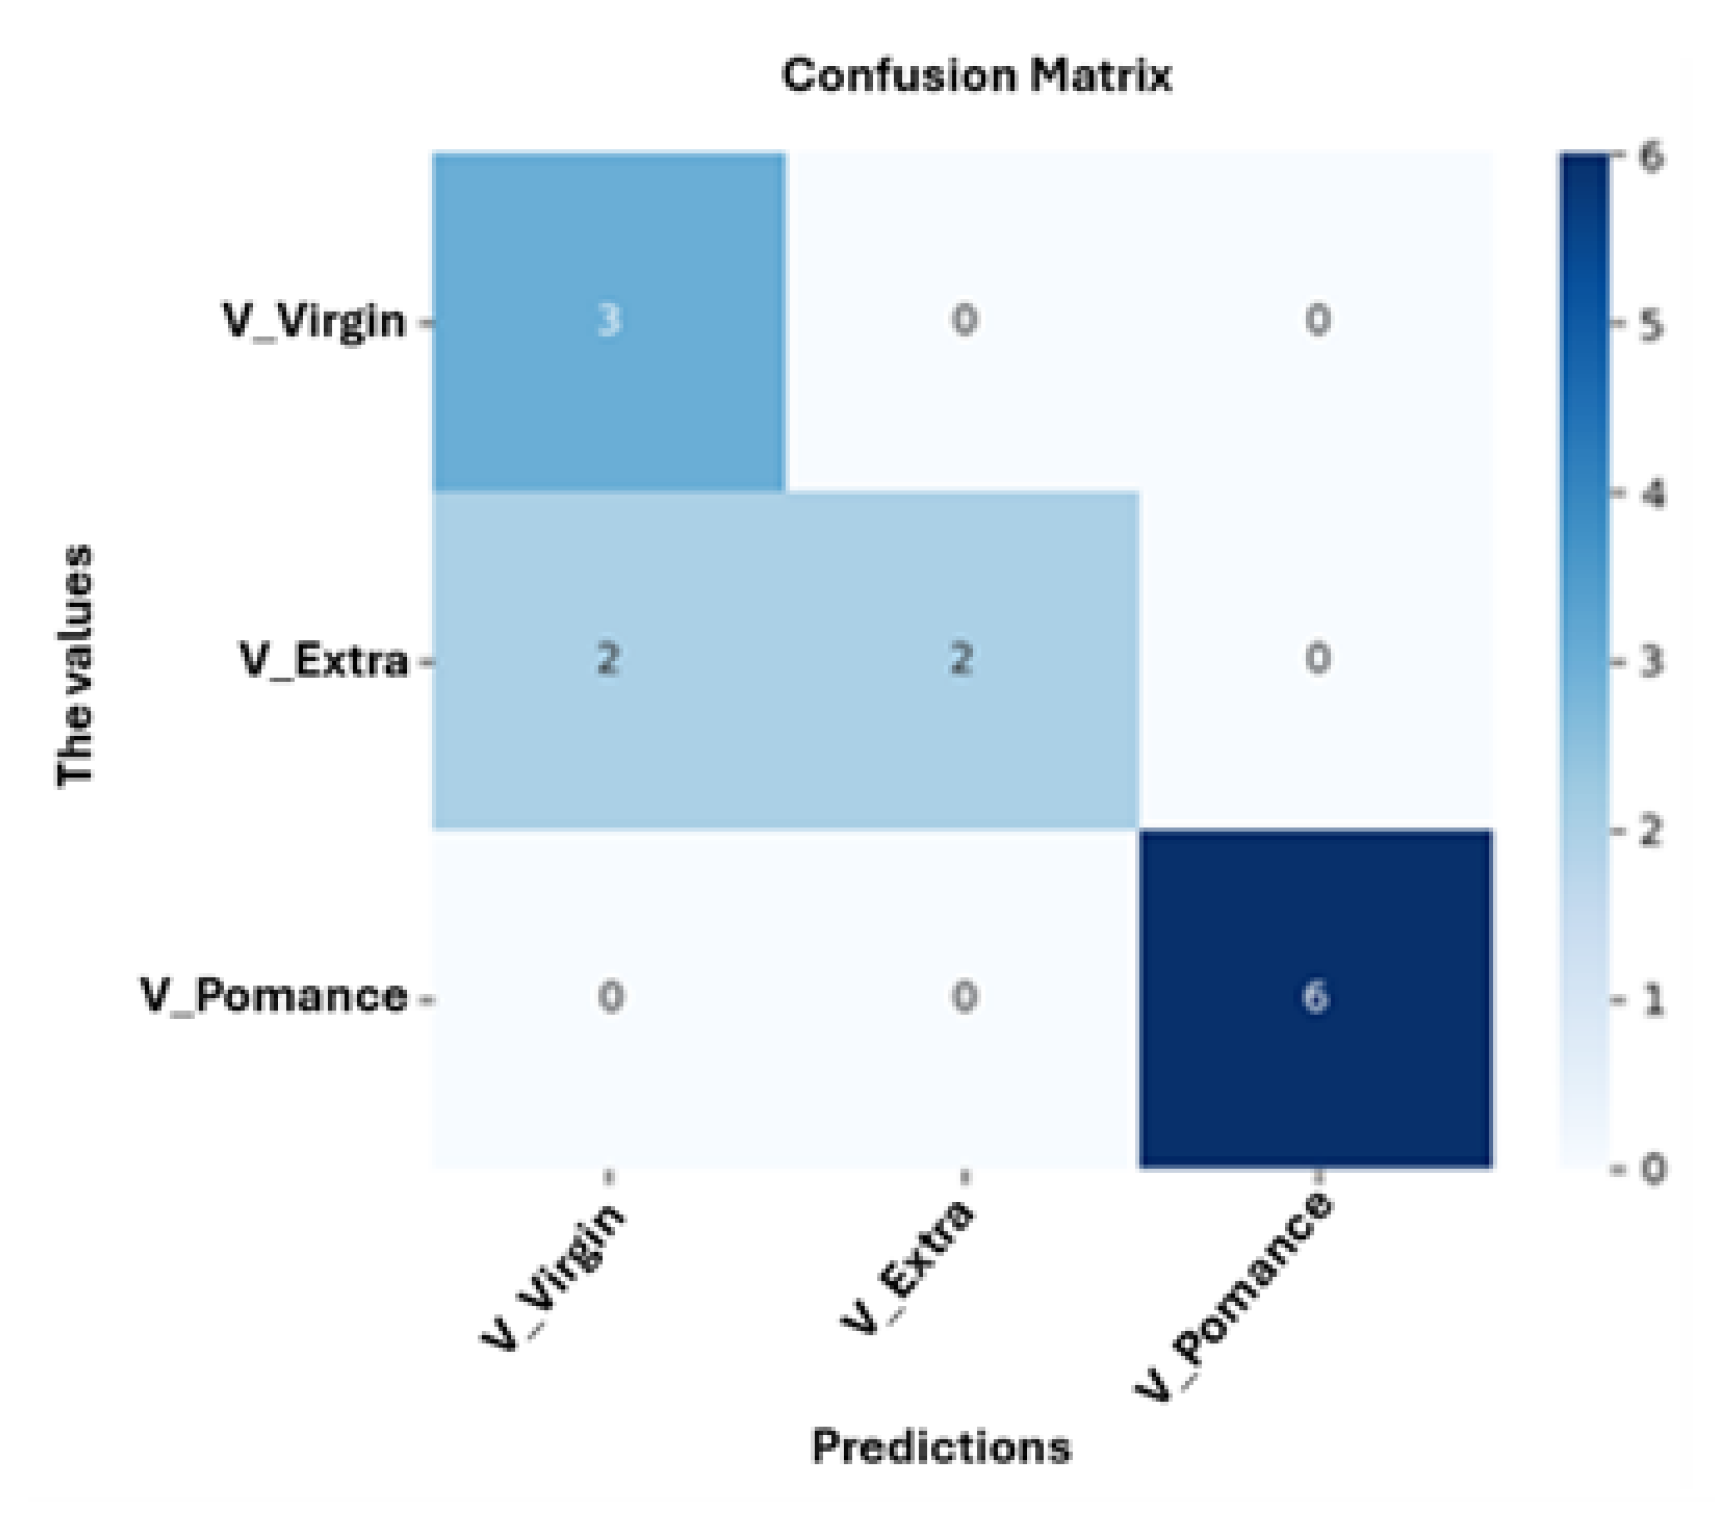
Figure 14.
Neuronal network performance for classifying pure olive oils.
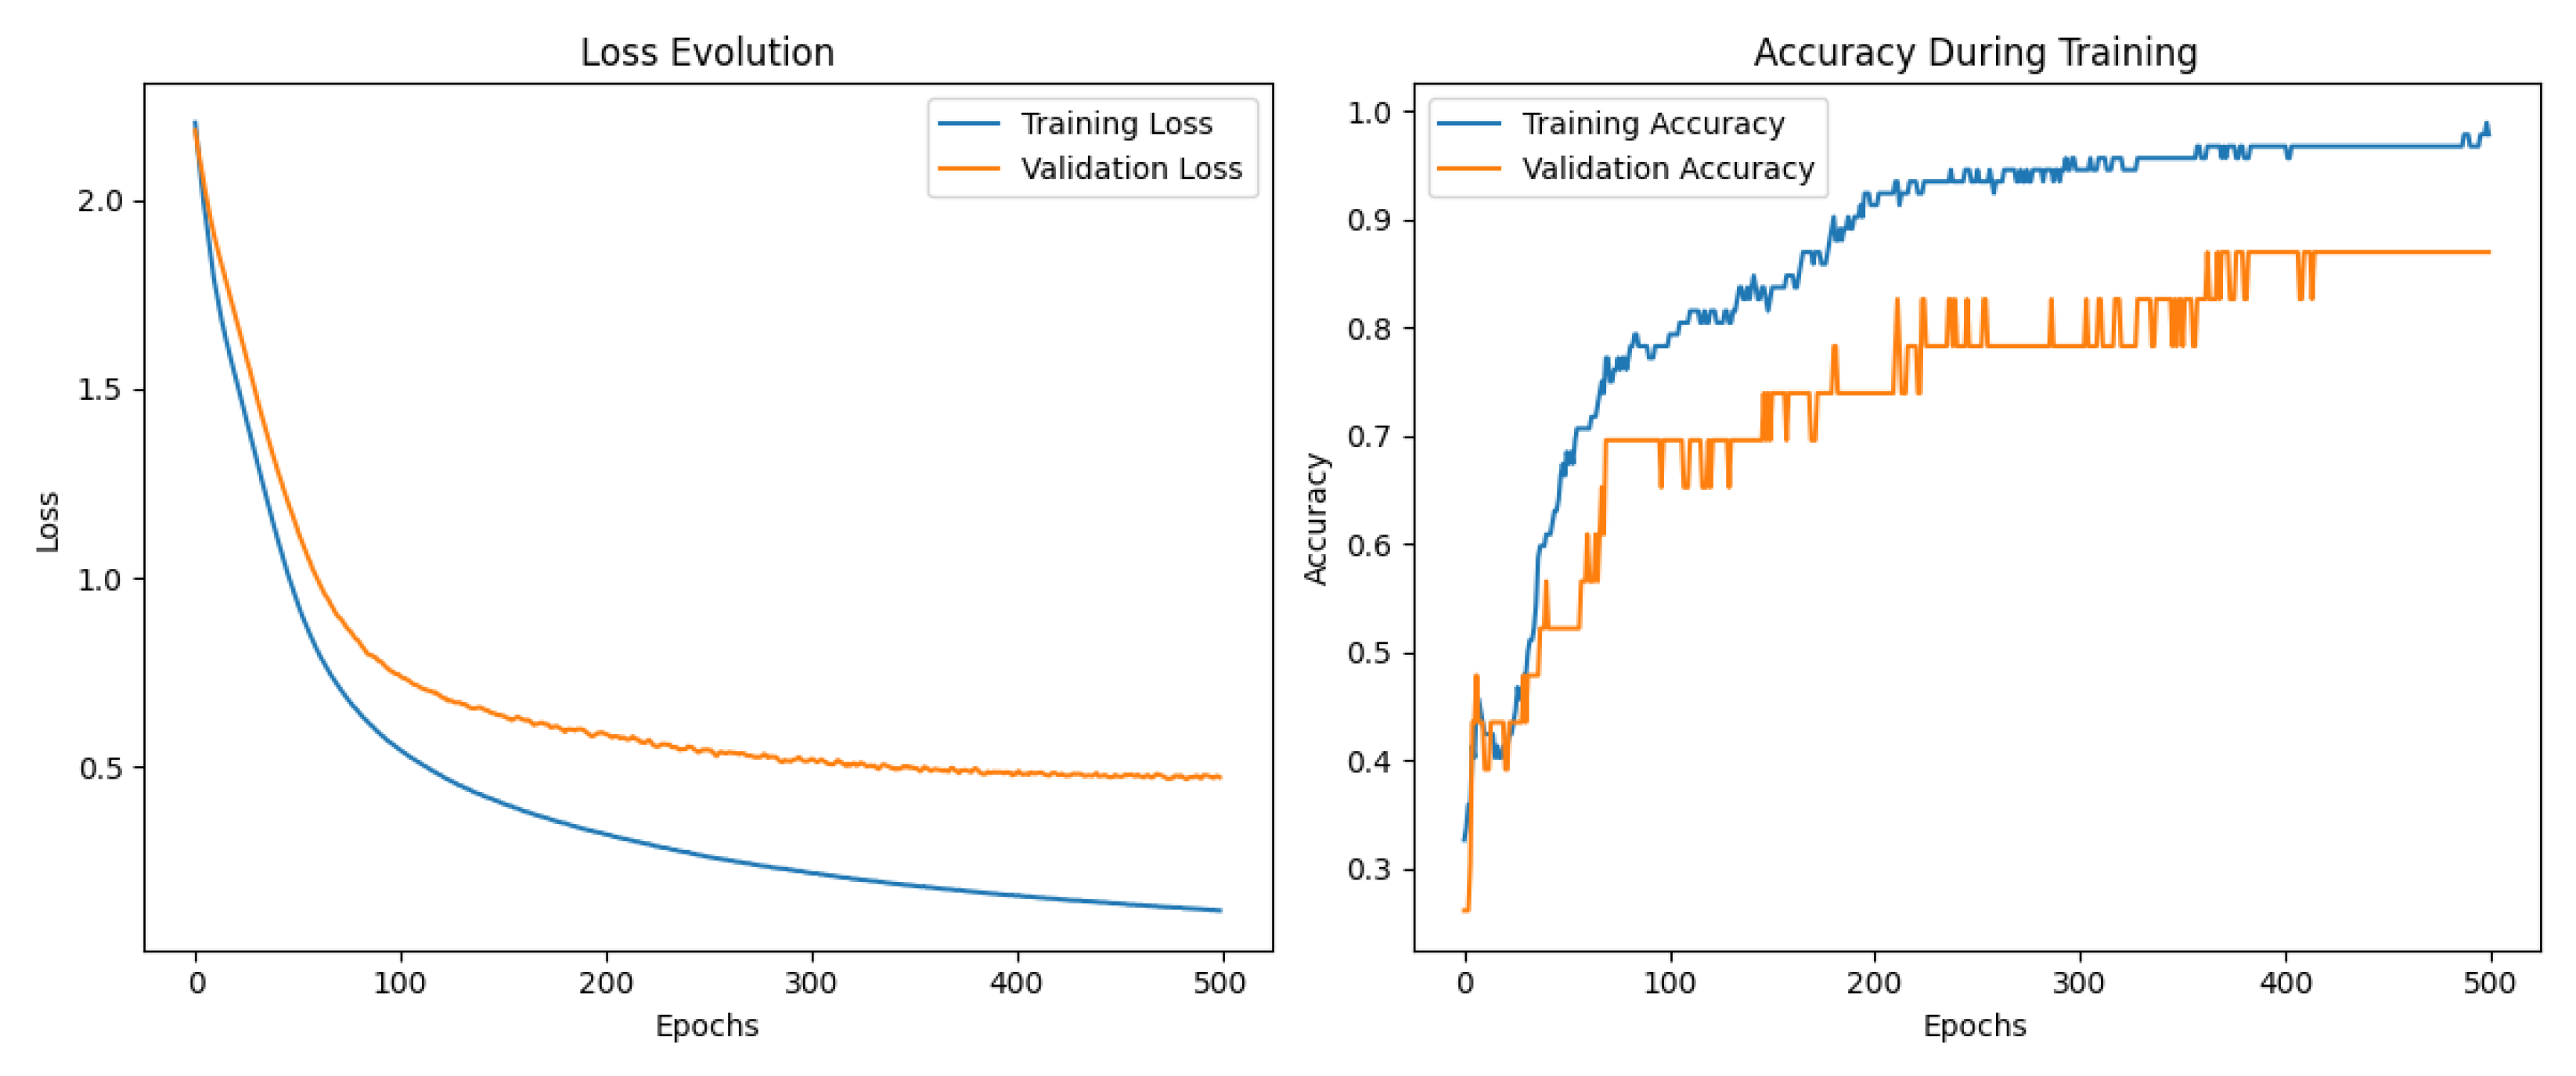
Figure 15.
Hierarchical clustering of pure olive oil categories based on TVOC profiles.
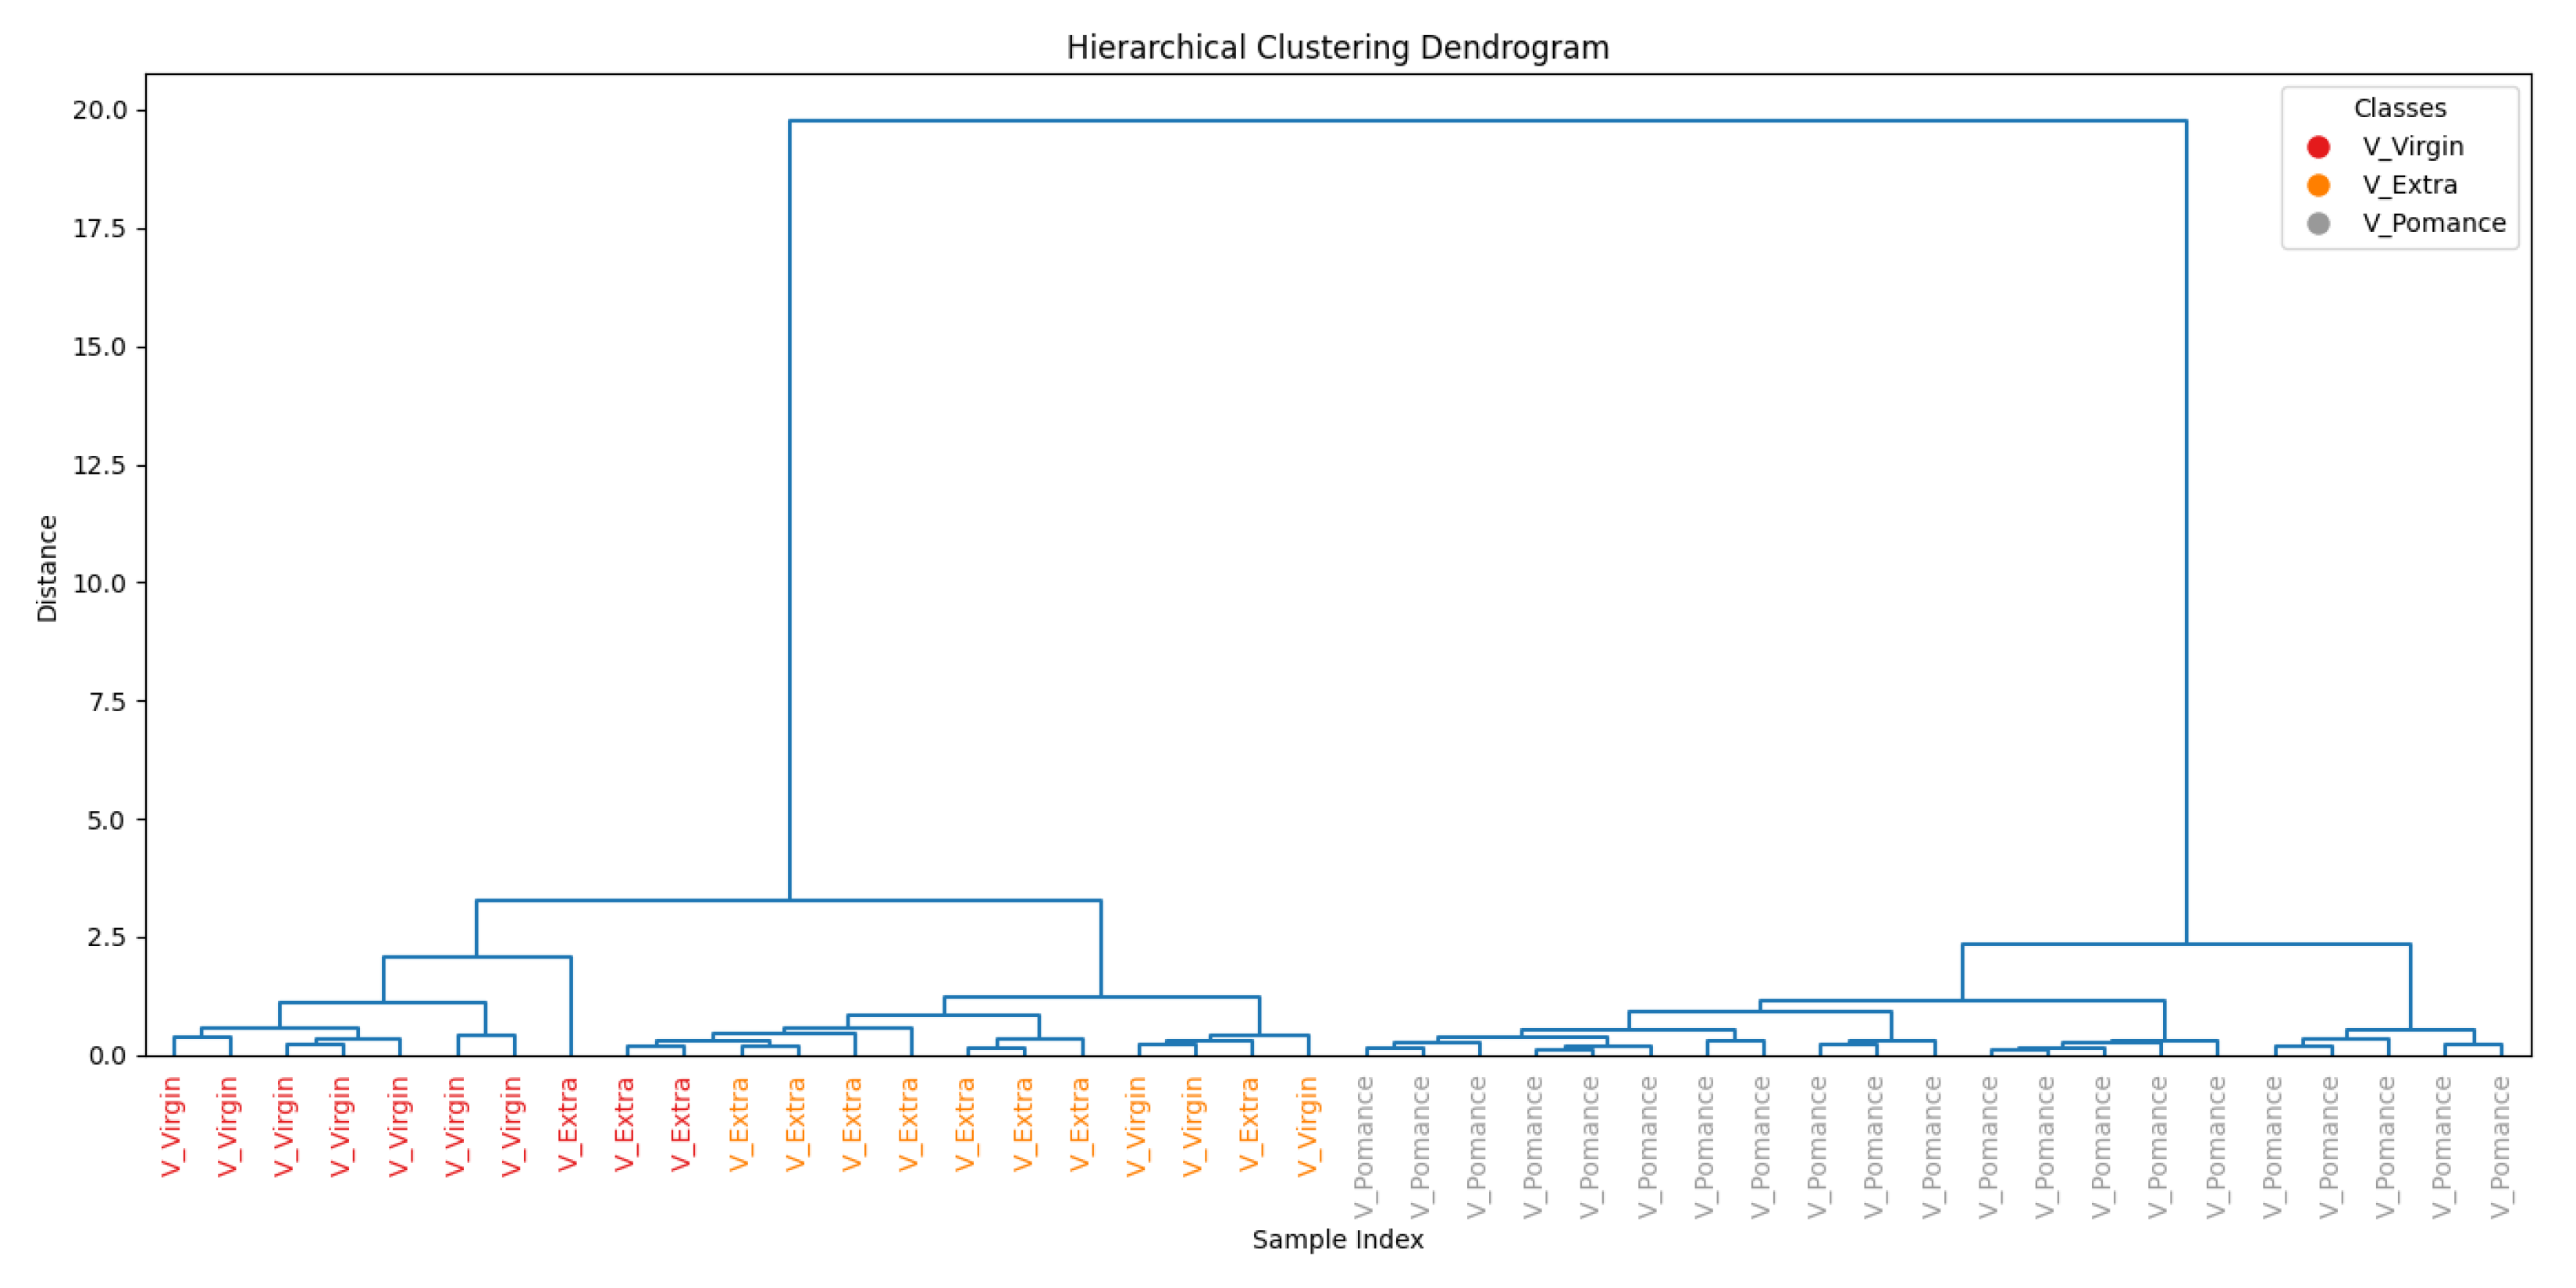
Figure 16.
Connection weights from input variables to the first hidden layer neurons.
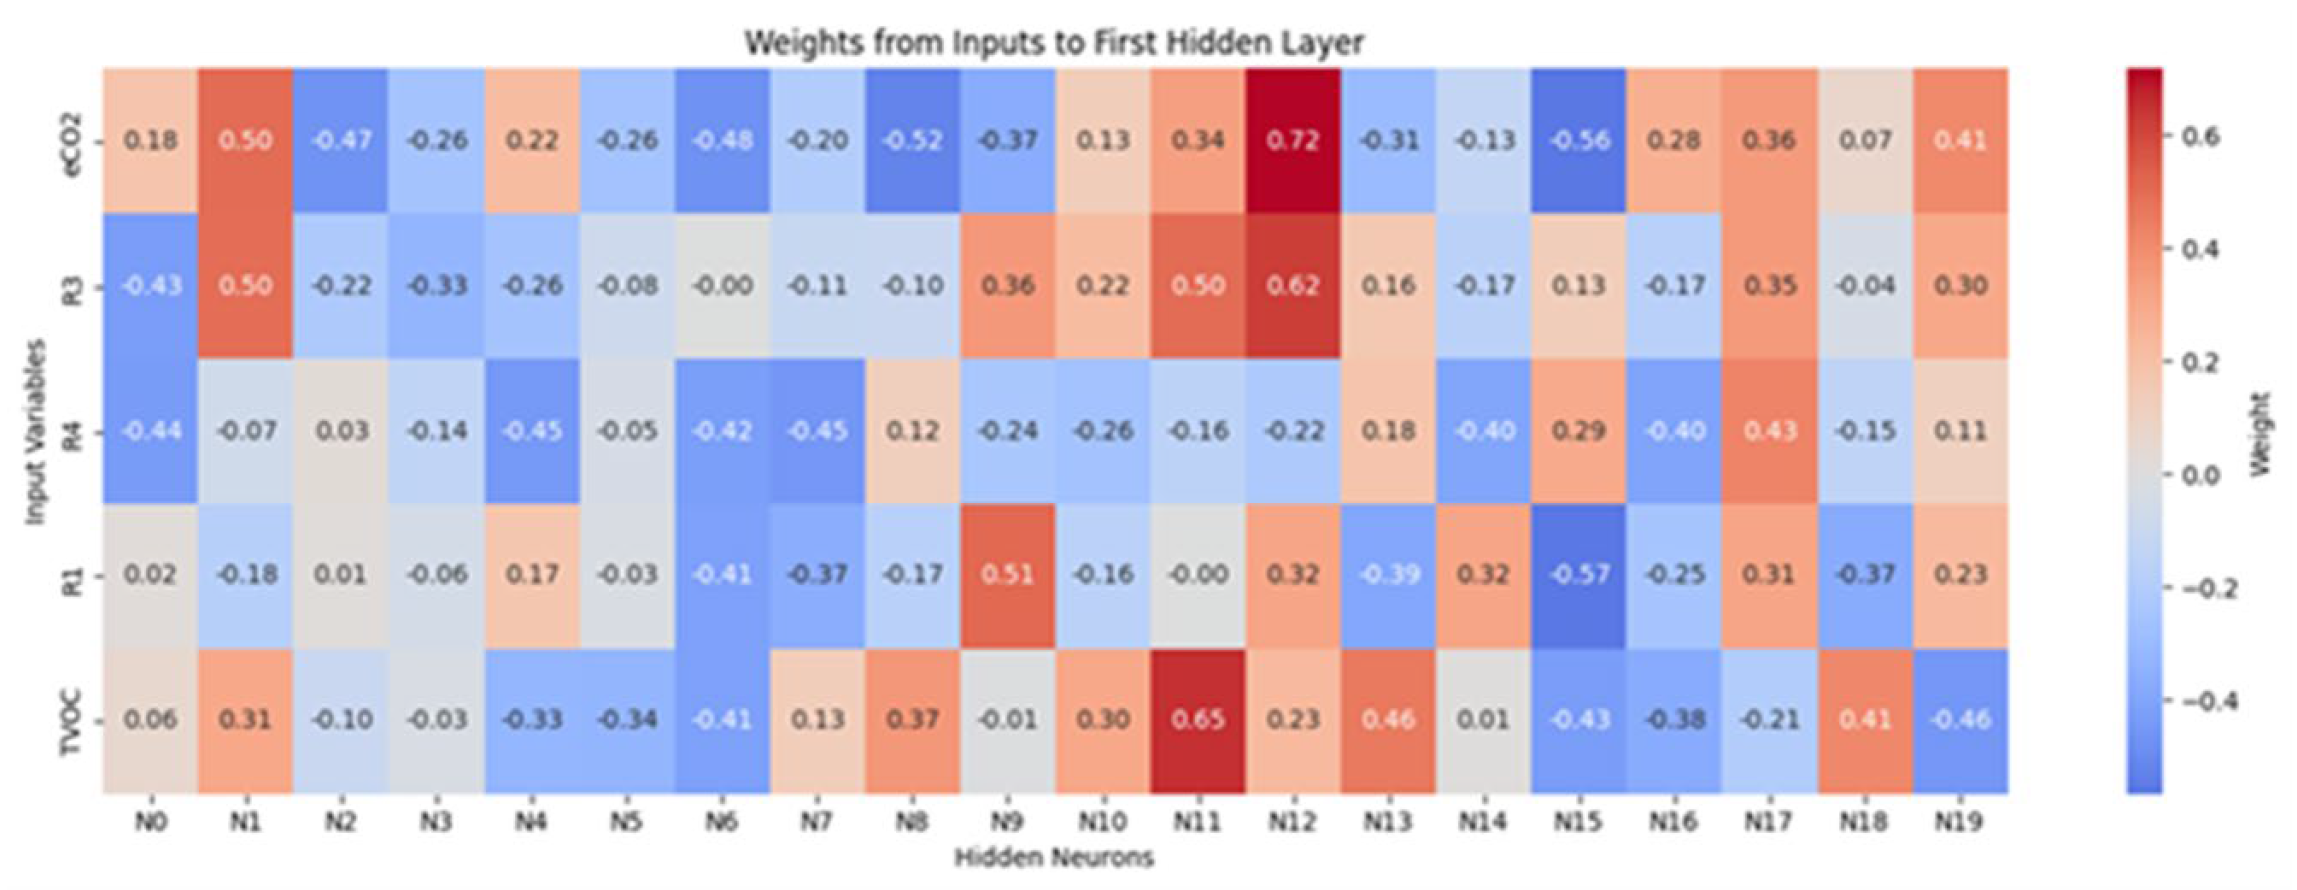
Figure 17.
Connection weights from hidden layer neurons to output classes.
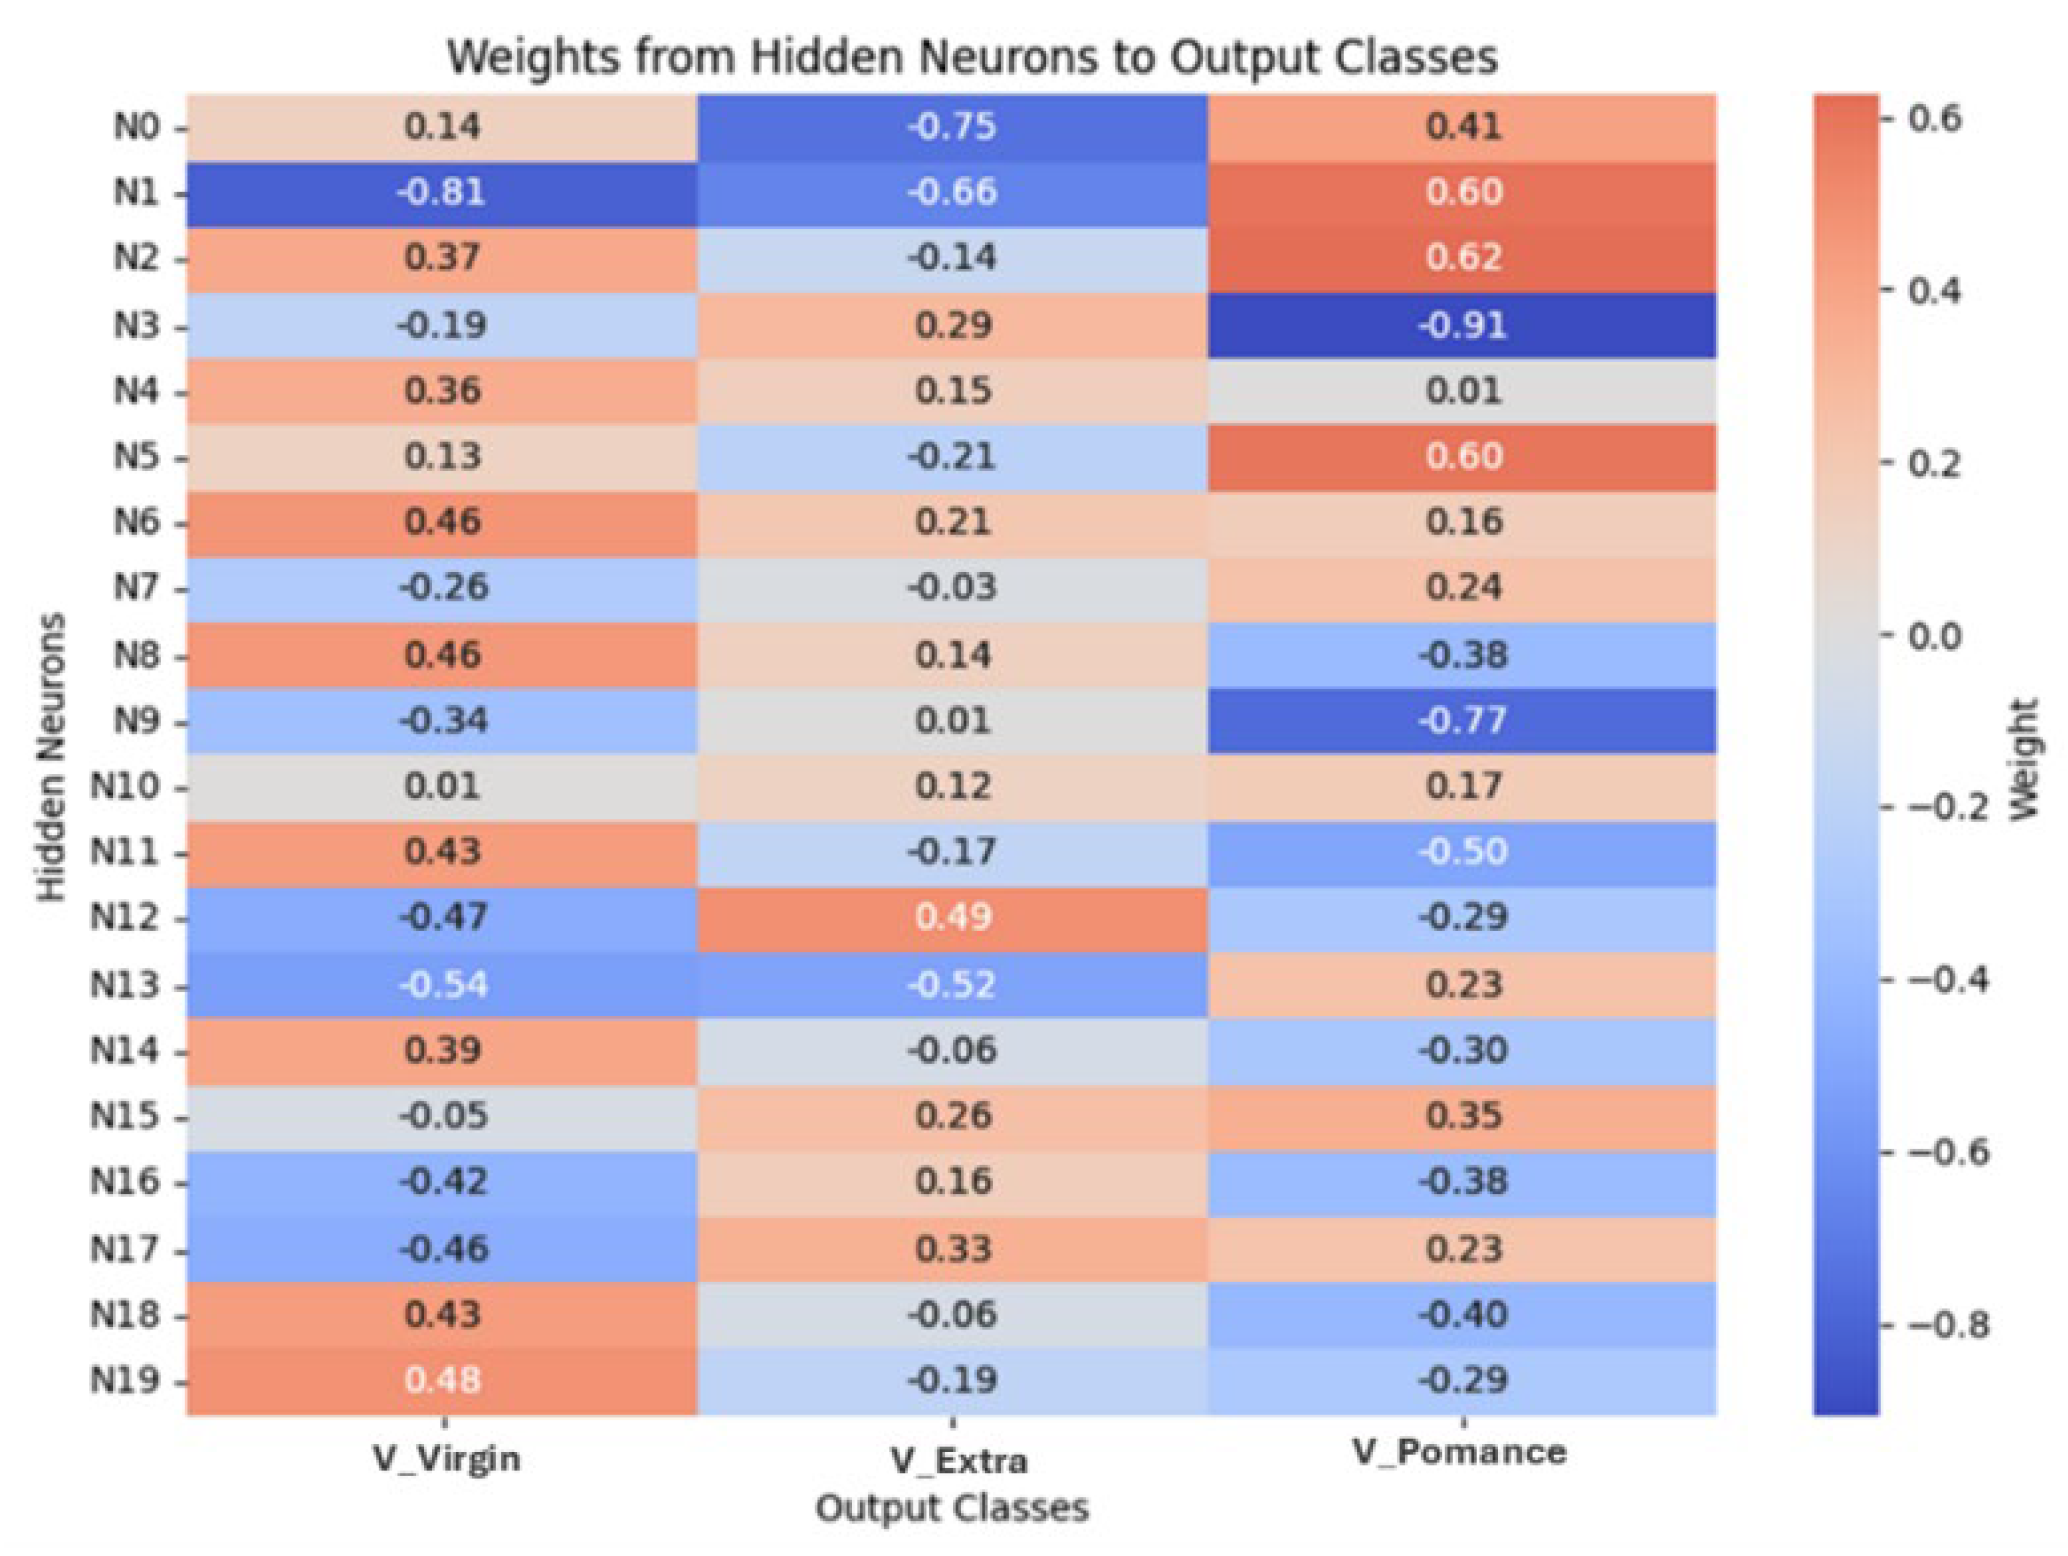
Figure 18.
Confusion matrix for classification of pure and adulterated olive oils.
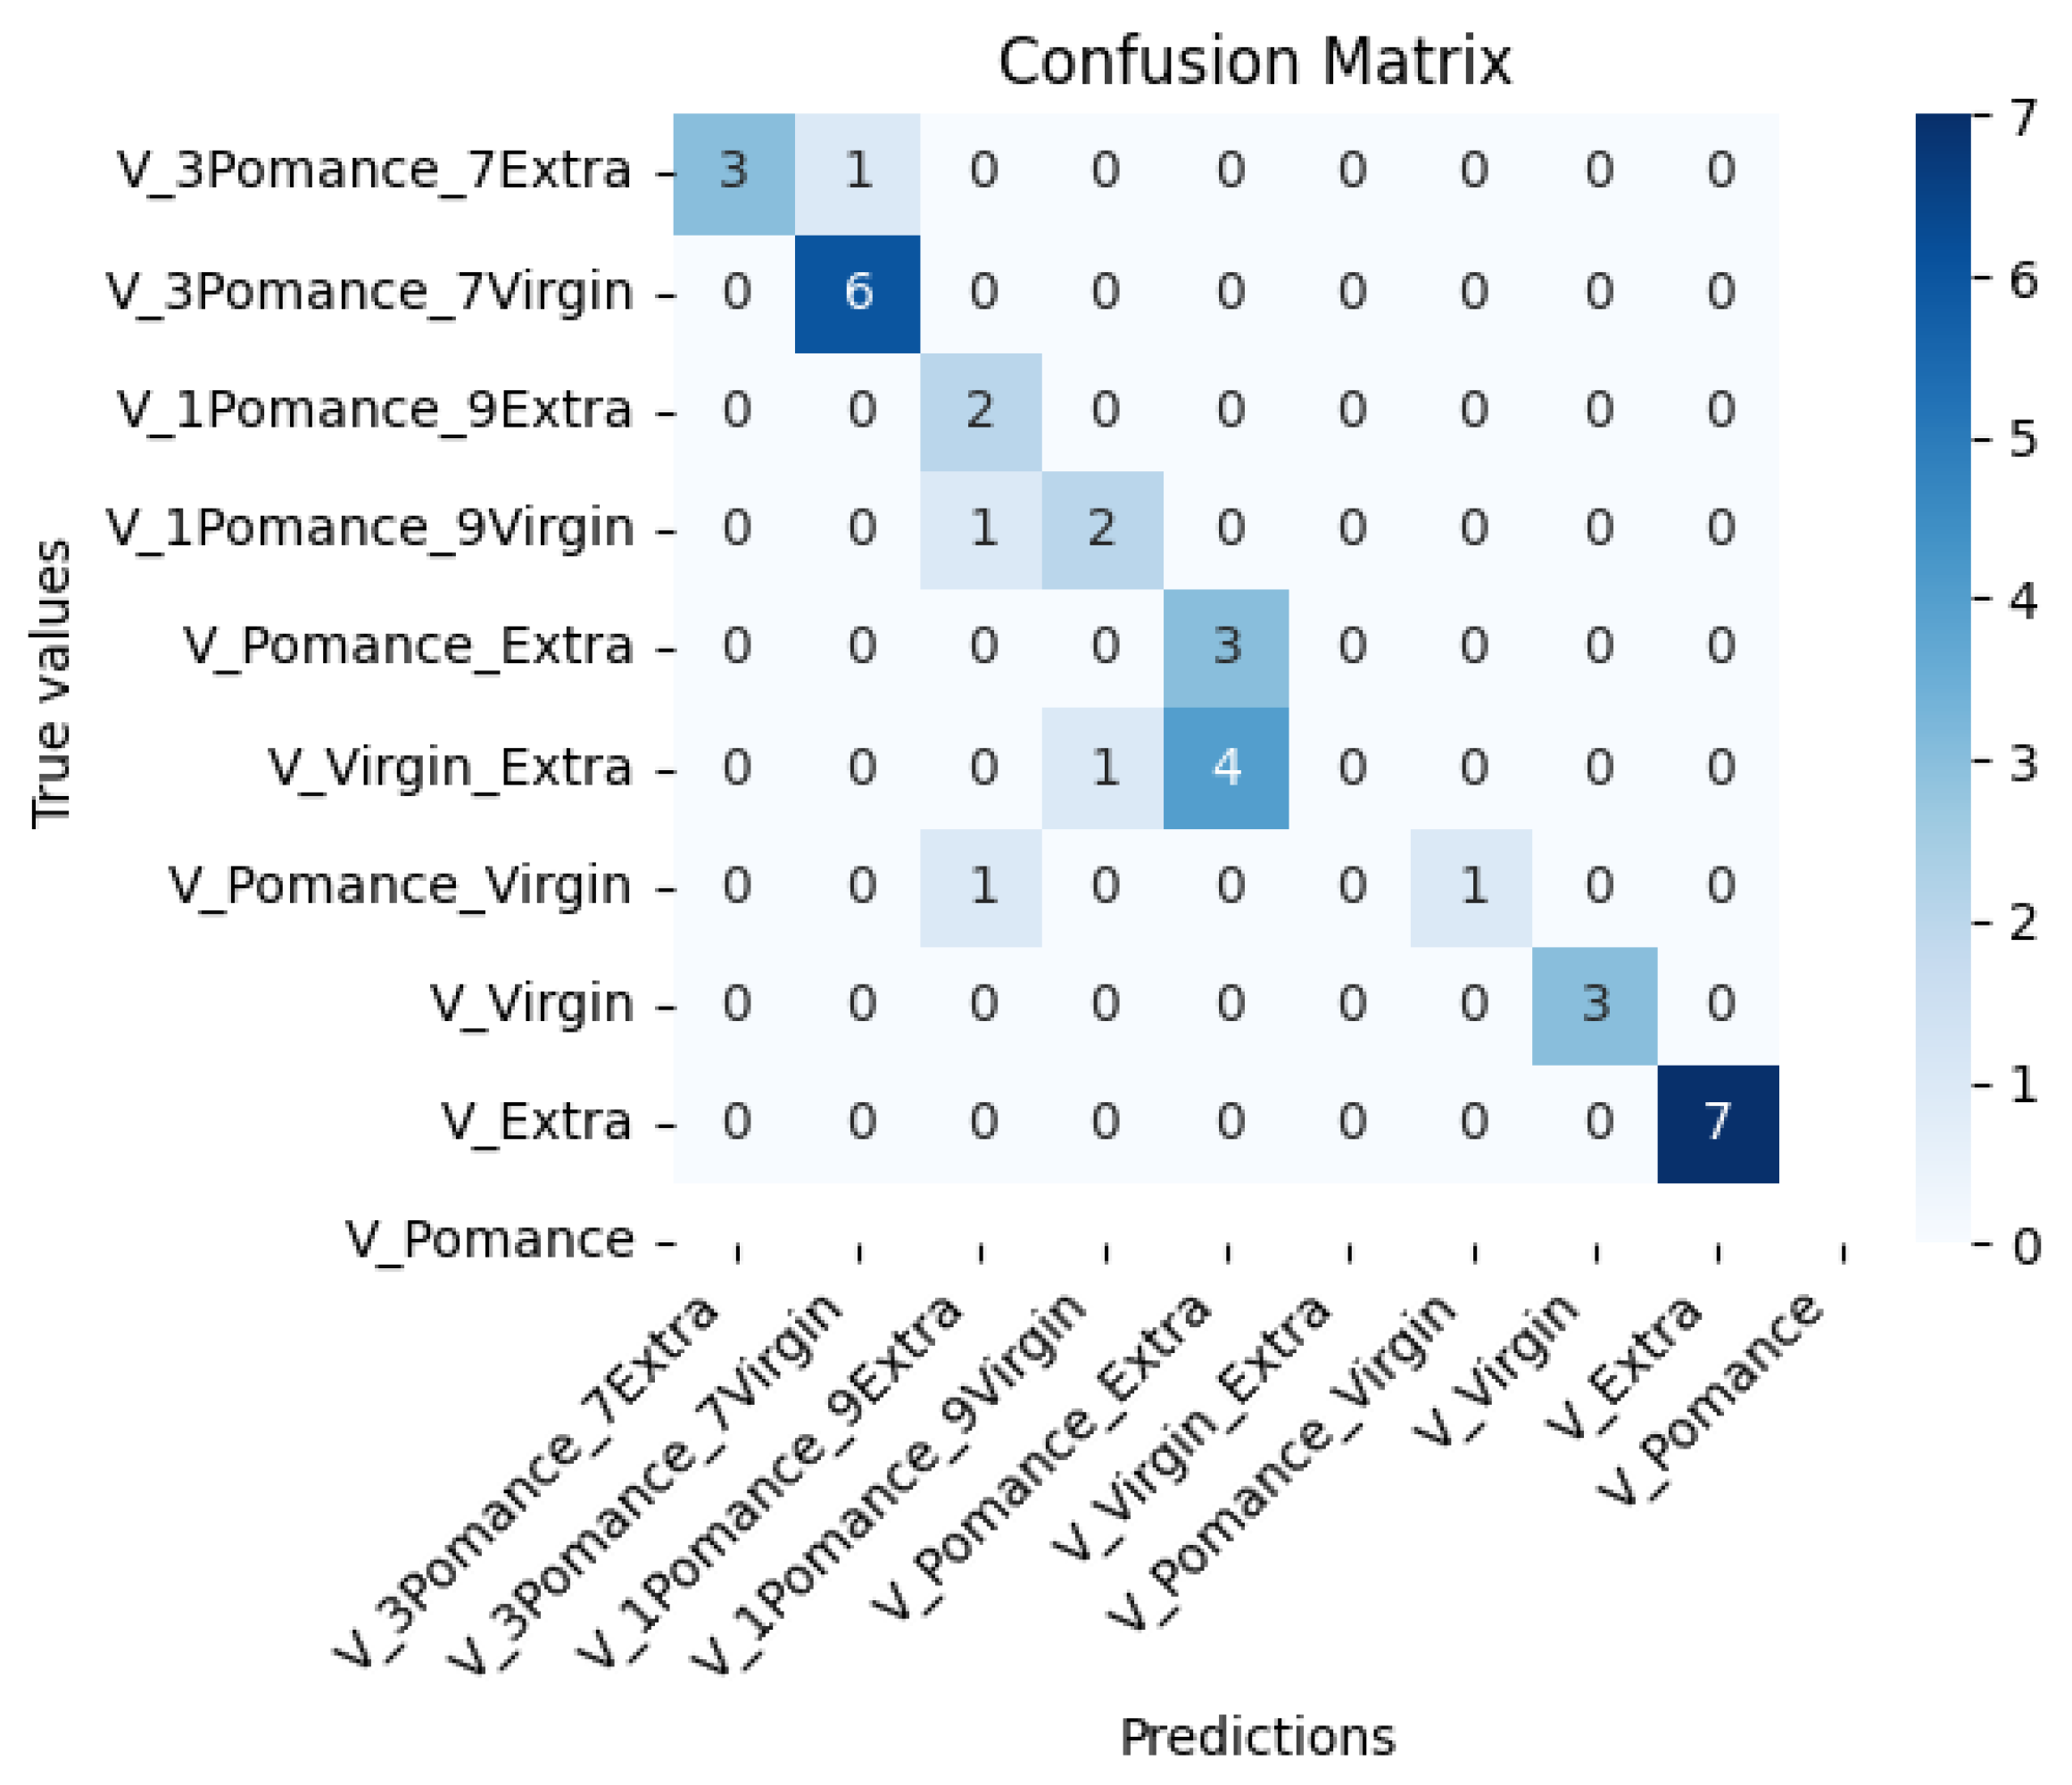
Figure 19.
Training and validation performance of the neural network for olive oil adulteration detection.
Figure 19.
Training and validation performance of the neural network for olive oil adulteration detection.
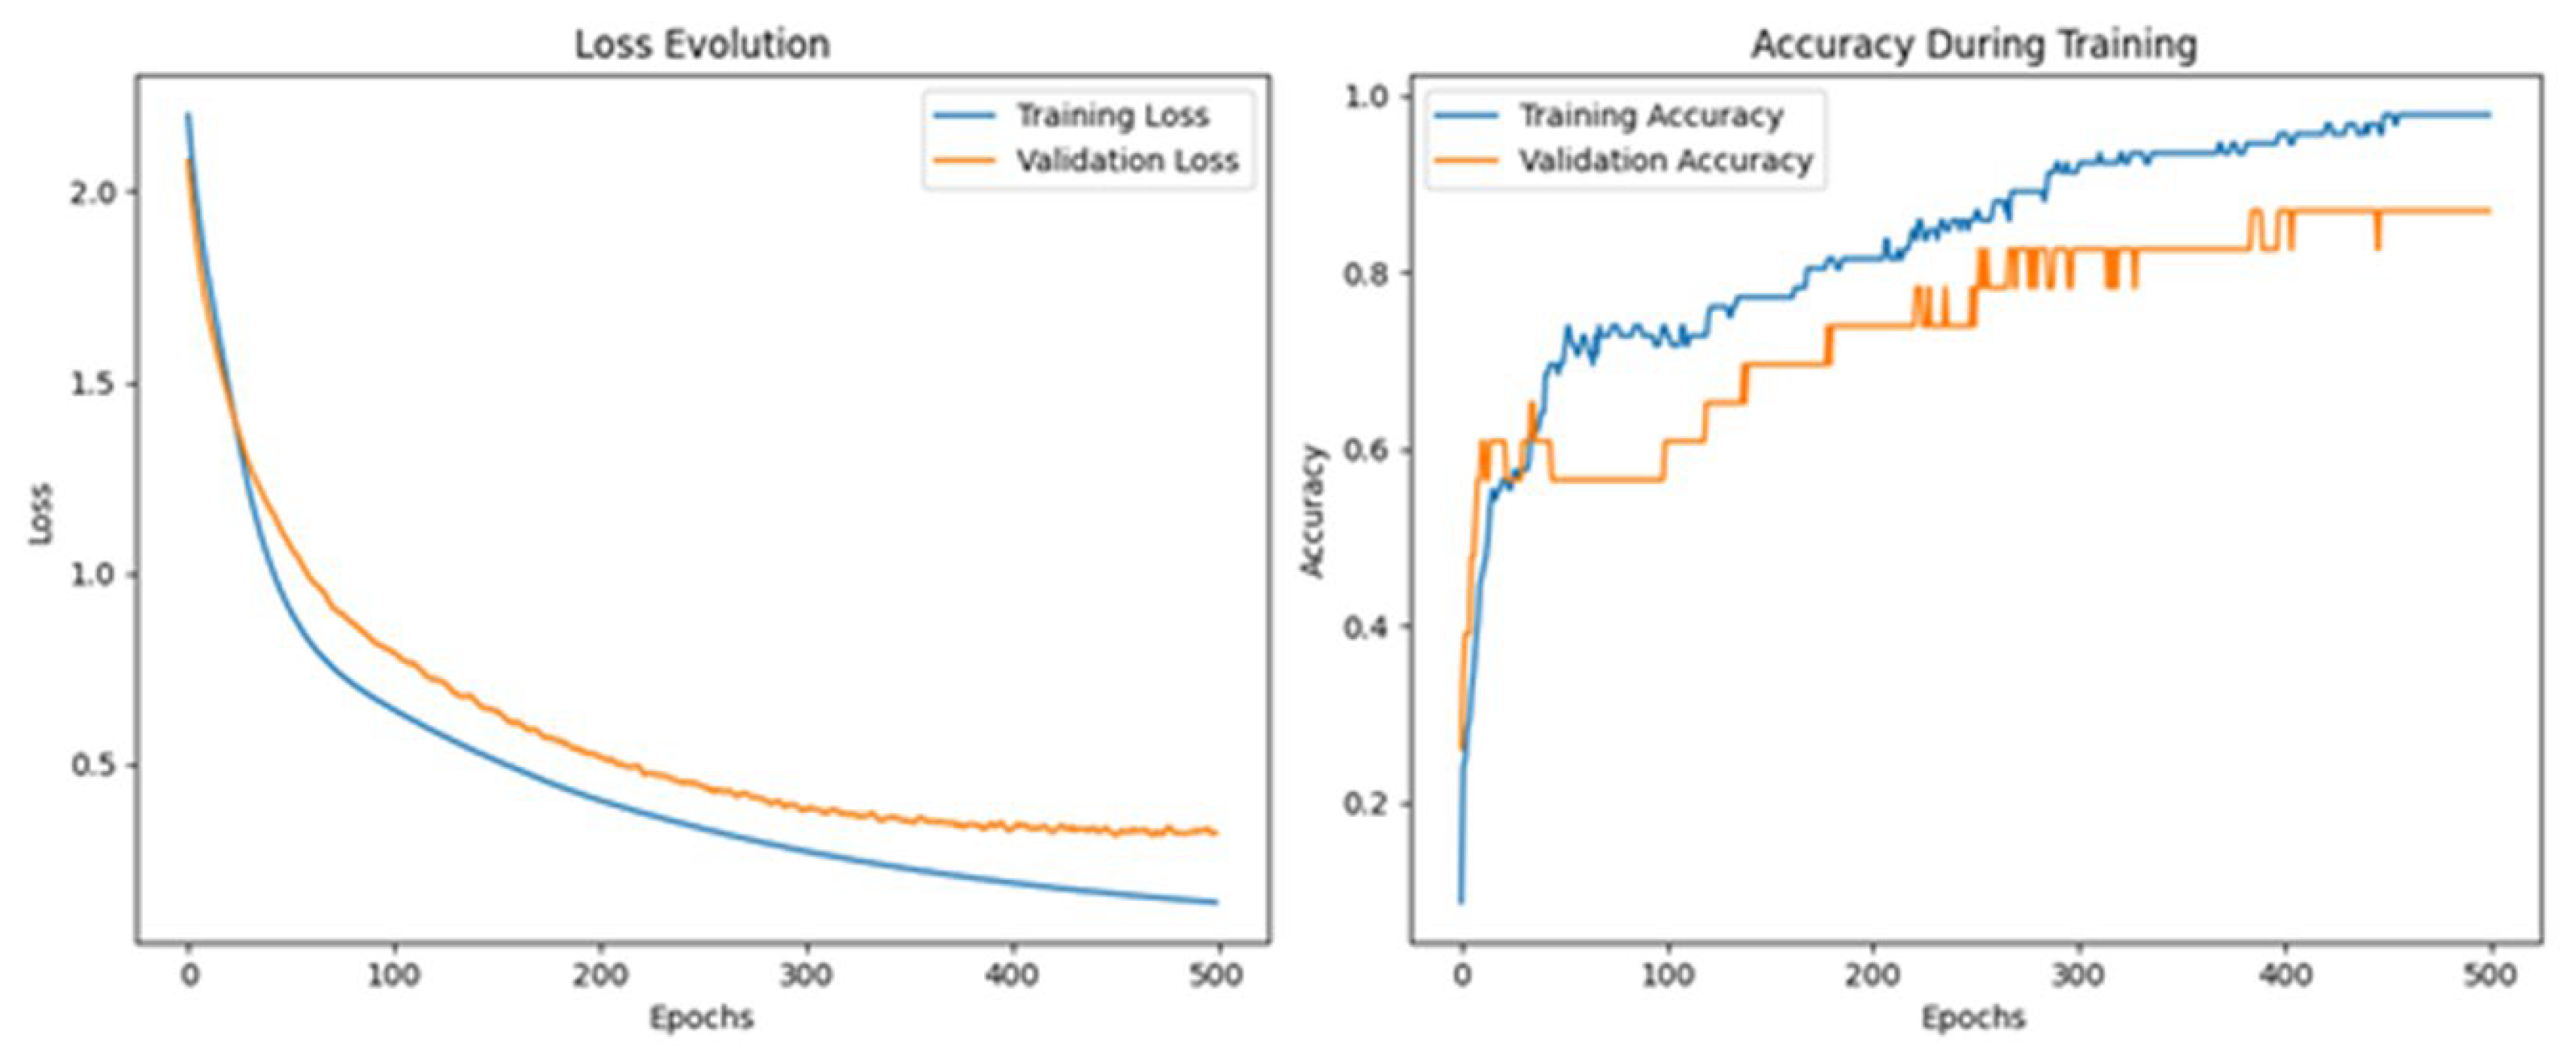
Figure 20.
Hierarchical clustering of pure and adulterated olive oil samples based on sensor response.
Figure 20.
Hierarchical clustering of pure and adulterated olive oil samples based on sensor response.
Figure 21.
Synaptic weights from input features to neurons in the first hidden layer (deep network).
Figure 21.
Synaptic weights from input features to neurons in the first hidden layer (deep network).
Figure 22.
Synaptic weights from hidden neurons to output classes in extended olive oil classification.
Figure 22.
Synaptic weights from hidden neurons to output classes in extended olive oil classification.

Table 1.
Schematic representation of the analyzed oil samples, indicating the number of replicates performed, the analytical techniques employed, and the total number of samples subjected to analysis.
Table 1.
Schematic representation of the analyzed oil samples, indicating the number of replicates performed, the analytical techniques employed, and the total number of samples subjected to analysis.
| Sample | Replicate (R) | Techniques | Sample Number |
|---|---|---|---|
| EVOO (20mL for GC-MS); EVVO (50mL for e-nose) | |||
| R1 | GC-MS SPME; | 1 | |
| e-nose | |||
| EVOO (20mL for GC-MS); EVVO (50mL for e-nose) | R2 | GC-MS SPME; | 2 |
| e-nose | |||
| EVOO (20mL for GC-MS); EVVO (50mL for e-nose) | R3 | GC-MS SPME; e-nose |
3 |
| POO (50mL) | R1 | GC-MS SPME; e-nose |
4 |
| POO (50mL) | R2 | GC-MS SPME; e-nose |
5 |
| POO (50mL) | R3 | GC-MS SPME; e-nose |
6 |
| OO (50mL) | R1 | GC-MS SPME; e-nose |
7 |
| OO (50mL) | R2 | GC-MS SPME; e-nose |
8 |
| OO (50mL) | R3 | GC-MS SPME; e-nose |
9 |
| 50% adulteration: (50mL) EVOO + (50 mL) POO | R1 | e-nose | 10 |
| 50% adulteration: (50mL) EVOO + (50 mL) POO | R2 | e-nose | 11 |
| 50% adulteration: (50mL) EVOO + (50 mL) POO | R3 | e-nose | 12 |
| 50% adulteration: (50mL) EVOO + (50 mL) OO | R1 | e-nose | 13 |
| 50% adulteration: (50mL) EVOO + (50 mL) OO | R2 | e-nose | 14 |
| 50% adulteration: (50mL) EVOO + (50 mL) OO | R3 | e-nose | 15 |
| 50% adulteration: (50mL) POO + (50 mL) OO | R1 | e-nose | 16 |
| 50% adulteration: (50mL) POO + (50 mL) OO | R2 | e-nose | 17 |
| 50% adulteration: (50mL) POO + (50 mL) OO | R3 | e-nose | 18 |
| 30% adulteration: (70mL) EVOO + (30 mL) OO | R1 | e-nose | 19 |
| 30% adulteration: (70mL) EVOO + (30 mL) OO | R2 | e-nose | 20 |
| 30% adulteration: (70mL) EVOO + (30 mL) OO | R3 | e-nose | 21 |
| 30% adulteration: (30mL) POO + (70 mL) OO | R1 | e-nose | 22 |
| 30% adulteration: (30mL) POO + (70 mL) OO | R2 | e-nose | 23 |
| 30% adulteration: (30mL) POO + (70 mL) OO | R3 | e-nose | 24 |
| 10% adulteration: (10mL) POO + (90 mL) EVVOO | R1 | e-nose | 25 |
| 10% adulteration: (10mL) POO + (90 mL) EVVOO | R2 | e-nose | 26 |
| 10% adulteration: (10mL) POO + (90 mL) EVVOO | R3 | e-nose | 27 |
| 10% adulteration: (10mL) POO + (90 mL) OO | R1 | e-nose | 28 |
| 10% adulteration: (10mL) POO + (90 mL) OO | R2 | e-nose | 29 |
| 10% adulteration: (10mL) POO + (90 mL) OO | R3 | e-nose | 30 |
Table 2.
Sensors used in the device.
| Sensor | Manufacturer | Type | Signal Measured |
|---|---|---|---|
| SHT40 | Sensirion | Temperature/ Humidity |
Temperature (°C), Relative humidity (%) |
| ENS160 | Sensirion | MOX | Eco2 (ppm), TVOCs (ppm), Air quality Index (AQI), Four resistive elements (Ohms) |
| STC31-R3 | Sensirion | CO2 sensor | CO2 (% vol) |
| data | data | data |
Table 3.
Volatile compounds detected by GC–MS SPME for each oil. Each compound is presented in terms of abundance (a dimensional variable) represented the average of three biological replicas.
Table 3.
Volatile compounds detected by GC–MS SPME for each oil. Each compound is presented in terms of abundance (a dimensional variable) represented the average of three biological replicas.
| OO | EVOO | POO | ||||
|---|---|---|---|---|---|---|
| Code: 25-L-CR051 |
Code: 25-L-CR052 |
Code: 25-L-CR050 |
||||
| RT | Volatile compounds | CAS | Absolute area | Absolute area | Absolute area | Description |
| 5,76 | Heptane | 142-82-5 | nd* | nd | 9,66E+05 | Linear saturated hydrocarbon composed of a straight chain of seven carbon atoms fully saturated with hydrogen [19]. |
| 7,82 | n-Octane | 111-65-9 | 1,50E+07 | 1,61E+07 | 2,75E+06 | Single chain of eight carbon atoms bonded to eighteen hydrogen atoms [19]. |
| 8,52 | Cyclohexane, 1,3-dimethyl-, cis- | 638-04-0 | nd | nd | 1,26E+06 | Chemical compound; six-carbon cycloalkane with methyl groups at positions 1 and 3. Exists as two geometric isomers: cis and trans [20]. |
| 9,52 | Octene | 111-66-0 | 1,11E+06 | 1,22E+06 | nd | Linear alpha-olefin with double bond at position 1. Industrially produced from ethylene; used as comonomer in polyethylene and in hydroformylation to produce linear aldehydes [21]. |
| 11,83 | Ethylcyclohexane | 1678-91-7 | nd | nd | 1,20E+06 | Saturated hydrocarbon: ethyl group bound to a cyclohexane ring. Found in petroleum as a naphthene; produced by hydrogenation of ethylbenzene or hydrodeoxygenation of lignin [22]. |
| 12,20 | n-Nonane | 111-84-2 | nd | nd | 2,50E+05 | Straight-chain alkane; colorless liquid with sharp odor. Volatile oil component and plant metabolite; insoluble in water. Found in various plant species [23]. |
| 12,34 | Acetic acid, ethyl ester , Ethyl acetate | 141-78-6 | 8,59E+06 | 2,51E+06 | 3,90E+05 | Sweet-smelling, colorless, flammable ester of ethanol and acetic acid. Widely used as a solvent in paints, nail polish, decaffeination, perfumes, and wine; also used for insect collection [24]. |
| 12,82 | Acetic acid, hydroxy- (Glycolic acid) | 79-14-1 | 1,41E+07 | 1,52E+07 | 1,27E+07 | Functions as a metabolite and keratolytic agent. Used in cosmetics and dermatology; safe up to 10% (pH ≥ 3.5) in consumer products [25]. |
| 13,79 | Pentanal | 110-62-3 | 9,87E+05 | 1,06E+06 | nd | Alkyl aldehyde; colorless volatile liquid with fruity, nutty odor. Produced via hydroformylation of butene; used in fragrance synthesis and as intermediate for plasticizers [26]. |
| 14,07 | butanal, 3-methyl | 590-86-3 | 8,20E+05 | 9,58E+05 | nd | Branched aldehyde with a methyl group at position 3; volatile compound found in olives. Acts as flavoring agent, plant metabolite, and product of yeast metabolism [27]. |
| 15,70 | Hexane, 1-methoxy- (Hexyl methyl ether) | 4747-07-3 | 1,57E+07 | 1,76E+07 | nd | Colorless liquid with characteristic odor. Contains a methyl group bonded to a hexane chain via oxygen; primarily used as a solvent [25]. |
| 16,70 | 3-buten-1-ol | 627-27-0 | 8,32E+05 | 1,27E+06 | nd | Organic compound belonging to the class of unsaturated alcohols. In the food sector, it can be detected as a volatile compound in certain vegetable oils [25]. |
| 17,85 | 3-pentanone | 96-22-0 | 3,56E+06 | 1,89E+06 | nd | Also known as diethyl ketone, is a simple symmetrical dialkyl ketone, with an odor like that of acetone [28]. |
| 17,95 | 3-methylbutanal | 590-86-3 | 1,03E+06 | 8,49E+05 | nd | Aldehyde, a colorless liquid and found in low concentrations in many types of food. Commercially it is used as a reagent to produce pharmaceuticals, perfumes and pesticides [29]. |
| 18,28 | Decane | 124-18-5 | 3,28E+06 | 3,06E+06 | 1,60E+06 | Linear molecule of 10 carbons with a non-define scent found in olive oil [30]. |
| 19,31 | 3-Ethyl-1,5-octadiene (c,t) | 105-54-4 | 3,72E+06 | 6,72E+06 | nd | 3-ethyl-1,5-octadiene is an alkadiene that is 1,5-octadiene substituted by an ethyl group at position 3. Has a non-define scent [3]. |
| 19,55 | Methyl 3(Z)-Hexenyl Ether | 70220-06-3 | 8,87E+06 | 7,83E+06 | nd | Fragrance and flavoring agent with green, fruity, slightly floral scent; methyl ether of (Z)-3-hexen-1-ol; used in flavors, fragrances, and potentially in coatings [31]. |
| 20,18 | alfa-pinene | 80-56-0 | 4,41E+05 | nd | nd | Bicyclic monoterpene, a volatile organic compound commonly found in essential oils from conifers and various aromatic plants. It exhibits anti-inflammatory, antimicrobial, antioxidant, and bronchodilator properties, making it useful in traditional and pharmaceutical applications [32]. |
| 21,48 | Ethyl Butanoate | 105-54-4 | 1,03E+06 | 3,34E+05 | nd | It is soluble in propylene glycol, paraffin oil, and kerosene. It has a fruity odor and is a key ingredient used as a flavor enhancer in processed orange juices. It also occurs naturally in many fruits, albeit at lower concentrations [33]. |
| 22,42 | Butanoic acid, 2-methyl-, ethyl ester | 7452-79-1 | 1,73E+06 | 3,44E+05 | nd | Also known as ethyl 2-methylbutyrate. It is a fruity-scented volatile ester, used as a flavoring agent and naturally found in wines, strawberries, blueberries, apples and olive [34]. |
| 23,43 | Butanoic acid, 3-methyl-, ethyl ester | 108-64-5 | 4,33E+05 | nd | nd | It has a fruity odor and flavor and is used in perfumery and as a food additive [35]. |
| 24,44 | Hexanal | 66-25-1 | 8,60E+06 | 1,12E+07 | 2,11E+06 | Also called hexanaldehyde or caproaldehyde, it is an alkyl aldehyde. Its scent resembles freshly cut grass, with a powerful, penetrating characteristic fruity odor and taste. It occurs naturally and contributes to the flavor in green peas [36]. |
| 24,65 | 1-Propanol, 2-methyl- | 78-83-1 | 2,21E+06 | 1,31E+06 | nd | Also called isobutanol. It’s produced by the carbonylation of propylene. Has ethereal, winey and cortex notes [37]. |
| 26,74 | Isoamyl acetate | 123-92-2 | 2,87E+06 | 1,10E+06 | nd | Colorless liquid, slightly soluble in water, highly soluble in organic solvents. Strong banana-like odor; used as food flavoring. Naturally from bananas or synthetically produced; also, a bee alarm pheromone [38]. |
| 27,20 | methyl laureate | 111-82-0 | 5,01E+05 | 5,61E+05 | nd | Fatty acid methyl ester of lauric acid; occurs in olive, fruits (e.g., grape, melon, pineapple), cheeses, wines, and spirits. Used as a flavoring agent; classified as a fatty acid ester [39]. |
| 27,44 | 2-pentenal | 623-36-9 | 6,24E+05 | 6,81E+05 | nd | Aldehyde found in cigarette smoke, virgin olive oil, and milk. It has a role as a plant metabolite [40]. |
| 28,72 | 1-Penten-3-ol | 616-25-1 | 1,66E+06 | 1,80E+06 | nd | Alcohol with pungent horseradish-like odor and tropical notes when diluted; used to enhance green, cucumber, melon, berry, and vegetable accords in fragrances [40]. |
| 30,33 | Dodecane | 112-40-3 | 3,50E+06 | 2,26E+06 | 1,29E+06 | Linear branched molecule consisting of decane with 12 carbon atoms. It is a clear colorless liquid isolated from the essential oils of various plants including Zingiber officinale (ginger). It has a role as a plant metabolite is a natural product found in Erucaria microcarpa, with a balsamic scent found in olive oil [41]. |
| 30,50 | Heptanal | 111-71-7 | 1,28E+06 | 1,67E+06 | 3,60E+05 | Aliphatic aldehyde; colorless liquid with strong fruity odor. Naturally found in ylang-ylang, clary sage, lemon, bitter orange oils, and in olives at low levels [42]. |
| 31,18 | Limonene | 138-86-3 | 8,53E+05 | 9,85E+05 | 7,20E+05 | Limonene is a volatile hydrocarbon, a cycloolefin classified as a cyclic monoterpene, lemon-like odor that can be found in the rind of citrus fruits [43]. |
| 31,34 | Isoamyl alcohol | 123-51-3 | 1,12E+07 | 3,88E+06 | nd | Isomeric alcohol: natural ester used in banana oil and as flavoring, also present in black truffle aroma. By-product of cereal fermentation, found in alcoholic beverages; component of hornet alarm pheromone [44]. |
| 32,55 | 2-hexenal | 505-57-7 | 4,98E+07 | 3,06E+07 | nd | 2-Hexenal is a chemical compound of the aldehyde group. Imparts fresh, green, and natural top note in fruity floral types. Apple, berry, and other fruit flavors. Also, citrus flavors, especially orange juice [41]. |
| 32,65 | 3,5-dimethyl-4-aza-4-heptene | 38836-40-7 | 8,56E+07 | 1,32E+08 | nd | Heterocyclic compound containing a nitrogen atom as part of a seven-membered ring, with two methyl groups attached to the carbon atoms at positions 3 and 5, and an ethyl group and a methyl group attached to the carbon at position 4 [44]. |
| 33,65 | 1-Pentanol | 71-41-0 | 7,32E+05 | 2,58E+05 | nd | It’s an alcohol with five carbon atoms. Pungent, fermented, bready, yeasty, fusel, winey and solvent-like smell [41]. |
| 33,94 | Trans-β-Ocimene | 3779-61-1 | 6,83E+06 | 7,88E+06 | nd | β-Ocimene is trans-3,7-dimethyl-1,3,6-octatriene. Exists in two stereoisomeric forms, cis and trans, with respect to the central double bond. The ocimenes are often found naturally as mixtures of the various forms. Complex note, mainly herbal lavender with green citrus, metallic and mango nuances [45]. |
| 34,69 | Styrene (Ethenylbenzene) | 100-42-5 | 2,11E+06 | 4,40E+05 | nd | Aromatic hydrocarbon. The vinyl group attached to the aromatic ring is highly reactive, as the ring can delocalize charges and unpaired electrons to the ortho and para positions through various resonance forms [46]. |
| 35,04 | n-hexyl acetate | 142-92-7 | 1,15E+07 | 1,32E+07 | nd | Hexyl acetate is the acetate ester of hexan-1-ol. Green fruity note reminiscent of apple, pear [47]. |
| 36,11 | Octanal | 124-13-0 | 9,11E+05 | 1,11E+06 | nd | Colorless fragrant liquid with fruity odor; naturally in citrus and olive oils. Used in perfumes and as a flavoring in food industry [48]. |
| 36,21 | 3-hydroxy-2-butanone | 513-86-0 | 2,05E+06 | 8,07E+05 | nd | Chemical used in food flavoring and fragrances; intermediate in microbial butanediol cycle; also serves as an aroma carrier in flavors and essences [48]. |
| 36,74 | (E)-4,8-Dimethyl-1,3,7-nonatriene | 19945-61-0 | 5,27E+06 | 5,85E+06 | nd | Alkatriene consisting of 4,8-dimethylnonane having the three double bonds in the 1-, 3- and 7-positions [49]. |
| 37,41 | 3-Hexen-1-ol, acetate, (Z)- | 3681-71-8 | 9,39E+07 | 1,34E+08 | nd | Acetate ester from acetic acid and (Z)-hex-3-en-1-ol; metabolite with green, fruity aroma; found in tea, olive, and other plants [50]. |
| 38,13 | 2-Heptenal, (E)- | 18829-55-5 | 2,57E+06 | 2,83E+06 | nd | Monounsaturated fatty aldehyde with a green, fatty aroma; found mainly in pomelo peel, soybean oil, and pulses. Acts as a plant metabolite, food flavoring, and uremic toxin [19]. |
| 38,59 | 6-methyl-5-hepten-2-one | 110-93-0 | 1,08E+06 | 1,09E+06 | nd | Unsaturated methylated ketone; colorless liquid with citrus, fruity odor. Found as a mosquito attractant [51]. |
| 38,85 | 1-Hexanol | 111-27-3 | 3,40E+07 | 2,91E+07 | nd | It’s an organic alcohol with a six-carbon chain. Smells pungent, etherial, fuel oil, fruity and alcoholic, sweet with a green top note [52]. |
| 40,55 | 3-Hexen-1-ol, (Z)- | 928-96-1 | 7,56E+07 | 8,07E+07 | nd | Colorless oily liquid with intense grassy-green odor; produced by most plants as insect attractant. Key aroma compound in flavors and perfumes; used in fruit and vegetable notes [53]. |
| 41,29 | Nonanal | 124-19-6 | 9,32E+06 | 1,37E+07 | 9,78E+05 | It’s a formally saturated fatty aldehyde resulting from the reduction of the carboxyl group of nonanoic acid. Waxy, rose and orange peel [41]. |
| 41,50 | 2-Hexen-1-ol, (E)- | 928-95-0 | 1,59E+07 | 8,83E+06 | nd | Primary allylic alcohol derived from 2-hexene; acts as a plant metabolite. Classified as an alkenyl and allylic alcohol [54]. |
| 43,75 | Acetic acid | 64-19-7 | 3,29E+07 | 6,51E+06 | 6,72E+05 | Colorless, acidic liquid; main component of vinegar. Widely used in food, chemical industry, and as acidity regulator. Central to metabolism (acetyl group) [55]. |
| 44,88 | trans,trans-2,4-heptadienal | 4313-03-5 | 1,40E+06 | 1,02E+06 | nd | Heptadienal with double bonds at positions 2 and 4 (E,E-isomer); used as a flavoring agent [56]. |
| 46,06 | .alpha.-Copaene | 3856-25-5 | 2,30E+06 | 1,68E+06 | nd | It’s an oily liquid hydrocarbon found in several plants that produce essential oils. Scents reminiscent of honey, spicy or woody notes [57]. |
| 47,59 | 2,3-Butanediol | 513-85-9 | 1,72E+06 | 8,12E+05 | nd | Organic compound; colorless vic-diol liquid. Occurs naturally in olive oil, cocoa butter, sweet corn, and rotten mussels. Used in plastics, pesticides, and GC carbonyl compound resolution [58]. |
| 47,73 | .alpha.-terpinolene | 586-62-9 | 7,31E+05 | 7,29E+05 | nd | Natural terpene found in lilac, sage, rosemary, nutmeg, conifers, olive, and tea tree oil. Colorless to pale yellow liquid with woody, citrus-like odor; slightly bitter at high concentrations [56]. |
| 47,93 | Benzaldehyde | 100-52-7 | 1,16E+06 | 1,05E+06 | 4,73E+05 | Aromatic aldehyde; colorless volatile liquid with characteristic bitter almond odor. Naturally occurs in apricot, cherry, and almond seeds (as amygdalin precursor) [59]. |
| 48,17 | n-Octanol | 111-87-5 | 1,75E+06 | 2,19E+06 | nd | Eight-carbon alcohol; colorless liquid with characteristic odor. Hydrophobic and water-immiscible; used to determine partition coefficients of chemicals [59]. |
| 51,32 | Butanoic acid | 107-92-6 | 1,06E+06 | 2,03E+05 | nd | Carboxylic acid found esterified in natural fats and released during fat rancidification (e.g., in butter, aged cheeses, olive). Has a pungent odor at high concentration; contributes to characteristic aroma of fermented dairy at low levels. Formed via butyric fermentation of sugars and used in the synthesis of flavor and fragrance esters [60]. |
| 51,99 | Benzoic acid, methyl ester | 93-58-3 | 1,32E+06 | 1,83E+06 | nd | Methyl ester of benzoic acid; colorless liquid with pleasant floral odor. Found naturally in some plants; used in perfumes and as a scent marker in canine training. Poorly soluble in water, well soluble in organic solvents [61]. |
| 52,48 | (E)-2-Decenal | 3913-81-3 | 2,90E+06 | 3,05E+06 | nd | Oily aldehyde with strong waxy odor; occurs in coriander, meats, fruits, and various foods. Used as flavoring agent and also acts as pheromone [62]. |
| 56,09 | Farnesene | 502-61-4 | 7,92E+06 | 1,04E+07 | nd | Group of sesquiterpene isomers, including α- and β-farnesene; differ by double bond position. Found in green apple peel, cannabis, ginger, hop, and other plants. Acts as an insect alarm pheromone (e.g., aphids) and contributes to fruity, woody, and citrus aromas [63]. |
| 58,32 | Benzoic acid, 2-hydroxy-, methyl ester | 119-36-8 | 1,50E+06 | 1,97E+06 | nd | Also known as methyl salicylate; colorless liquid with characteristic odor. Found in wintergreen oil; used in flavors, fragrances, and as a counterirritant in topical medications [64]. |
| 61,44 | Benzenemethanol | 100-51-6 | 1,22E+06 | 8,37E+05 | nd | Aromatic alcohol; clear, colorless liquid with pleasant odor. Used as solvent, antioxidant, fragrance, and chemical intermediate; may cause irritation on contact [65]. |
| 62,78 | phenylethyl alcohol | 60-12-8 | 4,50E+06 | 2,12E+06 | nd | Aromatic alcohol with rose-like scent; naturally found in rose, peppermint, hyacinth, and orange blossom. Used in perfumes, soaps, and as antimicrobial agent; slightly soluble in water [66]. |
* nd = ‘not detected’, the compound was not detected in any of the three biological replicas or was found only in one of them.
Disclaimer/Publisher’s Note: The statements, opinions and data contained in all publications are solely those of the individual author(s) and contributor(s) and not of MDPI and/or the editor(s). MDPI and/or the editor(s) disclaim responsibility for any injury to people or property resulting from any ideas, methods, instructions or products referred to in the content. |
© 2025 by the authors. Licensee MDPI, Basel, Switzerland. This article is an open access article distributed under the terms and conditions of the Creative Commons Attribution (CC BY) license (http://creativecommons.org/licenses/by/4.0/).
Copyright: This open access article is published under a Creative Commons CC BY 4.0 license, which permit the free download, distribution, and reuse, provided that the author and preprint are cited in any reuse.


