Submitted:
18 November 2025
Posted:
20 November 2025
You are already at the latest version
Abstract
CpG islands in vertebrate genomes are associated not only with housekeeping genes but also with some tissue-restricted genes, including those that comprise the alpha-like globin gene clusters of humans and rabbits. The facts that CpG islands are unmethylated in all tissues (even those not expressing the genes) and that they adopt a unique chromatin structure may have influenced the evolution of mechanisms by which alpha-globin genes are regulated to achieve expression in the correct tissues and the proper developmental stage. We have shown that CpG islands from the alpha-globin gene cluster have positive effects on gene expression, which requires integration into chromosomes and hence is likely to be mediated by effects on chromatin. The potential for a DNA sequence to form a nucleosome complex with core histones is influenced by the topology of that DNA molecule in solution. In light of the unique sequence profile of CpG islands, we tested whether CpG island DNA has a different affinity for nucleosome formation than non-CpG island DNA in a competitive nucleosome reconstitution assay. We find that CpG island DNA from the rabbit alpha-globin gene has a relatively low affinity for core histones in this system. This lower affinity was observed regardless of the position of the fragment in the gene or 5' flanking region. The lower affinity for CpG island DNA showed a length dependence, with the relative affinity for histones decreasing for longer DNA fragments of CpG island DNA. The results are consistent with predictions based on the functional effects of CpG islands and emerging rules for sequences that can exclude nucleosomes.
Keywords:
chromatin
; gene regulation
; CpG islands
; nucleosome depletion
Introduction
The genomic DNA of eukaryotes is packaged into chromatin by binding histones. The basic structural unit of chromatin is the nucleosome, in which 146 bp of DNA is wrapped 1.75 times around an octamer of histones. Several lines of genetic and biochemical evidence show that structural alterations in chromatin and nucleosomes play a role in the control of eukaryotic gene expression. The structure of the chromatin at important regulatory regions of genes is known to affect the potential for transcription by modulating the access of transcription factors to cis-regulatory elements (reviewed in [1,2,3,4]). This can be achieved by positioning nucleosomes on or away from regulatory sequences, by changing the density of nucleosomes in a region, or by remodeling the structure of the nucleosomes, either during replication or by active enzymatic modification, to allow transcription factor access. Natural DNA sequences differ in their ability to form regularly spaced nucleosomal arrays in vitro [5], indicating that the DNA sequence itself is one determinant of nucleosomal formation. Certain natural and synthetic DNA sequences can form a high affinity site for nucleosome formation. It is thought that the topology assumed by these sequences fits with that required for the tight helical path of DNA around the histone octamer [6]. Topological effects on nucleosome formation are supported by the observation that naturally occurring and synthetic DNA sequences that can form anisotropic bends in a certain periodicity have a relatively high affinity for histones in competitive nucleosome reconstitution assays [6].
CpG islands found in vertebrate genomes are stretches of highly G+C-rich DNA that contain a high frequency of the CpG dinucleotide, often about 0.5 to 1.5 kb in length. They are associated with the 5’ end of all known housekeeping genes [7] and some tissue-specific genes, typically extending from several hundred base pairs upstream of the transcription unit to well within the structural sequences. The CpG dinucleotide is rare in vertebrate genomes because of the mutability of 5-methyl cytosine by deamination to yield thymine. The substrate for the methyl transferase active on vertebrate DNA is the CpG dinucleotide, thus its methylation can lead to conversion to TpG and a loss of CpG over time. Unlike most regulated genes, which are methylated when not expressed, CpG islands and thus the 5’ ends of the associated genes are unmethylated throughout development in all tissues, except when located on an inactive X chromosome (reviewed in [8]). Therefore, the frequency of the CpG dinucleotide in these islands approaches that expected from the local nucleotide composition. The structure of chromatin associated with CpG islands in vivo differs from that of bulk chromatin in that histone H1 is depleted, histones H3 and H4 are hyperacetylated, and some regions are free of nucleosomes [9]. Because CpG islands are associated with the 5’ ends of ubiquitously-expressed genes, there is a possible correlation between the enhanced accessibility of chromatin in these regions to DNase I (and also to transcription factors) and these unique structural features [9]. Thus, the chromatin structure adopted at CpG islands could be one form of a decondensed, transcriptionally active chromatin. However, it is not clear to what extent this unique chromatin structure is determined by the sequence of CpG islands per se, and to what extent it results from active modification and remodeling of the chromatin.
The α-like globin gene clusters from human and rabbit contain several CpG islands, and most are associated with each of the genes in the cluster [10,11]. The rabbit α-globin gene CpG island starts about 600 bp upstream of the transcription start site and extends throughout the sequence of this short gene [12]. Analysis of gene expression in transfected cells revealed positive activities distributed throughout the α-globin CpG island [12,13,14,15,16,17,18]. The activity of the proximal promoter maps to conserved discrete binding sites for nuclear proteins [13]. The upstream and internal regulatory regions also contain specific protein binding sites [18,19], but the positive regulatory activity is dispersed, not localized, and it appears to be an additive general effect of the CpG island sequence [12,17]. Furthermore, many of the positive regulatory effects of the CpG island are seen only after integration of transfected constructs into the host cell genome [12,18], indicative of an effect mediated by alterations of chromatin structure.
One hypothesis to explain these observations is that CpG island DNA can resist repressive chromatin assembly to a greater degree than non-CpG island DNA. In light of the growing evidence for a correlation between DNA sequence and nucleosome formation, we sought to determine whether the unique DNA sequence character of CpG islands results in an inherently different affinity for core histones than non-CpG island sequences in a competitive nucleosome reconstitution assay. Using DNA fragments from the rabbit α- and β-globin genes, we demonstrate that CpG island sequences in fact have a lower propensity for nucleosome formation in this system than non-CpG island DNA. We discuss the relevance of this observation with respect to the characteristic chromatin structure of CpG islands in vivo and a possible connection with reports on the activity of CpG island sequences from the α-globin gene cluster on gene expression.
This manuscript describes the results of experiments conducted over the period 1995-1999. These results were presented in the Ph.D. thesis for Dr. Shewchuk [38] and the Bachelor’s Honors thesis for Dr. O’Connell. This manuscript describing the results was submitted for publication at that time, but we were not in a position to conduct the additional experiments recommended by reviewers, and the manuscript was not accepted for publication. We feel that the results reported here have value to the community, despite the fact that they were conducted with techniques and reagents from three decades ago, and thus we are depositing it on a preprint server in 2025. More recent results from genome-wide analyses confirm that CpG islands and GC content are major determinants of nucleosome depletion at mammalian promoters [39].
Materials and Methods
DNA Fragments Used as Probes in Competitive Nucleosome Reconstitutions
The 300 bp Xenopus borealis 5S rRNA gene probe is an EcoRI-HindIII fragment from the plasmid pXp10 [20]. An additional 150 bp fragment from the same gene was excised from the plasmid pIC280-5 using AvaI and ScaI. The 215 bp rabbit α-globin probe is an NcoI-TaqI fragment (nucleotides 6777 to 6995 in GenBank accession M74142) from the plasmid pBSαLuc containing the 5’ end of the coding sequence. The 260 bp rabbit α-globin probe is the SacII-NcoI fragment (nucleotides 6515 to 6777 in GenBank accession M74142) immediately preceding the 215 bp fragment from the same plasmid. The 380 bp rabbit β-globin gene probe is a PstI-AccI fragment (nucleotides 30817 to 31203 in GenBank accession M18818) containing the 5’ half of the coding sequence from the plasmid pBSβ4.5 . The 215 bp and 390 bp rabbit β-globin probes are SpeI-RsaI and SpeI-EcoRI fragments from the plasmid pBSβ325, which contains the 325 bp BglII-PstI fragment from the rabbit β-globin gene 5’ flank (nucleotides 30493 to 30822 in GenBank accession M18818) subcloned into the PstI-BamHI vector fragment from pBluescript (Stratagene; pBSIISK+). The SpeI and EcoRI sites are from the pBluescript polylinker immediately flanking the 325 bp rabbit β-globin sequence. All probe fragments were gel-purified on 5% polyacrylamide and 3’ end-labeled with the Klenow fragment of E. coli DNA polymerase and [α32P]dNTP.
PCR fragments from the 5’ flanking region of rabbit α- and β-globin genes were prepared using forward primers to amplify each fragment from position -408 (α, GGAATTCGGAGTCCTCCCAGCCAGCAAG; β, GGAATTCCTCTCTCTCTCTCTACCTATC). The following reverse primers established the right end of each amplified fragment at the indicated position relative to the cap site of the respective gene:
-237 α GGAATTCACACCGCGGCGCAAAATGGGC,
-237 β GGAATTCTCTTGCCAAATTTATTTATAT,
-169 α GGAATTCAGTCCCTCCCGCGCTGGCCGC,
-169 β, GGAATTCACTCAGCCTTCCTTCTATGTA,
-115 α, GGAATTCCCTCGCGGCGTCTGCCCTGGA,
-115 β, GGAATTCGATGACAGCACCCCTGTCCTT,
-42 α, GGAATTCGCGGGCACGCCCAGCGGGGCC,
-42 β, GGAATTCGAACTATGTAATCCCTACCCC,
+37 α, GGAATTCTGGTGGTTCCTTCTCAGTCGG,
+37 β, GGAATTCGATTGCAAGTAAACACAGTTG.
Primers were complementary to 21 nt of template DNA sequence. Additional nucleotides were included at the 5’ end of the PCR primers to incorporate EcoRI sites at both ends of the subsequent products in order to allow 3’ end-labeling as described above following digestion with EcoRI. These primer pairs yielded products of 185, 253, 307, 380 and 457 bp, respectively.
Competitive Nucleosome Reconstitution
Competitive nucleosome reconstitutions were performed as described in Wang and Griffith [21]. 100 ng of [32P]-labeled probe fragment was mixed with 5 or 10 µg of unlabeled calf thymus DNA and 5 µg of HeLa cell core histones [22] in a solution containing 2 M NaCl, 100 mg/L BSA and 0.1% Nonidet P-40 (Sigma). The histone preparation was depleted of histone H1 and was prepared at physiological levels of acetylation. The initial salt concentration was lowered to 0.1 M in 0.1 M increments at room temperature by addition of a solution of 20 mM HEPES, 1 mM EDTA, pH 7.5, incubating for 5 minutes at each interval. Aliquots of the reconstitution reactions were analyzed by electrophoresis on 5% polyacrylamide gels at 200 V and exposure to a Molecular Dynamics phosphorimager screen. Quantitation of the signal contained in the bound and free fractions was performed using the phosphorimager output and the ImageQuant program (Molecular Dynamics). All areas that had a greater signal than in the probe alone lane were included in the bound fraction, i.e., the entire area between the free probe and the top of the gel, not just the discrete complexes. The background signal for the histone:DNA complexes was taken from a lane in which the probe alone was run. The percent of labeled probe bound was calculated by (signal volume in bound complexes/signal volume in free probe) x 100.
Micrococcal Nuclease Analysis of Reconstituted Nucleosomes
Preparative amounts of a 300 bp and a 150 bp fragment of the 5S rRNA gene from Xenopus borealis, each containing a nucleosome positioning sequence, were excised from plasmids pXp10 and pIC280-5, respectively. The isolated DNA fragments (1.6 µg of the 300 bp fragment, 4.6 µg of the 150 bp fragment) were separately precipitated with ethanol and dissolved in 4 µl TE buffer. A solution was prepared containing 400 µl 5M NaCl, 20 µl 5g/L BSA, and 20 µl 5% NP-40; 4.4 µl of this solution was added to each. For nucleosome reconstitution, core histones (1.2 µg for the 300 bp fragment; 1.92 µg for the 150 bp fragment) were added to the DNA solution. The histones were omitted in the negative control. The same progressive dilution protocol used for competitive nucleosome reconstitution also was followed for this preparative reconstitution.
To analyze the size of micrococcal nuclease digestion products of the reconstituted nucleosomes, 4 µl 0.1M calcium chloride was added to each reconstitution mixture. For the reconstituted nucleosomes, five aliquots were treated with increasing amounts of micrococcal nuclease ranging from 0 to 0.01 units. The histone-free, negative control DNAs were treated with micrococcal nuclease ranging from 0 to 0.005 units. The reactions proceeded at room temperature for 5 minutes and were then quenched with 45 µl of stop solution (0.011 M EDTA, 0.56 % SDS, and 0.67 M sodium acetate). The samples were diluted to 100 µl with H2O, extracted with 25:24:1 phenol:chloroform:iso-amyl-alcohol to remove histones, ethanol precipitated and labeled at the 5’ end with [γ32P]ATP and T4 polynucleotide kinase. The sizes of the labeled products were determined by analysis on a 5% polyacrylamide gel and visualization on a phosphorimager.
Results
Competitive nucleosome reconstitution assay. The relative affinities of the α- and β-globin gene DNA for histones was determined by comparing their ability to reconstitute nucleosomes in vitro, using the 5S rRNA gene from Xenopus borealis as a reference. Sequences from this gene have been shown to reconstitute nucleosomes with a well-characterized affinity [23,24]. We adopted a nucleosome reconstitution procedure utilizing progressive dilution from high salt [21,22,25]. To confirm that this protocol produced DNA-histone complexes with a critical property expected for nucleosomes, we tested the products for protection of an approximately 140 bp fragment from digestion by micrococcal nuclease. Two DNA fragments from the Xenopus borealis 5S rRNA gene, 300bp from plasmid pXp10 and 150bp from plasmid pIC280-5, were used as the templates for nucleosome reconstitution. Both fragments contain a nucleosome-positioning sequence. Digestion of the reconstitution products with increasing amounts of micrococcal nuclease showed protection of the expected size fragments in the range from 140 to 150 bp for both of the 5S rRNA gene templates (Figure 1, top panel). The protection is observed over a 20-fold range of enzyme activity, and it is dependent on the presence of histones in the reconstitution mix, since no protection is seen in their absence (Figure 1, bottom panel). Random binding between histones and DNA should have produced a heterogeneous mixture of products with no preferred sizes. The observed preferred size around 140 bp argues that the histone-DNA complexes are in nucleosomes.
In order to compare affinities of different DNAs for histones in nucleosome formation, we employed a technique derived from the competitive nucleosome reconstitution method of Shrader and Crothers [25]. In this procedure, a small quantity of a labeled test fragment is assayed for its ability to form nucleosomes with purified core histones in the presence of a large amount of competitor DNA. We used a 300 bp fragment encompassing the Xenopus borealis 5S rRNA gene as a positive control for the ability of this method to yield nucleosomes. As shown in Figure 2A, a small fraction of the total labeled probe was reconstituted with histones to yield six discrete complexes. These complexes may represent both mono- and di-nucleosomes in several preferred phases along the template, each with a unique mobility. The formation of these complexes requires at least a 1:1 mass ratio of competitor calf thymus DNA to histones; at lower amounts of competitor DNA we obtain a non-specific aggregate containing all of the labeled probe (data not shown). The level of reconstitution on this template was used to normalize the relative affinities of other DNA sequences for core histones in subsequent experiments.
Sequences around the CpG island of the rabbit α-globin gene have a lower affinity for core histones than do sequences from the β-globin gene. DNA restriction fragments from the 5’ ends of the rabbit (Oryctolagus cuniculus) α- and β-globin genes were used in this competitive nucleosome reconstitution in order to compare their abilities to form specific complexes with core histones. Using a 2:1 mass ratio of calf thymus DNA to histones, a single discrete complex was formed with the β-globin DNA probe, whereas no complex was evident with the α-globin DNA probe (Figure 2B). This comparison suggests that the CpG island DNA from the α-globin gene has an inherently lower affinity for core histones in this in vitro competitive reconstitution method.
The experiment was repeated with less competitor DNA to allow some nucleosome formation on the α-globin gene DNA template and thereby facilitate a quantitative comparison (Figure 3A). At a 1:1 mass ratio of calf thymus DNA to histones, the affinity for the β-globin gene fragment was 3-4 times greater than that for the α-globin gene fragment (Figure 3A and 3B), consistent with the conclusion that the rabbit α-globin gene CpG island has a reduced ability to reconstitute into nucleosomes relative to β-globin gene non-CpG island DNA. The probes in this experiment are from different regions of the genes than those used in Figure 2B, indicating that these differential affinities for nucleosome reconstitution may reflect general properties of the DNA rather than a particular sequence per se.
We applied the free energy expression of Shrader and Crothers [25] to our results in order to ground them with what is known regarding the inherent abilities of various artificial and naturally occurring sequences to reconstitute into nucleosomes. This expression translates the relative proportions of two DNA fragments that form a complex with histones to a difference in the free energy of reconstitution. The levels of reconstitution shown in Figure 3B translate to a free energy of reconstitution on the α-globin gene template of about 750 cal mol-1 relative to reconstitution on the β-globin gene template (Figure 3C). Interestingly, the 390 bp β-globin fragment appears to have a higher affinity for core histones than the X. borealis 5S rRNA gene, with a free energy of about 350 cal mol-1 lower than that of the 5S rRNA gene.
DNA fragments of the same size show a lower affinity for nucleosome reconstitution on CpG island versus non-CpG island DNA. One concern about these initial results is that the higher affinity of the β-globin gene sequence for histones, compared to that of the α-globin gene sequence, could be due to the greater length of the β-globin gene fragment assayed rather than inherent properties of the DNA sequence. To test this possibility, DNA fragments of identical size (215 bp) from the α-globin and β-globin genes were assayed along with the fragments employed in Figure 3A. Each of the fragments yielded complexes with core histones to varying degrees (Figure 4A). The 5S 300 bp, α-globin 260 bp and β-globin 390 bp fragments had the same relative levels of reconstitution as seen previously. The affinity for core histones of the α-globin gene 215 bp fragment was 2-fold lower than that of the same sized fragment from the β-globin gene. This is consistent with a lower affinity of CpG island DNA for histones, but the difference is less than that seen previously (Figure 4A and 4B).
Next, two relatively long DNA fragments were compared in the competitive nucleosome reconstitution assay, a large 475 bp fragment from the α-globin gene containing the sequences from both the 215 bp and 260 bp fragments and the β-globin gene 390 bp fragment used previously (Figure 5A). The average level of reconstitution with the 475 bp α-globin gene fragment was considerably less than that obtained with the β-globin gene 390 bp sequence (Figure 5B); this difference is significant by the Kruskal-Wallis Rank Sum Test (p<0.05). The differences in fraction bound translates to a free energy of reconstitution of about 1000 cal mol-1 for the 475 bp α-globin gene fragment relative to the 390 bp β-globin gene fragment. Thus, a relatively large DNA fragment from the α-globin gene CpG island (475 bp) showed a lower level of nucleosome reconstitution than the 390 bp non-CpG island fragment from the β-globin gene.
Longer DNA fragments reconstitute nucleosomes more avidly, but the affinity of CpG island DNA is less than that of non-CpG island DNA. The results presented so far show that both short and long DNA fragments (sufficient to form 1 or 2 nucleosomes, respectively) from the α-globin CpG island form nucleosomes much less readily than do comparably sized fragments from the β-globin gene, which lacks a CpG island. Since the difference in affinities for histones is greater for longer DNA fragments, it appears that the β-globin gene sequence increases its avidity for histones as fragment length increases more so than the α-globin DNA does. There are two possible explanations for this observation. There may be a discrete high-affinity site for nucleosome formation within the 3’ end of the large 390 bp β-globin fragment that is not included in the short 215 bp fragment, whereas there is no such sequence in the analogous region of the α-globin gene. Alternatively, the nature of the β-globin non-CpG island DNA sequence may be such that it contains periodic sequence motifs of favorable topology that increase the ability of DNA to reconstitute into nucleosomes as more sequence is included. In contrast, the α-globin CpG island DNA sequence may not contain such motifs, making it a relatively poor overall template for nucleosome reconstitution that does not improve as more sequence is included.
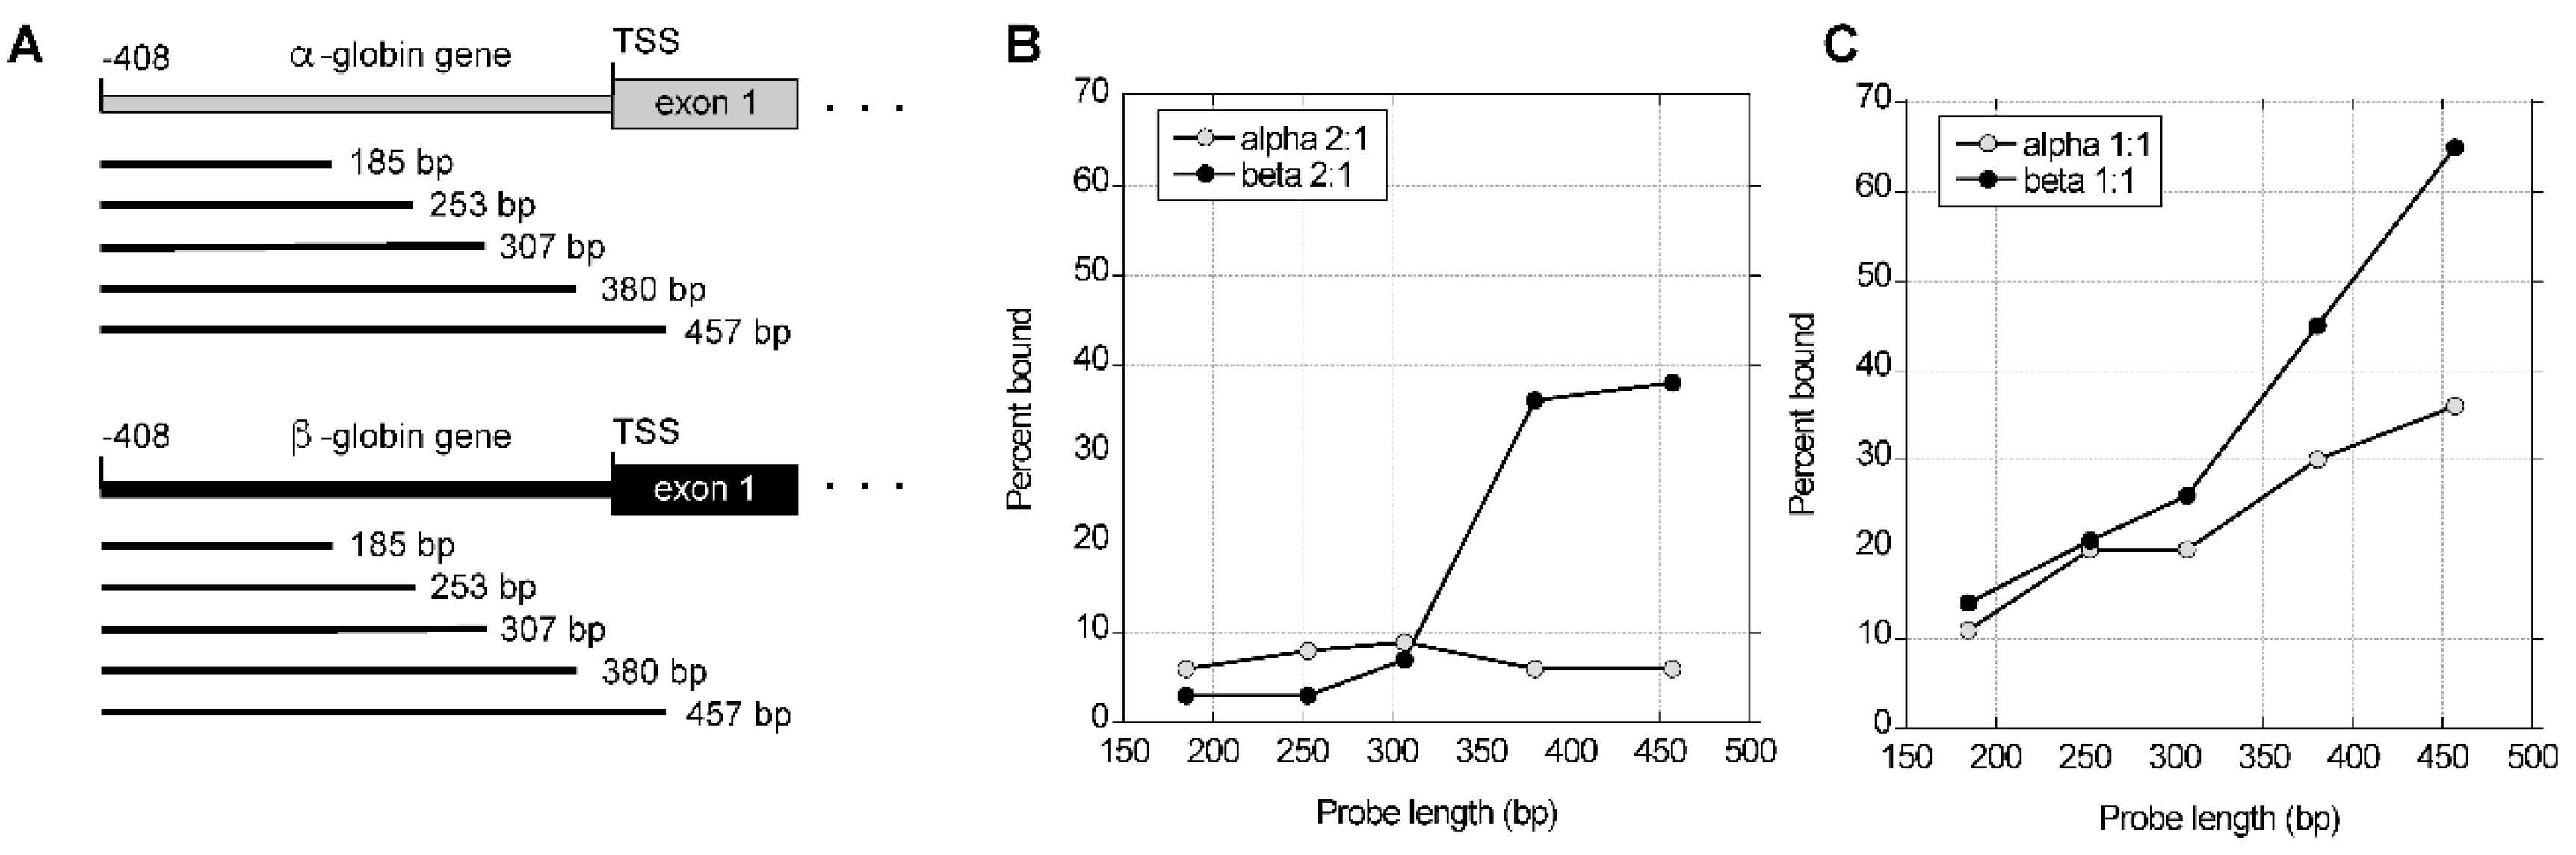
These possibilities were tested by measuring the affinities for core histones of an ordered series of fragments from the α-globin gene CpG island and β-globin gene non-CpG island DNA. Competitive nucleosome reconstitution reactions were performed on a series of PCR fragments ranging in length from 185 bp to 457 bp from the rabbit α- and β-globin genes (Figure 6A). The endpoints of the PCR fragments were the same relative to the cap site of the respective gene. Using a 2:1 mass ratio of calf thymus DNA to histones, the affinity of β-globin gene non-CpG island sequences for histones increased with longer DNA fragments (Figure 6B). In contrast, very little of the α-globin gene CpG-island DNA reconstituted into nucleosomes, and that amount did not change as the length of the DNA fragment increased (Figure 6B). When the amount of competitor DNA was reduced to give a 1:1 mass ratio of calf thymus DNA to histones, the amount of CpG island probe bound to histones did increase with longer DNA fragments, but an even greater increase in the affinities of the non-CpG island probes was observed for longer DNA fragments (Figure 6C).
These observations are congruent with the results obtained from restriction fragment probes, and they are consistent with the conclusion that the rabbit α-globin gene CpG island sequence is a relatively poor substrate for nucleosome reconstitution. Also, the gradual increase in nucleosome formation as the length of the β-globin gene probe was increased suggests that it is not driven by a discrete high-affinity site, but rather by more dispersed signals.
Discussion
Different DNA sequences have characteristic and distinct propensities for nucleosome formation, likely due to variations in double-helical structure and topology [26,27]. Studies of sequence periodicities in eukaryotic genomes and their relationship with DNA topology and nucleosome positioning have revealed some consistent themes. Early work showed that a periodic A2N3T2N3 motif, which can induce a bend due to base-pair tilting, has the potential to determine the most favorable position for a nucleosome [28]. Another type of repeat was revealed by work determining the sequence of DNA fragments resulting from micrococcal nuclease digestion of H1-depleted chromatin. These studies showed that A+T-rich and G+C-rich regions alternated with about a 10 bp period over the entire ~146 bp of mononucleosome DNA. Analysis of the rotational phase of the nucleosome suggested that A+T-rich regions faced inward toward the histone octamer where the minor groove was compressed, whereas G+C-rich regions faced inward where the major groove was compressed [29,30]. These orientation patterns of A+T and G+C-rich regions reflect similar rules governing the DNA bending induced by the catabolite activator protein (CAP) at the E. coli lac promoter [31]. Taken together, these results suggest that the orientation of DNA within nucleosomes in vivo is determined at least in part by the inherent topology of DNA sequences exhibiting alternating A+T and G+C-rich regions in a certain period, and that these rules may be general in governing the association of DNA with proteins that require a bent topology for binding.
Tests of the ability to design an optimal artificial nucleosome positioning sequence yielded results that were consistent with the patterns revealed by naturally occurring nucleosomes. Repeats of the sequence (A/T)3NN(G/C)3NN did in fact increase the affinity of core histones for a DNA fragment in an in vitro competitive nucleosome reconstitution assay. The affinity increased with the number of repeats of this motif, such that 40 repeats conferred the same affinity for the formation of a positioned nucleosome as the strong natural nucleosome positioning sequences from the sea urchin 5S rRNA gene [25]. A similar competitive nucleosome reconstitution method showed that nucleosomes assemble preferentially at the CTG repeats from the myotonic dystrophy gene [32]. Expansion of this repeat to >75 copies, paralleling the range of the repeat length associated with the threshold for the disease, resulted in an extremely high-affinity nucleosome positioning sequence. Thus, the in vitro competitive nucleosome reconstitution assay appears to reveal differences in the inherent ability of DNA sequences to assemble nucleosomes, reflecting the effect of sequence determinants elucidated from naturally occurring nucleosomes and relevant to effects on gene expression observed in vivo.
In this study, we adopted this technique to determine if DNA fragments from a CpG island have a measurable difference in the ability to complex with core histones compared to non-CpG island fragments. We observed that sequences from the rabbit α-globin CpG island have a lower affinity for core histones than non-CpG island sequences from the rabbit β-globin gene. The magnitude of this difference depends on the length of the DNA fragments being compared, with more dramatic differences seen as fragment length increases. The affinity increases gradually as fragment length increases, suggesting that affinity is determined by additive contributions of a dispersed array of signals. These signals are likely to be short nucleotide sequences that either favor or disfavor the particular DNA topology required for its path along the octamer at that location. Considering the activity of alternating A+T and G+C-rich regions in establishing a preferred high-affinity site for nucleosome assembly, it is possible that the lower levels of reconstitution on CpG island sequences compared to non-CpG island sequences may be due to the relative paucity of A+T-rich regions and the abundance of G+C-rich regions in CpG islands. Thus, compared to non-CpG island DNA, there may be fewer sequences with favorable topology in a period required for nucleosome formation, resulting in a reduced affinity for reconstitution that is more marked at greater sequence lengths.
Consistent with this interpretation, Wang et al. [33] showed that long blocks of a CCG triplet repeat (>50 copies) associated with fragile sites in chromosomes have the ability to exclude nucleosomes. Furthermore, repeats of the CCGNN motif exclude nucleosomes in a competitive reconstitution assay. This activity increased with repeat length, such that 48 copies of the motif had a ~78-fold lower affinity for core histones than the same number of copies of the previously described high-affinity CTG repeat. It was postulated that this sequence is resistant to nucleosome formation because motifs of the form (G/C)3NN(G/C)3NN direct bending into the major groove when minor groove compression is needed, in contrast to the (G/C)3NN(A/T)3NN motif, which accommodates the required alternating major groove and minor groove compressions [34]. The (G/C)3NN motif occurs frequently in the rabbit α-globin CpG island tested in our experiments. In particular, the CCGNN motif tested in Wang and Griffith [34] occurs 48 times in a 1.1 kb segment from the rabbit α-globin CpG island, in some regions arrayed in up to 10 contiguous repeats. In contrast, there are no copies of this motif in the analogous region of the rabbit β-globin gene. This degree of disparity is similar for the other members of the general (G/C)3NN motif, which together describe nearly the entire CpG island. Therefore, it is possible that the energetic basis for the reduced affinity of CpG island sequences is similar to that governing the exclusion of nucleosomes by these motifs at other loci. Furthermore, it is possible that one aspect of the unique chromatin structure of CpG islands in vivo, the presence of nucleosome-free regions, may be a direct function of this characteristic.
The observations reported here could explain the positive activity of CpG island DNA on gene expression at the level of chromatin structure inferred from the results of analysis in transfected cells [12,18]. Similar to the gradual increase in the disparity between the affinities for nucleosome formation on CpG island and non-CpG island DNA as the length of the tested fragments is increased, the positive effect of CpG island DNA on gene expression also correlates with the length of CpG island included in the transfected construct [12,17]. It is possible that these two observations are related, such that longer spans of CpG island DNA around the promoter have an increased probability of maintaining an open chromatin structure in transfected cells, leading to an increase in the frequency of expressing templates in the population of transfected cells. In the context of some reporter gene constructs, this effect is only apparent after their stable integration into the host cell genome [12,18], perhaps reflecting the greater degree of chromatinization that integrated constructs are subject to compared to unintegrated, non-replicating constructs. Thus, integration may provide a more repressive background for transgene expression in which the effect of CpG islands can be manifested. It would be informative to determine if other CpG islands have similarly reduced propensities for nucleosome formation, and if so whether it consistently correlates with a positive effect on gene expression in transfected cells.
The reduced tendency of CpG island DNA to form nucleosomes in vitro may provide part of the explanation for the α-globin genes being in constitutively open chromatin [35]. However, the α-globin genes are expressed exclusively in erythroid cells, under the control of a distal major control region [36] as well as its own promoter. The mechanistic basis for this regulated expression remains enigmatic, e.g., determining how α-globin genes are silenced in nonerythoid cells, despite their being in open chromatin. However, these striking differences between α-globin gene and β-globin gene DNA in affinity for histones and nucleosome formation have likely influenced the evolution of the regulatory mechanisms of globin genes. The distal regulators of the α- and β-globin gene clusters have some different properties [35,37], and perhaps this was determined, at least in part, by a propensity for their globin gene targets to form different chromatin structures.
Postscript: Looking back at these issues 30 years later (in 2025), it is gratifying to see that the basic results reported here have been confirmed and shown to be generally applicable to mammalian CpG islands. A thorough, genome-wide analysis of locations of RNA polymerase II, nucleosomes, and transcripts in mouse primary T cells showed a strong correlation between CpG islands and nucleosome depletions, with stronger effects with longer CpG islands [39]. Furthermore, nucleosomes tended to be present at the ends of the CpG islands. Thus, the low affinity of CpG islands for nucleosome formation reported here is applicable to the establishment of nucleosome depleted regions at a large fraction of mammalian promoters.
Acknowledgments
This work was supported by PHS grants DK27635, LM05110, and LM05773.
References
- Grunstein, M. (1990) Trends in Genetics, 6, 395-400.
- Felsenfeld, G. (1992) Nature, 355, 219-224.
- Workman, J. L. and Buchman, A. R. (1993) Trends In Biochem., 18, 90-95.
- Wolffe, A. P. (1994) Cell, 77(1), 13-6.
- Liu, K. and Stein, A. (1997) J. Mol. Biol., 270, 559-575.
- Simpson, R. T. (1991) Prog Nucleic Acid Res Mol Biol, 40, 143-84.
- Gardiner-Garden, M. and Frommer, M. (1987) Journal of Molecular Biology, 196, 261-282.
- Bird, A. P. (1986) Nature, 321(6067), 209-13.
- Tazi, J. and Bird, A. (1990) Cell, 60(6), 909-20.
- Fischel-Ghodsian, N. , Nicholls, R. D. and Higgs, D. R. (1987) Nucl. Acids Res., 15, 9215-9225.
- Hardison, R. , Krane, D., Vandenbergh, D., Cheng, J.-F., Mansberger, J., Taddie, J., Schwartz, S., Huang, X. and Miller, W. (1991) J. Mol. Biol., 222, 233-249.
- Shewchuk, B. M. and Hardison, R. C. (1997) Mol. Cell. Biol., 17, 5856-5866.
- Mellon, P. , Parker, V., Gluzman, Y. and Maniatis, T. (1981) Cell, 27(2 Pt 1), 279-88.
- Charnay, P. , Treisman, R., Mellon, P., Chao, M., Axel, R. and Maniatis, T. (1984) Cell, 38, 251-263.
- Whitelaw, E. , Hogben, P., Hanscombe, O. and Proudfoot, N. J. (1989) Molecular and Cellular Biology, 9(1), 241-251.
- Brickner, H., Zhu, X.-X. and Atweh, G. (1991) Journal of Biological Chemistry, 266, 15363-15368.
- James-Pederson, M. , Yost, S., Shewchuk, B., Zeigler, T., Miller, R. and Hardison, R. (1995) J. Biol. Chem., 270, 3965-3973.
- Pondel, M. , Murphy, S., Pearson, L., Craddock, C. and Proudfoot, N. (1995) Proc Natl Acad Sci U S A, 92, 7237-7241.
- Yost, S. E. , Shewchuk, B. and Hardison, R. (1993) Mol. Cell. Biol., 13, 5439-5449.
- Hayes, J. J. and Wolffe, A. P. (1993) Proc Natl Acad Sci U S A, 90(14), 6415-9.
- Wang, Y. H. and Griffith, J. (1995) Genomics, 25(2), 570-3. 2).
- Cote, J. , Utley, R. T. and Workman, J. L. (1995) Methods in Molecular Genetics, 6B, 108-128.
- Hayes, J. J. , Tullius, T. D. and Wolffe, A. P. (1990) Proc Natl Acad Sci U S A, 87(19), 7405-9.
- Hayes, J. J. , Clark, D. J. and Wolffe, A. P. (1991) Proc Natl Acad Sci U S A, 88(15), 6829-33.
- Shrader, T. E. and Crothers, D. M. (1989) Proc Natl Acad Sci U S A, 86(19), 7418-22. 19).
- Simpson, R. T. and Kunzler, P. (1979) Nucleic Acids Res, 6(4), 1387-415.
- Kunkel, G. R. and Martinson, H. G. (1981) Nucleic Acids Res, 9(24), 6869-88. 24).
- Trifonov, E. N. and Sussman, J. L. (1980) Proc Natl Acad Sci U S A, 77(7), 3816-20.
- Drew, H. R. and Travers, A. A. (1985) J Mol Biol, 186(4), 773-90.
- Satchwell, S. C. , Drew, H. R. and Travers, A. A. (1986) J Mol Biol, 191(4), 659-75.
- Gartenberg, M. R. and Crothers, D. M. (1988) Nature, 333(6176), 824-9. 6176).
- Wang, Y. H. , Amirhaeri, S., Kang, S., Wells, R. D. and Griffith, J. D. (1994) Science, 265(5172), 669-71.
- Wang, Y.-H. , Gellibolian, R., Shimizu, M., Wells, R. D. and Griffith, J. (1996) J. Mol. Biol., 263, 511-516.
- Wang, Y.-H. and Griffith, J. D. (1996) Proc. Natl. Acad. Sci., USA, 93, 8863-8867.
- Craddock, C. F. , Vyas, P., Sharpe, J. A., Ayyub, H., Wood, W. G. and Higgs, D. R. (1995) EMBO J., 14, 1718-1726.
- Higgs, D. , Wood, W., Jarman, A., Sharpe, J., Lida, J., Pretorious, I. M. and Ayyub, H. (1990) Genes & Devel., 4, 1588-1601.
- Grosveld, F. , Antoniou, M., Berry, M., de Boer, E., Dillon, N., Ellis, J., Fraser, P., Hanscombe, O., Hurst, J., Imam, A., Lindenbaum, M., Philipsen, S., Pruzina, S., Strouboulis, J., Raguz-Bolognesi, S. and Talbot, D. (1993) Philos. Trans. R. Soc. Lond., 339, 183-191.
- Shewchuk, B. (1997) Effect of CpG islands from the alpha-globin gene cluster on gene expression: Evidence for a chromatin-dependent activity. Thesis for Ph.D. in Molecular and Cell Biology from The Pennsylvania State University.
- Fenouil, R., Cauchy, P., Koch, F., Descotes, N., Cabeza, J.Z., Innocenti, C., Ferrier, P., Spicuglia, S., Gut, M., Gut, I., Andrau, J.-C. (2012) CpG islands and GC content dictate nucleosome depletion in a transcription-independent manner at mammalian promoters. Genome Res., 22, 2399-2408.
Figure 1.
The reconstitution procedure generates the expected protection from micrococcal nuclease. DNA fragments containing the nucleosome positioning sequence from Xenopus borealis 5S rRNA genes, 300 bp from pXp10 and 150 bp from pIC280-5, were reconstituted into nucleosomes at an excess of DNA to HeLa cell core histones (1.4:1 DNA to histone mass ratio for the 300 bp fragment; 2.4:1 for the 150 bp fragment). After treatment with the indicated amounts of micrococcal nuclease, the products were end-labeled and resolved on a polyacrylamide gel products, as shown in this phosphorimage. The markers are MspI digestion products of pBluescriptII KS(-). As a negative control, histone-free, naked DNA was also digested with micrococcal nuclease, with the results shown in the lower panel. The sizes of the initial fragments and major protected products are shown along the right side.
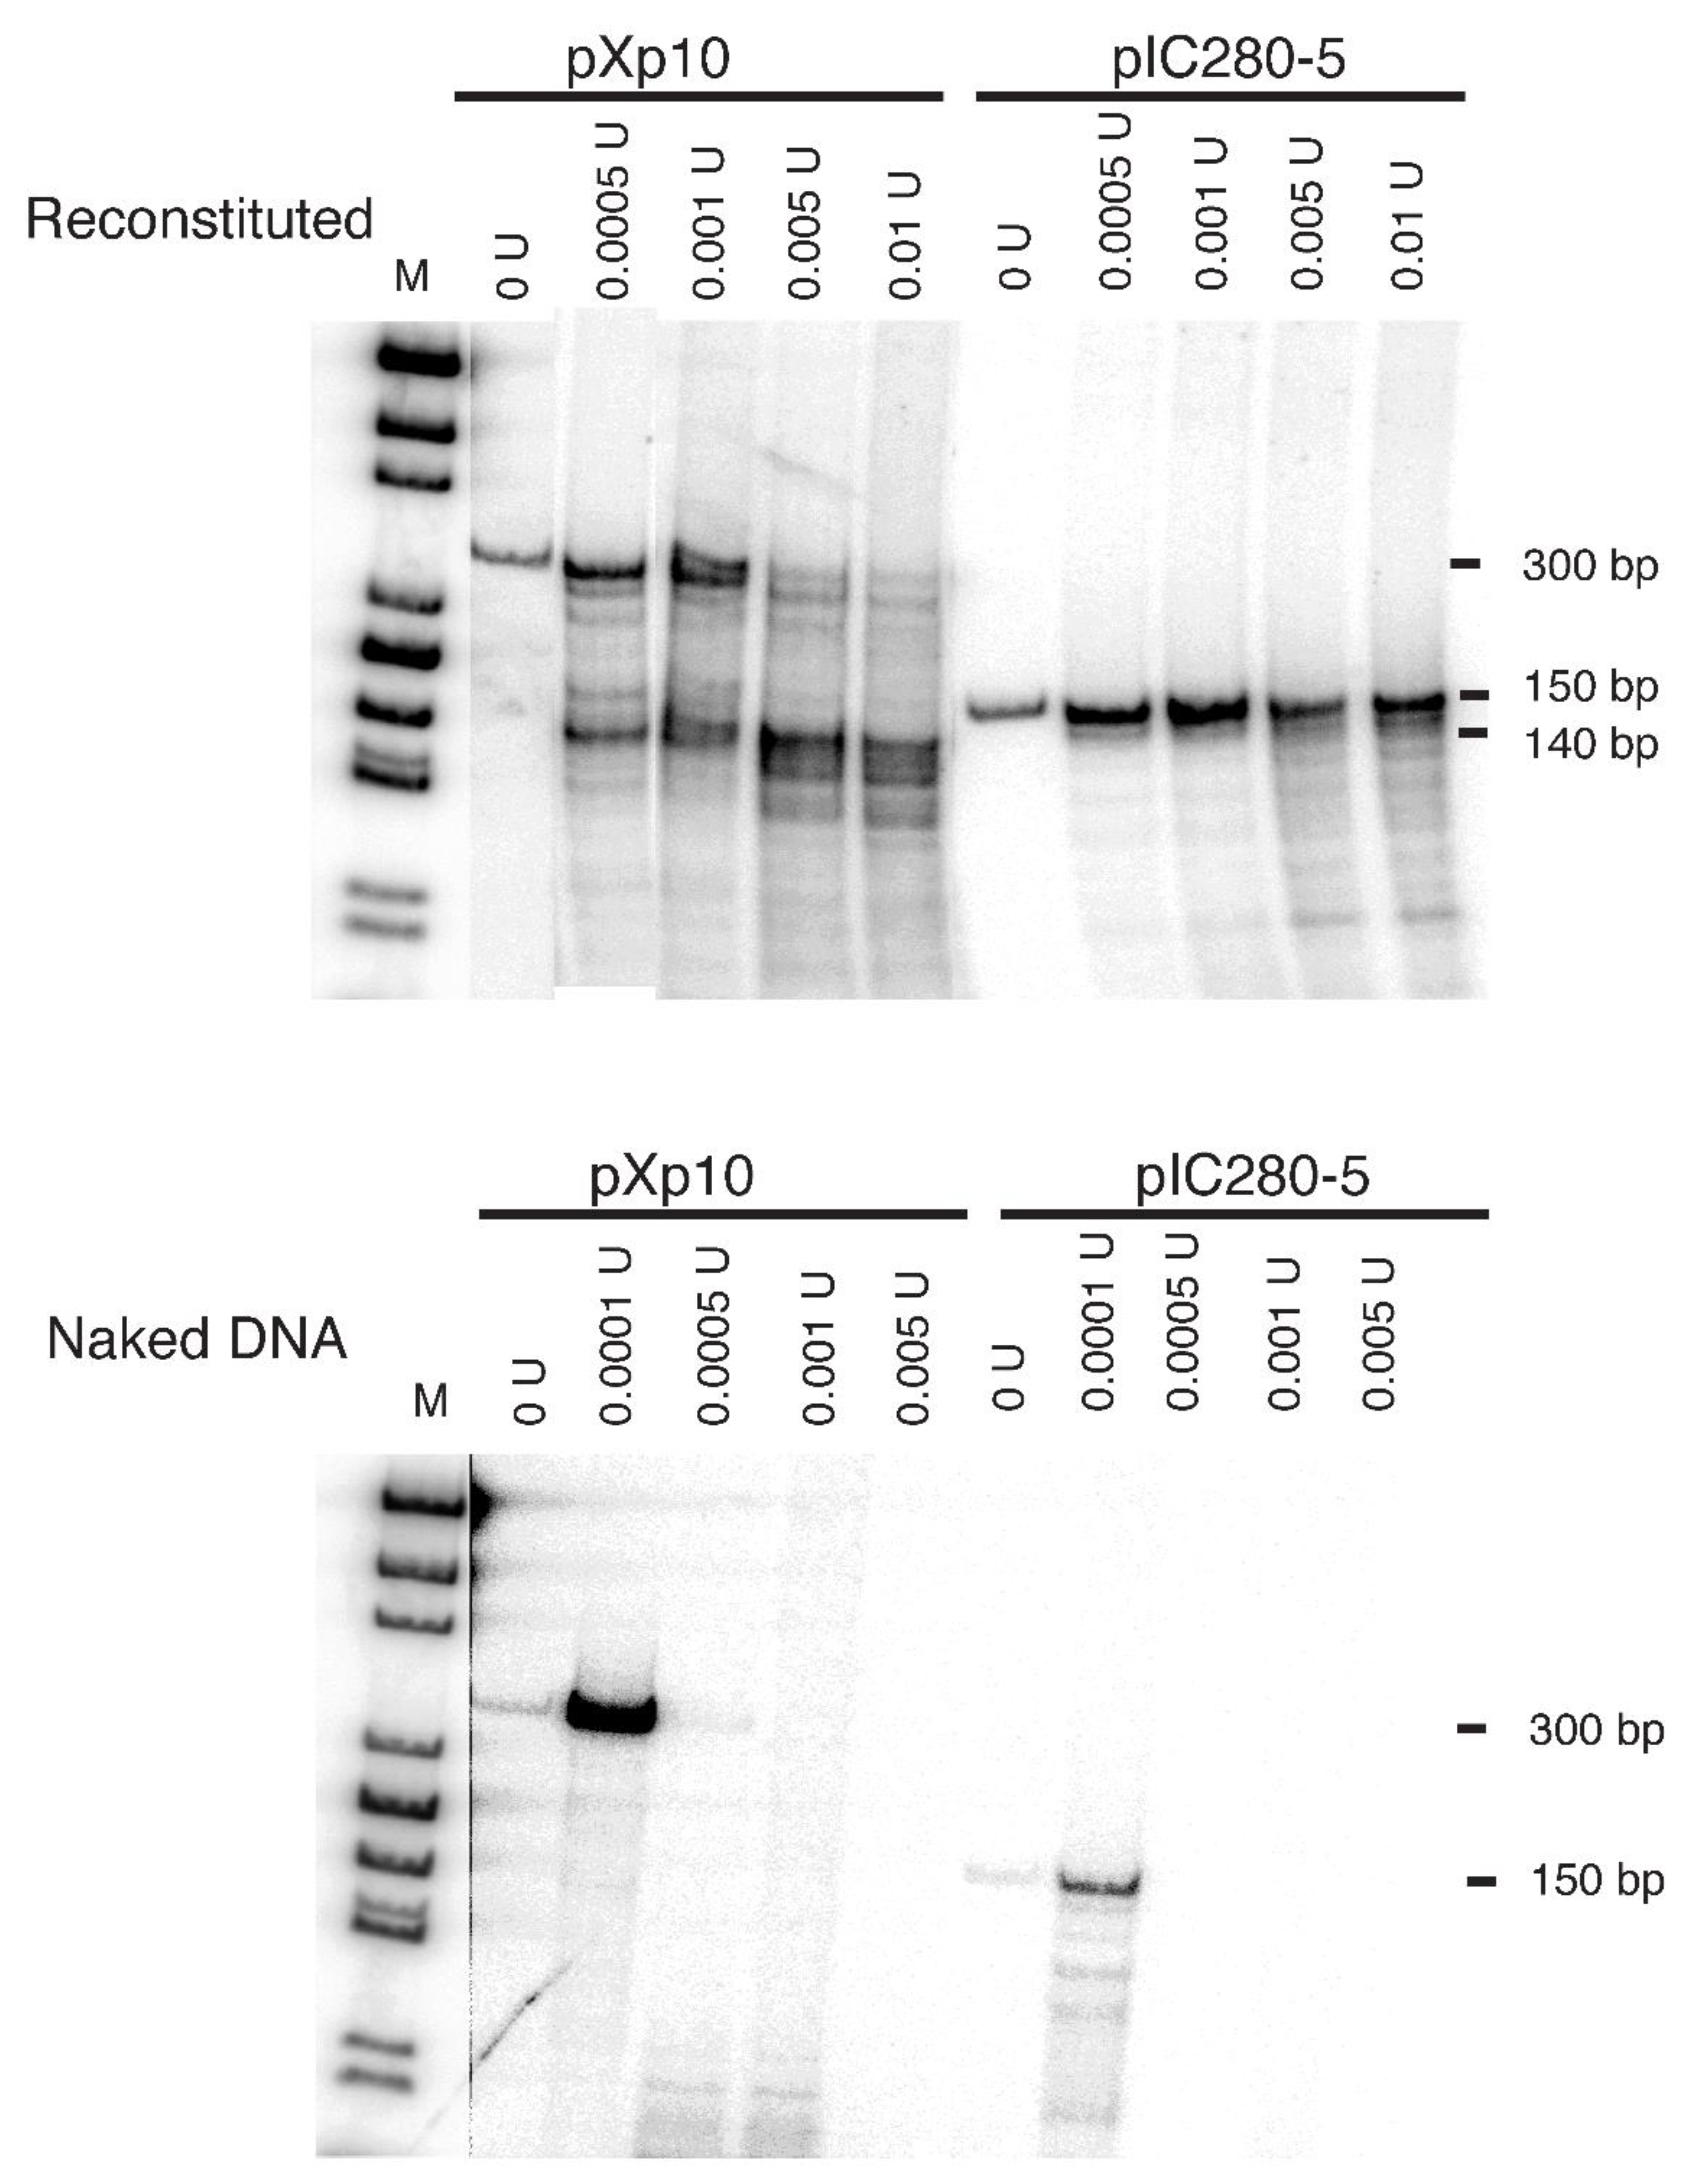
Figure 2.
Competitive nucleosome reconstitution with Xenopus borealis 5S rRNA gene, rabbit α-globin gene CpG island, and β-globin gene non-CpG island fragments. Gel mobility shift analysis of the product of the reconstitution reaction (histone +) and the labeled probe alone (histone -). A 2:1 mass ratio of calf thymus DNA to histones was used. A schematic diagram of the gene and the probe fragment is shown below the gel. Free=uncomplexed probe. (A) Nucleosome reconstitution of the 5S rRNA gene. Coding sequences are shown by a wide black box, and the non-transcribed flanking regions are shown by thin white boxes. (B) Nucleosome reconstitution of DNA fragments from the α- and β-globin genes. Exons are denoted by wide black boxes, introns by wide white boxes, and 5’ flanking regions by thin white boxes.
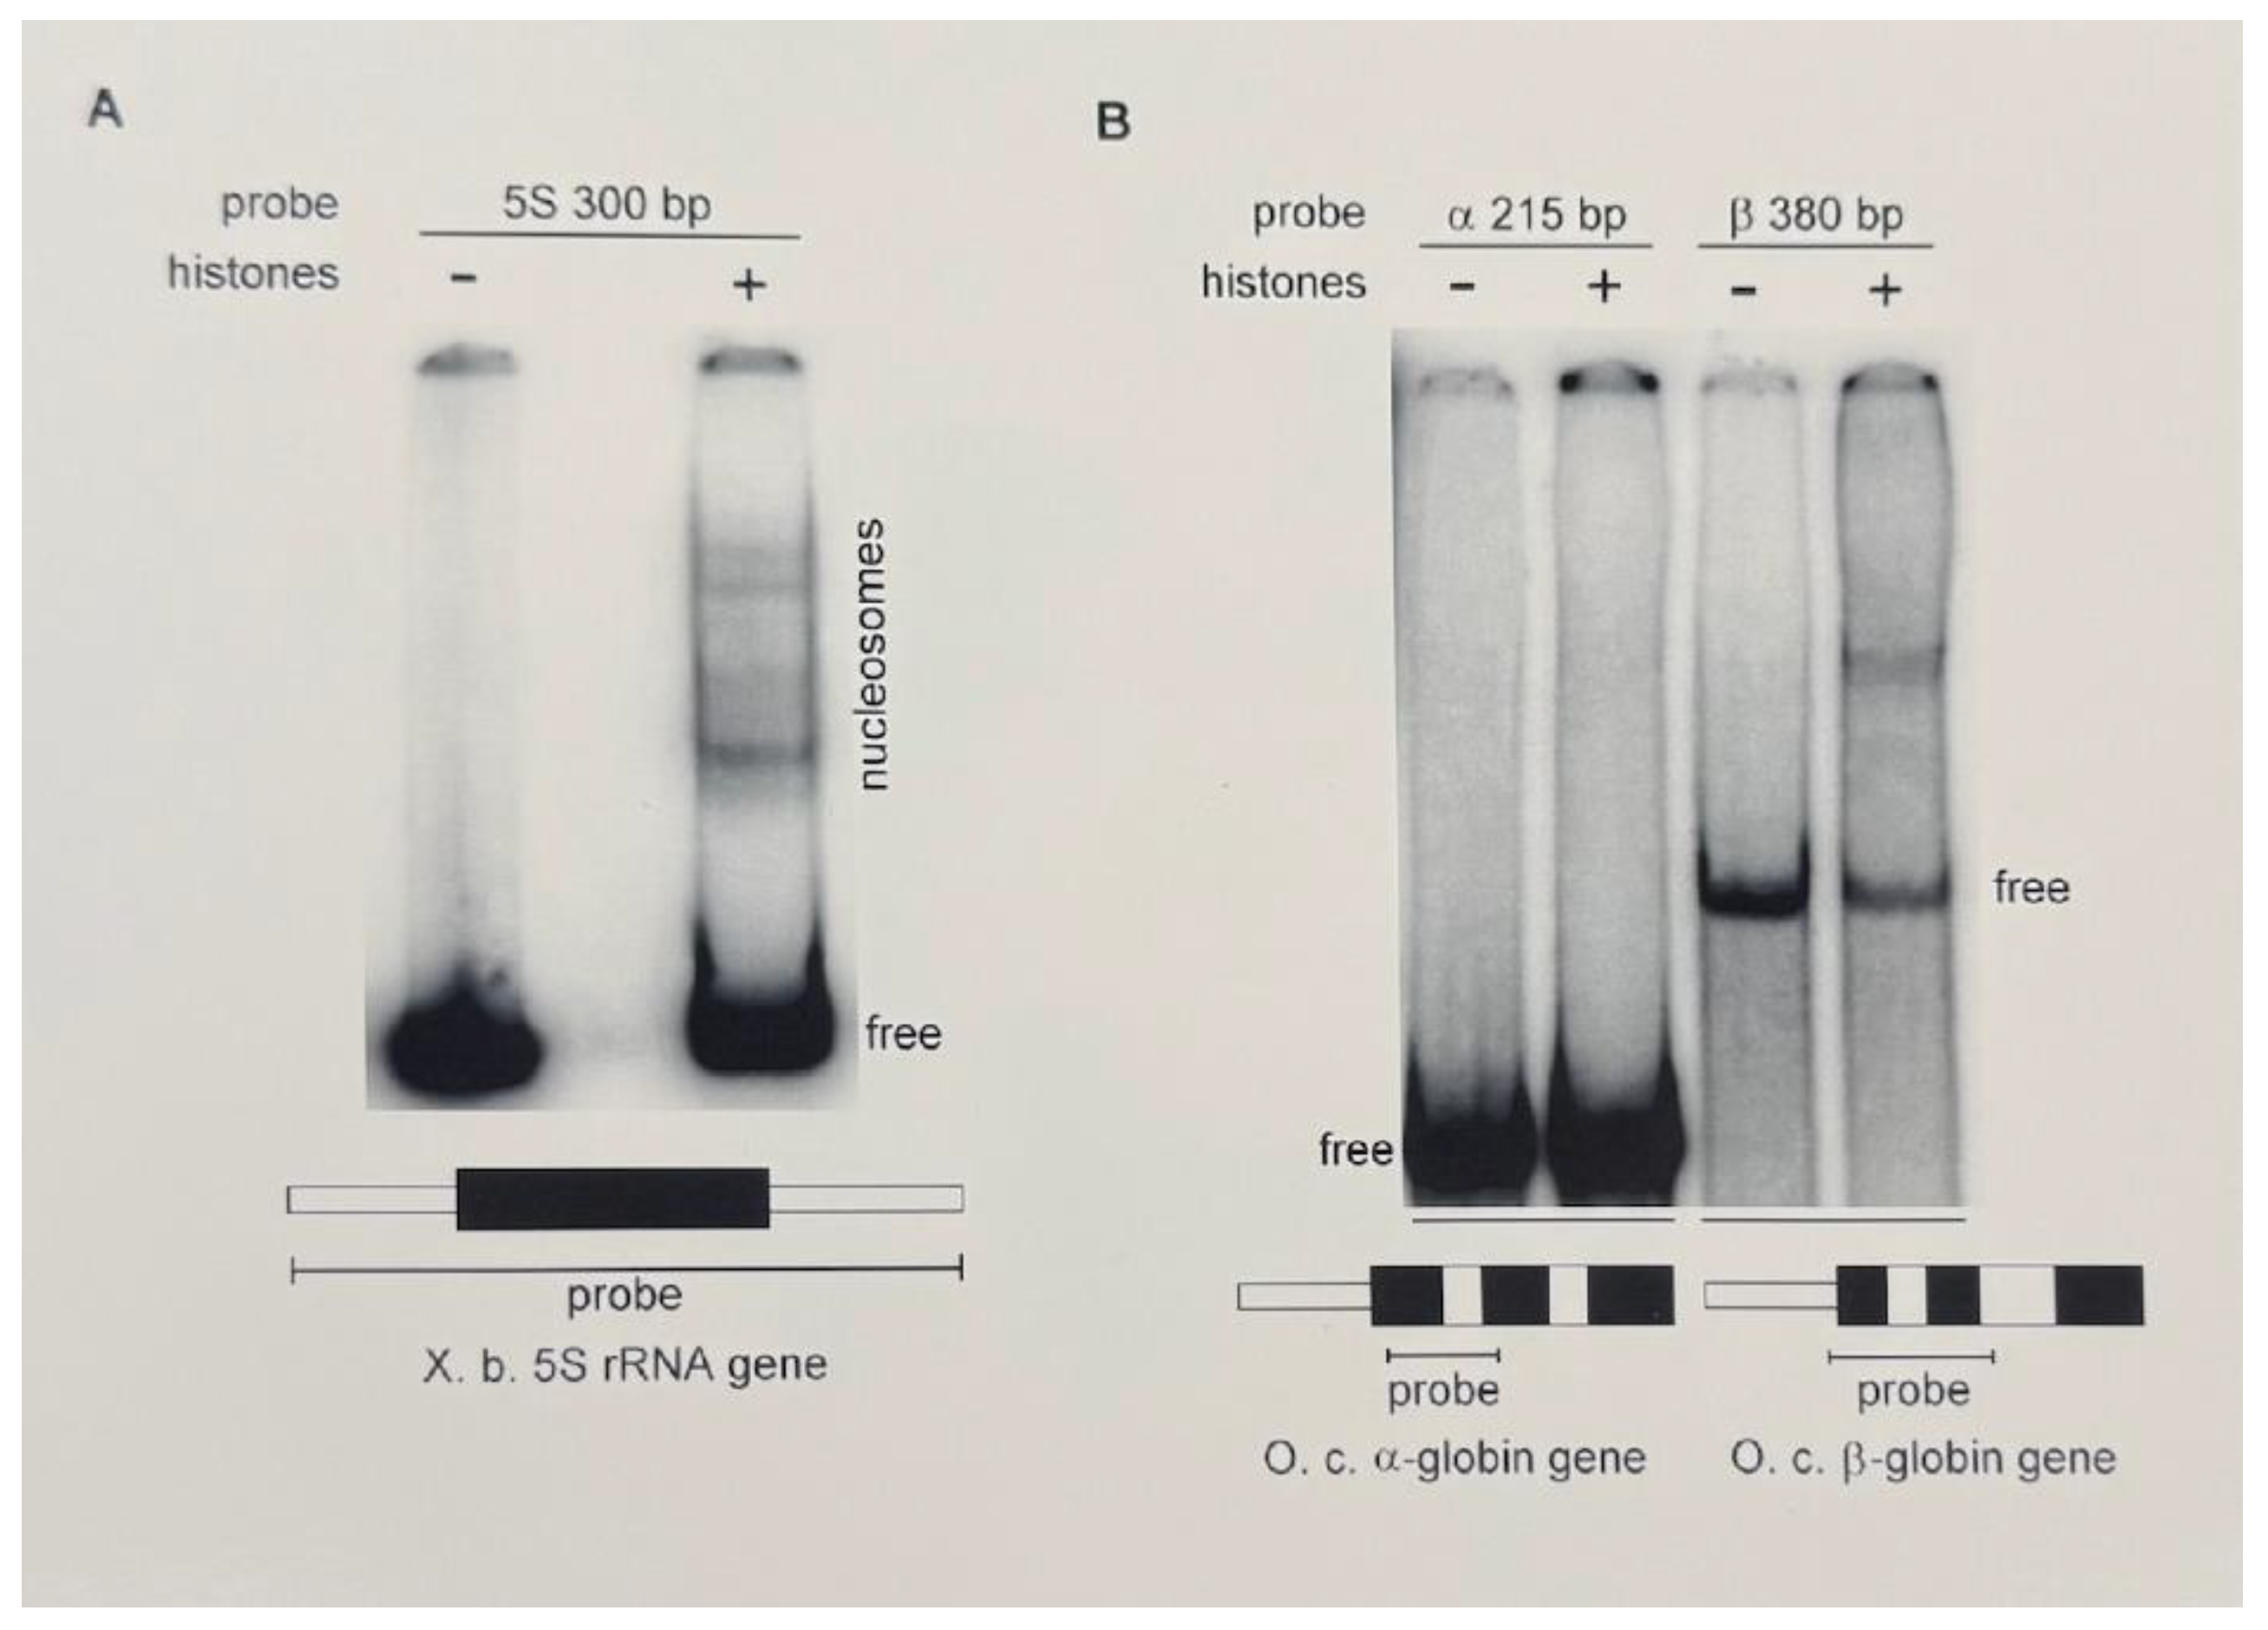
Figure 3.
Quantitation of differences in competitive nucleosome reconstitution with CpG island and non-CpG island DNA fragments. (A) Gel mobility shift analysis of the products of the reconstitution reactions (histone +) and the labeled probes alone (histone -). Equal masses of calf thymus DNA and histones were used. Diagram conventions are as described in Figure 2B. (B) The ratio of DNA complexed with histones to free DNA was calculated from the signals for each fraction in the phosphorimager output shown in panel A, quantitated as described in Materials and Methods. (C) Free energies of reconstitution for α-globin and β-globin gene fragments relative to the 5S rRNA gene fragment. The free energy was calculated using the equation E(test fragment) = RT ln (bound/free ratio for 5S fragment) - RT ln (bound/free ratio for test fragment).
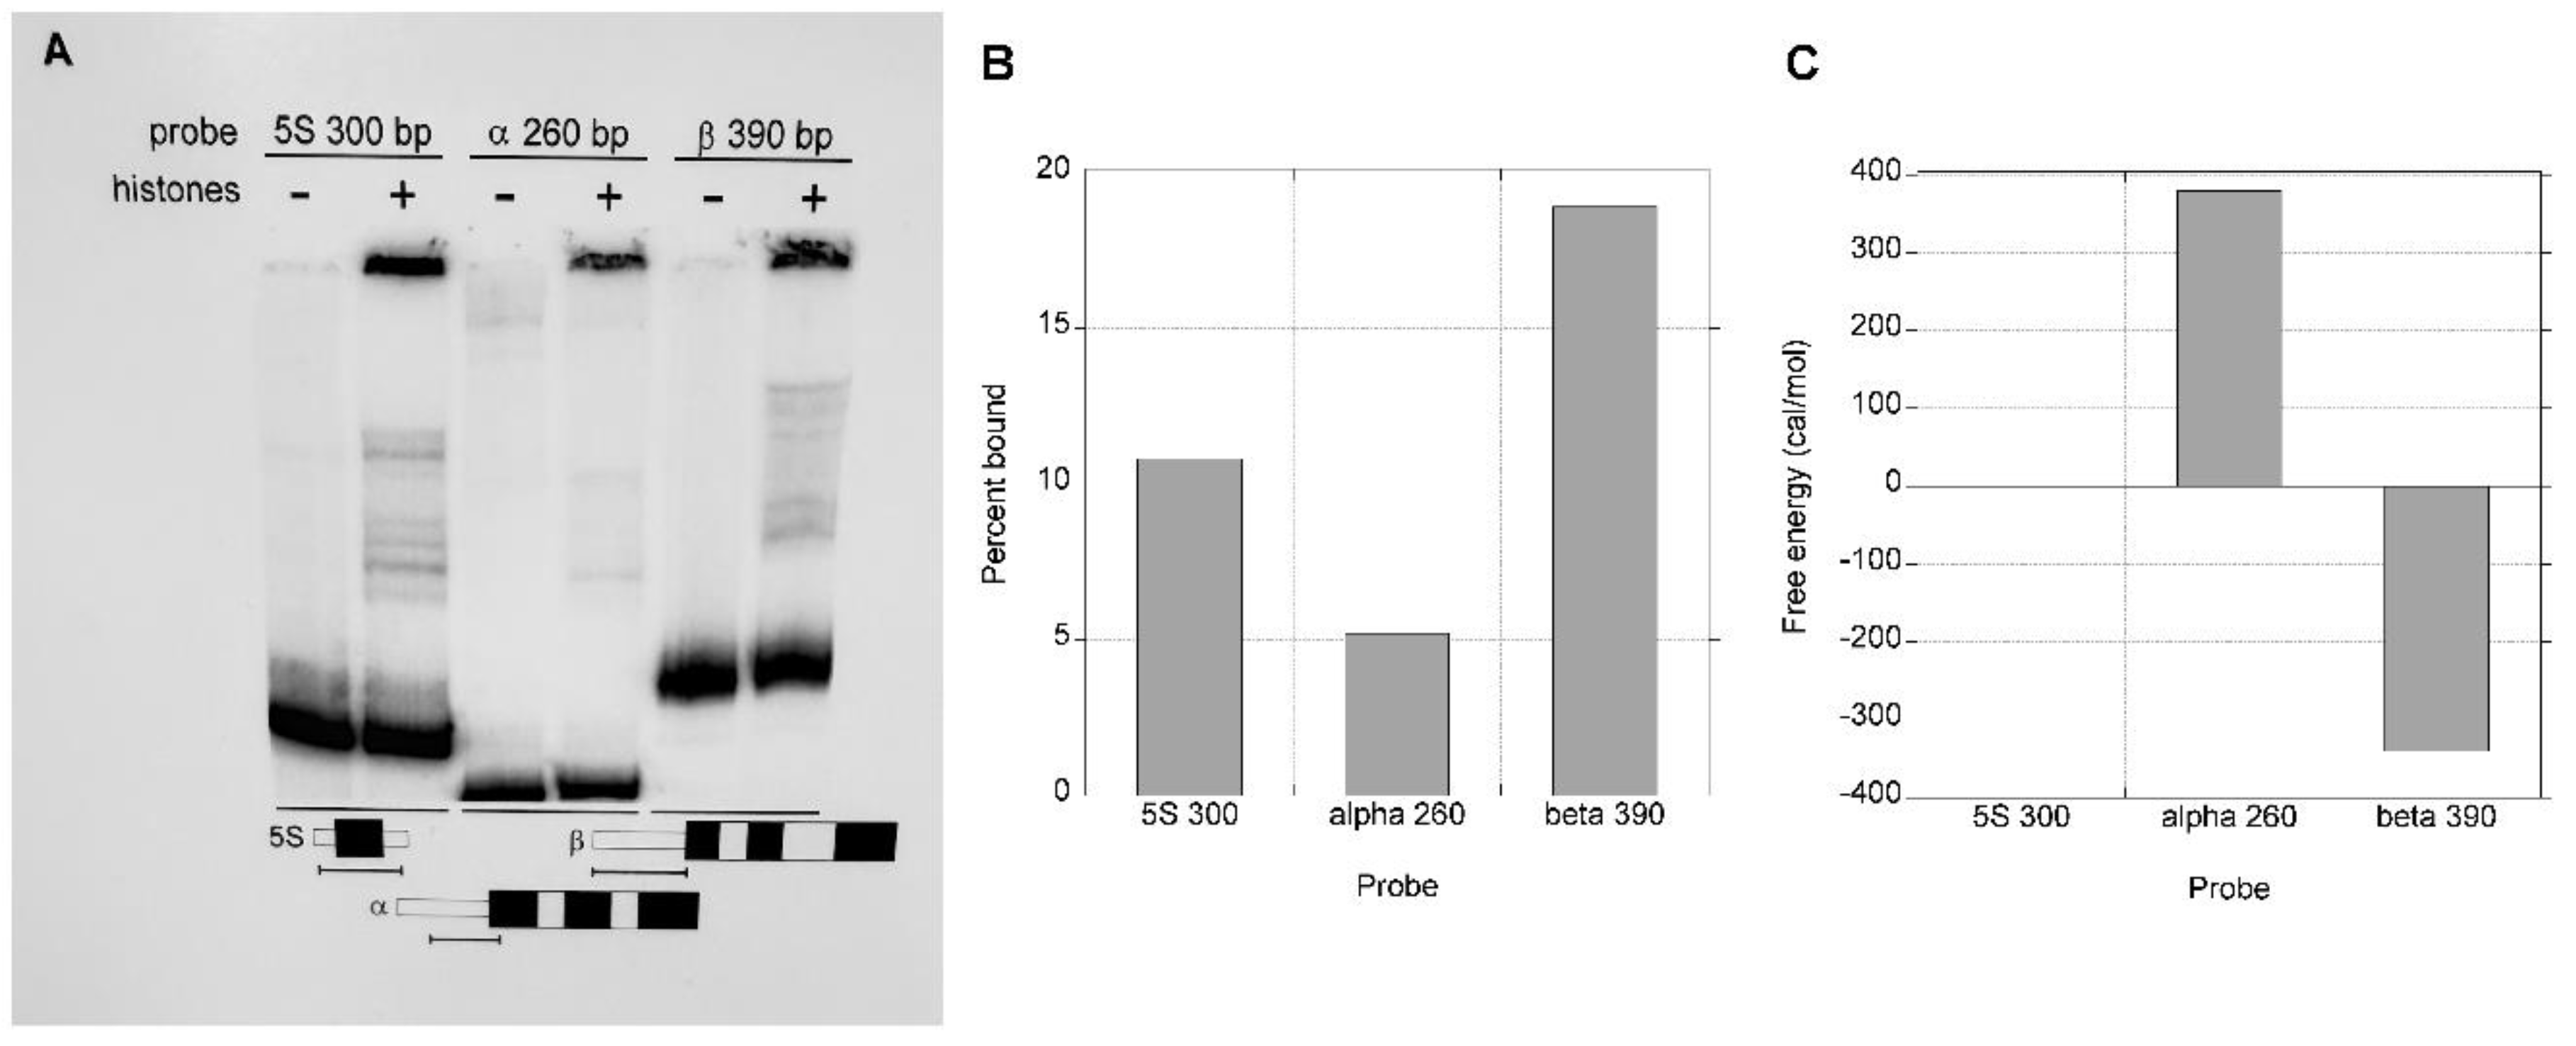
Figure 4.
Competitive nucleosome reconstitution on rabbit α-globin CpG island and β-globin non-CpG island DNA fragments of different lengths. (A) Gel mobility shift analysis of the products of the reconstitution reactions (histone +) and the labeled probes alone (histone -). A 2:1 mass ratio of calf thymus DNA to histones was used. Diagram conventions are as described in Figure 1B. (B) The ratio of DNA complexed with histones to free DNA was calculated from the signals for each fraction in the phosphorimager output shown in panel A.
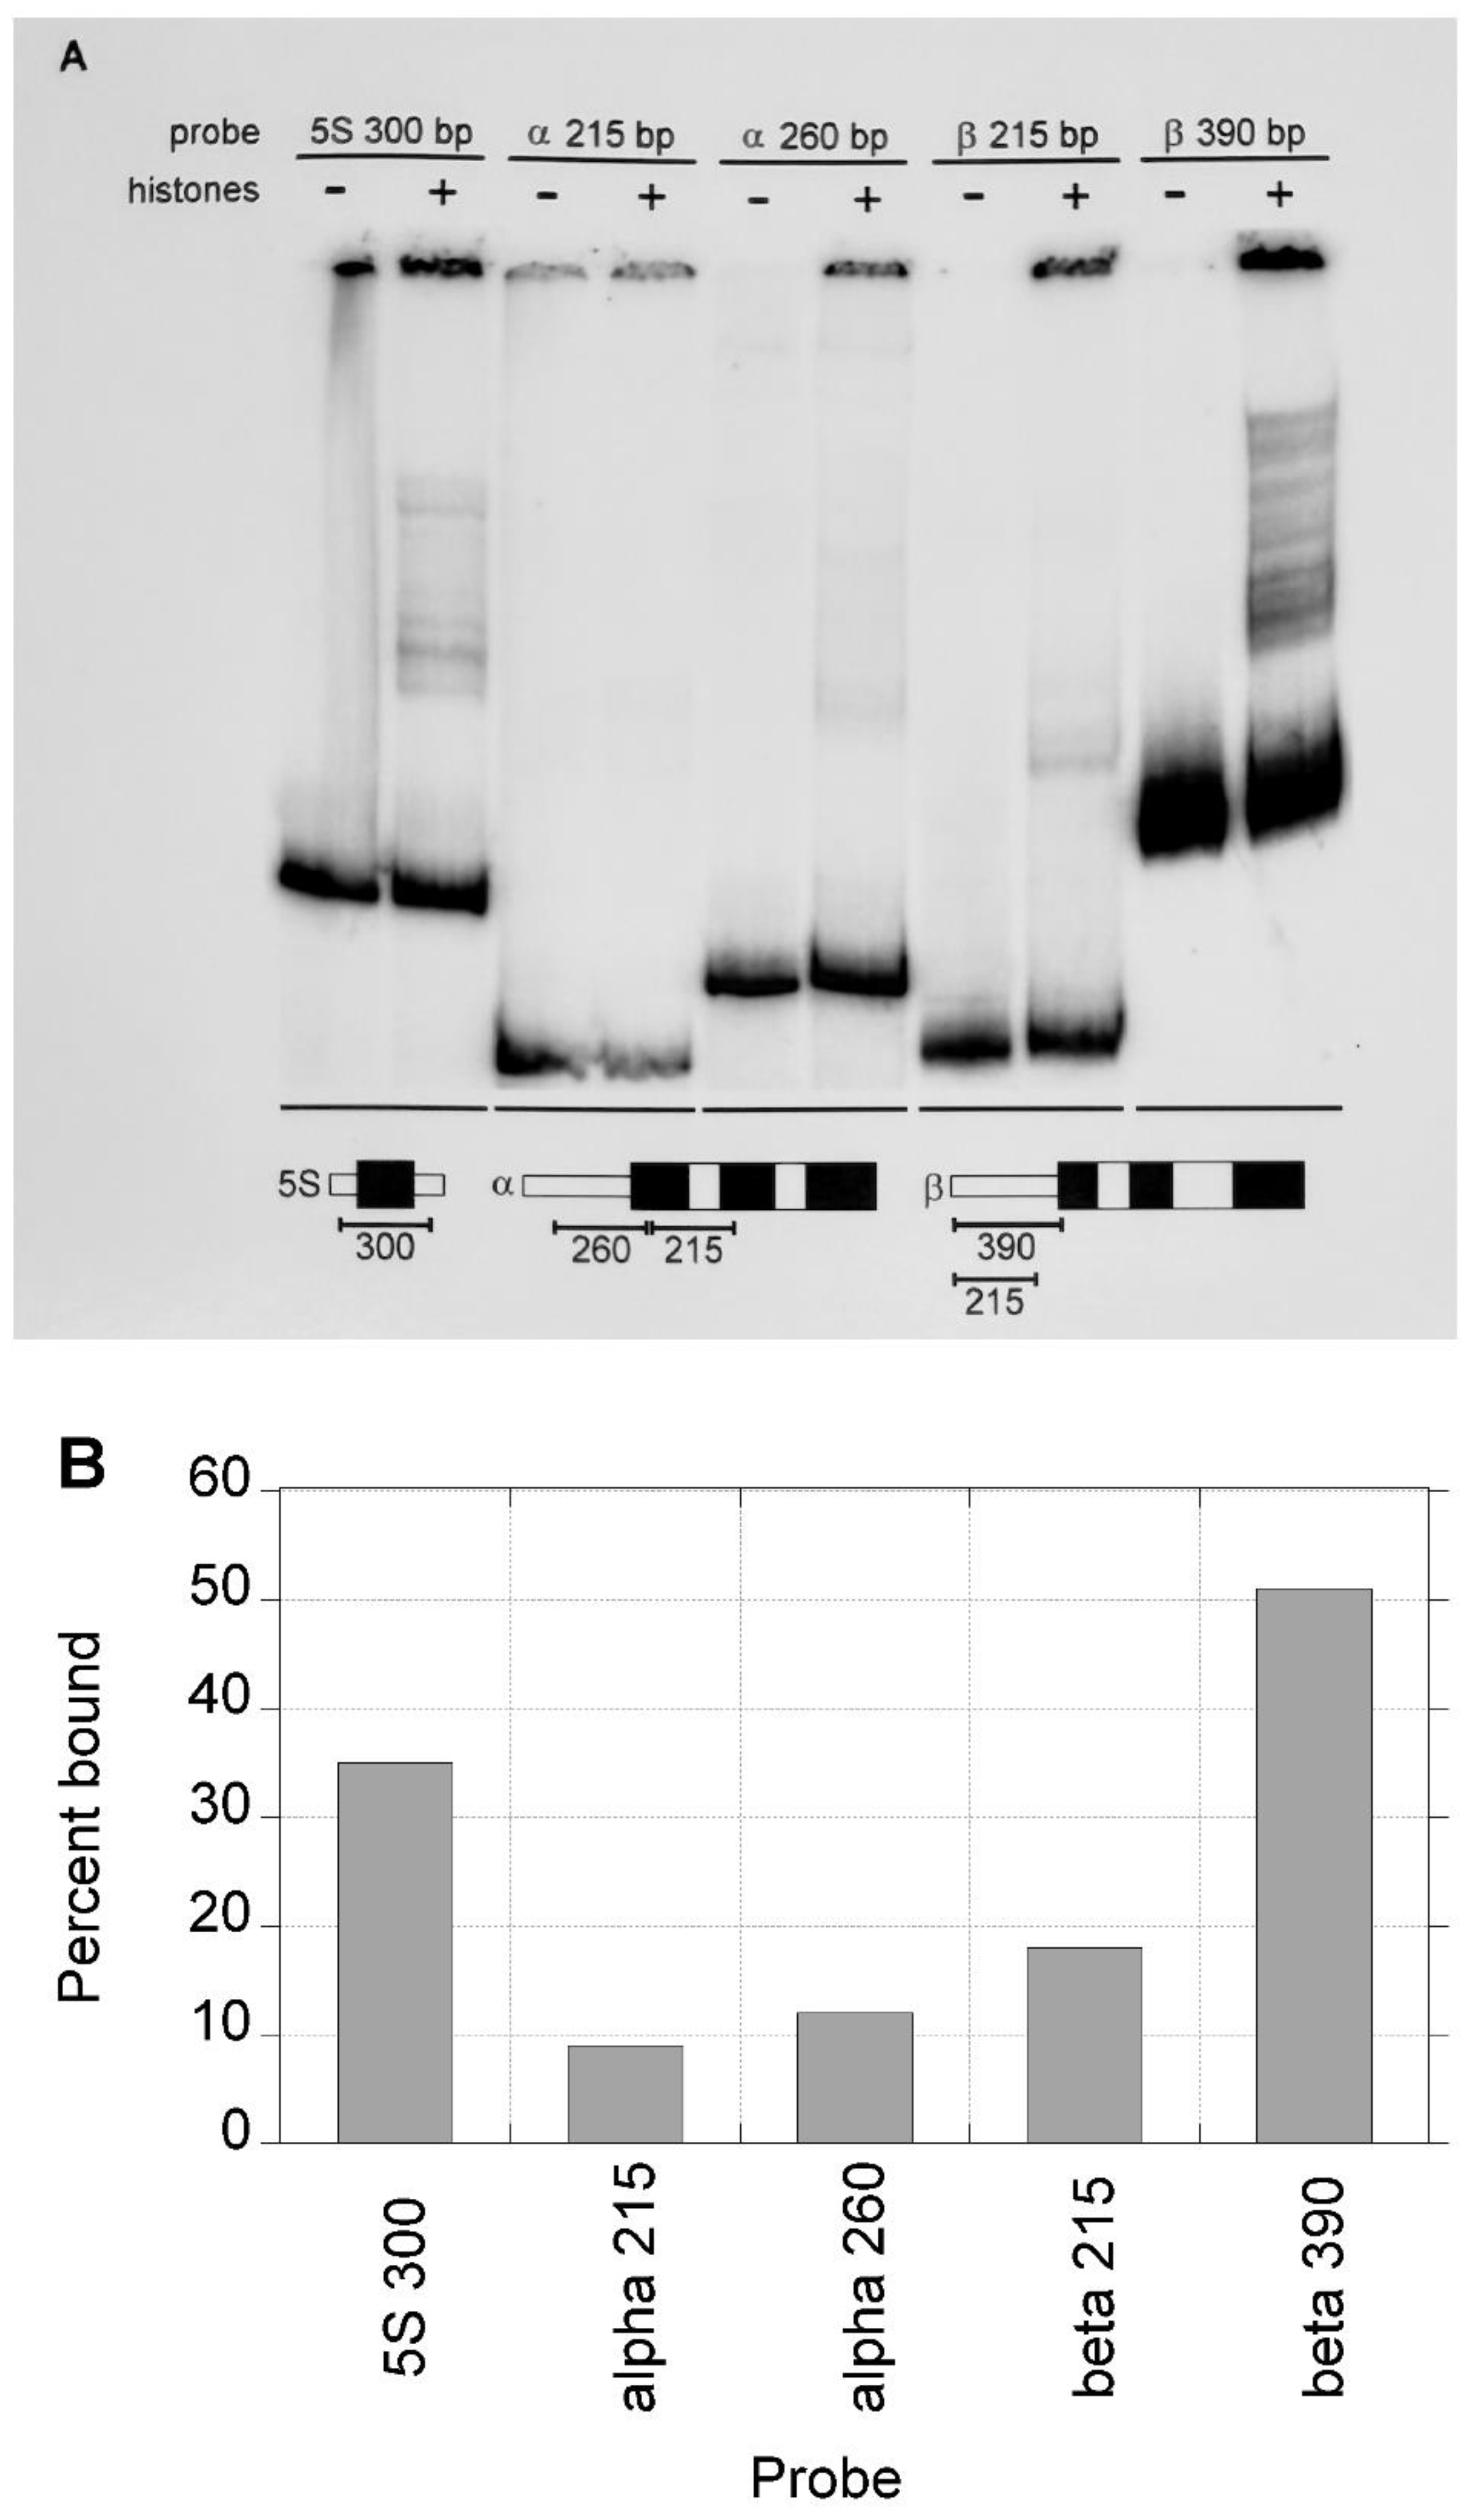
Figure 5.
Competitive nucleosome reconstitution on long rabbit α-globin CpG island and β-globin non-CpG island DNA fragments. (A) Gel mobility shift analysis of the products of the reconstitution reactions (histone +) and the labeled probes alone (histone -). Reconstitutions were performed in triplicate. A 2:1 mass ratio of calf thymus DNA to histones was used. (B) The ratio of DNA complexed with histones to free DNA was calculated from the signals for each fraction in the phosphorimager output shown in panel A. The values for each of the triplicates assays are plotted as circles, and the means for the groups of triplicates are indicated by the horizontal lines.
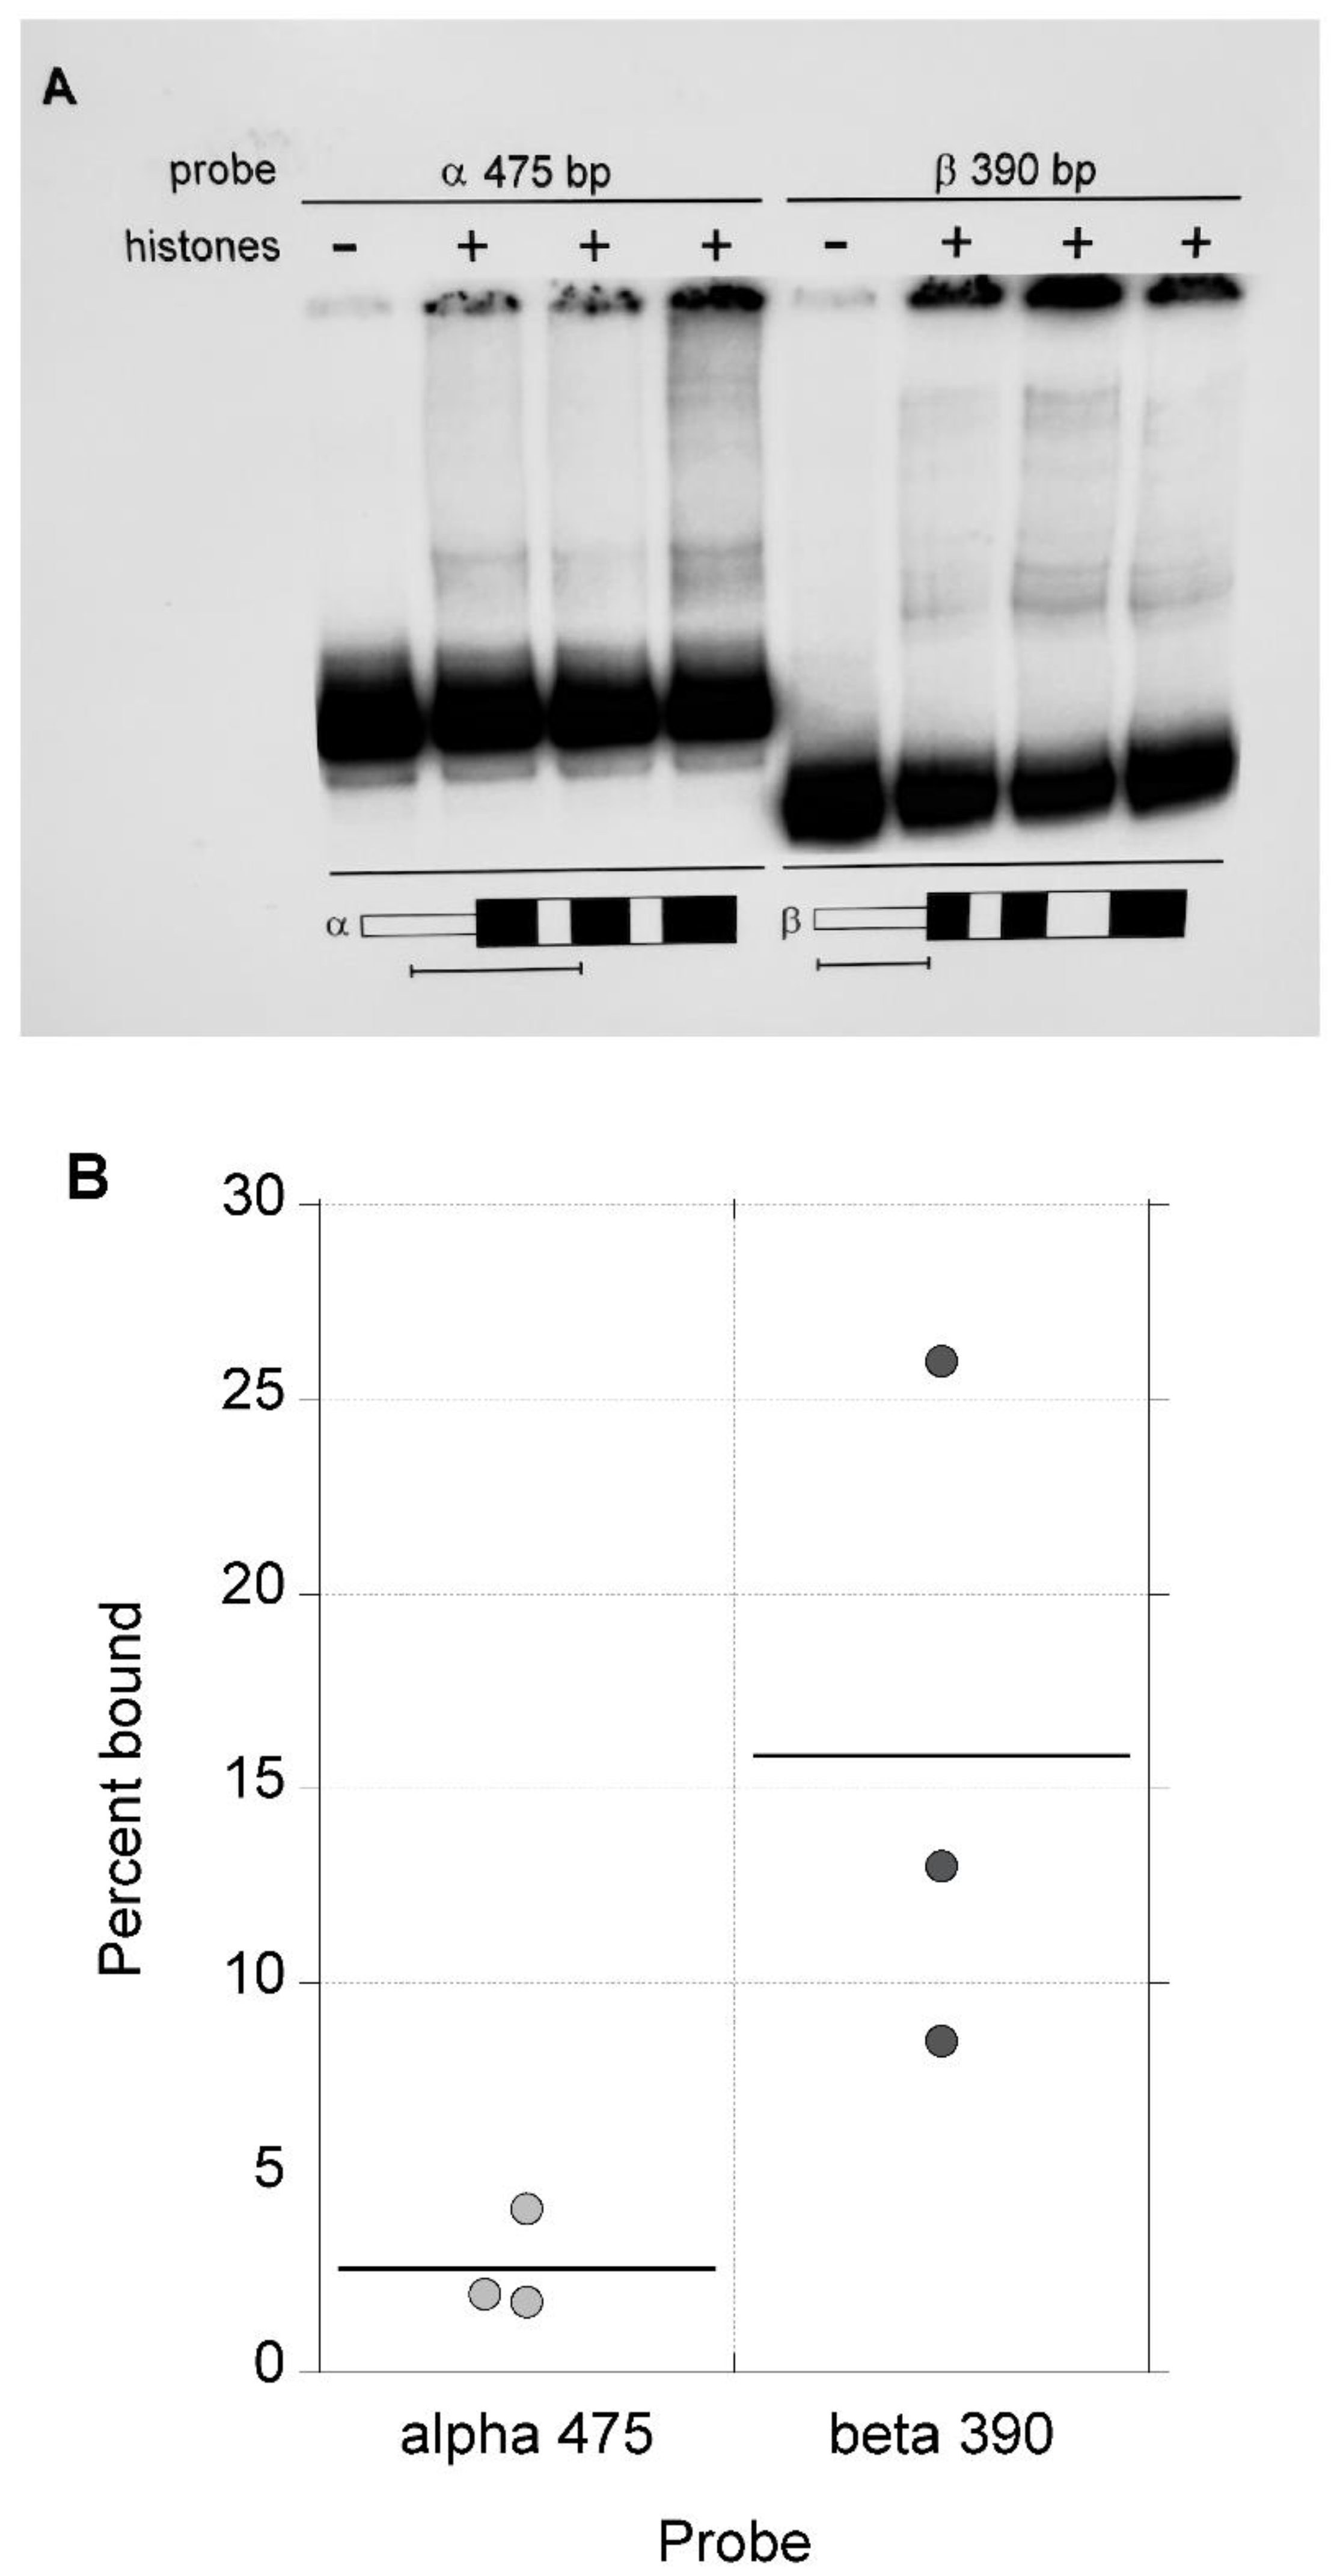
Figure 6.
Effect of DNA length on the amount of nucleosome reconstitution on CpG island and non-CpG island DNA. (A) Diagram of PCR fragments generated for comparison in a competitive nucleosome reconstitution assay. The gray rectangles in the gene diagrams indicate a CpG island (a-globin gene) and the black rectangles indicate non-CpG island DNA (b-globin gene). Exon1 of each gene is indicated by the taller rectangles. The sequences included in the products of the sizes indicated are represented by black bars. TSS = transcription start site. (B) Comparison of the amount of reconstitution on PCR fragments of increasing length from analogous sequences of the rabbit α- and β-globin genes at a 2:1 mass ratio of calf thymus DNA to histones. The ratio of DNA complexed with histones to free DNA was calculated from the signals for each fraction in the phosphorimager output from gel mobility shift analysis of reconstitution reactions with each probe. (C) Comparison of the amount of reconstitution on PCR fragments from analogous sequences of the rabbit α- and β-globin genes at a 1:1 mass ratio of calf thymus DNA to histones.
Disclaimer/Publisher’s Note: The statements, opinions and data contained in all publications are solely those of the individual author(s) and contributor(s) and not of MDPI and/or the editor(s). MDPI and/or the editor(s) disclaim responsibility for any injury to people or property resulting from any ideas, methods, instructions or products referred to in the content. |
© 2025 by the authors. Licensee MDPI, Basel, Switzerland. This article is an open access article distributed under the terms and conditions of the Creative Commons Attribution (CC BY) license (http://creativecommons.org/licenses/by/4.0/).
Copyright: This open access article is published under a Creative Commons CC BY 4.0 license, which permit the free download, distribution, and reuse, provided that the author and preprint are cited in any reuse.


