
Submitted:
18 November 2025
Posted:
20 November 2025
You are already at the latest version
Abstract
This paper presents a semi-supervised adaptive ensemble model designed to improve predictive performance in scenarios with limited labeled data. By integrating RandomForest, XGBoost, and an Attention-based Multi-Layer Perceptron (AttentionMLP), the model leverages both labeled and unlabeled data, using only 50% of the available labeled data alongside unlabeled data through an iterative pseudo-labeling process and an adaptive weighting scheme. The AttentionMLP incorporates a sample-wise attention mechanism to prioritize informative samples, enhancing robustness. The model's performance is evaluated on three diabetes classification datasets: BRFSS2015, Pima Indian, and Diabetes Diagnosis. Results demonstrate that the proposed model achieves superior Area Under the Curve (AUC), F1 Score, and Accuracy on the Pima Indian and Diabetes Diagnosis datasets, with AUC improvements of up to 12.4% over baseline models such as LSTM, GRU, and BiLSTM. On the BRFSS2015 dataset, the model performs competitively, highlighting its effectiveness across diverse data distributions. The findings suggest that the ensemble's combination of traditional and deep learning methods, augmented by attention and pseudo-labeling with limited labeled data, offers a powerful approach for classification tasks in data-scarce environments.
Keywords:
semi-supervised learning
; ensemble learning
; attention mechanism
; diabetes classification
; pseudo-labeling
1. Introduction
Diabetes poses a significant global health challenge, driving the need for accurate predictive models to facilitate early diagnosis and intervention. However, the scarcity of labeled data in medical datasets often limits the effectiveness of traditional supervised learning approaches, which struggle to generalize across diverse, real-world scenarios when annotations are sparse. Semi-supervised learning (SSL) has emerged as a compelling solution, harnessing both labeled and unlabeled data to bolster model performance. Despite its promise, existing SSL methods frequently lack the flexibility to adapt to varying data distributions and fail to fully integrate the complementary strengths of diverse modeling techniques.
In this paper, we propose a novel semi-supervised adaptive ensemble model tailored to address the challenges of limited labeled data in diabetes classification. By combining RandomForest, XGBoost, and an Attention-based Multi-Layer Perceptron (AttentionMLP), our approach leverages only 50% of available labeled data alongside unlabeled samples through an iterative pseudo-labeling process and an adaptive weighting scheme. The model’s design integrates the interpretability of traditional machine learning with the expressive power of deep learning, offering a robust solution for data-scarce environments. Our main contributions are:
- Development of an ensemble framework that synergistically combines RandomForest, XGBoost, and an AttentionMLP, leveraging their distinct strengths to enhance predictive accuracy.
- Introduction of a sample-wise attention mechanism within the AttentionMLP, enabling the model to prioritize informative samples and improve robustness against noisy or uncertain data.
- Implementation of an iterative pseudo-labeling strategy with adaptive weighting, optimizing the use of unlabeled data and achieving superior generalization with limited labeled samples.
We evaluate the proposed model on three diverse diabetes datasets: BRFSS2015, Pima Indian, and Diabetes Diagnosis—demonstrating significant performance gains over baselines such as LSTM, GRU, and BiLSTM. Notably, the model achieves notable improvements in Area Under the Curve (AUC) on the Pima Indian and Diabetes Diagnosis datasets, alongside competitive results on BRFSS2015. These outcomes highlight the model’s adaptability and effectiveness across varied data distributions. By offering a scalable and interpretable approach, our work not only advances diabetes classification but also holds potential for broader applications in fields like fraud detection and natural language processing, where labeled data is often limited.
2. Literature Review
The application of machine learning to diabetes prediction has been extensively explored, with prior work spanning supervised and semi-supervised techniques across diverse datasets. Alam et al. [1] investigated data mining approaches using the UCI Pima Indian Diabetes dataset, employing Artificial Neural Networks (ANN) and RandomForest (RF) to achieve accuracies of 75.7% and 81.6%, respectively. Their study focused on early diabetes diagnosis but highlighted persistent challenges in tracking feature importance and ensuring model interpretability, particularly for clinical adoption. Similarly, Hasan et al. [2] conducted a comprehensive evaluation of multiple classifiers—including KNN, Decision Trees (DT), RF, AdaBoost (AB), Naive Bayes (NB), and XGBoost—on the same dataset. Their best-performing model, XGBoost, achieved a 96% accuracy, yet class imbalance significantly impacted prediction reliability, underscoring the limitations of purely supervised methods in handling skewed distributions.
Semi-supervised learning (SSL) has gained attention for its ability to leverage unlabeled data, offering a pathway to address such limitations. Morid et al. [3] explored predictive analytics for chronic disease management, applying both supervised and semi-supervised methods to assess step-up therapy needs. Their one-class SVM approach in an SSL setting yielded a 65% F-measure, markedly outperforming the 42% achieved by supervised baselines, demonstrating SSL’s potential to handle label inconsistencies. Building on this, Subramaniyan et al. [4] proposed a semi-supervised framework for diabetes prediction using Big Data analytics on a dataset of 4.1 million records with over 42,000 variables. They employed self-training and tri-training techniques, achieving robust performance by iteratively refining pseudo-labels to mitigate label imbalances. However, their reliance on large-scale data and static training protocols limited adaptability to smaller, heterogeneous datasets.
Chowdhury et al. [5] examined data augmentation techniques to enhance diabetes prediction on the BRFSS dataset. They applied oversampling (SMOTE-N), undersampling (ENN), and hybrid methods (SMOTE-Tomek, SMOTE-ENN) to address class imbalance, improving recall rates. Nevertheless, their approach risked overfitting and data leakage, particularly when applied without cross-validation safeguards, highlighting a trade-off between imbalance correction and model generalization.
Tasin et al. [6] developed an automated diabetes prediction system using the Pima Indian dataset and a private dataset of female patients from Bangladesh. They tackled class imbalance with SMOTE and ADASYN oversampling, comparing models like Decision Trees, SVM, RF, Logistic Regression, KNN, and XGBoost. Their best model, XGBoost with ADASYN, achieved an accuracy of 81%, an F1-score of 0.81, and an AUC of 0.84, with SHAP and LIME providing interpretability insights. Despite these strengths, their supervised focus overlooked the potential of unlabeled data, a gap our work seeks to fill. Muhammad et al. [7] explored supervised learning for diabetes prediction using data from Murtala Mohammed Specialist Hospital in Nigeria, evaluating Logistic Regression, SVM, KNN, RF, Naive Bayes, and Gradient Boosting. RF topped their results with an 88.76% accuracy and an ROC of 86.28% alongside Gradient Boosting, yet the absence of SSL techniques limited its applicability in data-scarce scenarios.
Our proposed semi-supervised adaptive ensemble model builds on these insights by integrating RandomForest, XGBoost, and an AttentionMLP into a cohesive framework. Unlike prior studies, it leverages only 50% of labeled data, augmented by an iterative pseudo-labeling process that dynamically refines predictions using unlabeled samples. The AttentionMLP’s sample-wise attention mechanism prioritizes informative instances, enhancing robustness without the computational complexity of feature-wise attention, distinguishing it from methods like those of Tasin et al. [6]. Adaptive weighting optimizes classifier contributions, addressing the static ensemble limitations seen in Hasan et al. [2] and Muhammad et al. [7]. Evaluated on BRFSS2015, Pima Indian, and Diabetes Diagnosis datasets, our model outperforms baselines like LSTM and GRU, achieving AUC gains of up to 12.4%. By overcoming challenges in adaptability, imbalance sensitivity, and data scarcity, this work establishes a new benchmark for diabetes classification and offers a scalable, interpretable solution with broader implications for predictive analytics.
3. Proposed Model
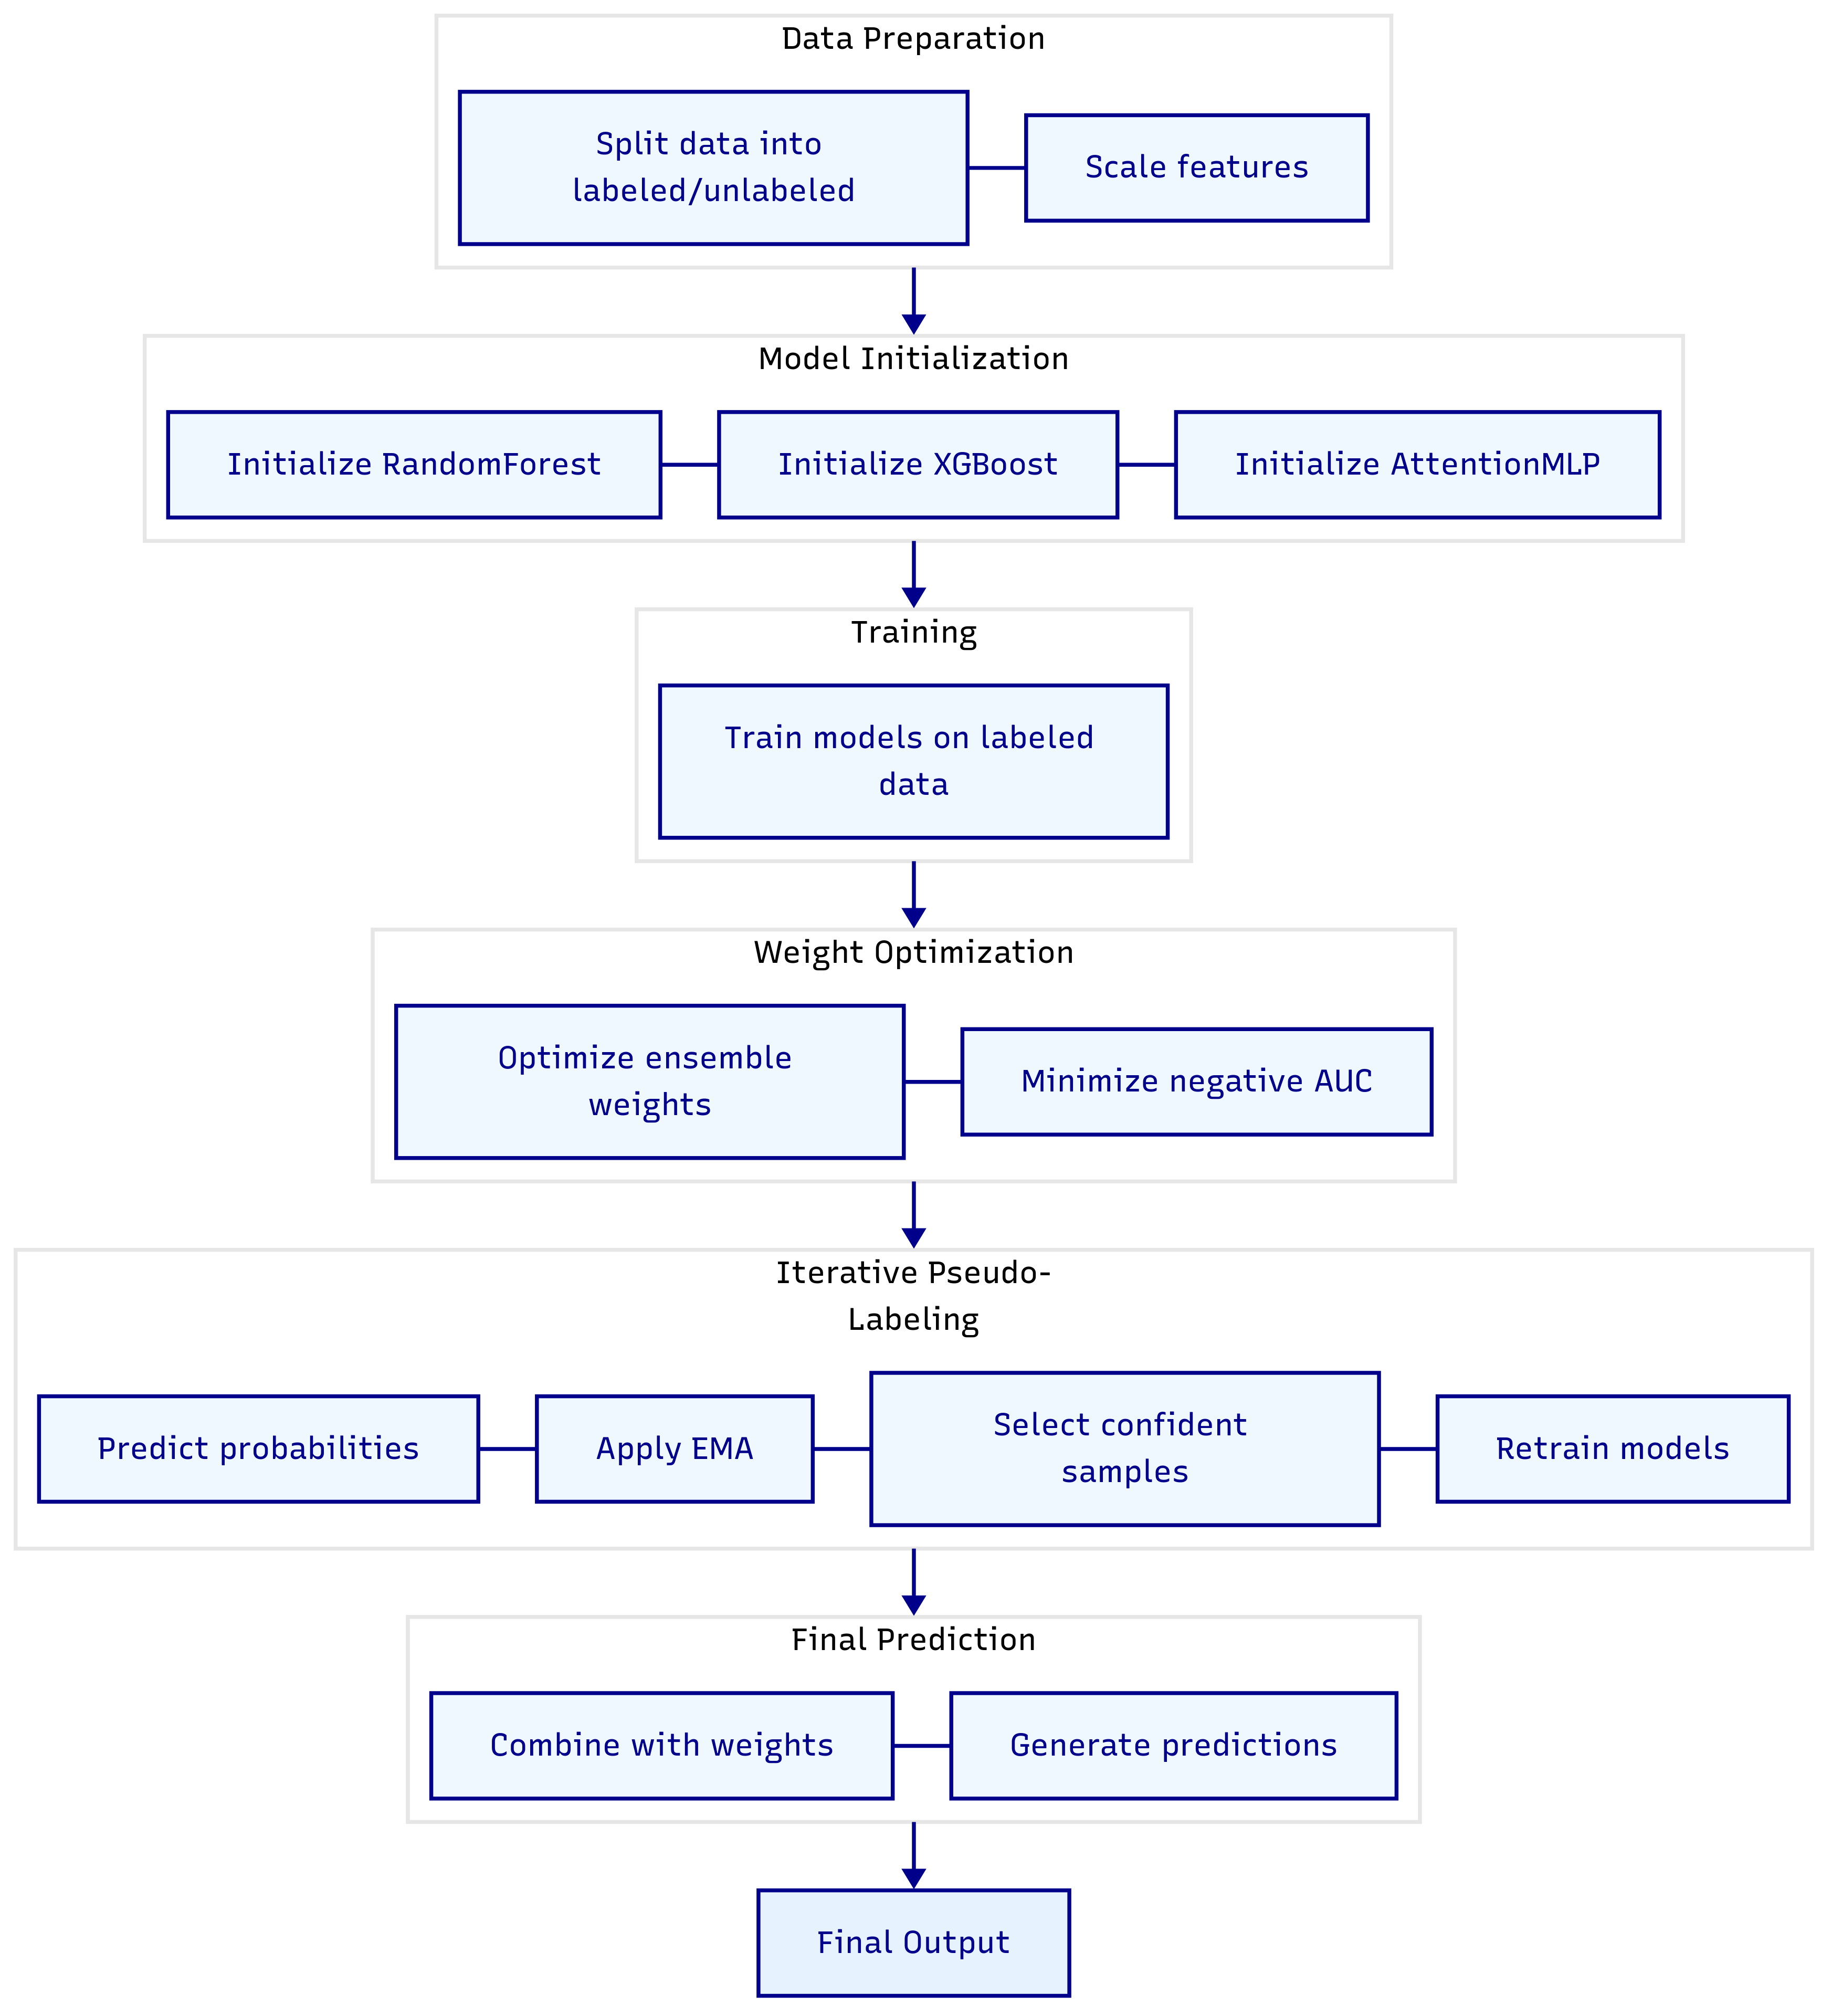
In this section, we present a novel semi-supervised adaptive ensemble model designed to enhance predictive performance in settings with limited labeled data [8]. By integrating traditional machine learning techniques with deep learning approaches, the model leverages both labeled and unlabeled data through an iterative pseudo-labeling process and an adaptive weighting scheme. The overall pipeline, depicted in Figure 1, illustrates the flow from data preparation to final prediction. Below, we detail each component of the model, its functionality, and its role within the ensemble.
3.1. Semi-Supervised Adaptive Ensemble
Semi-supervised learning (SSL) aims to improve model generalization by utilizing both labeled data, denoted as , where is an input sample and is its binary label, and unlabeled data, . In this work, we use only 50% of the available labeled data for training, such that constitutes half of the total initially labeled samples, with the remaining labeled samples treated as unlabeled (). This results in an initial split where , and includes both originally unlabeled samples and the withheld labeled samples. The proposed ensemble comprises three classifiers: a RandomForest classifier, an XGBoost classifier, and an Attention-based Multi-Layer Perceptron (AttentionMLP), each contributing distinct strengths to the model.
The AttentionMLP is a neural network with a sample-wise attention mechanism, defined as:
where: - is a fully connected layer mapping the input x to a hidden representation , with hidden dimension and ReLU activation. - computes a scalar attention weight for the sample. - is the sigmoid function, yielding . - The hidden representation is scaled by this weight: . - maps to class logits.
3.2. Initialization and Training Process
The RandomForest and XGBoost classifiers are initialized using standard libraries (e.g., scikit-learn and xgboost in Python). Their hyperparameters are optimized via cross-validation exclusively on the initial labeled data . The AttentionMLP is also initialized and trained on .
Crucially, before the iterative pseudo-labeling process begins, all three classifiers (RandomForest, XGBoost, and AttentionMLP) are independently trained on the initial labeled data . There is no direct interaction or information sharing between these models during their individual initial training phase. This initial training allows each model to learn baseline predictive capabilities from the available ground truth. The output before the pseudo-labeling loop is the set of predicted probabilities (, , ) for the unlabeled data , generated by these independently trained models. These probabilities are then averaged to form , which is subsequently stabilized using Exponential Moving Average (EMA) to form . This is then used to generate initial pseudo-labels for high-confidence unlabeled samples, which are then added to for subsequent retraining. Figure 1 implicitly reflects this initial training step where the models produce outputs that feed into the pseudo-labeling loop.
3.3. Role of Ensemble Components and Algorithm Choices
We chose RandomForest (RF) and XGBoost due to their proven effectiveness and widespread use in tabular data analysis, offering robustness against noise and excellence at capturing complex patterns. RF generalizes well by averaging predictions from multiple decision trees, reducing overfitting, while XGBoost boosts accuracy by sequentially correcting errors of previous models in an additive manner. Their combined strengths, along with their relative interpretability compared to deep learning models, make them ideal for establishing a strong baseline for our hybrid model, especially given their past success in diverse classification tasks, including diabetes prediction.
However, traditional machine learning models like RF and XGBoost can sometimes miss subtle, hierarchical patterns inherent in complex datasets. To address this limitation and enhance the model’s ability to capture deeper representations, we included the AttentionMLP. This deep learning component excels at learning intricate mappings and provides a crucial adaptive element through its sample-wise attention mechanism. This mechanism dynamically assigns a scalar weight to each input sample’s hidden representation. This allows the model to prioritize more informative samples while mitigating the influence of noisy or less certain ones, which is particularly advantageous in semi-supervised learning where pseudo-labeled data may introduce errors. This makes the AttentionMLP more robust than traditional models or standard MLPs that treat all samples equally. Unlike feature-wise attention, this sample-wise approach maintains computational efficiency by focusing on the importance of entire samples, further enhancing the model’s robustness and adaptability to varying data quality.
This specific ensemble strategy blends the complementary strengths of RF and XGBoost for reliable pattern recognition and a strong baseline with the AttentionMLP’s capacity for deep pattern learning and adaptive weighting. This synergy mitigates individual weaknesses, such as the potential for traditional models to miss complex relationships or the vulnerability of deep learning models to limited labeled data, leading to superior generalization and overall performance, particularly when labeled data is scarce. Other ensemble choices, such as solely relying on deep learning models, might struggle significantly with limited labeled data, while purely traditional ensembles might not capture the full complexity of the data without the deep learning component.
3.4. Adaptive Ensemble Weighting
To integrate the predictions from the three classifiers effectively, we employ an adaptive weighting scheme. Let , , and represent the predicted probabilities of the positive class from the RandomForest, XGBoost, and AttentionMLP, respectively. The combined probability is:
where and . These weights are optimized on a dedicated validation set, comprising 20% of the initial labeled data, by minimizing the negative Area Under the Receiver Operating Characteristic Curve (AUC):
This optimization process, implemented using numerical optimization (e.g. scipy package’s optimize.minimize as shown in the accompanying code), ensures that each classifier’s contribution is balanced according to its empirically observed performance on the validation set, thereby maximizing the overall ensemble’s predictive accuracy and robustness.
3.5. Iterative Pseudo-Labeling
To effectively exploit the large volume of unlabeled data [9] and progressively improve model performance, the model employs an iterative pseudo-labeling strategy [10], outlined as follows:
- Prediction: In each iteration, all three independently trained classifiers generate predicted probabilities for the currently available unlabeled data : , , and .
- Averaging: The raw predicted probabilities from the three classifiers are averaged to compute a mean probability: .
- Stabilization: To ensure stability and reduce the impact of noisy predictions, an Exponential Moving Average (EMA) is applied to smooth the ensemble’s predictions over iterations: , with . In the first iteration, is initialized directly with . This EMA-based "teacher" model provides more reliable pseudo-labels.
- Pseudo-Labeling: The probabilities are converted to softmax probabilities. Samples from whose maximum class probability (confidence) exceeds a predefined threshold (set to 0.75 in our implementation) are selected as high-confidence pseudo-labeled samples.
- Data Augmentation: To maintain diversity and prevent the rapid depletion of the unlabeled pool, a random subset of these high-confidence samples is selected. We implement a strategy to select a minimum of 5 samples and a maximum of 25% of the total confident set in each iteration. These selected samples, along with their pseudo-labels, are then added to the labeled training set .
- Update and Retrain: The selected pseudo-labeled samples are removed from to avoid redundant processing. All three classifiers (RandomForest, XGBoost, and AttentionMLP) are then retrained on the now augmented . This retraining step is crucial as it allows the models to learn from a progressively larger and more confident dataset, directly contributing to enhanced generalization capabilities and overall predictive performance.
This iterative process repeats for up to 50 iterations or until fewer than 10 confident samples remain in , whichever comes first. This ensures stable and meaningful updates to the labeled set. The iterative flow is integrated into Figure 1, showing how the ensemble continually refines its knowledge by leveraging unlabeled data.
3.6. Final Prediction
For the test set, the ensemble computes the final prediction using the optimized weights obtained from the adaptive weighting step:
The binary output is determined by thresholding the combined probability:
This weighted combination leverages the optimized strengths of all classifiers, producing a robust final prediction by integrating diverse perspectives.
3.7. Summary
The proposed semi-supervised adaptive ensemble model [11] integrates RandomForest, XGBoost, and an AttentionMLP to effectively address the challenges of limited labeled data [12]. Through its novel sample-wise attention mechanism, adaptive weighting, and an iterative pseudo-labeling strategy, the model achieves enhanced generalization, robustness, and scalability. This approach is well-suited for diverse domains such as medical diagnosis, fraud detection, and natural language processing, where obtaining large quantities of labeled data is often costly or impractical. The overall pipeline, illustrated in Figure 1, provides a clear overview of the model’s workflow.
4. Dataset Information and Preprocessing
This study leverages three datasets for diabetes classification. Below, we describe each dataset and outline the preprocessing steps applied. Table 2 summarizes the datasets’ key characteristics.
4.1. Dataset 1: BRFSS2015 Survey Responses
The BRFSS2015 dataset from the CDC contains 253,680 survey responses with 21 features and a multiclass target, Diabetes_012 (0 = no diabetes/pregnancy-only, 1 = prediabetes, 2 = diabetes) [13]. After merging classes 1 and 2 into a binary target (1 = diabetes, 0 = no diabetes), the distribution is 213,703 (84.24%) for class 0 and 39,977 (15.76%) for class 1. Preprocessing includes random undersampling to balance classes (39,977 per class), an 80:20 train-test split with stratification, a further 80:20 train-validation split, and feature [14] normalization using MinMaxScaler to [0, 1].
4.2. Dataset 2: Pima Indian Diabetes Dataset
Originating from the National Institute of Diabetes and Digestive and Kidney Diseases, this dataset includes 768 records of Pima Indian women (age ≥ 21) with 8 continuous features (e.g., glucose, BMI, insulin) and a binary target, Outcome (0 = non-diabetic, 1 = diabetic) [15]. The initial distribution is 500 (65.10%) for class 0 and 268 (34.90%) for class 1. SMOTE oversampling balances the classes (500 each), followed by an 80:20 train-test split, an 80:20 train-validation split (both stratified), and normalization with MinMaxScaler [16]. A snapshot of the dataset’s initial rows and columns is presented in Table 1.
4.3. Dataset 3: Diabetes Diagnosis Dataset
This dataset comprises 9,538 medical records with 16 features (e.g., HbA1c, triglycerides, WHR) and a binary target, Outcome (0 = no diabetes, 1 = diabetes) [17]. The original distribution is 6,256 (65.60%) for class 0 and 3,282 (34.40%) for class 1. Preprocessing involves dropping an unused column (Unnamed: 0), SMOTE oversampling to balance classes (6,256 each), an 80:20 train-test split, an 80:20 train-validation split (both stratified), and feature scaling with MinMaxScaler. Table 2 provides a summary of all datasets used in this study, including the Diabetes Diagnosis Dataset.

Table 2.
Summary of Datasets Used in the Study.
| Dataset | Original Distribution (0/1) | Balancing Method | Final Size (0/1) |
|---|---|---|---|
| BRFSS 2015 | 213,703 / 39,977 | Undersampling | 39,977 / 39,977 |
| Pima Indian | 500 / 268 | SMOTE | 500 / 500 |
| Diabetes Diagnosis | 6,256 / 3,282 | SMOTE | 6,256 / 6,256 |
5. Hyperparameter Tuning
To optimize model performance, we employed Optuna, a hyperparameter optimization framework, to tune all models systematically. For tree-based models (RandomForest, XGBoost) [18], we adjusted key parameters such as n_estimators (50–300) and max_depth (3–20), with XGBoost, additionally tuning learning_rate (0.01–0.3). Neural network models (LSTM, GRU, Attention, LSTM+Attention, Bidirectional LSTM) were tuned for units (10–256) and dropout_rate (0.1–0.5), utilizing early stopping with a patience of 3 to prevent overfitting. Final models were retrained on the full training data using the best hyperparameters identified, ensuring robust generalization to the test set.
6. Evaluation & Results
This section evaluates the proposed semi-supervised adaptive ensemble model on three datasets decribed above: BRFSS2015, Pima Indian and Diabetes Diagnosis. Performance is assessed using Area Under the Curve (AUC), F1 Score, Accuracy, True Positive Rate (TPR), and False Positive Rate (FPR), compared against five baselines: LSTM, GRU, Attention, LSTM with Attention (LSTM+Attention), and BiLSTM. Results are presented in Table 3, with the best metric per dataset bolded [19].
7. Discussion
The proposed semi-supervised adaptive ensemble model demonstrates strong performance across the three datasets, as detailed below.
7.1. Performance Analysis
For the Pima dataset, the proposed model achieved the highest AUC (0.8516), F1 Score (0.7783), and Accuracy (0.7750), outperforming the best baseline, BiLSTM (AUC: 0.7583), by 12.4%. The lowest FPR (0.2400) compared to BiLSTM (0.4400) indicates enhanced specificity, while the F1 Score reflects a balanced precision-recall trade-off. This suggests the ensemble effectively leverages both labeled and unlabeled data to enhance generalization.
On the Diabetes Diagnosis Dataset, the model recorded exceptional performance, tying with LSTM+Attention for the highest AUC (0.9992) and achieving the best F1 Score (0.9895), Accuracy (0.9896), TPR (0.9832), and FPR (0.0040). The low FPR compared to GRU (0.0216) and BiLSTM (0.0367) underscores its precision, while the high TPR ensures excellent recall. These results indicate that the model excels with sufficient data, making it highly reliable for critical applications.
BRFSS2015 Dataset results show a competitive AUC (0.8177), slightly below the Attention baseline (0.8213). The F1 Score (0.7537) and Accuracy (0.7449) are outpaced by GRU (0.7597 and 0.7464), though the model achieves the lowest FPR (0.2913). This suggests that dataset-specific characteristics may influence the model’s dominance, though it remains effective overall.
7.2. Model Contributions
Our ensemble model integrates RandomForest, XGBoost, and AttentionMLP with adaptive weighting to capture diverse data patterns, enhancing prediction accuracy and generalization. The AttentionMLP’s sample-wise attention mechanism is crucial as it learns to prioritize more informative samples and mitigate the influence of noisy pseudo-labels, leading to high recall (e.g., 0.9832 TPR for Diabetes Diagnosis). Furthermore, the iterative pseudo-labeling strategy significantly boosts performance by effectively leveraging large amounts of unlabeled data, resulting in notable AUC improvements (e.g., up to 12.4% on Pima Indian). Finally, our adaptive ensemble weighting dynamically optimizes each model’s contribution, ensuring robust and balanced predictions that consistently outperform individual models or static ensemble approaches. This comprehensive framework not only addresses data scarcity but also ensures a more resilient and accurate model for complex classification tasks.
7.3. Model Computational Demand
The proposed ensemble model offers strong performance but comes with substantial computational demands, primarily due to training three classifiers (RandomForest, XGBoost, AttentionMLP), an iterative pseudo-labeling process (up to 50 cycles), and intensive hyperparameter optimization, especially for the GPU-dependent AttentionMLP. In low-resource settings, these demands are challenging, ideally requiring GPUs for the AttentionMLP. Without such resources, simpler, less computationally intensive alternatives might be more practical, though possibly at the cost of some accuracy. However, once trained, the model offers fast inference, making real-time predictions feasible, thus presenting a trade-off between performance and computational overhead.
7.4. Implications
The model excels with limited labeled data, showing near-perfect results on Diabetes Diagnosis and scalability on Pima Indian. However, its computational complexity may challenge resource-limited settings, and BRFSS2015 results suggest dataset-specific tuning needs.
7.5. Future Work
Future efforts could optimize efficiency, explore alternative attention mechanisms, or compare against other ensembles to further validate its strengths.
8. Conclusions
In conclusion, this study introduces a semi-supervised adaptive ensemble model that effectively addresses the challenge of limited labeled data in classification tasks. By combining the strengths of RandomForest, XGBoost, and an Attention-based Multi-Layer Perceptron, and utilizing only 50% of the available labeled data, the model achieves significant performance gains on the Pima Indian and Diabetes Diagnosis datasets, outperforming several baseline models in terms of AUC, F1 Score, and Accuracy. The incorporation of a sample-wise attention mechanism and an iterative pseudo-labeling strategy enhances the model’s ability to generalize across diverse data patterns with minimal labeled input. While the model demonstrates competitive performance on the BRFSS2015 dataset, further optimization may be required to fully leverage its capabilities in more complex data environments. Future work could focus on reducing computational complexity and exploring alternative attention mechanisms to enhance efficiency. Overall, the proposed model offers a robust and scalable solution for classification problems with scarce labeled data, with potential applications in domains such as medical diagnosis and fraud detection.
Author Contributions
: Md Shahadat Kabir: Writing – original draft, Writing – Review & editing, Resources, Methodology, Investigation, Formal analysis, Visualization, Conceptualization. Usman Gani Joy: Writing – Review & editing, Validation, Investigation, Formal analysis, Project administration. Tanvir Azhar: Validation.
Funding
This research received no funding from any public, commercial or not-for-profit organizations.
Data Availability Statement
The dataset used in this study has been cited within the paper.
Conflicts of Interest
The authors declare that they have no known competing financial interests or personal relationships that could have appeared to influence the work reported in this paper.
References
- Alam, T.M.; Iqbal, M.A.; Ali, Y.; Wahab, A.; Ijaz, S.; Baig, T.I.; Hussain, A.; Malik, M.A.; Raza, M.M.; Ibrar, S.; et al. A model for early prediction of diabetes. Informatics in Medicine Unlocked 2019, 16, 100204. [Google Scholar] [CrossRef]
- Hasan, M.K.; Alam, M.A.; Das, D.; Hossain, E.; Hasan, M. Diabetes prediction using ensembling of different machine learning classifiers. IEEE Access 2020, 8, 76516–76531. [Google Scholar] [CrossRef]
- Morid, M.A.; Lau, M.; Del Fiol, G. Predictive analytics for step-up therapy: Supervised or semi-supervised learning? Journal of Biomedical Informatics 2021, 119, 103842. [Google Scholar] [CrossRef] [PubMed]
- Subramaniyan, S.; Regan, R.; Perumal, T.; Venkatachalam, K. Semi-supervised machine learning algorithm for predicting diabetes using big data analytics. Business Intelligence for Enterprise Internet of Things pp. 139–149, 2020. [Google Scholar]
- Chowdhury, M.M.; Ayon, R.S.; Hossain, M.S. An investigation of machine learning algorithms and data augmentation techniques for diabetes diagnosis using class imbalanced BRFSS dataset. Healthcare Analytics 2024, 5, 100297. [Google Scholar] [CrossRef]
- Tasin, I.; Nabil, T.U.; Islam, S.; Khan, R. Diabetes prediction using machine learning and explainable AI techniques. Healthcare technology letters 2023, 10, 1–10. [Google Scholar] [CrossRef] [PubMed]
- Muhammad, L.; Algehyne, E.A.; Usman, S.S. Predictive supervised machine learning models for diabetes mellitus. SN Computer Science 2020, 1, 240. [Google Scholar] [CrossRef] [PubMed]
- Han, C.H.; Kim, M.; Kwak, J.T. Semi-supervised learning for an improved diagnosis of COVID-19 in CT images. PLoS One 2021, 16, e0249450. [Google Scholar] [CrossRef] [PubMed]
- Bekker, J.; Davis, J. Learning from positive and unlabeled data: A survey. Machine Learning 2020, 109, 719–760. [Google Scholar] [CrossRef]
- Li, Y.; Yin, J.; Chen, L. Informative pseudo-labeling for graph neural networks with few labels. Data Mining and Knowledge Discovery 2023, 37, 228–254. [Google Scholar] [CrossRef]
- Wu, H.; Levinson, D. The ensemble approach to forecasting: A review and synthesis. Transportation Research Part C: Emerging Technologies 2021, 132, 103357. [Google Scholar] [CrossRef]
- Kangra, K.; Singh, J. Comparative analysis of predictive machine learning algorithms for diabetes mellitus. Bulletin of Electrical Engineering and Informatics 2023, 12, 1728–1737. [Google Scholar] [CrossRef]
- Centers for Disease Control and Prevention (CDC). Behavioral Risk Factor Surveillance System (BRFSS) 2015, 2015. Accessed: 2024-09-13.
- Le, T.M.; Vo, T.M.; Pham, T.N.; Dao, S.V.T. A novel wrapper–based feature selection for early diabetes prediction enhanced with a metaheuristic. IEEE access 2020, 9, 7869–7884. [Google Scholar] [CrossRef]
- National Institute of Diabetes and Digestive and Kidney Diseases. Pima Indian Diabetes Dataset, 2024. Accessed: 2024-03-19.
- Mohammed, A.J.; Muhammed Hassan, M.; Hussein Kadir, D. Improving classification performance for a novel imbalanced medical dataset using SMOTE method. International Journal of Advanced Trends in Computer Science and Engineering 2020, 9, 3161–3172. [Google Scholar] [CrossRef]
- Shahadat Kabir. Diabetes Diagnosis Dataset, 2024. Accessed: 2024-03-19.
- Li, S.; Zhang, X. Research on orthopedic auxiliary classification and prediction model based on XGBoost algorithm. Neural Computing and Applications 2020, 32, 1971–1979. [Google Scholar] [CrossRef]
- Hicks, S.A.; Strümke, I.; Thambawita, V.; Hammou, M.; Riegler, M.A.; Halvorsen, P.; Parasa, S. On evaluation metrics for medical applications of artificial intelligence. Scientific reports 2022, 12, 5979. [Google Scholar] [CrossRef] [PubMed]
Figure 1.
Overall pipeline of the proposed semi-supervised adaptive ensemble model, showing the flow from data preparation through training, weight optimization, pseudo-labeling, and final prediction.
Figure 1.
Overall pipeline of the proposed semi-supervised adaptive ensemble model, showing the flow from data preparation through training, weight optimization, pseudo-labeling, and final prediction.
Table 1.
Snapshot of the Diabetes Dataset (First few rows and columns).
| Pregnancies | Glucose | BloodPressure | Insulin | BMI | DiabetesPedigreeFunction | Age | Outcome |
|---|---|---|---|---|---|---|---|
| 6 | 148 | 72 | 0 | 33.6 | 0.627 | 50 | 1 |
| 1 | 85 | 66 | 0 | 26.6 | 0.351 | 31 | 0 |
| 8 | 183 | 64 | 0 | 23.3 | 0.672 | 32 | 1 |
| 1 | 89 | 66 | 94 | 28.1 | 0.167 | 21 | 0 |
| 0 | 137 | 40 | 168 | 43.1 | 2.288 | 33 | 1 |
Table 3.
Performance of the proposed ensemble and baselines across datasets. Best results per metric are bolded.
Table 3.
Performance of the proposed ensemble and baselines across datasets. Best results per metric are bolded.
| Dataset | Model | AUC | F1 | Acc. | TPR | FPR |
|---|---|---|---|---|---|---|
| Pima Indian | Ensemble | 0.8516 | 0.7783 | 0.7750 | 0.7900 | 0.2400 |
| LSTM | 0.7282 | 0.7230 | 0.7050 | 0.7700 | 0.3600 | |
| GRU | 0.7333 | 0.6965 | 0.6950 | 0.7000 | 0.3100 | |
| Attention | 0.7249 | 0.7215 | 0.6950 | 0.7900 | 0.4000 | |
| LSTM+Attn | 0.7255 | 0.7150 | 0.7050 | 0.7400 | 0.3300 | |
| BiLSTM | 0.7583 | 0.7424 | 0.7050 | 0.8500 | 0.4400 | |
| Diabetes Diag. | Ensemble | 0.9992 | 0.9895 | 0.9896 | 0.9832 | 0.0040 |
| LSTM | 0.9985 | 0.9789 | 0.9792 | 0.9640 | 0.0056 | |
| GRU | 0.9988 | 0.9805 | 0.9804 | 0.9824 | 0.0216 | |
| Attention | 0.9958 | 0.9688 | 0.9692 | 0.9552 | 0.0168 | |
| LSTM+Attn | 0.9992 | 0.9838 | 0.9840 | 0.9728 | 0.0048 | |
| BiLSTM | 0.9923 | 0.9582 | 0.9584 | 0.9536 | 0.0367 | |
| BRFSS2015 | Ensemble | 0.8177 | 0.7537 | 0.7449 | 0.7810 | 0.2913 |
| LSTM | 0.8193 | 0.7586 | 0.7420 | 0.8105 | 0.3264 | |
| GRU | 0.8193 | 0.7597 | 0.7464 | 0.8021 | 0.3094 | |
| Attention | 0.8213 | 0.7556 | 0.7452 | 0.7880 | 0.2976 | |
| LSTM+Attn | 0.8175 | 0.7525 | 0.7430 | 0.7815 | 0.2954 | |
| BiLSTM | 0.8166 | 0.7575 | 0.7416 | 0.8073 | 0.3240 |
Disclaimer/Publisher’s Note: The statements, opinions and data contained in all publications are solely those of the individual author(s) and contributor(s) and not of MDPI and/or the editor(s). MDPI and/or the editor(s) disclaim responsibility for any injury to people or property resulting from any ideas, methods, instructions or products referred to in the content. |
© 2025 by the authors. Licensee MDPI, Basel, Switzerland. This article is an open access article distributed under the terms and conditions of the Creative Commons Attribution (CC BY) license (http://creativecommons.org/licenses/by/4.0/).
Copyright: This open access article is published under a Creative Commons CC BY 4.0 license, which permit the free download, distribution, and reuse, provided that the author and preprint are cited in any reuse.


