
Submitted:
18 November 2025
Posted:
19 November 2025
You are already at the latest version
Abstract
Objectives: The mobile phone has become an inseparable part of everyday life, and are equipped with a variety of sensors that make it possible to monitor different aspects of human activity, including physical exercise. The aim of this study was to verify whether acceleration recorded by a mobile phone can reliably reflect the intensity of strength exercises. Methods: 40 participants with different levels of physical perfor-mance were involved in the experiment. Each subject completed 30 repetitions of the clean and jerk exercise, performed at regular intervals over the course of 11 minutes with a barbell weighing 30 kg. A mobile phone equipped with the PHYPHOX application was attached to the right forearm to record acceleration values. From each repeti-tion, both the average and maximum acceleration were evaluated. As a control pa-rameter, the barbell velocity was measured using the Tendo Power Analyzer. Results: The results showed that the mean acceleration during the exercise was 4.80 ± 0.95 m·s⁻², while the maximum acceleration reached 33.71 ± 15.19 m·s⁻². The average power output was 419.00 ± 67.34 W, and the maximum power achieved 913.81 ± 259.44 W. The mean execution velocity was 1.42 ± 0.23 m·s⁻¹, with a maximum velocity of 2.16 ± 0.38 m·s⁻¹. Data analysis revealed a significant correlation between both average and maximum acceleration and average and maximum velocity (r > 0.65, p < 0.01). Conclusions: These findings suggest that a mobile phone can serve as a practical and reliable tool for assessing the intensity of strength exercises. However, due to the small number of participants, further research on a larger sample is recommended to verify the generalizability of the results and potentially extend the application of this method to other types of physical activities.
Keywords:
muscular strength
; endurance training
; muscular power
; mobile phone
; strength exercise intensity
1. Introduction
Modern smartphones have become accessible, versatile, and technically advanced tools that extend far beyond communication. Their embedded sensors, particularly accelerometers, measure changes in acceleration across multiple axes and provide data suitable for evaluating both the quantity and intensity of human movement [23,31].
Early studies in this field primarily focused on distinguishing basic daily activities such as walking, running, or sitting [3,20]. Accelerometers proved to be reliable instruments for differentiating between low, moderate, and high intensity of physical activity, with these categories often validated against reference physiological parameters, such as oxygen consumption and energy expenditure [16,26]. Subsequently, research evolved toward the recognition of more complex movement patterns. The field of human activity recognition (HAR) began to employ advanced algorithms and machine learning methods, enabling more accurate classification of activities even in free-living environments [7,25,40].
Building on these foundations, increasing attention has been directed toward strength training. Chang, Chen, and Canny [8] demonstrated that sensors could effectively monitor free-weight exercises. Later studies confirmed that smartphones are capable of detecting repetitions in resistance training [27], and wearable devices have been shown to classify both exercise type and intensity with high accuracy [28]. Similar evidence supports the use of accelerometers to assess repetition tempo and quality, further underscoring their applicability in strength exercise monitoring [29,32].
Beyond sports performance, accelerometer-based systems have found broad application in medicine and rehabilitation. They are used to monitor patients with mobility impairments, support balance training, and provide long-term assessment in home-care settings [22]. Recently, novel approaches such as “smart clothing” have emerged, integrating accelerometers with additional sensors to deliver comprehensive, real-time movement monitoring [23].
From a practical standpoint, most commercial mobile applications remain limited to basic functionalities, including step counting or interval timers [11]. Only a smaller number focus on performance-oriented metrics, such as velocity and power output. Nevertheless, some applications already utilize accelerometer data to evaluate resistance exercise or vertical jumping performance, highlighting their potential for strength-oriented training contexts [2,14,27].
Methodological considerations are critical in this context. The validity and reliability of measurement vary depending on the device, its placement, and the algorithms employed. Linear encoders and optical motion capture systems are still regarded as the “gold standard” for measuring velocity and performance in strength training. Yet smartphones and consumer wearables represent an attractive alternative, offering cost-effectiveness, portability, and accessibility to a wide population of athletes and recreational users [13].
More recently, the discussion has shifted toward the accuracy of smartphone applications designed for velocity-based training (VBT). Applications that analyze barbell displacement from video recordings have been widely investigated. For example, the iPhone app MyLift demonstrated high concurrent validity and reliability against a linear transducer in the bench press, albeit with small systematic biases [4]. Further validation confirmed that while MyLift cannot directly compute mean propulsive velocity (MPV), mean velocity at moderate-to-high loads approximates MPV sufficiently for practical monitoring [4]. Comparative studies revealed that while applications such as Qwik VBT, Metric VBT, and MyLift generally show acceptable accuracy, Qwik VBT is consistently more reliable, whereas Metric and MyLift tend to produce higher error rates and more frequent missed repetitions [30].
In contrast, accelerometer-based approaches integrate inertial measurement directly from embedded sensors. Achermann et al. [1] and Barrajon & San Juan [5] validated the Apple Watch and smartphone for velocity monitoring during squats and bench-press, comparing it to a gold-standard motion capture system and linear transducer. Their results showed very high validity, particularly when the device was mounted on the barbell, with slightly lower but still strong accuracy when worn on the wrist. These findings indicate that consumer-grade accelerometer-based devices can provide precise and practical monitoring solutions for VBT, provided sensor placement is carefully considered.
Taken together, existing literature highlights the strong potential of smartphones and wearables as practical tools for monitoring movement intensity in both health and performance contexts. However, given the variability in accuracy across devices, placement, and exercise types, further validation against gold-standard systems and larger, more diverse study samples remain necessary. Addressing this gap forms the basis of the present study, which aims to evaluate whether acceleration recorded by a smartphone can serve as a valid indicator of strength exercise intensity.
Based on this rationale, we hypothesize that acceleration data obtained from a mobile phone will reliably reflect the reference barbell velocity measured using the Tendo Power Analyzer, thereby supporting its potential as an accessible and cost-effective alternative for monitoring strength training performance.
2. Materials and Methods
We conducted a preliminary validation study aimed at determining whether acceleration recorded by a smartphone can serve as a valid indicator of the intensity of a multi-joint strength exercise. The methodology involved comparing acceleration-derived metrics obtained from a mobile device with velocity parameters measured by a linear transducer during a unstandardized clean and jerk protocol. In structuring the study, particular emphasis was placed on methodological simplicity, ensuring that the data could be used in their raw form as directly exported from the mobile application, thereby minimizing the need for additional processing or specialized software.
2.1. Test Subjects
A purposive sampling strategy was used to recruit 40 male participants with a broad range of physical performance levels. All individuals had previous experience with resistance training and were familiar with the experimental protocol, which served as a key inclusion requirement. The sample included participants with diverse athletic backgrounds, ranging from competitive athletes to recreationally active individuals. Some participants were actively involved in organized sports such as athletics, football, volleyball, or combat sports, while others engaged in regular non-competitive training aimed at maintaining general fitness. This heterogeneous composition ensured representation across high-, moderate-, and lower-performance categories, providing sufficient variability for examining whether smartphone-derived acceleration data can reliably capture inter-individual differences in physical performance when compared with reference velocity measurements. The inclusion of participants with different sporting histories and training intensities allowed for a more ecologically valid assessment of the practical applicability of the measurement approach.
The assessment of motor abilities was carried out in accordance with international standards and included the countermovement vertical jump [24], back squat, and bench press [19] (Table 1).
None of the participants reported any current orthopedic or neurological disorders that could affect performance or safety. All participants were fully informed about the study procedures, potential risks, and anticipated benefits. They voluntarily agreed to participate and provided written informed consent prior to data collection, in accordance with the ethical standards outlined in the Declaration of Helsinki and approved by the Ethics Committee of the Vasile Alecsandri University of Bacau.
2.2. Procedures
Clean and Jerk Protocol was designed to match the timing of a boxing match: 3 rounds of 3 minutes, separated by 1-minute breaks. During each round, participants performed 10 clean and jerk repetitions, paced by an auditory signal every 20 seconds, for a total of 30 repetitions. The test subjects were instructed to maintain the resting phase without a significant activity between the repetitions. Each repetition consisted of two continuous phases. In the clean, the barbell was lifted from the floor to the shoulders in one motion, kept close to the body, and stabilized on the clavicles or chest. Immediately, without pause, the jerk was executed: from the front rack position, participants explosively extended their legs and arms to drive the bar overhead in a single movement, using either a split or power jerk. The lift was completed with full extension of the arms and legs, feet in line, after which the barbell was lowered under control to the platform. Unlike competition, no referee signals or pauses were required [19] (Figure 1).
We used a mobile phone, which can capture the measurement data using its sensors, including the built-in accelerometer, to measure the activity during the short-interval exercise. The acceleration values were collected using the PHYPHOX mobile app with the mobile phone (iPhone SE with a recording frequency of 100 Hz) in a case attached to the subject's right forearm (Figure 1). The PHYPHOX app recorded the accelerations along the x, y and z axis and the total magnitude of acceleration √(x^2+y^2+z^2 ) in ms-2 with the relevant time stamps. The values were recorded without the gravity G component and when the mobile device was motionless, the acceleration values had a zero value in all positions. The measurement data were exported in the csv format to Microsoft Excel (phyphox.org).
The intensity of each repetition was measured and recorded using a linear displacement transducer (Tendo Power Analyzer), which has been demonstrated to be a reliable tool for power measurement [12,34]. The device was attached to the barbell using a nylon cord, allowing real-time measurement. The Tendo Power Analyzer was connected to the computer with compatible software, providing immediate feedback on barbell velocity (m/s) and power (W).
2.3. Data Processing
In our research, we worked with the values of total acceleration magnitude (m). The phyphox mobile app recorded around 66000 readings during the load phase. One Clean/jerk exercise was represented by approximately 600 to 700 acceleration values depending on the execution speed. When processing the data from the accelerometer, we extracted the values for each Clean/jerk separately in MS Excel. When filtering the values representing the Clean/jerk, we used the moving average smoothing method with manual control. To eliminate the unwanted external factors, an average of 11 values (5 before and 5 after the given value) was used instead of the given value, and the data were smoothed 9 times with this method (Figure 2). The beginning of the exercise was identified by the smoothed acceleration value exceeding the limit of 1.5 and not falling below this limit for the next 200 values. The end of the exercise was identified in a similar way: the acceleration value had to exceed the threshold of 3 and not fall below this threshold for the next 200 values [36,37]. We calculated the average and maximum from the real values, which representing Clean/jerk. This way, we obtained 30/30 values total. The results included the average and maximum values of the Clean/jerk during the protocol (avacc, maxacc).
The Tendo Power Analyzer provided values of mean and peak velocity during the concentric phase of the exercise, from which mean and peak power outputs were calculated. The device recorded one value for the clean and one value for the jerk. These two values were then averaged to obtain a single result per repetition, yielding a total of 30/30 data points for each participant. For the statistical analysis, the outcome variables included the mean values obtained across the entire testing protocol: average velocity (avvel), peak velocity (maxvel), average power (avper), and peak power (maxper).
2.4. Data Analysis
The data are reported as mean (standard deviation), minimum-maximum. The Shapiro-Wilk test for normality was carried out on all variables. To determine differences between participants, a one-way ANOVA was applied. Partial eta squared η² was calculated as a measure of effect size to assess the magnitude of between-subjects differences [9]. The Pearson's correlation (r) was used to determine the relationships between the variables of individual tests. The magnitude of correlation coefficients was analyzed according to Hopkins et al. (17) as small (0.1 to 0.29), moderate (0.3 to 0.49), large (0.5 to 0.69), very large (0.7 to 0.89), and extremely large (0.9 to 1). A linear regression analysis was performed to estimate barbell velocity from smartphone-recorded acceleration data. Agreement between smartphone-derived velocity estimates and reference velocity values obtained from the Tendo Power Analyzer was further examined using ICC correlation and Bland–Altman plots, providing a graphical assessment of systematic bias and limits of agreement. The significance level was at p < 0.05 and p < 0.01. The statistical analyses were performed in MS Excel 2016 and JASP 0.16.4.0.
3. Results
All data met the assumptions of normality, as confirmed by the Shapiro–Wilk test conducted for each variable. This indicated that the distribution of values was appropriate for the application of parametric statistical methods.
Table 2 provides a summary of the main performance parameters across forty participants. Substantial inter-individual variability was evident in all measured variables, reflecting the broad range of fitness and performance levels represented in the sample. The highest-performing individuals achieved notably elevated values in acceleration-, power-, and velocity-related measures, consistent with advanced or competitive athletic capability. In contrast, participants at the lower end of the performance spectrum demonstrated markedly reduced outputs, indicating lower strength, power, and movement efficiency.
The majority of participants fell within intermediate performance levels, showing moderate values that corresponded to their recreational training background and maintained physical fitness. This distribution created a diverse performance profile within the sample, enabling meaningful comparisons and supporting the evaluation of whether smartphone-derived acceleration data can accurately differentiate between smaller and larger inter-individual performance differences when compared with reference velocity measurements.
A one-way ANOVA confirmed statistically significant differences among participants for all measured parameters (p < .01, η² = .83–.98), indicating substantial variability in acceleration, power, and velocity values. These findings emphasize the sensitivity of the applied measurement protocol in capturing both high and low levels of physical performance.
Figure 3 summarizes the Pearson’s correlation coefficients among all kinematic and kinetic variables. All correlations were statistically significant (p < .001).
A strong positive correlation was found between average acceleration and maximum acceleration (r = 0.609), indicating that individuals who produced higher average accelerations also achieved higher peak values. Similarly, both average and maximum power were strongly correlated with acceleration and velocity parameters (r = 0.55–0.77), demonstrating the interdependence between force application and movement speed.
The strongest associations were observed among the velocity- and power-related variables. Average and maximum velocity showed an almost perfect correlation (r = 0.983), as did average and maximum power (r = 0.960), confirming the internal consistency of the measured constructs. Likewise, average velocity and average power were nearly identical in their variation (r = 0.998), indicating that both measures reflect similar aspects of performance output.
A multiple linear regression was conducted to examine the extent to which average acceleration (avacc) and maximum acceleration (maxacc) predict average velocity (avvel). The analysis revealed a statistically significant model, F(2, 1197) = 208.79, p < .001, indicating that the two predictors together accounted for approximately 59% of the variance in average velocity (R² = 0.586). The root mean square error (RMSE = 0.147) suggested a strong agreement between observed and predicted values, confirming good model precision.
Both predictors contributed significantly to the model, with positive relationships to average velocity. Specifically, higher levels of both average and peak acceleration were associated with faster barbell movement during execution. The confidence intervals for both predictors were narrow (avacc: 0.046–0.091; maxacc: 0.007–0.010), further confirming the stability and reliability of the estimates.
These results demonstrate that acceleration-related parameters are strong determinants of movement velocity, and their combined effect explains a substantial proportion of performance variability. This finding highlights the potential of acceleration-based indicators—particularly those derived from smartphone measurements—for estimating velocity-related outcomes in resistance exercise tasks with good predictive accuracy.

Table 3.
Linear regression results for average velocity.
| R | R² | RMSE | B | 95% CI | SE | p | ||
| LL | UL | |||||||
| 0.764 | 0.586 | 0.147 | ||||||
| (Intercept) | 0.811 | 0.724 | 0.899 | 0.013 | < .01 | |||
| avacc | 0.069 | 0.046 | 0.091 | 0.045 | < .01 | |||
| maxacc | 0.008 | 0.007 | 0.010 | 7.032×10⁻⁴ | < .01 | |||
Note. R = Pearson’s correlation coefficient; R² = coefficient of determination; B = unstandardized regression coefficient; 95% CI = 95% confidence interval (LL = lower limit, UL = upper limit); SE = standard error; p = significance level.
Reliability between the two measurement methods was further evaluated using the intraclass correlation coefficient (ICC1,1). The average velocity measured with the Tendo unit (M = 1.420 m·s⁻¹, SD = 0.227, range: 0.850–2.050 m·s⁻¹) closely corresponded to the estimated velocity derived from the regression model (M = 1.412 m·s⁻¹, SD = 0.170, range: 1.054–1.951 m·s⁻¹). The analysis yielded an ICC of 0.734, with a 95% confidence interval ranging from 0.677 to 0.782, indicating moderate to good absolute agreement between the methods. This level of reliability supports the consistency of the measurements, although some degree of method-specific variability remains detectable.
In addition the Bland–Altman analysis demonstrated a mean bias of 0.07 m·s⁻¹ between the smartphone-based and reference measurements, indicating minimal systematic difference. The 95% limits of agreement ranged from –0.30 to +0.32 m·s⁻¹, within which approximately 95% of all observations were contained. The data points were symmetrically distributed around the zero line, confirming the absence of a consistent proportional bias. A slight increase in variability was observed at higher mean velocities (above 1.6 m·s⁻¹), suggesting marginally greater dispersion at faster movement speeds. Nevertheless, the overall spread of differences remained small relative to the measured range of velocities (0.8–2.0 m·s⁻¹).
These findings indicate a high level of agreement between the two methods, with negligible bias and acceptable random error (Figure 4).
4. Discussion
The primary aim of this study was to compare acceleration data recorded by a smartphone with velocity values obtained from the Tendo Power Analyzer during the execution of a clustered clean and jerk protocol. The findings confirmed strong associations between the two modalities, suggesting that smartphone-based acceleration metrics can serve as valid proxies for external-load parameters traditionally measured by laboratory-grade systems. This outcome aligns with and extends the growing body of literature focused on the use of consumer technologies for monitoring strength training intensity.
From the perspective of research design, we deliberately aimed to employ a protocol that was as simple and practical as possible. The selected clean and jerk cluster protocol is frequently used in the regular training routines of the study participants, ensuring a natural execution environment and minimizing unfamiliarity. The smartphone was chosen as the measuring device because it is widely accessible, unlike specialized accelerometers or smartwatches, which are not always available to the general population. The mobile application used is free and allows for straightforward data export in a suitable format. The decision to attach the smartphone to the forearm was based on prior testing, which showed that this placement most closely mirrors barbell movement without requiring any additional equipment or setup. In previous experiments, we also tested placement under the deltoid, on the back using a chest strap, and at the waist; however, these locations introduced greater discrepancies in range of motion within this specific movement pattern. We deliberately chose not to attach the smartphone directly to the barbell, as this was considered impractical for potential use in regular training settings and among general users. In this study, mean propulsive velocity (MPV) was not measured because it could not be directly assessed with the available equipment. The Tendo Weightlifting Analyzer provides only mean and peak concentric velocity, not MPV. However, Lorenzetti et al. [21] reported a very high correlation (0.93–0.98) between Tendo-derived velocities and MPV measured by the T-Force system, indicating that Tendo reliably reflects propulsive performance despite not capturing MPV directly. Furthermore, no data filtering or signal processing techniques were applied; all acceleration values were processed directly in Microsoft Excel exactly as exported from the application. This approach ensured full transparency and reflects the realistic conditions under which general users would analyze their own training data. Finally, the sample composition—including athletes across a broad range of performance levels—was intentionally selected to assess whether smartphone-derived acceleration data can capture both large and small inter-individual performance differences. This aligns with our overall aim of developing accessible, scalable, and practically relevant monitoring methods.
Early work in this domain was pioneered by Pernek, Hummel, and Kokol [27], who demonstrated that smartphone sensors could reliably detect repetitions in resistance training exercises. Their subsequent study further advanced this concept by showing that wearable sensors are capable of distinguishing exercise intensity levels [28]. A different methodological pathway emerged through the use of video-based analysis. Balsalobre-Fernández et al. [4] validated smartphone applications that calculate barbell velocity from video recordings, and more recent evidence by Renner, Mitter, and Baca [30] confirmed the concurrent validity of such apps in powerlifting contexts, although small biases and occasional detection errors were observed.
Later research returned to inertial-based methods, focusing on smartphones used as accelerometers. Barrajón and San Juan [5] demonstrated that a smartphone accelerometer, when attached directly to the barbell, could provide valid and reliable lift velocity data during the bench press, although reported correlations with criterion measures were only moderate (around r ≈ 0.50). Building on this, Achermann et al. [1] showed that even commercially available smartwatches, such as the Apple Watch, can yield highly accurate velocity measures during squats, with very strong correlations exceeding r = 0.90, particularly when mounted directly to the barbell. Compared with these studies, our findings fall in between: correlations between smartphone-derived acceleration and Tendo Power Analyzer velocity ranged from r = 0.55 to 0.77. These results were further supported by regression analysis, which demonstrated a strong predictive relationship between acceleration and velocity, and by Bland–Altman analysis, which confirmed a high level of agreement and minimal bias between the two measurement methods. This pattern confirms that low-cost inertial sensors can serve as practical monitoring tools, while our choice of forearm placement provided a balance between data quality and usability.
Beyond validation, the question of data acquisition and processing deserves attention. In our study, the smartphone was affixed to the forearm, and data were processed with a custom Excel-based algorithm that identified repetitions, computed averages, and derived a linear fatigue index. This simple approach preserved field practicality, as the data were used directly after export from the mobile application with minimal preprocessing. Nevertheless, alternative devices such as smartwatches or dedicated IMUs (e.g., Movesense) may provide more user-friendly solutions. In parallel, more advanced Human Activity Recognition (HAR) methods offer powerful options for repetition detection and intensity classification. Prior studies have demonstrated effective HAR pipelines using both feature-based and deep learning approaches [15,20,25,39,40]. These studies focused solely on activity recognition and did not further process the collected data. In contrast, our simple Excel-based algorithm not only allowed us to accurately identify exercises such as burpees or clean and jerk, but also to generate meaningful results from raw data, that can be applied for practical training feedback, performance monitoring, or simply as an accessible way to track exercise intensity and volume. Integrating these approaches could further enhance accuracy, improve robustness to sensor orientation, and enable automatic generalization across exercise types.
From an exercise and protocol perspective, the choice of the clean and jerk was deliberate. Olympic lifts are recognized as among the most effective training means to develop maximal strength and rate of force development, with significant transfer to athletic performance [10,33]. In addition, the clean and jerk is one of the most comprehensive lifts in terms of range of motion, sequencing, and coordination. The clustered set structure used in this study reflects concepts discussed by Tufano, Brown, and Haff [38], who emphasized that cluster sets offer both theoretical and practical advantages for balancing force and velocity demands. Moreover, embedding this structure into a HIIT framework aligns with recommendations from Buchheit and Laursen [6], and parallels recent case applications in boxing-specific conditioning [18]. Our earlier work using the clean only, as well as methodological developments for strength–endurance assessment [35] and functional HIIT programs [36], further support the utility of this approach.
Taken together, these results reinforce that the clustered clean and jerk protocol is both ecologically valid and versatile: it provides a diagnostic lens into performance and fatigue while simultaneously serving as a meaningful training stimulus for explosive strength and strength–endurance.
Limitations of the Study
This study has several limitations. The sample size was small, which limits the generalizability of the findings and warrants further research involving a larger and more diverse group of participants to confirm these results. The placement of the smartphone sensor on the forearm, although practical, should be examined more systematically, as sensor location can significantly influence measurement accuracy. Future studies should include a detailed comparison of sensor placement strategies and their impact on data quality. In addition, it will be important to compare raw acceleration data with other commonly used devices such as the Apple Watch, Movesense sensors, or other IMUs to assess the relative accuracy and reliability of different technologies. Data processing in this study was intentionally minimal, relying on raw acceleration exported directly from the mobile application without extensive filtering or sensor fusion, which increases susceptibility to noise, placement variability, and orientation errors. The focus on a single exercise and load further narrows external validity. Finally, the custom Excel algorithm lacks the sophistication of modern HAR systems, which could provide more robust, adaptive, and automated solutions.
Practical Implications
Despite these limitations, the present findings have practical value. They show that a smartphone can provide meaningful information about exercise intensity, closely matching data from a validated external device. Coaches and practitioners can leverage such low-cost, accessible tools to monitor within-session fatigue and between-session progress without the logistical burden of laboratory systems. By prioritizing methodological simplicity and direct data export, this study illustrates a pathway toward integrating smartphone-based monitoring into real-world training environments.
5. Conclusions
In summary, the present findings support a pragmatic message: complex lifts such as the clean and jerk can be identified and quantified with encouraging accuracy using low-cost sensors, and a clustered protocol can simultaneously serve diagnostic and training functions consistent with HIIT principles and best practice in weightlifting. By prioritizing methodological simplicity, this study demonstrated that reliable insights can be obtained directly from data exported by a mobile application, minimizing preprocessing and maximizing field practicality. Future work should expand samples and exercises, standardize sensor placement, and adopt modern HAR methods and validated velocity tools to strengthen reliability and automate analysis. With these enhancements, a fully integrated field system—wearable sensor + HAR + analytics—can deliver robust monitoring of explosive strength and strength–endurance in weightlifting derivatives and combat-sport conditioning.
Author Contributions
Conceptualization, Ľ.Š.; methodology, Ľ.Š., G.B.; software, L.N.V.; validation, Ľ.Š., G.B., J.Z. and N.T.B.; formal analysis, Ľ.Š. and P.K.; investigation, Ľ.Š., D.Ž. and J.Z.; resources, Ľ.Š. and G.B.; data curation, J.Z., N.T.B. and S.I.P.; writing—original draft preparation, Ľ.Š.; writing—review and editing, G.B.; visualization, D.Ž. and L.N.V.; supervision, Ľ.Š. and G.B.; project administration, Ľ.Š.; funding acquisition, Ľ.Š. and G.B. All authors have read and agreed to the published version of the manuscript.
Funding
This research received no external funding.
Institutional Review Board Statement
This study was conducted in accordance with the Declaration of Helsinki, and approved by the Ethics Committee of the Vasile Alecsandri University of Bacau. (Approval Code: 25/2/19.09.2025, Approval Date: 19.09.2025).
Informed Consent Statement
All the subjects agreed to participate voluntarily and signed a written informed consent before data collection.
Data Availability Statement
The data presented in this study are available upon reasonable request from the corresponding author.
Acknowledgments
A great thank you to all the collaborators and volunteers for their availability and contribution to this study. A special thanks goes to the Vasile Alecsandri University of Bacau, Romania, for the support and assistance provided.
Conflicts of Interest
The authors declare no conflicts of interest. The funders had no role in the design of the study; in the collection, analyses, or interpretation of data; in the writing of the manuscript or in the decision to publish the results.
References
- Achermann, B., Oberhofer, K., Ferguson, S. J., & Lorenzetti, S. R. Velocity-based strength training: The validity and personal monitoring of barbell velocity with the Apple Watch. Sports, 2023, 11(7), 125. [CrossRef]
- Aksović, N.; Arsenijević, R.; Bubanj, S.; Utvić, N.; Lilić, L.; Stanković, V.; Bjelica, B.; Mareș, G.; Galeru, O.; Pavel, S.I.; et al. Enhancing Motor Abilities in Male Basketball Players Through Complex Training: A Systematic Review. Appl. Sci. 2025, 15, 3342. [Google Scholar] [CrossRef]
- Bao, L., & Intille, S. S. Activity recognition from user-annotated acceleration data. In Pervasive Computing (pp. 1–17). Springer. 2004. [CrossRef]
- Balsalobre-Fernández, C. , Marchante, D., Baz-Valle, E., Alonso-Molero, I., Jiménez, S. L., & Muñóz-López, M. Analysis of wearable and smartphone-based technologies for the measurement of barbell velocity in different resistance training exercises. Frontiers in Physiology, 2017, 8, 649. [Google Scholar] [CrossRef] [PubMed]
- Barrajon, J. P, & San Juan, A. F. Validity and reliability of a smartphone accelerometer for measuring lift velocity in bench-press exercises. Sustainability, 2020, 12(6), 2312.
- Buchheit, M., & Laursen, P. B. High-intensity interval training, solutions to the programming puzzle: Part I: cardiopulmonary emphasis. Sports medicine, 2013, 43(5), 313-338.
- Bulling, A., Blanke, U., & Schiele, B. A tutorial on human activity recognition using body-worn inertial sensors. ACM Computing Surveys, 2014, 46(3), 1–33. [CrossRef]
- Chang, K.-H., Chen, M. Y., & Canny, J. Tracking free-weight exercises. In UbiComp 2007: Ubiquitous Computing (pp. 19–37). Springer. [CrossRef]
- Cohen, J. (1988). Statistical Power Analysis for the Behavioral Sciences (2nd ed.). Routledge. [CrossRef]
- Comfort, P., Haff, G. G., Suchomel, T. J., Soriano, M. A., Pierce, K. C., Hornsby, W. G. & Stone, M. H. National Strength and Conditioning Association position statement on weightlifting for sports performance. The Journal of Strength & Conditioning Research, 2023, 37(6), 1163-1190.
- Elder, A., Guillen, G., Isip, R., Zepeda, R., & Lewis, Z. H. A deeper look into exercise intensity tracking through mobile applications: a brief report. Technologies, 2023, 11(3), 66.
- Garnacho-Castaño, M. V., López-Lastra, S., & Maté-Muñoz, J. L. Reliability and validity assessment of a linear position transducer. Journal of Sports Science and Medicine, 2015, 14(1), 128–136.
- Godfrey, A. , Hetherington, V., Shum, H., Bonato, P., Lovell, N. H., & Stuart, S. From A to Z: Wearable technology explained. Maturitas, 2017, 100, 26–30. [Google Scholar] [CrossRef]
- Harahap, M.F., Khamraeva, Z.B., Gorgan, C.M. Force Generation and Muscle Activation: A Literature Review of Lower Limb Mechanics in Softball Batting. INSPIREE: Indonesian Sport Innovation Review, 2025, 6(02), 87-97. [CrossRef]
- Heng, X., Wang, Z., & Wang, J. Human activity recognition based on transformed accelerometer data from a mobile phone. International Journal of Communication Systems, 2016, 29(13), 1981-1991.
- Hekler, E. B., Buman, M. P., Grieco, L., Rosenberger, M., Winter, S. J., Haskell, W., & King, A. C. Validation of physical activity tracking via android smartphones compared to ActiGraph accelerometer: laboratory-based and free-living validation studies. JMIR mHealth and uHealth, 2015, 3(2), e3505.
- Hopkins, W.G.; Marshall, S.W.; Batterham, A.M.; Hanin, J. Progressive statistics for studies in sports medicine and exercise science. Med. Sci. Sports Exerc. 2009, 41, 3–13. [Google Scholar] [CrossRef] [PubMed]
- Hubinák, A., Šiška, Ľ., & Krška, P. High intensity interval training for boxing: Case study. Journal of Sports Science and Nutrition, 2024, 5(1), 20–24. [CrossRef]
- International Powerlifting Federation. (n.d.). International Powerlifting Federation Technical Rules 2019. http://www.powerlifting-ipf.com/rules/technical-rules.html.
- Khalaf, H., & Riyadh, M. Human activity recognition using inertial sensors in a smartphone: Technical background. Al-Nahrain Journal of Science, 2024, 27(1), 108-120.
- Lorenzetti, S., Lamparter, T., & Lüthy, F. Validity and reliability of simple measurement device to assess the velocity of the barbell during squats. BMC research notes, 2017, 10(1), 707.
- Mannini, A., & Sabatini, A. M. Machine learning methods for classifying human physical activity from on-body accelerometers. Sensors, 2010, 10(2), 1154–1175. [CrossRef]
- Mathie, M. J., Coster, A. C. F., Lovell, N. H., & Celler, B. G. Accelerometry: Providing an integrated, practical method for long-term, ambulatory monitoring of human movement. Physiological Measurement, 2004, 25(2), R1–R20. [CrossRef]
- McMahon, J. J., Lake, J. P., & Suchomel, T. J. 2018. Vertical jump testing. In Performance assessment in strength and conditioning (pp. 96-116). Routledge.
- Middya, A. I., Kumar, S., & Roy, S. Activity recognition based on smartphone sensor data using shallow and deep learning techniques: A Comparative Study. Multimedia Tools and Applications, 2024, 83(3), 9033-9066.
- Mukaino, M., Ogasawara, T., Matsuura, H., Aoshima, Y., Suzuki, T., Yamaguchi, M., Nakashima, H., Saitoh, E., Tsukada, S., & Otaka, Y. Validity of trunk acceleration measurement with a chest-worn monitor for assessment of exercise intensity. Technologies, 2021, 11(66), 1–7. [CrossRef]
- Pernek, I., Hummel, K. A., & Kokol, P. Exercise repetition detection for resistance training based on smartphones. Personal and Ubiquitous Computing, 2013, 17(4), 771–782. [CrossRef]
- Pernek, I., Kurillo, G., Stiglic, G., & Bajcsy, R. Recognizing the intensity of strength training exercises with wearable sensors. Journal of Biomedical Informatics, 2015, 58, 145–155. [CrossRef]
- Preece, S. J., Goulermas, J. Y., Kenney, L. P. J., Howard, D., Meijer, K., & Crompton, R. Activity identification using body-mounted sensors—a review of classification techniques. Physiological Measurement, 2009, 30(4), R1–R33. [CrossRef]
- Renner, A., Mitter, B., & Baca, A. Concurrent validity of novel smartphone-based apps monitoring barbell velocity in powerlifting exercises. PLOS ONE, 2024, 19(11), e0313919. [CrossRef]
- Ravi, N., Dandekar, N., Mysore, P., & Littman, M. L. Activity recognition from accelerometer data. In Proceedings of the 17th Conference on Innovative Applications of Artificial Intelligence 2005 (IAAI’05) (pp. 1541–1546). AAAI Press.
- Rey-López, J. P., Lee, D. H., Ferrari, G., Giovannucci, E., & Rezende, L. F. Physical activity intensity measurement and health: state of the art and future directions for scientific research. International journal of environmental research and public health, 2023, 20(11), 6027.
- Rodríguez-Rosell, D., Yáñez-García, J. M., Mora-Custodio, R., Sánchez-Medina, L., Ribas-Serna, J., & González-Badillo, J.J. Effect of velocity loss during squat training on neuromuscular performance. Scandinavian Journal of Medicine & Science in Sports, 2021, 31(8), 1621-1635.
- Suchomel, T. J., Techmanski, B. S., Kissick, C. R., & Comfort, P. Reliability, validity, and comparison of barbell velocity measurement devices during the jump shrug and hang high pull. Journal of Functional Morphology and Kinesiology, 2023, 8(1), 35. [CrossRef]
- Šiška, Ľ., Šutka, V., & Kováčová, N. Development of strength-endurance with regard to Pmax in conditioning preparation in boxers. International Journal of Yoga, Physiotherapy and Physical Education, 2017, 2(6), 139–142.
- Šiška, Ľ., Hubinák, A., Krška, P., & Balint, G. Assessment of exercise intensity using the Phyphox mobile app. Journal of Physical Education & Sport, 2024, 24(8), 1840–1848. [CrossRef]
- Šiska, Ľ., Balint, G., Židek, D., Sedlacek, J., Tkacik, Š., & Balint, N. T. The relationship between the Burpee movement program and strength and endurance performance measures in active young adults: A Cross-Sectional analysis. Journal of Functional Morphology and Kinesiology, 2024, 9(4), 197. [CrossRef]
- Tufano, J. J., Brown, L. E., & Haff, G. G. Theoretical and practical aspects of different cluster set structures: a systematic review. The journal of strength & conditioning research, 2017, 31(3), 848-867. [CrossRef]
- Voicu, R. A., Dobre, C., Bajenaru, L., & Ciobanu, R. I. Human physical activity recognition using smartphone sensors. Sensors, 2019, 19(3), 458. [CrossRef]
- Wan, S., Qi, L., Xu, X., Tong, C., & Gu, Z. Deep learning models for real-time human activity recognition with smartphones. mobile networks and applications, 2020, 25(2), 743-755.
Figure 1.
Course of one repetition of Clean/jerk exercise.
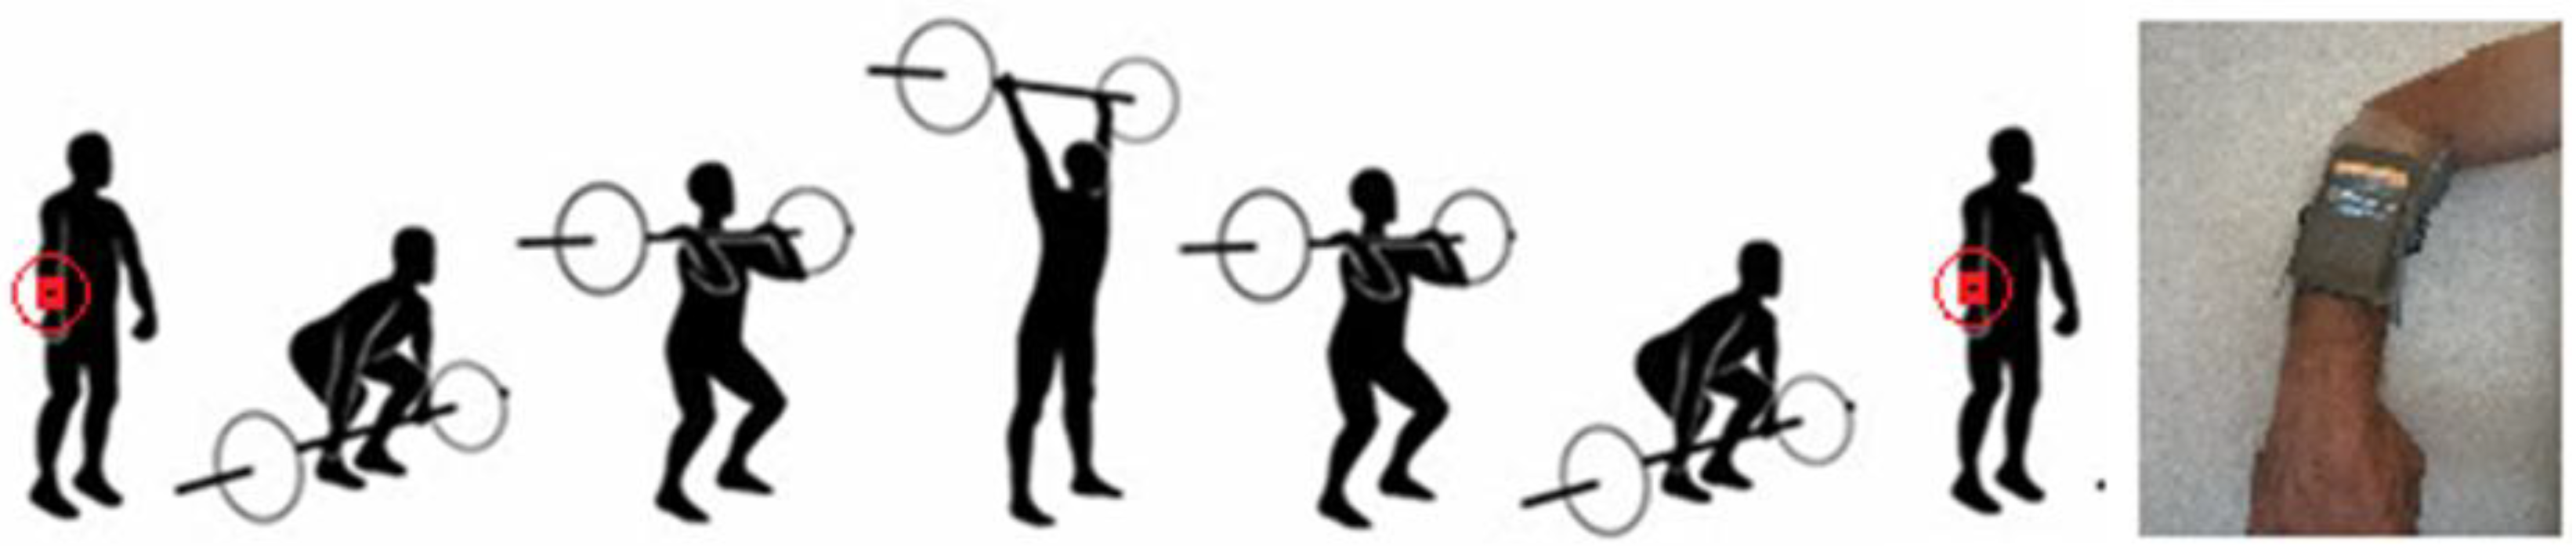
Figure 2.
Course of real and smoothing acceleration.
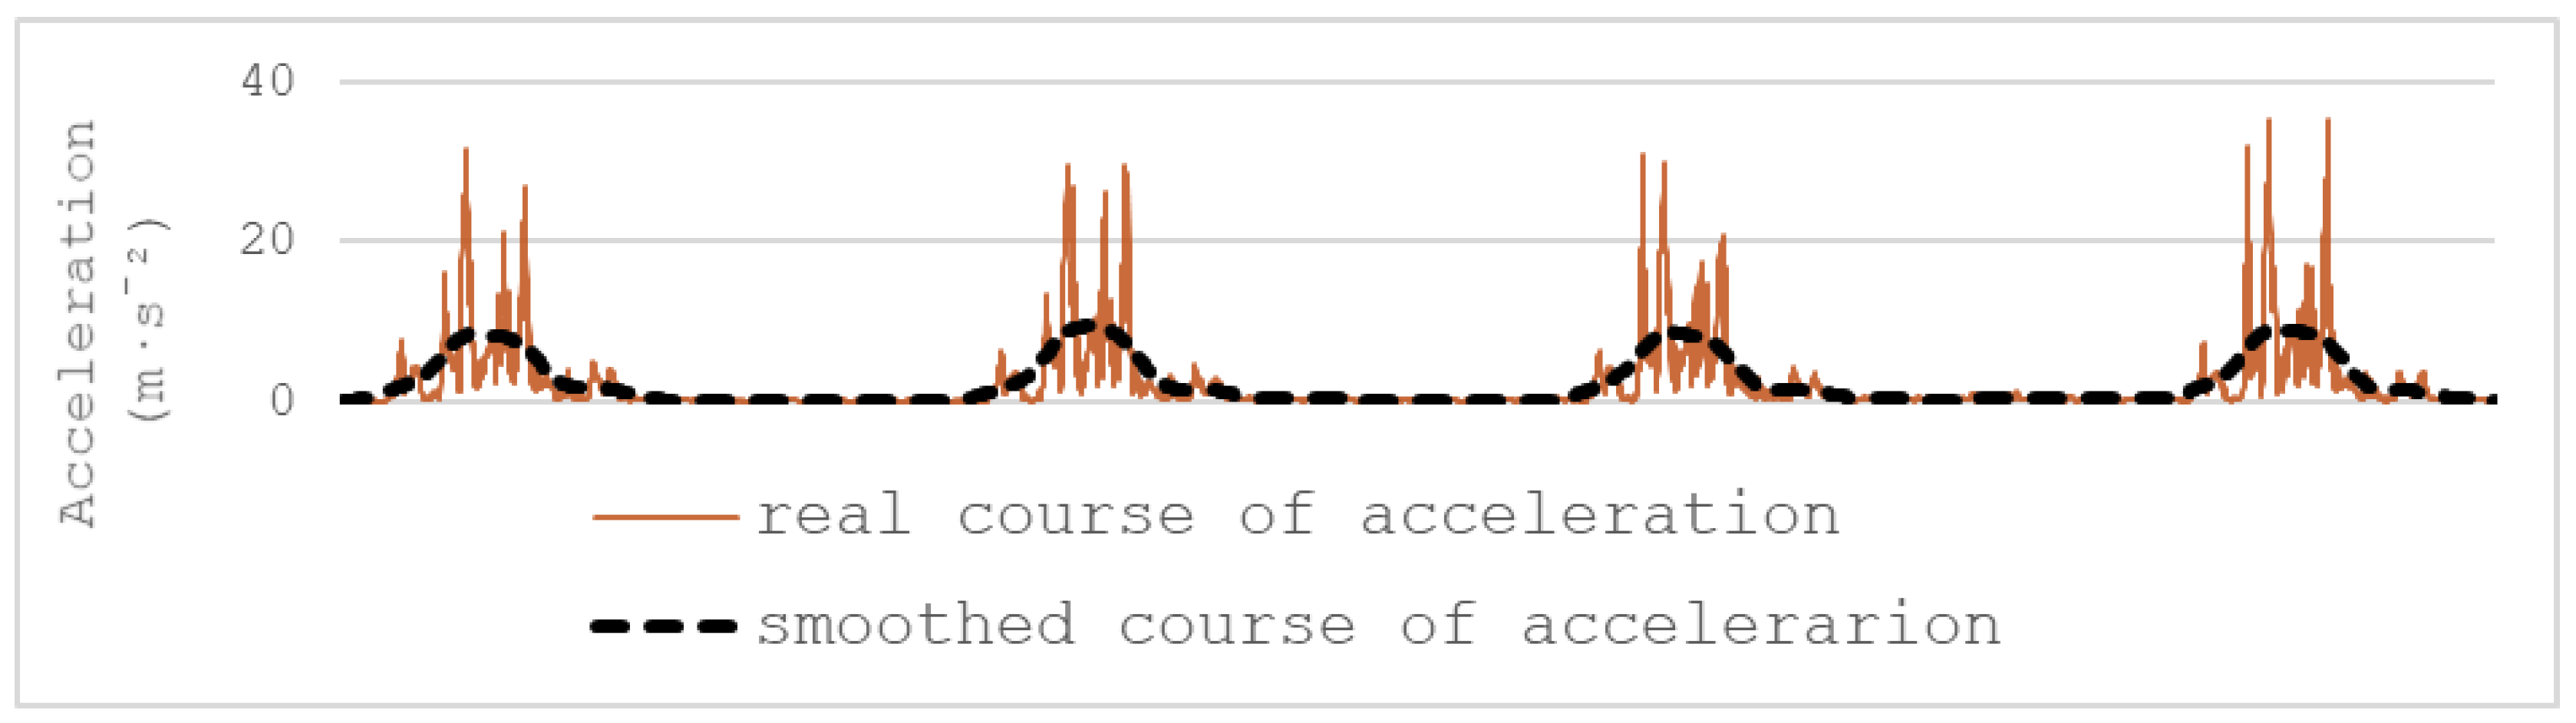
Figure 3.
Correlation matrix of observed parameters.
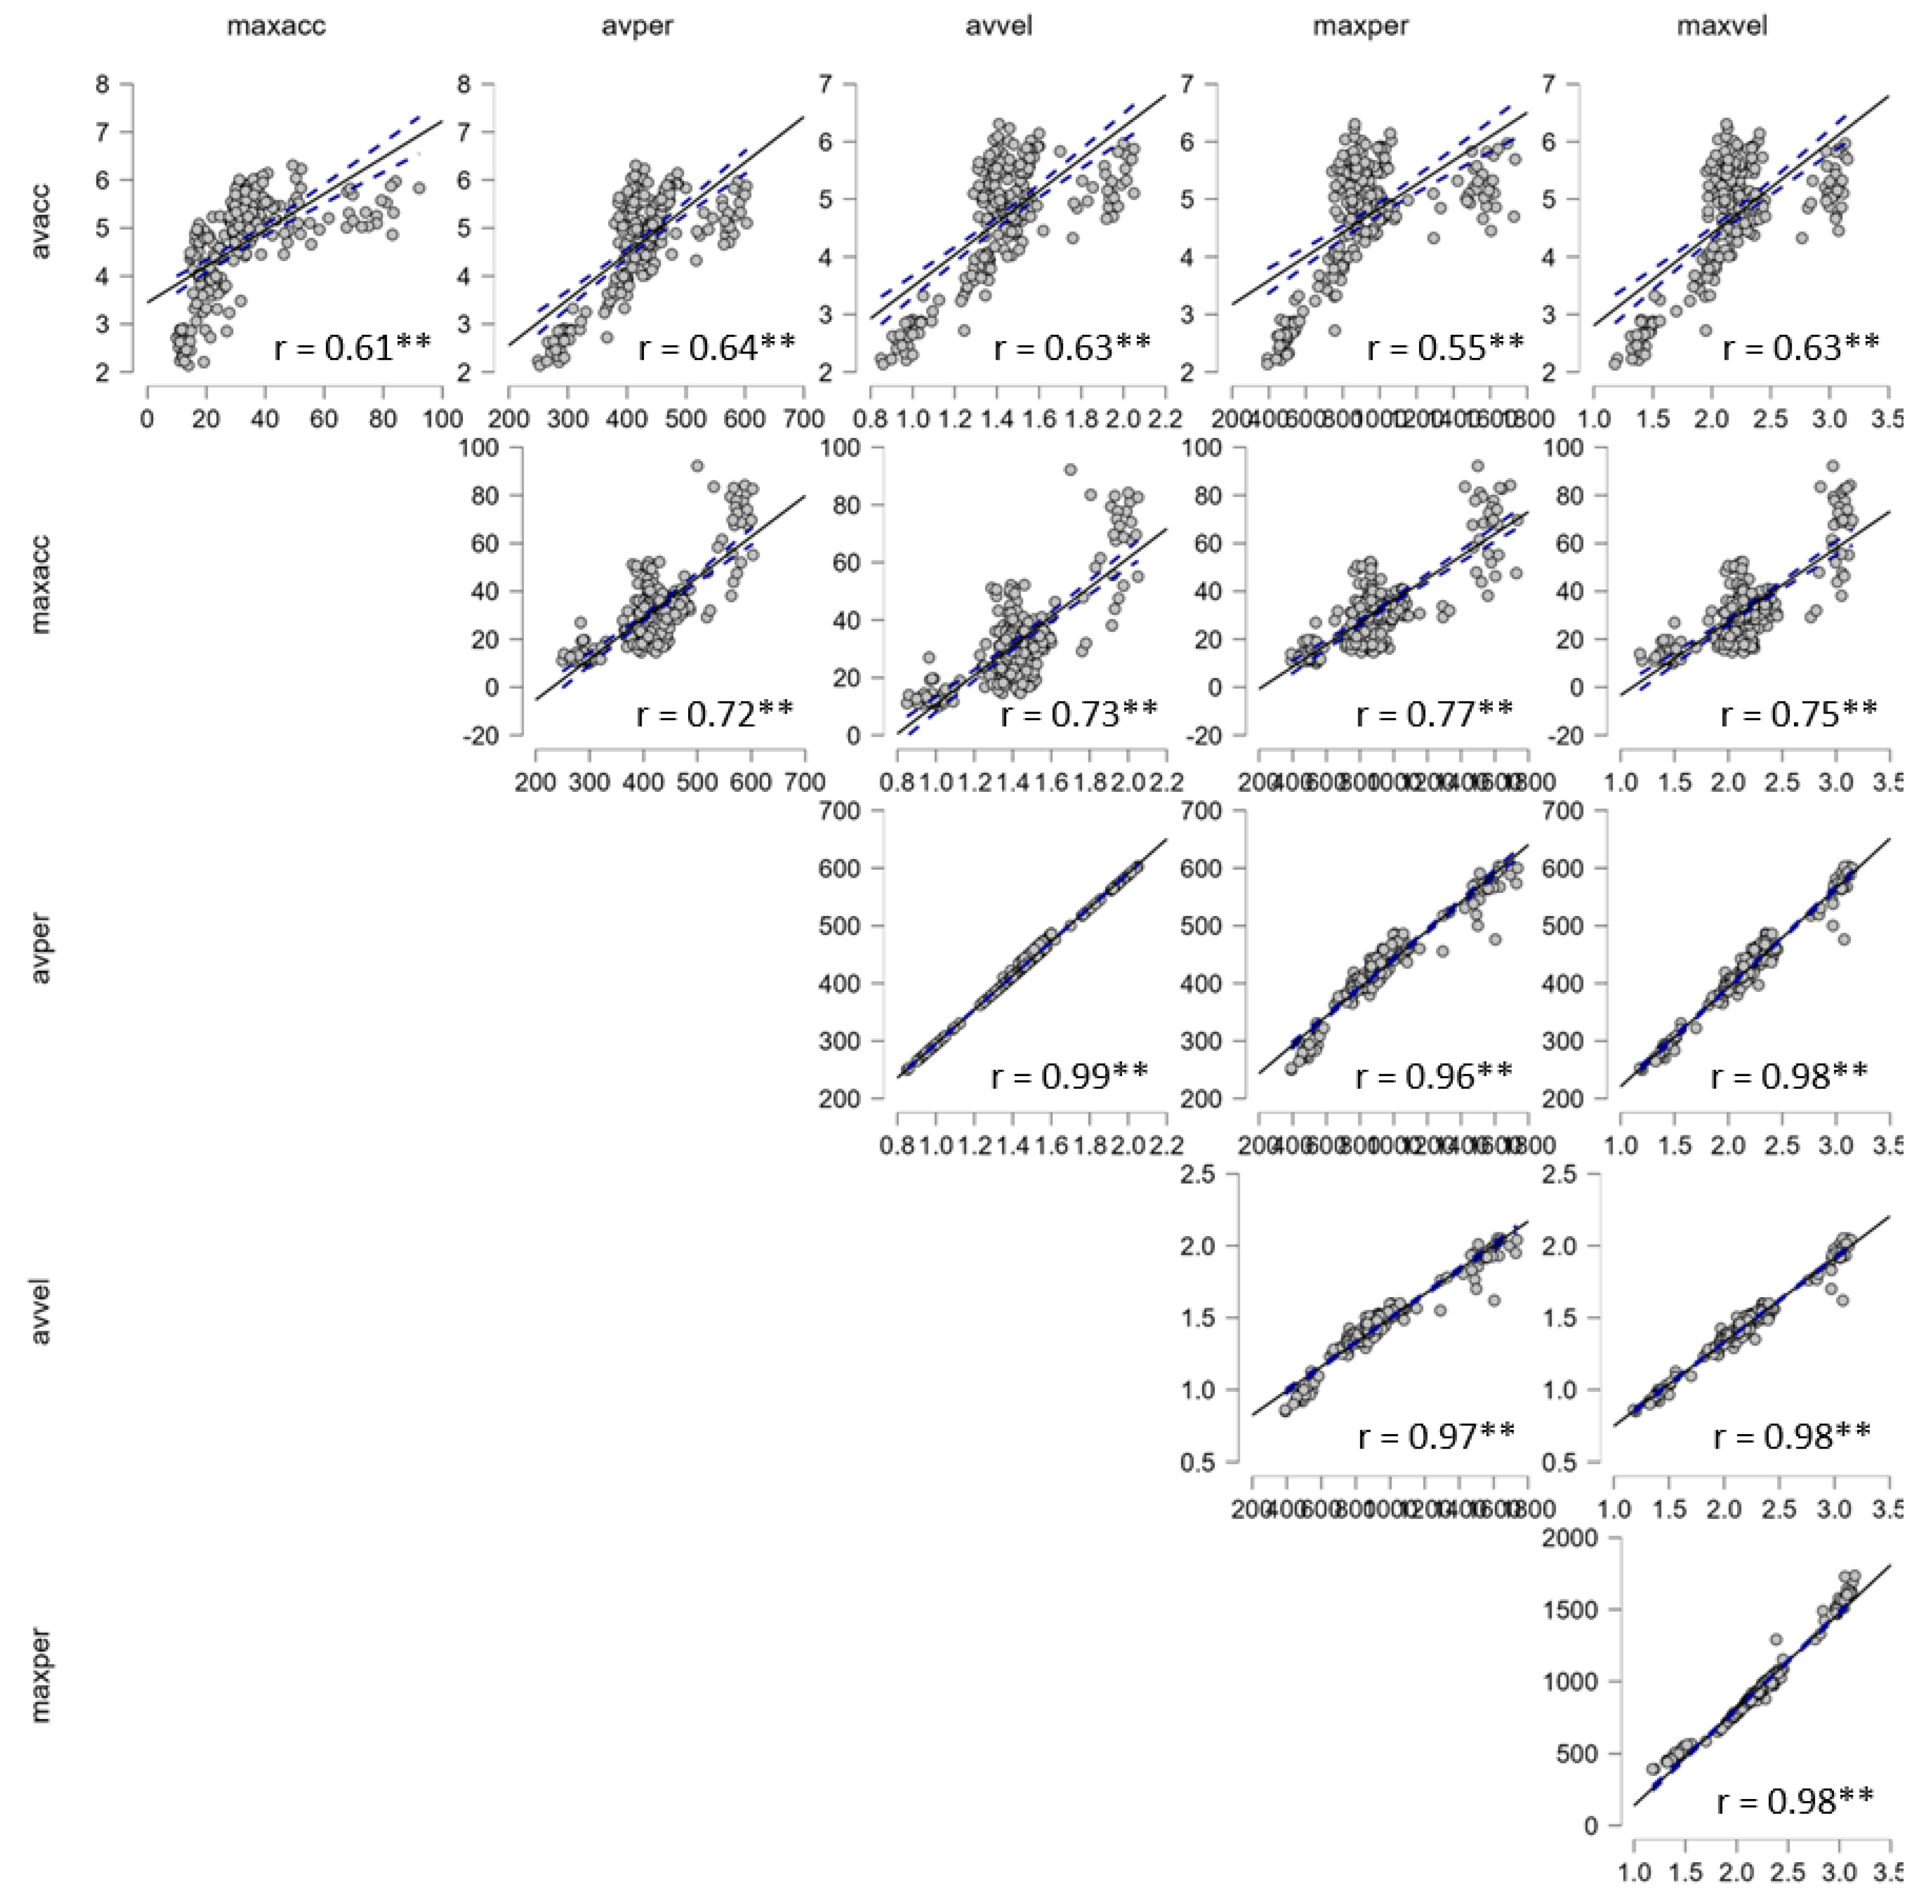
Figure 4.
Bland-Altman plot.
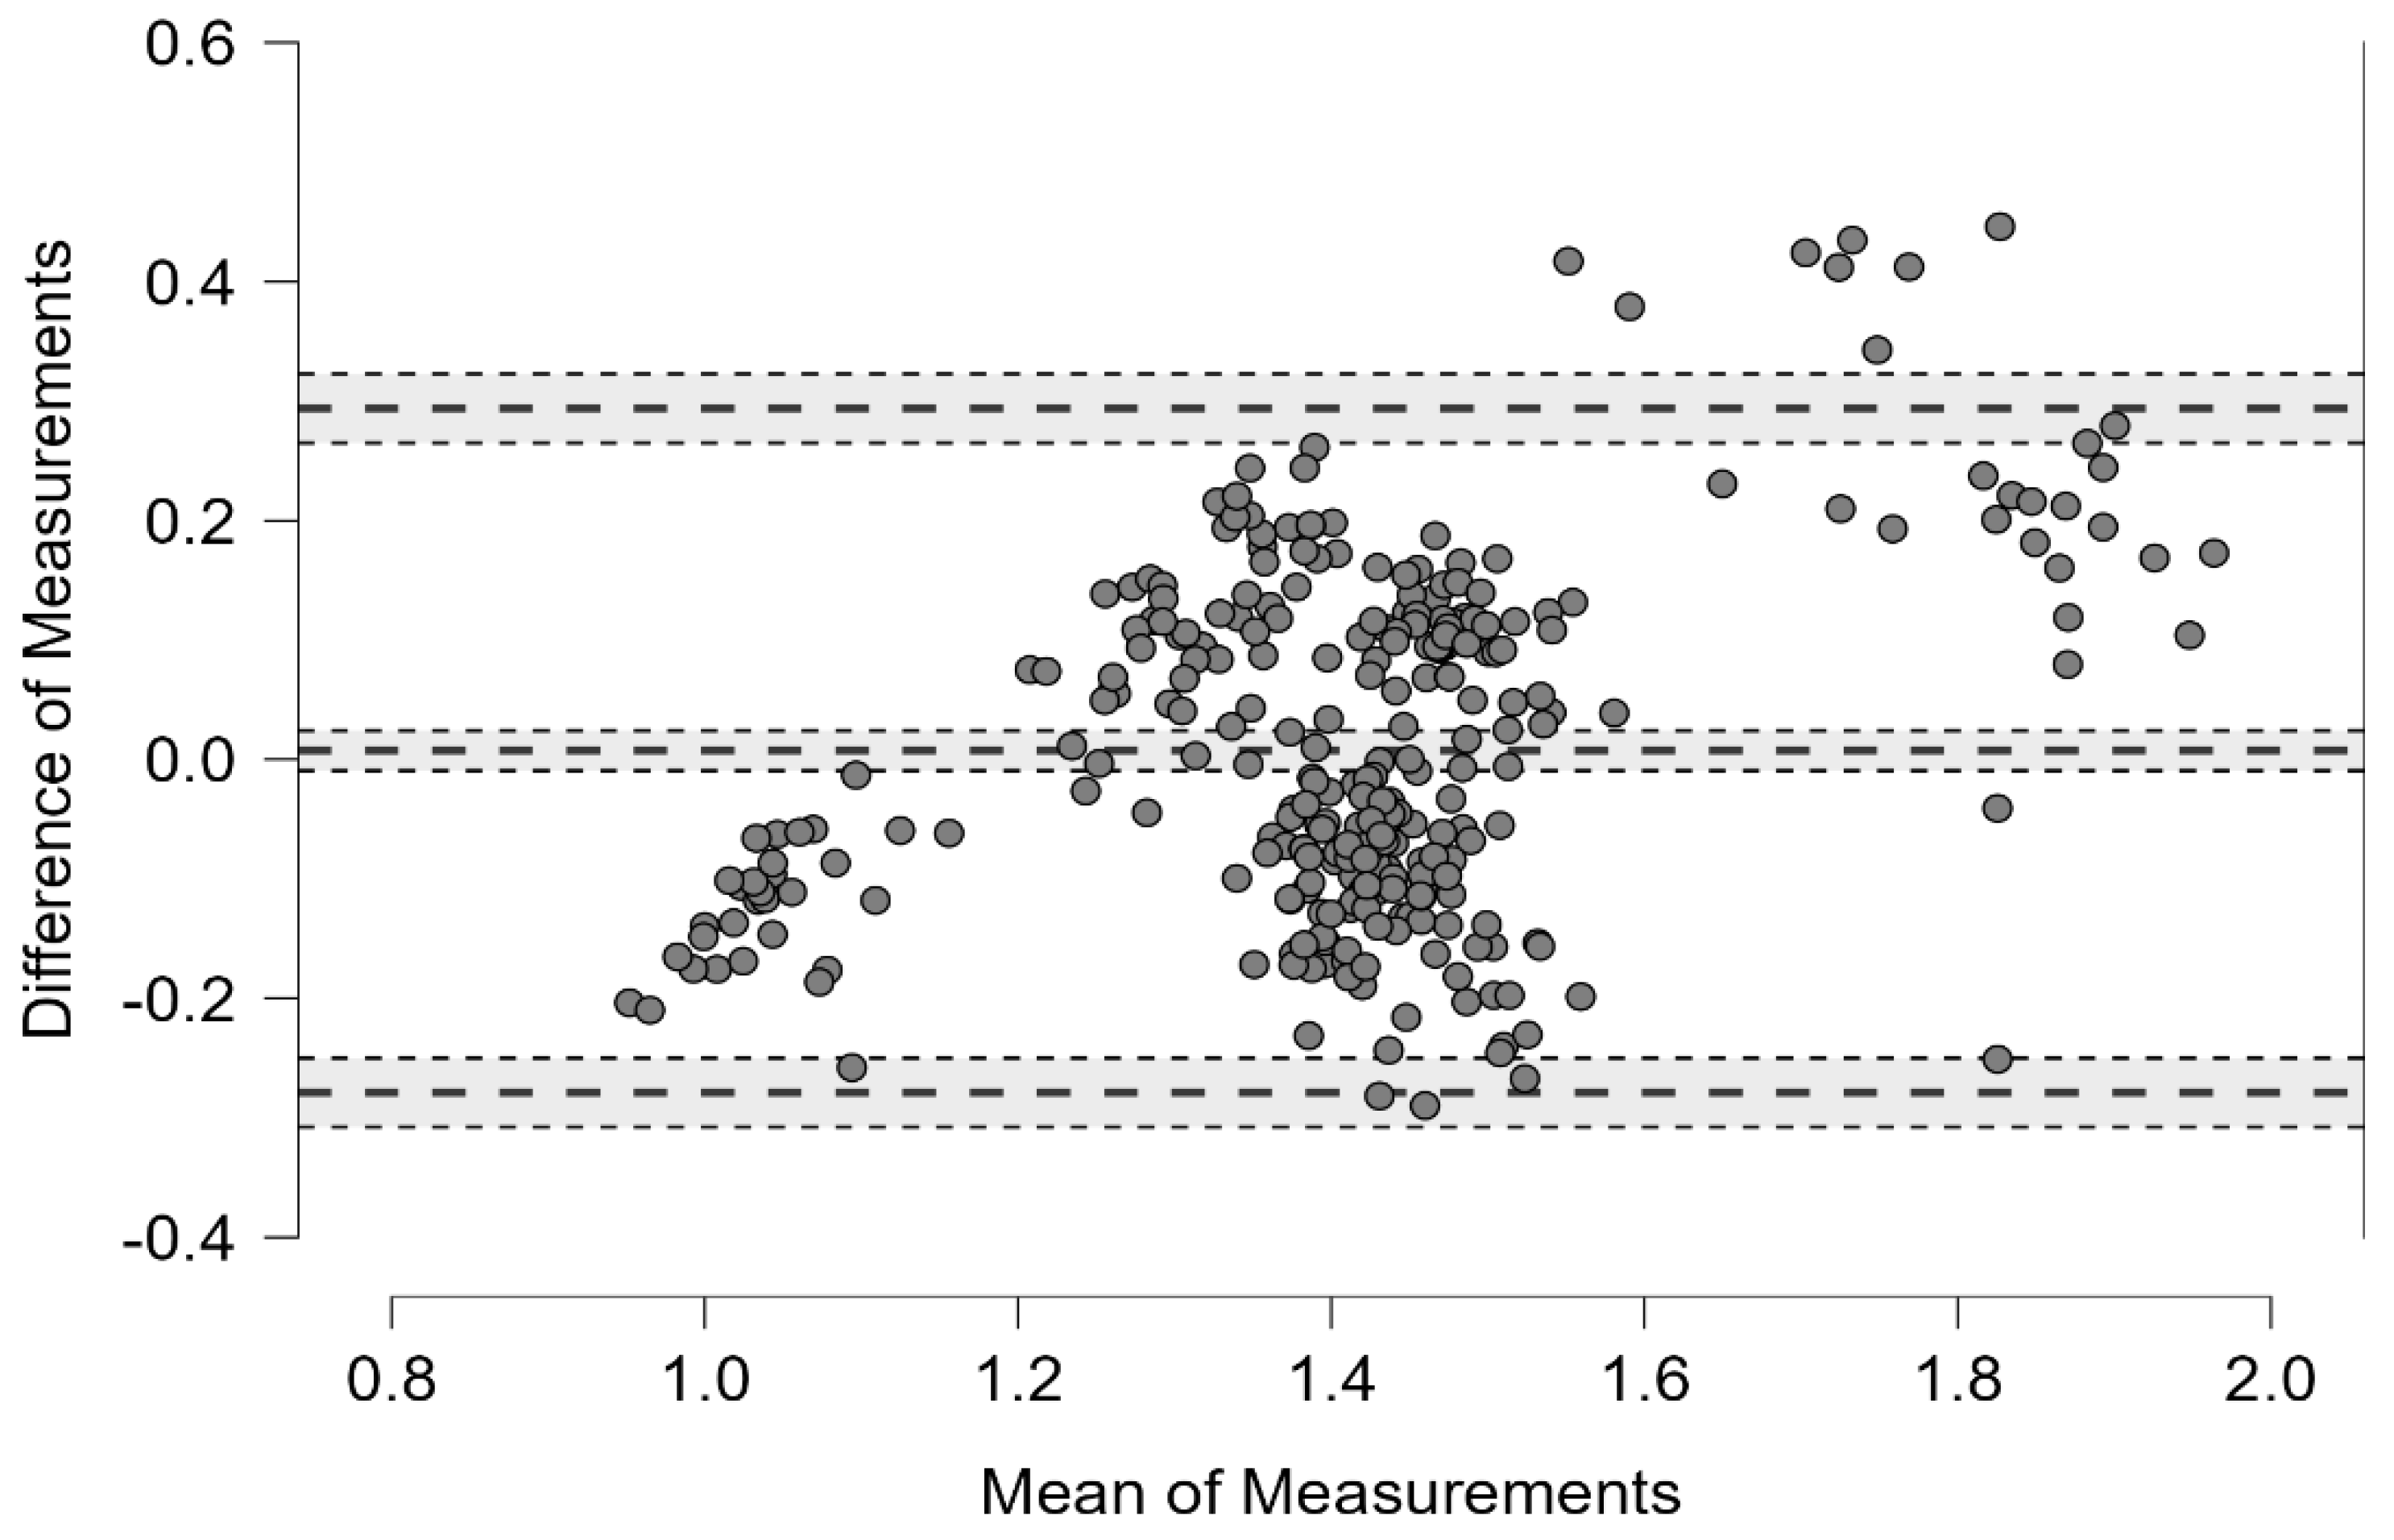
Table 1.
Basic parameters of the participants.
| M | SD | Min | Max | |
| Age (years) | 32.8 | 7.8 | 22 | 45 |
| BH (cm) | 182.1 | 5.9 | 172 | 190 |
| BW (kg) | 84.4 | 9.9 | 72 | 103 |
| CMJ (cm) | 38.1 | 8.0 | 27.1 | 53.3 |
| BS (kg) | 96.6 | 20.6 | 65 | 130 |
| BP (kg) | 86.7 | 18.8 | 60 | 120 |
Note. BH – body height, BW – body weight, CMJ – counter movement jump, BS – back squat, BP – bench-press.
Table 2.
Descriptive statistics M (SD) Min–Max of performance parameters.
| Parameter | P-Shapiro-Wilk | Mean | SD | Min | Max |
| avacc (m·s⁻²) | .18 | 4.80 | 0.95 | 2.14 | 6.30 |
| maxacc (m·s⁻²) | .10 | 33.71 | 15.19 | 9.95 | 92.20 |
| avper (W) | .13 | 419.00 | 67.34 | 250 | 603 |
| avvel (m·s⁻¹) | .26 | 1.42 | 0.23 | 0.85 | 2.05 |
| maxper (W) | .21 | 913.81 | 259.44 | 392 | 1735 |
| maxvel (m·s⁻¹) | .20 | 2.16 | 0.38 | 1.18 | 3.15 |
Disclaimer/Publisher’s Note: The statements, opinions and data contained in all publications are solely those of the individual author(s) and contributor(s) and not of MDPI and/or the editor(s). MDPI and/or the editor(s) disclaim responsibility for any injury to people or property resulting from any ideas, methods, instructions or products referred to in the content. |
© 2025 by the authors. Licensee MDPI, Basel, Switzerland. This article is an open access article distributed under the terms and conditions of the Creative Commons Attribution (CC BY) license (http://creativecommons.org/licenses/by/4.0/).
Copyright: This open access article is published under a Creative Commons CC BY 4.0 license, which permit the free download, distribution, and reuse, provided that the author and preprint are cited in any reuse.


