Preprint
Article

This version is not peer-reviewed.

Peridynamic Modeling of Fatigue Crack Initiation and Interaction in Modified Compact Tension Specimens

Submitted:

18 November 2025

Posted:

18 November 2025

You are already at the latest version

Abstract

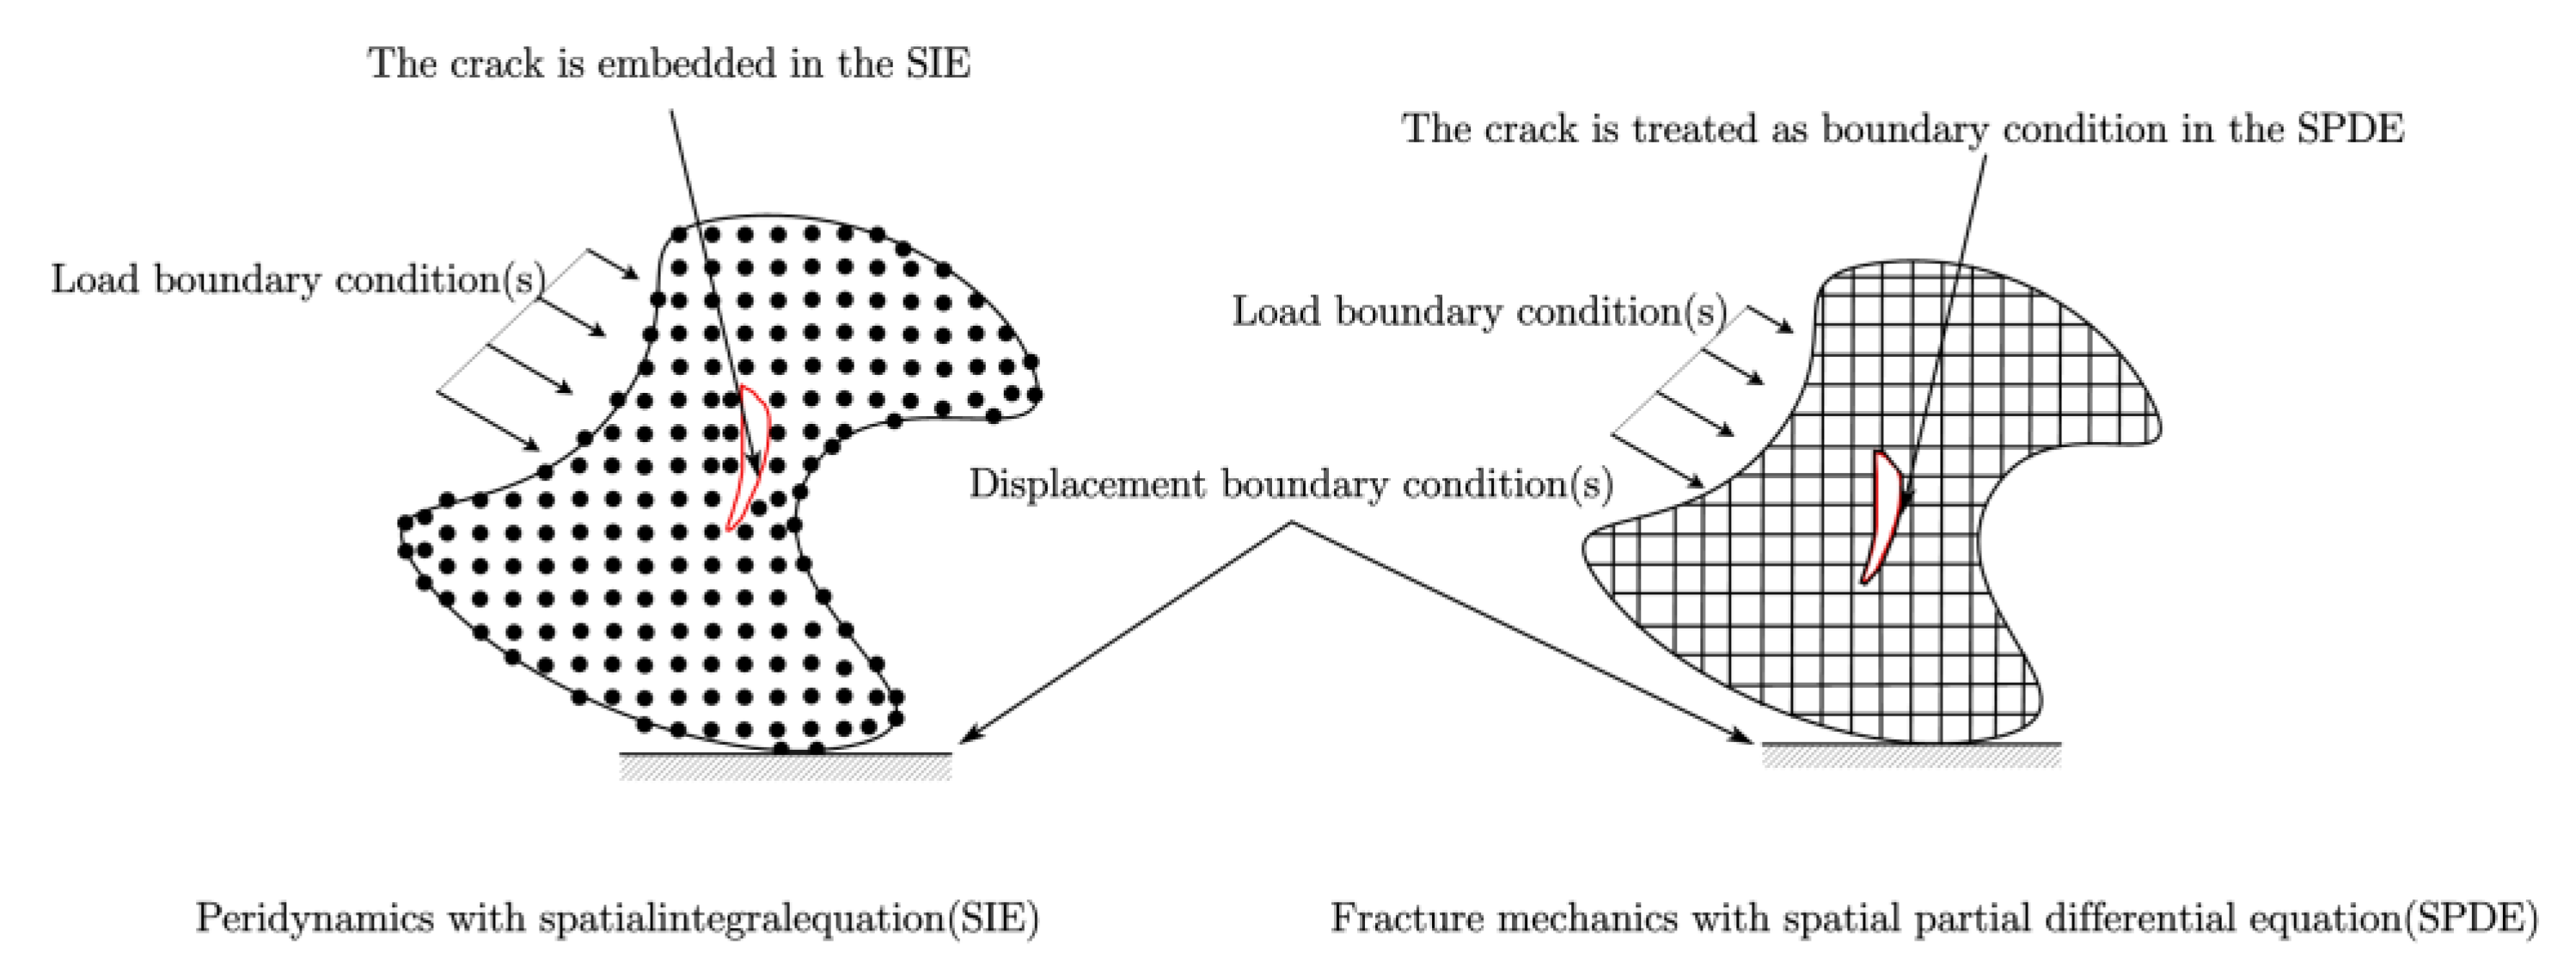
A state-based peridynamic (PD) fatigue framework is formulated for crack initiation, propagation, and interaction in Modified Compact Tension (MCT) specimens. By replacing local PDEs with a nonlocal integral model, discontinuities are handled without tip tracking or remeshing. Pin–fixture loading is represented via a nonlocal traction/contact mapping; fatigue damage evolves through a cyclic bond-degradation law consistent with S–N/Paris behavior. Driving forces are interpreted using a 3D PD J-integration and an energy-based bond-failure criterion, with quasi-static response advanced by adaptive dynamic relaxation. Calibration uses elastic/fracture properties referenced to baseline CT data, and validation combines finite-element benchmarks with targeted MCT tests recording load–displacement hysteresis, crack paths, and da/dN-K/J, trends across multiple ratios. The framework recovers nucleation sites without pre-seeded flaws, predicts mesh-insensitive growth rates and paths, and captures deflection, shielding/amplification, and coalescence. Quantitatively, path-angle discrepancies remain within a few percent, and life predictions fall within ~10% of experiments. Parametric studies on notch radius, ligament width, pin-hole diameter/offset, thickness/side grooves, stress ratio, and load amplitude establish how constraint and geometry govern initiation life, path stability, interaction distance, and failure mode. The result is a reproducible, mesh-independent route to fatigue-resistant MCT design and service-relevant assessment of metallic structures.

Keywords: 
;  ;  ;  ;  ;  ;  

1. Introduction

The initiation and growth of fatigue cracks diminish structural damage tolerance, compromise structural integrity, and shorten component service life [1]. Uncovering the multiscale mechanisms governing crack initiation–growth and developing full-life prediction frameworks for structures subjected to cyclic loading constitute a forefront pursuit in fatigue and fracture science [2,3,4]. Yet classical fracture and fatigue models are unable, within a unified framework, to simultaneously capture multiscale “micro-nucleation to macro-growth” behavior, thermo-mechanical/environmental coupling, and crack-topology evolution (branching, coalescence, deflection); consequently, uncertainty in life prediction is amplified and model transferability is weakened [5,6]. These limitations restrict accurate prediction of initiation and growth, especially in complex geometries such as the Modified Compact Tension (MCT) specimen. In contrast to the CT configuration—with its quasi-deterministic crack path—the MCT geometry induces path variability and load-sequence sensitivity, precluding a priori trajectory specification and complicating parameter identification under service-like conditions. As a result, current evaluations often pre-assign a small flaw before invoking fracture-mechanics formulas, a workflow misaligned with real operating scenarios and prone to appreciable prediction error. Peridynamics (PD), introduced by Silling [7,8,9], replaces local derivatives with nonlocal integrals, enabling robust modeling of initiation, propagation, branching, coalescence, and arrest without special tip tracking or remeshing, and thus offering a consistent route from nucleation to long-crack growth. Against this backdrop, improving CT-type specimens is meaningful for two reasons: (i) the standard CT primarily exercises mode-I growth under high constraint, conditions not always representative of service environments in airframes and other built-up metallic structures; and (ii) modern durability-and-damage-tolerance assessments must capture short-crack behavior, crack-closure effects, multiple-site damage, and interactions with geometric features (pin holes, fillets, ligaments) that a conventional CT does not emulate well. An improved MCT specimen provides controlled kinematics, tunable constraint, and richer mixed-mode content, thereby furnishing a stringent, application-relevant benchmark for mechanistic fatigue modeling, calibration, and life prediction.
At the same time, prevailing computational approaches struggle to meet these demands with reliability and economy. Conventional finite element formulations and their enriched variants (e.g., CZM, XFEM) typically require ad-hoc criteria for nucleation [10,11,12], propagation direction, kink/branch selection, and arrest; they exhibit mesh dependence in the vicinity of evolving crack paths; and they often rely on remeshing or enrichment bookkeeping to follow discontinuities—burdens that escalate under multiple-site damage, load-sequence effects, and trans-scale interactions [13,14,15]. Additional challenges include representing crack-face contact and closure under variable
R-ratios, resolving constraint/thickness influences (e.g., T-stress, out-of-plane constraint), and maintaining numerical stability when cracks interact with holes, fillets, and ligaments typical of fixture-loaded specimens [16,17,18]. These limitations lead to path bias, parameter non-uniqueness, and sensitivity to discretization and user-defined criteria, thereby inflating uncertainty in life prediction for geometries like the improved MCT [19,20,21].
This work develops and rigorously validates a peridynamics-based (PD) fatigue framework tailored to an improved Modified Compact Tension (MCT) specimen, and subsequently quantifies how geometry, loading, and multi-crack interaction govern fatigue life and failure mechanisms. First, the improved MCT is parameterized—initial notch and radius, pin-hole offset, ligament width, and optional side grooves—and PD material and horizon parameters are calibrated against baseline CT data so that the cyclic bond-degradation law remains consistent with S–N and Paris-type behavior. Second, predictions are validated against independent MCT measurements, including load–displacement hysteresis, crack paths, and d a / d N Δ K / Δ J trends across multiple R-ratios; the framework captures the short-to-long crack transition, closure effects under pin loading, and mixed-mode deflection without pre-seeded flaws or prescribed trajectories. Third, parametric studies are performed on notch radius, ligament length, pin-hole eccentricity, thickness/constraint, and load amplitude, including scenarios with multiple-site initiation, alongside sensitivity analyses with respect to discretization and the horizon/thickness ratio. Results indicate that the improved MCT delivers stable, instrumentable growth with tunable constraint; PD reproduces nucleation sites and path evolution (branching, coalescence, arrest) without crack-tip tracking; growth-rate and path predictions exhibit mesh independence and avoid singular fields; and the workflow yields actionable design maps linking dimensionless geometric groups and loading metrics to fatigue life, interaction distance, and failure mode. Overall, coupling the improved MCT with PD provides a reproducible experimental–computational testbed and a mesh-independent simulation route for service-relevant fatigue assessment of metallic structures, enabling mechanism-based calibration, uncertainty reduction, and transferability to complex assemblies.

2. Peridynamic Fatigue Modeling

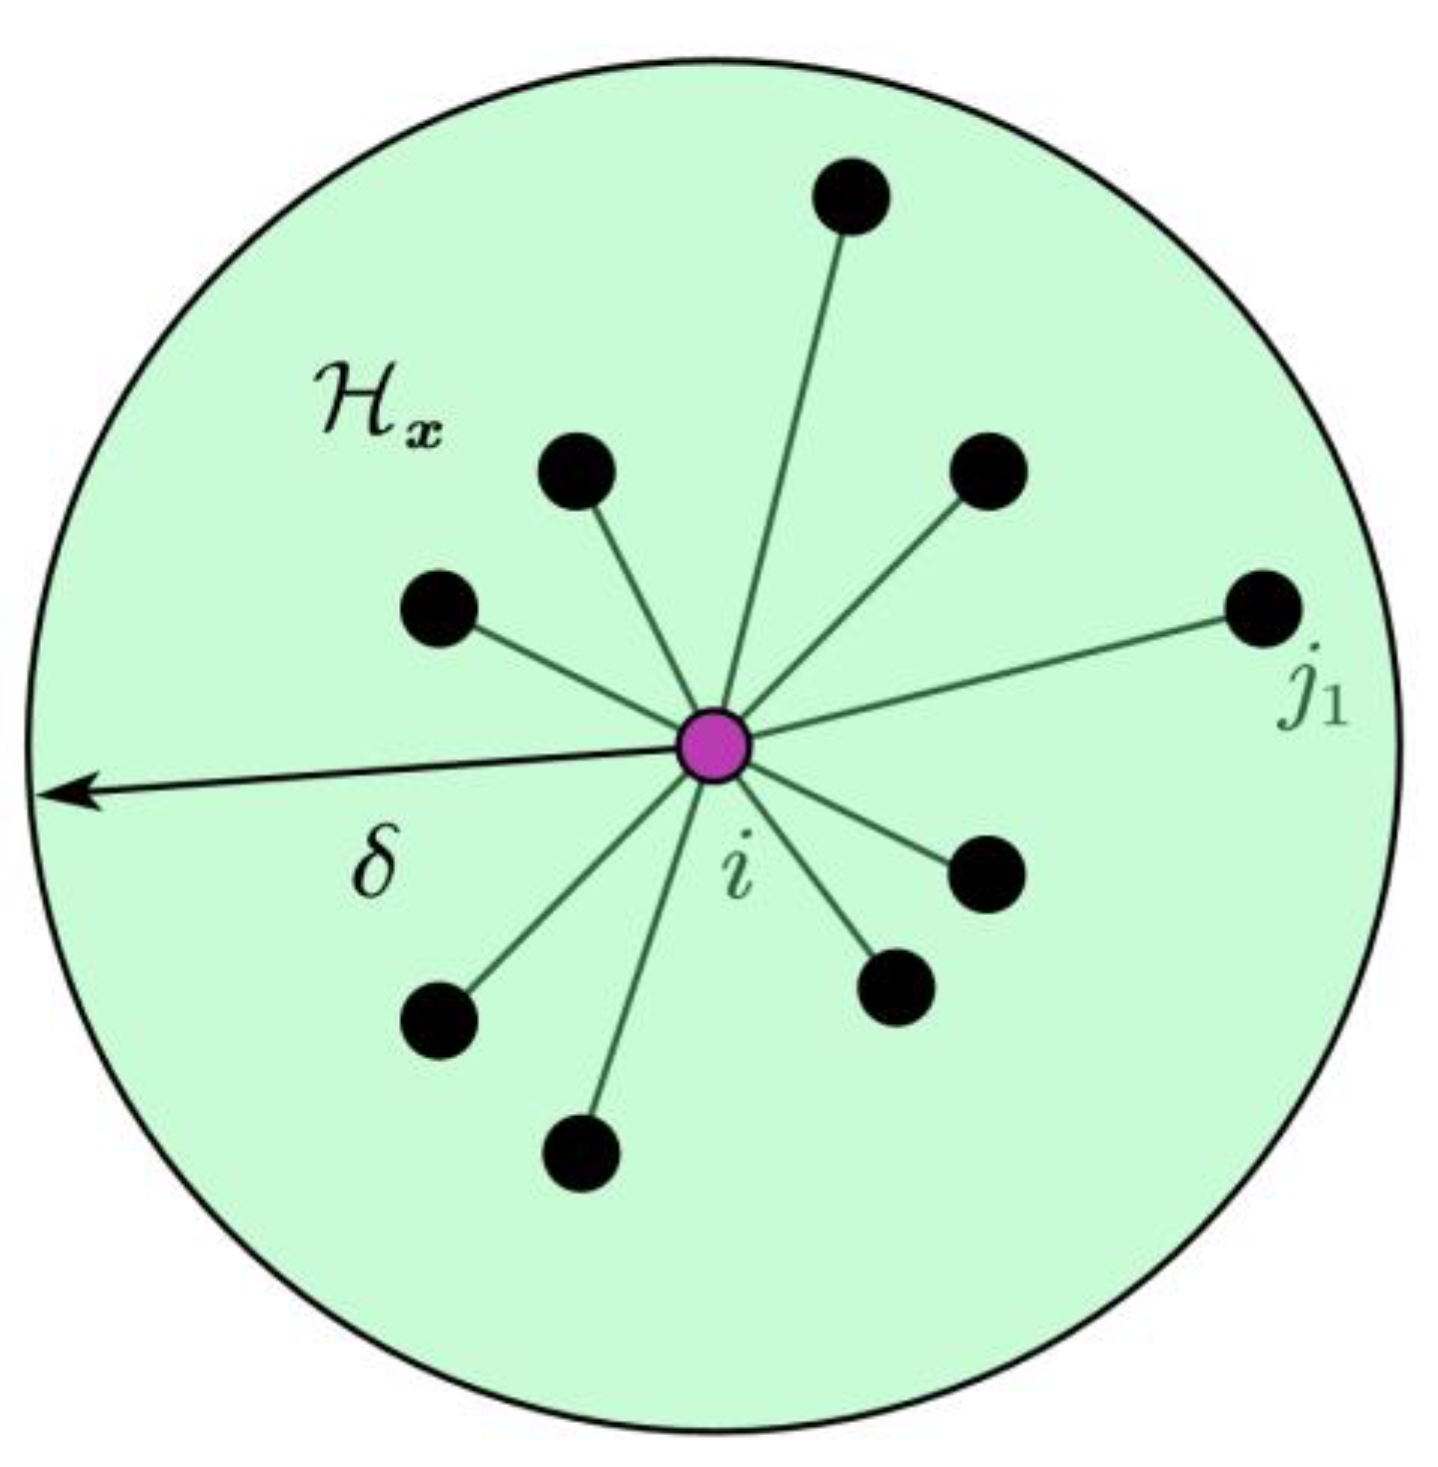
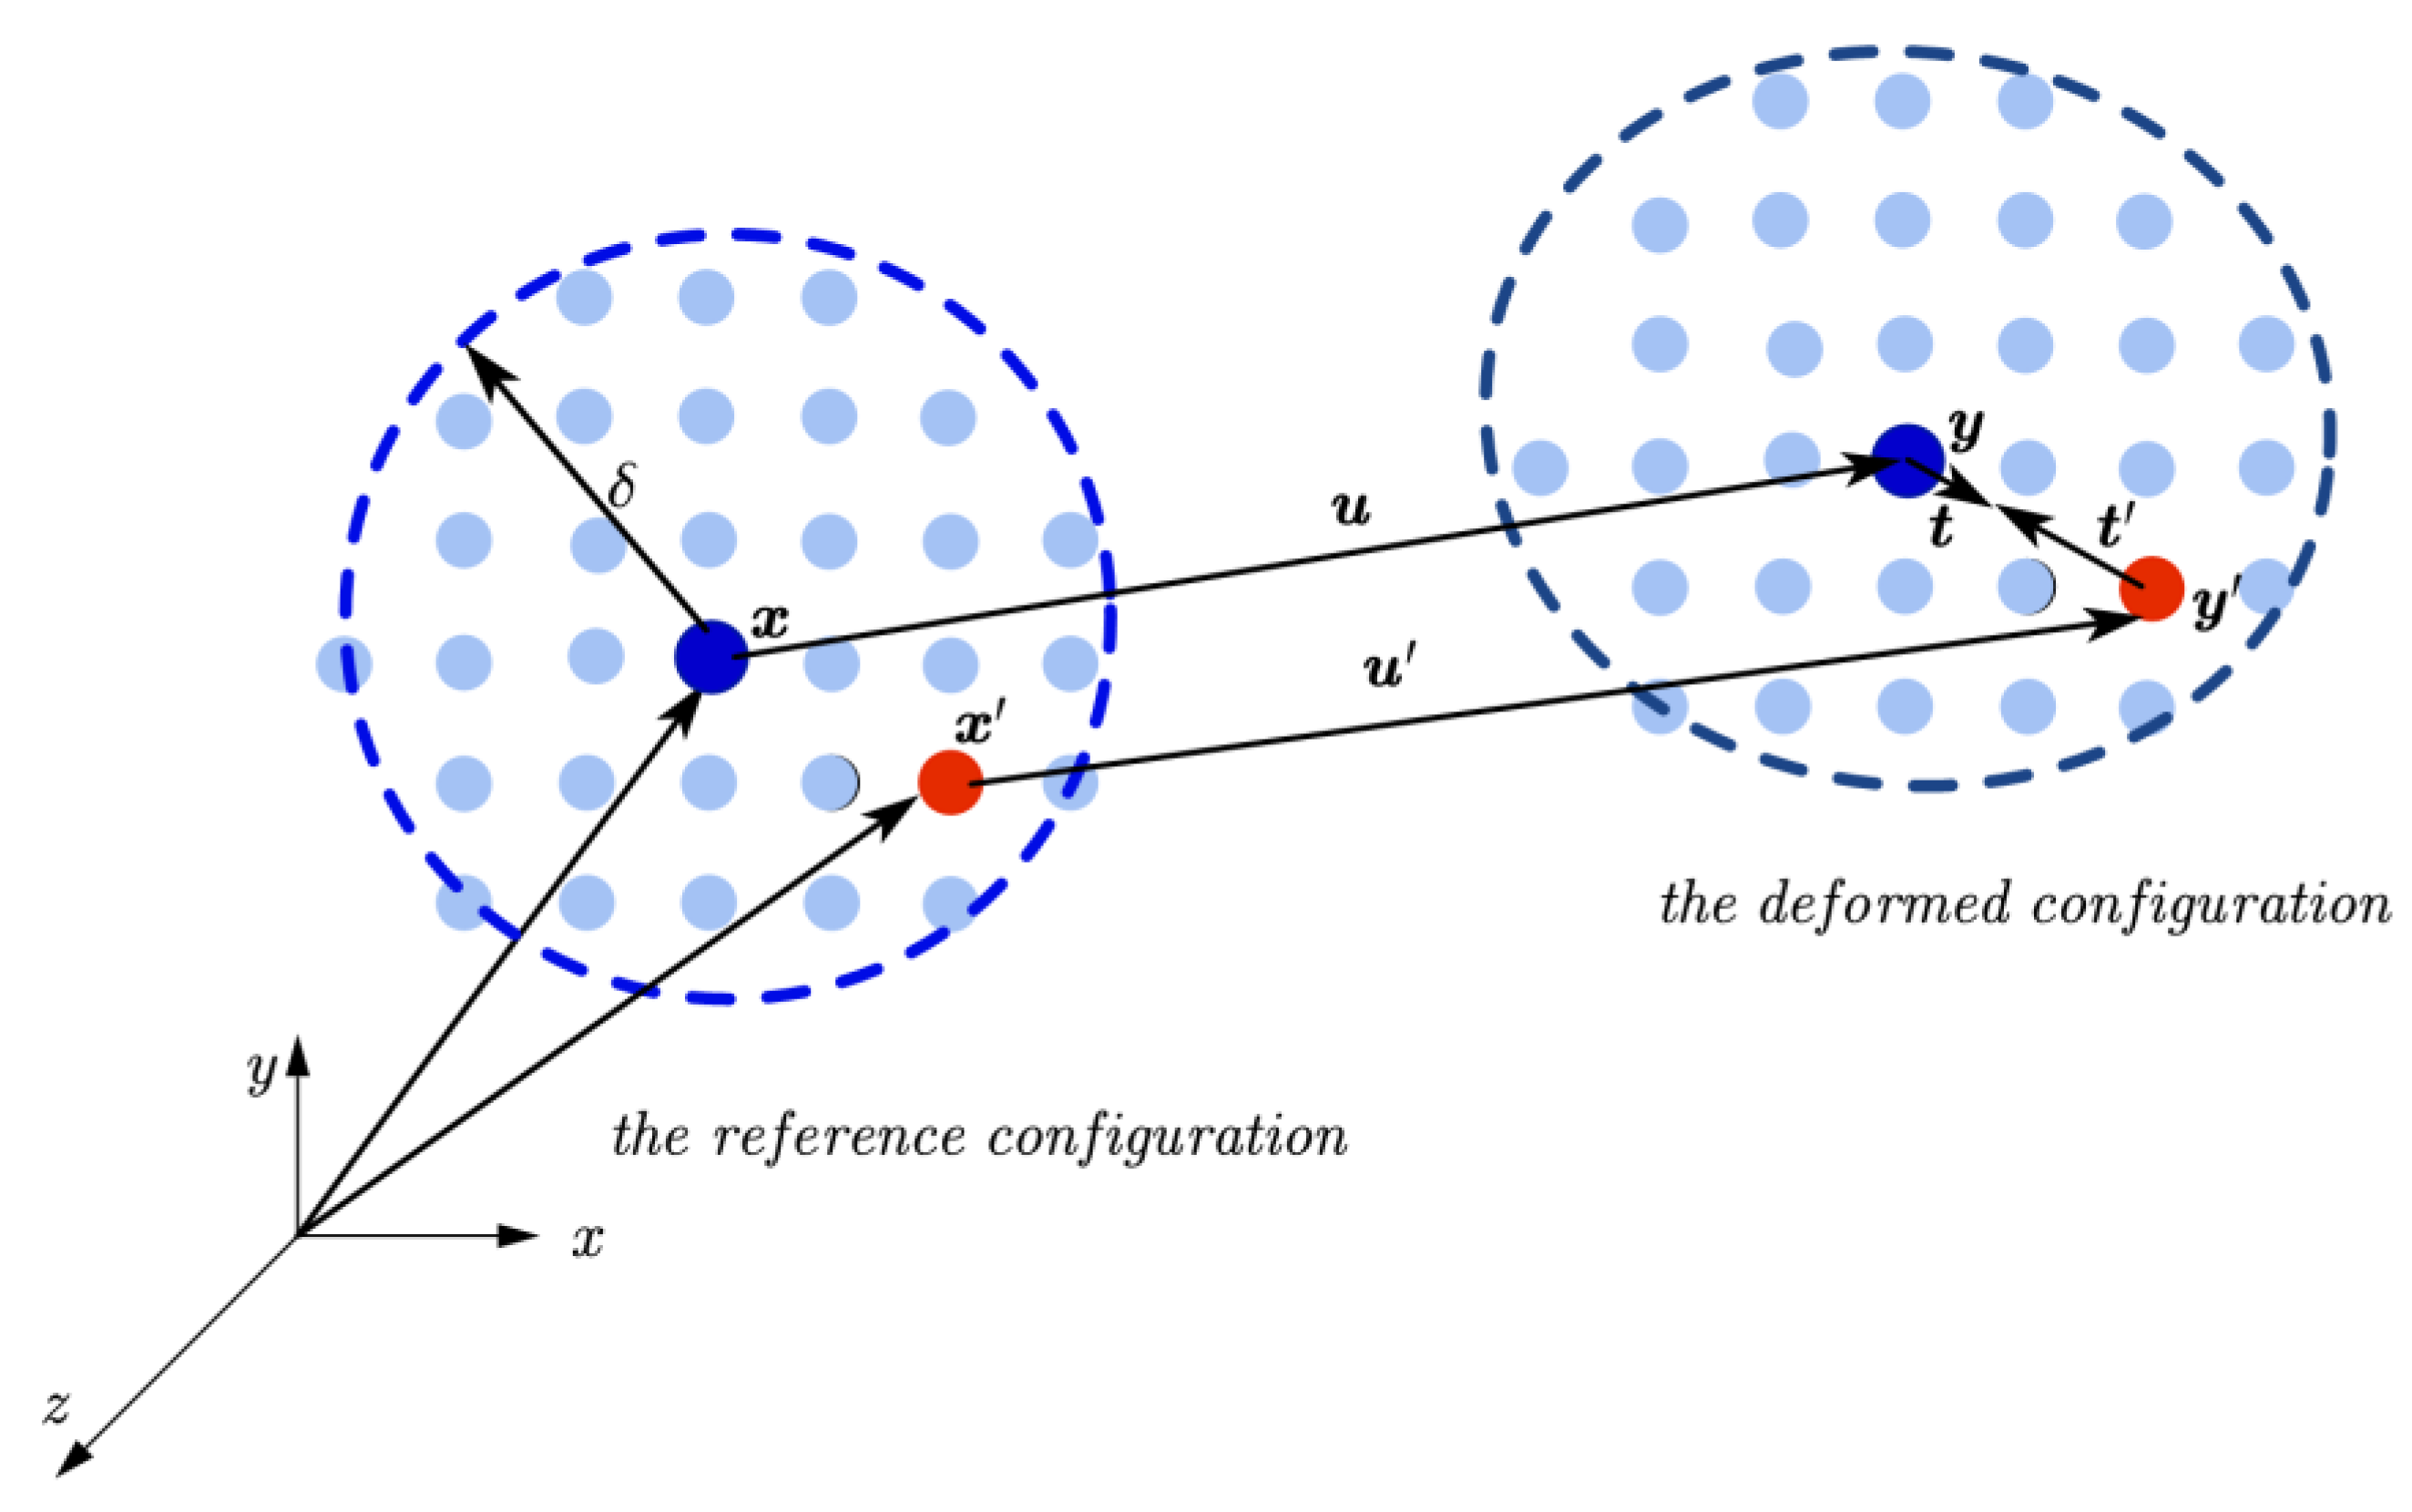
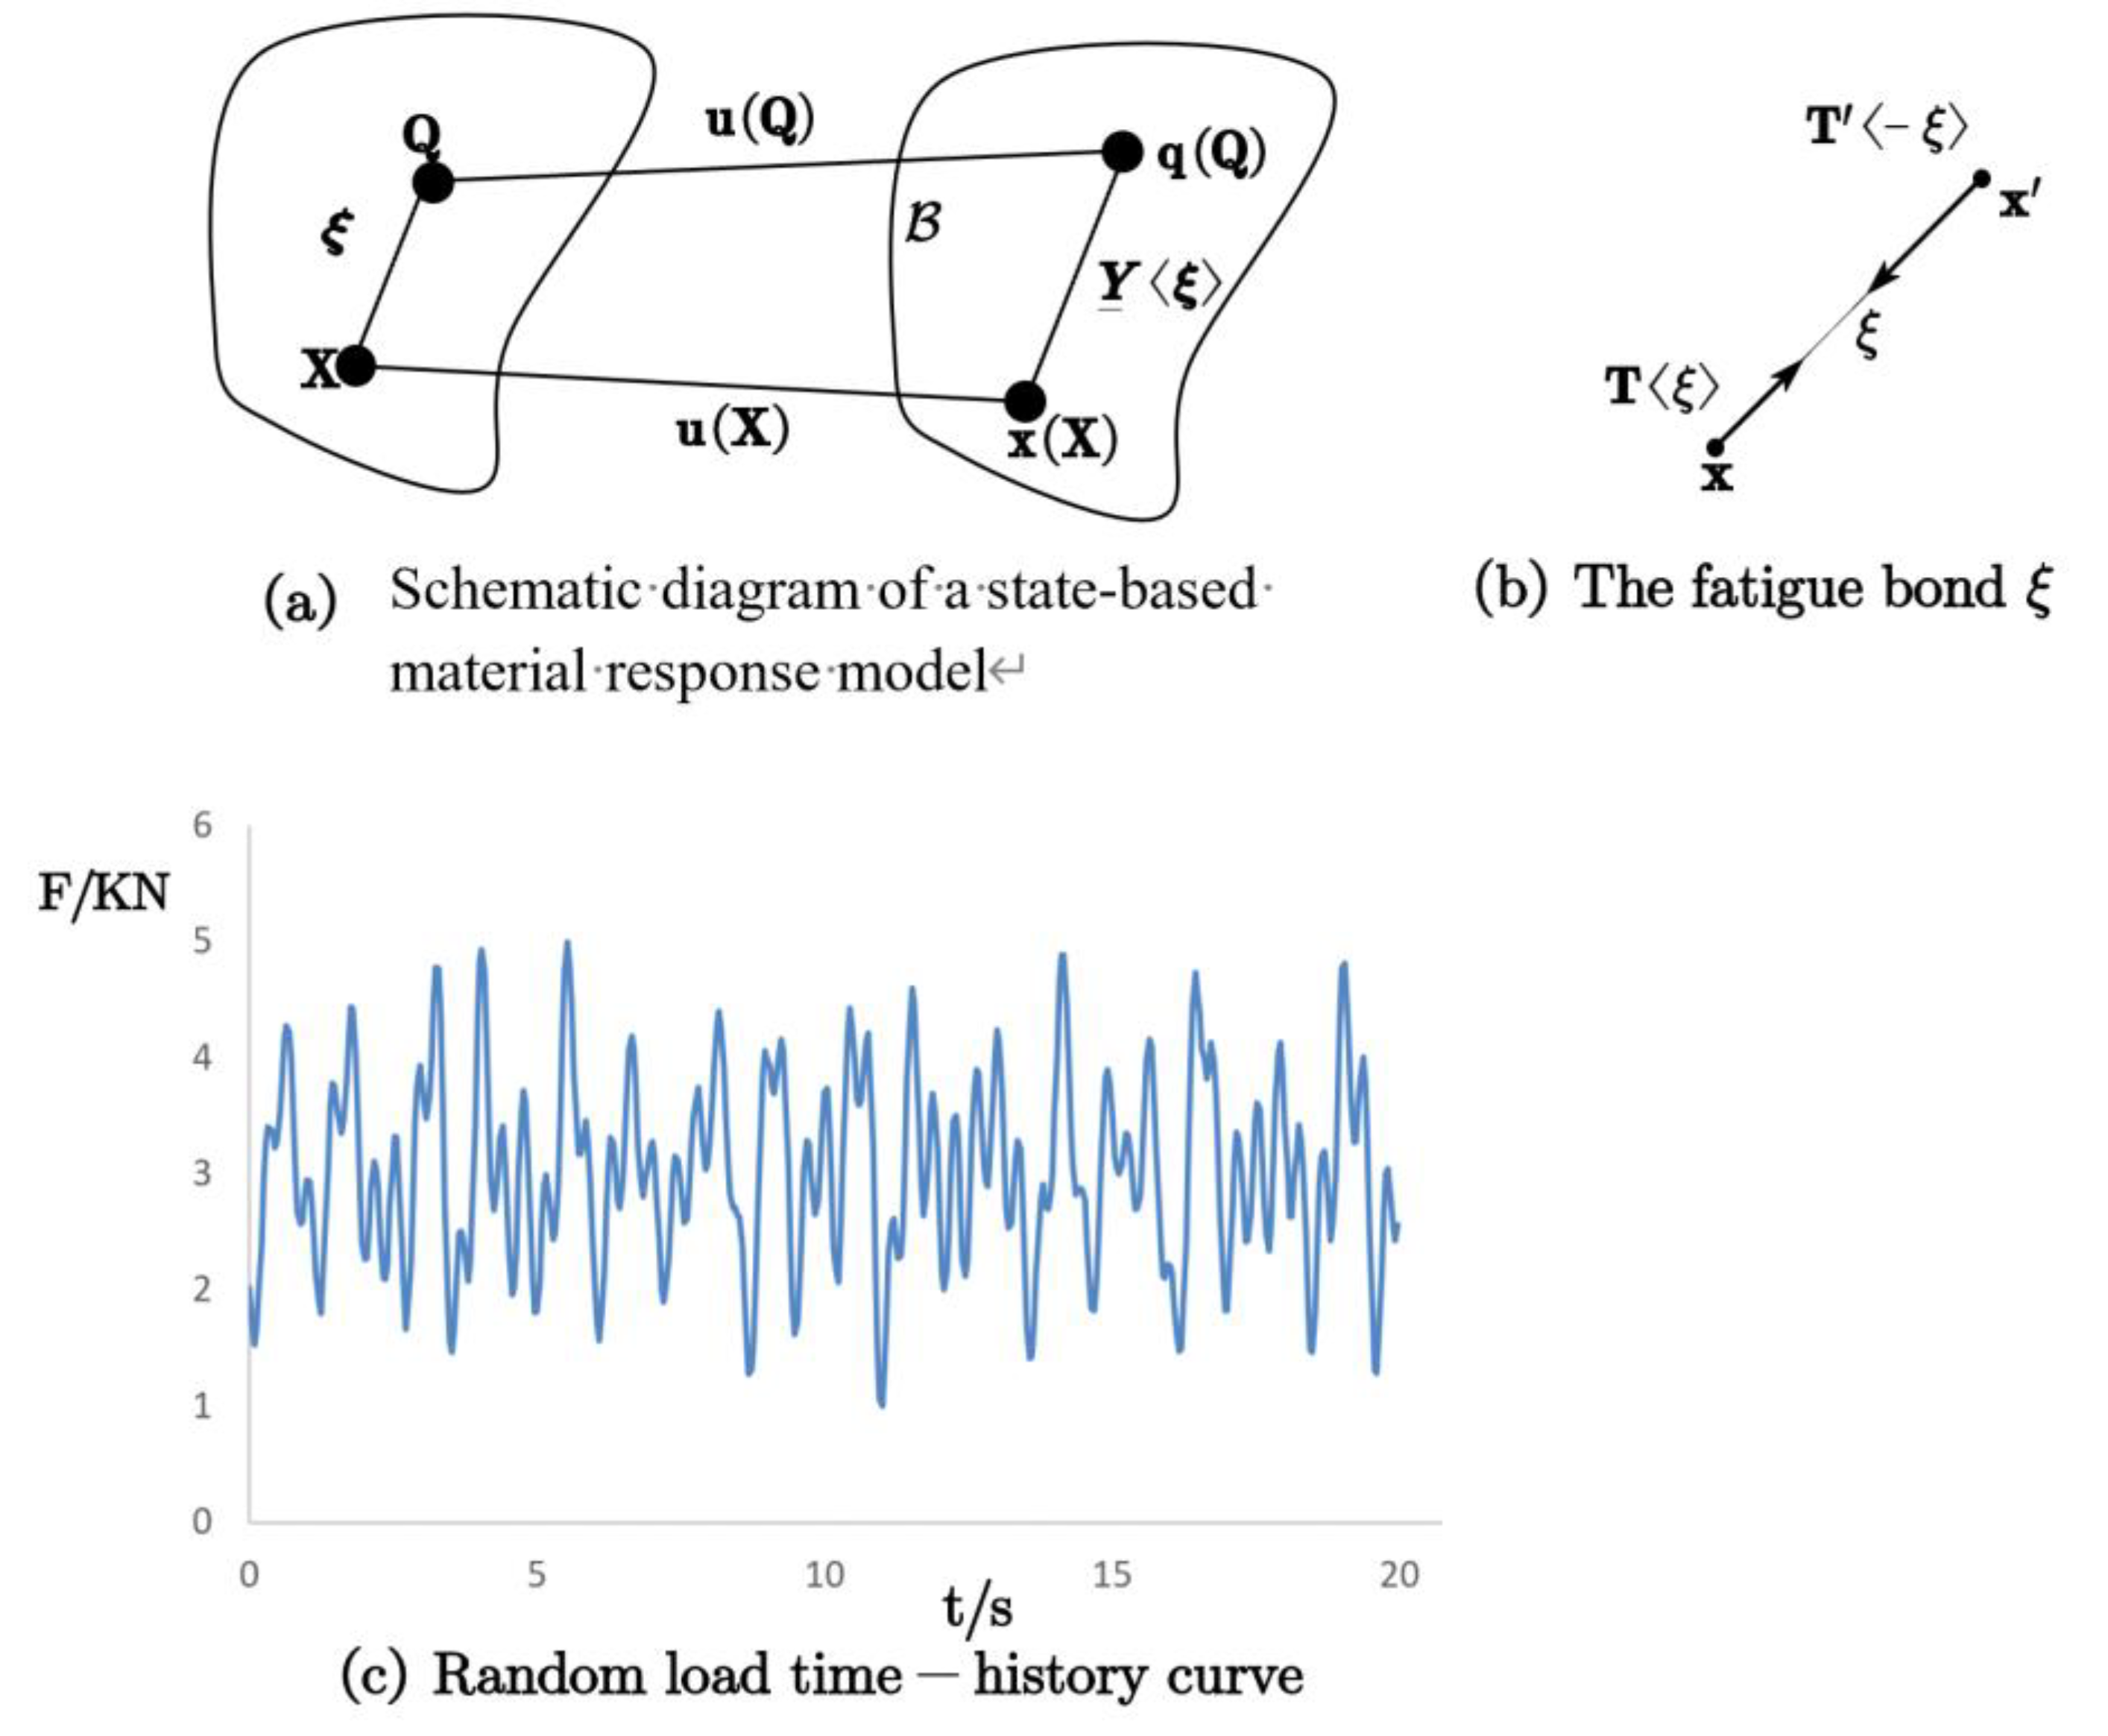
2.1. State-Based Peridynamic Theory

By generalizing the bond-based peridynamic formulation, a state-based peridynamic model is obtained. As illustrated in Figure 1, this generalized framework renders the material response at any point in a structural component dependent on the collective deformation state of all bonds connecting that point to neighbors within its horizon family.
Within the constraints of the aforementioned generalized peridynamic framework, the bond force between material points is given by the following expression,
f i j n = f ξ i j 1 ξ i j 2 ξ i j n , η i j 1 η i j 2 η i j n , t
where f i j n is bond force between material points i and jn, ξ i j n is relative position vector between two interacting material points in the reference configuration, is the relative displacement between two interacting material points in the deformed configuration, t denotes the elapsed time (temporal evolution) parameter. As shown in Figure 2.
In the deformed configuration, the force–density vectors t and t are opposite in direction and colinear with the deformed bond (relative position) vector. To satisfy conservation of angular momentum, these can be written as
t u u , x x , t = T ( x , t ) x x = 1 2 A y y y y
t u u , x x , t = T x , t x x = 1 2 B y y y y
where x , x ' are reference positions, y = x + u ( x , t ) and y ' = x ' + u ( x ' , t ) are the corresponding deformed positions, and T(⋅)⟨⋅⟩ denotes the force state, A and B are constitutive parameters that depend on the material properties, the deformation state, and the peridynamic horizon δ.
A model for which the force–density vectors satisfy Eq. (2) and Eq. (3) is referred to as the ordinary state-based peridynamic (OSB-PD) model. The OSB-PD formulation can represent volumetric deformation, distortional (deviatoric) deformation, and plastic incompressibility. In the deformed configuration, the force–density vectors and may assume arbitrary directions. To satisfy conservation of angular momentum, invoking the principle of virtual work (virtual displacements) yields,
ρ k u ¨ x , t Δ u = H ( T _ ( x , t ) x x T _ x , t x x ) Δ u d H + b x , t Δ u
where ρ is density, u is displacement, H is the horizon, and b is body force. State-based PD admits general constitutive relations, allowing accurate multiaxial response. The horizon δ is commonly set to 3Δ, where Δ is the particle spacing. Δ u is the virtual displacement vector of the material point x .

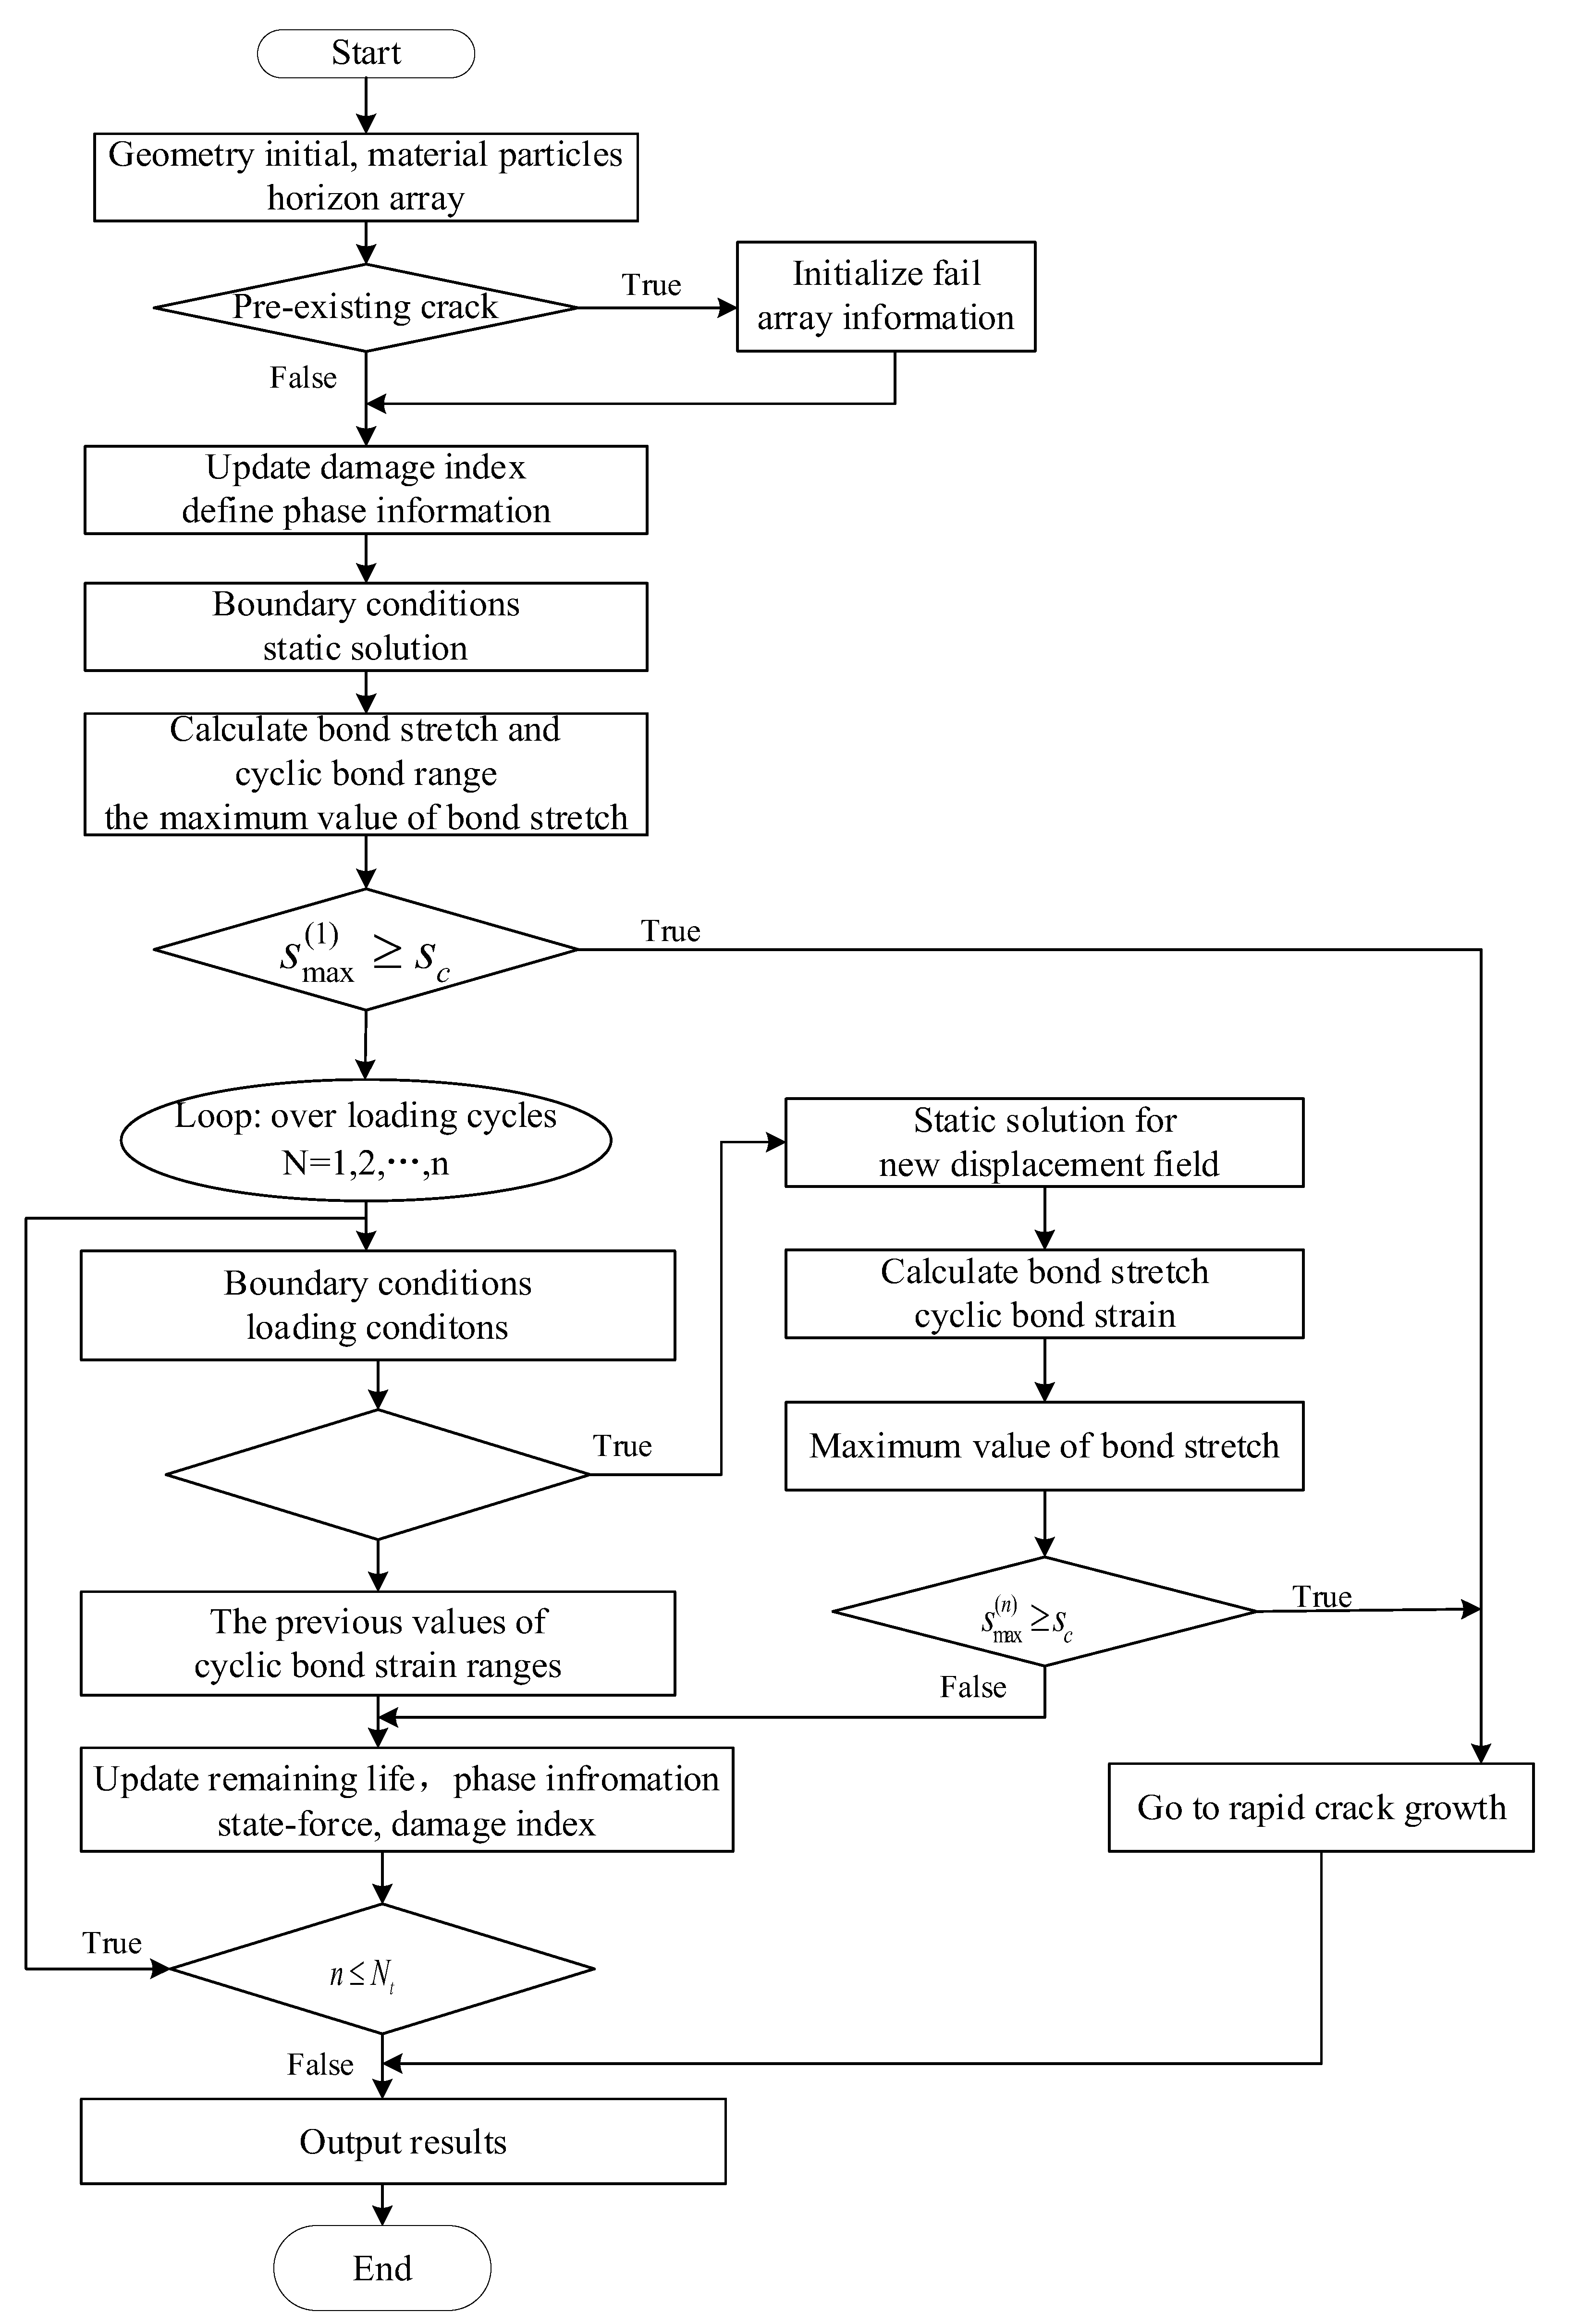
2.2. Fatigue Damage Theory

Under cyclic pin loading, the MCT geometry concentrates tensile–shear stresses along the notch mouth and around the pin holes. Microplasticity first localizes on favorably oriented slip systems, forming persistent slip bands and micro-voids at inclusions or surface asperities. As the elastic–plastic wake develops, crack closure and mean-stress effects modulate the local driving force each half-cycle. Small cracks nucleate at the highest gradient region near the notch root (or hole edge), grow along the ligament under predominantly Mode-I conditions, and may curve slightly as nonzero T-stress and geometry-induced multiaxiality redistribute the field. When multiple microcracks form on the notch flanks, their mutual interaction accelerates coalescence and brings forward the onset of macroscopic growth.
In the state-based peridynamic framework, each material point interacts with neighbors inside a finite horizon δ via “bonds”, as shown in Figure 3a. A bond carries a history of stretch s(t). Fatigue is modeled as progressive bond-life degradation under cyclic tension, as shown in Figure 3(b). Under external loading, the virtual bonds in the structure exhibit a fatigue mode comparable to that of a cylindrical fatigue specimen.
By generalizing the bond-based peridynamic formulation, a state-based peridynamic model is obtained. As illustrated in Figure 1, this generalized framework renders the material response at any point in a structural component dependent on the collective deformation state of all bonds connecting that point to neighbors within its horizon family.
As shown in Figure 3b, the damage-driving amplitude is the positive stretch range,
s a = s max s min +
where the macaulay brackets exclude purely compressive portions to account for crack closure. A mean-stress factor Φ(R) (function of load ratio R) can scale the effective amplitude to capture R-ratio effects. As for the remaining life update, each bond carries a scalar remaining life λ [ 0 , 1 ] . In order to update per counted cycle, the following equation can be obtained.
λ n + 1 = λ n C f s a s c m Φ ( R )
where C f and m are fatigue parameters calibrated for martensitic stainless steel, and s is the static critical stretch. A bond fails irreversibly if λ 0 within a cycle.
The local particle-level damage ψ ( x , t ) is the fraction of broken bonds in the particle’s family. Crack nucleation is declared once exceeds a prescribed threshold (e.g., ψ 0.6 ) over a connected set of particles. Because bonds span finite distance, the approach naturally regularizes the process zone without tip singularities or special enrichment. The integral form of particle-level local damage can be obtained,
ψ ( x , t ) = 1 H δ ( x ) ω ( ξ ) μ ( x , ξ , t ) d V x + ξ H δ ( x ) ω ( ξ ) d V x + ξ
and its discrete form is
ψ i = 1 j H δ ( i ) ω i j μ i j j H δ ( i ) ω i j = N broken   ( i ) N 0 ( i )
where ψ ( x , t ) [ 0 , 1 ] , H δ ( x ) is horizon (neighborhood) of radius δ around x, δ is the nonlocal length scale, ω ( ) is influence function, N broken   ( i ) and N 0 ( i ) are broken and initial bond counts for particle respectively.

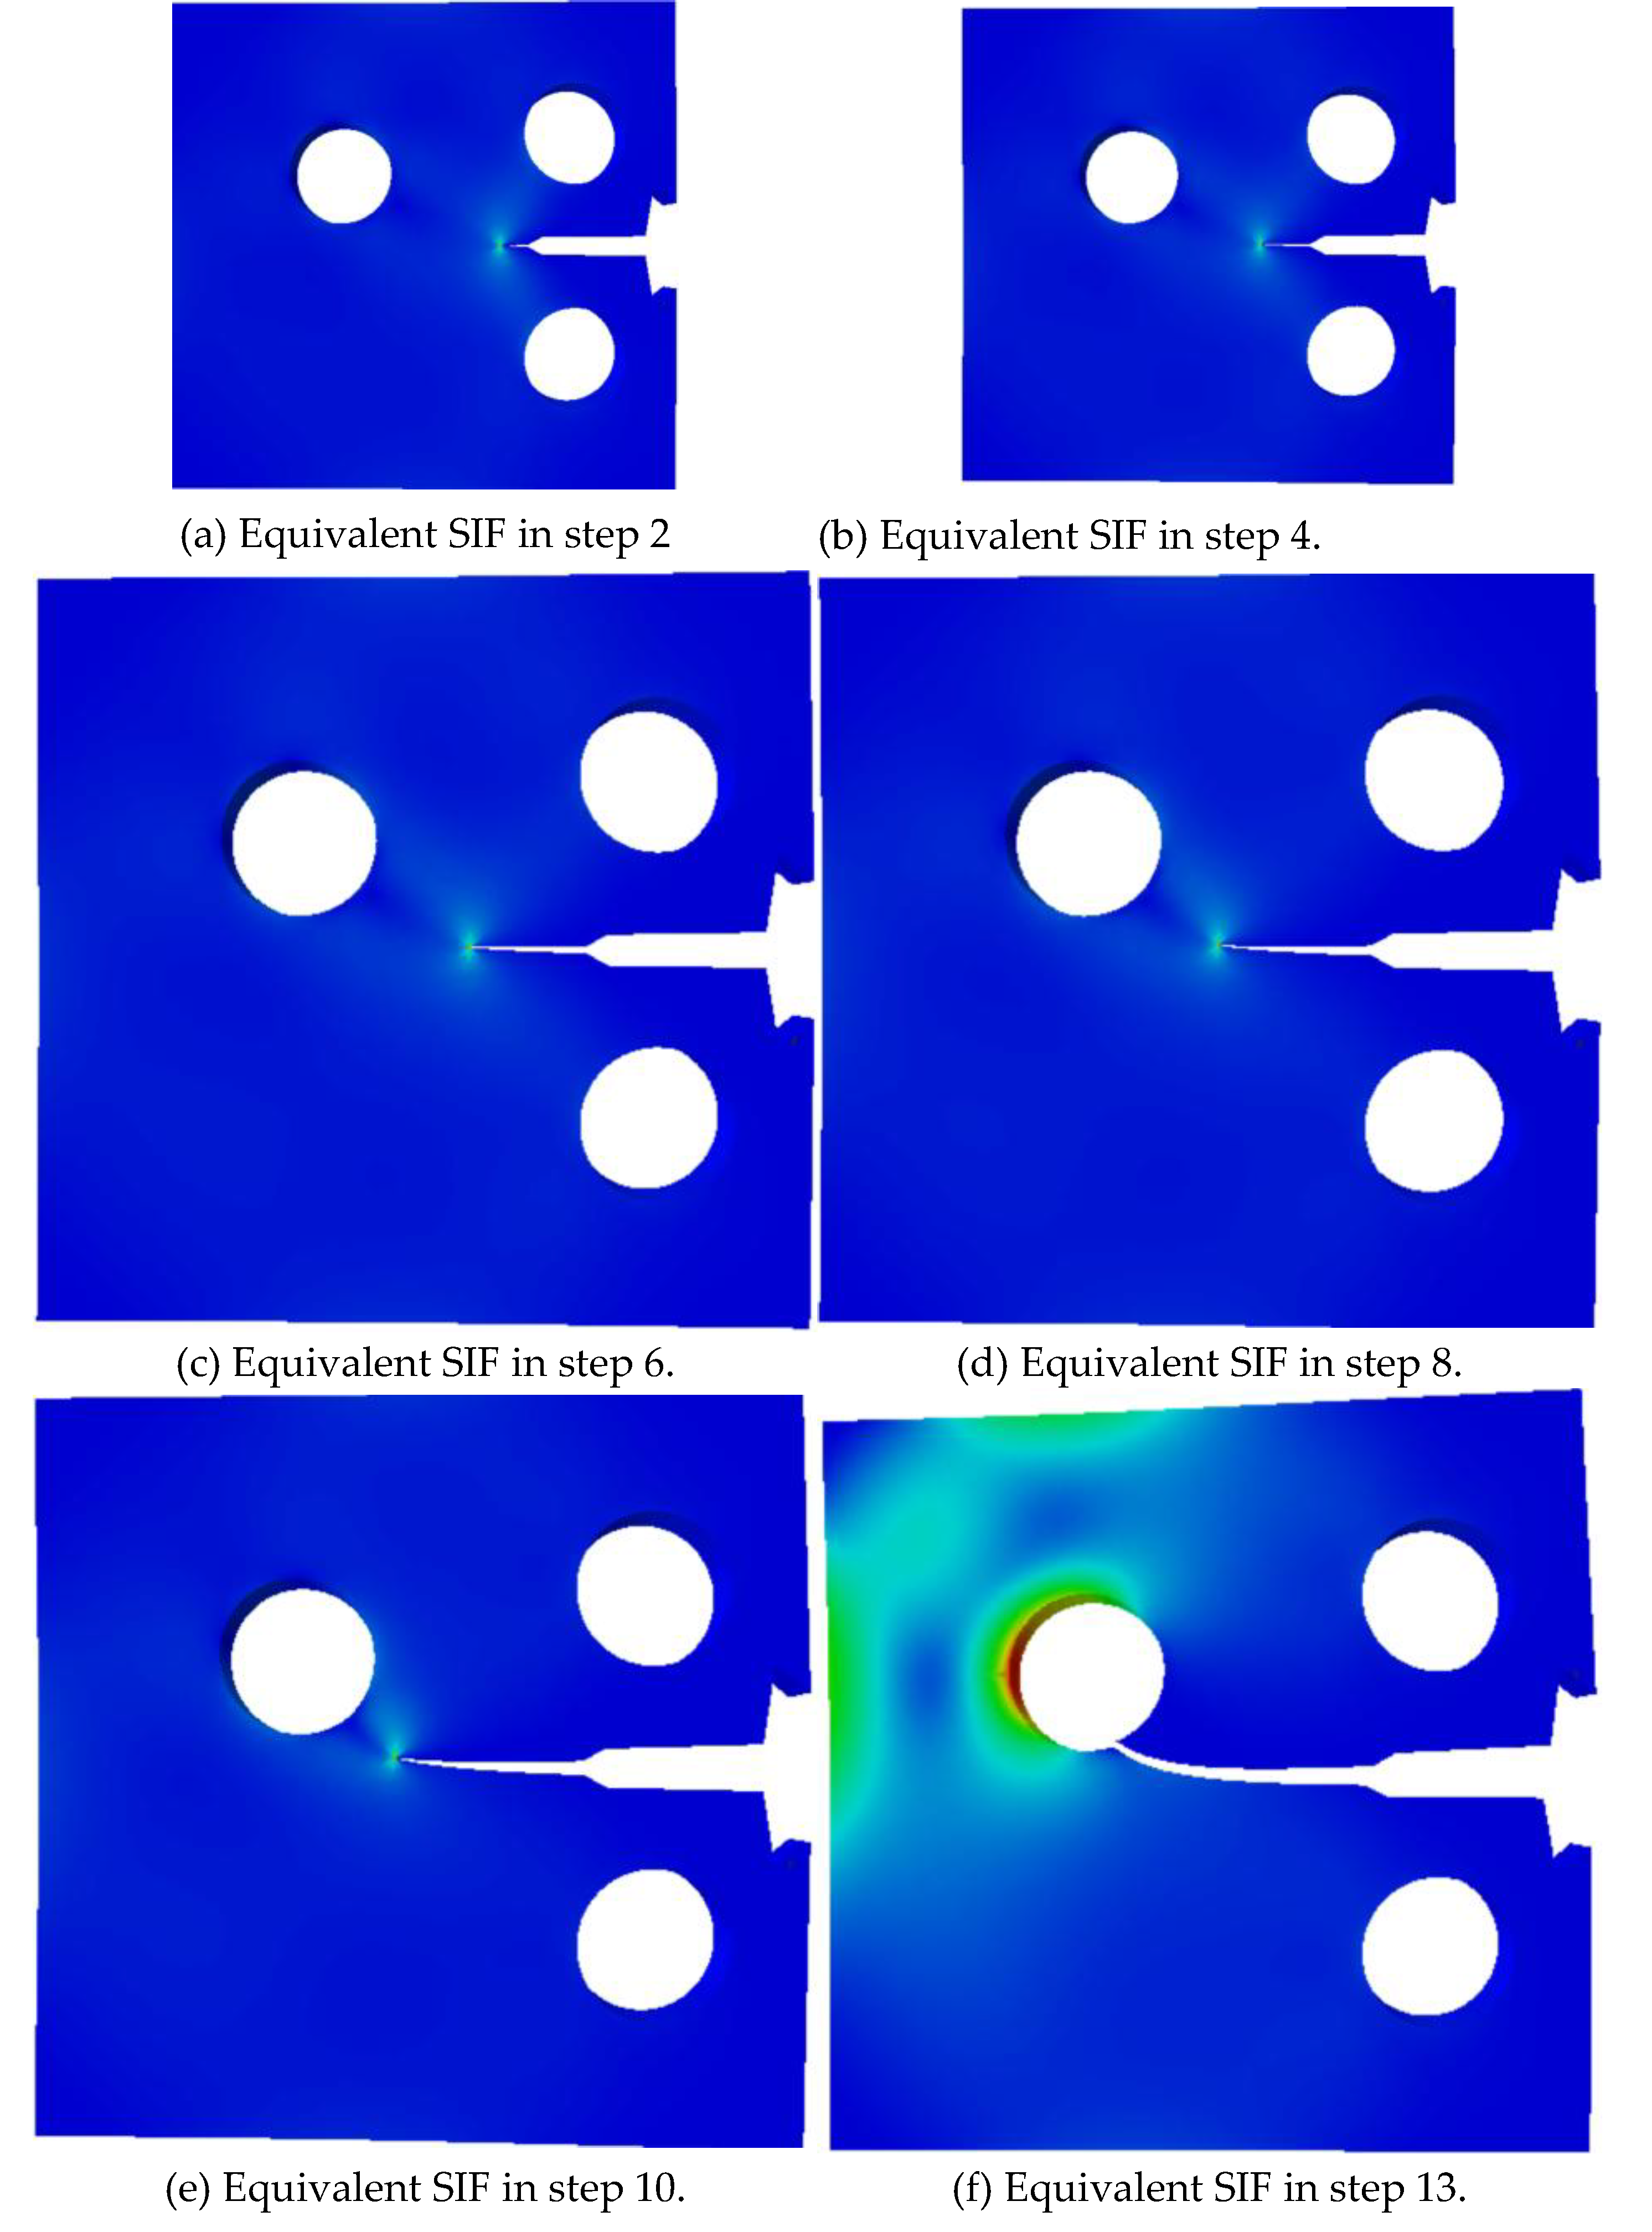
2.3. Modeling Multiple Fatigue Cracks

Multiple cracks are represented implicitly by collections of broken bonds. Interaction arises naturally as neighborhoods overlap, leading to deflection, shielding/amplification, and coalescence. No ad hoc coalescence rules are required.
As shown in Figure 4, in a state-based peridynamic (PD) solid, cracks are emergent sets of broken bonds rather than predefined geometric discontinuities. For a particle x with horizon H x , let B ( x , t ) H x be the time-dependent set of neighbors that have lost interaction with x. The internal force density excludes these inoperative interactions, producing automatic accommodation of discontinuities and natural interaction among multiple cracks.
f int ( x , t ) = H x \ B ( x , t ) T x x , t d V x
where multiple cracks are represented implicitly by the union of broken-bond sets B ( x , t ) = c B c ( x , t ) . Interaction arises naturally because different cracks remove different portions of the nonlocal neighborhood, altering f int , redistributing stresses, and changing the local driving force for further damage.
For a candidate bond ( x , ξ ) (where ξ = x x ), define the effective fatigue driving amplitude using closure-filtered, positive stretch,
s a eff ( x , ξ ) = s max ( x , ξ ) s min ( x , ξ ) +
where x is position of the material point (particle), x is position of its interacting neighbor, ξ = x x is reference bond vector between x and x . s max ( x , ξ ) and s min ( x , ξ ) are maximum/minimum bond stretch attained over one load cycle (dimensionless), + is macaulay bracket and y + = max ( y , 0 ) ,which removes purely compressive portions to account for crack closure, s a eff is effective fatigue driving amplitude (dimensionless), counting only the tensile (opening) part of the cycle.
The presence of other cracks modifies the local field; a simple, dimensionless interaction factor is,
I ( x , ξ ) = s a , int eff s a , iso eff = Δ d int Δ d iso 1 / m , Δ d = s a eff s c m Φ ( R )
where subscripts “int/iso” mean “with/without neighboring cracks”, m is fatigue exponent, s c is the static critical stretch, Φ ( R ) is a mean-stress correction, Δ d is per cycle damage increment, Δ d int and Δ d iso are per-cycle damage increments with/without neighboring cracks, and I 1 means shielding(reduced driving), I > 1 means amplification (enhanced driving).
A companion, energy-based measure uses a peridynamic J-like quantity (or equivalent SIF),
S ( x ) = J equ int J equ iso = Δ K equ int Δ K equ iso 2 , S 1 ( s h i e l d i n g ) , S 1 ( a m p l i f i c a t i o n )
where S ( x ) is energy-based shielding/amplification factor (dimensionless), J equ int and J equ iso are equivalent energy-release rates (peridynamic J-like measures), with and without neighboring cracks.
The presence of other cracks modifies the local field; a simple, dimensionless interaction factor is,
I ( x , ξ ) = s a , int eff s a , iso eff = Δ d int Δ d iso 1 / m , Δ d = s a eff s c m Φ ( R )
where subscripts “int/iso” mean “with/without neighboring cracks”, m is fatigue exponent, s c is the static critical stretch, Φ ( R ) is a mean-stress correction, Δ d is per cycle damage increment, Δ d int and Δ d iso are per-cycle damage increments with/without neighboring cracks, and I 1 means shielding(reduced driving), I > 1 means amplification (enhanced driving).
Growth direction at a front point x f can be obtained by maximizing the local fatigue work over sectors within the horizon. Let S α , Δ α be a sector centered at angle α , Define
W ( α ) = H x f S ( α , Δ α ) s ( x f , ξ ) + m ω ( ξ ) d V ξ
where S ( x ) is energy-based shielding/amplification factor (dimensionless), J equ int and J equ iso are equivalent energy-release rates (peridynamic J-like measures), with and without neighboring cracks.
with ω an influence function. The preferred direction is
α = arg max α W ( α )
which naturally accounts for asymmetric neighborhoods caused by nearby cracks (nonlocal steering) and thus predicts deflection without special crack-tip criteria.

3. Prediction Model for Crack Interaction

3.1. Geometry, Loads, and Boundary Conditions

The Modified Compact Tension (MCT) specimen is characterized by width W, thickness B, and an evolving crack length a(t) measured from the notch root. The net load-bearing ligament is
l ( t ) = W a ( t )
Two circular pin holes of diameter D are centered at a grip span S. For convenience, the geometry is described by the dimensionless ratios
α ( t ) = a ( t ) W , λ ( t ) = l ( t ) W = 1 α ( t ) , δ p = D W
together with additional ratios such as hole offset, notch-root radius and groove depth.
The external boundary Γ is decomposed into loading, fixture, and traction-free parts,
Γ = Γ L Γ F Γ free   ,
where Γ L denotes the pin-loaded edges, Γ F the fixture/support region, and Γ free   the remaining free boundaries.
A cyclic pin load of mean value P m and amplitude Δ P / 2 is applied,
P ( t ) = P m + Δ P 2 sin ( 2 π f t ) ,
where f is the loading frequency, Δ P = P max P min and the stress ratio is R = P min / P max . The nominal net-section stress across the ligament is
σ nom ( t ) = P ( t ) B l ( t )
K I ( t ) = P ( t ) B W F α ( t ) , δ p ,
where F ( ) is the MCT geometry function, and the ellipsis denotes any additional nondimensional parameters (hole offset, notch radius, groove ratio, etc.). The associated energy-release rate is
For the MCT geometry, the mode-I stress intensity factor is written as
G ( t ) = K I 2 ( t ) E
with E the effective modulus(plane stress: E = E ; plane strain: E = E / 1 ν 2 ).
u ¯ ( t )
P ( t ) = u ¯ ( t ) C ( a )
where C ( a ) is the specimen compliance as a function of crack length. This ensures equivalence of load- and displacement-controlled protocols through the relationships P K I →G.
To enforce PD-consistent boundary conditions, the resultant load P ( t ) is distributed as an equivalent traction t n ( t ) over the loading patch Γ L , and then mapped onto a nonlocal “loading skin’’ of thickness so that the nonlocal boundary work matches the classical resultant. On the fixture patch Γ F , appropriate supports or anti-rigid-body constraints are applied; the remaining boundary Γ f r e e is traction-free.
Given the prescribed history P ( t ) or u ¯ ( t ) , two fatigue drivers are used: a bond-level peridynamic driver based on the closure-filtered positive stretch range, and an LEFM-level driver based on Δ K . These are consistent in the sense that Δ P is mapped to Δ K via the MCT geometry, and the effective bond stretch is obtained from the nonlocal kinematics under the same boundary data. All geometric ( B , W , D , S , ) , material ( E , ν ) , and loading P max , P min , f parameters are set equal to the experimental values to enable one-to-one comparison of predicted K , G , and peridynamic damage measures.

3.2. Numerical Procedure and ADR Scheme

The state-based peridynamic equations of motion are integrated with an explicit central-difference scheme, and quasi-static equilibria at each load (or cycle) increment are obtained by Adaptive Dynamic Relaxation (ADR). Let m i denote the lumped mass associated with particle i and f i n the total force (peridynamic internal force plus external/body force) at time level t n . The ADR displacement update can be written as
u i n + 1 = u i n + Δ t v i n + Δ t 2 m i f i n α n v i n ,
where u i n and v i n are the displacement and pseudo-velocity of particle i at step n , Δ t , and α n is an adaptive damping coefficient chosen at each iteration to approach critical damping of the dominant quasi-static mode while maintaining stability. In practice, α n is estimated from energy or residual measures so that the discrete total energy decays monotonically toward equilibrium.
A CFL-type stability bound controls the time step,
Δ t γ Δ c d , c d = 3 κ + 4 μ ρ
where Δ is the particle spacing, κ and μ are the bulk and shear moduli, ρ is the mass density, c d is the dilatational wave speed, and γ < 1 is a user-selected safety factor. The horizon–spacing ratio δ / Δ is kept fixed under refinement to preserve consistent nonlocal resolution.
Within each load increment, ADR iterations continue until a quasi-static stopping criterion is met, e.g.
f n f 0 ε f   and   u n u n 1 u n ε u ,
where f n denotes the global residual force vector (which tends to zero at equilibrium), and ε f , ε u are prescribed tolerances.
After each converged increment (or after a specified number of counted cycles under spectrum loading), fatigue variables are updated. Bond stretches are extracted to form the closure-filtered amplitude s a eff , and the remaining bond life is advanced according to the chosen fatigue law. Bonds satisfying the fatigue-failure condition or a static rupture criterion are irreversibly broken. The ADR loop is then restarted within the same increment until no additional bonds fail. This in-cycle re-equilibration ensures that crack growth, deflection, shielding/amplification, and possible coalescence are captured consistently with the evolving nonlocal neighborhoods.

3.3. Implementation Details

3.3.1. Discretization and Horizon

A uniform particle spacing Δ and fixed horizon δ are adopted. In 2D plane-stress simulations, each particle represents a control area Δ 2 and an effective volume V i = B Δ 2 ; in 3D, the control volume is V i = Δ 3 . The average neighbor count scales with the horizon–spacing ratio δ / Δ ; for a circular (spherical) neighborhood,
N nbr π δ Δ 2 ( 2 D ) , N nbr 4 π 3 δ Δ 3 ( 3 D ) ,

3.3.2. Influence Function and Moment Normalization

A radial influence ω ( ξ ) (e.g., constant or tapered for 0 ξ δ ) is used to define the weighted second moment
m = H δ ω ( ξ ) ξ 2 d V
which appears in the ordinary state-based force and energy states. The dilatational and deviatoric moduli (κ,μ) are chosen to be consistent with the target isotropic elastic pair (E, ν) via standard correspondence relations, and the discrete force/energy states are scaled so that the small-strain PD energy density recovers the Cauchy elastic energy. This moment consistency eliminates spurious boundary softening and ensures the intended elastic response.

3.3.3. Fracture-Energy Calibration

The fatigue/rupture threshold in the state-based PD model is calibrated by equating the nonlocal fracture work to the material fracture energy G c . Let w c denote the critical bond-level energy density at failure. Requiring the energy consumed per unit crack area to equal G c yields, schematically,
G c = H δ w c K ( ξ ) d V
where K ( ξ ) is a kernel depending on the horizon and influence function. From this relation, a static critical measure (e.g., critical stretch s c or an equivalent energy-state threshold) is obtained. Together with the fatigue parameters ( m , Φ ( R ) ) , this critical value governs both instantaneous rupture and the cycle-wise damage increments.
Drawing on the preceding assessment of conventional and peridynamic fatigue-crack models, a workflow for crack nucleation and subsequent propagation is formulated, as outlined in Figure 5.

4. Analysis of Model Parameters

4.1. Discretization and Horizon Size

A mesh–horizon study is carried out to select the particle spacing and peridynamic horizon used in all subsequent simulations. The discretization is defined by the particle spacing Δ, and the nonlocal length scale is the peridynamic horizon δ. Their ratio is written as
η δ = δ Δ
where η δ is the horizon–spacing ratio (dimensionless), δ is the horizon radius, and Δ is the particle spacing.
For each choice of (Δ, δ) with fixed η δ , the solution is compared against a reference solution computed on the finest mesh. The relative error in displacement is measured as
e u ( Δ ) = u Δ u ref 2 u ref 2
where u Δ is the displacement field obtained on a mesh with spacing Δ, u r e f is the displacement field on the finest reference mesh, and · 2 denotes the discrete L2 norm.
A hotspot error in equivalent stress is also monitored over a selected region H (e.g., notch root, hole edge, and ligament)
e σ ( Δ ) = max x H | σ eq , Δ ( x ) σ eq , ref ( x ) | max x H σ eq , ref ( x )
where σ eq , Δ ( x ) is the equivalent (e.g., von Mises) stress at location x computed on spacing Δ, σ eq , ref ( x ) is the equivalent stress on the reference mesh, and H is the hotspot set in which the maximum difference is evaluated.
A discretization is regarded as converged when both the displacement error and hotspot stress error fall below prescribed tolerances,
e u ( Δ ) ε u , e σ ( Δ ) ε σ
where ε u and ε σ are user-selected tolerances for displacement and stress, respectively (dimensionless). Based on this study, a single horizon–spacing ratio η δ and particle spacing Δ are adopted in all subsequent simulations to balance accuracy and computational cost.

4.2. Fatigue Damage Theory

To avoid unphysical burst failures and maintain reasonable runtime, the number of newly broken bonds in each load increment is limited. Let N f a i l , t o t , be the total number of bonds that would fail in the current increment if no cap were imposed. A global cap is defined as
  N f a i l , t o t     N c a p
where N c a p is the maximum number of bonds allowed to fail per increment (dimensionless count).
n fail , i n cap
where n c a p is the maximum number of broken bonds allowed for any single particle in one increment (dimensionless count
N fail , tot f cap N act
where f c a p is a dimensionless fraction (e.g., a few percent).
B = { indices   of   the   N cap   bonds   with   largest   Δ d j }
All bonds indexed in B are set to the failed state, and the system is re-equilibrated before proceeding
Δ d = s a eff s c m Φ ( R )
where s a eff is the effective fatigue driving amplitude (closure-filtered positive stretch for the bond, dimensionless), s c is the static critical stretch or equivalent critical energy threshold (dimensionless), m is the fatigue exponent (dimensionless), Φ(R) is a mean-stress (load-ratio) correction function (dimensionless), and R   =   P m i n   /   P m a x is the load ratio (dimensionless).
Sensitivity studies show that moderate values of N c a p , n c a p , and f c a p yield robust crack paths and fatigue lives while keeping the computational cost acceptable.

4.3. Material and Fatigue Parameter Identification

The peridynamic elastic parameters are identified from the target isotropic pair (E, ν). The bulk modulus κ and shear modulus μ are obtained via
κ = E 3 ( 1 2 ν ) , μ = E 2 ( 1 + ν )
where E is the Young’s modulus, ν is the Poisson’s ratio (dimensionless), κ is the bulk modulus and μ is the shear modulus.
The ordinary state-based peridynamic force and energy states are scaled using the second moment of the influence function so that the small-strain peridynamic energy matches the classical Cauchy elastic energy. The weighted second moment is defined as
m 0 = H δ ω ( ξ ) ξ 2 d V
where H δ is the horizon region of radius δ, ω(ξ) is the radial influence function (dimensionless), ξ = ξ is the bond length in the reference configuration, and d V is the volume measure. The force-state coefficients are then chosen such that the peridynamic strain energy density W P D satisfies
      Ω   W P D   d V = Ω   W C a u c h y   d V   ,
where Ω is the body domain, W P D is the peridynamic strain-energy density, and W C a u c h y is the classical Cauchy strain-energy density.
The static failure threshold (e.g., a critical stretch Sc or a critical energy state) is set by equating the nonlocal fracture work to the material fracture energy Gc . Introducing a critical bond energy density Wc(ξ) , the area-equivalence condition is
s c G c w c ξ G c = H δ w c ( ξ ) K ( ξ ) d V
where G c is the fracture energy, ξ is the energy density needed to break bonds at radial distance ξ , K ξ is a kernel function determined by the horizon and influence function (dimensionless), and d V is the volume element. This relation fixes the static rupture level s c consistently with the target G c .
At the bond level, the remaining life n r (in cycles) is updated after each counted cycle. Let n r ( k ) be the remaining cycles to failure for a bond after k cycles and Δ d ( k ) the damage increment in cycle k. A simple cumulative-damage update is
n r ( k + 1 ) = n r ( k ) Δ d ( k )
where n r ( k ) and n r ( k + 1 ) remeasured in cycles, and Δ d ( k ) is the dimensionless damage per cycle as defined earlier. Crack initiation is declared when the minimum remaining life among all bonds falls to zero or below:
min bonds n r ( k ) 0
For constant-amplitude loading with a single damage increment Δ d per cycle, the predicted cycles to initiation N i satisfy
N i Δ d = 1
where N i is the cycles to initiation (cycles), and Δ d is the dimensionless damage per cycle.
To calibrate the fatigue parameters (e.g., exponent m and mean-stress function Φ(R)) from an S–N dataset {( σ a , j , N i , j exp )}, the nominal or hotspot stress/strain amplitude σ a , j is mapped to a peridynamic driving amplitude s a , j e f f at the critical region (e.g., the 95th percentile around the notch). The predicted initiation life N i , j exp follows from the constant-amplitude relation above. The parameters are chosen to minimize the misfit
J = j [ log N i , j pred log N i , j exp ] 2
where J is a dimensionless least-squares objective, N i , j pred is the predicted cycles to initiation for data point j, and N i , j exp is the corresponding experimental life.
For variable-amplitude spectra (e.g., after rainflow counting), Miner-type consistency at initiation is enforced as k w k Δ d k = 1 where w k is the cycle weight in bin k (1.0 for full cycles, 0.5 for half cycles), and Δ d k is the damage increment for bin k. This condition reduces to N i   Δ d =   1 for constant amplitude.

5. Model Verification

The proposed peridynamic (PD) formulation is verified along three axes—quasi-static elastic response, crack-initiation prediction, and local stress concentration—using the same geometry, material constants, and boundary conditions as in the reference finite-element (FEM) and experimental datasets.

5.1. Quasi-Static Response

With identical boundary conditions, PD results are compared to FEM benchmarks using displacement- and reaction-force–based error norms. The relative displacement error is defined as
e u = u PD u FEM 2 u FEM 2
where e u is the displacement error (dimensionless), u PD and u FEM are the nodal (or particle) displacement vectors from PD and FEM, respectively, and 2 denotes the discrete Euclidean L 2 norm over all degrees of freedom.
e R = R PD R FEM 2 R FEM 2
where e R is the reaction-force error (dimensionless), R PD and R FEM are the global reaction-force vectors on the loading and fixture boundaries obtained from PD and FEM, respectively, and 2 is again the Euclidean norm.
To assess stiffness consistency, a compliance error is also monitored:
e C = | C PD C ref | C ref
where e C is the compliance error (dimensionless), C PD is the specimen compliance extracted from a reference-point displacement under a reference load in PD, and C ref is the corresponding compliance obtained from the FEM benchmark or an analytical solution.
For the MCT benchmarks considered, the errors e u , e R , and e C remain small, establishing elastic fidelity of the correspondence-based PD formulation under the adopted discretization and horizon.

5.2. Initiation Sites and Lives

Crack initiation in the PD model is detected through a particle-level damage variable that measures the fraction of broken bonds attached to each particle. For particle i, the local damage is defined as
d i = 1 N intact , i N 0 , i = N broken , i N 0 , i
where d i is the damage at particle i (dimensionless), N intact , i is the number of intact bonds in the horizon of particle i, N broken , i is the number of broken bonds attached to particle i, and N 0 , i is the initial number of bonds in its horizon ( N 0 , i = N intact , i + N broken , i ).
A crack is said to nucleate once the damage exceeds a critical threshold over a connected cluster of particles of sufficient size. Denoting the critical damage fraction by d c (dimensionless), initiation is declared when
d i d c for   all   i C
where C is a connected set of particles representing the emerging crack nucleus. The spatial location of initiation is identified by the cluster C with the largest damage, which typically concentrates near the notch root or hole edge in the MCT geometry.
Let N i pred denote the predicted number of cycles to initiation and N i exp the experimental value obtained from MCT tests. A relative life error is defined as
e N = | N i pred N i exp | N i exp
where e N is the initiation-life error (dimensionless), N i pred is the PD-predicted cycles to initiation, and N i exp is the experimentally measured cycles to initiation. Across the MCT cases examined, e N typically lies within 10–15%, and the predicted initiation sites coincide with the experimentally observed hot spots, consistent with classical fatigue criteria based on local stress/strain localization.

5.3. Stress Concentration

To quantify local amplification near the notch or hole edge, a Cauchy stress tensor is recovered from the correspondence-based PD formulation. From this, an equivalent stress concentration factor is defined as
K t = σ max σ nom
where K t is the equivalent stress concentration factor (dimensionless), σ max is the peak equivalent stress (e.g., von Mises or principal stress) in the hot-spot neighborhood reconstructed from PD and σ nom is the nominal net-section stress. For an MCT specimen, the nominal stress can be written as
σ nom = P B l = P B ( W a 0 )
where P is the applied load (N), B is the specimen thickness, l is the net-section ligament length, W is the specimen width, and a 0 is the initial crack or notch length used to define the current ligament l = W a 0 in the uncracked configuration.
Agreement between PD-derived and reference concentration factors is quantified by a relative error metric
e K t = | K t , PD K t , ref | K t , ref
where e K t is the concentration-factor error (dimensionless), K t , PD is the concentration factor computed from the PD solution, and K t , ref is the corresponding value obtained from closed-form notch solutions or high-resolution FEM. For the MCT benchmarks, e K t remains small, confirming that the PD model, under the same geometry and boundary conditions, reproduces local stress amplification reliably.

6. Numerical Simulations and Experiments

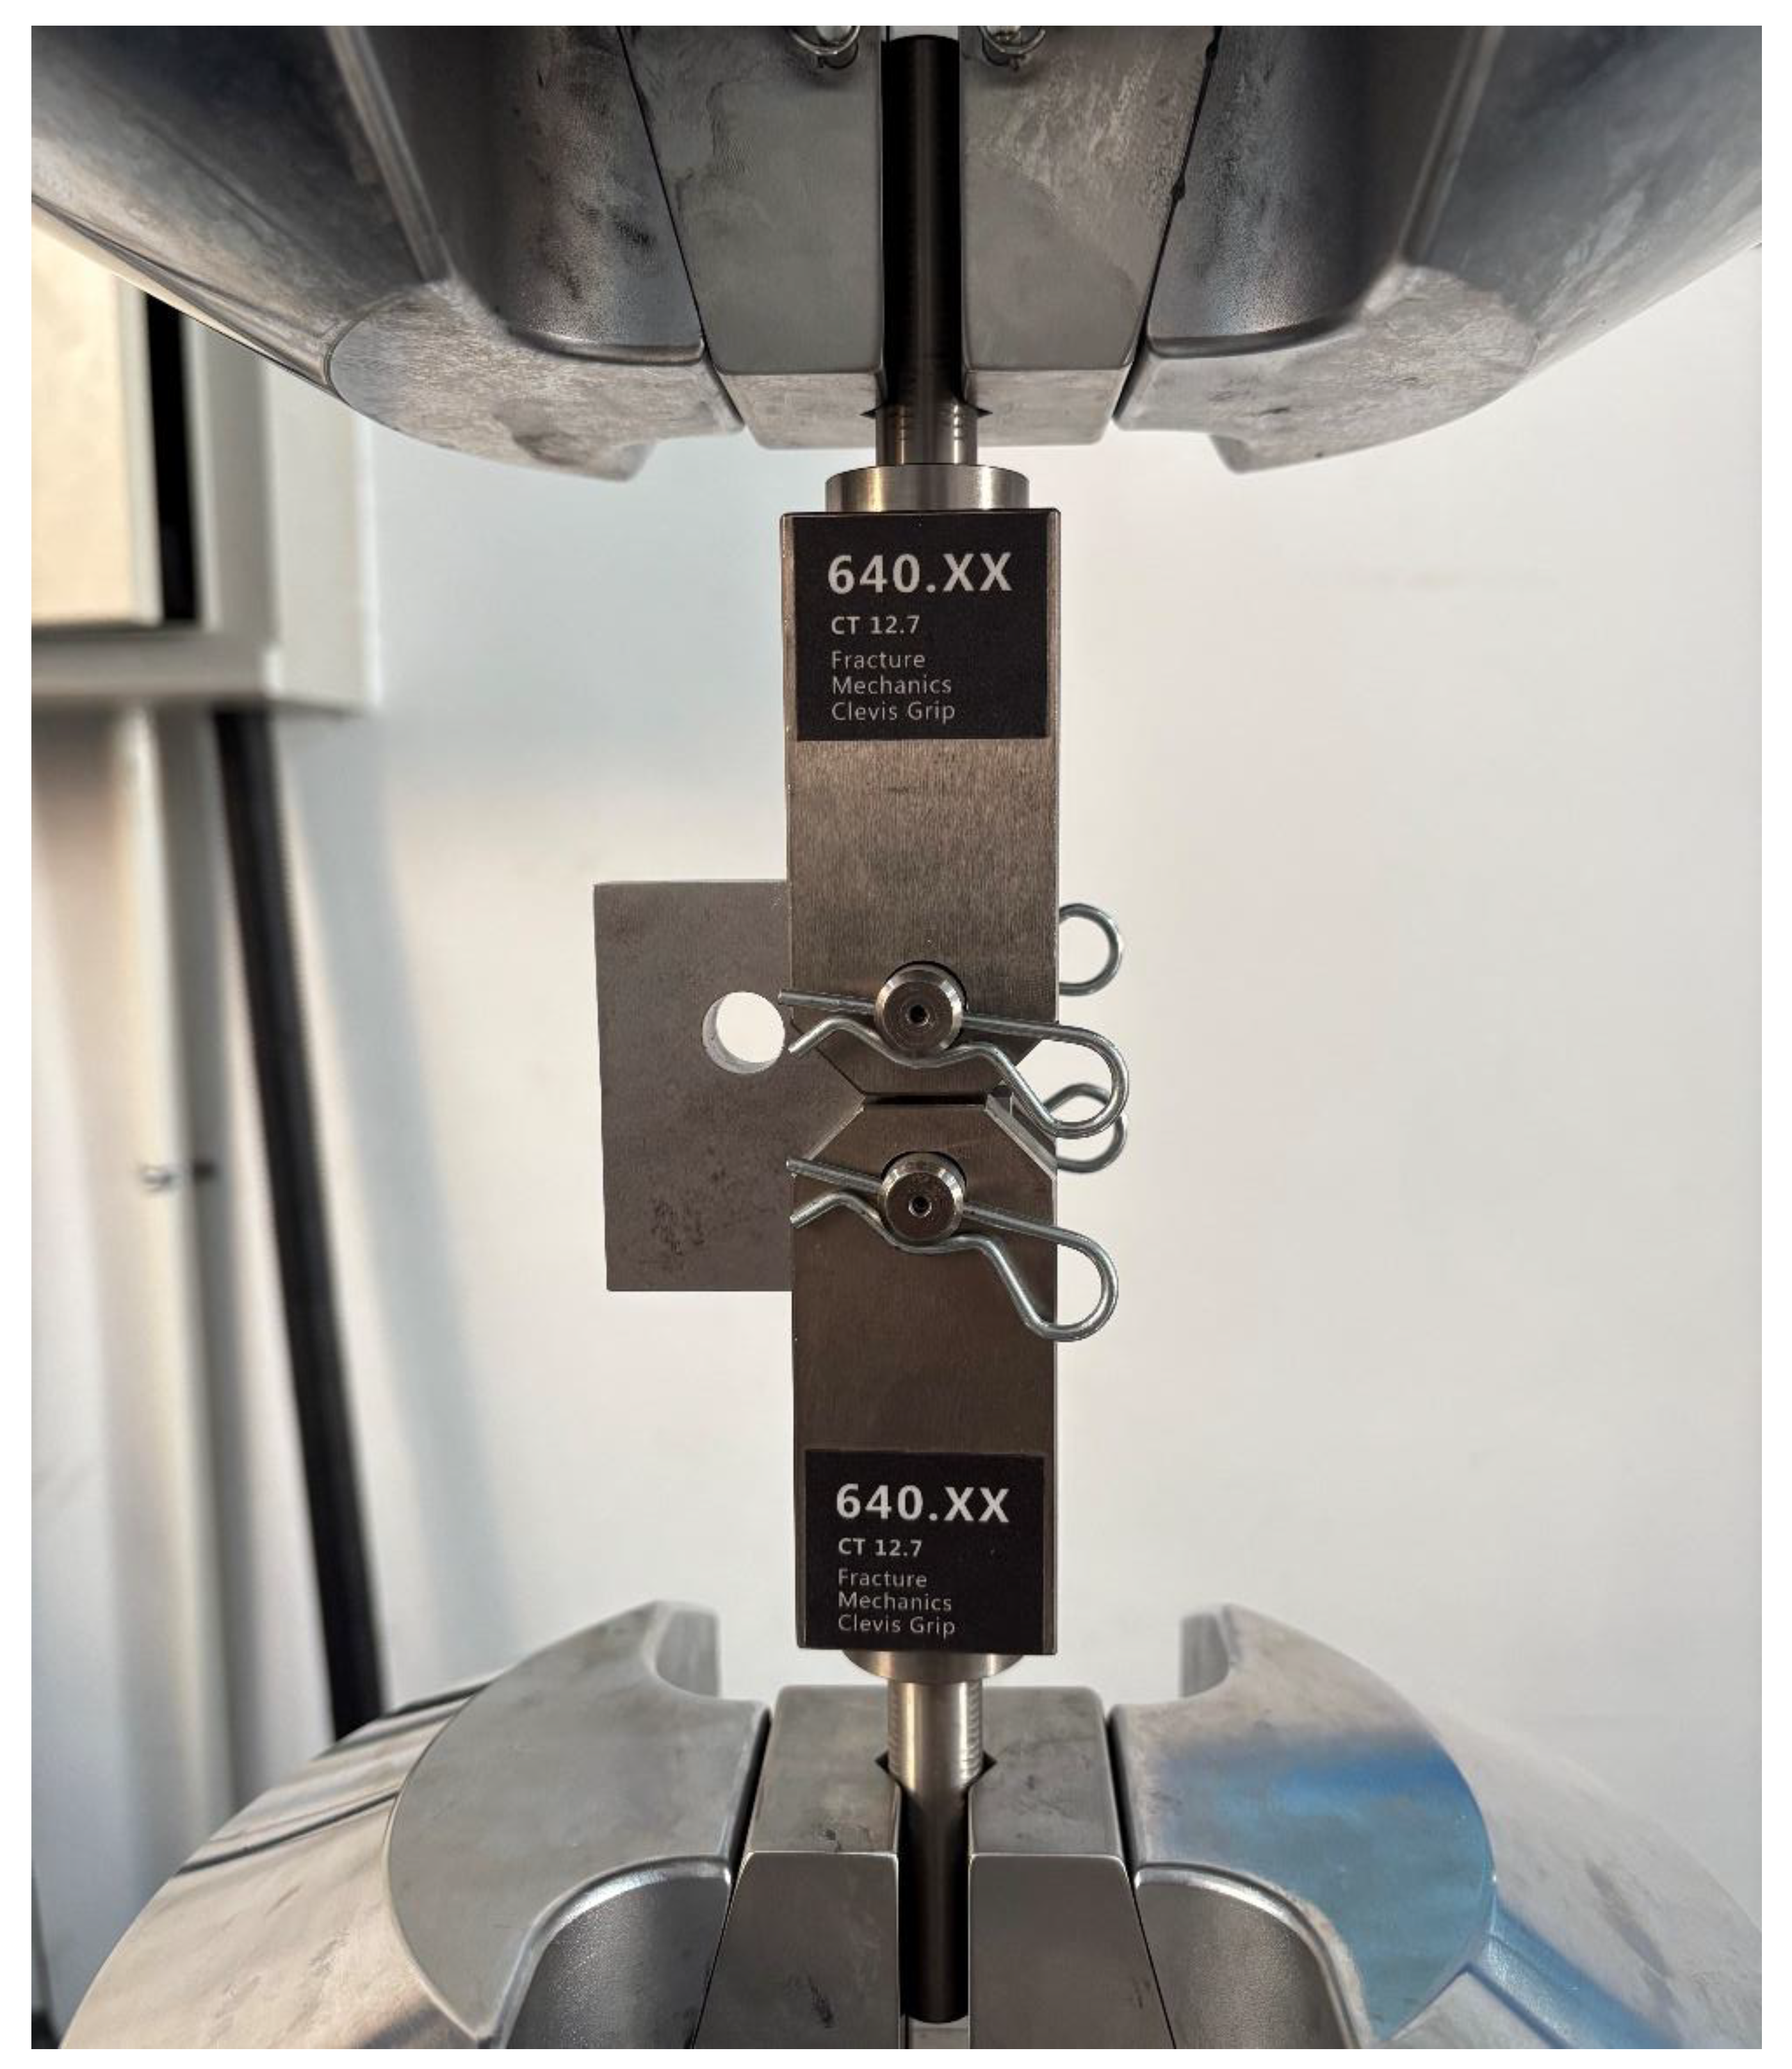
6.1. Fatigue Testing Platform

As shown in Figure 6, fatigue tests on pin-loaded MCT specimens were carried out using an MTS servo-hydraulic fatigue testing machine. The system converts hydraulic power into axial cyclic loading through a servo actuator and transfers it to the specimen via dedicated pin-loading fixtures, enabling controlled loading and high-precision monitoring throughout crack initiation and propagation. The frame has a rated capacity of 25 tons (≈ 250 kN) and a maximum cyclic frequency of 50 Hz. Closed-loop load, displacement, and strain control modes are available, and sinusoidal, triangular, square, or user-defined waveforms can be programmed. Both constant-amplitude and variable-amplitude spectra are applied at prescribed stress ratio R = P min / P max , load range Δ P = P max P min , and frequency f, subject to thermal and rate-effect limits. Overload and over-travel protections, together with real-time status monitoring, ensure test safety and data quality.
To reproduce pin-loaded boundary conditions and obtain stable crack paths under repeatable constraint, the platform integrates three main subsystems:
(a) Loading and control unit.
A high-stiffness dual-column frame, servo-hydraulic actuator, and digital closed-loop controller deliver precise cyclic loading and process control. A capacity-matched load cell and displacement transducer provide feedback for closed-loop control and for data logging.
(b) Fixture and alignment unit.
A dedicated MCT pin-loading fixture, equipped with high-strength loading pins and a self-aligning configuration, is used together with alignment-correction and lateral-constraint components to suppress secondary bending and eccentricity. This arrangement ensures that the load axis coincides with the specimen’s geometric axis. Fixture clearance and surface finish are controlled according to standard practice to minimize friction and fit-gap effects on crack path evolution.
(c) Measurement and data acquisition unit.
A high-resolution data acquisition system synchronously records load, displacement, and cycle count. Depending on the test plan, a clip-on gauge for crack-mouth opening displacement (CMOD) or an optical/digital image correlation (DIC) system is installed to capture crack opening and crack-path kinematics. Crack length is identified and calibrated using compliance or imaging-based procedures.
On this basis, MCT geometric parameters (initial notch and radius, pin-hole offset, ligament width, and optional side grooves) can be parametrically configured according to the study design, and loading spectra (constant or variable amplitude, stress ratio, and frequency) can be programmed to match target conditions. The configuration enables stable, instrumentable crack growth under engineering-relevant constraint, ensures repeatable measurement of crack path and growth rate, and provides high-quality experimental data for subsequent model calibration and fatigue life assessment.

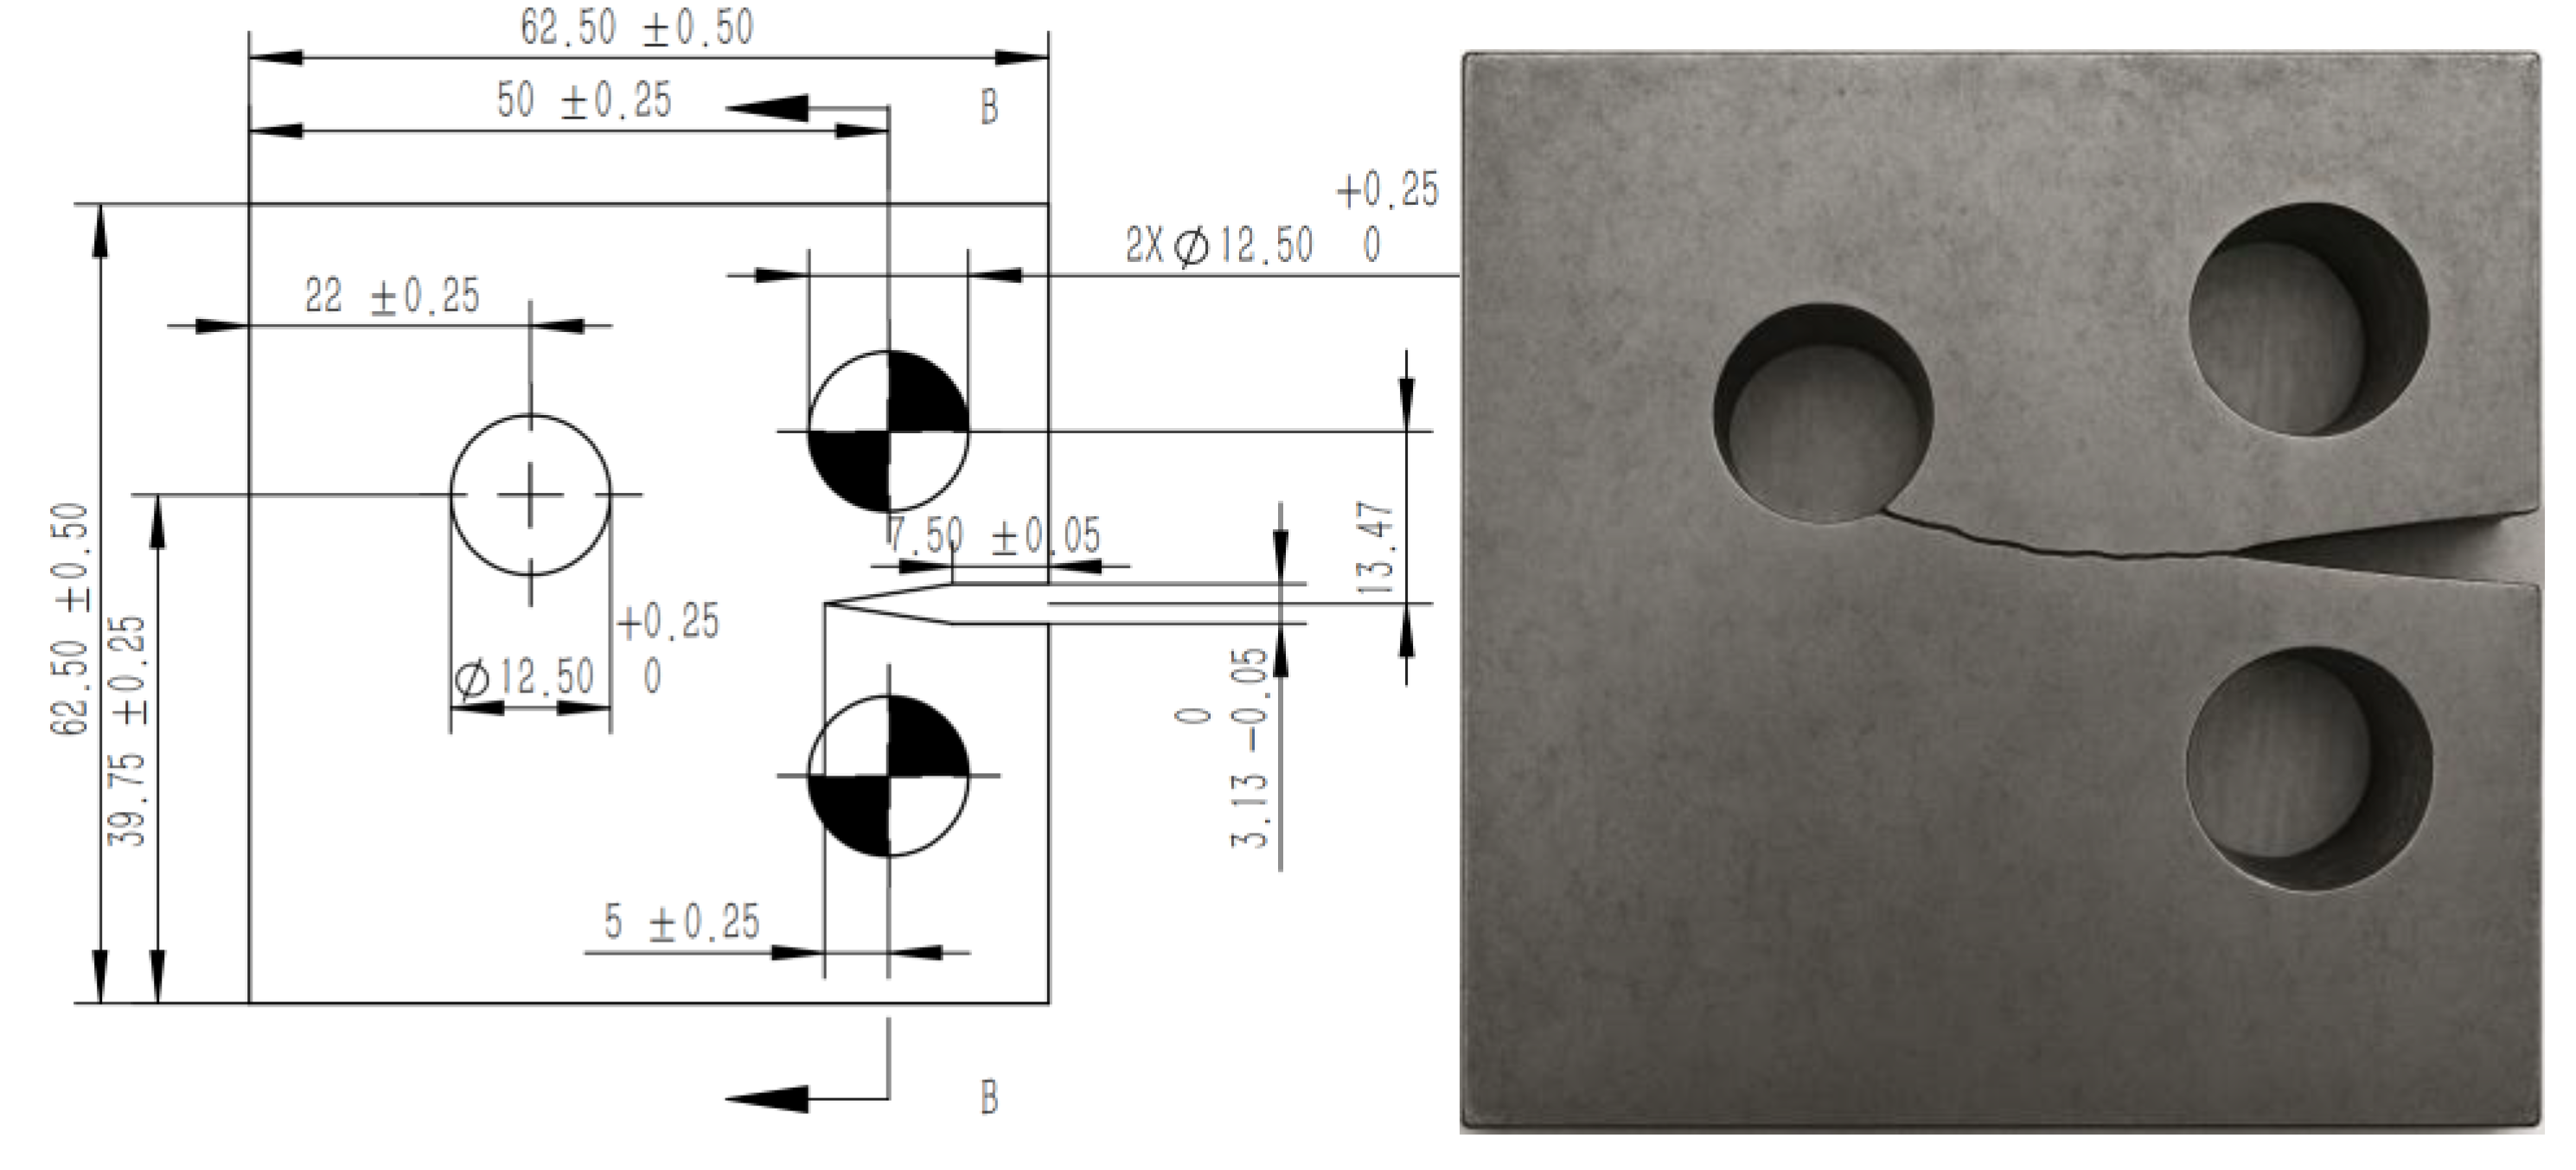
6.2. Loading Parameters and Geometric Configuration

For each test, the loading history is described by P max , P min , the stress ratio R = P min / P max , the load range Δ P = P max P min , and the loading frequency f. Constant-amplitude and variable-amplitude spectra are used to represent service-like conditions under controlled thermal and rate constraints.
Key geometric parameters of the MCT configuration (specimen width W, thickness B, pin-hole diameter and spacing, initial notch length, ligament width) are summarized in Table 1. These parameters are chosen to produce a representative combination of constraint, mixed-mode content, and interaction between notch, pin hole, and ligament.
The MCT specimens were machined from 0Cr13Ni5Mo martensitic stainless steel, a runner-blade material commonly used in hydro turbines. This alloy is a low-carbon Cr–Ni–Mo martensitic stainless steel, typically containing about 13 wt.% Cr, 4–6 wt.% Ni and a small Mo addition, with carbon content controlled at a low level to improve toughness and weldability. After appropriate heat treatment (solution treatment followed by tempering), the microstructure consists mainly of tempered martensite with a small amount of retained austenite, providing a balanced combination of strength, fracture toughness and corrosion resistance in water environments. These characteristics make 0Cr13Ni5Mo particularly suitable for investigating fatigue crack initiation and growth in turbine runner components under cyclic bending and mixed-mode loading. The main mechanical properties of the steel used in this study (Young’s modulus, yield strength, ultimate tensile strength, hardness, and fatigue strength) are summarized in Table 2.

6.3. Modeling Multiple Fatigue Cracks

Under cyclic pin loading, multiple cracks nucleate around stress concentrators and interact as their nonlocal fields begin to overlap. In the present MCT configuration, microcracks first appear near the notch root and hole edge; as the cycles accumulate, they deflect toward the ligament and merge into a dominant crack, shortening fatigue life relative to isolated-crack scenarios. The macroscopic crack pattern observed on the tested specimen is shown in Figure 6.
The corresponding peridynamic simulations reproduce this behavior. Figure 7 illustrates the evolution of the fatigue crack at several representative iterative steps (e.g., steps 2, 4, 6, 8, 10, and 13). At early steps, small cracks initiate and grow locally; with further cycling, the cracks extend toward the ligament, undergo deflection, and ultimately coalesce into a main crack. The damage maps and equivalent stress-intensity-factor (SIF) distributions highlight the gradual transition from distributed micro-damage to a dominant macro-crack.
Figure 8 shows the equivalent SIF along the crack front at selected steps together with the relationship between crack-growth step and cycle count. For each specified iteration, the distribution of the equivalent SIF along the crack front reflects local shielding and amplification due to geometric features and neighboring cracks. As the crack grows, the peak value and spatial variation of the equivalent SIF increase, consistent with the observed acceleration in crack-growth rate. Comparisons between simulation and experiment (in terms of crack path, sequence of coalescence, and qualitative SIF trends) demonstrate that the peridynamic fatigue model captures the main features of crack initiation, deflection, and interaction in the MCT specimen.
Smaller hole spacing in the parametric studies leads to earlier crack interaction and faster coalescence, whereas larger hole diameter increases the local stress-concentration factor and advances initiation. These trends provide actionable guidance for geometry optimization of pin-loaded components.
Figure 9. Simulation results of fatigue crack with based on OSPD fatigue model. (a) Crack propagates under iterative step =2; (b) Crack propagates under iterative step=4; (c) Crack propagates under iterative step=6; (d) Crack propagates under iterative step=8; (e) Crack propagates under iterative step=10; (f) Crack propagates under iterative step=13.
Preprints 185621 g009

6.4. Experimental Validation

(1) Crack initiation and life partition
Macroscopic crack marking combined with CMOD/DIC measurements confirms that the improved MCT specimen initiates a primary crack at the notch root under pin-loaded cyclic loading. The cycle counts corresponding to first detectable initiation, subsequent stable growth, and through-ligament penetration are listed, enabling a clear separation of initiation life and propagation life.
(2) Statistics of fatigue life
As summarized in Table Z, the mean cycles to initiation are N ¯ i , and the mean cycles for through-ligament propagation are N ¯ p , with total life N ¯ f = N ¯ i + N ¯ p . The dispersion, reported as the coefficient of variation, remains modest across the tested stress ratios R, indicating that the present fixturing, alignment, and surface preparation yield repeatable constraint conditions and stable crack paths from test to test.
(3) Crack-path comparison between experiment and simulation
Crack trajectories extracted from Figure X (experiment) and Figure W (PD simulation) show that the angle between the crack path and the reference ligament axis is θ exp on average, while the simulation predicts θ PD with a deviation θ PD θ exp Δ θ within a few degrees. Path curvature near the notch root and subsequent deflection toward the pin hole are reproduced, and the temporal sequence of crack-marking bands matches the recorded cycle counts within experimental resolution.
(4) Driving-force evolution and mode mix
For fixed geometry, this equivalent measure scales approximately linearly with load amplitude; for larger initial or notch-root crack lengths, the absolute level of the equivalent SIF is higher. Under identical crack length and load, the mode-I component dominates the in-plane shear and out-of-plane components( K I K I I , K I I I ), indicating that opening-mode loading controls fracture in the present pin-loaded MCT configuration. Mixed-mode contributions are secondary and depend primarily on hole offset and local constraint. These trends are consistent between experiment and PD simulation and support the use of the improved MCT as a stable, instrumentable benchmark for fatigue-life evaluation and for calibration/validation of the peridynamic fatigue model.

7. Conclusions

A state-based peridynamic fatigue framework is presented for MCT specimens. The model reproduces quasi-static fields, initiation sites, multi-crack interaction and coalescence, and with close agreement to FEM and experiments. Parametric studies quantify the effects of load ratio, amplitude, hole spacing, and diameter, providing guidance for fatigue-resistant design. The method avoids heuristic crack-tracking and is extensible to 3D and variable-amplitude spectra.
(1) A peridynamics-based (PD) fatigue framework tailored to the improved MCT specimen was established to evaluate service life under pin-loaded, mixed-mode bending conditions. Within this constitutive fatigue formulation, crack initiation at the notch root and subsequent propagation proceed autonomously, enabling a full-life assessment anchored to S–N/Paris-consistent cyclic bond degradation.
(2) The ordinary state-based PD damage model imposes no mesh or size limitations; the entire initiation–propagation process in the MCT ligament is accommodated within a single nonlocal formulation. Consequently, cross-scale phenomena—short-crack nucleation, interaction and coalescence of multiple sites, closure under fixture constraint, and transition to long-crack growth—are consistently represented throughout the fatigue life.
(3) Crack nuclei at the notch root evolve into dominant cracks with temporal records consistent with measurements. Numerical predictions reproduce load–displacement hysteresis, crack paths, a N histories, and ( d a / d N Δ K / Δ J ) trends across R -ratios, showing close agreement with experimental results. Relative to classical FEM/XFEM/CZM approaches, the present framework more accurately captures path deflection and local compliance evolution while reducing sensitivity to discretization and user-defined propagation criteria.
(4) Natural formation and growth of fatigue cracks in the MCT occur without auxiliary rules for manual tip tracking or remeshing. Quantitative damage metrics and design maps are produced, and three-dimensional nucleation/propagation in the MCT geometry is evaluated to predict fatigue life. The validated framework thus provides a reproducible experimental–computational basis for geometry–loading–life correlations and for transfer to service-relevant structural assessments.

Author Contributions

Conceptualization, J.H., Q.Z. and J.M.; methodology, J.M., Q.Z. and G.Z.; software, J.P. and W.C.; validation, J.H., J.P. and W.C.; formal analysis, J.H., Q.Z. and G.Z.; investigation, J.H. and J.M.; resources, J.H. and W.C.; data curation, J.P. and W.C.; writing—original draft preparation, J.H. and J.M.; writing—review and editing, J.H and J.P.; visualization, J.H., Q.Z. and J.M.; supervision, J.P.; project administration, W.C.; funding acquisition, W.C. All authors have read and agreed to the published version of the manuscript.

Informed Consent Statement

Not applicable.

Data Availability Statement

The data sets generated and/or analyzed during the current study are available from the corresponding author on reasonable request.

Acknowledgments

The authors have reviewed and edited the output and take full responsibility for the content of this publication.

Conflicts of Interest

The authors declare no conflict of interest.

Abbreviations

The following abbreviations are used in this manuscript:
PD Peridynamics
MCT Modified Compact Tension
ADR Adaptive Dynamic Relaxation

References

  1. Mourad A.-H. I., Sajith S., Shitole S., et al. Fatigue life and crack growth prediction of metallic structures: A review [C].Structures,2025: 109031.
  2. Gao G., Liu R., Fan Y., et al.Mechanism of subsurface microstructural fatigue crack initiation during high and very-high cycle fatigue of advanced bainitic steels [J].Journal of Materials Science & Technology,2022, 108: 142–157.
  3. Adibaskoro T., Bordas S., Sołowski W. T., et al.Multiple discrete crack initiation and propagation in Material Point Method [J].Engineering Fracture Mechanics,2024, 301: 109918.
  4. Sangid M. D.The physics of fatigue crack propagation [J].International Journal of Fatigue,2025: 108928.
  5. Li L., Yang J., Yang Z., et al.Towards revealing the relationship between deformation twin and fatigue crack initiation in a rolled magnesium alloy [J].Materials Characterization,2021, 179: 111362.
  6. Fang X., Ding K., Minnert C., et al.Dislocation-based crack initiation and propagation in single-crystal SrTiO3 [J].Journal of Materials Science,2021, 56 (9): 5479–5492.
  7. Silling S. A., Lehoucq R. B.Peridynamic theory of solid mechanics [J].Advances in applied mechanics,2010, 44: 73–168.
  8. Silling S. A., Askari A. Peridynamic model for fatigue cracking [R]. Sandia National Lab.(SNL-NM), Albuquerque, NM (United States),2014.
  9. Zhang G., Le Q., Loghin A., et al.Validation of a peridynamic model for fatigue cracking [J].Engineering Fracture Mechanics,2016, 162: 76–94.
  10. Idan M.Advanced Modeling of Crack Propagation Using Extended Finite Element Method (XFEM): Module Theory and Computational Approaches [J],2025.
  11. Higuchi R., Okabe T., Nagashima T.Numerical simulation of progressive damage and failure in composite laminates using XFEM/CZM coupled approach [J].Composites Part A: Applied Science and Manufacturing,2017, 95: 197–207.
  12. Bouhala L., Makradi A., Belouettar S., et al.An XFEM/CZM based inverse method for identification of composite failure parameters [J].Computers & Structures,2015, 153: 91–97.
  13. Haddad M., Sepehrnoori K.XFEM-based CZM for the simulation of 3D multiple-cluster hydraulic fracturing in quasi-brittle shale formations [J].Rock Mechanics and Rock Engineering,2016, 49 (12): 4731–4748.
  14. Talebi B., Abedian A.Numerical modeling of adhesively bonded composite patch repair of cracked aluminum panels with concept of CZM and XFEM [J].Proceedings of the Institution of Mechanical Engineers, Part G: Journal of Aerospace Engineering,2016, 230 (8): 1448–1466.
  15. Djebbar S. C., Madani K., El Ajrami M., et al.Substrate geometry effect on the strength of repaired plates: Combined XFEM and CZM approach [J].International Journal of Adhesion and Adhesives,2022, 119: 103252.
  16. González J. A. O., de Castro J. T. P., Meggiolaro M. A., et al.Challenging the “ΔKeff is the driving force for fatigue crack growth” hypothesis [J].International Journal of Fatigue,2020, 136: 105577.
  17. Nielsen M.Challenges for accurate and reliable determination of effective stress intensity factor range for structural assessments supporting incredibility of failure claims1 [J].Materials Science and Technology,2025: 02670836251354823.
  18. Vidler J., Kotousov A., Ng C.-T.Analysis of crack closure and wake of plasticity with the distributed dislocation technique [J].Theoretical and Applied Fracture Mechanics,2023, 127: 104034.
  19. Ritchie R. O., Liu D. Introduction to fracture mechanics [M]. Elsevier,2021.
  20. Xia C., Lv S., Cabrera M. B., et al.Unified characterizing fatigue performance of rubberized asphalt mixtures subjected to different loading modes [J].Journal of Cleaner Production,2021, 279: 123740.
  21. Gu T., Stopka K. S., Xu C., et al.Prediction of maximum fatigue indicator parameters for duplex Ti–6Al–4V using extreme value theory [J].Acta Materialia,2020, 188: 504–516.
Figure 1. Pairwise interaction between material points i and j.
Preprints 185621 g001
Figure 2. Ordinary state-based peridynamics (OSB-PD) model.
Preprints 185621 g002
Figure 3. Fatigue degradation of virtual (peridynamic) bonds.
Preprints 185621 g003
Figure 4. Peridynamics and Elastic–Plastic Fracture Mechanics (EPFM).
Preprints 185621 g004
Figure 5. Follow chart of fatigue crack simulation.
Preprints 185621 g005
Figure 6. Pairwise interaction between material points i and j.
Preprints 185621 g006
Figure 7. Marco fatigue crack of the test specimen.
Preprints 185621 g007
Figure 8. In each specified iteration, the equivalent intensity factors along crack front. (a) cycle number vs. crack growth step; (b) along crack propagation front with iterative step = 2; (c) along crack propagation front with iterative step = 4; (d) along crack propagation front with iterative step = 6; (e) along crack propagation front with iterative step = 8; (f) along crack propagation front with iterative step = 10; (g) along crack propagation front with iterative step = 13.
Preprints 185621 g008
Table 1. Key geometric parameters of the MCT specimen.
MCT Width
/mm
Thickness
/mm
pin-hole
diameter/mm
pin-hole
spacing/mm
initial notch
length/mm
Ligament
Width/mm
Specimen 62.5 12.5 12.5 26.94 17.5 3.13
Table 2. Main mechanical properties parameters of martensitic stainless steel.
Name E/GPa σ0.2/MPa σb/MPa Density
g/cm3
Poisson’
Ratio
Brittle
Hardness/HB
0Cr13Ni5Mo 208 565 801.6 7.9 0.31 216
Disclaimer/Publisher’s Note: The statements, opinions and data contained in all publications are solely those of the individual author(s) and contributor(s) and not of MDPI and/or the editor(s). MDPI and/or the editor(s) disclaim responsibility for any injury to people or property resulting from any ideas, methods, instructions or products referred to in the content.
Copyright: This open access article is published under a Creative Commons CC BY 4.0 license, which permit the free download, distribution, and reuse, provided that the author and preprint are cited in any reuse.
Prerpints.org logo

Preprints.org is a free preprint server supported by MDPI in Basel, Switzerland.

Subscribe

Disclaimer

Terms of Use

Privacy Policy

Privacy Settings

© 2025 MDPI (Basel, Switzerland) unless otherwise stated