Submitted:
17 November 2025
Posted:
18 November 2025
You are already at the latest version
Abstract
To deeply explore the mechanism of consumers' electric vehicle (EV) purchase behavior and address research gaps related to insufficient consideration of psychological latent variables and neglect of consumer heterogeneity in existing studies, this study constructs a latent class model (LCM) that integrates personal attributes, vehicle attributes, and six psychological latent variables: perceived usefulness, perceived ease of use, perceived risk, environmental awareness, purchase attitude, and purchase intention. Based on 1,044 valid questionnaires collected from Urumqi, latent profile analysis (LPA) is used to classify consumers. The results indicate that EV consumers can be divided into five distinct latent profiles with significant differences in purchase preferences: risk-avoidance type, moderate-low intention wait-and-see type, utility-oriented and low environmental concern type, high utility cognition and low risk proactive type, and all-dimensional high-intention core type. Socioeconomic and vehicle-related factors exert heterogeneous impacts on the psychological variables and purchase decisions of each profile. This study clarifies the intrinsic psychological mechanism of EV purchase behavior, providing a theoretical basis and targeted strategy references for the government and enterprises to promote EV adoption and advance sustainable transportation development.
Keywords:
electric vehicle
; purchase behavior
; latent class model
; customer heterogeneity
1. Introduction
Recently, with the increasingly serious problems of environmental pollution and energy shortage, needs for development and promotion of new energy products are also becoming extremely urgent. Electric vehicles, with the significant features of environmental protection and energy conservation, have become the development direction of the automotive industry in countries around the world. According to statistics from the Ministry of Public Security of the People's Republic of China, in 2023, 7.43 million new energy vehicles were registered, accounting for 30.25% of the total number of newly registered vehicles. Compared with 2022, this figure increased by 2.07 million, showing a growth of 38.76%. By 2024, the total number of new energy vehicles in China had reach 31.4 million, accounting for 8.90% of the total number of vehicles. Among them, the ownership of electric vehicles is 15.52 million, the proportion is 76.04% of the total number of new energy vehicles. It can be seen that with the continuous improvement of Chinese new energy vehicle technology and the intensive promotion of national policies, consumers' acceptance of electric vehicles will also be increasing day by day. However, according to the statistics from MPS, even by June of 2025, electric vehicles still have a low proportion of 7.11% in the total number of vehicles. Therefore, exploring the influencing factors of consumers' choice behavior of electric vehicles and formulating targeted and effective policies for promoting electric vehicles, which are of extremely important practical significance for implementing the country's new energy vehicle development strategy.
2. Literature Review
It is necessary to deeply explore consumers' behavior in choosing electric vehicles to introduce effective policies for promoting electric vehicles. At present, the common method for studying the characteristics of electric vehicle choice behavior is to construct discrete choice models to study the electric vehicle choice behavior of consumers. However, these models still have their shortcomings: First, insufficient consideration is given to variables that are difficult to observe directly, namely latent variables. Zhang et al. used 3 binary logistic models to determine the factors that contribute to consumers' acceptance of electric vehicles, their purchase time and their purchase price, the variables included socioeconomic attributes, consumers' acceptance of electric vehicles, and consumers' awareness of related development measures for electric vehicles[1]. Helveston conducted an investigation into consumers' behavior in choosing electric vehicles based on various vehicle attributes such as model, brand, price, fast-charging capacity, fuel price, and acceleration performance[2]. As the research progressed, some scholars began to explore that certain psychological factors that cannot be directly observed also influence consumers' choice behaviors[3,4]. Schmalfuß et al. and Zhang et al. utilized the theory of planned behavior model (TPB) to introduce non-direct factors of subjective norms in the choice behavior of electric vehicles, and found that subjective norms had a significant impact on the adoption of electric vehicles[5,6]. Song and Adu-Gyamfi respectively explored the influence of perceived usefulness and perceived ease of use on the behavior of choosing electric vehicles[8,9]; Second, the assumption of homogeneity of the model is not in line with reality, a lot of researches assumed that individual consumers are homogeneous entities with the same physiological, psychological states and even the same decision-making rules. However, in reality, significant differences are among individuals in terms of physiology, psychology and decision-making rules, indicating heterogeneity among individuals. Many choice models have also neglected that it exists among individuals[10,11]. With the development of choice models, more researchers treat the assumption of heterogeneity as an important research field[12,13,14,15,16]. Many models can disclose the heterogeneity of the research objects, such as Probit model, mixed logit model[17](ML) and latent class model (LCM) etc. The LCM divides the research samples into a limited number of latent classes, using the differences in parameters among the latent classes to represent the heterogeneity existing in the research samples. Compared with other models, the LCM has unique advantages: it not only can represent the heterogeneity at the group level, and has stronger explanatory power[18], but also does not require assumptions about the distribution of random parameters, thereby improving the computational efficiency of the model[19].
At first, scholars tended to emphasize the differences between factor analysis and latent structure analysis[20]. After that, researchers developed the LCM continuously on distinguishing the cases where there is prior evidence or theory which leads people to expect there to be latent categories, namely, whether the classes are existed in advance and how many there might be[21,22,23]. During recent decades, with the continuous improvement of model methodology and the rapid development of electric vehicles, LCM has been utilized to study the heterogeneity of consumers during the decision-making process when choosing to purchase or lease a vehicle, as well as the choice behaviors of different types of consumers[24,25]. However, in the research on the choice behavior of electric vehicles, few studies have considered the psychological latent variables of consumers for modeling, and fewer studies have explored the choice preferences of consumers with different psychological characteristics. Therefore, this study will be based on psychological latent variables, focus on considering the psychological heterogeneity of consumers, construct a latent class model, and explore the preference of consumers for electric vehicle choice behavior
3. Materials and Methods
This study employs a quantitative and descriptive-analytical research design, with attention paid to the heterogeneity of electric vehicle purchasers. Which investigates how personal attributes, vehicle attributes and psychological attributes affect purchasers’ behaviour. In order to achieve the goal, an analysis tool is deployed, namely, latent class model. The design combines structured survey instruments to capture electric vehicle purchasers’ heterogeneity during electric vehicle choice.
3.1. Introduction to Latent Class Model
Latent class model is an effective method for studying heterogeneity. Whose essence lies in the semi-parametric specification within the utility function, which assumes that decision-makers are divided into multiple latent classes. The parameters of the utility function vary among different classes, but are the same within same class. The latent class model can be expressed as:
Where
In the model, each class has its own parameter vector βs. The probability that decision-maker n chooses option i is equal to the probability that this decision-maker belongs to category s multiplied by the probability that option i is chosen in category s.
The class membership probability πns is a function of the explanatory variable Zn, ηs is the parameter vector of a specific category, and δs is the constant term of a specific category:
In the model, choice behaviour is judged based on the utility function:
Where V(i) represents the fixed utility of option i, and ɛ(i) represents the random utility, which follows a certain probability distribution. When U(i) is greater than that of any other option, option i is chosen. Therefore, the selection probability P(i) of option i can be expressed as:
Substituting equation (4) into equation (3), which yields
Where F(x) represents the probability distribution function, and fi(x) is the probability density function of the random variable x = ɛ(i). First, assuming that ɛ(i) is known, and obtain the probability distribution function value of ɛ(j) corresponding to the scheme j. Then, when the probability of ɛ(j) changes, multiply it by its probability density and perform integration.
Assuming that ɛ(i) in the utility function are mutually independent, and follow the Gumbel distribution, let x be the probability variable representing ɛ(i), and θ represent the parameters, the distribution function of the random term can be expressed as follows:
Substituting (6) into (5), we can obtain the probability that decision-maker n selects option i:
3.2. Questionnaire Investigation
This study adopts the method of field investigation and the location is selected in Urumqi, with a focus on randomly sampling surveys in the major commercial districts with high passenger flow in the city. A total of 1,157 questionnaires are collected. After eliminating 113 incomplete or invalid questionnaires, a total of 1,044 valid questionnaires are obtained, and the effective recovery rate of the questionnaires is 90.23%.
The questionnaire is divided into three parts. The first part is the scenario selection, the second part is the psychological condition survey, and the third part is the personal socioeconomic attribute survey. In the scenario selection, apart from setting the traditional fuel vehicle as the reference item, this study also sets the hybrid vehicle for comparative analysis. In the study, 3 types of vehicles are provided, including traditional fuel vehicles, pure electric vehicles, and hybrid vehicles. The vehicle attributes include purchase price, energy consumption per 100 kilometers, range, charging/refueling time, and government policies. The psychological condition survey includes 6 latent variables: perceived usefulness, perceived ease of use, perceived risk, environmental awareness, purchase attitude, and purchase intention. These variables are measured using a Likert five-point scale. Personal socioeconomic attributes include gender, age, income level, education, family annual income, occupation, driving years, the number of family vehicles, and vehicle purchase price. The specific variables in the questionnaire are described in Table 1.
Descriptive statistical analysis was conducted on the collected valid samples, and the statistical results are shown in Table 2.
The proportion of males and females in the sample is 59.2% and 40.8% respectively. Since the actual proportion of males purchasing vehicles is higher than that of females, the proportion of males is appropriately increased during sampling. The age group of 26-35 years old is the largest, followed by 35-60 years old, accounting for 66.2% in total. These two groups are the main vehicle purchasing population and have strong representative significance. The number of people with an annual household income of over 100,000 accounts for 61%. The number of people with a driving experience of 1-6 years is the largest, accounting for 41.2%. The number of people with one vehicle in the family accounts for 63.3%. The number of people who have purchased a vehicle with a price of 100,000-200,000 is the largest, accounting for 48.0%. Meanwhile, the occupations involved in the survey are relatively comprehensive, and the survey sample has certain representative significance.
4. Results
4.1. Analysis of Latent Variable Relationships and Survey Results
In order to clarify the structural relationship between latent variables and manifest variables, this study obtains the loading coefficients between latent variables and manifest variables through measurement equations, and the result is shown in Table 3. From Table.3, loading coefficients are all greater than 0.5, indicating that there is a high degree of causal relationship between latent variables and manifest variables. The consistency and stability of the questionnaire measurement results are tested through Cronbach's α value. When the Cronbach's α value is greater than 0.7, it indicates that the measurement results have a high internal consistency, suggesting that the questionnaire has a high level of reliability. An α value between 0.5 and 0.7 is considered acceptable[26].
The validity of the measurement results is analyzed using composite reliability (CR). A CR value greater than 0.6 indicates that the measurement results of the questionnaire are valid and the questionnaire has high reliability [27]. The results show that the Cronbach's α of each latent variable is greater than 0.6, and the CR values are all greater than 0.7, indicating that the reliability of the questionnaire is high.
4.2. Analysis of Model Results
4.2.1. Analysis of Latent Variable Classification Results
During the modeling process, when the variables in the latent class model are discrete(categorical) manifest variables and discrete latent variables, it is called latent class analysis (LCA). When the variables in the latent class model are discrete manifest variables and continuous latent variables, it is called latent trait analysis (LTA) . Besides, when the variables are continuous manifest variables and discrete latent variables, it is called latent profile analysis (LPA). In this study, the manifest variable data collected using the Likert five-point scale can be regarded as continuous variables. Therefore, this study adopts LPA to construct the latent class model. The main test indicators for LPA include Akaike information criterion (AIC), Bayesian information criterion (BIC), adjusted Bayesian information criterion (aBIC), entropy criterion (Entropy), and Lo-Mendell-Rubin test (LMR). Among these indicators, a smaller value indicates a better model fitting effect. When Entropy is greater than or equal to 0.8, it indicates that the classification accuracy exceeds 90%. A significant P-value of LMR(P<0.05) indicates that the fitting effect of the m profiles model is significantly better than that of the m-1 profiles model [23]. The fitting results of each model are shown in Table 4.
As shown in Table 4, when variables are divided into 5 profiles, Entropy has the maximum value. When divided into 6 profiles, the P value of LMR is not significant, indicating that the model with 6 profiles is not superior to that with 5 profiles. Therefore, this study determines 5 profiles as the optimal ones. Figure 1 shows the scores of each profile on different manifest variables when divided into 5 profiles.
As shown in Figure 1, the points on the horizontal axis represent the manifest variables, and the vertical axis represents the score of this manifest variable. Based on the data comparison and analysis in Figure 1, it can be observed that individuals in profile 1 have intermediate levels of perceived risk and environmental awareness, but exhibit the lowest scores for perceived usefulness, perceived ease of use, purchase intention, and purchase attitude. We have named this group the 'risk-avoidance type', because they hold high perceived risk and hesitate to purchase due to concerns about practicality and convenience, showing a tendency of risk avoidance
The perceived ease of use, perceived usefulness, perceived risk and environmental awareness of the profile 2 are at medium level among the five profiles, and their purchase intention and purchase attitude are relatively weak. They have no obvious preference or rejection towards electric vehicles and show weak purchase intention, and this group is named after the moderate-low intention wait-and-see type.
As for people of profile 3, except for having a relatively weak environmental awareness, their scores in other latent variables are at an intermediate level, and they account for the largest proportion of the population. We term this group the utility-oriented and low environmental concern type.
People of profile 4 has the poorest perceived risk and the medium level of perceived ease of use, but they have stronger environmental awareness, purchase intention and purchase attitude. Besides, the perceived usefulness of this group is the highest. So this group are named the high utility cognition and low risk proactive type, because they highly recognize the practical value of electric vehicles and have minimal concerns about safety and convenience.
Last, people of profile 5 have the strongest perceived usefulness, purchase intention and purchase attitude, and they also have the strongest environmental awareness, perceived risk and perceived ease of use. They are named as all-dimensional high-intention core type, although their perceived risk is slightly higher, it is completely offset by strong environmental awareness and high recognition of practicality. They have extremely strong purchase intention and are the core potential users for electric vehicle promotion.
Based on the scores of the manifest variables and the loading coefficients, the magnitude of the psychological latent variables of each profile can be further calculated. Through the analysis of variance shown in Table 5, the mean and variance of the psychological latent variables of each profile can be obtained. By further comparing the differences in the psychological latent variables of people of different profiles, it can be seen from the analysis of variance table that the people of profile 1 have a higher perceived risk and lower environmental awareness. The people of profile 5 have the highest perceived ease of use, perceived risk, environmental awareness, purchase attitude and purchase intention. People of profile 4 have the strongest perceived usefulness, which is consistent with the analysis results in Figure 1. This further proves the existence of psychological heterogeneity among the population, and the significance results indicate that there are significant differences among the five groups of people in terms of latent variables such as perceived usefulness, perceived ease of use, perceived risk, environmental awareness, purchase attitude and purchase intention, indicating a good classification result.
4.2.2. Influencing Factors for the Classification of Electric Vehicle Purchasers
Taking the profile 1 as a benchmark, this study explores the influencing factors of purchasers profile classification. The results are shown in Table 6.
According to Table 6, compared to the purchasers of profile 1, purchasers of profile 2 are mainly male. As for profile 3, there are more males and have a higher level of education but fewer family vehicles. The purchasers of profile 4 are mainly male and have a higher level of education, they own fewer vehicles compared to profile 1, but the purchase price of their vehicles is higher. Compared to other professions, there are more public institution employees and self-employed individuals among people of profile 4, while there are fewer employees from enterprise units. Compared to the purchasers of profile 1, purchasers of profile 5 are mainly male.
4.3. Analysis of Influencing Factors of Purchasers’ Choice Behaviour
This part analyses the effects of each influencing factor on the perceived usefulness(PU), perceived ease of use(PEU), perceived risk(PR), environmental awareness(EA) and purchase intention(PI) of five profiles.
4.3.1. Comparative Analysis of Influencing Factors of Purchase Intention
From Table 7, it indicates that gender and occupation have less influence on the purchase intention of five profiles of purchasers. Age and driving experience only have significant influence on the PI of profile 1. Education background has significant effect on the PI of profile 1 and profile 5. As for annual household income and the number of family vehicles, they influence the PI of profile 2 and profile 3 significantly. And vehicle purchasing price only influences the PI of profile 4.
4.3.2. Comparative Analysis of the Influencing Factors of Purchase Attitude
As can be seen from Table 8, neither the annual household income nor the driving experience has a significant influence on the purchase attitude of the five profiles. Occupation, the number of family vehicles, and the vehicle purchase price only have a significant influence on the PA of profile 1; education has a significant influence on the PA of profile 2, but not on the other profiles; gender only has a significant influence on the PA of the profile 3; and only age has a significant influence on the PA of profile 4.
This section may be divided by subheadings. It should provide a concise and precise description of the experimental results, their interpretation, as well as the experimental conclusions that can be drawn.
4.3.3. Comparative Analysis of the Influencing Factors of Perceived Risk
Table 9 indicates that driving experience has little significant influence on the perceived risk of five profiles. Gender and occupation only influence the PR of profile 2 significantly. Gender and the number of family vehicles influence the PR of profile 3. As for profile 4, their PR is influenced greatly by gender and the vehicle purchase price. The PR of profile 5 is only influenced by the annual household income.
4.3.4. Comparative Analysis of the Influencing Factors of Environmental Awareness
It can be seen from Table 10 that gender, occupation, driving experience and the number of family vehicles do not influence the environmental awareness of profile 5 significantly. The annual household income only influences that of profile 4. Vehicle purchase price has a significant influence on the EA of profile 3. The EA of profile 2, profile 3 and profile 5 is influenced by age greatly.
4.3.5. Comparative Analysis of the Influencing Factors of Perceived Usefulness
From Table 11, age, education background, annual household income and vehicle purchase price don’t have a significant influence on the perceived usefulness of five profiles. Gender and driving experience only influence the PU of profile 2. The number of family vehicles only has a significant influence on the PU of profile 3.
4.3.6. Comparative Analysis of the Influencing Factors of Perceived Ease of Use
From Table 12, it indicates that age education background, occupation and vehicle purchase price have no significant influence on the perceived ease of use of all profiles. Age and driving experience only influence the PE of profile 2. For profile 3, the purchasers are only influenced greatly by the number of family vehicles.
5. Discussion
In the previous chapters, this study constructs a latent class model to fit the survey data and demonstrates the heterogeneity of purchasers in different profiles through LPA method. For purchasers of different profiles, this study recommends adopting differentiated sales strategies to enhance the purchase intention.
The core characteristics of profile 1 are high perceived risk, weak perceived usefulness and ease of use, strong concerns about the practicality and safety of vehicles, and their purchase attitude and perceived risk are significantly influenced by factors such as education background, annual household income, occupation, and vehicle purchase price. In response to their risk-averse nature, sales strategies should focus on alleviating the risk perception of the group and emphasizing the safety and practical aspects of electric vehicles.
Profile 2 represents a group with moderate-low purchase intention, characterized by average levels of psychological variables, no clear preferences or aversions, and weak purchase intention. Age, education background, gender, and driving experience significantly influence their environmental awareness and perceived usefulness. This group is classified as a convertible wait-and-see group. For this group, sales strategies should focus on awakening their needs, developing experiential scenarios, and offering purchasing discount.
The purchasers of profile 3 values utility and has weak environmental concerns, making up the highest proportion (46.1%). Their core characteristics include prioritizing vehicle practicality and having low environmental awareness. The number of family vehicles and the vehicle purchase price significantly influence their perceived usefulness and ease of use. This group is considered the core group for scale conversion, and sales strategies should emphasize the practical attributes and cost advantages of electric vehicles.
The characteristics of purchasers belong to profile 4 are the highest perceived usefulness, low perceived risk, and strong environmental awareness. The vehicle purchase price and gender significantly influence their purchase intention. This group is considered an easily convertible proactive group, and it is crucial to meet their quality and personalized needs.
Purchasers of profile 5 are the core potential user of electric vehicles, characterized by the strongest purchase intention and attitude, high environmental awareness, significant influence of age and education background on purchase intention, low sensitivity to price, and a need to focus on ensuring the purchase experience of this group of purchasers and continuously enhancing their brand recognition.
Future research can explore other psychological factors that may influence the purchase intention of electric vehicles based on this model, and supplement and integrate the existing model.
6. Conclusions
This study analyzes the purchasers’ heterogeneity during electric vehicle choice based on latent class model, and effectively improved the prediction accuracy of the model. Based on the latent profile analysis, purchasers can be classified into 5 latent profiles, and each exhibiting a distinct characteristic of choice behavior. For instance, the first profile of purchasers have higher perceived risk and environmental awareness, the fifth profile of purchasers have the highest perceived ease of use, perceived risk, environmental awareness, purchase attitude and purchase intention, while the perceived usefulness of the forth profile of purchasers is the strongest. The research results reveals the intrinsic formation mechanism and psychological process in purchasers' decisions for electric vehicles, and reflects the influence of different socioeconomic attributes of each profile of purchasers on various psychological latent variables. The following conclusions are drawn:
(1) Age and driving experience have a significant influence only on the purchase intention of the fifth profile of purchasers, and education background has a significant influence on the purchase intention of both profile 1 and profile 5; annual household income and the number of family vehicles have a significant influence on profile 2 and profile 3; vehicle purchase price has a significant influence only on the purchase intention of profile 4.
(2) Occupation, number of family vehicles and vehicle purchase price only influence the purchase attitude of people belonging to profile 1; education background has significant influence on the purchase attitude of profile 2; gender only influences the purchase attitude of profile 3.
(3) Gender, education background and annual household income influence the perceived risk of the first profile of purchasers significantly; age and occupation only have a significant influence on the PR of profile 2; as for the purchasers of profile 3, age and the number of family vehicles have a significant influence on their PR; the PR of the profile 4 is influenced by gender and vehicle purchase price; annual household income only influences the PR of profile 5.
(4) Annual household income only influences the environmental awareness of the forth profile of purchasers significantly; vehicle purchase price has a significant influence on the EA of profile 3; the EA of profile 2, 3 and 5 is significantly influenced by age.
(5) Gender and age influence the perceived usefulness and perceived ease of use of the profile 2 significantly; the number of family vehicles has a significant influence on the perceived usefulness and perceived ease of use of profile 3.
Funding
This research was funded by Science Foundation of Education Department of Liaoning Province (grant number LJKZ1326), the Doctoral Research Startup Fund of Liaoning University of International Business and Economics (grant number 2022XJLXBSJJ01), the National Natural Science Foundation of China (grant number 71861032) and the Natural Science Foundation of Xinjiang Uygur Autonomous Region of China (2022D01C3195).
Informed Consent Statement
Informed consent was obtained from all subjects involved in the study.
Data Availability Statement
Data will be made available on request from the author.
Conflicts of Interest
The authors declare no conflicts of interest.
Abbreviations
The following abbreviations are used in this manuscript:
| EV | Electric vehicle |
| LCM | Latent class model |
| TPB | Theory of planned behavior model |
| ML | Mixed logit |
| PU | Perceived usefulness |
| PEU | Perceived ease of use |
| PR | Perceived risk |
| EA | Environmental awareness |
| ATT | Purchase attitude |
| PI | Purchase intention |
| CR | Composite reliability |
| LTA | Latent trait analysis |
| LPA | Latent profile analysis |
| AIC | Akaike information criterion |
| BIC | Bayesian information criterion |
| aBIC | adjusted Bayesian information criterion |
| LMR | Lo-Mendell-Rubin test |
References
- Zhang, Y. Yu, Y.F., Zou, B. Analyzing public awareness and acceptance of alternative fuel vehicles in China: The case of EV. Energy Policy, 2011, volume 39, pp. 7015-7024.
- Helveston, J.P., Liu, Y.M., Feit, E.M. et al. Will subsidies drive electric vehicle adoption? Measuring consumer preferences in the U.S. and China. Transp. Res. A., 2015, volume 73, pp. 96-112. [CrossRef]
- Jensen, A.F., Cherchi, E., Mabit, S.L. On the stability of preferences and attitudes before and after experiencing an electric vehicle. Transp. Res. D., 2013, volume 25, pp. 24-32. [CrossRef]
- Kim, J. Rasouli, S., Timmermans, H. Expanding scope of hybrid choice models allowing for mixture of social influences and latent attitudes: Application to intended purchase of electric cars. Transp. Res. A., 2014, volume 69, pp. 71-85.
- Schmalfuß, F., Mühl, K., Krems, J.F. Direct experience with battery electric vehicles (BEVs) matters when evaluating vehicle attributes, attitude and purchase intention. Transp. Res. F., 2017, volume 46, pp. 47-69. [CrossRef]
- Zhang, X., Bai, X., Shang, J. Is subsidized electric vehicles adoption sustainable: Consumers’ perceptions and motivation toward incentive policies, environmental benefits, and risks. J. Clean. Prod., 2018, volume 192, pp. 71-79. [CrossRef]
- Song. Y.K., An empirical study on the influencing factors of consumers' willingness to use pure electric vehicle based on TAM model. 2020 16th Dahe Fortune China Forum and Chinese High-educational Management Annual Academic Conference (DFHMC), China, 2020, pp. 289-292.
- Gyamfi, G.A., Song, H.M., Obuobi, B., Nketiah, E., Wang, H., Cudjoe, D. Who will adopt? Investigating the adoption intention for battery swap technology for electric vehicles. Renew. Sustain. Energy Rev., 2022, volume 156, p. 111979, 10.1016/j.rser.2021.111979. [CrossRef]
- Singh, G., Misra, S.C., Daultani, Y. et al. Electric vehicle adoption and sustainability: Insights from the bibliometric analysis, cluster analysis, and morphology analysis. Oper. Manag. Res., 2024, volume 17, pp. 635–659. [CrossRef]
- Duives, D., Mahmassani, H. Exit choice decisions during pedestrian evacuations of buildings. Transp. Res. Rec., 2018, pp. 84-94. [CrossRef]
- Sun, C.W.; Obrenovic, B., Li, H.T. Influence of virtual CSR co-creation on the purchase intention of green products under the heterogeneity of experience value. Sustainability, 2022, 14, 13617. [CrossRef]
- Wang, R.B., Wan, X., Mao, P., Li D.Z., Wang, X. Relevance study between unsafe behaviors of passengers and metro accidents based on fsQCA. China Saf. Sci. J., 2020, volume 30, pp. 152-158.
- Román, C., Arencibia, A.I., Feo-Valero, M. A latent class model with attribute cut-offs to analyze modal choice for freight transport. Transp. Res. A., 2017, volume 102, pp. 212-227. [CrossRef]
- Motoaki, Y., Daziano, R.A. A hybrid-choice latent-class model for the analysis of the effects of weather on cycling demand. Transp. Res. A., 2015, volume 75, pp. 217-230. [CrossRef]
- Araghi, Y., Kroesen, M., Molin, E., Van Wee, B. Revealing heterogeneity in air travelers' responses to passenger-oriented environmental policies: A discrete-choice latent class model. International Journal of Sustainable Transportation, 2016, volume 10, pp. 765-772. [CrossRef]
- Alenazi, S.A. Sustainability awareness, price sensitivity, and willingness to pay for eco-friendly packaging: A discrete choice and valuation study in the Saudi retail sector. Sustainability, 2025, 17, 7287. [CrossRef]
- Hensher, D. A., Greene, W. H. The mixed logit model: the state of practice. Transportation, 2003, 30, pp. 133-176. [CrossRef]
- Boxall, P.C., Adamowicz, W.L. Understanding heterogeneous preferences in random utility models: A latent class approach. Environ. Resour. Econ., 2002, 23, pp. 421-446. [CrossRef]
- Greene, W. H., Hensher, D. A. A latent class model for discrete choice analysis: contrasts with mixed logit. Transp. Res. B., 2003, 37, pp. 681-698. [CrossRef]
- Lazarsfeld, P.F. Qualitative analysis; historical and critical essays, 1st ed. Allyn and Bacon: Boston, USA, 1972, pp. 47-51.
- Everitt, B.S. An introduction to latent variable models, 1st ed. Chapman & Hall: New York, USA. 1984. pp. 63-70.
- Macready, G.B., Dayton, C.M. The use of probabilistic models in the assessment of mastery. J. Educ. Stat., 1977, volume 2, pp. 99-120.
- Pickering, R.M., Forbes, J.F. A classification of Scottish infants using latent class analysis. Stat. Med., 1984, 3, pp. 249-259. [CrossRef]
- Kim, J. Rasouli, S., Timmermans, H. Expanding scope of hybrid choice models allowing for mixture of social influences and latent attitudes: Application to intended purchase of electric cars. Transp. Res. A., 2014, volume 69, pp. 71-85.
- Hidrue, M.K., Parsons, G.R., Kempton, W., Gardner, M.P. Willingness to pay for electric vehicles and their attributes. Resour. Energy Econ., 2011, volume 33, pp. 686-705. [CrossRef]
- Cronbach L.J. Coefficient alpha and the internal structure of tests. Psychometrika, 1951, volume 48, pp. 99–111.
- Bagozzi R.P., Fornell, C., Larcker, D.F. Canonical correlation analysis as a special case of a structural relations model. Multivar. Behav. Res., 1981, volume 16, pp.437-454. [CrossRef]
Figure 1.
Observed variable scores of five latent classes.
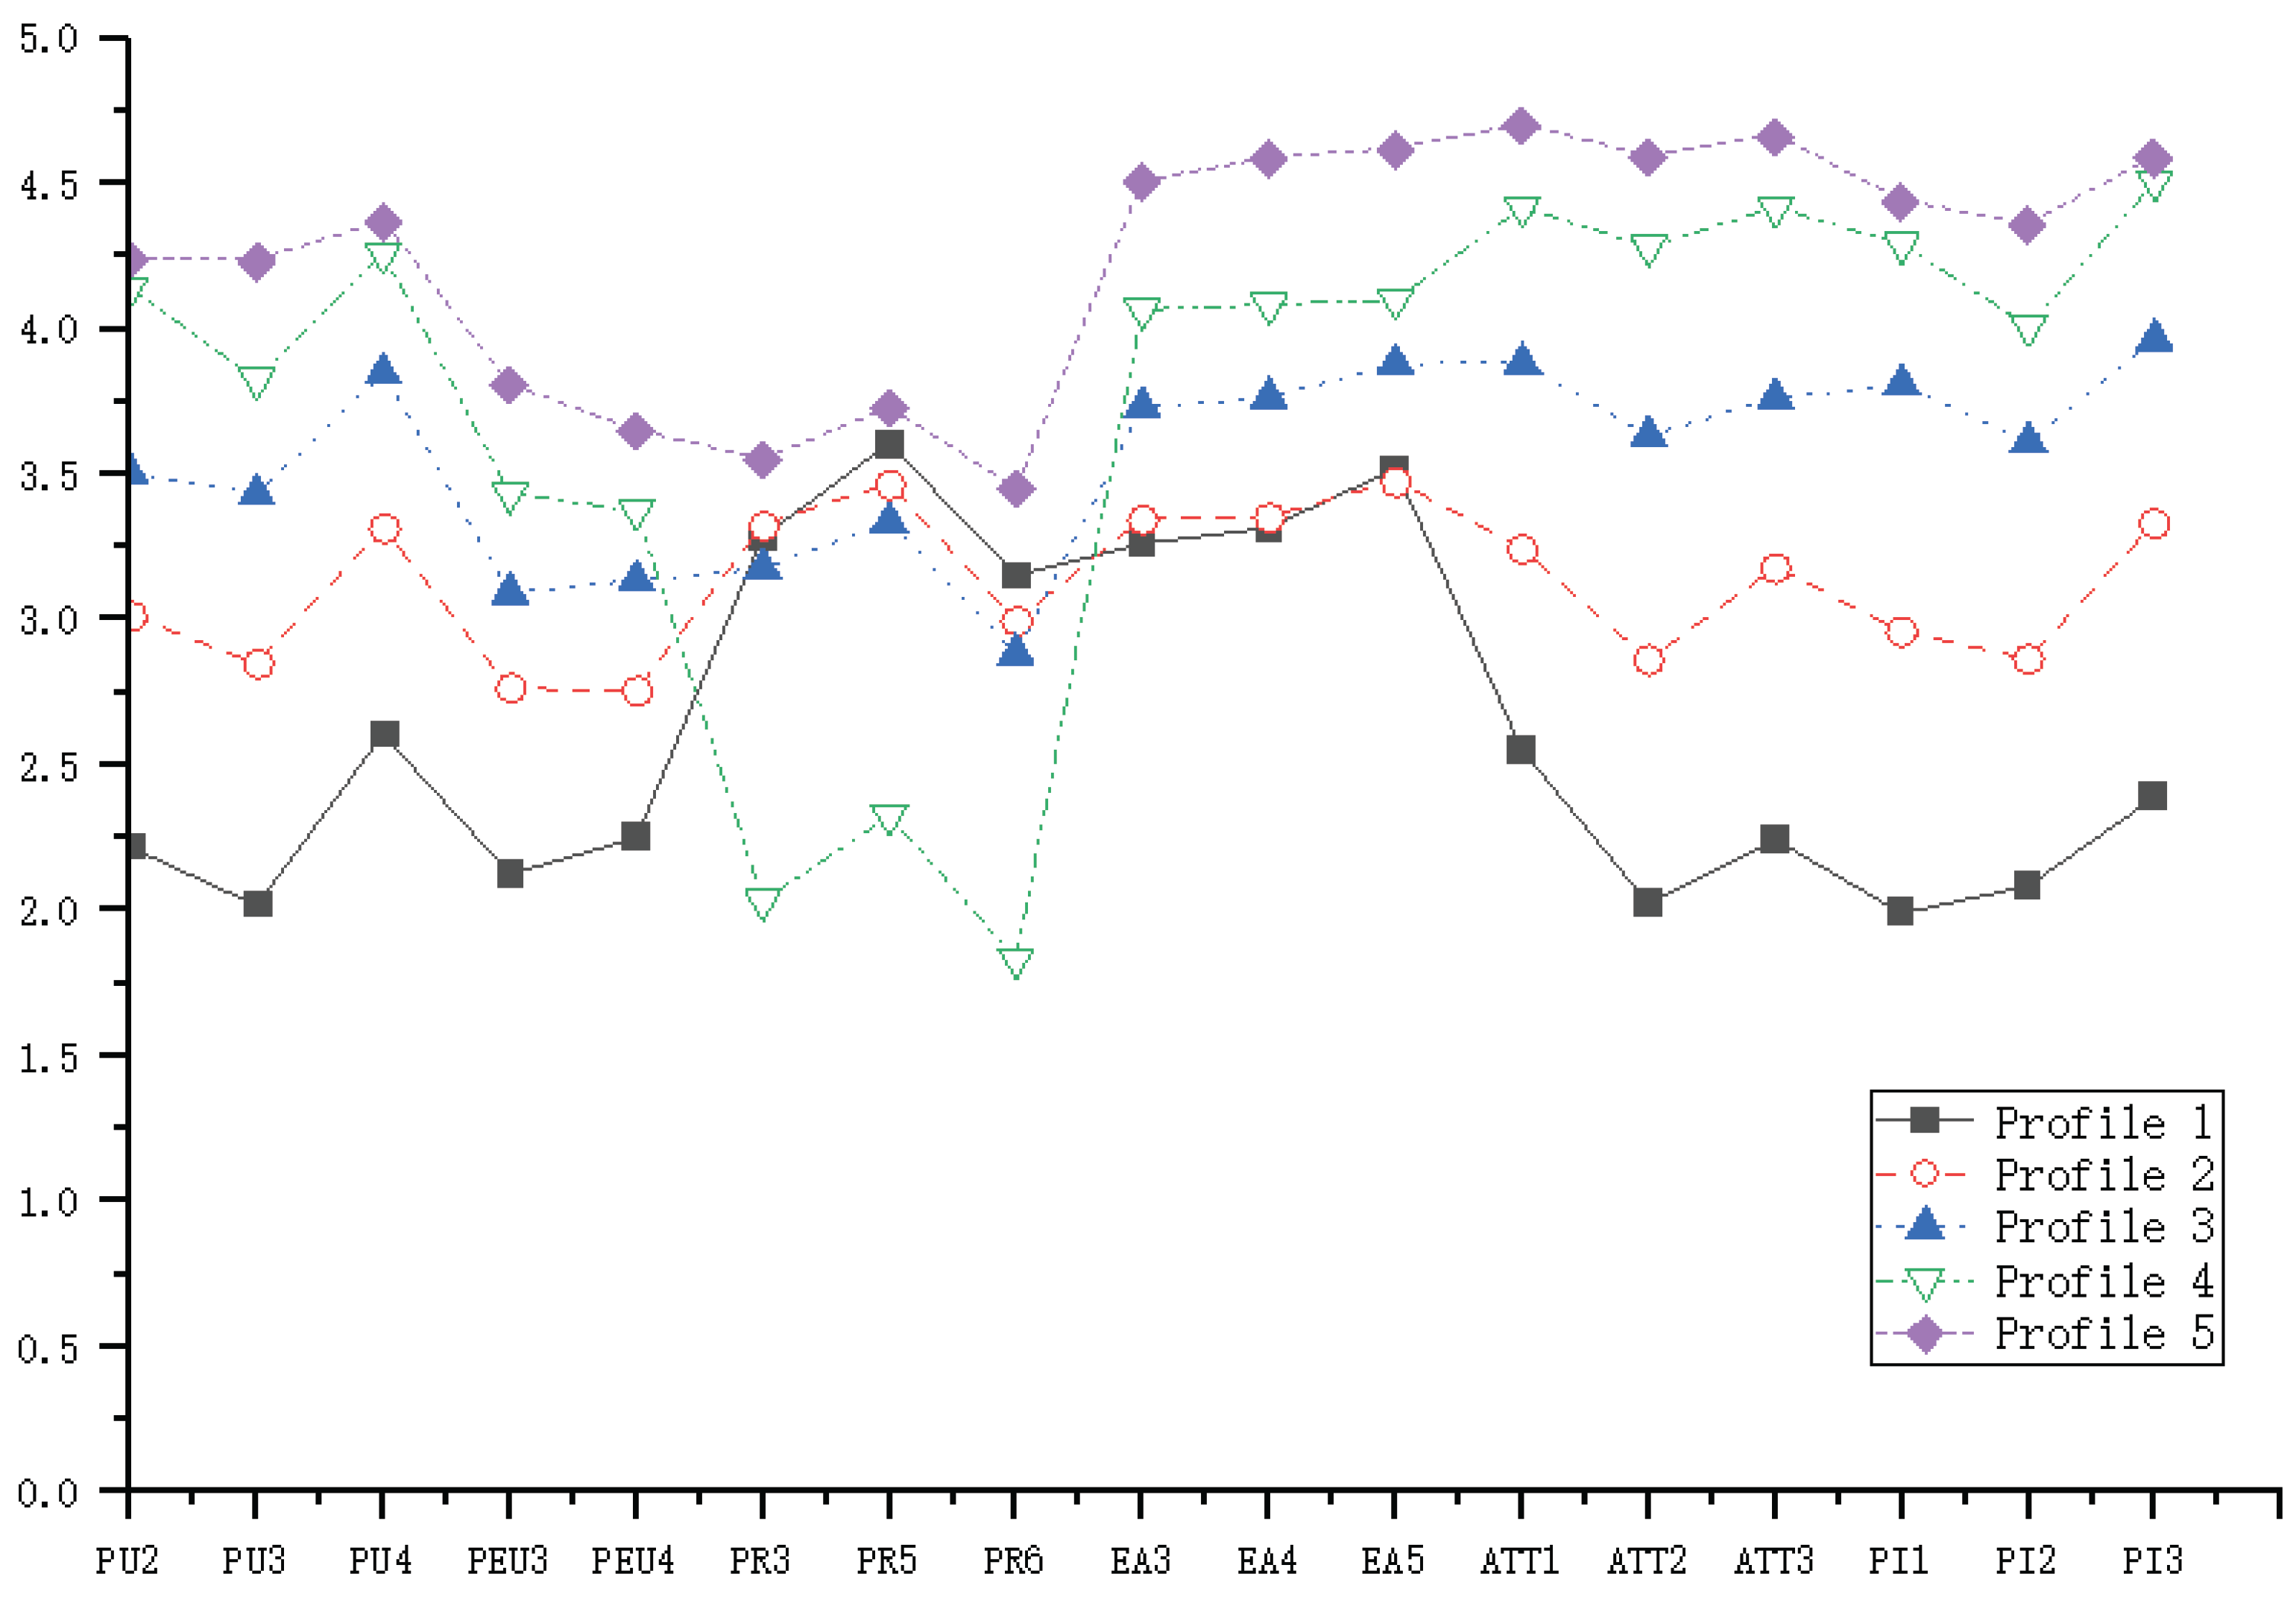

Table 1.
Variables.
| Influence Factors | Variable | Variable specification | |
|---|---|---|---|
| Personal attributes | Sex | SEX | 0: Male; 1: Female |
| Age | AGE | 1: 18-25; 2: 26-35; 3: 36-60; 4: over 60 | |
| Education | KNOW | 1: High school or below; 2: College; 3: Undergraduate; 4: Master or above |
|
| Annual household income | INC (CNY) |
1: Less than 50k; 2: 50k-100k; 3: 100k-200k; 4: 200k-300k; 5: More than 300k |
|
| Occupation | PRO | 1: Employee of enterprises; 2: Employee of public institutions; 3: Student; 4: Self-employed; 5: Free agent; 6: Retiree; 7: Other | |
| Driving experience | DRI | 1: No license; 2: Less than 1 year; 3: 1-6 years; 4: More than 6 years | |
| Number of family vehicles | CAR | 1: 0; 2: 1; 3: 2; 4: 3 or more | |
| Available fund for vehicle purchase | PRI (CNY) |
1: 0 2: 50k-100k; 3: 100k-200k; 4: 200k-300k; 5: More than 300k | |
| Vehicle attributes | Purchase price | PRICE | 1: 150,000 Yuan; 2: 210,000 Yuan; 3: 225,000 Yuan |
| Energy consumption per 100-kilometer, | CONSUM | 1: 25 Yuan; 1: 65 Yuan; 2: 100 Yuan | |
| Cruising range | DIS | 1: 200KM; 2: 380KM; 3: 500KM | |
| Charging time | TIME | 1: 10min; 2: 20min; 3: 35min | |
| Government policy | GUI | 0: No policy; 1: Free parking | |
| Psychological attributes | Perceived usefulness | PU | A five-point Likert scale was adopted, and each attribute was measured by multiple questions. |
| Perceived ease of use | PEU | ||
| Perceived risk | PR | ||
| Environmental awareness | EA | ||
| Purchase attitude | ATT | ||
| Purchase intention | PI | ||
Table 2.
Survey Sample Statistics.
| Attribute | Levels | Proportion |
|---|---|---|
| Gender | Male | 59.2% |
| Female | 40.8% | |
| Age | 18-25 | 29.5% |
| 26-35 | 36.5% | |
| 36-60 | 29.7% | |
| Above 60 | 4.3% | |
| Education | High school or below | 20.9% |
| College | 26.4% | |
| Undergraduate | 48.1% | |
| Master or above | 4.6% | |
| Annual Household income | Less than 50k | 9.7% |
| 50k-100k | 29.3% | |
| 100k-200k | 38.7% | |
| 200k-300k | 16.4% | |
| More than 300k | 5.9% | |
| Occupation | Employee of enterprises | 27.8% |
| Employee of public institutions | 12.5% | |
| Student | 14.9% | |
| Self-employed | 19.5% | |
| Free agent | 10.6% | |
| Retiree | 3.5% | |
| Other | 11.2% | |
| Driving experience | No license | 21.5% |
| Less than 1 year | 15.6% | |
| 1-6 years | 41.2% | |
| More than 6 years | 21.7% | |
| Number of family vehicles | 0 | 17.0% |
| 1 | 63.3% | |
| 2 | 17.2% | |
| 3 or more | 2.5% | |
| Available fund for vehicle purchase | 0 | 11.6% |
| 50k-100k | 16.8% | |
| 100k-200k | 48.0% | |
| 200k-300k | 18.6% | |
| More than 300k | 5.0% |
Table 3.
Test results of loading factors.
| Latent variable | Manifest variable | Loading factors | CR | Cronbach’s α |
| PU | PU2 | 0.706 | 0.747 | 0.741 |
| PU3 | 0.745 | |||
| PU4 | 0.649 | |||
| PEU | PEU3 | 0.778 | 0.731 | 0.744 |
| PEU4 | 0.741 | |||
| PR | PR3 | 0.612 | 0.684 | 0.679 |
| PR5 | 0.734 | |||
| PR6 | 0.600 | |||
| EA | EA3 | 0.702 | 0.689 | 0.683 |
| EA4 | 0.632 | |||
| EA5 | 0.616 | |||
| ATT | ATT1 | 0.660 | 0.794 | 50.804 |
| ATT2 | 0.799 | |||
| ATT3 | 0.770 | |||
| PI | PI1 | 0.812 | 0.801 | 0.813 |
| PI2 | 0.741 | |||
| PI3 | 0.732 |
Table 4.
Classification results of the latent profile model.
| Number of Profiles | AIC | BIC | αBIC | Entropy | P-value | Profile Probability(%) |
|---|---|---|---|---|---|---|
| 1 | 45479.9 | 45648.2 | 45540.2 | — | — | 100 |
| 2 | 42646.3 | 42903.8 | 42738.6 | 0.856 | 0 | 39.0/61.0 |
| 3 | 41667.7 | 42014.2 | 41791.9 | 0.866 | 0.001 | 60.7/21.2/18.1 |
| 4 | 41169.5 | 41605.1 | 41325.6 | 0.864 | 0.005 | 8.5/46.6/33.2/11.7 |
| 5 | 40995.5 | 41520.3 | 41183.7 | 0.871 | 0.032 | 8.5/31.9/46.1/8.2/5.3 |
| 6 | 40808.7 | 41422.6 | 41028.7 | 0.805 | 0.684 | 5.6/20.0/24.6/14.3/10.2/25.3 |
Table 5.
Table of variance analysis.
| Variables | Psychological types (mean ± variance) | Significance | ||||
| Profile 1 n=89 |
Profile 2 n=333 |
Profile 3 n=481 |
Profile 4 n=86 |
Profile 5 n=55 |
||
| Perceived usefulness | 2.4±0.7 | 3.1±0.5 | 3.6±0.5 | 4.2±0.7 | 4.2±0.6 | *** |
| Perceived ease of use | 2.2±0.7 | 2.8±0.7 | 3.1±0.8 | 3.4±0.8 | 3.7±0.9 | *** |
| Perceived risk | 3.4±0.8 | 3.3±0.6 | 3.1±0.6 | 2.1±0.5 | 3.7±0.5 | *** |
| Environmental awareness | 3.4±0.8 | 3.4±0.6 | 3.8±0.6 | 4.3±0.6 | 4.5±0.5 | *** |
| Purchase attitude | 2.3±0.5 | 3.2±0.4 | 3.8±0.3 | 4.6±0.4 | 4.6±0.4 | *** |
| Purchase intention | 2.2±0.5 | 3.1±0.4 | 3.8±0.3 | 4.5±0.4 | 4.6±0.4 | *** |
*: P<0.1; **: P<0.05; ***: P<0.01, the same significance notation is consistently used in all subsequent tables.
Table 6.
Influencing factors for the classification.
| Influencing factor | Coefficient | Standard error | Influencing factor | Coefficient | Standard error |
|---|---|---|---|---|---|
| INTERCEPT2 | 1.029* | 0.738 | INTERCEPT4 | -2.128** | 1.085 |
| GENDER2 | 0.585** | 0.296 | GENDER4 | 1.105*** | 0.358 |
| AGE2 | -0.184 | 0.192 | AGE4 | -0.003 | 0.246 |
| KNOWLEDG2 | 0.376** | 0.163 | KNOWLEDG4 | 0.392* | 0.213 |
| INCOME2 | 0.103 | 0.157 | INCOME4 | -0.07 | 0.199 |
| PRO12 | 0.768* | 0.431 | PRO14 | -0.188** | 0.082 |
| PRO22 | -0.249 | 0.479 | PRO24 | 1.97*** | 0.726 |
| PRO32 | 0.238 | 0.406 | PRO34 | 1.239 | 0.768 |
| PRO42 | 0.511 | 0.615 | PRO44 | 0.991 | 0.74 |
| PRO52 | 0.322 | 0.471 | PRO54 | 2.124*** | 0.875 |
| PRO62 | -0.172 | 0.679 | PRO64 | 1.201 | 0.797 |
| DRIVE2 | 0.07 | 0.15 | DRIVE4 | -0.11 | 0.191 |
| NUMBER2 | -0.545** | 0.222 | NUMBER4 | -0.723** | 0.289 |
| PRICE2 | 0.028 | 0.165 | PRICE4 | 0.477*** | 0.203 |
| INTERCEPT3 | 1.689** | 0.711 | INTERCEPT5 | -0.996* | 1.074 |
| GENDER3 | 0.736*** | 0.287 | GENDER5 | 1.122*** | 0.398 |
| AGE3 | -0.223 | 0.186 | AGE5 | -0.28 | 0.281 |
| KNOWLEDGE3 | 0.327** | 0.157 | KNOWLEDG5 | 0.002 | 0.233 |
| INCOME3 | 0.104 | 0.152 | INCOME5 | 0.28 | 0.219 |
| PRO13 | 0.623 | 0.415 | PRO15 | 0.342 | 0.648 |
| PRO23 | -0.093 | 0.452 | PRO25 | 0.294 | 0.681 |
| PRO33 | -0.011 | 0.389 | PRO35 | -0.262 | 0.649 |
| PRO43 | 0.406 | 0.595 | PRO45 | 1.061 | 0.824 |
| PRO53 | -0.154 | 0.459 | PRO55 | 0.586 | 0.671 |
| PRO63 | -0.101 | 0.629 | PRO65 | 0.48 | 0.966 |
| DRIVE3 | 0.023 | 0.144 | DRIVE5 | 0.255 | 0.215 |
| NUMBER3 | -0.385* | 0.213 | NUMBER5 | -0.331 | 0.316 |
| PRICE3 | -0.048 | 0.16 | PRICE5 | -0.116 | 0.226 |
Table 7.
Influencing factors of purchase intention.
| Profile 1 | Profile 2 | Profile 3 | Profile 4 | Profile 5 | |
|---|---|---|---|---|---|
| GENDER | -0.419 | -0.171 | 0.031 | -0.300 | 0.898 |
| AGE | 0.268 | -0.077 | 0.045 | 0.238 | -1.115*** |
| KNOWLEDGE | 0.771*** | 0.016 | -0.06 | 0.156 | -1.306*** |
| INCOME | -0.297 | -0.299** | -0.236** | -0.322 | -0.257 |
| PROFESSION | 0.125 | -0.031 | 0.054 | 0.036 | -0.139 |
| DRIVE | 0.117 | 0.145 | 0.06 | 0.111 | 1.053*** |
| NUMBER | 0.256 | 0.366* | -0.256* | 0.098 | -0.457 |
| PRICE | 0.329 | -0.051 | 0.124 | 0.414* | 0.533 |
Table 8.
Analysis of the influencing factors of purchase attitude.
| Profile 1 | Profile 2 | Profile 3 | Profile 4 | Profile 5 | |
|---|---|---|---|---|---|
| GENDER | -0.451 | -0.259 | -0.381** | -0.033 | -0.890 |
| AGE | -0.434 | 0.142 | -0.014 | 0.485* | -0.297 |
| KNOWLEDGE | -0.17 | 0.299** | -0.009 | 0.398 | -0.413 |
| INCOME | -0.007 | -0.198 | -0.031 | -0.093 | 0.525 |
| PROFESSION | -0.185* | 0.035 | 0.002 | -0.065 | -0.105 |
| DRIVE | 0.188 | -0.022 | -0.016 | -0.002 | 0.303 |
| NUMBER | -0.900** | 0.163 | -0.120 | -0.348 | -0.655 |
| PRICE | 0.623** | -0.089 | 0.070 | 0.086 | 0.221 |
Table 9.
Analysis of PR influencing factors.
| Profile 1 | Profile 2 | Profile 3 | Profile 4 | Profile 5 | |
|---|---|---|---|---|---|
| GENDER | 1.017** | -0.098 | -0.652*** | 0.996** | -0.772 |
| AGE | -0.407 | 0.534*** | 0.142 | 0.038 | -0.470 |
| KNOWLEDGE | -0.55** | -0.022 | -0.063 | -0.460 | -0.607 |
| INCOME | 0.483** | -0.160 | 0.144 | -0.157 | 0.587* |
| PROFESSION | 0.090 | 0.085* | -0.022 | -0.197 | -0.053 |
| DRIVE | 0.047 | 0.151 | -0.058 | 0.156 | -0.200 |
| NUMBER | 0.079 | -0.009 | 0.317** | -0.031 | 0.367 |
| PRICE | -0.021 | 0.092 | -0.104 | 0.529** | -0.288 |
Table 10.
Analysis of EA influencing factors.
| Profile 1 | Profile 2 | Profile 3 | Profile 4 | Profile 5 | |
|---|---|---|---|---|---|
| GENDER | 0.529 | 0.020 | 0.175 | 0.565 | 0.260 |
| AGE | 0.091 | 0.314** | 0.290*** | 0.271 | 0.632* |
| KNOWLEDGE | 0.050 | 0.057 | 0.048 | -0.039 | 0.723 |
| INCOME | -0.371 | -0.178 | -0.091 | -0.494* | -0.285 |
| PROFESSION | 0.143 | 0.010 | -0.020 | 0.092 | 0.042 |
| DRIVE | -0.125 | -0.061 | -0.078 | 0.320 | -0.289 |
| NUMBER | 0.219 | 0.241 | 0.038 | 0.018 | -0.092 |
| PRICE | 0.058 | 0.004 | 0.180* | -0.173 | -0.061 |
Table 11.
Analysis of PU influencing factors.
| Profile 1 | Profile 2 | Profile 3 | Profile 4 | Profile 5 | |
|---|---|---|---|---|---|
| GENDER | -0.043 | 0.369* | 0.170 | -0.048 | -0.043 |
| AGE | 0.438 | 0.003 | 0.177 | 0.367 | 0.438 |
| KNOWLEDGE | 0.126 | -0.097 | -0.139 | 0.191 | 0.126 |
| INCOME | -0.250 | -0.086 | 0.055 | -0.305 | -0.250 |
| PROFESSION | -0.029 | 0.043 | -0.042 | -0.014 | -0.029 |
| DRIVE | 0.074 | -0.225* | -0.092 | 0.001 | 0.074 |
| NUMBER | 0.354 | -0.135 | -0.349** | 0.449 | 0.354 |
| PRICE | -0.564 | 0.203 | -0.045 | 0.170 | -0.564 |
Table 12.
Analysis of PEU influencing factors
| Profile 1 | Profile 2 | Profile 3 | Profile 4 | Profile 5 | |
|---|---|---|---|---|---|
| GENDER | -0.043 | 0.369* | 0.170 | -0.048 | -0.043 |
| AGE | 0.438 | 0.003 | 0.177 | 0.367 | 0.438 |
| KNOWLEDGE | 0.126 | -0.097 | -0.139 | 0.191 | 0.126 |
| INCOME | -0.250 | -0.086 | 0.055 | -0.305 | -0.250 |
| PROFESSION | -0.029 | 0.043 | -0.042 | -0.014 | -0.029 |
| DRIVE | 0.074 | -0.225* | -0.092 | 0.001 | 0.074 |
| NUMBER | 0.354 | -0.135 | -0.349** | 0.449 | 0.354 |
| PRICE | -0.564 | 0.203 | -0.045 | 0.170 | -0.564 |
Disclaimer/Publisher’s Note: The statements, opinions and data contained in all publications are solely those of the individual author(s) and contributor(s) and not of MDPI and/or the editor(s). MDPI and/or the editor(s) disclaim responsibility for any injury to people or property resulting from any ideas, methods, instructions or products referred to in the content. |
© 2025 by the authors. Licensee MDPI, Basel, Switzerland. This article is an open access article distributed under the terms and conditions of the Creative Commons Attribution (CC BY) license (http://creativecommons.org/licenses/by/4.0/).
Copyright: This open access article is published under a Creative Commons CC BY 4.0 license, which permit the free download, distribution, and reuse, provided that the author and preprint are cited in any reuse.


