
Submitted:
15 November 2025
Posted:
18 November 2025
You are already at the latest version
Abstract
The stability of miRNAs in biological fluids and their association with pathological conditions make miRNAs promising biomarkers for non-invasive disease diagnostics, including non-small cell lung cancer (NSCLC). However, variability in miRNA expression and technical aspects of quantitative reverse transcription PCR (RT-qPCR) necessitate effective normalization methods to ensure accurate evaluation of miRNA levels and identification of biological differences. In this study, we performed a comparative analysis of several miRNA normalization approaches applied to extracellular vesicles isolated from plasma of NSCLC patients, including pairwise normalization, “Tres” and “Quadro” normalization strategies, normalization to the mean, and normalization considering miRNA functional groups. Method effectiveness was evaluated using quality metrics of diagnostic models. The most robust results were observed with normalization methods utilizing miRNA pairs, triplets, and quadruplets, which provided high accuracy, model stability, and minimal overfitting. In contrast, normalization to the general or exclusive mean and functional group-based normalization showed lower efficiency in terms of classification performance and feature selection stability. These findings highlight the critical importance of normalization strategy choice to improve the accuracy and interpretability of RT-qPCR-based diagnostic models, particularly in the development of biomarker panels for NSCLC diagnostics. Pairwise normalization, combining computational simplicity and high efficiency, appears optimal for practical applications.
Keywords:
NSCLC
; RT-qPCR
; normalization
; miRNA
; differential expression
; diagnostic model
; lung cancer
1. Introduction
MiRNAs are small non-coding RNAs that play a key role in regulating gene expression and, consequently, biological processes. The stability of miRNAs in biological fluids and the correlation of extracellular miRNA expression levels in these fluids with pathological conditions make them promising biomarkers for non-invasive or minimally invasive diagnostics of various diseases, including oncological, cardiovascular, neurological, etc [1,2,3]. Among the drawbacks of using miRNAs as biomarkers are the variability of their expression depending on sample type and physiological state, as well as the use of indirect methods to assess their concentrations (reverse transcription polymerase chain reaction, RT-qPCR), which implies the need for normalization of individual miRNA expression data. Inadequate normalization can lead to incorrect assessment of expression levels and false conclusions [4]. Thus, the reliability of data regarding the content of individual miRNAs depends on the correctness of the normalization applied, and different normalization strategies can significantly affect the analysis outcomes of miRNA expression and the identification of meaningful biological differences [5,6,7]. Several normalization methods are widely used to assess individual miRNA levels, namely: normalization to stably expressed RNA molecules (e.g., miR-16, U6, miR-191), global normalization to the mean level of all miRNAs studied in the experiment, pairwise normalization of individual miRNAs, as well as TMM (trimmed mean of M-values) and VSN (variance stabilization normalization) methods [4,5,8,9]. Despite the abundance of methods, there is no universal "best" normalization technique for assessment of miRNA levels; the choice depends on data type, measurement platform, and research objective [4,5,10]. Each normalization method has advantages and disadvantages. For example, normalization to “housekeeping” miRNAs like miR-16 is often used as a simple internal control, but the stability of miR-16 expression varies across tissues, pathological and physiological states. Variants of global normalization (to the overall mean or similar) and functional normalization (to functionally important miRNAs) consider more complex biological relationships and can provide information on the contribution of studied miRNAs to the investigated phenomenon but require larger datasets and more complex computations. Quantile normalization is a method aimed at making signal intensity distributions identical across all samples. For this, values in each sample are sorted, averaged by rank, and returned to their original order, ensuring the same empirical distribution across all data. The method is widely used in microarray data analysis and similar data arrays obtained by other methods and effectively removes technical variation without considering a function describing data distribution [5]. The TMM method is based on calculating the trimmed mean of log-fold changes between pairs of samples, excluding extreme values and accounting for technical biases such as total expression level [11]. TMM normalization effectively balances differences in sequencing library depth and is often used to analyze RNA expression profiles after massively parallel sequencing. Another normalization method, VSN, transforms data so that variance minimally depends on the mean, thereby stabilizing expression variability and improving data comparability [12]. VSN uses models based on assumptions about noise and signal intensity distribution, increasing the reliability of subsequent analysis [5]. However, despite their advantages, quantile normalization, TMM, and VSN are generally not applied to normalize RT-qPCR data, including miRNA analysis [5]. The cycle threshold (Ct) value measured by RT-qPCR reflects the expression level of individual miRNAs rather than the distribution of signal intensities across the entire panel simultaneously, as in microarrays or RNA-Seq. Since quantile normalization aims to equalize value distributions across the entire sample set, its application to Ct values, which reflect individual rather than global characteristics, is inappropriate. Similarly, the TMM method, designed to align library size and remove extreme values in RNA-Seq data, loses relevance for RT-qPCR, where the number of miRNAs studied is small. VSN, intended to stabilize variance in large continuous datasets, is ineffective for RT-qPCR Ct values as its statistical assumptions do not fit the nature of discrete RT-qPCR data. As a result, RT-qPCR data normalization commonly uses stable reference genes (e.g., miR-16 or snRNA U6), the mean Ct of several stable miRNAs, or the ΔCt method to correct technical variation without distorting biological data [4].
The aim of this study is a comparative analysis of normalization methods for circulating miRNA expression data obtained by quantitative reverse transcription PCR to identify diagnostic miRNA markers, select the best ones, and form diagnostic panels based on them. Accordingly, we focused on comparing several normalization techniques: pairwise normalization, Tres- and Quadro-normalization (to the mean of pairs and triplets of miRNAs), normalization to the mean level of studied miRNAs, and specific functional normalization considering the division of miRNAs into pools of tumor suppressor and oncogenic miRNAs. The choice of these approaches is based on previously reported data regarding the efficiency of different miRNA expression normalization methods for solving the stated task and gaining insight into the biological role of miRNA markers. In this study, normalization methods were evaluated using model quality metrics, computational resources, and stability of feature selection on RT-qPCR miRNA level data from blood extracellular vesicles (EVs) of patients with non-small cell lung cancer (NSCLC) and healthy donors (HD).
It was shown that pairwise normalization, Tres-, and Quadro-normalizations are optimal for RT-qPCR data normalization aimed at discovering potential lung cancer markers and marker panels, which may improve NSCLC diagnostic accuracy using circulating miRNAs analyzed by RT-qPCR.
2. Materials and Methods
2.1. Samples of Biological Fluids and Their Analysis
This study utilized plasma EVs samples from 27 HD and 19 NSCLC patients, obtained from the National Medical Research Center named after Academician Meshalkin and the Federal State Budgetary Institution "Research Institute of Pulmonology" of the Federal Medical-Biological Agency of Russia.
All patients and donors provided informed voluntary consents to participate in the research. The study was approved by the Ethics Committees of the Federal State Budgetary Institution Institute of Chemical Biology and Fundamental Medicine of the Siberian Branch of the Russian Academy of Sciences (protocol No. 10 dated December 22, 2008) and the Federal State Budgetary Institution "Research Institute of Pulmonology" (protocol LEC No. 04-24 dated June 24, 2024). The donors' ages and disease stages according to the TNM classification are provided in Table 1.
Blood processing and isolation of EVs with subsequent miRNA extraction were performed as described in [13]. Real-time reverse transcription PCR (RT-qPCR) to assess expression levels of 17 microRNAs (primer and probe sequences are listed in Table 2) was conducted as described in [13] in two setups (miR-19b, -374a, -324, -22, -222, -133b, -144, -425 and miR-205, -660, -30e, -125b, -92a, -378a, -375, -27b, -31).
*Conditionally, since these normalization types include all investigated miRNAs.
As an internal spike-in control, cel-miR-39 was added to each sample before extraction, and its amount was subsequently quantified by real-time RT-qPCR (primer and probe sequences are given in the table) and used as a criterion for sample inclusion/exclusion in the analysis.
2.2. Methods of miRNA Expression Normalization and Statistical Analysis
The following normalization methods were used for miRNA expression analysis:
- Pairwise normalization (PN): For each unique miRNA pair, the difference between their Ct values was calculated. This accounts for relative expression of two miRNAs, reducing the influence of common technical variability.
- Tres normalization (TN): ΔCt values were calculated for each triplet of microRNAs by subtracting the mean Ct of the other two miRNAs in the triplet from the Ct of each miRNA. This method extends the concept of pairwise normalization by considering relationships among three markers.
- Quadro normalization (QN): ΔCt values were calculated for each quadruplet of miRNAs by subtracting the mean Ct of the other three miRNAs in the quadruplet from the Ct of each miRNA. This further extends pairwise normalization by considering relationships within groups of four markers.
- Normalization to the arithmetic mean (overall mean, OM): Ct values for each miRNA were normalized by subtracting the mean Ct of all miRNAs in the panel. This approach standardizes variability of overall expression in the sample.
- Normalization to the exclusive mean (EM): For each miRNA, Ct was normalized by subtracting the mean Ct of all other miRNAs in the panel, excluding the one being normalized.
- Normalization to mean considering expression level (NME): miRNAs were classified as tumor suppressors or oncogenes based on average Ct differences between NSCLC patients and HD. Tumor suppressor miRNAs (upregulated in HD and downregulated in NSCLC) were normalized against the mean of oncogenic miRNAs (upregulated in NSCLC and downregulated in HD), and vice versa. This approach accounts for biological roles of miRNAs and allows correcting mutual influence of functional groups.
- Normalization to mean considering function (NMF): miRNAs were classified into tumor suppressor and oncogenic groups based on two criteria: a) expression differences between NSCLC and HD; b) only miRNAs with statistically significant intergroup differences were included. Tumor suppressor miRNAs were normalized to the mean of oncogenic, and vice versa. This method, like the previous one, incorporates biological function but applies stricter group selection criteria.
Each normalization approach was implemented in R. Subsequently, statistical filtering of variables was performed based on distribution analysis using the Shapiro-Wilk test (if normal distribution, t-test was used to identify intergroup differences; if not, the non-parametric Kruskal-Wallis test was applied). Only features with significant intergroup differences (p < 0.05) were included in the final dataset.
Next steps included feature space expansion and cleaning, class balancing via bootstrapping, and 100-fold bootstrap on training data to select optimal regularization parameter λ (each time the sample was randomly split into training (30%) and testing (70%) subsets). The median λ from the 100 repeats was used to build the final LASSO model on the training data. Informative features were selected based on LASSO coefficients and used to build a diagnostic model based on Random Forests (RF) with 100-fold bootstrapping (each time the sample was randomly split into training (30%) and testing (70%) subsets, averaged results for test sets are presented in the Results section).
This combined analysis approach showed the highest effectiveness in a previous comparative study of machine learning methods [14]. The script also included data visualization: average ROC curve from 100 repeats, mean SHAP (Shapley Additive exPlanations, importance ranking) values for all donors (overall feature importance for the model).
The models were evaluated by metrics averaged over 100 bootstrap iterations:
- Accuracy (mean ± SD): proportion of correct predictions among all observations; overall classification quality. Calculated as the sum of true positives and true negatives divided by total number of cases; range 0-1.
- F1 score (mean ± SD): harmonic mean between Precision and Sensitivity. Balances the ability to detect positive diagnoses while minimizing false positives; range 0-1 where 1 indicates perfect balance.
- AUC (mean ± SD): area under the ROC curve. Measures model’s ability to distinguish classes at different probability thresholds; ranges from 0.5 (random chance) to 1 (perfect).
- Precision (mean ± SD): proportion of correctly classified positive cases among all cases predicted as positive by the model; important when false positives are risky; range 0-1.
- Sensitivity (mean ± SD): proportion of true positives among all actual positives (true patients); range 0-1.
- Specificity (mean ± SD): proportion of correctly identified negatives among all negatives; higher specificity means fewer false positives; range 0-1.
- OverfitGap (mean ± SD): metric showing model overfitting degree, e.g., difference between performance on training and testing sets; lower is better; expressed as fraction or percent.
- MCC (mean ± SD) (Matthews Correlation Coefficient): balanced metric considering all confusion matrix elements; ranges from -1 (complete error) to +1 (perfect); 0 means random chance.
- Jaccard Index: feature selection stability, reflecting similarity between feature sets in different repetitions or model variations; used to assess reliability and reproducibility of feature selection in diagnostic and prognostic models; defined as the intersection size divided by union size of two feature sets; ranges 0 (no overlap) to 1 (perfect overlap).
These metrics jointly assess the accuracy and reliability of diagnostic models and help select the most optimal depending on clinical conditions and data analysis tasks. Models with the highest values for all listed metrics except OverfitGap, which should be minimized, possess the greatest diagnostic significance. Additional evaluation metrics included training and inference time, i.e., the time spent on data processing and obtaining results.
3. Results
The analysis included data where the Ct values of investigated miRNAs were below 40; all samples met this criterion. The Ct values for the spike-in control cel-miR-39 across all samples averaged 25 with a variability of ±1. Its consistent Ct across samples indicates uniform RNA extraction and reverse transcription efficiency, validating the reliability of microRNA quantifications in the study.
A comparative analysis of various miRNA normalization methods was performed, assessing their effectiveness using key model quality metrics and computational parameters. No statistically significant differences were found between the two variants of mean normalization methods (OM and EM); the number of features in the final model was identical (5 out of 17). The only difference was a higher average training time for the normalization method using the exclusive mean of miRNAs (EM), likely due to computational characteristics, but it did not significantly affect model quality. Therefore, both variants are further considered a single method.
Normalization by functional group (NMF) - separating oncogenic and tumor suppressor miRNAs, using a pre-selection of miRNAs with significant intergroup differences - resulted in selection of only miR-324 with modest diagnostic performance: AUC 0.73, sensitivity 83%, specificity 40%. Due to low diagnostic efficiency, this method was excluded from further analysis. The comparative results of other normalization methods with evaluation of model quality metrics are presented in Table 4.
The final number of features in diagnostic panels ranged from 8 to 3 (Table 2, Table 3 and Table 4, Figure 1). Information on the set and representation of miRNAs in the final diagnostic models is shown in Table 2 and Table 3.
The pairs selected in the PN diagnostic model included 10 miRNAs (8 features) (Table 2). Twelve miRNAs were part of the 8 features in the TN diagnostic model. Thirteen microRNAs were included among the 7 features in the QN diagnostic model.
The final OM and EM normalization models included 5 features: miR-30, miR-205, miR-660, miR-222, and miR-125. Three of these microRNAs also appeared in the functional group-based normalization (NME) diagnostic panel: miR-30, miR-660, miR-125.
None of these normalization methods' final models included miR-31 or miR-375, and miR-200 and miR-324 appeared only once (Table 2).
The AUC metric reached its maximum in TN and QN methods, with PN showing a marginal difference (Figure 2). AUC values dropped notably for normalization to means (OM and EM) and even more for normalization considering miRNA functions (NME). Similar patterns were found for recall, sensitivity, specificity, and MCC (Table 4).
The overfit gap metric was minimal in PN, TN, and QN, indicating absence of overfitting in diagnostic panels based on these normalizations, but it increased substantially across OM, EM, and NME.
All examined methods demonstrate good control of overfitting with low overfit gap values, with the lowest values observed in PN, TN, and QN, despite the increased number of markers analyzed.
Training and inference times were lowest for pairwise normalization (0.02 s), increasing sequentially for TN, QN, functional group, and mean normalizations. Memory consumption was minimal and did not differ significantly among the methods.
Feature selection stability, measured by the Jaccard index, was highest in normalization accounting for functional groups, associated with a reduced number of selected features. This was followed by TN, PN and QN, whereas stability was lower for mean normalizations. The low stability observed for OM and EM normalizations likely indicates averaging of feature importance under these methods, resulting in different features being selected across bootstraps but with overall similar diagnostic significance of the resulting models.
Thus, normalization methods based on one or a few miRNAs (PN, TN, and QN) provide the highest accuracy and balance in models. Though similar in performance, TN achieves the best diagnostic results.
4. Discussion
The question of optimal normalization of miRNA data obtained by RT-qPCR remains unresolved. Current studies largely focus on identifying single miRNA normalizers [15,16] or several miRNAs for this purpose [17]. Rarely, normalization to initial sample amount, total nucleic acid concentration, or volume is used [18]. This study presents a comparative analysis of several miRNA normalization methods applied to RT-qPCR data aiming to optimize the search for NSCLC diagnostic markers.
Our results demonstrate high effectiveness of normalization methods using 1-3 miRNA normalizers for building NSCLC diagnostic models. High AUC, accuracy, sensitivity, and specificity values achieved with PN indicate a superior capacity to reduce technical variability and enhance biological signal. These findings align with previous reports; Boeri et al. [8] proposed pairwise normalization to increase RT-qPCR sensitivity and specificity in oncological microRNA analysis. Similarly, Schwarzenbach et al. [5] and Meyer et al. [4] reported that using multiple miRNAs as normalizers better compensates technical variation and stabilizes models compared to normalization with universal housekeeping miRNAs.
Normalization to the mean and to the mean considering classification of miRNAs into oncogenic and tumor suppressor groups showed comparatively poorer classification performance and lower feature selection stability than PN, TN, and QN methods. This likely reflects over-averaging of biologically meaningful variation or insufficient adaptation to clinical data specifics - a conclusion supported by literature noting that excessive averaging during normalization can obscure biologically important miRNA differences and reduce diagnostic power [7].
Normalization by miRNA functional groups is conceptually attractive as it incorporates biological roles and interactions of markers. However, our results showed relatively low efficiency and stability for this approach compared to PN, TN, and QN. MiRNAs regulate numerous genes and pathways, with one miRNA targeting multiple genes and vice versa [19]. In tumors, miRNAs can compensate for each other’s expression changes, creating complex nonlinear interactions that challenge simplified normalization models based on group averaging. Reduced accuracy, AUC, sensitivity, and specificity suggest that functional group averaging dilutes important individual expression differences, introducing biological ambiguity. Methods in the PN-QN group better capture individual relative changes. This aligns with evidence that miRNA biological heterogeneity and complex regulation limit simplified mean-based normalizations [4,5]. Nonetheless, such approaches may enhance interpretability and provide functionally sound normalization in specific research contexts, especially in pathogenetic and therapeutic studies (e.g., suppressing oncogenic miRNAs and restoring tumor suppressors).
The computational efficiency depends on normalization method; PN requires the shortest training and inference times, consistent with the fundamental algorithmic load differences reported by Mestdagh et al. [9], representing a practical advantage for clinical and research applications necessitating resource minimization.
The number of miRNAs included in diagnostic models ranged from 3 to 8 (out of 17 studied), balancing biological signal completeness and model parsimony to enhance stability and interpretability. The PN and TN models included 8 features each, while the QN model had 7. The total unique miRNAs increased from PN to QN, reflecting higher-dimensional feature space expansion. The PN model comprised 10 miRNAs; miR-19, -425, -125, -205, -92, and -660 predominated, forming diagnostic pairs (8 features total). TN increased unique miRNAs to 12 (adding miR-133, -222, -27; dropping miR-30), with miR-660 (4 features) and miR-144 (3 features) dominating, suggesting diagnostic relevance and likely involvement in disease-associated biological processes. QN altered the panel by adding miR-324 and -200, totaling 14 miRNAs forming 7 diagnostic features. Overall, PN, TN, and QN identify overlapping marker miRNAs; adding new miRNAs does not always yield additional diagnostic features. Considering feasibility, simplicity, performance, and cost, pairwise normalization is optimal, though TN and QN can validate marker selection or improve diagnostic metrics and provide insights into miRNA regulatory interactions implicated in pathology.
Most studied miRNAs featured in PN, TN, and QN diagnostic signatures, appearing in numerator, denominator, or with varying SHAP importance signs, complicating cross-method data analysis but allowing comparisons. For example, miR-19 appears 2, 2, and 3 times in PN, TN, and QN respectively, always in the numerator with positive SHAP importance, similarly for miR-22, suggesting lower expression in patients relative to HD. This partly aligns with literature describing both oncogenic (miR-19 [20,21]) and tumor suppressor (miR-22 [22,23,24]) roles. MiR-425 is largely in denominators with mostly positive SHAP values (except 1 of 7 unique markers), indicating higher expression in patients, consistent with its role in promoting NSCLC growth via the PTEN/PI3K/AKT pathway [25,26].
All miRNAs from mean normalization models (miR-30, miR-205, miR-660, miR-222, miR-125) also appear in PN, TN, and QN panels; miR-30 exclusively in PN, miR-222 in TN and QN. MiR-125 and miR-660 feature in all five diagnostic panels (including NME); miR-205 in four, highlighting their robustness as NSCLC biomarker candidates confirmed in literature [27,28,29,30,31,32,33,34,35,36].
MiRNAs appearing only once or twice in models were few (two in each case), suggesting significant overlap between normalization variants and indicating lower biomarker potential for those (miR-27, -133, -200, -324). MiR-31 and miR-375 did not appear in any model, denoting low diagnostic value and limited utility in NSCLC marker panels.
In summary, PN, TN, and QN normalization methods effectively analyze RT-qPCR data to identify potential cancer markers. Other methods, such as normalization to overall or exclusive means (OM, EM) and mean normalization considering oncogenic and tumor suppressor marker grouping, are less effective for marker discovery and diagnostic system building but provide supplementary insights into disease mechanisms and help identify biologically significant, stably represented candidate miRNA markers in biological fluids. These methods are recommended as complementary tools, at least in early marker panel selection stages.
Author Contributions
Conceptualization, M. Y. Konoshenko and P. P. Laktionov; methodology, O. E. Bryzgunova; software, M. Y. Konoshenko; validation, O. E. Bryzgunova; formal analysis, M. Y. Konoshenko; investigation, E. V. Shutko, E. A. Murina, A. A.; resources, Danilova Y.M. and Gorbunkov S.D.; data curation, Ilyushchenko A.A.; writing—original draft preparation, M. Y. Konoshenko ; writing—review and editing, P. P. Laktionov ; visualization, M. Y. Konoshenko; project administration and funding acquisition, Zykov K.A. and Gorbunkov S.D.. All authors have read and agreed to the published version of the manuscript.
Funding
The study was funded by the Russian state-funded project for the FBSI "Research Institute of Pulmonology" of the FMBA of Russia (grant number 388-03-2024-136) and supported by the Russian state-funded project for ICBFM SB RAS (grant number 125012900932-4).
Institutional Review Board Statement
The study was approved by the Ethics Committees of the Federal State Budgetary Institution Institute of Chemical Biology and Fundamental Medicine of the Siberian Branch of the Russian Academy of Sciences (protocol No. 10 dated December 22, 2008) and the Federal State Budgetary Institution "Research Institute of Pulmonology" (protocol LEC No. 04-24 dated June 24, 2024).
Informed Consent Statement
Not applicable.
Data Availability Statement
The original contributions presented in this study are included in the article/supplementary material. Further inquiries can be directed to the corresponding author(s).
Conflicts of Interest
All authors declare no conflict of interests.
References
- Sohel, M.M.H. Circulating microRNAs as biomarkers in cancer diagnosis. Life Sci. 2020, 248, 117473. Epub 2020 Feb 27. [CrossRef] [PubMed]
- Koskimäki, J.; Jhaveri, A.; Srinath, A.; Bindal, A.; Vera Cruz, D.; Yeradoddi, G.P.; Lightle, R.; Lee, J.; Stadnik, A.; Iqbal, J.; Alcazar-Felix, R.; Hage, S.; Romanos, S.; Shenkar, R.; Loeb, J.; Faughnan, M.E.; Weinsheimer, S.; Kim, H.; Girard, R.; Awad, I.A. Common and distinct circulating microRNAs in four neurovascular disorders. Biochem. Biophys. Rep. 2025, 43, 102189. [CrossRef] [PubMed] [PubMed Central]
- Shah, V.; Panchal, V.; Shah, A.; Vyas, B.; Bhowmik, S.; Panchal, I.; Jain, P. Exosomal miRNAs as biomarkers in predicting chemotherapy-induced cardiotoxicity in patients with cancer (Review). Med Int (Lond) 2025, 5(6), 69. [CrossRef] [PubMed] [PubMed Central]
- Meyer, S.U.; Pfaffl, M.W.; Ulbrich, S.E. Normalization strategies for microRNA profiling experiments: a ‘normal’ way to a hidden layer of complexity? Biotechnol. Lett. 2010, 32(12), 1777-1788. Epub 2010 Aug 12. [CrossRef] [PubMed]
- Schwarzenbach, H.; et al. Data Normalization Strategies for MicroRNA Quantification. Clin. Chem. 2015, Nov;61(11):1333-42. Epub 2015 Sep 25. [CrossRef] [PubMed] [PubMed Central]
- Faraldi, M.; Gomarasca, M.; Sansoni, V.; Perego, S.; Banfi, G.; Lombardi, G. Normalization strategies differently affect circulating miRNA profile associated with the training status. Sci. Rep. 2019, 9(1), 1584. [CrossRef] [PubMed] [PubMed Central]
- Garmire, L.X.; Subramaniam, S. Evaluation of normalization methods in mammalian microRNA-Seq data. RNA 2012, 18(6), 1279-1288. Epub 2012 Apr 24. [CrossRef] [PubMed] [PubMed Central]
- Boeri, M.; Verri, C.; Conte, D.; Roz, L.; Modena, P.; Facchinetti, F.; Calabrò, E.; Croce, C.M.; Pastorino, U.; Sozzi, G. MicroRNA signatures in tissues and plasma predict development and prognosis of computed tomography detected lung cancer. Proc. Natl. Acad. Sci. U.S.A. 2011, 108(9), 3713-3718. Epub 2011 Feb 7. [CrossRef] [PubMed] [PubMed Central]
- Mestdagh, P.; Van Vlierberghe, P.; De Weer, A.; Muth, D.; Westermann, F.; Speleman, F.; Vandesompele, J. A novel and universal method for microRNA RT-qPCR data normalization. Genome Biol. 2009, 10(6), R64. Epub 2009 Jun 16. [CrossRef] [PubMed] [PubMed Central]
- Pfaffl, M.W.; Ulbrich, S.E. Normalization strategies for microRNA profiling experiments: a ‘normal’ way to a hidden layer of complexity? Biotechnol. Lett. 2010, 32(12), 1777-1788. Epub 2010 Aug 12. [CrossRef] [PubMed]
- Robinson, M.D.; Oshlack, A. A scaling normalization method for differential expression analysis of RNA-seq data. Genome Biol. 2010, 11(3):R25. Epub 2010 Mar 2. [CrossRef] [PubMed] [PubMed Central]
- Huber, W.; von Heydebreck, A.; Sültmann, H.; Poustka, A.; Vingron, M. Variance stabilization applied to microarray data calibration and to the quantification of differential expression. Bioinformatics 2002, 18 (Suppl 1), S96-S104. [CrossRef] [PubMed]
- Konoshenko M. Yu., Laktionov P. P., Lancuhaj Yu. A. et al. Cell-free plasma miRNAs analysis for low invasive lung cancer diagnostics. Advanc Mol Onc. 2023;10(2):78–89. [CrossRef]
- Konoshenko M.Y., Bryzgunova O.E., Shutko E.V., Murina E.A., Ilyushchenko A.A., Danilova Y.M., Gorbunkov S.D., Zykov K.A., Laktionov P.P. Comparative Analysis of Machine Learning Methods for Cancer Diagnosis Based on miRNAs: LASSO Regression, Random Forest, SVM, and Their Combinations, Institute of Chemical Biology and Fundamental Medicine, Siberian Branch, Russian Academy of Sciences, Novosibirsk, Russia. 2025, (manuscript in preparation; to be submitted).
- Torso, N.G.; Quintanilha, J.C.F.; Cursino, M.A.; Pincinato, E.C.; Lima, C.S.P.; Moriel, P. Data Normalization of Urine miRNA Profiling from Head and Neck Cancer Patients Treated with Cisplatin. Int. J. Mol. Sci. 2023, 24(13), 10884. [CrossRef] [PubMed] [PubMed Central]
- Corral-Vazquez, C.; Blanco, J.; Salas-Huetos, A.; Vidal, F.; Anton, E. Normalization matters: tracking the best strategy for sperm miRNA quantification. Mol. Hum. Reprod. 2017, 23(1), 45-53. Epub 2016 Dec 8. [CrossRef] [PubMed]
- Want, A.; Staniak, K.; Grabowska-Pyrzewicz, W.; Fesiuk, A.; Barczak, A.; Gabryelewicz, T.; Kulczyńska-Przybik, A.; Mroczko, B.; Wojda, U. Optimized RT-qPCR and a novel normalization method for validating circulating miRNA biomarkers in ageing-related diseases. Sci. Rep. 2023, 13(1), 20869. [CrossRef] [PubMed] [PubMed Central]
- Komina, A.V.; Lavrentyev, S.N.; Ruksha, T.G. MicroRNAs and small interfering RNAs as tools for targeted regulation of cellular processes for therapy. Bull. Siberian Med. 2020, 19(1), 160-171.
- Makeyev, E.V.; Maniatis, T. Multilevel regulation of gene expression by microRNAs. Science 2008, 319(5871), 1789-1790. [CrossRef] [PubMed] [PubMed Central]
- Gu, Y.; Liu, S.; Zhang, X.; Chen, G.; Liang, H.; Yu, M.; Liao, Z.; Zhou, Y.; Zhang, C.Y.; Wang, T.; Wang, C.; Zhang, J.; Chen, X. Oncogenic miR-19a and miR-19b co-regulate tumor suppressor MTUS1 to promote cell proliferation and migration in lung cancer. Protein Cell 2017, 8(6), 455-466. Epub 2017 Mar 31. Erratum in Protein Cell 2024, 15(11), 866. doi:10.1093/procel/pwad062. PMID: 28364280; PMCID: PMC5445029. [CrossRef]
- Zaporozhchenko, I.A.; Morozkin, E.S.; Skvortsova, T.E.; Ponomaryova, A.A.; Rykova, E.Y.; Cherdyntseva, N.V.; Polovnikov, E.S.; Pashkovskaya, O.A.; Pokushalov, E.A.; Vlassov, V.V.; Laktionov, P.P. Plasma miR-19b and miR-183 as potential biomarkers of lung cancer. PLoS ONE 2016, 11(10), e0165261. [CrossRef] [PubMed] [PubMed Central]
- Zhang, K.; Li, X.Y.; Wang, Z.M.; Han, Z.F.; Zhao, Y.H. MiR-22 inhibits lung cancer cell EMT and invasion through targeting Snail. Eur. Rev. Med. Pharmacol. Sci. 2017, 21, (16), 3598–3604. [PubMed]
- Jiang, W.; Han, X.; Wang, J.; Wang, L.; Xu, Z.; Wei, Q.; Zhang, W.; Wang, H. miR-22 enhances the radiosensitivity of small-cell lung cancer by targeting WRNIP1. J. Cell Biochem. 2019, 120, (10), 17650–17661. Epub 2019 Jun 12. [CrossRef] [PubMed] [PubMed Central]
- Han, X.; Li, H.; Liu, S.; Zhao, Z. Study on the potential mechanism of miR-22-5p in non-small-cell lung cancer. Dis. Markers 2022, 2022, 3750734. [CrossRef] [PubMed] [PubMed Central]
- Zhou, J.S.; Yang, Z.S.; Cheng, S.Y.; Yu, J.H.; Huang, C.J.; Feng, Q. miRNA-425-5p enhances lung cancer growth via the PTEN/PI3K/AKT signaling axis. BMC Pulm. Med. 2020, 20, (1), 223. [CrossRef] [PubMed] [PubMed Central]
- Guo, Z.; Ye, H.; Zheng, X.; Yin, W.; He, J. Extracellular vesicle-encapsulated microRNA-425 derived from drug-resistant cells promotes non-small-cell lung cancer progression through DAPK1-mediated PI3K/AKT pathway. J. Cell Physiol. 2021, 236, (5), 3808–3820. Epub 2020 Nov 30. Retraction in: J. Cell Physiol. 2022, 237, (11), 4330. doi:10.1002/jcp.30897. PMID: 33258116. [CrossRef]
- Li, J.H.; Sun, S.S.; Li, N.; Lv, P.; Xie, S.Y.; Wang, P.Y. MiR-205 as a promising biomarker in the diagnosis and prognosis of lung cancer. Oncotarget 2017, 8, (54), 91938–91949. [CrossRef] [PubMed] [PubMed Central]
- Lei, L.; Huang, Y.; Gong, W. miR-205 promotes the growth, metastasis and chemoresistance of NSCLC cells by targeting PTEN. Oncol. Rep. 2013, 30, (6), 2897–2902. Epub 2013 Sep 30. [CrossRef] [PubMed]
- Zhao, Y.L.; Zhang, J.X.; Yang, J.J.; Wei, Y.B.; Peng, J.F.; Fu, C.J.; Huang, M.H.; Wang, R.; Wang, P.Y.; Sun, G.B.; Xie, S.Y. MiR-205-5p promotes lung cancer progression and is valuable for the diagnosis of lung cancer. Thorac. Cancer 2022, 13, (6), 832–843. Epub 2022 Jan 25. [CrossRef] [PubMed] [PubMed Central]
- Xu, L.B.; Xiong, J.; Zhang, Y.H.; Dai, Y.; Ren, X.P.; Ren, Y.J.; Han, D.; Wei, S.H.; Qi, M. miR-205-3p promotes lung cancer progression by targeting APBB2. Mol. Med. Rep. 2021, 24, (2), 588. Epub 2021 Jun 24. [CrossRef] [PubMed] [PubMed Central]
- Fortunato, O.; Boeri, M.; Moro, M.; Verri, C.; Mensah, M.; Conte, D.; Caleca, L.; Roz, L.; Pastorino, U.; Sozzi, G. Mir-660 is downregulated in lung cancer patients and its replacement inhibits lung tumorigenesis by targeting MDM2-p53 interaction. Cell Death Dis. 2014, 5, (12), e1564. [CrossRef] [PubMed] [PubMed Central]
- Wang, Z.; Su, X.; Zhan, Z.; Wang, H.; Zhou, S.; Mao, J.; Xu, H.; Duan, S. miR-660: A novel regulator in human cancer pathogenesis and therapeutic implications. Gene 2025, 953, 149434. Epub 2025 Mar 20. [CrossRef] [PubMed]
- Wang, X.; Zhang, Y.; Fu, Y.; Zhang, J.; Yin, L.; Pu, Y.; Liang, G. MicroRNA-125b may function as an oncogene in lung cancer cells. Mol. Med. Rep. 2015, 11, (5), 3880–3887. Epub 2014 Dec 31. [CrossRef] [PubMed]
- Yuxia, M.; Zhennan, T.; Wei, Z. Circulating miR-125b is a novel biomarker for screening non-small-cell lung cancer and predicts poor prognosis. J. Cancer Res. Clin. Oncol. 2012, 138, (12), 2045–2050. Epub 2012 Jul 18. [CrossRef] [PubMed] [PubMed Central]
- Tang, L.; Yuan, Y.; Zhai, H.; Wang, J.; Zhang, D.; Liang, H.; Shi, Y.; Duan, L.; Jiang, X. MicroRNA-125b-5p correlates with prognosis and lung adenocarcinoma progression. Front. Mol. Biosci. 2022, 8, 788690. [CrossRef] [PubMed] [PubMed Central]
- Wang, Y.; Zhao, M.; Liu, J.; Sun, Z.; Ni, J.; Liu, H. miRNA-125b regulates apoptosis of human non-small cell lung cancer via the PI3K/Akt/GSK3β signaling pathway. Oncol. Rep. 2017, 38, (3), 1715–1723. Epub 2017 Jul 12. [CrossRef] [PubMed]
Figure 1.
Global importance according to SHAP of markers included in the diagnostic models.
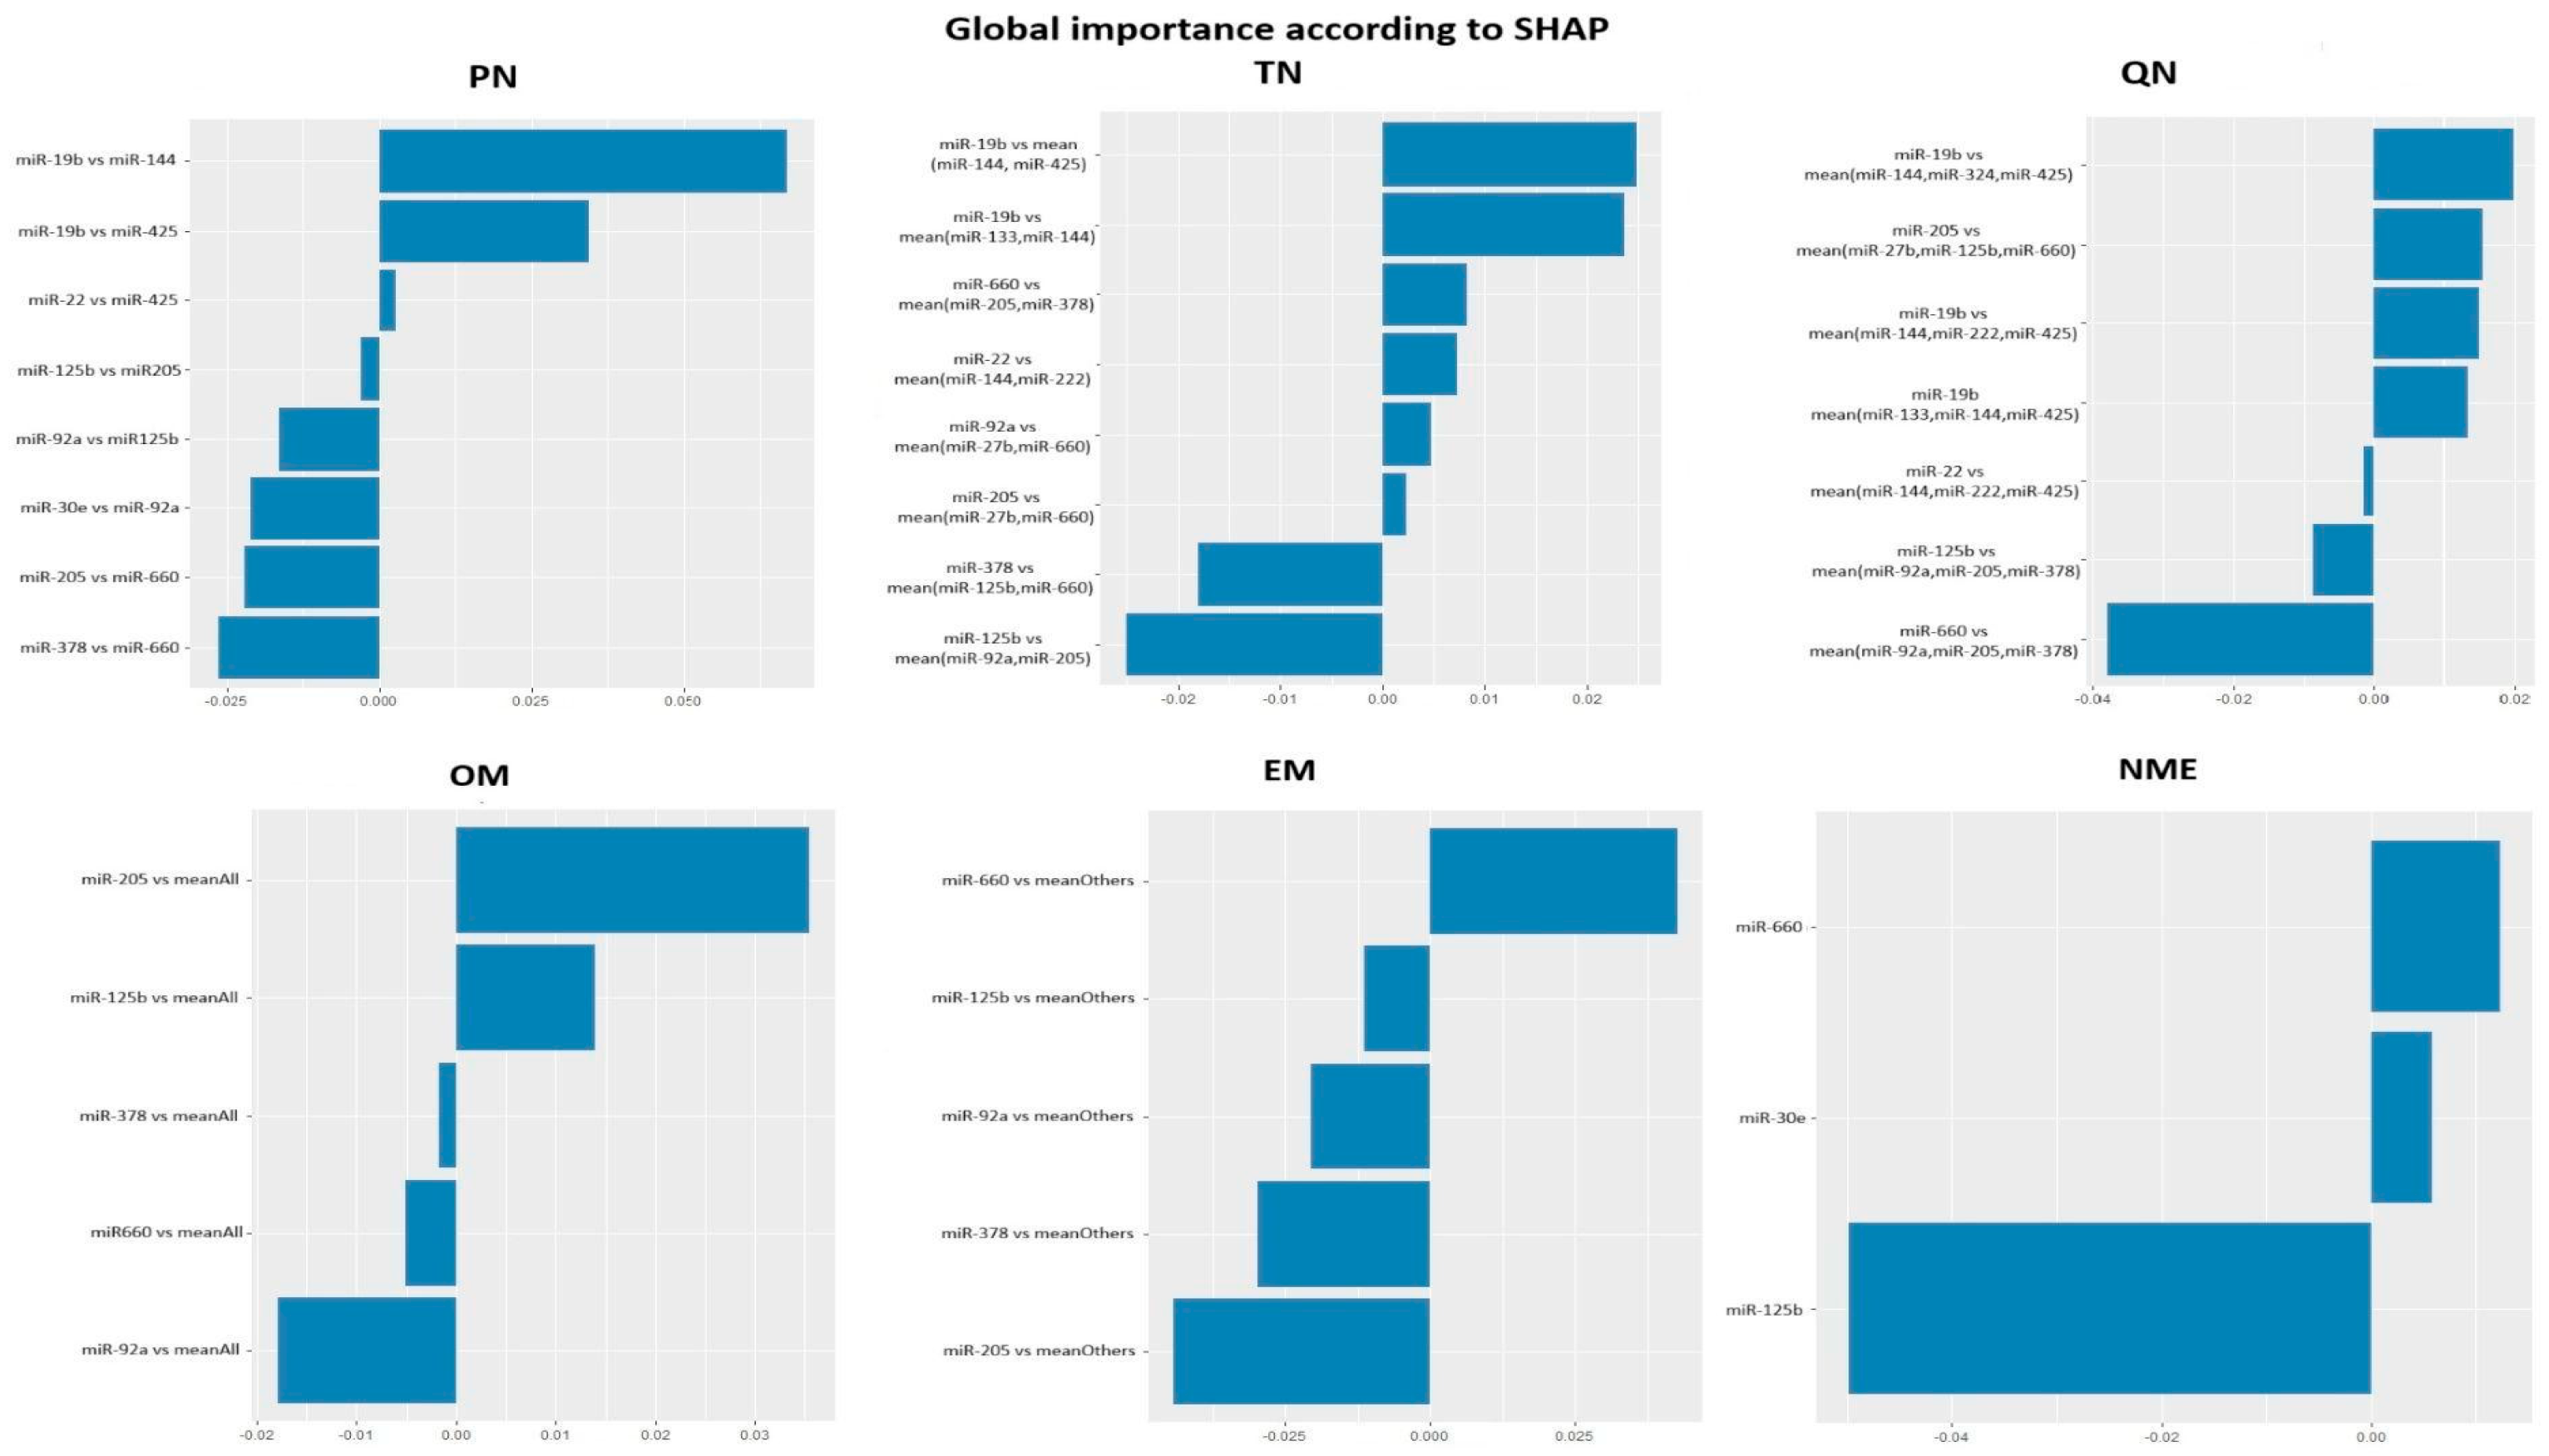
Figure 2.
Average ROC curve over 100 bootstraps of the RF-based diagnostic model using different normalization methods.
Figure 2.
Average ROC curve over 100 bootstraps of the RF-based diagnostic model using different normalization methods.
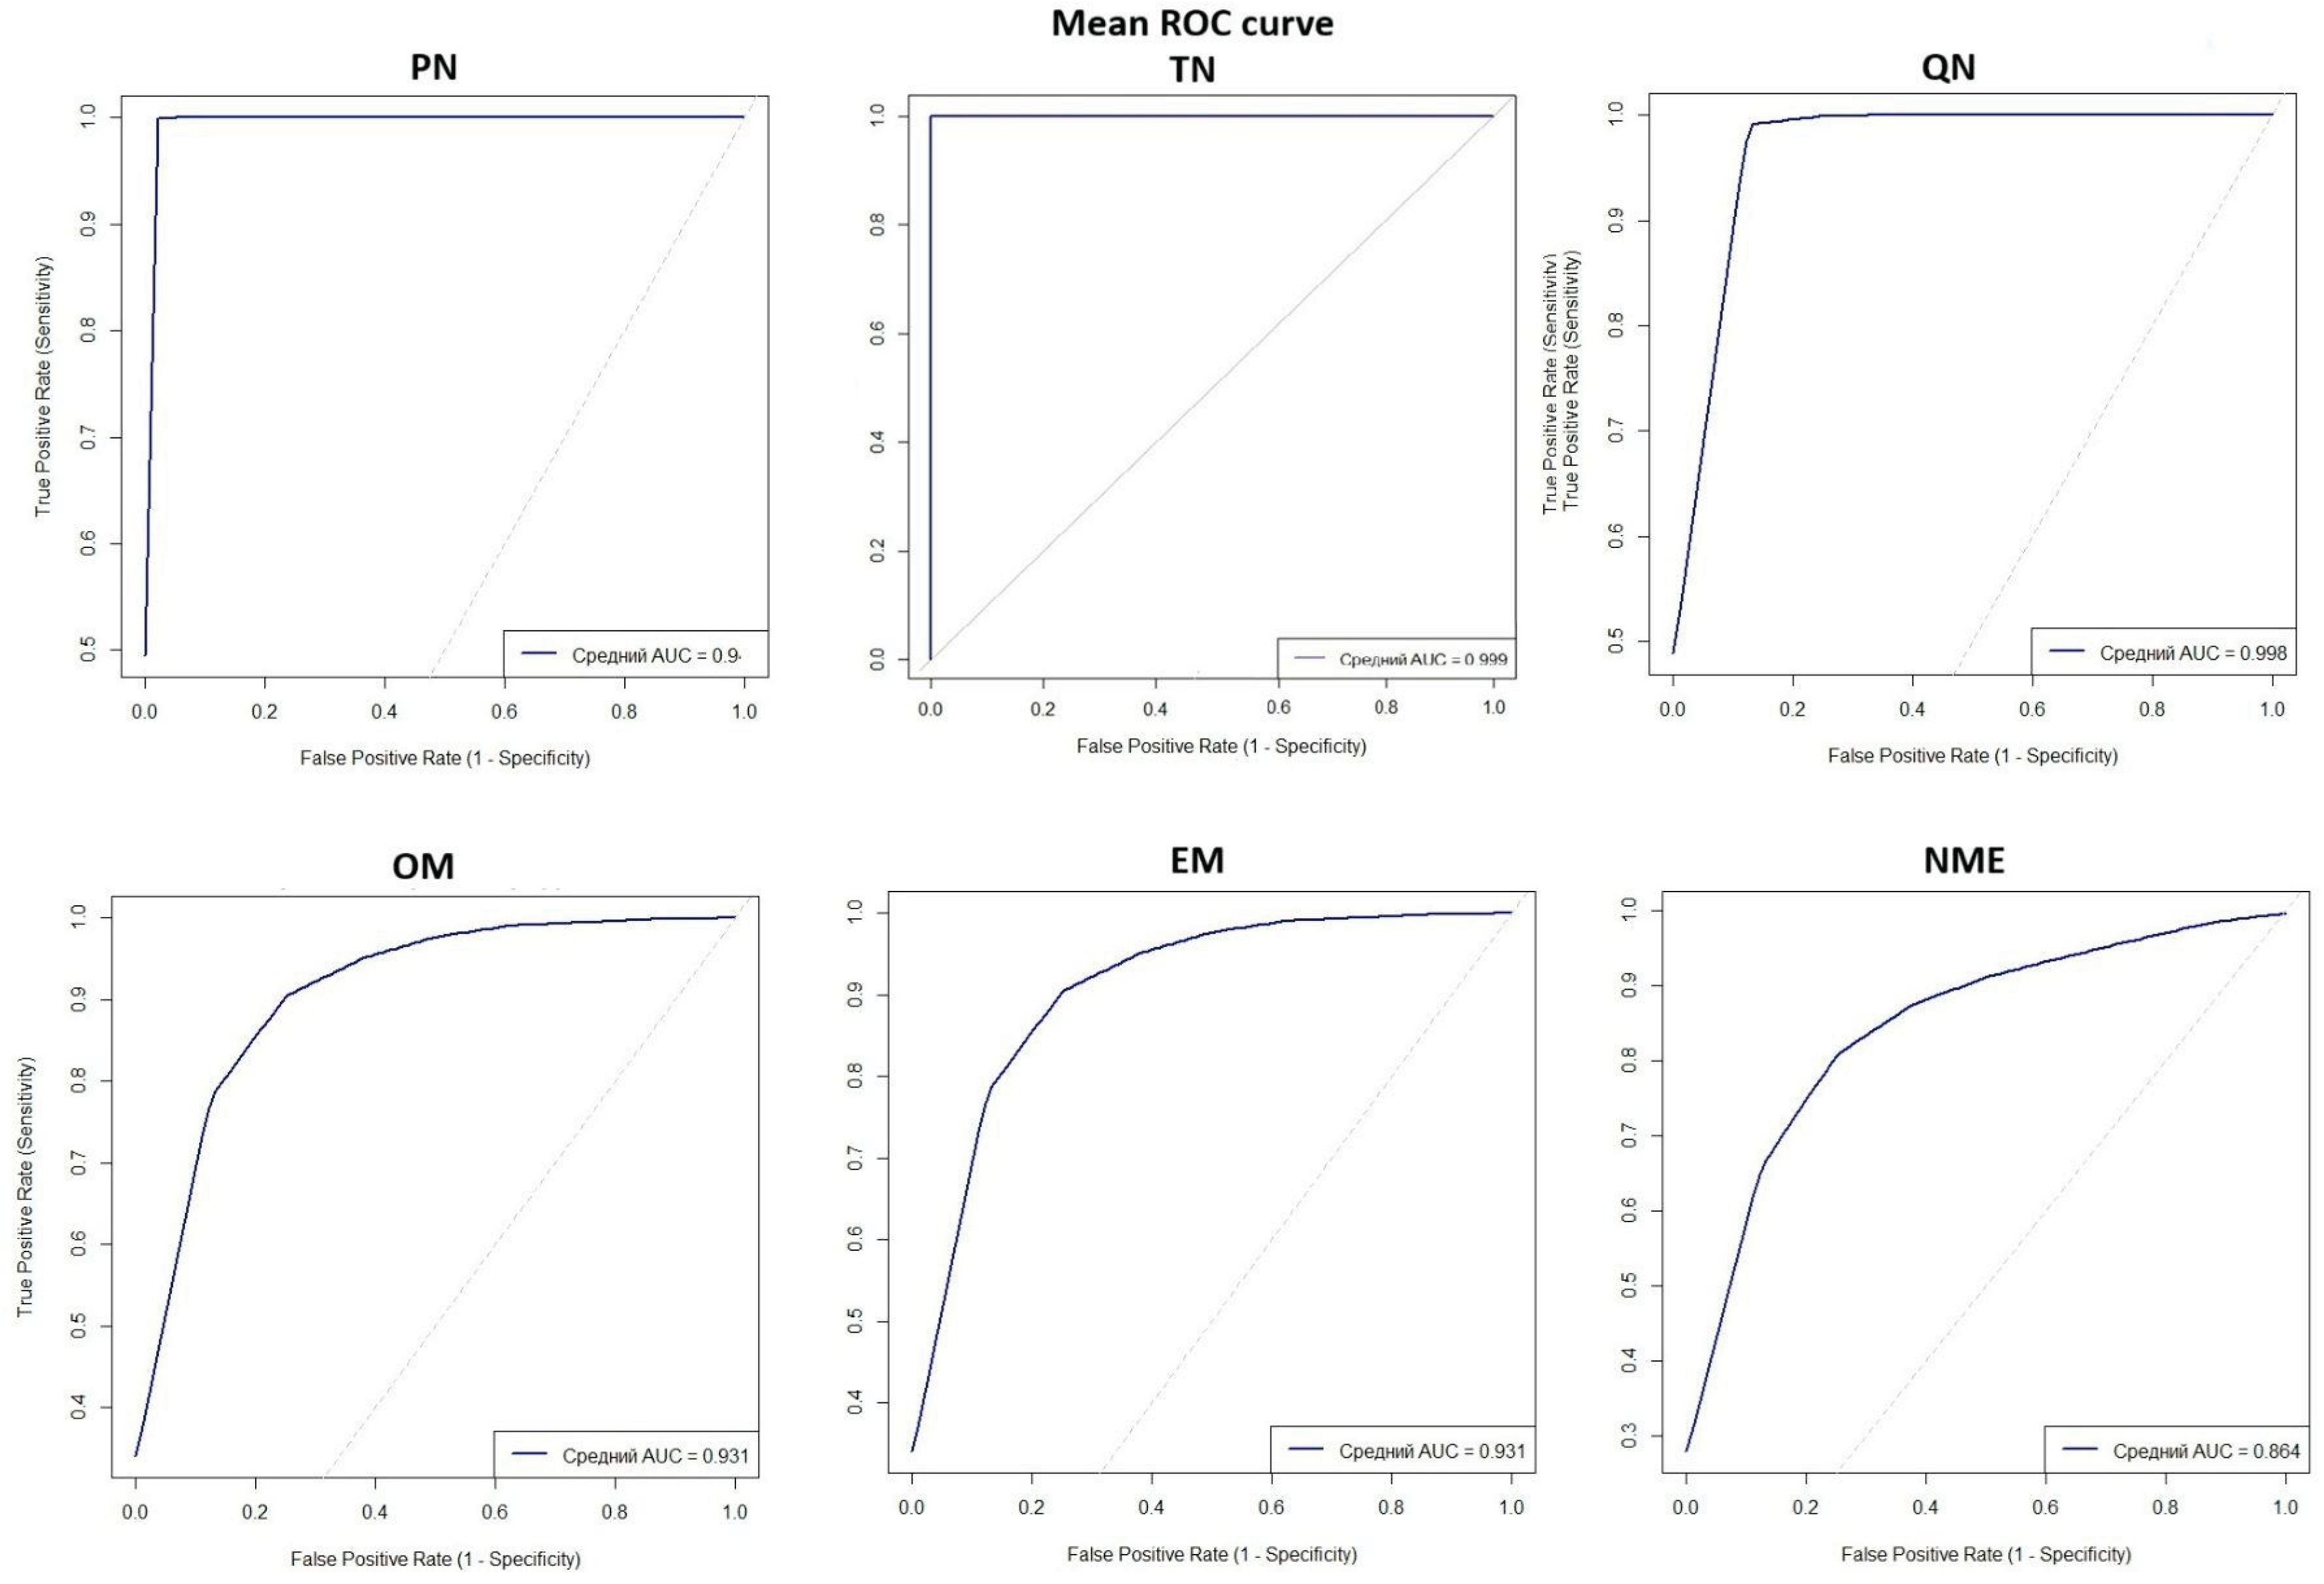

Table 1.
Clinical data of donors and NCLC patients.
| Clinical Data | Healthy donors, N=27 | NCLC patients, N= 19 | ||
|---|---|---|---|---|
| Age, years | Mean ± sd. | 53±5.4 | 66.4±9.9 | |
| Range | 45-62 | 37-78 | ||
| TNM | T | 1 | - | 21% |
| 2 | 37% | |||
| 3 | 32% | |||
| 4 | 10% | |||
| N | 0 | 53% | ||
| 1 | 32% | |||
| 2 | 11% | |||
| 3 | 4% | |||
| M | 0 | 95% | ||
| 1 | 5% | |||
Table 2.
Composition of diagnostic panels based on different normalization methods.
| Normalization methods | Markers in diagnostic panel |
| PN (Pairwise normalization) | miR-19 vs miR-144, miR-19 vs miR-425, miR-22 vs miR-425, miR-125vs miR-205, miR-92 vs miR-125, miR-30 vs 92, miR-205vs miR-660, miR-378 vs miR-660 |
| TN (Tres normalization) | miR-19 vs (miR-144+miR-425), miR-19 vs (miR-133+miR-144), miR-660 vs (miR-205+miR-378), miR-22 vs (miR-144+miR-222), miR-92 vs (miR-27+miR-660), miR-205 vs (miR-27+miR-660), miR-378 vs (miR-125+miR-660), miR-125 vs (miR-92+miR-205) |
| QN (Quadro normalization) | miR-19 vs (miR-144+miR-324+miR-425), miR-200 vs (miR-27+miR-125+miR-660), miR-19 vs (miR-144+miR-222+miR-425), miR-19 vs (miR-133+miR-144+miR-425), miR-22 vs (miR-144+miR-222+miR-425), miR-125 vs (miR-92+miR-205+miR-378), miR-660 vs (miR-92+miR-205+miR-378) |
| OM и EM* (mean) | miR-30, miR-205, miR-660, miR-222, miR-125 |
| NME* (mean considering expression level) | miR-30, miR-660, miR-125 |
Table 3.
Frequency of miRNA representation in diagnostic models.
| Normalization methods | miR-19 | miR-22 | miR-27 | miR-30 | miR-92 | miR-125 | miR-133 | miR-144 | miR-200 | miR-205 | miR-222 | miR-324 | miR-378 | miR-425 | miR-660 | miR-31 | miR-375 |
| PN (Pairwise normalization) | 2 | 1 | 0 | 1 | 2 | 2 | 0 | 1 | 0 | 2 | 0 | 0 | 1 | 2 | 2 | 0 | 0 |
| TN (Tres normalization) | 2 | 1 | 2 | 0 | 2 | 2 | 1 | 3 | 0 | 3 | 1 | 0 | 2 | 1 | 4 | 0 | 0 |
| QN (Quadro normalization) | 3 | 1 | 1 | 0 | 2 | 2 | 1 | 4 | 1 | 2 | 2 | 1 | 2 | 4 | 2 | 0 | 0 |
| OM и EM* (mean) | 0 | 0 | 0 | 1 | 0 | 1 | 0 | 0 | 0 | 1 | 1 | 0 | 0 | 0 | 1 | 0 | 0 |
| NME* (mean considering expression level) | 0 | 0 | 0 | 1 | 0 | 1 | 0 | 0 | 0 | 0 | 0 | 0 | 0 | 0 | 1 | 0 | 0 |
| The total number of markers | 7 | 3 | 3 | 3 | 6 | 8 | 2 | 8 | 1 | 8 | 4 | 1 | 5 | 7 | 10 | 0 | 0 |
| The total number of diagnostic models. | 3 | 3 | 2 | 3 | 3 | 5 | 2 | 3 | 1 | 4 | 3 | 1 | 3 | 3 | 5 | 0 | 0 |
*Conditionally, since these normalization types include all investigated miRNAs.PN method demonstrated the highest accuracy, with TN and QN methods showing comparable results. Accuracy significantly decreased with normalization to mean values and further declined with normalization considering miRNA functions. Similar trends were observed for the F1 metric, which represents the harmonic mean of precision and recall.
Table 4.
Effect of normalization on classification characteristics and diagnostic model performance parameters.
Table 4.
Effect of normalization on classification characteristics and diagnostic model performance parameters.
| Classification characteristics and diagnostic model performance parameters | PN (Pairwise normalization) | TN (Tres normalization) | QN (Quadro normalization) | OM (mean) | EM (exclusive mean ) | NME* (mean considering expression level) |
| The final number of unique markers | 8 of 64 | 8 of 420 | 7 of 784 | 5 of 17 | 5 of 17 | 3 of 17 |
| Accuracy (mean ± SD) | 0.980 ± 0.039 | 0.987 ± 0.030 | 0.977 ± 0.038 | 0.852 ± 0.083 | 0.864 ± 0.084 | 0.789 ± 0.096 |
| F1 (mean ± SD) | 0.980 ± 0.042 | 0.988 ± 0.027 | 0.977 ± 0.039 | 0.851 ± 0.086 | 0.862 ± 0.089 | 0.793 ± 0.097 |
| AUC (mean ± SD) | 0.998 ± 0.008 | 1.000 ± 0.002 | 1.000 ± 0.000 | 0.930 ± 0.055 | 0.935 ± 0.053 | 0.859 ± 0.088 |
| Precision (mean ± SD) | 0.974 ± 0.048 | 0.977 ± 0.051 | 0.970 ± 0.055 | 0.862 ± 0.108 | 0.872 ± 0.106 | 0.779 ± 0.101 |
| Sensitivity (mean ± SD) | 0.989 ± 0.056 | 1.000 ± 0.000 | 0.989 ± 0.051 | 0.859 ± 0.131 | 0.873 ± 0.138 | 0.825 ± 0.145 |
| Specificity (mean ± SD) | 0.971 ± 0.053 | 0.974 ± 0.060 | 0.965 ± 0.064 | 0.845 ± 0.135 | 0.855 ± 0.133 | 0.752 ± 0.141 |
| OverfitGap (mean ± SD) | 0.002 ± 0.008 | 0.000 ± 0.002 | 0.000 ± 0.000 | 0.070 ± 0.055 | 0.065 ± 0.053 | 0.141 ± 0.088 |
| MCC (mean ± SD) | 0.96 ± 0.005 | 0.97 ± 0.010 | 0.936 ± 0.009 | 0.708 ± 0.012 | 0.639 ± 0.012 | 0.626 ± 0.011 |
| Average training time (s) | 0.02 | 0.0754 | 0.035 | 0.083 | 0.3897 | 0.0602 |
| Average inference time (ms) | 0.870 | 3.597 | 1.457 | 3.554 | 3.173 | 2.316 |
| Average feature selection stability (Jaccard) | 0.647 | 0.721 | 0.646 | 0.503 | 0.508 | 0.744 |
Disclaimer/Publisher’s Note: The statements, opinions and data contained in all publications are solely those of the individual author(s) and contributor(s) and not of MDPI and/or the editor(s). MDPI and/or the editor(s) disclaim responsibility for any injury to people or property resulting from any ideas, methods, instructions or products referred to in the content. |
© 2025 by the authors. Licensee MDPI, Basel, Switzerland. This article is an open access article distributed under the terms and conditions of the Creative Commons Attribution (CC BY) license (http://creativecommons.org/licenses/by/4.0/).
Copyright: This open access article is published under a Creative Commons CC BY 4.0 license, which permit the free download, distribution, and reuse, provided that the author and preprint are cited in any reuse.


