
Submitted:
14 November 2025
Posted:
18 November 2025
You are already at the latest version
Abstract
Access to ecologically grown, nutritious food remains limited in low-income U.S. communities due to cost, structural inequities, and the dominance of industrial food systems. Stone Barns Center’s Leading an Ecological and Accessible Food System (LEAF) program—developed through a community-based participatory partnership in the South Bronx—aims to address these challenges through biweekly distributions of regeneratively grown produce, seasonal gardening kits, and culturally responsive nutrition education. This study presents findings from the first two years (April 2023–August 2024) of a multi-year intervention, evaluated using six household-level, paper-based surveys that provided primarily quantitative data. The surveys captured changes in fruit and vegetable consumption, gardening comfort, emotional well-being, participation in SNAP and WIC programs, food purchasing behaviors, and unmet needs. Statistically significant (p < 0.05) improvements were observed in fruit and vegetable intake, comfort with growing food, and emotional response to gardening. SNAP participation rose by 130%, and purchasing shifted toward local access points. Notably, 99% of Year 1 families returned for Year 2, reflecting strong engagement and trust. These results demonstrate the potential of integrated, community-partnered, and climate-aligned interventions to advance health equity, ecological literacy, and food justice. LEAF offers a replicable model for sustainable food system transformation in other under-resourced settings.
Keywords:
food access
; nutrition equity
; urban agriculture
; regenerative agriculture
; community-based participatory research
; SNAP and WIC
; home gardening
; health disparities
; sustainable food systems
; climate resilience
1. Introduction
Equitable access to ecologically grown, nutrient-dense food remains one of the most persistent challenges at the intersection of public health and environmental justice in the United States (U.S.) [1,2]. Urban, low-income communities—especially in large cities— continue to face disproportionately high rates of food insecurity. These inequities are rooted not only in limited physical access to fresh produce but also in long-term underinvestment in healthy food infrastructure, and structural barriers within the retail environment [3,4,5]. Although regenerative and organic agriculture can support environmental sustainability and nutrient-rich diets, their benefits are not equally distributed: for many families experiencing economic hardship, such foods are often priced out of reach, reinforcing disparities in diet quality and participation in sustainable food systems [6,7].
Historically, U.S. responses to food insecurity have focused on calories—pantries, emergency distributions, and other stop-gap measures [8]. These strategies matter, yet they rarely transform the system itself. More recently, research and practice point towards integrated approaches that combine food access, culturally grounded food and nutrition education (nutrition education), environmental stewardship, and community co-design—principles aligned with community-based participatory research (CBPR) and with food-systems perspectives on climate and health [2,9,10,11,12]. Emerging work in urban U.S. settings suggests that localized, culturally responsive interventions, such as subsidized Community Supported Agriculture (CSA) models, home-gardening supports, and food-literacy programs, can improve diet and related psychosocial outcomes at the household level, though rigorous prospective evaluations remain limited [13,14,15,16,17,18].
This paper presents findings from Stone Barns Center’s Leading an Ecological and Accessible Food System (LEAF) program, a community-led initiative that pairs regeneratively grown produce with culturally responsive nutrition education and home-growing support in the South Bronx of New York City (NYC) [19].
1.1. Background: A Systems Approach to Food Equity
The LEAF program operates within a broader regional strategy to transform food systems through multi-sector collaboration [20]. The Stone Barns Center for Food & Agriculture (Stone Barns Center) launched the initiative, building on over 15 years of community engagement and implementation experience, including pandemic-era efforts such as the Kitchen Farming Project and ResourcED [21,22,23]. In 2022, Stone Barns Center convened its board, philanthropic funders, and South Bronx organizers to form the LEAF Task Force. This collaborative team laid the groundwork for a community-centered program focused on nutrition security and food system resilience [19].
To support research and evaluation efforts, Stone Barns Center invited Columbia University to join the initiative. The Columbia Climate School—serving as the lead research institution—partnered with Teachers College and other affiliated Columbia schools to co-develop and assess the program. Together, the academic and practitioner teams employed a CBPR approach, equity-focused evaluation methods, and a shared mission to foster climate-resilient and just food systems [10,11,12,13].
1.2. The Bronx Context
The South Bronx, particularly ZIP code 10454, provides a compelling setting for food system intervention. The neighborhood experiences some of NYC’s highest burdens of poverty, food insecurity, and chronic diseases [24,25]. As of the 2019-2023 American Community Survey (ACS), the median household income in ZIP code 10454 was $27,500, compared to $77,700 citywide [24,26]. Educational attainment remains low—only about 14% of adults in the South Bronx hold a bachelor’s degree or higher [24]. Recent community health assessments estimate that 17.5% of Bronx residents—and 23.5% of children—experience food insecurity, among the highest rates in the city [25]. Local food pantries and community kitchens report sustained, high demand for meals and fresh produce, underscoring the need for durable, community-rooted strategies [24,25].
1.3. Community-Driven Research and Partnership Structure
From its inception, LEAF relied on community-based organizations to shape and deliver the program through a participatory design. In collaboration with these partners, the evaluation team co-developed measurement tools and feedback loops to keep the intervention grounded in local expertise—consistent with CBRP principles of shared governance, bidirectional learning, and equity-focused action [10,11]. Partners also identified key barriers to food security—including the cost of ecologically grown food, gaps in culturally relevant produce, and limited awareness or uptake of the Supplemental Nutrition Assistance Program (SNAP) and the Special Supplemental Nutrition Program for Women, Infants, and Children (WIC), which informed program design and benefits navigation [6,7,27,28].
1.4. Problem Statement, Study Purpose, and Research Questions
Persistent food insecurity in historically under-resourced communities reflects a convergence of structural inequities, rising living costs, and constrained access to healthy, affordable foods [3,4,5]. While emergency programs provide essential relief, few efforts address dietary health, environmental sustainability, and community empowerment—especially during early implementation [5,8,9,10,13].
This study evaluates LEAF during its first two years in the South Bronx. Specifically, it examines whether distributing regeneratively grown produce on a biweekly (every two weeks) schedule for 17 weeks-–together with gardening kits, culturally responsive nutrition education, and rotating community-based distribution sites—shifts: (a) household fruit and vegetable consumption; (b) comfort with and enjoyment of growing food; (c) perceived affordability and access; (d) awareness and use of SNAP/WIC; (e) usual sources for purchasing produce and remaining unmet needs; and (f) contributions to climate-aligned regional food systems.
Despite the documented benefits of regenerative agriculture and nutrition education, household-level evaluations of integrated, community-led interventions in urban U.S. contexts remain scarce [13,14,15,16,17,18]. Addressing this gap is essential for informing practice and policy that reduce health disparities while advancing climate-resilient food systems. By assessing household outcomes in LEAF, this study contributes evidence on how regeneratively grown food, home-growing supports, and culturally responsive nutrition education–delivered through community partnerships—can promote nutrition equity and support climate-aligned regional food systems [2,9,13,15,16,17,18].
2. Materials and Methods
This study was approved by the Institutional Review Board at Teachers College, Columbia University (Protocol #24-521).
2.1. Study Design and Overview
We conducted a longitudinal observational study using a repeated cross-sectional survey design, grounded in a community-based participatory research (CBPR) approach [10,11]. The study assessed the first two years of the Leading an Ecological and Accessible Food System (LEAF) program, which ran from April to November in 2023 and in 2024 in the South Bronx. Each of the six surveys administered over the two-year period was completed by one respondent per household, capturing the shared experiences of that family unit. Surveys were administered at three timepoints each year—April, June, and August—to assess changes in fruit and vegetable consumption, gardening comfort, emotional well-being, and food access. Community partners participated in all stages of study design, recruitment, implementation, and data interpretation.
2.2. Participant Recruitment
Participants were recruited through five LEAF community partners, all of whom were members of the LEAF Task Force: (1) La Morada Community Kitchen, which combines a mutual aid model that provides free meals with a dine-in restaurant open to the community; (2) Upbeat NYC, a free afterschool music program for children; (3) Word Up Community Bookshop, a volunteer-run bookstore and community hub; (4) the Brook Park Community Garden, a longstanding green space led by residents; and (5) the Bruckner Mott Haven Community Garden, another longstanding residents-led green space. For recruitment purposes, the two community gardens functioned as a single entity. During monthly task force meetings, each organization committed to recruiting 20 participant families from their networks to fill the 80 available program slots, the maximum number supported by the program’s budget.
Recruitment flyers, designed as party invitations, were posted at partner sites, on light poles throughout ZIP code 10454, and within each organization’s WhatsApp group. Due to high demand and limited slots, each organization prioritized participants based on perceived household need. If more than 20 families expressed interest through one site, the additional names were placed on a shared waitlist. If fewer than 20 signed up through a given partner, those spaces were filled by families from the waitlist to ensure full enrollment.
2.3. Intervention Overview
The LEAF program provided families with resources to support food access, self-sufficiency, and community connections. Enrollment took place each April at Bruckner Mott Haven Community Garden. On that day, participants signed informed consent forms, completed baseline surveys (Surveys 1 & 4), and received gardening kits, household supplies, and a starter nutrition education guide. They also began receiving biweekly produce distributions of regeneratively grown produce, which continued through November (17 per year). During the season, families were offered additional nutrition education guides, child-friendly activities, and translation support. Each year, all participants were invited to a Family Day at Stone Barns Center. The following sections describe each component of the intervention in more detail.
2.3.1. Gardening Kits and Growing Instruction
Each household received a home gardening kit to support engagement in growing food. Kits included a growing pouch, organic soil, a trowel, clippers, watering can, gloves, and two seedling trays (“six-packs”) with a total of nine salad green seedlings. Participants also received written and video instructions—available in English and Spanish—and a live demonstration on how to transplant seedlings.
Seedlings were distributed three times per year: April, June, and August. The sequence of seedlings was scaffolded to build knowledge and confidence. In Year 1, the April distribution included lettuce varieties (EZlor/, Rhone, and Hampton); June included parsley, cilantro, and basil; and August included Winter Bloomsdale spinach and Lacinato kale. In Year 2, the same sequence was followed, with substitutions based on participant feedback, including mustard greens, lunch box peppers (small sweet peppers), Jedi peppers (spicy jalapeño peppers) and marigolds as well as additional cilantro. Each round emphasized practical skills like harvesting, pruning, and protecting plant health. If participants’ seedlings failed before the next scheduled distribution, they were provided with replacement seedlings to ensure continued engagement and learning.
To mirror Stone Barns Center’s own crop rotation, seedling varieties and timelines were aligned with seasonal growing practices. Companion planting concepts were introduced in Year 2. All participants received fresh organic potting mix and a new pot annually. Participants in temporary housing who were unable to keep growing kits at home were invited to garden at either of the two community garden partners, Brook Park Community Garden or Bruckner Mott Haven Community Garden.
2.3.2. Biweekly (Every Other Week) Produce Distribution and Community Integration
Starting in April and continuing through November, participants received biweekly distributions of regeneratively grown organic produce, totaling 17 per program year (34 in total). Produce was harvested and packaged at Stone Barns Center and transported to South Bronx distribution sites within 24 hours.
To support relationship-building and community engagement, distribution rotated across four of the five community partner sites: La Morada Community Kitchen, Upbeat NYC, Brook Park Community Garden, and Bruckner Mott Haven Community Garden. Produce not picked up was transported to La Morada Community Kitchen for preparation and redistribution through community meals.
2.3.3. Educational Materials and SNAP/WIC Support
At each produce distribution, participants received a bilingual educational guide that included information about the foods in that week’s bundle, culturally relevant preparation tips, and simple, family-friendly recipes. These recipes were created and tested by chefs from Blue Hill, the restaurant located at Stone Barns Center, to reflect the cultural preferences of the participating community and matched to the seasonal produce provided.
The handouts also included nutrition-focused activity sheets for children, such as games, coloring pages, and conversation prompts to support intergenerational engagement with food and health topics. Materials were designed to align with the produce items distributed that week and to reinforce concepts like variety, balance, and seasonality in the diet (Supplementary Materials). They were also developed to be culturally relevant, simple, and practical, while making vegetable consumption exciting and desirable.
Additionally, the handouts provided information about how to enroll in federal nutrition assistance programs, specifically SNAP and WIC. Contact details for bilingual program staff were listed so participants could request individualized assistance or troubleshooting support. This component was designed to help families enroll more easily and to encourage greater use of food benefits that strengthen household food security.
2.3.4. Family Day at the Farm
Participants were invited to attend a Family Day at Stone Barns Center, held in September 2023 and in August 2024. Transportation was arranged from La Morada Community Kitchen and coordinated using WhatsApp. The event itinerary included guided tours of the farm, educational activities focused on sustainable agriculture, visits to the bakery and farm store, and hands-on experiences for children. Participants also received breakfast upon arrival and a communal meal, there was also an additional distribution of produce and back-to-school items.
In 2023, families were asked on the June survey if they were interested in attending a Family Day at the farm. Based on the high level of interest expressed, Stone Barns Center subsequently established a cap of 100 participants. In 2024, because of this cap was already in place, the intent-to-attend question was not included on Survey 4. Instead, families signed up through a program-managed registration sheet, which limited attendance to 100 participants and allowed for up to 25 additional families on a waitlist.
2.4. Data Collection
Data were collected at three timepoints per year—April, June, and August—for a total of six survey rounds between April 2023 and August 2024 (Surveys 1 through 6). Surveys were administered in person at distribution events and were paper-based, bilingual (English and Spanish), and standardized across participants at each timepoint. While each household completed one survey per timepoint, the content of the surveys varied by month: all April surveys used the same set of questions, all June surveys used a different but consistent set, and the same applied to August. Not all questions were repeated across timepoints; each survey was designed to reflect the specific goals and activities of that phase in the program. Survey content was developed collaboratively by the research team and the program coordinator to ensure alignment with both evaluation objectives and on-the-ground implementation.
The bilingual program coordinator manually entered all survey responses into Google Sheets. Spanish responses were translated into English prior to analysis. The research team received de-identified data only after receiving IRB approval (Protocol #24-521). All data were stored securely on Stone Barns Center’s Google drive and analyzed at the household level.
2.5. Data Collection Instrument
The survey instrument was co-developed by the research team, Stone Barns Center staff, and community partners to align with the program’s goals and reflect culturally relevant measures. Surveys included Likert-type scales [29], multiple-choice, and open-ended questions. All participants received the same version of the survey at each designated timepoint.
The instrument assessed the following domains: household fruit and vegetable consumption; access and affordability of produce; comfort and confidence with growing food; emotional impact of gardening; SNAP and WIC enrollment; and perceived program benefits and challenges. A complete list of questions is included in the supplementary Materials.
2.6. Data Analysis
We analyzed quantitative data using descriptive and inferential statistics. Descriptive statistics summarized household demographics, participation patterns, and program outcomes. For changes across time, we used one-way ANOVAs with Tukey’s Honestly Significant Differences (HSD) post-hoc test for multiple comparisons. These analyses examined three primary outcomes: (1) household-level fruit and vegetable consumption; (2) comfort with and frequency of growing food; and (3) the emotional impact of gardening. Statistical assumptions of normality and homogeneity of variance were checked prior to conducting tests. Analyses were performed using Microsoft Excel for Mac (Version 16.79.1).
Qualitative responses were analyzed using thematic analysis [30]. Two researchers independently coded responses, using both inductive (emerging themes) and deductive (pre-specified categories such as affordability, food access, and participant experience) approaches. Coding discrepancies were discussed and resolved through consensus. Results were summarized into themes to capture common experiences and perspectives.
3. Results
3.1. Demographics
We enrolled 80 families in the LEAF program in both 2023 and 2024, filling all available slots each year. Of the original 2023 cohort, 79 families (99%) returned for 2024. Survey participation was consistently high: 79 families (99%) completed Surveys 1–4 (April-August 2023, and April 2024), and all 80 families (100%) completed Surveys 5–6 (June and August 2024).
Demographic household-level data was collected at program enrollment each year (Surveys 1 and 4). While the number of enrolled families was consistent (n = 80 each year), the total number of individuals represented in the completed surveys increased from 308 in 2023 to 356 in 2024, reflecting natural changes in household composition. In 2023, household sizes ranged from 2 to 7 members (mean = median = 4); in 2024, household sizes ranged from 1 to 8 members (mean = median = 5) (Table 1).
Age distributions were recorded in April 2023 and 2024 (Surveys 1 and 4). Due to survey design, which asked participants to circle applicable age ranges without noting frequency per category, results may underestimate the number of individuals per age bracket (Table 1).
Most participants identified as Latino and/or Hispanic (Table 1). In April 2023, 71 (90%) identified as Latino/Hispanic, 5 (6%) as African American, and 3 (4%) as mixed. The proportions remained similar in April 2024.
Nearly all participants (99%) were open to receiving text messages, based on the April 2023 survey. While participants were asked to submit identifying information, only 10 provided accurate name and phone number data. As a result, all analysis was conducted anonymously at the group level.
3.2. Fruit and Vegetable Consumption
Participants rated their household’s fruit and vegetable consumption on a 5-point Likert scale (1 = “rarely or never,” 5 = “every day”). Reported mean scores across six timepoints, from April 2023 to August 2024, were 3.80, 3.91, 3.90, 3.48, 4.36, and 4.49.
A one-way ANOVA revealed significant differences across all six time points (p < 0.05). Tukey’s Honestly Significant Differences (HSD) post-hoc test showed that June and August 2024 scores were significantly higher than at all earlier surveys (p < 0.05), with the largest increase from April 2023 to August 2024 (p = 0.000003). No significant differences were found among the earlier timepoints, suggesting relatively stable consumption patterns before June 2024. These results are presented in Table 2 and Figure 1. A temporary dip in reported consumption was observed in April 2024 (Table 2, Figure 1), the reason for which is further explored in the Discussion.
3.3. Comfort with Growing Food
Participants rated their comfort with growing food on a 5-point Likert scale (1 = “not at all comfortable,” 5 = “very comfortable”) across four timepoints. Mean scores were 3.08, 3.96, 4.00, and 4.68.
Comfort with growing food increased significantly over time (ANOVA, p < 0.05). Tukey’s Honestly Significant Differences (HSD) post-hoc comparisons revealed in April 2023 participants were significantly less comfortable than they were at all later timepoints: June 2023 (p = 0.0001), April 2024 (p = 0.000003), and June 2024 (p = 0.000000000000001). While comfort levels between June 2023 and April 2024 did not differ significantly, both were significantly lower than June 2024, which marked the highest reported comfort level (p = 0.00000001). This pattern suggests a steady and meaningful increase in participants’ comfort with growing food, culminating in a notable rise by June 2024. These results are presented in Table 2 and Figure 1.
In a question not reported in the table, participants were asked whether they had ever grown food prior to the program. In April 2023, 38 participants (48%) answered yes, while 41 (52%) had not. By April 2024, all 79 respondents (100%) reported having grown their own food.
3.4. Emotional Response to Gardening
Participants rated how growing food made them feel on five of the six surveys using a 5-point Likert scale (1 = “very bad,” 5 = “very good”). Mean scores were 4.13, 4.18, 4.30, 4.75, and 4.55.
A one-way ANOVA showed a statistically significant difference in emotional response over time (p = 0.00002). Tukey’s HSD post-hoc analysis confirmed that scores in June 2023, August 2023, and April 2024 were statistically similar, while scores in both June and August 2024 were significantly higher than those earlier timepoints. The strongest contrasts were between June 2023 and June 2024 (p = 0.00007) and between August 2023 and June 2024 (p = 0.00001), with other comparisons also reaching significance (p < 0.05). The largest gain in emotional response was observed by June 2024 and remained stable through August. These results are presented in Table 2 and Figure 1.
3.5. Financial Assistances Participation
Participants reported enrollment in SNAP and WIC in April 2023 and April 2024. As shown in Table 3, SNAP-only enrollment more than doubled, while WIC-only and dual enrollment also rose modestly. The number of participants not enrolled in any assistance program declined by 24%, reflecting increased engagement with federal nutrition benefits over time.
3.6. Fruit and Vegetable Purchasing Patterns
Participants identified all the neighborhood sources from which they usually purchase fruits and vegetables. Supermarkets were the primary source in both years, reported by nearly all participants. Use of street vendors and farmers markets declined by 36% and 57%, respectively. Grocery store use also fell modestly from 27% to 19%, while bodega purchases—previously unselected—emerged as a new source in 2024. These results are presented in Table 3.
3.7. Perceived Affordability of Fruits and Vegetables
Participants rated how affordable it was to purchase fruits and vegetables in their neighborhood using a 5-point Likert scale, where 1 = “Not accessible” and 5 = “Very affordable.” This question was asked in April 2023 and April 2024. A total of 79 participants responded at each timepoint.
Observed Trends
- -
- Ratings of “Some” (3) affordability increased from 27 (34%) to 32 (41%) participants, representing the most selected response in 2024.
- -
- The number of participants who rated produce as “Affordable” (4) or “Very affordable” (5) declined between years.
- -
-
The proportion of participants indicating lower affordability (ratings 1 or 2) remained consistent at 36 out of 79 (46%) across both years, though slightly more participants rated produce as “Not accessible” in 2024.These results are presented in Table 3.
3.8. Unmet Food Needs and Preferences
Participants identified food types they were unable to obtain in their neighborhood. In April 2023, the most commonly reported unmet needs were vegetables (27%), fruit (23%), and organic produce (18%). Smaller proportions cited meat and fish (8%), prepared foods and miscellaneous items (4%), and dairy (3%), while 10% responded “anything” and 27% provided no answer. By April 2024, unmet needs shifted: vegetables (44%) became the most frequently reported, followed by fruit (23%) and meat and fish (23%). Reports of organic produce as an unmet need dropped to zero, while prepared foods (9%) and dairy (11%) increased. These results are presented in Table 3.
3.9. Participant-Identified Support Needs
When asked what additional support from LEAF would be most helpful, participants in April 2024 most frequently requested produce (80%), plants (63%), hygiene packages (46%), and clothing (41%). A smaller proportion (28%) requested cooked meals. No participants selected “no answer.” These results are presented in Table 3.
3.10. Trip to Stone Barns Center for Food and Agriculture
In June 2023 (Survey 2), 65 families (n = 214 individuals) indicated interest in attending Family Day at Stone Barns Center. However actual attendance was capped at 100 people due to funding constraints, which represented 32% of the 308 individuals enrolled that year.
In 2024, the survey item on intent was removed because the cap had already been established. Attendance was managed through a program sign-up sheet that filled immediately, with all 100 Bronx slots taken and an additional 25 families on a waitlist. On the day of the event, 100 Bronx participants attended (28% of the 356 enrolled individuals). These results are presented in Table 3.
4. Discussion
This study evaluated the first two years of the LEAF program in the South Bronx, showing how a community-led, multi-sector approach can influence household food behaviors, access, and perceptions. The findings suggest that when regeneratively grown produce is combined with gardening kits, nutrition education, and local delivery, families can see improvements in dietary patterns, food-growing confidence, and awareness of support services such as SNAP and WIC. In this way, LEAF adds to a growing body of evidence that community-designed food system programs can advance environmental sustainability, equity, and household empowerment [1,2,5,10,13,17].
4.1. Research Implications
The results highlight several contributions to research on food systems interventions. Fruit and vegetable consumption was stable throughout 2023 but rose significantly in 2024, underscoring the importance of consistent and sustained exposure to healthy food [2,22]. The temporary decline between November 2023 and April 2024, when the program was paused, illustrates how quickly dietary gains can be lost when access is disrupted [3,4].
Equally important, participants grew more confident and found more enjoyment in food growing. These experiences reflect earlier studies showing that home gardening can improve self-efficacy, reduce stress, and support ecological literacy [13,15,17]. LEAF’s flexibility in responding to participants’ requests—such as adding cilantro, peppers, and rye grains—shows how community feedback can make interventions more relevant. This mirrors findings from research on culturally tailored programs, which emphasize that when participants see their input reflected, engagement and effectiveness increase [15,16].
Finally, the program achieved nearly complete retention, with most families returning in the second year. Peer-to-peer exchanges—such as sharing seedlings, posting gardening updates in WhatsApp groups, and picking up distributions for participants who could not attend—were not formally planned but became an important part of the experience. Families in temporary housing maintained their growing pouches at one of the two community garden partner sites, returning regularly to care for them. These relational practices, though unplanned, reinforce trust and highlight how CBPR approaches can sustain engagement and build cohesion [10,11,17,18].
4.2. Practice Implications
For practitioners, LEAF demonstrates how pairing access to healthy food with support for home growing and education can work in practice [13,14]. Families did not just receive produce; they were given seedlings, tools, and recipes, and their feedback was incorporated into distributions [13,14]. This combination made the program both practical and engaging.
The decline in farmers market and street vendor use suggests that LEAF also served as a substitute for other sources of food at a time when inflation made purchasing produce more difficult [5]. This substitution highlights how community-based programs can relieve financial pressure while ensuring access to healthy foods.
LEAF also shows the value of creating formal and informal spaces for participants to share knowledge. WhatsApp groups, community gardens, a visit to Stone Barns, and simple acts like picking up bi-weekly distributions for neighbors became organic extensions of the program [17]. Practitioners designing similar interventions may benefit from intentionally encouraging these kinds of exchanges, which can deepen trust and broaden impact without requiring major resources.
4.3. Policy Implications
The LEAF model points to several lessons for policy. First, building short, regenerative supply chains—such as the 25-mile link between Stone Barns Center and the South Bronx—can reduce emissions, support regional agriculture, and provide reliable access to healthy food [2,9]. Surplus redistribution to La Morada Community Kitchen further demonstrated how local programs can reduce waste and promote circularity [7].
Second, increases in SNAP and WIC enrollment show that food distribution sites can be powerful entry points for raising awareness of entitlements. Embedding benefits navigation within trusted community programs could be a scalable strategy for reducing food insecurity [3,28,31].
Third, the persistence of affordability concerns—even with SNAP, WIC, and free produce distributions—points to the limits of household-level interventions [4,5]. Broader policy changes in food pricing, subsidies, and procurement are required to address structural inequities.
Finally, LEAF illustrates how CBPR approaches can transform food programs from isolated projects into parts of a neighborhood support system [10,11]. Policy frameworks that encourage partnerships across food, health, housing, climate and other sectors may replicate this integrative impact on a larger scale.
4.4. Limitations
This study has limitations. Survey data were self-reported, which may introduce recall or social desirability bias. Objective assessment tools such as Veggie Meters (e.g., reflection-spectroscopy devices validated in youth populations), as well as digitally-validated dietary recalls, could enhance accuracy in future research beyond self-reported measures [32,33]. Another limitation is that data were collected at the household level, which prevented analysis of changes at the individual level, especially among children.
Although surveys were translated and data entry was carefully conducted, minor errors may have occurred. In addition, the repeated cross-sectional design limits causal inference; longitudinal tracking would provide stronger evidence. Also, the absence of qualitative interviews meant that deeper insights into participants’ experiences and stories were not captured. Finally, the study did not include anthropometric or cardiometabolic measures, which limits the ability to assess health impacts. Incorporating screening such as body mass index (BMI), blood pressure, or other biomarkers at future community health fairs would further strengthen evaluation.
4.5. Future Research
Future research should build on these findings in several ways. Longitudinal mixed-methods studies could track individuals over time and capture the lived experiences behind dietary change and gardening confidence.
Incorporating objective measures of diet quality would complement self-reported data and provide stronger evidence. Testing LEAF-like models in other urban neighborhoods would clarify whether the integration of regenerative agriculture, culturally tailored food support, and CBPR can be adapted across contexts. LEAF has already expanded to a second site, Sleepy Hollow, a Westchester County, NY, neighborhood approximately 10 miles from Stone Barnes, creating opportunity for future studies to compare and contrast the experiences of families across sites.
In addition, incorporating health outcomes could strengthen evaluation. For example, future iterations of LEAF may include anthropometrics and cardiometabolic screenings through community health fairs at distribution sites. Similar approaches have been tested in gardening interventions such as Litt et al. (2023), which paired community gardening with measures of BMI, blood pressure, and cardiometabolic risk factors [18]. Embedding such screenings within LEAF would allow the program to assess physical health impacts alongside dietary and psychosocial outcomes, providing a more comprehensive understanding of benefits.
Future studies should also focus on children, who may experience different outcomes than adults within the same household. Future studies could also integrate bilingual digital survey tools to minimize translation challenges and reduce data entry errors, strengthening the reliability of household-level responses. Finally, policy-focused research is needed to explore how community-based food interventions can be embedded within municipal food systems to ensure sustainability and scale.
5. Conclusions
As climate change, food insecurity, and public health inequities converge, integrated models like LEAF provide a promising blueprint for community-led food systems transformation [11,12]. This study adds to the evidence that regenerative agriculture, home gardening, and culturally responsive education—when embedded in trusted community networks—can strengthen dietary behaviors, ecological literacy, and social resilience [1,5,13,22]. The program’s high retention, increased participant confidence, and peer-to-peer exchange highlight that food interventions can extend beyond transactional food access to become transformative processes that foster agency and collective impact [14,15,37]. Future research and policy should explore how LEAF-like approaches can be scaled, adapted, and institutionalized across diverse urban contexts to advance food justice and climate resilience [10,33].
Supplementary Materials
The following supporting information can be downloaded at: Preprints.org, which includes the survey instruments and responses collected from six timepoints over two program years, the statistical analyses conducted for this study, documentation of the fresh produce and home gardening materials (e.g., planting pots) distributed to participants, and examples of the nutrition education materials provided at each distribution.
Author Contributions
Conceptualization, Carolina Saavedra, Jack Algiere, Jason Grauer, Natalie Greaves-Peters, and Pamela A. Koch; methodology, Carolina Saavedra, Natalie Greaves-Peters and Pamela A. Koch; software, not applicable; validation, Natalie Greaves-Peters and Pamela A. Koch; formal analysis, Wei Yin and Natalie Greaves-Peters; investigation, Carolina Saavedra and Natalie Greaves-Peters; resources, Cynthia Rosenzweig, Jason Grauer, Natalia Mendez, Liza Austria, and Karina Cipria; data curation, Natalie Greaves-Peters and Carolina Saavedra; writing—original draft preparation, Natalie Greaves-Peters; writing—review and editing, Pamela A. Koch, Erik Mencos-Contreras, Wei Yin, Jason Grauer, Carolina Saavedra, and Natalie Greaves-Peters; visualization, Natalie Greaves-Peters and Pamela A. Koch; supervision, Pamela A. Koch, Cynthia Rosenzweig, Jack Algiere, and Jason Grauer; project administration, Carolina Saavedra, Daniel Bartush, Grace Jorgensen, Natalia Mendez, Liza Austria, and Karina Cipria; funding acquisition, Cynthia Rosenzweig and Jason Grauer. All authors have read and agreed to the published version of the manuscript.
Funding
The implementation of the LEAF program was funded by the Stone Barns Center for Food and Agriculture. The research component was funded in part by The Neon Foundation through a gift account to Columbia University (GT008701). Additional institutional support was provided by Columbia University and the Columbia Climate School.
Institutional Review Board Statement
The study was conducted in accordance with the Declaration of Helsinki, and approved by the Institutional Review Board of Teachers College, Columbia University (Protocol number #24-521, approved on 11/13/2024).
Informed Consent Statement
Informed consent was obtained from all subjects involved in the study.
Data Availability Statement
The original data presented in this study are openly available in Academic Commons at https://doi.org/10.7916/tx9v-vd03. The dataset includes anonymized survey responses collected at six timepoints over two program years and the corresponding statistical analyses supporting the reported findings.
Acknowledgments
The authors thank the families who participated in the LEAF program for generously sharing their time, experiences, and perspectives. We are also grateful to the staff and volunteers at La Morada Community Kitchen, Upbeat NYC, Word Up Community Bookshop, and the Brook Park and Bruckner Mott Haven Community Gardens for their collaboration and community leadership throughout the program. We remember with gratitude the late Daniel Chervoni of Brook Park Community Garden, whose leadership, generosity, and commitment to food justice were instrumental to the success of LEAF. Additional thanks to the farmers, as well as the administrative and program teams at Stone Barns Center for Food and Agriculture, for their dedication, logistical support, coordination, and contributions of fresh produce. During the preparation of this manuscript, the authors used ChatGPT (GPT-5, OpenAI, 2025) for assistance in refining text clarity and accessibility. The authors reviewed and edited all outputs and take full responsibility for the content of this publication.
Conflicts of Interest
The authors declare no conflicts of interest. The funders had no role in the design of the study; in the collection, analyses, or interpretation of data; in the writing of the manuscript; or in the decision to publish the results.
Abbreviations
The following abbreviations are used in this manuscript:
| CBPR | Community-Based Participatory Research |
| LEAF | Leading an Ecological and Accessible Food System |
| SNAP | Supplemental Nutrition Assistance Program |
| WIC | Women Infants and Children Program |
References
- Alkon, A.H.; Agyeman, J. Cultivating Food Justice: Race, Class, and Sustainability; MIT Press: Cambridge, MA, USA, 2011. [Google Scholar]
- Rosenzweig, C.; Mbow, C.; Barioni, L.G.; Benton, T.G.; Herrero, M.; Krishnapillai, M.; Liwenga, E.T.; Pradhan, P.; Rivera-Ferre, M.G.; Sapkota, T.; Tubiello, F.N.; Xu, Y.; Mencos-Contreras, E.; Portugal-Pereira, J. Climate change responses benefit from a global food system approach. Nat. Food 2020, 1, 94–97. [Google Scholar] [CrossRef] [PubMed]
- U.S. Department of Agriculture, Economic Research Service. Food Access Research Atlas: Documentation; 2025. Available online: https://www.ers.usda.gov/data-products/food-access-research-atlas/ (accessed on 15 August 2025).
- Mah, C.L.; Luongo, G.; Hasdell, R.; Taylor, N.G.A.; Lo, B.K. A systematic review of the effect of retail food environment interventions on diet and health with a focus on the enabling role of public policies. Curr. Nutr. Rep. 2019, 8, 411–428. [Google Scholar] [CrossRef] [PubMed]
- Odoms-Young, A.M. Examining the Impact of Structural Racism on Food Insecurity: Implications for Addressing Racial/Ethnic Disparities. Fam. Syst. Health 2018, 41 (Suppl. 2), S3–S6. [Google Scholar] [CrossRef] [PubMed]
- Food and Agriculture Organization; IFAD; UNICEF; WFP; WHO. The State of Food Security and Nutrition in the World 2024 (SOFI 2024); FAO: Rome, Italy, 2024; Available online: https://www.fao.org/publications/sofi (accessed on 15 August 2025).
- The Rockefeller Foundation. True Cost of Food: Measuring What Matters to Transform the U.S. Food System; The Rockefeller Foundation: New York, NY, USA, 2021; Available online: https://www.rockefellerfoundation.org/report/true-cost-of-food/ (accessed on 15 August 2025).
- Poppendieck, J. Sweet Charity? Emergency Food and the End of Entitlement; Penguin Books: New York, NY, USA, 1998. [Google Scholar]
- Fanzo, J.; Davis, C.; McLaren, R.; Choufani, J. The effect of climate change across food systems: Implications for nutrition outcomes. Glob. Food Secur. 2018, 18, 12–19. [Google Scholar] [CrossRef]
- Minkler, M.; Wallerstein, N. Community-Based Participatory Research for Health: From Process to Outcomes, 2nd ed.; Jossey-Bass: San Francisco, CA, USA, 2008. [Google Scholar]
- Israel, B.A.; Schulz, A.J.; Parker, E.A.; Becker, A.B. Review of community-based research: Assessing partnership approaches to improve public health. Annu. Rev. Public Health 1998, 19, 173–202. [Google Scholar] [CrossRef] [PubMed]
- Agurs-Collins, T.; Alvidrez, J.; ElShourbagy Ferreira, S.; Evans, M.; Gibbs, K.; Kowtha, B.; Pratt, C.; Reedy, J.; Shams-White, M.; Brown, A.G. Perspective: Nutrition Health Disparities Framework—A model to advance health equity. Adv. Nutr. 2024, 15, 100194. [Google Scholar] [CrossRef] [PubMed]
- Rivera, R.L.; Adams, M.; Dawkins, E.; Carter, A.; Zhang, X.; Tu, W.; Peña, A.; Holden, R.J.; Clark, D.O. Delivering food resources and kitchen skills (FoRKS) to adults with food insecurity and hypertension: A pilot study. Nutrients 2023, 15, 1452. [Google Scholar] [CrossRef] [PubMed]
- Kearsey, J.L.; West, E.; Vairinhos, N.; Constable, N.; Chu, A.; Douglas, N.; Charlton, K. Evaluation of a nutrition education and skills training programme in vulnerable adults at high risk of food insecurity. J. Hum. Nutr. Diet. 2024, 37, 418–429. [Google Scholar] [CrossRef] [PubMed]
- Lu, I.; Suss, R.; Lanza, D.V.; Cohen, S.; Yusuf, Y.; Yi, S.S. A qualitative study to inform a subsidized community-supported agriculture program for Chinese Americans in Brooklyn, New York, U.S. Prev. Med. Rep. 2023, 36, 102480. [Google Scholar] [CrossRef] [PubMed]
- Chan, S.W.C.; Chin, M.; Suss, R.; Kui, K.; Lam, S.Z.; Dowd, E.; Bosen, C.; Mei, S.; Barth, K.; Hughes, M.; Yi, S.S. A culturally specific community-supported agriculture (CSA) program to improve diet in immigrant communities in Brooklyn, New York. Health Promot. Pract. 2025, 26, e1–e11. [Google Scholar] [CrossRef] [PubMed]
- Hume, C.; Rivers, A.; Power, N.; Corna, L.M.; Kitchen, P. Community gardens and their effects on diet, health, psychosocial and community outcomes: A systematic review. BMC Public Health 2022, 22, 1756. [Google Scholar] [CrossRef] [PubMed]
- Litt, J.S.; Schmiege, S.; Hale, J.; et al. Effects of a community gardening intervention on diet, physical activity, and cardiometabolic risk factors: A randomized controlled trial. Lancet Planet. Health 2023, 7, e532–e543. [Google Scholar] [CrossRef] [PubMed]
- Stone Barns Center for Food & Agriculture. LEAF (Leading an Ecological and Accessible Food System). Available online: https://www.stonebarnscenter.org/leaf (accessed on 18 August 2025).
- Stone Barns Center for Food & Agriculture. About Us. Available online: https://www.stonebarnscenter.org/about (accessed on 18 August 2025).
- Stone Barns Center for Food & Agriculture. Kitchen Farming Project—Recipes to Grow Your Garden (YouTube playlist). Available online: https://www.youtube.com/playlist?list=PLD0j-qW5HqB9jZhXsXlN2zvyfNLQVhuNK (accessed on 18 August 2025).
- Edible Brooklyn. Blue Hill in a Box, from Manhattan to Montauk. 7 July 2020. Available online: https://www.ediblebrooklyn.com/2020/blue-hill-debuts-resourced-boxes/ (accessed on 18 August 2025).
- Blue Hill Farm (Instagram). “Today we launch resourcED …” 31 March 2020. Available online: https://www.instagram.com/p/B-IaDHKhyJb/ (accessed on 18 August 2025).
- New York State Office of the State Comptroller. The South Bronx: An Economic Snapshot (Report 13-2024). Office of the State Comptroller: Albany, NY, USA, 16 November 2023; Available online: https://www.osc.ny.gov/files/reports/osdc/pdf/report-13-2024.pdf (accessed on 19 August 2025).
- BronxCare Health System. Community Health Needs Assessment and Community Service Plan, 2022–2024; 2022. Available online: https://www.bronxcare.org/fileadmin/SiteFiles/Images/1-About_Us/d-Community_Service_Plan/CSP_2022_12.15.22_FINAL.pdf (accessed on 15 August 2025).
- U.S. Census Bureau. ZCTA 10454 (New York, NY): ACS 2019–2023 5-Year Estimates. Census Reporter Profile. Available online: https://censusreporter.org/profiles/86000US10454-10454/ (accessed on 15 August 2025).
- U.S. Census Bureau. QuickFacts: New York City, New York—Median Household Income (in 2023 dollars), 2019–2023. Available online: https://www.census.gov/quickfacts/fact/table/newyorkcitynewyork (accessed on 15 August 2025).
- U.S. Department of Agriculture, Economic Research Service. Household Food Security in the United States in 2022; Rabbitt, M.P., Hales, L.J., Burke, M.P., Coleman-Jensen, A., Eds.; Economic Research Report No. 325; USDA ERS: Washington, DC, USA, 2023; Available online: https://www.ers.usda.gov/publications/pub-details?pubid=107702 (accessed on 19 August 2025). [CrossRef]
- Likert, R. A technique for the measurement of attitudes. Arch. Psychol. 1932, 22, 1–55. [Google Scholar]
- Miles, M.B.; Huberman, A.M.; Saldaña, J. Qualitative Data Analysis: A Methods Sourcebook, 4th ed.; Sage: Thousand Oaks, CA, USA, 2020. [Google Scholar]
- McDaniel, M.; Cancian, M.; Waxman, E.; Gearing, M. Customer Service Experiences and Enrollment Difficulties Vary Widely across Safety Net Programs; Urban Institute: Washington, DC, USA, 2023; Available online: https://www.urban.org/sites/default/files/2023-01 (accessed on 15 August 2025).
- Di Noia, J. Use of the Spectroscopy-Based Veggie Meter® to Objectively Assess Skin Carotenoids as a Biomarker of Fruit and Vegetable Intake. Nutrients 2021, 13, 2270. [Google Scholar] [CrossRef] [PubMed]
- Söderström, E.; Wingson, E.; Schulz, B.; et al. Validation of an Online Dietary Recall Method (RiksmatenFlex) Against the Doubly Labeled Water Method in Pregnant Women. Nutrition Journal 2024, 23, 66. [Google Scholar] [CrossRef] [PubMed]
Figure 1.
Trends Over Time.
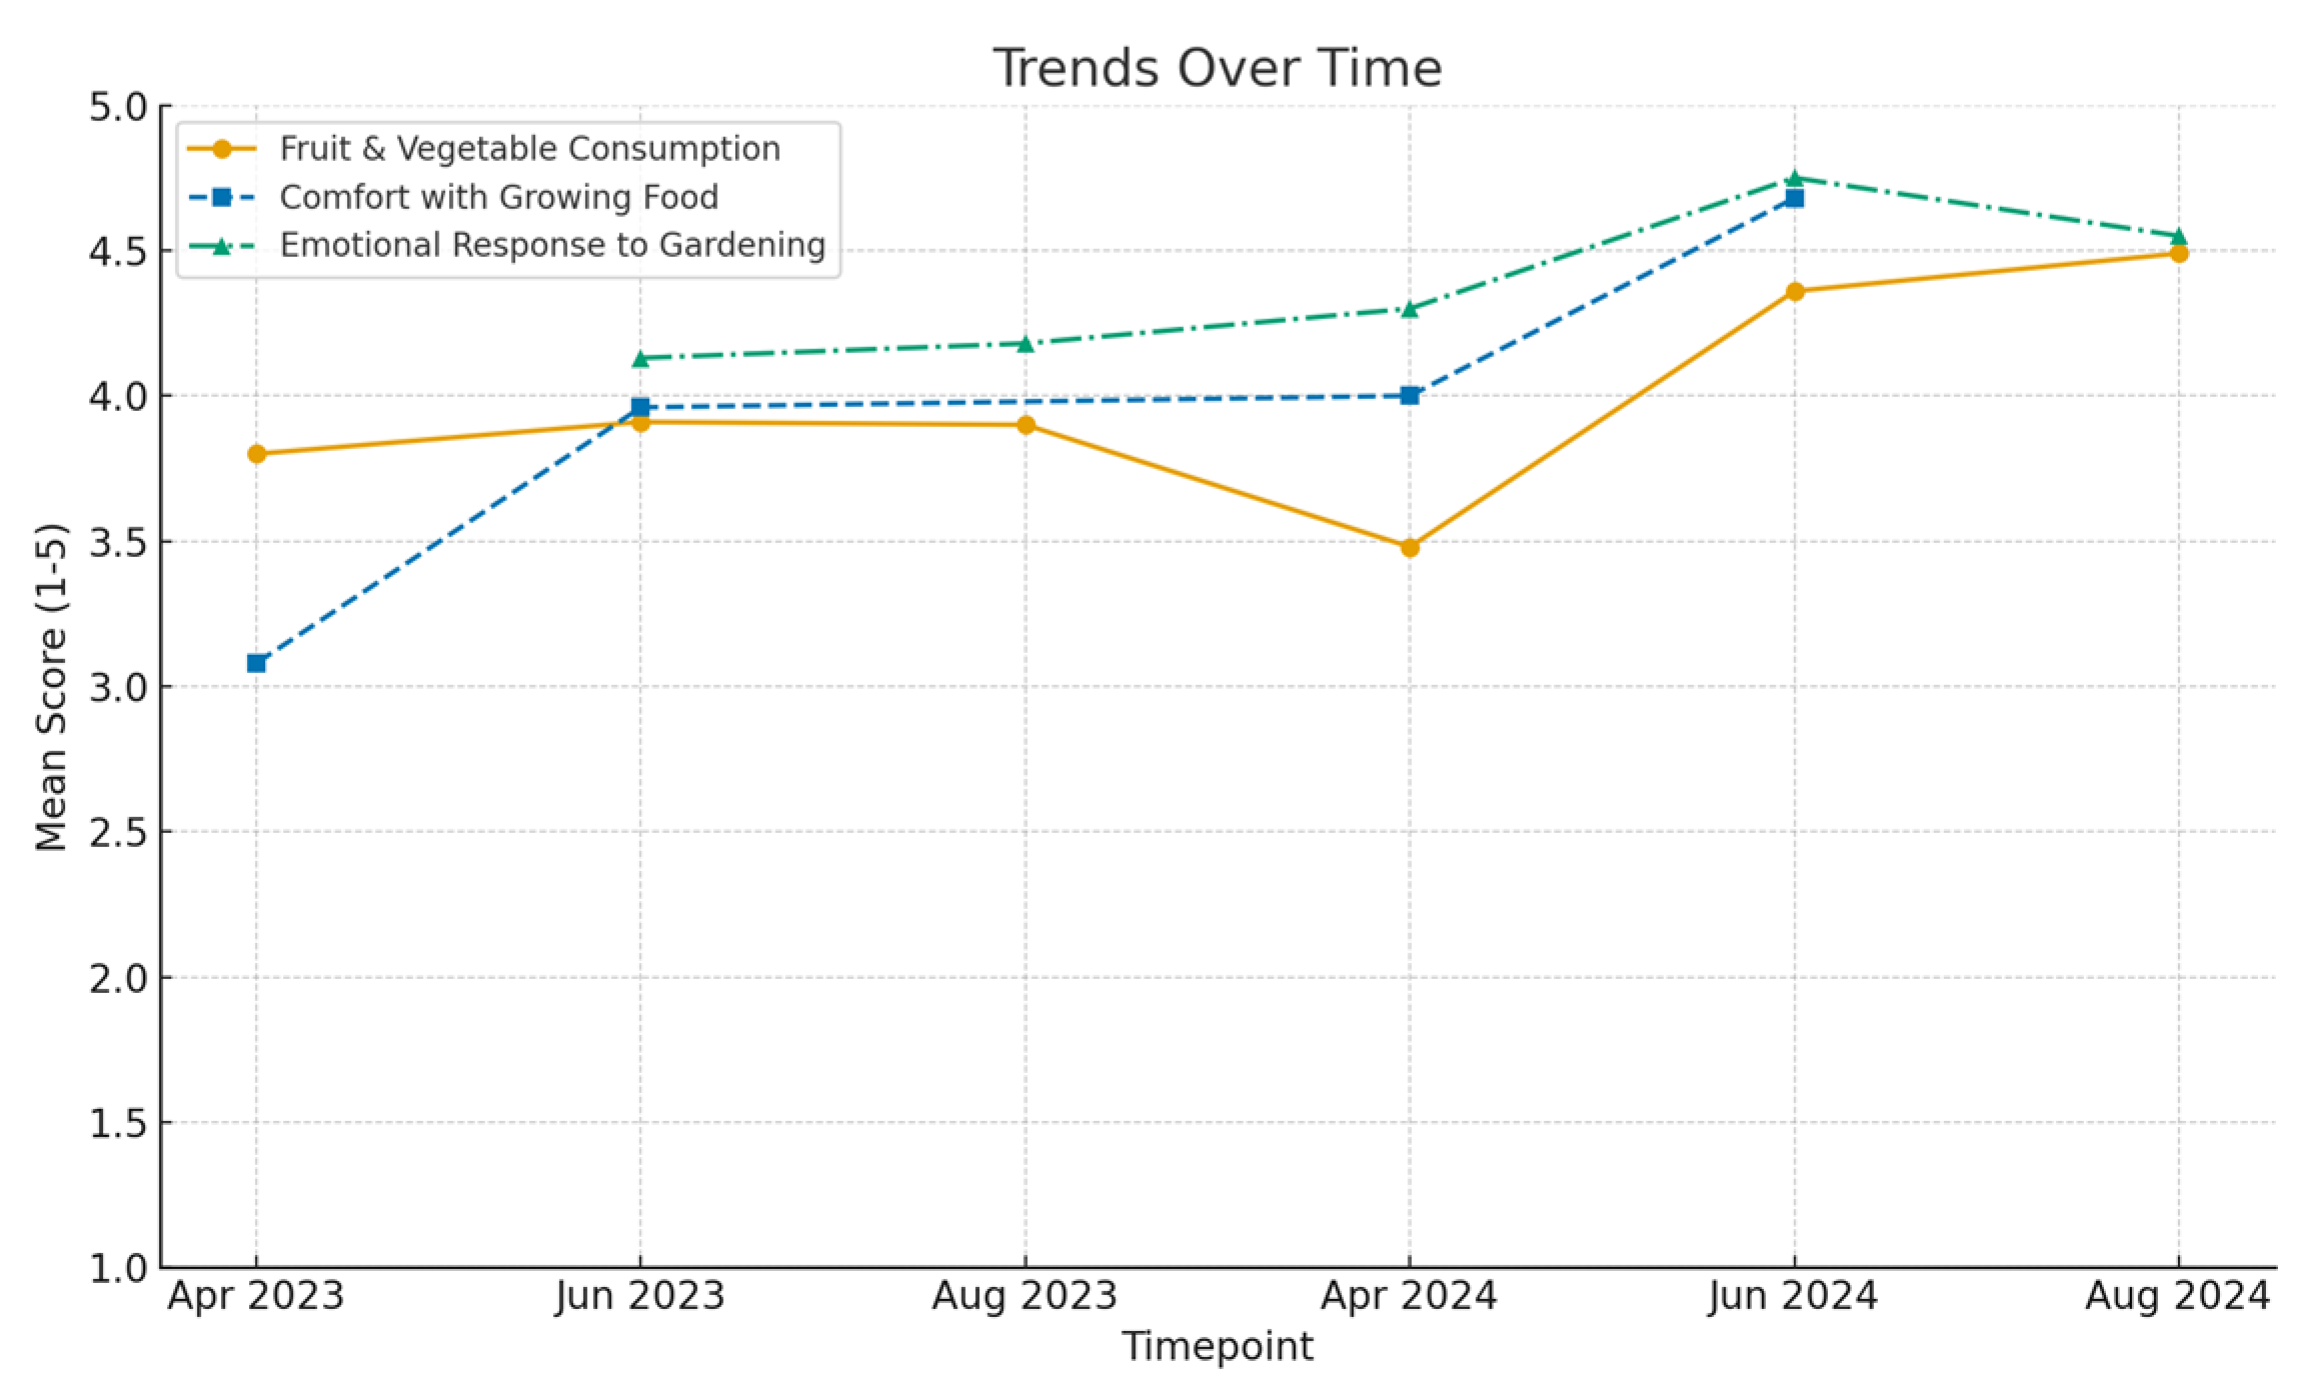

Table 1.
Demographics of the LEAF Participants.
|
2023 79 families (308a individuals) |
2024 79 families (356a individuals) |
|
| Household size (mean, range)b | 4, 2–7 | 5, 1–8 |
| Reported household (n=79) age groups (nc, %) | ||
| 0–5 | 13 (16%) | 36 (46%) |
| 6–12 | 16 (20%) | 39 (49%) |
| 13–19 | 25 (32%) | 39 (49%) |
| 20–35 | 35 (44%) | 35 (44%) |
| 36–45 | 20 (25%) | 24 (30%) |
| 46–55 | 20 (25%) | 24 (30%) |
| 56–65 | 6 (8%) | 9 (11%) |
| 66+ | 5 (6%) | 4 (5%) |
| Race/ethnicity (n=79) (n, %)d | ||
| Latino/Hispanic | 71 (90%) | 71 (90%) |
| African American | 5 (6%)e | 4 (5%)e |
| Mixed | 3 (4%)e | 4 (5%)e |
aAlthough the number of enrolled families (n = 80) and completed surveys (n = 79) remained consistent across years, the total number of individuals represented increased from 308 in 2023 to 356 in 2024 due to natural changes in household composition (e.g., new children, relatives joining, or changes in which household member completed the survey). bMedian household size was the same as the mean. cNumber of households reporting having one or more persons in the indicated age group. dThis is the race/ethnicity reported for the person who completed the survey for the household. eSmall variations in reported race/ethnicity categories may reflect which household member completed the demographic survey rather than substantive demographic shifts.
Table 2.
Fruit and Vegetable Consumption and Gardening Outcomes.
|
Outcome |
April 2023 mean (SD) |
June 2023 mean (SD) |
August 2023 mean (SD) |
April 2024 mean (SD) |
June 2024 mean (SD) |
August 2024 mean (SD) |
pa |
| F&V Consumption Scale 1-5b |
3.80# (1.11) | 3.91# (1.17) |
3.90# (1.04) |
3.48# (1.03) |
4.36& (0.81) |
4.49& (0.62) |
<0.05 |
| Comfort Growing Food Scale 1-5c |
3.08# (1.43) |
3.96& (1.32) |
--e | 4.00& (0.89) |
4.68$ (0.65) |
--e | <0.05 |
| Emotional Response to Gardening Scale 1-5d | --e | 4.13# (1.25) |
4.18# (0.98) |
4.30# (0.82) |
4.75& (0.54) |
4.55& (0.67) |
<0.05 |
aAn ANOVA test was used to compare the mean values of each outcome in Table 2 across all time points, and the results were statistically significant. To further examine differences between specific time points, Tukey’s HSD post-hoc test was conducted (for example, April 2023 vs. June 2023; April 2023 vs. April 2024; April 2023 vs. June 2024; June 2023 vs. April 2024; June 2023 vs. June 2024; April 2024 vs. June 2024; see Section 3.3 for details). Time points with no significant difference are marked with the same symbol. b1= rarely or never, 5= every day c1=not at all comfortable, 5=very comfortable. d1=very bad, 5=very good. eQuestion is not asked in this survey
Table 3.
Food Assistance.
|
2023 April (n=79) |
2024 April (n=79) |
|
| Food Assistance | ||
| SNAPa only | 10 (13%) | 23 (29%) |
| WICb only | 4 (5%) | 5 (6%) |
| SNAP + WIC | 2 (3%) | 3 (4%) |
| None | 63 (80%) | 48 (61%) |
| Fruit and Vegetable Purchasingc | ||
| Supermarket | 75 (95%) | 74 (94%) |
| Street Vendors | 39 (49%) | 25 (32%) |
| Farmers Market | 37 (47%) | 16 (20%) |
| Grocery Stores | 21 (27%) | 15 (19%) |
| Bodegas | 0 (0%) | 9 (11%) |
| Food Delivery | 1 (1%) | 0 (0%) |
| None / Other | 4 (5%) | 1 (1%) |
| No answer | 2 (3%) | 4 (5%) |
| Perceived Affordability of Fruits and Vegetables | ||
| Not affordable | 9 (11%) | 11 (14%) |
| A little bit affordable | 27 (34%) | 27 (34%) |
| Somewhat affordable | 27 (34%) | 32 (41%) |
| Affordable | 12 (15%) | 6 (8%) |
| Very affordable | 4 (5%) | 3 (4%) |
| Unmet Food Needs | ||
| Vegetables | 21 (27%) | 35 (44%) |
| Fruit | 18 (23%) | 18 (23%) |
| Organic Produce | 14 (18%) | 0 (0%) |
| Meat & Fish | 6 (8%) | 18 (23%) |
| Prepared Foods and Miscellaneous | 3 (4%) | 7 (9%) |
| Dairy | 2 (3%) | 9 (11%) |
| Anything | 8 (10%) | 5 (6%) |
| No Answer | 21 (27%) | 6 (8%) |
| Requested LEAF Support Items | ||
| Produce | -- | 63 (80%) |
| Plants | -- | 50 (63%) |
| Hygiene Packages | -- | 36 (46%) |
| Clothes | -- | 32 (41%) |
| Cooked Meals | -- | 22 (28%) |
| No answer | -- | 0 (0%) |
| Stone Barnes Visit Attendanced | ||
| Families Indicating Intent (survey 2) | 64 (81%) | Not asked |
| Individuals Planned to Attend (survey 2) | 214 individuals | Not asked |
| Individuals Actually Attended | 100 (cap reached) | 100 (cap reached, waitlist full) |
aSupplemental Nutrition Assistance Program. bWomen Infants and Children Program. cParticipants could choose more than one option. dSurvey intent to attend was collected in June 2023, when families reported the number of household members who would participate. Due to high demand, Stone Barns Center instituted a 100-person attendance cap beginning in 2023. In 2024, registration was managed through a sign-up sheet with a full 25-person waitlist.
Disclaimer/Publisher’s Note: The statements, opinions and data contained in all publications are solely those of the individual author(s) and contributor(s) and not of MDPI and/or the editor(s). MDPI and/or the editor(s) disclaim responsibility for any injury to people or property resulting from any ideas, methods, instructions or products referred to in the content. |
© 2025 by the authors. Licensee MDPI, Basel, Switzerland. This article is an open access article distributed under the terms and conditions of the Creative Commons Attribution (CC BY) license (http://creativecommons.org/licenses/by/4.0/).
Copyright: This open access article is published under a Creative Commons CC BY 4.0 license, which permit the free download, distribution, and reuse, provided that the author and preprint are cited in any reuse.


