
Submitted:
14 November 2025
Posted:
17 November 2025
You are already at the latest version
Abstract
Tuberculosis remains a major public health concern in Uganda and one among the thirty high TB burden countries globally. Despite national progress, gaps persist due to asymptomatic infections, diagnostic limitations, and uneven access to healthcare within the country. This study implemented the Epi-Control platform, an AI-driven predictive modelling tool, to predict community level hotspots and support data driven active case finding (ACF). Using retrospec-tive chest x-ray screening data, we integrated demographic, environmental and human development indicators from open-source databases to model TB risk at sub-parish level. A proprietary Bayesian modelling framework was deployed and validated by comparing TB yields between predicted hotspots and non-hotspot locations. Across Uganda, the mod-el identified significantly higher TB yields in hotspot areas (risk ratio= 1.69, 95% CI 1.41-2.02; p< 0.001). The Central and Western regions showed the highest concentrations of hotspots, consistent with their population density and urbaniza-tion patterns. The results demonstrate that AI-based predictive modelling can enhance the efficiency of ACF by targeting high-risk areas for screening. Integrating such predictive tools within national TB programs can optimize resource allo-cation and accelerate progress toward Uganda’s TB elimination goals.
Keywords:
hotspots
; tuberculosis
; active case finding
; artificial intelligence
1. Introduction
Tuberculosis (TB) continues to pose a significant public health challenge in Uganda, the country is among the thirty high TB burden countries globally, with an estimated 240 new cases reported daily [1]. While stakeholders use national estimates of incidence and prevalence to determine high-burden areas, these figures can vary locally due to differences in local risk factors [2]. Moreover, passive case finding often fails to fully capture the true TB incidence [3,4]. This is attributable to factors such as limited healthcare access, asymptomatic cases, diagnostic shortcomings, or misdiagnosis as other respiratory ailments [4]. Active case finding (ACF) proactively identifies individuals at risk of TB, a shift from reactive healthcare [3,5]. It is vital for diagnosing TB in both urban and rural areas, stopping its spread through early detection and treatment [6]. ACF also helps pinpoint risk factors, allowing efficient resource allocation and reducing disease burden [7].
Ugandan studies highlight the effectiveness of ACF strategies in boosting TB case detection. One study found community-based ACF had a tenfold higher screening yield than healthcare facility screening (3.7% vs. 0.3%) [8]. Another study by Robsky et al. in Kampala showed screening 20% of the population could find 40% of undiagnosed TB cases [7]. Aceng observed a rise in TB case notifications in Uganda, especially after ACF implementation began in 2018 [2]. Given that ACF requires significant resources, it is essential to implement data-driven and evidence-based strategies to enhance systematic and cost-effective screening. Methods like GIS-based hotspot mapping [4,7,9,10] effectively target resources to TB hyperendemic zones or hotspots. Traditional geospatial mapping methodologies predominantly rely on routine notification data, thereby limiting their accuracy to the quality of the data itself. In countries where notification data fails to encompass all instances, it becomes imperative to explore alternative and innovative strategies.
Leveraging the growing adoption of AI and machine learning approaches, we implemented a proprietary solution from EPCON, called the ‘Epi-control platform’ to identify community level TB hotspots in Uganda. The solution has previously been implemented in Pakistan [11], Nigeria [12], Central African Republic [13], The Philippines to mention a few, in collaboration with local partner organizations and the National TB control programs.
The Epi-control platform is a software, accessible via a browser, which uses AI to strengthen public health. The platform uses principles of machine learning to develop an epidemiological digital representation (“twin model”) of geospatial TB positivity across Uganda. This digital twin model was based on data generated from local ACF program implementation and contextual data, following the principles of the MATCH framework [14,15]. The outputs were visualized on a customized Geoportal with an intuitive interface. The local stakeholders can access the platform for routine planning of community outreach interventions, assessing the distribution of healthcare services and countrywide hotspot predictions down to the community level.
This study aims to assess the ability of the Epi-control platform to effectively predict ‘hotspots’ that could be targeted for improving ACF outcomes in Uganda.
We intend to achieve the following objectives:
- Use Chest X-ray based ACF data along with local contextual data to predict TB positivity rate at sub-parish level across the four regions.
- Map the predicted output, the TB positivity rate on a customized geoportal for geospatial visualization and local stakeholder engagement in Uganda.
- Estimate the difference in yield (confirmed TB cases/screened) by comparing predicted ‘hotspots’ with ‘non-hotspots.’
2. Materials and Methods
2.1. Study Design and Setting
A retrospective analysis was conducted on the data generated from community-based ACF interventions implemented under the United States Government (USG) funded Local Partner Health Services for Tuberculosis (LPHS-TB) activity, led by the Infectious Diseases Institute (IDI) in collaboration with other implementing partners. The project data was collected between Jan 2023 to October 2025. The program implementation involved national, subnational, and community stakeholders. The National Tuberculosis and Leprosy Control Program (NTLP) provided strategic oversight, while district, regional, and community civil society organizations managed demand creation, mobilization, logistical support for mobile services (van, digital x-rays), and patient linkage to care. Additional partners included USG-supported grants and The Global Fund.
ACF activities implemented multi-pronged interventions in 15 sub-regions (146+ districts) across Uganda. These interventions included verbal screening for symptoms, mobile digital chest X-ray (DCXR) and CXR vans equipped with AI software for TB screening, all in adherence to the National screening algorithm. At community level the project engaged community-based civil society organizations (CSOs) and village health teams volunteers (VHTs) for contact tracing of index TB cases enrolled for treatment, community outreach, active case finding and sensitization meetings in the communities. This diverse coverage up to the community level ensured the model was trained on data from varied epidemiological and socio-economic context.
While the intervention included both verbal and X-ray based screening, we chose to use only X-ray based data for modelling TB hotspots. Chest x-rays have higher sensitivity as compared to verbal screening and can detect nonclinical TB [16,17], the final dataset could provide a better understanding of actual distribution of undiagnosed TB in the community. This meant that we included 26% of the total data available from the screening intervention.
2.2. Input and Outcome Variables
The TB positivity rate was defined as the proportion of confirmed TB cases from the total individuals screened by chest X-ray devices (observed yield), serving as the model training variable. Predicted TB positivity rate was the outcome of interest. Incomplete records lacking confirmatory test results or geospatial data were excluded from the dataset.
2.3. Covariates
Data regarding sociodemographic and human development indicators, recognized as factors linked to TB [18,19], were obtained from open-source platforms. The total population density, encompassing females, males, and the elderly, was sourced from Facebook [20]. Data on poverty, distance to major roads, were obtained from WorldPop [21]. Data on childhood vaccinations, including the full 8 basic vaccination, DPT1 and 2, and the measles vaccine were obtained from spatially modelled data from Demographic and Health Surveys (DHS) [22]. Data on male and female literacy [23], childhood nutrition (percentage of underweight children) [24], and mortality under 5 [23] were obtained from Institute for Health Metrics and Evaluation (IHME) [25]. Access to water, sanitation availability, nighttime lights [26], elevations [21], Gridded Relative Deprivation Index (GRDI) [27], and motorized travel time to a health facility [28] were also included in the assessment [29]. Table 1 lists the variables, and more details are available in the supplementary file.
2.4. Resolution, Data Preparation, and Model Training
Uganda consists of four major regions: namely the Central, Eastern, Northern and Western regions. These are further divided into 15 sub-regions referred to as health regions, which sub-divide into 146 districts, 312 counties, 2208 sub-counties and 10 864 parishes. The parishes were further divided into smaller units called ‘sub-parishes’ by using the K-means clustering algorithm such that each sub-parish contained approximately 10,000 population. The approach has been explained in more detail in another publication [14,12].
All variables listed in Table 1 were aggregated to the sub-parish level. They were then scaled to a rate form, providing each unit with a unique profile based on its local sociodemographic contextual information. Sub-parishes with screening count lower than 25 were excluded from the analyses and modelling.
Chest X ray based ACF events were organized across 10,864 sub-parishes, the geo-coordinates of each event were shared by the implementing partners that enabled precise mapping. The model was trained on the observed sub-parish TB positivity rate to predict a TB positivity rate for all sub-parishes including those with observed data. The predicted output thus allowed for identification of other areas that could be prioritized for ACF activities.
2.5. Modelling Approach
The modelling pipeline used sub-parish–level chest X-ray TB positivity rates as the response variable, complemented by the set of the associated X-ray screening data and contextual covariates as predictor variables. A proprietary full Bayesian framework [14] was implemented to estimate the underlying TB positivity rate across all sub-parishes, including those without direct observations, by modelling the influence of included covariates on the target variable. Bayesian network structure was learned using the Peter-Clark (PC) algorithm for causal discovery with the Fisher-Z test for conditional independence and an alpha sensitivity setting of 0.9, and Linear Gaussian Conditional Probability Distribution (CPDs) for parameter estimation were fitted using Maximum Likelihood Estimation. A maximum parent cutoff of 5 parents to the target node were used, and nodes not directly connected to the target variable were pruned. Model inference was performed using analytical propagation of evidence through the network’s linear Gaussian conditional probability distributions.
2.6. Model Evaluation and Comparison
To evaluate predictive performance, a five-fold cross-validation approach was applied across all sub-parishes in the country. The data were first partitioned into five groups (folds) using the GroupKFold method. For each iteration, four folds (80% of the data) were used to train a Bayesian model, while the remaining fold (20%) served as the validation set to test predictive accuracy. This process was repeated five times so that every sub-parish was used once for validation. Model accuracy and calibration were then assessed by comparing predicted TB positivity rates against the observed rates in the held-out folds.
To interpret hotspot performance, predictions were sorted by estimated positivity rate, and the top 30% of sub-parishes were classified as hotspots, and the remainder as non-hotspots, based on prior cross-country calibration. For each fold, relative yield metrics were computed: Hotspot yield vs. non-hotspot yield (positives per screened), Risk ratio, relative risk increase (RRI), risk difference, number needed to screen (NNS), and statistical significance via Fisher’s Exact Test.
Additionally, a stratified evaluation was conducted to assess model performance across the four major regions, to evaluate whether the predictive accuracy was consistent across distinct epidemiological contexts. Hotspots were identified based on the top 30% of predicted TB positivity rates, with the remaining 70% classified as non-hotspots.
3. Results
We analysed chest X-ray based ACF data aggregated across four regions: Central, Eastern, Northern, and Western. The four regions were subdivided into 146 districts, which were further divided into 10,864 parishes. Key metrics presented for each region are presented in Table 2.
The distribution of the number and proportion of hotspots and non-hotspots and their ACF coverage across the country, by region are illustrated in Table 3.

Table 4.
Chest X-ray based ACF yield in predicted hotspots and non-hotspots across the country.
| Region | Hotspots | Non-hotspots | Risk ratio | 95% CI (Risk Ratio) | Relative Risk Increase | Fischer’s exact p- value |
| Country | TB positive: 215 TB negative: 11064 |
TB positive: 250 TB negative: 21898 |
1.69 | 1.41-2.02 | 0.69 | < 0.001 |
| Central | TB positive: 18 TB negative: 905 |
TB positive: 93 TB negative: 10306 |
2.18 | 1.32-3.60 | 1.18 | 0.004 |
| Eastern | TB positive: 75 TB negative: 4140 |
TB positive: 71 TB negative: 6002 |
1.52 | 1.10-2.10 | 0.52 | 0.011 |
| Northern | TB positive: 49 TB negative: 1805 |
TB positive: 66 TB negative: 4286 |
1.74 | 1.21-2.51 | 0.74 | 0.003 |
| Western | TB positive: 54 TB negative: 2217 |
TB positive: 39 TB negative: 3301 |
2.04 | 1.35-3.06 | 1.04 | < 0.001 |
Across the country, chest X-ray screening identified 215 TB-positive individuals in hotspot areas and 250 in non-hotspot areas, corresponding to a risk ratio of 1.69 (95% CI: 1.41-2.02; p < 0.001). At the regional level, risk ratios ranged from 1.52 (95% CI: 1.10-2.10; p=0.011) in the Eastern region to 2.18 (95% CI: 1.32-3.60; p=0.004) in the Central region. Statistically significant associations were observed in all four regions.
We mapped the predicted outputs on a customized geoportal for easy access for the stakeholders (Figure 1).
4. Discussion
This study demonstrates the application of an innovative solution, the Epi-control platform to predict TB hotspots in Uganda. The solution is based on a Bayesian inference model, integrating community based ACF data, socio-demographic data, and other contextual data to identify TB hotspots in Uganda. We compared the difference in TB case finding yield in predicted hotspots with non-hotspots.
The model predicted a variable number of hotspots across the four regions of Uganda and demonstrated potential to improve case finding yield across all regions. An analysis of the predicted hotspot distribution reveals that the highest number of hotspots were identified in the central region (48.7%), followed by the western regions (42.8%). Conversely, the northern and eastern regions exhibited the fewest predicted hotspots.
The central region demonstrated the highest screening coverage, succeeded by the eastern, western, and northern regions, respectively. According to Uganda’s 2002 census, the Central region accounted for 27% of the country’s population, the Western region 26%, the Eastern region 25%, and the Northern region 22%. Furthermore, the Central region contained 54% of the urban population (predominantly in Kampala), while the Northern, Western, and Eastern regions accounted for 17%, 14%, and 13% of the urban population, respectively [28]. Given the higher population density and urban settlements in the central and western regions, the model’s prediction of a greater proportion of hotspots in these areas aligns with the typical distribution of TB transmission, which tends to be higher in populous urban settings [29].
While this model predicted most hotspots in the central and western regions, an alternative spatial modelling approach by Henry et al. [3] suggests a higher prevalence of hotspots in the central and northern regions. This difference could be attributed to the ACF data included in our analysis, we had the most extensive screening coverage in the central region and the least in the northern region. With ongoing program implementation and updates to the dataset, the model’s outputs may undergo further refinement over time. Also, variations in definition of ‘hotspots can also lead to relative differences.
Another noteworthy observation from the geospatial distribution of high burden areas is the potential for the model to have identified previously unknown hotspots. For instance, the Mbale and Soroti districts in the eastern region were traditionally recognized as areas with low notification rates [2]. While this could be due to low reporting, inadequate screening, or genuinely low TB transmission, our model predicts Mbale district as a potential hotspot. The dataset included high screening coverage in this region together with the highest number of confirmed TB cases in the eastern region. This highlighted an advantage of utilizing community-based active case finding (ACF) data over notification data for identifying TB hotspots. By learning from both community-based interventions and local contextual data, the model facilitates a more comprehensive understanding of the population’s local health situations.
A significant burden of TB was predicted in large areas of the western region (Table 1 and Figure 2). While some studies suggest the burden in this region is below the national average [4], our finding may alternatively indicate a higher prevalence of undetected TB, which is not captured by notification-based studies. Wynne et al. reported that the National TB control program in the Western Uganda region encounters substantial challenges, with the healthcare system facing financial constraints that adversely affect timely diagnosis and patient outcomes [30]. The western region shares borders with the Democratic Republic of Congo (DRC), Tanzania, Rwanda, and Burundi, potentially resulting in a high migrant population. This demographic group frequently experiences financial hardship, difficult living conditions, and systemic barriers to accessing and maintaining continuous care [31,32]. It is plausible that the model identified a potentially underserved region with an elevated risk of undiagnosed TB.
Based on the Fischer’s exact test results and indicators of relative risk increase from the hotspot to non-hotspot comparison; we conclude that the Epi-control platform can enhance TB case finding yield by 68% across the country. In practical terms, for every 100 TB cases identified through routine screening methods, employing the Epi-Control platform could lead to the identification of approximately 168 cases under similar conditions. Although ACF interventions are costly, targeting specific areas or hotspots could contribute to the detection of more undiagnosed TB cases within the community, thereby improving the overall cost-efficiency of intervention.
The geoportal developed to visualize predicted hotspots enhances the practical applicability of the predictive outputs, enabling stakeholders, such as the NTLP managers, community-based organizations to access and act on the findings efficiently. The platform enhances the applicability of predictive outputs by allowing for targeted interventions in specific communities, which can lead to improved TB case notifications and optimized resource allocation. The portal also visualizes contextual data layers for further analysis and epidemiological insight.
Our approach had certain limitations and potential biases. Primarily, sampling bias may have occurred because we relied on ACF screening data. This data includes individuals reached through organized outreach events, possibly underrepresenting remote, underserved, or stigmatized populations. But since we included several other contextual indicators, the effect may have been mitigated to some extent. Utilizing ACF data for predictive modelling also offered a significant advantage. It allowed the model to learn the distribution of undiagnosed TB cases within the community, thereby enhancing its ability to predict new ACF sites more effectively than facility-level notification data alone [12]. This approach minimizes the dependence on notification data and facilitates data-driven decision-making in low-resource environments.
This approach, a first for Uganda, involved predicting subnational TB hotspots at a sub-parish level. Therefore, it is hard to validate the predicted geographical distribution of high TB burden areas by comparing with existing evidence. However, studies that highlight the potential challenges or drivers of TB transmission in specific regions helped us understand whether the predicted distribution aligns with the available knowledge. The test of significance comparing yield in the hotspots with non-hotspots is therefore a satisfactory approach for a quantitative comparison. It can be concluded that the Epi-control platform may prove to be a promising solution to guide ACF interventions and help find undiagnosed TB in communities.
Author Contributions
Conceptualization, G.A., P.T., K.R.M. , M.G.P. and C.V.C.; Methodology, S.H., J.S.,P.T., AL.B. and M.G.P.; Software, J.S., AL.B. and M.G.P; Validation, S.H., J.S., AL.B. and M.G.P.; Formal Analysis, J.S. and AL.B.; Resources, G.A., P.T., S.D.B., M.B., L.H., M.N-M and C.V.C; Data Curation, G.A., P.T., B.N., A.Z., M.N-M; Writing—Original Draft Preparation, S.H., B.N., J.S. and M.G.P.; Writing—G.A., AL.B; Visualization, J.S.; Supervision, G.A., P.T., K.R.M., C.V.C; Project Administration, A.Z., B.N., G.A. and P.T. ; Funding Acquisition, G.A., L.H.,M.B., S.D.B., and C.V.C. All co-authors read and approved the manuscript.
Funding
The ACF intervention program led by IDI was directly funded by the United States Government. IDI contracted EPCON for the implementation of the Epi-control platform. EPCON did not receive any funding for preparation of this manuscript.
Institutional Review Board Statement
Not applicable.
Data Availability Statement
The datasets presented in this article are not readily available because it is the sole property of the National TB control program, Uganda. Requests to access the datasets should be directed to the same authority.
Conflicts of Interest
The authors declare no competing interests.
Abbreviations
| ACF | Active Case Finding |
| AI | Artificial Intelligence |
| CSO | Civil Society Organizations |
| CPD | Conditional Probability Distribution |
| DHS | Demographic and Health Survey |
| DCXR | Digital Chest X-Ray |
| GIS | Geographic Information System |
| GRDI | Gridded Relative Wealth Index |
| IDI | Infectious Disease Institute |
| LPHS-TB | Local Partner Health Services for Tuberculosis |
| MoH | Ministry of Health |
| NTLP | National TB and Leprosy Control Program |
| TB | Tuberculosis |
| USG | United States Government |
| VHTs | Village Health Teams |
| WHO | World Health Organization |
Appendix A
Table A1.
Epidemiological Variables and Sources.
| Variable Name | Definition/Description | Source | Resolution | Year |
| Overall population density | Number of people per square kilometer | 30m | 2016 | |
| Elderly (ages 60+) population | Counts of people over the age of 60 per square kilometre | |||
| Female population | Counts of females per square kilometer | |||
| Male population | Counts of males per square kilometer | |||
| Distance to major roads | Distance from OpenStreetMap major roads to the centroid of a population cluster, measured in kilometers | WorldPop | 3 arc seconds/~100m at the equator | 2018 |
| DPT 1 vaccination received | Percentage of children 12-23 months who had received DPT 1 vaccination | Uganda Bureau of Statistics (UBOS) and ICF | 5 × 5km | 2018 |
| DPT 3 vaccination received | Percentage of children 12-23 months who had received DPT 3 vaccination | |||
| Fully vaccinated (8 basic antigens) | Percentage of children 12-23 months who were fully vaccinated with 8 basic antigens (BCG, Polio 1-3, DPT 1-3, Measles) | |||
| Measles vaccination received | Percentage of children 12-23months who had received Measles vaccination | |||
| Prevalence of stunting among children under 5 years of age | Percentage of children stunted (below −2 SD of height for age according to the WHO standard) | |||
| Literacy men and women | Mean years of educational attainment in men (ages 15-49) and women (ages 15-49) | Institute For Health Metrics and Evaluation | 5 × 5km | 2019 |
| Prevalence of underweight among children younger than 5 years of age |
Percentage of children with a body mass index (BMI) of lower than 18.5 | 5 × 5km | 2019 | |
| Under-5 (0-5 years old) mortality probability | Probability of death for children under 5—mean estimates. | Institute for Health Metrics and Evaluation | 5 × 5km | 2019 |
| Access to any improved water source | Percentage of the de jure population living in households whose main source of drinking water is an improved source | Institute for Health Metrics and Evaluation | 5 × 5km | 2019 |
| Reliance on open defecation | Percentage of the de jure population living in households whose main type of toilet facility is no facility (open defecation) | Institute for Health Metrics and Evaluation | 5 × 5km | 2019 |
| HIV prevalence | Estimated prevalence among individuals aged 15–59 years | Institute for Health Metrics and Evaluation | 5 × 5km | 2019 |
| Elevation | Elevation above sea level (in metres) | WorldPop | 100m | |
| Motorised travel time to health facility | Optimal travel time to healthcare with access to motorised transport | Malaria Atlas | 1km | |
| Nightlights [nanoWatts/cm2/sr] | VIIRS data measured in nanoWatts/cm2/sr | Earth Observation Group | 100m | |
| Relative deprivation index | Composite socioeconomic deprivation index (2010–2020 average). | NASA Socioeconomic Data and Applications Center | 1km |
References
- WHO. WHO conducts mid-term review of Uganda’s response to TB | WHO | Regional Office for Africa [Internet]. 2023 [cited 2025 Aug 12]. Available from: https://www.afro.who.
- Aceng, F.L.; Kabwama, S.N.; Ario, A.R.; Etwom, A.; Turyahabwe, S.; Mugabe, F.R. Spatial distribution and temporal trends of tuberculosis case notifications, Uganda: a ten-year retrospective analysis (2013-2022). BMC Infect. Dis. 2024, 24, 46. [Google Scholar] [CrossRef]
- Ho, J.; Fox, G.J.; Marais, B.J. Passive case finding for tuberculosis is not enough. Int. J. Mycobacteriology 2016, 5, 374–378. [Google Scholar] [CrossRef]
- Henry, N.J.; Zawedde-Muyanja, S.; Majwala, R.K.; Turyahabwe, S.; Barnabas, R.V.; Reiner, R.C., Jr.; et al. Mapping TB incidence across districts in Uganda to inform health program activities. IJTLD OPEN 2024, 1, 223–229. [Google Scholar] [CrossRef]
- Ayabina, D.V.; Gomes, M.G.M.; Nguyen, N.V.; Vo, L.; Shreshta, S.; Thapa, A. , et al. The impact of active case finding on transmission dynamics of tuberculosis: A modelling study. PLoS ONE 2021, 16, e0257242. [Google Scholar] [CrossRef] [PubMed]
- Sekandi, J.N.; List, J.; Luzze, H.; Yin, X.P.; Dobbin, K.; Corso, P.S. , et al. Yield of undetected tuberculosis and human immunodeficiency virus coinfection from active case finding in urban Uganda. Int. J. Tuberc. Lung Dis. Off. J. Int. Union. Tuberc. Lung Dis. 2014, 18, 13–19. [Google Scholar] [CrossRef] [PubMed]
- Robsky, K.O.; Kitonsa, P.J.; Mukiibi, J.; Nakasolya, O.; Isooba, D.; Nalutaaya, A. , et al. Spatial distribution of people diagnosed with tuberculosis through routine and active case finding: a community-based study in Kampala, Uganda. Infect. Dis. Poverty 2020, 9, 73. [Google Scholar] [CrossRef] [PubMed]
- Kazibwe, A.; Twinomugisha, F.; Musaazi, J.; Nakaggwa, F.; Lukanga, D.; Aleu, P. , et al. Comparative yield of different active TB case finding interventions in a large urban TB project in central Uganda: a descriptive study. Afr. Health Sci. 2021, 21, 975–984. [Google Scholar] [CrossRef]
- Ochom, E.; Robsky, K.O.; Gupta, A.J.; Tamale, A.; Kungu, J.; Turimumahoro, P. , et al. Geographic distribution and predictors of diagnostic delays among possible TB patients in Uganda. Public. Health Action. 2023, 13, 70–76. [Google Scholar] [CrossRef]
- Aturinde, A.; Farnaghi, M.; Pilesjö, P.; Mansourian, A. Spatial analysis of HIV-TB co-clustering in Uganda. BMC Infect. Dis. 2019, 19, 612. [Google Scholar] [CrossRef]
- Mergenthaler, C.; Mathewson, J.D.; Lako, S.; van der Merwe, A.W.; Potgieter, M.; Meurrens, V. , et al. Predicting communities with high tuberculosis case-finding efficiency to optimise resource allocation in Pakistan: comparing the performance of a negative binomial spatial lag model with a Bayesian machine-learning model. BMJ Public. Health 2025, 3, e001424. [Google Scholar] [CrossRef]
- Alege, A.; Hashmi, S.; Eneogu, R.; Meurrens, V.; Budts, A.L.; Pedro, M. , et al. Effectiveness of Using AI-Driven Hotspot Mapping for Active Case Finding of Tuberculosis in Southwestern Nigeria. Trop. Med. Infect. Dis.
- Koura, K.G.; Hashmi, S.; Menon, S.; Gando, H.G.; Yamodo, A.K.; Budts, A.L. , et al. Leveraging Artificial Intelligence to Predict Potential TB Hotspots at the Community Level in Bangui, Republic of Central Africa. Trop. Med. Infect. Dis. 2025, 10, 93. [Google Scholar] [CrossRef] [PubMed]
- EPCON [Internet]. [cited 2025 Oct 28]. EPCON | Bayesian Network Approach. Available from: https://www.epcon.
- Rood, E.; Khan, A.H.; Modak, P.K.; Mergenthaler, C.; Van Gurp, M.; Blok, L. , et al. A Spatial Analysis Framework to Monitor and Accelerate Progress towards SDG 3 to End TB in Bangladesh. ISPRS Int. J. Geo-Inf. 2019, 8, 14. [Google Scholar] [CrossRef]
- John, S.; Abdulkarim, S.; Usman, S.; Rahman, M.d.T.; Creswell, J. Comparing tuberculosis symptom screening to chest X-ray with artificial intelligence in an active case finding campaign in Northeast Nigeria. BMC Glob. Public. Health 2023, 1, 17. [Google Scholar] [CrossRef] [PubMed]
- Babayi, A.P.; Odume, B.B.; Ogbudebe, C.L.; Chukwuogo, O.; Nwokoye, N.; Dim, C.C. , et al. Improving TB control: efficiencies of case-finding interventions in Nigeria. Public. Health Action. 2023, 13, 90–96. [Google Scholar] [CrossRef] [PubMed]
- van Gurp, M.; Rood, E.; Fatima, R.; Joshi, P.; Verma, S.C.; Khan, A.H. , et al. Finding gaps in TB notifications: spatial analysis of geographical patterns of TB notifications, associations with TB program efforts and social determinants of TB risk in Bangladesh, Nepal and Pakistan. BMC Infect. Dis. 2020, 20, 490. [Google Scholar] [CrossRef]
- Rahman, M.S.; Shiddik, A.B. Utilizing artificial intelligence to predict and analyze socioeconomic, environmental, and healthcare factors driving tuberculosis globally. Sci. Rep. 2025, 15, 13619. [Google Scholar] [CrossRef]
- Facebook Connectivity Lab and Center for International Earth Science Information Network—CIESIN—Columbia University. Global High Resolution Population Density Maps (Facebook Connectivity Lab, CIESIN) | UN-SPIDER Knowledge Portal [Internet]. High Resolution Settlement Layer (HRSL); 2016 [cited 2025 Oct 15]. Available from: https://www.un-spider.org/links-and-resources/data-sources/global-high-resolution-population-density-maps-facebook.
- WorldPop. Global 100m Covariates [Internet]. University of Southampton; 2018 [cited 2025 Oct 13]. Available from: https://www.worldpop.org/doi/10. 5258.
- 2ganda Bureau of Statistics (UBOS) and ICF. 2018. Uganda Demographic and Health Survey 2016. Kampala, Uganda and Rockville, Maryland, USA: UBOS and ICF.
- Institute for Health Metrics and Evaluation (IHME). Low- and Middle-Income Country Educational Attainment Geospatial Estimates 2000-2017. Seattle, United States of America: Institute for Health Metrics and Evaluation (IHME) 2019.
- Institute for Health Metrics and Evaluation (IHME). Global Under-5 Child Growth Failure Geospatial Estimates 2000-2019. Seattle, United States of America: Institute for Health Metrics and Evaluation (IHME), 2019.
- Institute for Health Metrics and Evaluation [IHME]. Low- and Middle-Income Country Neonatal, Infant, and Under-5 Mortality Geospatial Estimates 2000-2017 [Internet]. Institute for Health Metrics and Evaluation [IHME]; [cited 2025 Oct 27]. Available from: http://ghdx.healthdata. 2000.
- Mapping geographical inequalities in access to drinking water and sanitation facilities in low-income and middle-income countries, 2000–2017. Deshpande, Aniruddha et al. The Lancet Global Health 2020, 8, e1162–e1185. [Google Scholar]
- Dwyer-Lindgren, L.; Cork, M.A.; Sligar, A.; Steuben, K.M.; Wilson, K.F.; Provost, N.R.; Mayala, B.K.; VanderHeide, J.D.; Collison, M.L.; Hall, J.B.; Biehl, M.H. Mapping HIV prevalence in sub-Saharan Africa between 2000 and 2017. Nature 2019, 570, 189–193. [Google Scholar] [CrossRef]
- Earth Observation Group, NOAA/NESDIS/NCDC (2023). VIIRS Nighttime Lights.
- WorldPop (www.worldpop.org—School of Geography and Environmental Science, University of Southampton; Department of Geography and Geosciences, University of Louisville; Departement de Geographie, Universite de Namur) and Center for International Earth Science Information Network (CIESIN), Columbia University (2018).
- Malaria Atlas Project. Malaria Atlas Project | Data [Internet]. [cited 2025 Oct 13]. Available from: https://data.malariaatlas.org/trends?year=2024&metricGroup=Malaria&geographicLevel=admin0&metricSubcategory=Pf&metricType=rate&metricName=incidence. 2024.
- Data tools and practices | Institute for Health Metrics and Evaluation [Internet]. [cited 2025 Oct 13]. Available from: https://www.healthdata.
- Maps and Regions—Office of the Vice President of Uganda [Internet]. [cited 2025 Oct 29]. Available from: https://www.vicepresident.go.
- Mortazavi, S.A.; Swartwood, N.A.; Singh, N.; Can, M.H.; Cui, H.; Ryuk, D.K. , et al. Urban and rural prevalence of tuberculosis in low- and middle-income countries: a systematic review and meta-analysis [Internet]. medRxiv, /: 2025 Oct 27]. p. 2025.09.20.25336166. Available from: https, 2025. [Google Scholar]
- Wynne, A.; Richter, S.; Banura, L.; Kipp, W. Challenges in tuberculosis care in Western Uganda: Health care worker and patient perspectives. Int. J. Afr. Nurs. Sci. 2014, 1, 6–10. [Google Scholar] [CrossRef]
- Johnson-Peretz, J.; Chamie, G.; Kakande, E.; Christian, C.; Kamya, M.R.; Akatukwasa, C. , et al. Geographical, social, and political contexts of tuberculosis control and intervention, as reported by mid-level health managers in Uganda: ‘The activity around town.’ Soc Sci Med. 2023, 338, 116363. [Google Scholar]
- Seyedmehdi, S.M.; Jamaati, H.; Varahram, M.; Tabarsi, P.; Marjani, M.; Moniri, A. , et al. Barriers and facilitators of tuberculosis treatment among immigrants: an integrative review. BMC Public. Health 2024, 24, 3514. [Google Scholar] [CrossRef] [PubMed]
Figure 1.
Visualization of predicted TB positivity rate on the Epi-control Geoportal at sub parish level. Light yellow represents lower rate and dark red represents higher rate. Interspersed blue areas (in-land) represent sub-parishes where observed data was present (light blue to dark blue). District borders are represented with black lines.
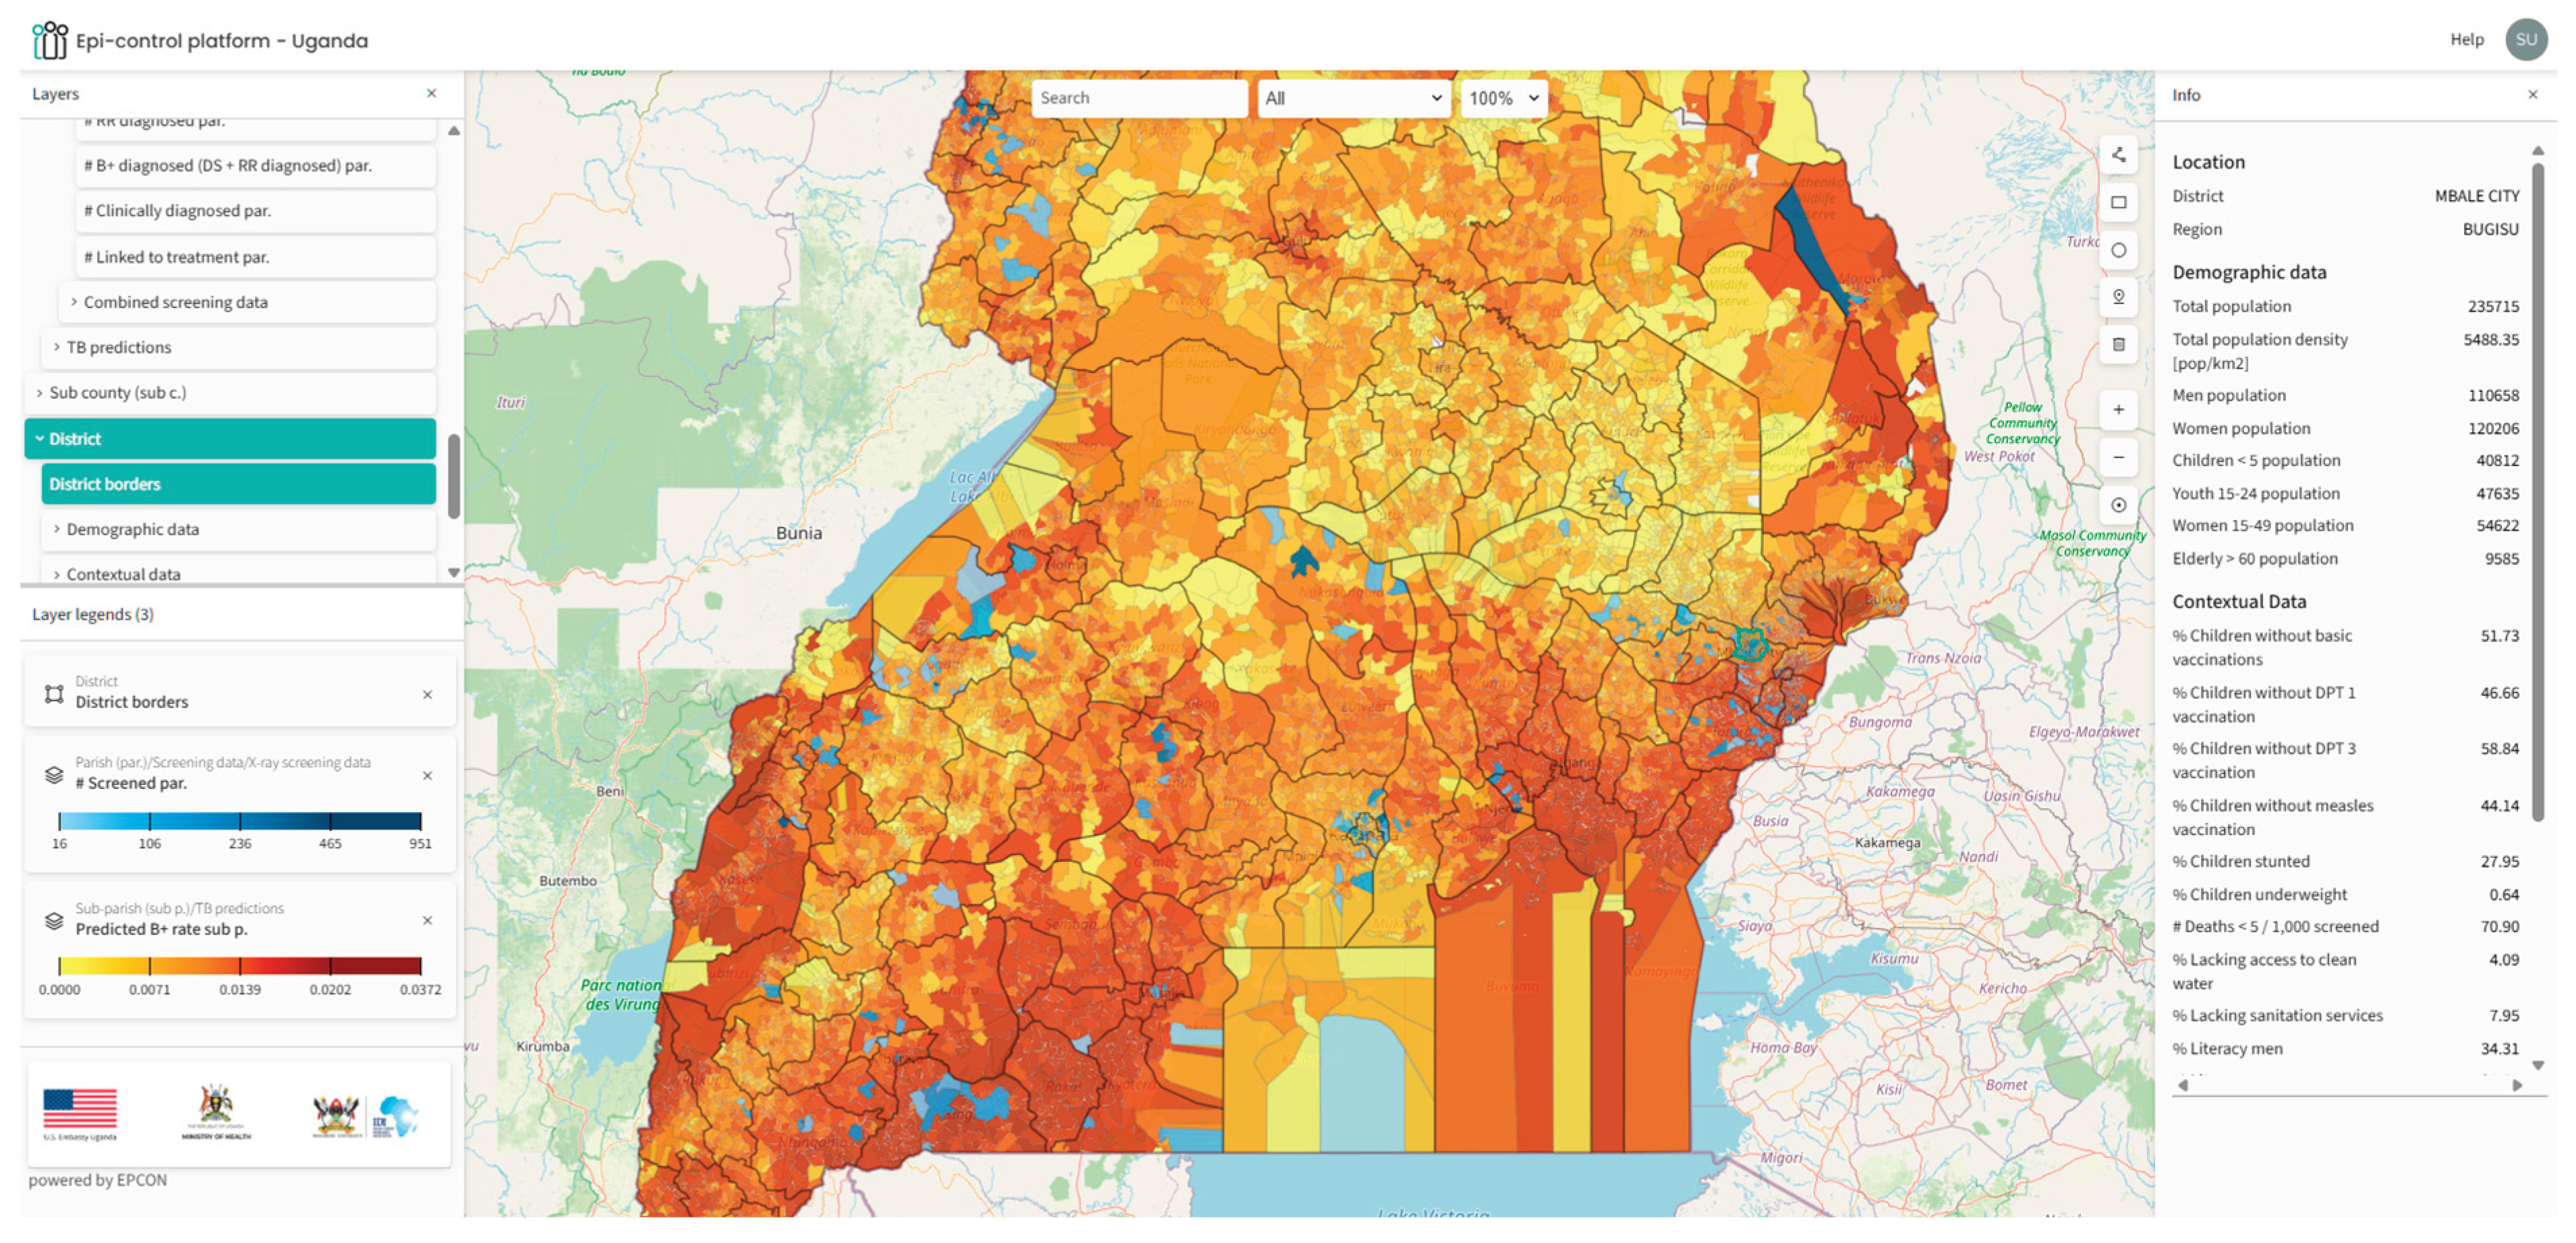
Table 1.
Local contextual data from open sources to inform subnational burden estimation.
| Indicator | Source | Year |
| Overall population density Elderly (ages 60+) population Female population Male population |
Facebook’s Connectivity Lab and the Center for International Earth Science Information Network | 2016 |
| Distance to major Roads Elevation |
WorldPop | 2018 |
| % children with DPT-1, DPT-3, Measles vaccination Fully vaccinated (8 basic antigens) |
Uganda Bureau of Statistics (UBOS) and ICF | 2018 |
| Under-5 (0-5 years old) mortality probability Access to any improved water source Reliance on open defecation HIV prevalence Literacy in male and females Percentage of children underweight |
Institute For Health Metrics and Evaluation | 2019 |
| Motorised travel time to health facility | Malaria Atlas Project (MAPS) | 2019 |
| Nightlights (nanoWatts/cm2/sr) | Earth Observation Group | 2023 |
| Relative Deprivation Index | NASA Socioeconomic Data and Applications Centre | 2020 |
Table 2.
Chest X-ray based ACF data and descriptive statistics across the country.
| Region | Metrics | N |
| Country | Total parishes Total Sub-parishes Sub-parishes screened Screening coverage Total Individuals screened TB diagnosed |
10,864 11,153 243 2.18% 33,427 465 |
| Central Region | Total parishes Total Sub-parishes Sub-parishes screened Screening coverage Total Individuals screened TB diagnosed |
1765 1958 71 3.63% 11,322 111 |
| Eastern Region | Total parishes Total Sub-parishes Sub-parishes screened Screening coverage Total Individuals screened TB diagnosed |
3599 3626 98 2.70% 10,288 146 |
| Northern Region | Total parishes Total Sub-parishes Sub-parishes screened Screening coverage Total Individuals screened TB diagnosed |
2628 2654 32 1.21% 6206 115 |
| Western Region | Total parishes Total Sub-parishes Sub-parishes screened Screening coverage Total Individuals screened TB diagnosed |
2872 2915 42 1.44% 5611 93 |
Table 3.
Distribution of number and proportion of hotspots and non-hotspots and their ACF coverage across the country, by region.
Table 3.
Distribution of number and proportion of hotspots and non-hotspots and their ACF coverage across the country, by region.
| Region | Total Hotspots | Total non-hotspots | Total sub-parishes | Proportion of hotspots | Proportion of non-hotspots |
| Central | 954 | 1004 | 1958 | 48.7% | 51.3% |
| Eastern | 822 | 2804 | 3626 | 22.7% | 77.3% |
| Northern | 320 | 2334 | 2654 | 12.1% | 87.9% |
| Western | 1249 | 1666 | 2915 | 42.8% | 57.2% |
Disclaimer/Publisher’s Note: The statements, opinions and data contained in all publications are solely those of the individual author(s) and contributor(s) and not of MDPI and/or the editor(s). MDPI and/or the editor(s) disclaim responsibility for any injury to people or property resulting from any ideas, methods, instructions or products referred to in the content. |
© 2025 by the authors. Licensee MDPI, Basel, Switzerland. This article is an open access article distributed under the terms and conditions of the Creative Commons Attribution (CC BY) license (http://creativecommons.org/licenses/by/4.0/).
Copyright: This open access article is published under a Creative Commons CC BY 4.0 license, which permit the free download, distribution, and reuse, provided that the author and preprint are cited in any reuse.


