
Submitted:
15 November 2025
Posted:
18 November 2025
You are already at the latest version
Abstract
The complex study of the influence of the H2SeO4 electrolyte temperature on the porous anodic aluminum oxide (AAO) composition and defects, morphological, luminescent properties is performed. The synthesis temperature increasing leads to decrease of AAO cell diameter from 85-115 nm to 38-58 nm (depending on the electrolyte concentration) and increases AAO walls etching that can even lead to AAO etching to individual fibers at 40°C. Selenium concentration in the samples formed in 0.5-1.5 M H2SeO4 at 5-40°C does not exceed 2 at.% and becomes undetectable at 40°C. It is established that the formation of the nanocrystalline phase Al2O3 in H2SeO4 electrolyte is observed at 40°C. The samples exhibit very weak photoluminescence. It was shown that in AAO formed in H2SeO4 there are 3 types of paramagnetic centers: F+ centers (NₛF=8.2·1015 g-1), newly discovered centers in which the unpaired electron belongs to an oxygen atom (NₛO=1017 g-1), and paramagnetic centers associated with selenate radicals (NₛS=6·1018 g-1). By comparison of the photoluminescence spectra and defect concentrations, it is assumed that the luminescent properties of AAO obtained in selenic acid are exclusively determined by F⁺ centers. The centers associated with other reaction products do not contribute to the AAO luminescent properties.
Keywords:
porous anodic aluminum oxide
; selenic acid
; paramagnetic centers
; F+ centers
; photoluminescence
1. Introduction
Porous anodic aluminum oxide (AAO) has become one of the widely used materials for nanostructure manufacturing, photonic crystals, optical and electrochemical sensors, drug delivery and biological nanocontainers, etc. due to its unique properties [1,2,3,4,5]. It is an unexpensive, chemically and thermo-stable material with high surface area. Its porous structure represents self-organized cylindrical pores, the thickness is proportional to the charge passed through the system and can be estimated easily, the pore diameter is relatively constant over the entire sample area of the oxide layer. Meanwhile pore and cell diameter can be easily varied from few nanometers up to a micron by choosing the technological parameters: electrolyte composition determines the range of pore and cell diameters that can be obtained, and anodization voltage or current density can be used for diameter tuning and changing within this range directly during AAO formation. Moreover, by controlling both oxide composition and morphology, it is possible to obtain either transparent, or colored, and also either luminescent, or almost nonluminescent AAO films [1,2,3,6].
Selenic acid is one of the promising electrolytes for AAO formation. Using this electrolyte, it is possible to rapidly produce highly ordered porous AAO both in potentiostatic [7] and galvanostatic [8] mode. The AAO structure with a very low porosity and pore diameter of several nm could be obtained, meanwhile the relatively big interpore distance afford pore widening up to the values closed to 100 nm [9,10,11].
Despite the fact that porous aluminum oxide synthesized in selenic acid solutions possesses promising properties, there is still lack of information about influence of the technological parameters of anodization process on them. Although the influence of the electrolyte concentration, current density, voltage, anodization duration and magnetic stirrer rotation rate on the morphology of the AAO fabricated in selenic acid were studied intensively [7,8,9,12,13], there is lack of information about the effect of the anodization temperature. As the anodization temperature determines the electrolyte chemical activity and, as a consequence, reaction rate that eventually impact the AAO composition and morphology.
Although most of the papers focus the attention on the AAO morphology, there are only few papers about the effect of technological parameters on the composition and other properties of AAO. In particular, in [7], the composition of a single AAO sample was investigated using the energy dispersive X-ray spectroscopy method (EDX). In [14], the same method established the influence of oxide formation voltage on its composition. In [11,15], the X-Ray photoelectron spectroscopy method (XPS) was used to thoroughly study the selenium content in Al2O3/NbO2 or Al2O3/ZrO2 composite samples, as well as in selenate doped Nb or Zr rods obtained by removing the AAO matrix. Possible reactions occurring in the electrolyte, that lead to the incorporation of selenium into the composites, are provided. However, no study has been conducted on the composition of pure oxide structures without Nb or Zr. The estimated concentration of selenium in porous structures varies significantly from paper to paper, ranging from 1% to 25% among different authors within similar AAO preparation regimes, indicating that the composition analysis should be provided accurately, taking into account the specific features of each method.
Both composition and morphology ultimately affect its optical properties, such as reflection and luminescent spectra that are also crucial for the AAO application in the mentioned fields. It is shown that AAO formed in 0.3-0.5 M selenic acid is transparent [4,7] and do not exhibit parasitic effects in their Raman spectra even after annealing, as it is the case for templates produced with other electrolytes [8,16,17]. This feature makes AAO a promising material as a transparent almost nonluminescent matrix. However, there is still no consensus on which defects control the optical properties of AAO (especially the luminescent properties), and whether it is possible to control the type and concentration of defects by the synthesis conditions varying.
Since the optical and electrical properties of porous aluminum oxide (AAO) to a significant extent are associated with paramagnetic vacancies and electrolyte inclusions [6,18,19,20], the most suitable method for studying AAO defects is electron paramagnetic resonance (EPR). The EPR spectroscopy is a highly informative method for detecting point defects with unpaired electrons (paramagnetic centers), allowing one to determine the type of defects, their concentration and local environment. Since defects with an unpaired electron actively interact with photons, such states can be responsible for photoluminescence. Thus, the EPR method is indispensable in establishing the nature of PL in AAO. To our knowledge, identification of defects in AAO synthesized in selenic acid by the EPR method, calculation of their concentrations and connection with luminescent characteristics are absent in the world literature. In addition, we have not found articles that determine the concentrations of defects in AAO synthesized in any other acids, which does not allow to draw unambiguous conclusions about the nature of luminescence, since at low concentrations of defects, luminescence is negligibly small, and at too high concentrations, nonradiative recombination on defects may begin to prevail. Meanwhile, such information is extremely necessary for the formation of optical sensors based on AAO with specified characteristics.
In this paper, the complex study of the selenic acid electrolyte temperature influence on the AAO morphology and chemical structure, including defects, is performed. To determine the nature of the defects in AAO and their concentration, studies were conducted using combination of luminescent and electron paramagnetic resonance spectroscopy.
1. Materials and Methods
1.1. Synthesis
Porous anodic alumina samples were formed on the 0.3 mm thick aluminum sheets 99.95% purity via anodization in 0.5 and 1.5 M selenic acid solutions. The surface of aluminum sheets was purified from dust and organic species prior the anodization process by immersion in acetone in the ultrasonic bath for 10 minutes. Then Al substrates were electropolished in the solution of perchloric acid and ethanol in composition of 1:6 at 40 V, 5 °C and washed in deionized water. The area exposed for the anodization was set 7 cm2 at one side of the Al sheet.
Prepared substrates were anodized using selenic acid with concentration 0.5-1.5 M. The electrolyte was mildly stirred to ensure the uniform heat distribution and to prevent bubbles and products aggregation on the surface of the samples. Pt grid with area 8 cm2 was used as counter electrode. Anodization was carried out in galvanostatic mode, current density was set 5-15 mA/cm2. The cell was attached to the thermostat Termex CRIO-VT-01. The temperature was varied in the range 5-40 °C. The technological regimes were chosen to cover a range of oxide formation conditions to produce both ordered and low-ordered structures [7,8,12], but excluding the hard anodization processes. Additionally, the anodizing regimes were selected to ensure the thick AAO layers formation preventing its destruction caused by either etching, or “burning” [21]. Porous anodic alumina samples were obtained via two-step anodization as this procedure is helpful to produce AAO with well-ordered porous structure [22]. First anodization step was carried out for 30 minutes. After that, samples were immersed in the preheated to 60 °C solution, containing dissolved 0.3 M CrO3 and 0.1 M H3PO4, to remove sacrificial oxide layer. Second anodization step was carried out either for 180 minutes for Electron paramagnetic resonance (EPR) investigation (a thick layer of AAO must be prepared for further separation from the aluminum substrate due to the peculiarities of EPR detection), and for 30 min for observation by the other methods (AAO was not removed from the substrate).
In order to compare the luminescent properties and defect characteristics, AAO samples were synthesized in oxalic acid using similar synthesis conditions (acid concentration: 0.45 M, current density: 15 mA/cm2, synthesis temperature: 5 °C).
2.2. Characterization
Morphology of the samples was examined by field-emission scanning electron microscope (SEM) Carl Zeiss SUPRA 40 FE-SEM (in-lens SE detector was used, aperture = 30 μm). The geometric parameters of the samples were estimated by Fiji software.
For the XPS analysis equipment, PHI 5000 Versa Probe II (ULVAC-PHI, Japan) equipped with GCIB source was used. The surface of the sample was etched by monoatomic Ar+ with 2 keV rastered over 2 × 2 mm2 area during 10 min. The source of X-ray was monochromatized Al Kα line (hν = 1486.6 eV, 50 W) probe with spot diameter 200 µm. A dual charge neutralization system was used. The chemical state of the elements was determined using high-resolution spectra (HR). The HR spectra of O1s, Al 2p and Se 3d were recorded at analyzer transmission energy of 23.5 eV with a step of 0.2 eV. The binding energy scale (Eb) was calibrated using Au4f – 83.96 eV and Cu2p3 – 932.62 eV. The Eb scale was corrected using the Eb spectrum of Al 2p in Al2O3 – 74.2 eV.
Additionally, elemental analysis was performed using a wavelength-dispersive X-ray fluorescence (WDXRF) spectrometer, ZSX Rigaku Primus IV (Japan). The Se element was measured using a scintillation detector and a LiF200 diffraction crystal. The experiment was performed at 50 kV and 60 mA. The diaphragm diameter was 10 mm.
XRD analysis was performed with a Rigaku MiniFlex 600 ( Rigaku Corporation, Tokyo, Japan) with a Cu Kα radiation source (λ = 1.54 Å). Data were collected with steps of 0.01° (2θ) with the Bragg angle 2θ ranging from 5° to 90°.
Photoluminescence (PL) spectra were recorded using a FL 8500 Fluorescence spectrometers (USA) in the spectral range from 250 to 900 nm.
Electron paramagnetic resonance (EPR) studies were performed using an EPR spectrometer ELEXSYS-E500-10/12. The concentration of paramagnetic centers was estimated using a CuCl2·2H2O standard with a known number of spin centers.
1. Results and Discussion
1.1. Morphology
An analysis of the anodizing temperature influence on the geometric parameters of porous AAO formed using H2SeO4 electrolyte was carried out. Figure 1 shows surface images of AAO obtained at various oxide formation temperatures.
The sample formed at a current density of 5 mA/cm2 in 0.5 M H2SeO4 at 5 °C represents porous layer in hexagonal order. It strives to the structure where one porous cell contains one large pore (Figure 1a). Moreover, it is clearly seen that the cell consists of 2 layers: the brighter inner layer and darker out layer. Such structure corresponds to the descriptions of a double-layer porous cells reported in [23,24,25], where it was noted that the inner layer has a compact, low-defect structure, while the outer layer is spongy, and it contains embedded electrolyte ions.
The raising of the anodization temperature to 25 °C results in the disordering of the porous structure, with the formation of multiple small-diameter pores within a single porous cell (Figure 1b). Additionally, the diameter of the porous cell decreases (a trend similar to that observed with a reduction in current density [2]). The double-layer structure is maintained. With a further increase in temperature, the porous cell diameter continues to decrease, while the pore diameter increases due to the higher etching rate of the pore walls. Consequently, the thickness of the outer layer reduces significantly (Figure 1c).
The same trends, but more pronounced, are observed for the anodization temperature increasing in more concentrated electrolytes, such as 1.5 M H2SeO4 (Figure 2). It is worth noting that with increasing concentration, the current density 3 times higher was set, as it is well known that current density increasing leads to the oxide growth rate increase and contributes to maintain a sufficient value of mechanical stress in the films, which leads to the formation of an ordered porous structure [8,21]. As a result, the ordered nanostructures have been formed under the technological parameters: 15 mA/cm2, 1.5 M H2SeO4 at 5 °C (Figure 2a). The increase of the temperature to the 25 °C has led to the disordering of the porous structure, with the formation of numerous small-diameter pores (Figure 2b). Also, the cell diameter has decreased significantly (from 84 ± 7 nm to 52 ± 5 nm). Upon raising the temperature to 40 °C (Figure 2c and 3a), destructive etching of the pore walls occurs in the upper part of the oxide (Figure 2c). Consequently, the oxide has been divided into an upper layer (individual filament-like fibers, Figure 2c and Figure 3a) and a porous layer (cylindrical pores, Figure 3b). The further cell diameter decreasing is observed, the outer layer becomes visually undistinguishable (Figure 3).
The results of the morphology investigation of AAO samples formed under various technological parameters in H2SeO4 solutions are presented in Table 1.
Based on scanning electron microscopy (SEM) results, it was established that the porosity of oxide matrices obtained in 0.5 M H2SeO4 varies from 1.5% (for the samples formed at 5 °C) to 16.5% (for the samples formed at 40 °C). An increase in the electrolyte concentration significantly enhances the chemical etching of pore walls. The porosity varies from 1.7% to unmeasurable values, as the porous structure in the upper part of the oxide is completely etched away, causing oxide disintegration into fibers.
Since the trends observed with the electrolyte temperature increasing were the same for samples obtained both at electrolyte concentrations of 0.5 M and 1.5 M, but its variation was stronger for the samples obtained in 1.5 M H2SeO4, the further results are presented only for the samples formed in 1.5 M H2SeO4.
1.1. Chemical and Crystal Structure
To determine the elemental composition and chemical bonds, an investigation was conducted using the XPS method. Typical XPS spectra of AAO formed in selenic acid solution is presented in Figure 4.
The spectra of the samples formed at different temperature do not vary significantly, although the intensity of the peaks related to Se slightly decreases with the anodization temperature increasing. Atomic concentrations were determined by the method of relative elemental sensitivity factors from the survey spectrum, using the integrated intensities of the following lines: C 1s, O 1s, Al 2p and Se 3d. These results are shown in Table 2.
According to XPS data, Se content is higher on the surface of the samples. Thus, the presence of selenium is partially caused by its adsorption from the electrolyte on the AAO surface and its incomplete removal during washing. It can be noted, that Se may exist both in the form of selenates and in the form of elemental selenium, as during the anodic oxidation, the selenic acid partially disproportionates into selenide anions and even Se0 species [7,15]. Se content decreases with anodization temperature from 2 at.% to less than 1 at.%.
Since the obtained selenium concentration values are close to the detection limit, especially for the sample formed at 40 °C, additional WDXRF investigation was performed to determine the ratio of selenium in films obtained at different synthesis temperatures (Figure 5). WDXRF studies showed a distinct selenium peak at 2θ = 31.87 degrees. The WDXRF results are consistent with the XPS data: as the electrolyte temperature increases, the intensity of selenium peak decreases. The intensity of Se peaks in the samples formed at 5 °C is 2.6 and 7.5 times higher than intensity of AAO formed at 25 °C and 40 °C, respectively.
To our knowledge, studies of AAO composition for the samples, fabricated at different synthesis temperatures, have not been conducted by other researchers yet. However, we can compare our results for 5 °C sample with similar samples. Results of our XPS and WDXRF (1-2%) analyses are equal to the values obtained by Kamnev et al. for Al2O3/ZrO2 and Al2O3/NbO2 composites although these objects are different: composites are formed by interaction of growing ZrO2 or NbO2 nanocolumns with the narrow outer part of AAO, which is more contaminated by Se [11,15]. Se content for AAO, obtained in 0.3 M H2SeO4 at 5 °C is 1.6 at.% overall (EDX), that correlates with our data, without taking into account the difference in Se content on the surface and in depth of the AAO, demonstrated in our investigation. Nevertheless, Se content in AAO formed at 0 °C determined by EDX in [14] varied depending on the anodization voltage from 9 to 25 at.%, which is sufficiently higher. Most likely, this difference is caused by lower temperature of AAO synthesis (and it correlates with our data that Se concentration is higher at lower temperatures) and anodization in “hard anodization” regimes. It is also important to keep in mind that since the K and L X-ray emission lines of Al and Se are estimated in the same energy range (~1.4 kV), this significantly complicates the task of correctly identifying these overlapping peaks [26].
Figure 6 shows the diffraction patterns of samples prepared at different electrolyte temperatures. All peaks detected in the spectra for anodization temperatures of 5 °C and 25 °C relate to the aluminum substrate and correspond to JCPDS Card No.04-0787. Porous AAO samples are amorphous. Interestingly, when the temperature increases to 40 ℃, two peaks appear at 6.41, 19.36 degrees, which could be attributed to γ-Al2O3 JCPDS Card No.29-0063 that may indicate the beginning of crystallization of the aluminum oxide film. The effect is reproduced on both similar substrates and substrates of different thicknesses and grades. This effect for AAO samples synthesized in H2SeO4 is discovered for the first time.
Previously, researchers noted that porous aluminum oxide, predominantly an anion-free oxide layer, can be crystallized by electron beam irradiation of the sample, for example, during its examination in the scanning electron microscope. And although the presence of crystalline alumina in coatings was not proved for porous alumina films formed in phosphoric, oxalic and sulfuric acids, it was found that anodizing in mixture of sulfuric and chromic acid can result in amorphous alumina with traces of γ-Al2O3 [27]. Such features of the crystalline structure were observed for samples synthesized at 20 °С; therefore, the emergence of a crystalline phase in samples obtained in electrolytes heated up to 40 °C is also possible.
1.1. Luminescent Properties and Paramagnetic Centers
Figure 7 shows the photoluminescence spectra of porous AAO samples formed at 5-40 °C in 1.5 M H2SeO4. The samples exhibit weak luminescence at the noise level, without pronounced peaks or photoluminescence (PL) bands. Changes in the anodization temperature do not lead to crucial changes in the PL spectra of the samples.
The EPR spectra for the samples prepared at different temperatures are presented in the Figure 8. It can be noted, that all EPR spectra have a complex shape due to the presence of several different signals, indicating several types of paramagnetic centers. All samples exhibit lines with gI = 2.0024±0.0005. This signal has been repeatedly observed previously in the EPR spectra of AAO obtained in different electrolytes and it is attributed to oxygen vacancies with the unpaired electrons (F+-centers) in aluminum oxide [18,19,20,28].
The line, associated with F+ centers, overlaps with the EPR signal of anisotropic shape with gII1 = 2.0322±0.0005, gII2 = 2.0081±0.0005. Such a g-factor values suggest that the electron belongs to an oxygen atom in configuration similar to O−, and such paramagnetic centers were detected previously in the structure of different metal oxides [29]. Thus, it is assumed that this EPR signal is related to an oxygen radical that has one unpaired bond, while the second bond pairs it with another atom. Since the EPR signal is observed only in samples formed in selenic acid and it is not detected for AAO synthesized in other electrolytes, it can be assumed that the oxygen is bonded to a selenium atom (>Al-Se-O*). Moreover, since the EPR signal persists even after additional etching, washing, and complete drying, and disappears only upon almost complete etching of the porous structure walls, it can be concluded that it corresponds to ions embedded in the oxide rather than residual electrolyte. As this radical is not characteristic for samples formed in sulfuric acid (the electrolyte with the structure similar to selenic acid, but it does not decompose to sulfides), it can be hypothesized that it may be a decomposition product of selenic acid (to selenides). A third type of EPR signal with gIII=2.0735±0.0005 is also identified. This EPR signal is detected in AAO samples prepared at anodizing temperatures starting from 10 °C, and it reaches its maximum intensity in samples anodized at 25 °C. The signal is similar to the signal detected in oxides formed in sulfuric acid, associated with sulfate complexes [30]. Since the molecules of sulfuric and selenic acids have similar structures, and, in addition, similar g-factor values are observed for the SeO4− radicals in Na2SeO4 samples [31], we believe that the EPR signal with such a g-value is associated with a selenate-like radical with an oxygen atom containing an unpaired electron.
The intensity of EPR signal, attributed to F+ centers, decreases with anodization temperature increasing. The maximum concentration of F+-centers is NₛF=8.2·1015 g-1 in AAO samples, obtained at 5 °C. The highest concentration of paramagnetic centers with gII=2.0322 (associated with >Al-Se-O*centers) is calculated as NₛO=1017 g-1 for samples formed at low temperatures (5–10 °C), and the signal decreases with the anodization temperature increasing. The intensity of the signal with gIII=2.0735±0.0005 increases with the anodization temperature increasing up to 25 °C. At this anodization temperature, the EPR intensity increases sharply, and the concentration of paramagnetic centers reaches the value NₛS=6·1018 g-1. For samples synthesized at 40 °C, the intensities of all EPR signals and, accordingly, the defect concentrations decrease sharply (Figure 8).
It is also worth mentioned that since the PL of the samples has an extremely weak intensity, which does not change significantly with a change in the synthesis temperature in the range of 5-40 °C (Figure 7), this indicates that various oxygen related radicals (defects with gII=2.0322 and gIII=2.0735) are not PL centers. Oxygen vacancies (F+-centers) are reported to determine PL in porous alumina [18,19,20,28]. However, in our samples F+-centers concentration is rather low (does not exceed significantly 1016 g-1), which can explain low PL intensity (Figure 7). To test this hypothesis, we synthesized AAO samples in oxalic acid for comparison, since such structures are known to have intense PL [18,19,26]. Indeed, the obtained AAO samples formed in C2H2O4 have intense PL (Figure 7). These samples were also investigated by the EPR method. The oxygen vacancies are detected (Figure 8), and its concentration (NsF=2·1017 g-1) is an order of magnitude higher than the concentration of vacancies in the samples obtained in selenic acid. At the same time, an increase in the concentration of oxygen-containing radicals up to 6·1018 g-1 in samples formed in H2SeO4 does not affect the PL spectra. Thus, the PL intensity correlates with the concentration of F+ centers and its intensity can be controlled by the electrolyte variation.
To explain the behavior of paramagnetic centers observed for samples formed at different anodization temperatures, schematic representation of the AAO cell structure showing different paramagnetic centers location is given in Figure 9.
As it was mentioned in section 3.1 «Morphology», the synthesis temperature increasing leads to the etching of oxide walls. This, eventually, leads to decrease in the proportion of the anion-incorporated outer layer of the AAO compared to its total volume. The concentration of oxide defects with signals gI and gII gradually decreases with the reduction of the outer layer thickness, both as a result of the synthesis temperature increase from 5° to 40° and due to the thinning of the outer layer during additional post-etching of the sample. This indicates that the gI and gII defects are located in the outer layer of the oxide and they are uniformly distributed throughout it.
The most challenging is to understand the gIII EPR signal. Its intensity begins to increase with AAO synthesis temperature rising, but only up to 25 °C. XPS and WDXRF compositional analysis methods do not reveal a significant increase in the concentration of Se in a different valence state compared to the sample synthesized at 5 °C. However, the samples used for these methods are significantly thinner. It is possible that the signal is associated with precipitates in the thin surface layer of the AAO (Figure 9b). At lower temperatures, the chemical activity of the electrolyte is lower, and the pore size is larger, which may result in fewer adsorbed particles on the oxide wall surfaces. As the temperature increases, the activity of the electrolyte rises, and the pores become narrow, that could lead to more active species precipitation. In samples with a thickness of several micrometers, the oxide is rinsed more effectively compared to the samples with thicknesses of tens of micrometers. Therefore, XPS and WDXRF do not detect any substantial changes in composition that could explain the emergence and increase of the gIII signal. However, in thicker samples, the precipitates remain and are detected by EPR, which, among other things, is the most sensitive method for detecting changes in sample composition.
The decrease of concentration of all types of centers at 40 °C can be explained by the significant etching of the porous structure walls, which removes the defective layer containing both embedded ions, other species, and vacancies. As a result, a more perfect, near-crystalline layer of aluminum oxide remains at the samples, which is confirmed by XRD results. The total concentration of defects in this layer tends to zero (Figure 9c).
Conclusions
Based on a comprehensive study of AAO films formed in selenic acid at different anodizing temperatures, we can draw a number of important conclusions from both fundamental and practical points of view. It has been established that with an increase of the synthesis temperature, the diameter of the AAO cells decreases. Meanwhile AAO walls etching increases, causing pore diameter increasing, and even leading to etching of AAO formed in 1.5 M H2SeO4 to individual fibers at 40 °C. The concentration of selenium in the samples does not exceed 2 at.%. When the temperature increases to 40 ℃, two peaks appear in the XRD spectrum at 6.41, 19.36 degrees, which may indicate the beginning of crystallization of the aluminum oxide. The samples exhibit very weak luminescence without pronounced PL bands. In AAO formed in a selenic acid electrolyte, different paramagnetic centers were discovered: F+ centers; for the first time ˗ centers in which the electron belongs to an oxygen atom in configuration similar to O− centers (>Al-Se-O*), and paramagnetic defects structurally similar to selenates (gIII=2.0735±0.0005). Using test experiments with AAO samples synthesized in oxalic acid, it was established that of all the defects found in AAO synthesized in selenic acid, only F+ centers are responsible for luminescence. With an increase of the electrolyte temperature, the selenium content, luminescence intensity, concentration of F+ centers and (>Al-Se-O*)-centers decrease. Concentration of all types of centers decreases drastically at 40 °C. These tendencies can be explained by the significant etching of the porous structure walls, which removes the defective outer layer containing both embedded impurities from the electrolyte and oxygen vacancies. As a result, only inner alumina layer, with anion-free near-crystalline structure remains, which is confirmed by XRD results. A geometric model is proposed that explains the results obtained in the set of AAO samples synthesized at different temperatures. The obtained results are new and original and can be purposefully used for the manufacturing of AAO with specified optical properties.
Author Contributions
Conceptualization, V.Z., E.A.K. and Y.N.; Methodology, Y.N., A.D. and D.B.; Validation, T.S. and A.M.; Formal Analysis, E.V.K., T.S. and Y.N.; Investigation, Y.N., I.T., D.D., V.Z., E.V.K. and E.A.K.; Resources, Visualization, D.B.; Writing – Original Draft Preparation, Y.N. and D.D.; Writing – Review & Editing, E.A.K., A.M. and A.D., Supervision, V.Z.; Project Administration, E.A.K.
Funding
The study was supported by the Russian Science Foundation grant No. 24-19-00402, https://rscf.ru/en/project/24-19-00402/.
Acknowledgments
For SEM measurements, equipment from the Educational and Methodological Center for Lithography and Microscopy of Moscow State University was utilized. Composition and structure investigations were performed using the facilities of the Advanced Processes Lab (Scientific-Manufacturing Complex “Technological Centre”). EPR measurements were performed using the facilities of the Collective Use Center at the Moscow State University.
Conflicts of Interest
Authors declare no conflict of interest.
References
- Santos, A.; Kumeria, T.; Losic, D. Nanoporous anodic aluminum oxide for chemical sensing and biosensors. Trends Anal. Chem. 2013, 44, 25–38. [Google Scholar] [CrossRef]
- Abd-Elnaiem, A.M.; Mohamed, Z.A.; Soliman, S.El.; Almokhtar, M. Synthesis, characterization, and optical sensing of hydrophilic anodic alumina films. Opt. Mater. (Amst.) 2024, 157, 116390. [Google Scholar] [CrossRef]
- Sadykov, A.I.; Kushnir, S.E.; Roslyakov, I.V.; Baranchikov, A.E.; Napolskii, K.S. Selenic Acid Anodizing of Aluminium for Preparation of 1D Photonic Crystals. Electrochem. Commun. 2019, 100, 104–107. [Google Scholar] [CrossRef]
- Zhao, X.; Meng, G.; Han, F.; Li, X.; Chen, B.; Xu, Q.; Zhu, X.; Chu, Z.; Kong, M.; Huang, Q. Nanocontainers made of various materials with tunable shape and size. Sci. Rep. 2013, 3, 2238. [Google Scholar] [CrossRef] [PubMed]
- Sacco, L.N.; Vollebregt, S. Overview of Engineering Carbon Nanomaterials Such As Carbon Nanotubes (CNTs), Carbon Nanofibers (CNFs), Graphene and Nanodiamonds and Other Carbon Allotropes inside Porous Anodic Alumina (PAA). Nanomaterials 2023, 13, 1–58. [Google Scholar] [CrossRef]
- Brzózka, A.; Brudzisz, A.; Hnida, K.; Sulka, G.D. Chemical and Structural Modifications of Nanoporous Alumina and Its Optical Properties. In Electrochemically Engineered Nanoporous Materials, 1st ed.; Losic, D., Santos, A., Eds.; Springer International Publishing: Switzerland, 2015. [Google Scholar] [CrossRef]
- Nishinaga, O.; Kikuchi, T.; Natsui, S.; Suzuki, R.O. Rapid fabrication of self-ordered porous alumina with 10-/sub-10-nm-scale nanostructures by selenic acid anodizing. Sci. Rep. 2013, 3, 2748–1. [Google Scholar] [CrossRef]
- Nazarkina, Y.; Gavrilov, S.; Terryn, H.; Petrova, M.; Ustarroz, J. Investigation of the Ordering of Porous Anodic Alumina Formed by Anodization of Aluminum in Selenic Acid. J. Electrochem. Soc. 2015, 162, E166–E172. [Google Scholar] [CrossRef]
- Nazarkina, Y.; Kamnev, K.; Dronov, A.; Dudin, A.; Pavlov, A.; Gavrilov, S. Features of Porous Anodic Alumina Growth in Galvanostatic Regime in Selenic Acid Based Electrolyte. Electrochim. Acta 2017, 231, 13–19. [Google Scholar] [CrossRef]
- Ahmadzadeh, M.; Kashi, M.A.; Noormohammadi, M.; Ramazani, A. Small-diameter magnetic and metallic nanowire arrays grown in anodic porous alumina templates anodized in selenic acid. Appl. Phys. A Mater. Sci. Process. 2021, 127, 1–12. [Google Scholar] [CrossRef]
- Kamnev, K.; Bendova, M.; Fohlerova, Z.; Fialova, T.; Martyniuk, O.; Prasek, J.; Cihalova, K.; Mozalev, A. Arrays of ultra-thin selenium-doped zirconium-anodic-oxide nanorods as potential antibacterial coatings. Mater. Chem. Front. 2025, 9, 866–883. [Google Scholar] [CrossRef]
- Gordeeva, E.O.; Roslyakov, I.V.; Napolskii, K.S. Aluminium anodizing in selenic acid: electrochemical behaviour, porous structure, and ordering regimes. Electrochim. Acta 2019, 307, 13–19. [Google Scholar] [CrossRef]
- Akiya, S.; Kikuchi, T.; Natsui, S.; Suzuki, R.O. Optimum Exploration for the Self-Ordering of Anodic Porous Alumina Formed via Selenic Acid Anodizing. J. Electrochem. Soc. 2015, 162, E244–E250. [Google Scholar] [CrossRef]
- Sadykov, A.I.; Leontev, A.P.; Kushnir, S.E.; Napolskii, K.S. Kinetics of the Formation and Dissolution of Anodic Aluminum Oxide in Electrolytes Based on Sulfuric and Selenic Acids. Russ. J. Inorg. Chem. 2021, 66, 258–265. [Google Scholar] [CrossRef]
- Kamnev, K.; et al. Se-doped Nb2O5–Al2O3 composite-ceramic nanoarrays via the anodizing of Al/Nb bilayer in selenic acid. Ceram. Int. 2023, 49, 34712–34725. [Google Scholar] [CrossRef]
- Nazarkina, Y.; Kamnev, K.; Polokhin, A. The Effect of Annealing on the Raman Spectra of Porous Anodic Alumina Films Formed in Different Electrolytes. In Proceedings of the 2017 IEEE Russia Section Young Researchers in Electrical and Electronic Engineering Conference, ElConRus 2017, St. Petersburg, Russia, 31 January–2 February 2017; IEEE: Piscataway, NJ, USA, 2017; pp. 1409–1412. [Google Scholar]
- Nazarkina, Y.; Gavrilov, S.A.; Polohin, A.A.; Gromov, D.; Shaman, Y.P. Application of porous alumina formed in selenic acid solution for nanostructures investigation via Raman spectroscopy. Proc. SPIE Int. Soc. Opt. Eng. 2016, 10224, 102240J. [Google Scholar] [CrossRef]
- Huang, G.S.; Wu, X.L.; Mei, Y.F.; Shao, X.F.; Siu, G.G. Strong blue emission from anodic alumina membranes with ordered nanopore array. J. Appl. Phys. 2003, 93, 582–585. [Google Scholar] [CrossRef]
- Chen, J.H.; Huang, C.P.; Chao, C.G.; Chen, T.M. The investigation of photoluminescence centers in porous alumina membranes. Appl. Phys. A 2006, 84, 297–300. [Google Scholar] [CrossRef]
- Staninski, K.; Kaczmarek, M. Afterglow luminescence phenomena in the porous anodic alumina. Opt. Mater. (Amst.) 2021, 121, 111615. [Google Scholar] [CrossRef]
- Ono, S.; Saito, M.; Ishiguro, M.; Asoh, H. Controlling Factor of Self-Ordering of Anodic Porous Alumina. J. Electrochem. Soc. 2004, 151, B473. [Google Scholar] [CrossRef]
- Masuda, H.; Hasegwa, F.; Ono, S. Self-Ordering of Cell Arrangement of Anodic Porous Alumina Formed in Sulfuric Acid Solution. J. Electrochem. Soc. 1997, 144, L127. [Google Scholar] [CrossRef]
- Thompson, G.E.; Furneaux, R.C.; Wood, G.C. Nucleation and growth of porous anodic films on Aluminium. Nature 1978, 272, 433–435. [Google Scholar] [CrossRef]
- Le Coz, F.; Arurault, L.; Datas, L. Chemical analysis of a single basic cell of porous anodic aluminium oxide templates. Mater. Charact. 2010, 61, 283–288. [Google Scholar] [CrossRef]
- Chang, Y.; Ling, Z.; Liu, Y.; Hu, X.; Li, Y. A simple method for fabrication of highly ordered porous α-alumina ceramic membranes. J. Mater. Chem. 2012, 22, 7445–7448. [Google Scholar] [CrossRef]
- MyScope Training. Available online: https://www.myscope.training (accessed on 13 November 2025).
- Parkhutik, V.P.; Belov, V.T.; Chernyckh, M.A. Study of aluminium anodization in sulphuric and chromic acid solutions—II. Oxide morphology and structure. Electrochim. Acta 1990, 35, 961–966. [Google Scholar] [CrossRef]
- Khan, G.G.; Singh, A.K.; Mandal, K. Structure dependent photoluminescence of nanoporous amorphous anodic aluminium oxide membranes: Role of F+ center defects. J. Lumin. 2013, 134, 772–777. [Google Scholar] [CrossRef]
- Kokorin, A.I. Electron Spin Resonance of Nanostructured Oxide. In Semiconductors: Chemical Physics of Nanostructured Semiconductors; Kokorin, A.I., Bahnemann, D.W., Eds.; VSP Publishing: Utrecht, The Netherlands, 2003. [Google Scholar]
- Kytina, E.V.; Konstantinova, E.A.; Pavlikov, A.V.; Nazarkina, Y.V. Effect of Synthesis Parameters on Photoluminescence of Dyes in Pores of Anodic Aluminum Oxide. Russ. J. Phys. Chem. B 2025, 19, 1082–1088. [Google Scholar] [CrossRef]
- Atkins, P.W.; Symons, M.C.R. The Structure of Inorganic Radicals: An Application of Electron Spin Resonance to the Study of Molecular Structure; Elsevier Publishing Company: Amsterdam, The Netherlands, 1967; p. 280. [Google Scholar]
Figure 1.
SEM images of porous anodic alumina formed in 0.5 M H2SeO4 at a current density of 5 mA/cm2 at temperatures: a) 5 °C, b) 25 °C, c) 40 °C.
Figure 1.
SEM images of porous anodic alumina formed in 0.5 M H2SeO4 at a current density of 5 mA/cm2 at temperatures: a) 5 °C, b) 25 °C, c) 40 °C.
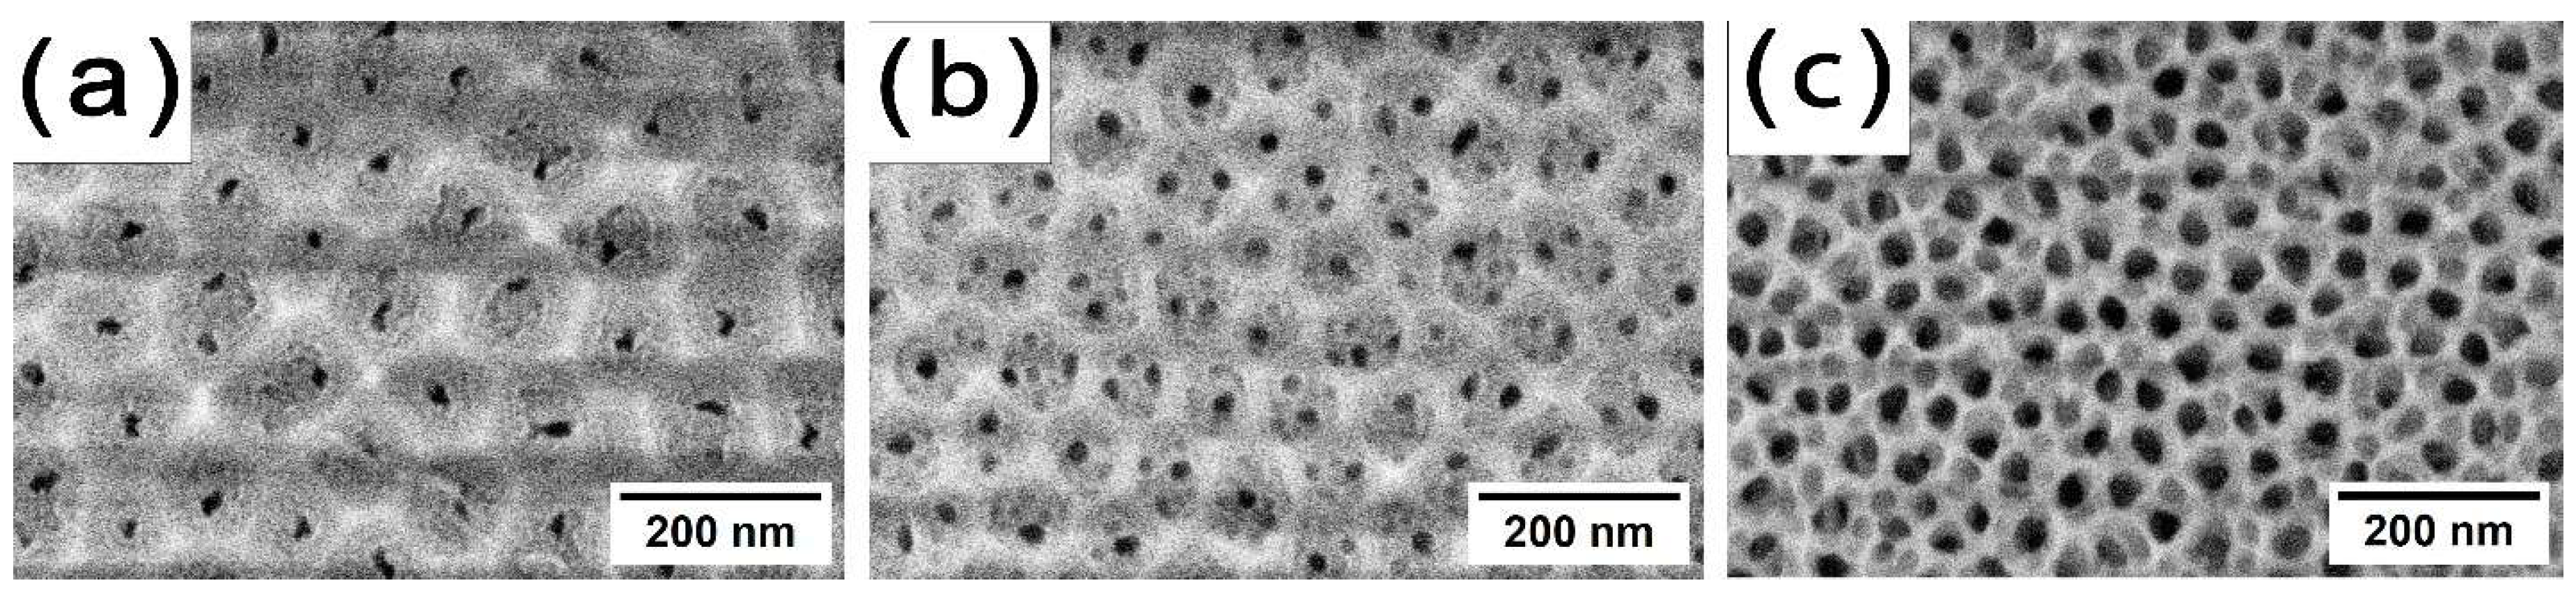
Figure 2.
SEM images of porous anodic alumina formed in 1.5 M H2SeO4 at a current density of 15 mA/cm2 at temperatures: a) 5 °C, b) 25 °C, c) 40 °C.
Figure 2.
SEM images of porous anodic alumina formed in 1.5 M H2SeO4 at a current density of 15 mA/cm2 at temperatures: a) 5 °C, b) 25 °C, c) 40 °C.
Figure 3.
Side view of a porous anodic alumina formed in 1.5 M H2SeO4 at a current density of 15 mA/cm2 at 40 °C: a) the upper part, b) the inner part of the oxide.
Figure 3.
Side view of a porous anodic alumina formed in 1.5 M H2SeO4 at a current density of 15 mA/cm2 at 40 °C: a) the upper part, b) the inner part of the oxide.
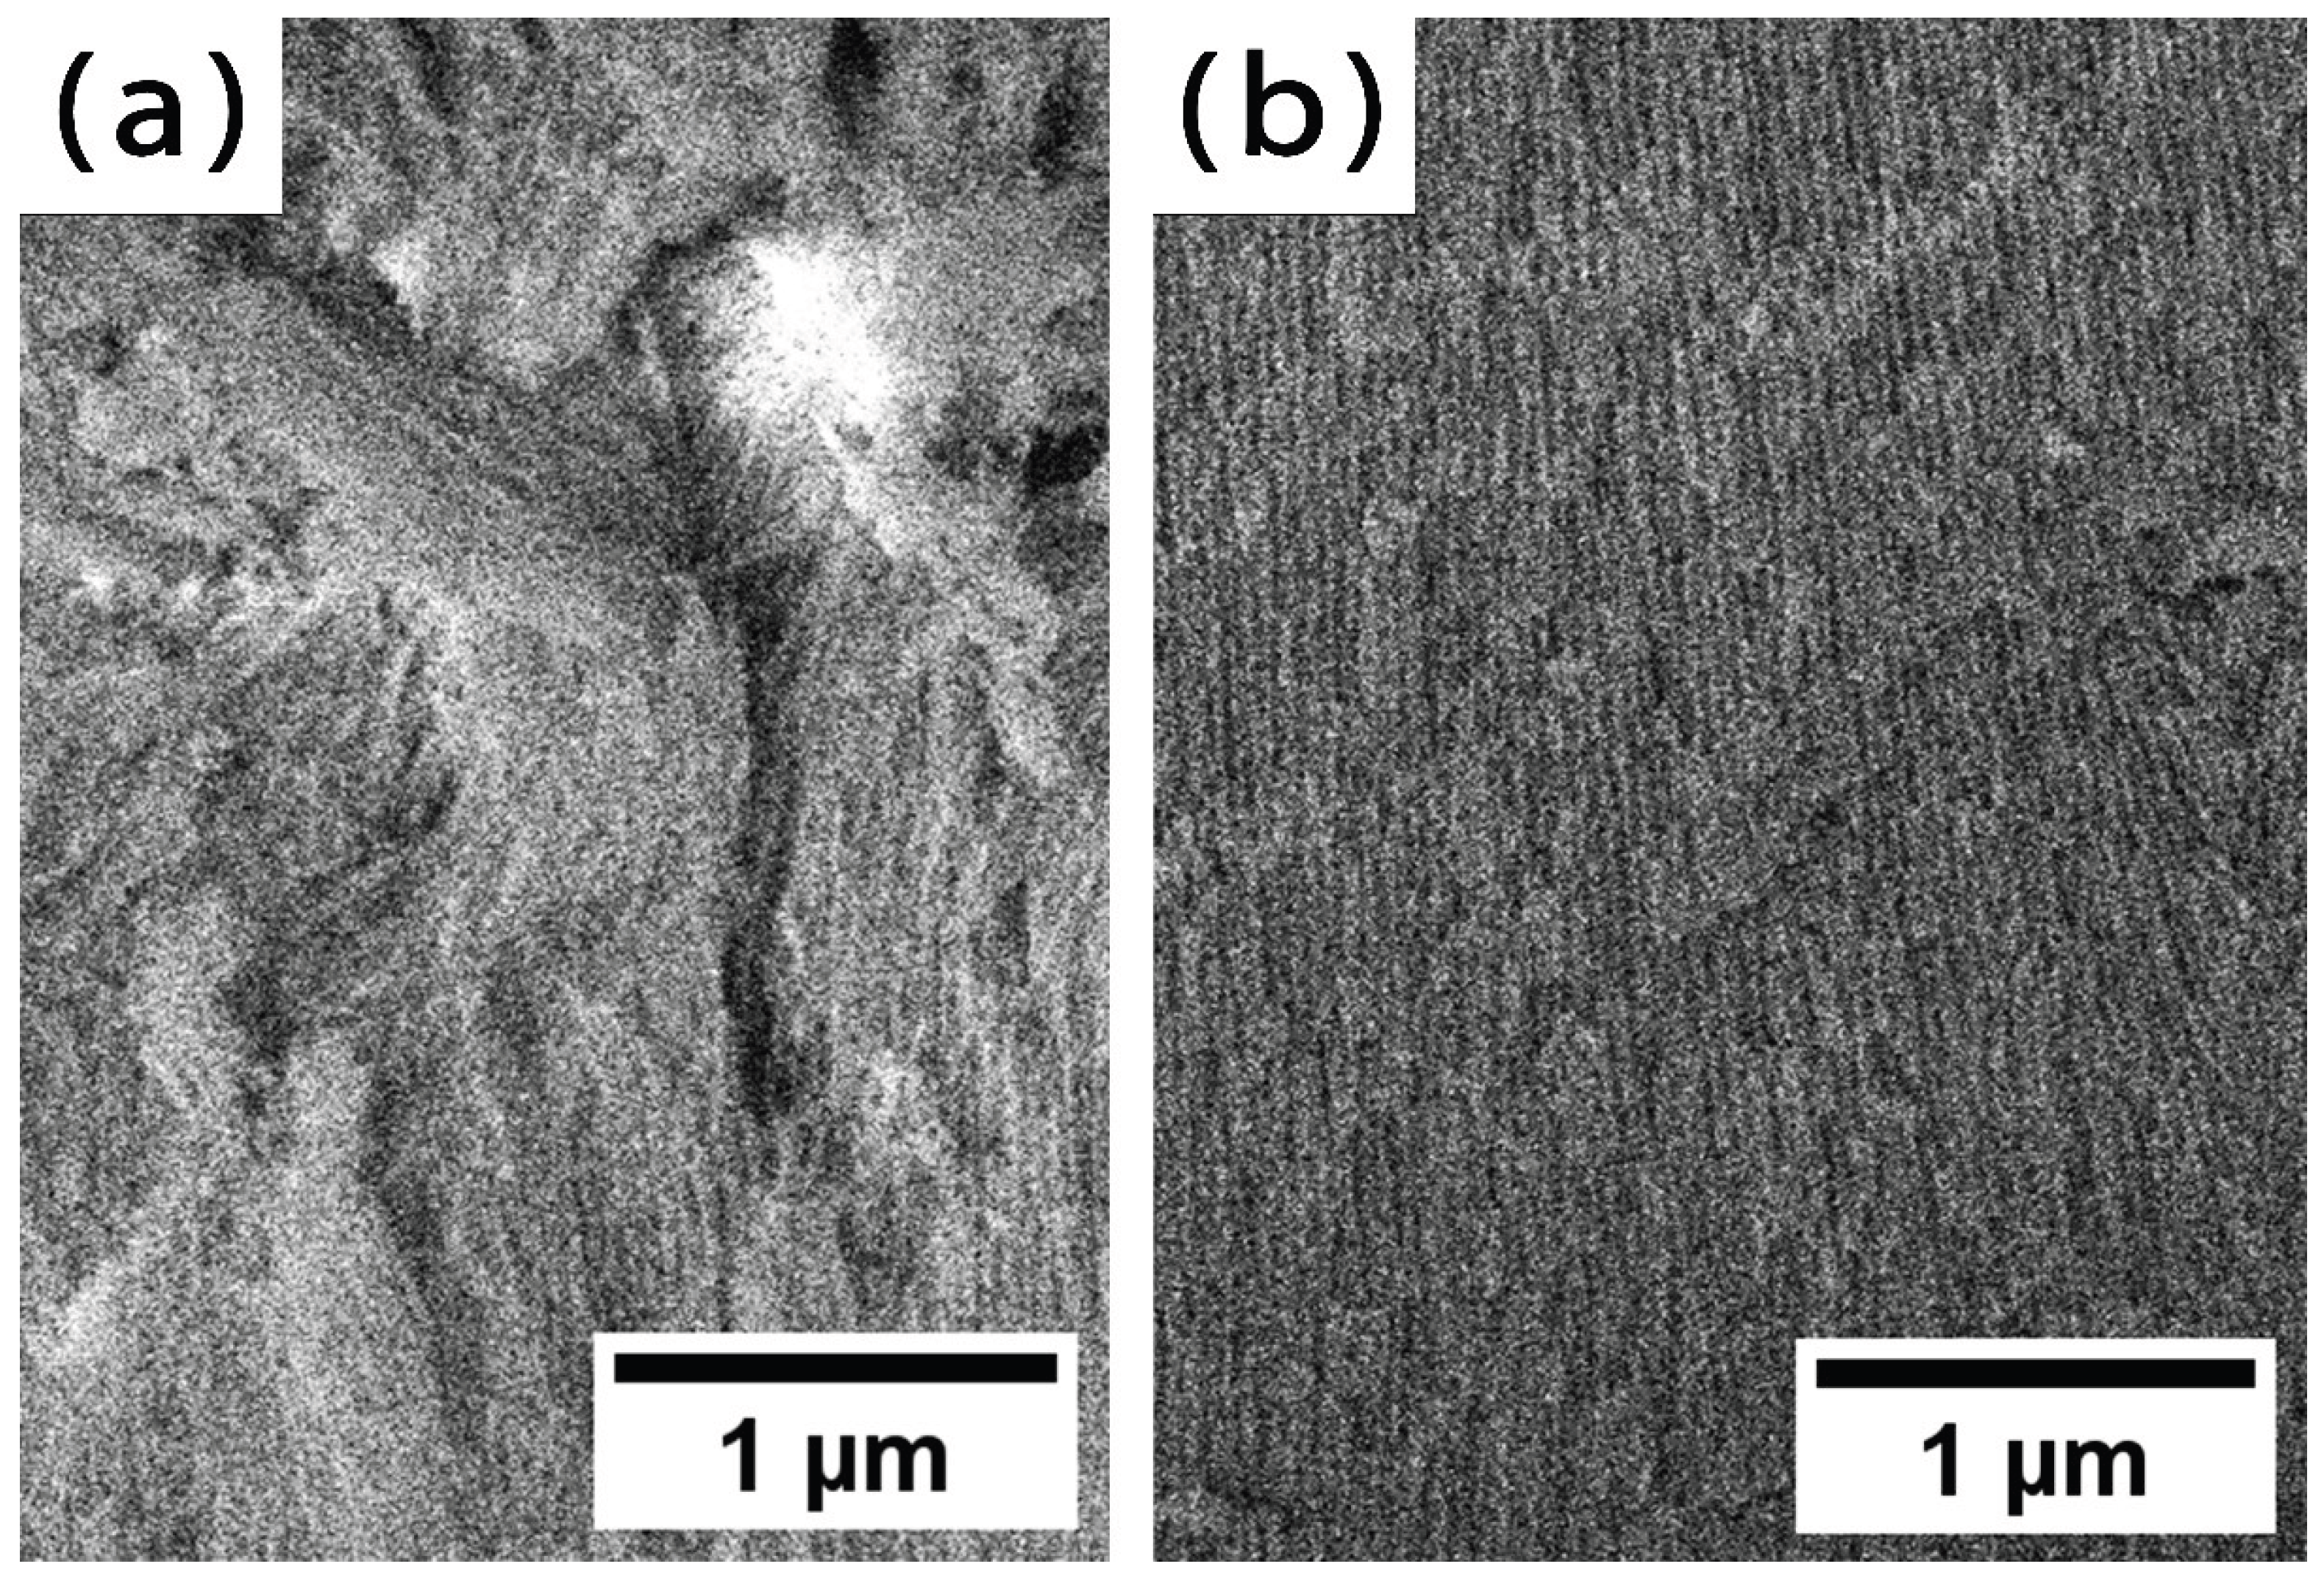
Figure 4.
XPS spectra of porous anodic alumina formed in 1.5 M H2SeO4 at a current density of 15 mA/cm2 at 5 °C: a) before and b) after ion beam etching.
Figure 4.
XPS spectra of porous anodic alumina formed in 1.5 M H2SeO4 at a current density of 15 mA/cm2 at 5 °C: a) before and b) after ion beam etching.
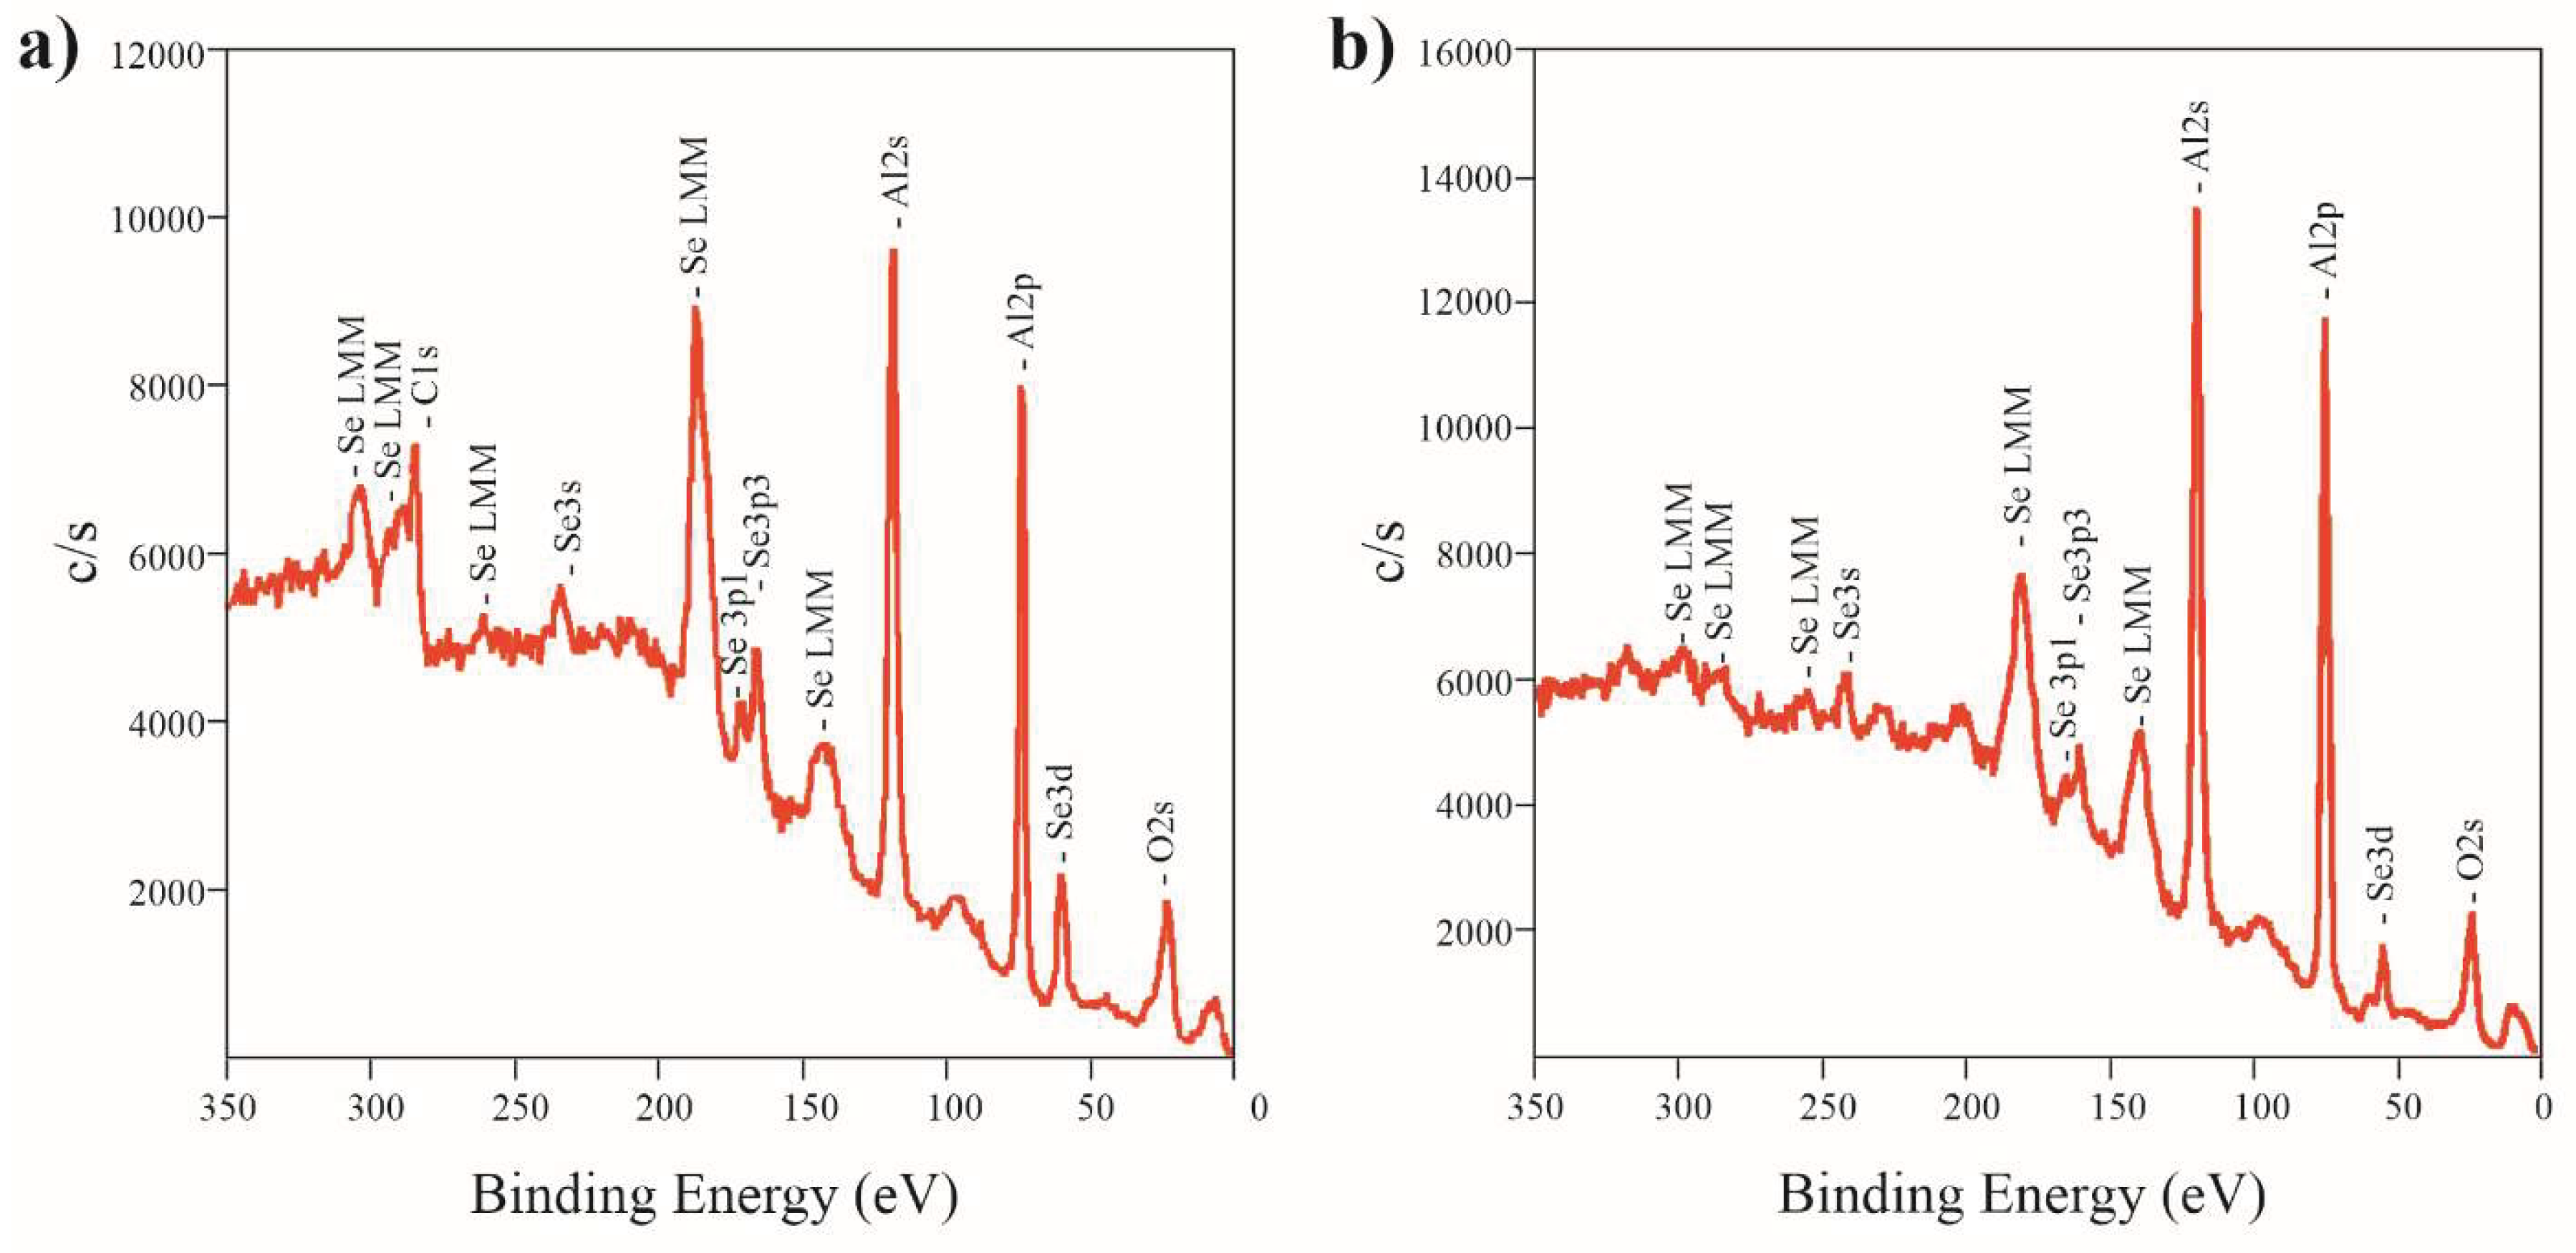
Figure 5.
WDXRF spectra of anodic alumina prepared in 1.5 M H2SeO4 at a current density of 15 mA/cm2 at different anodization temperatures.
Figure 5.
WDXRF spectra of anodic alumina prepared in 1.5 M H2SeO4 at a current density of 15 mA/cm2 at different anodization temperatures.
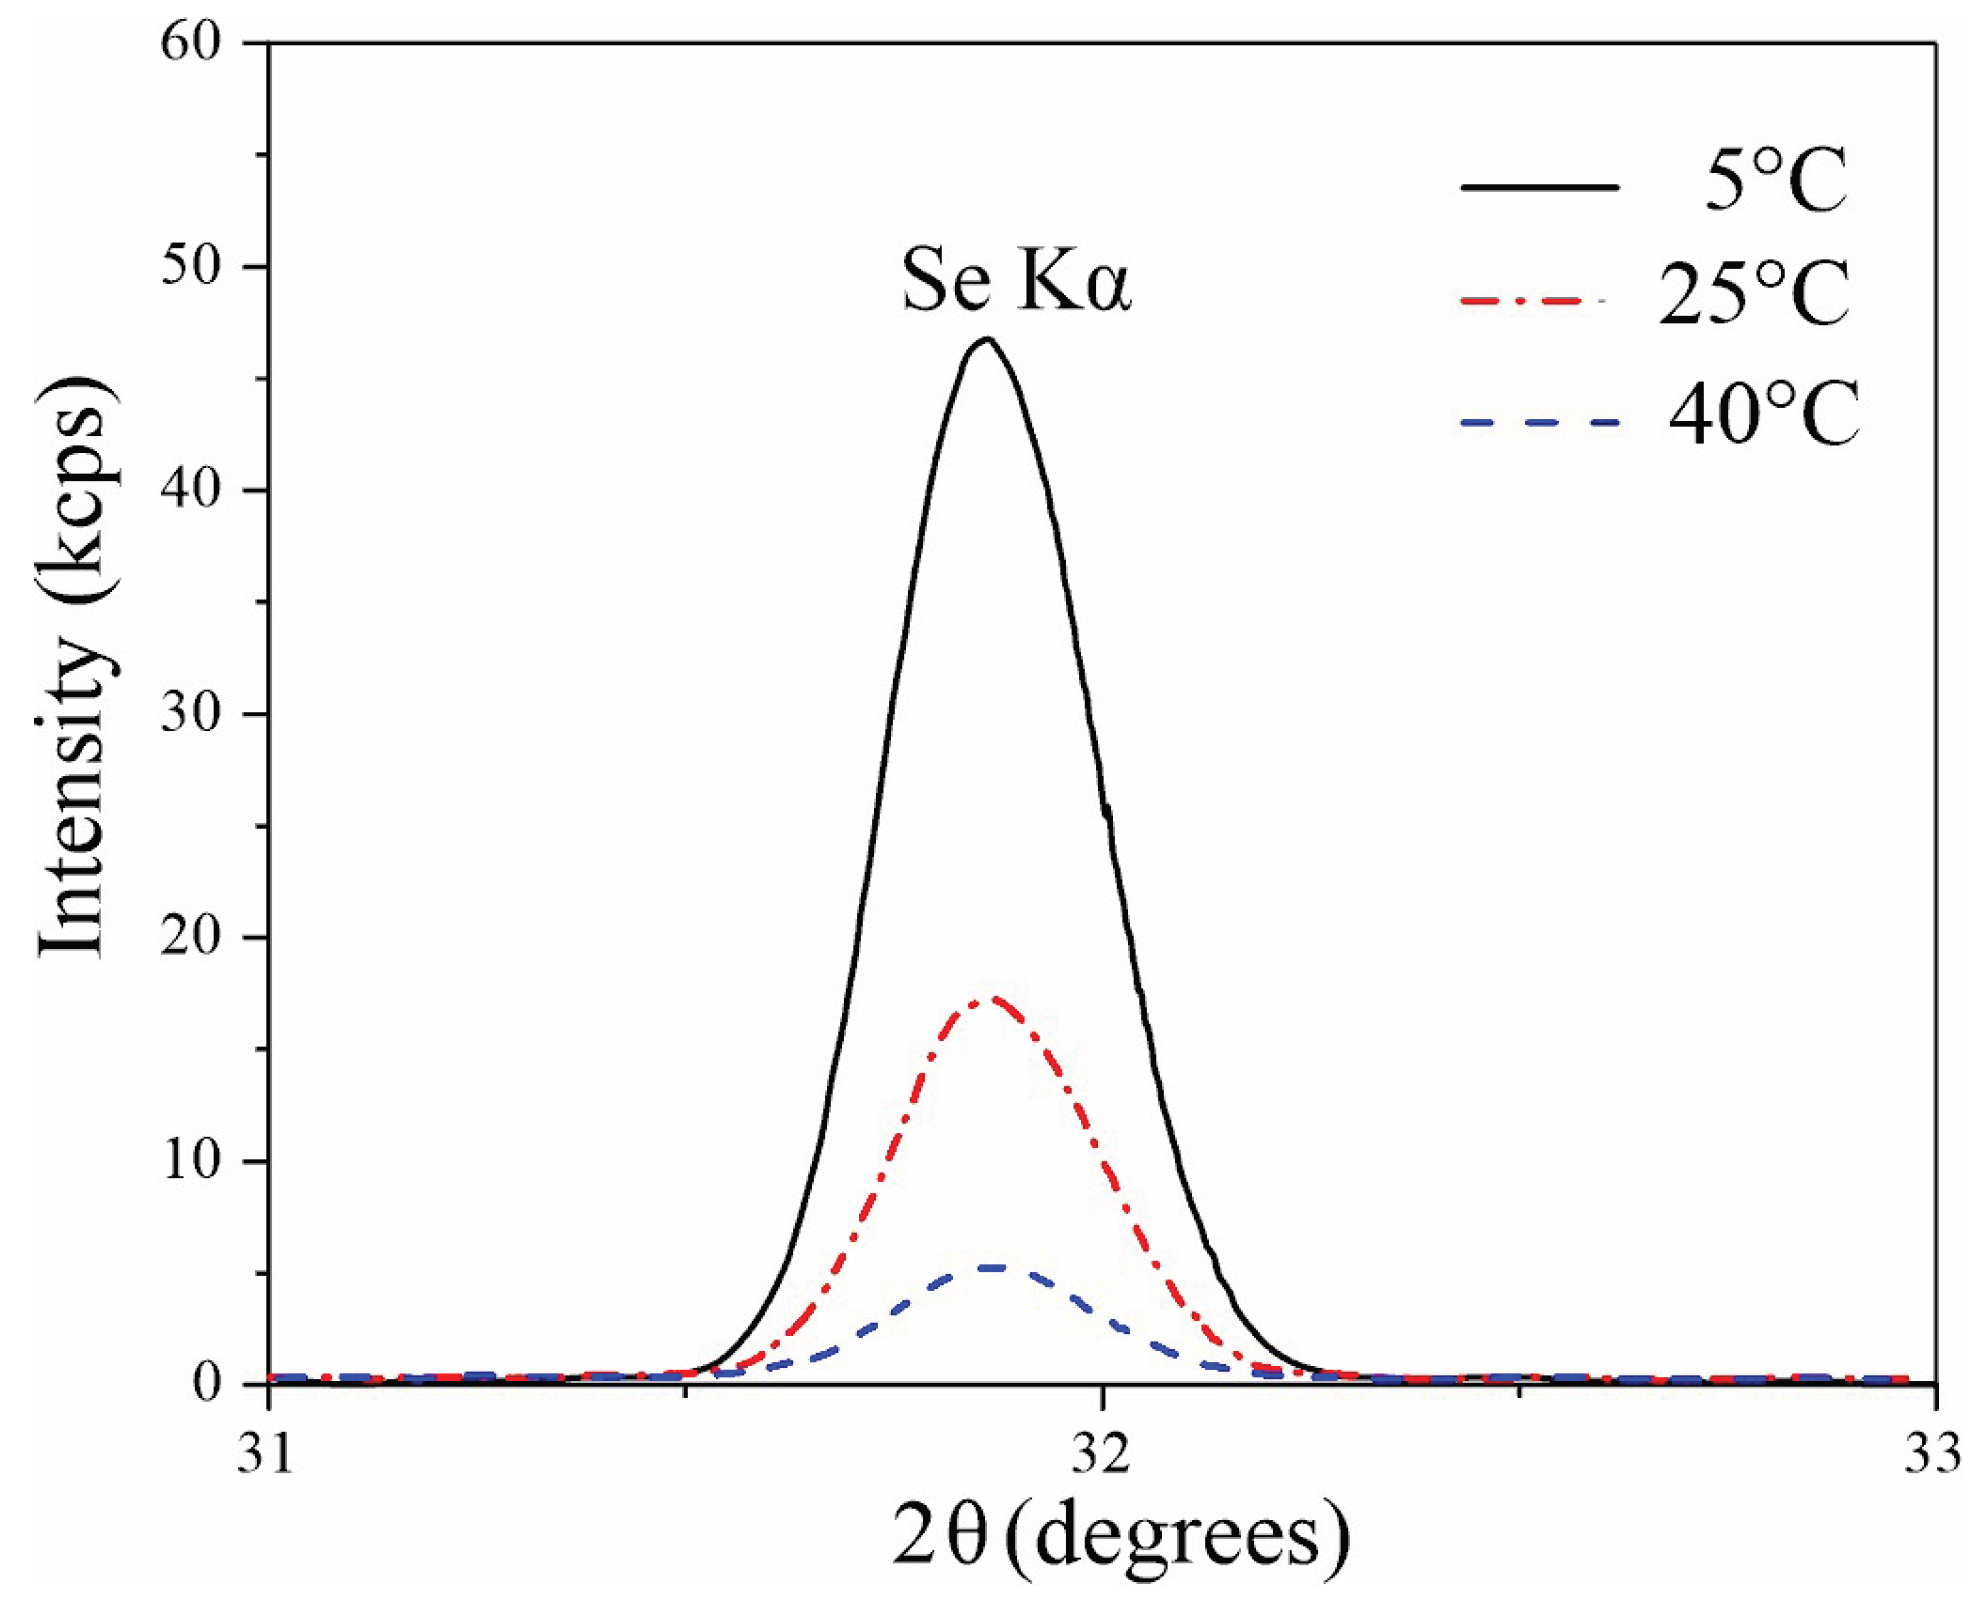
Figure 6.
Diffraction patterns of samples prepared in 1.5 M H2SeO4 at a current density of 15 mA/cm2 at different anodization temperatures.
Figure 6.
Diffraction patterns of samples prepared in 1.5 M H2SeO4 at a current density of 15 mA/cm2 at different anodization temperatures.
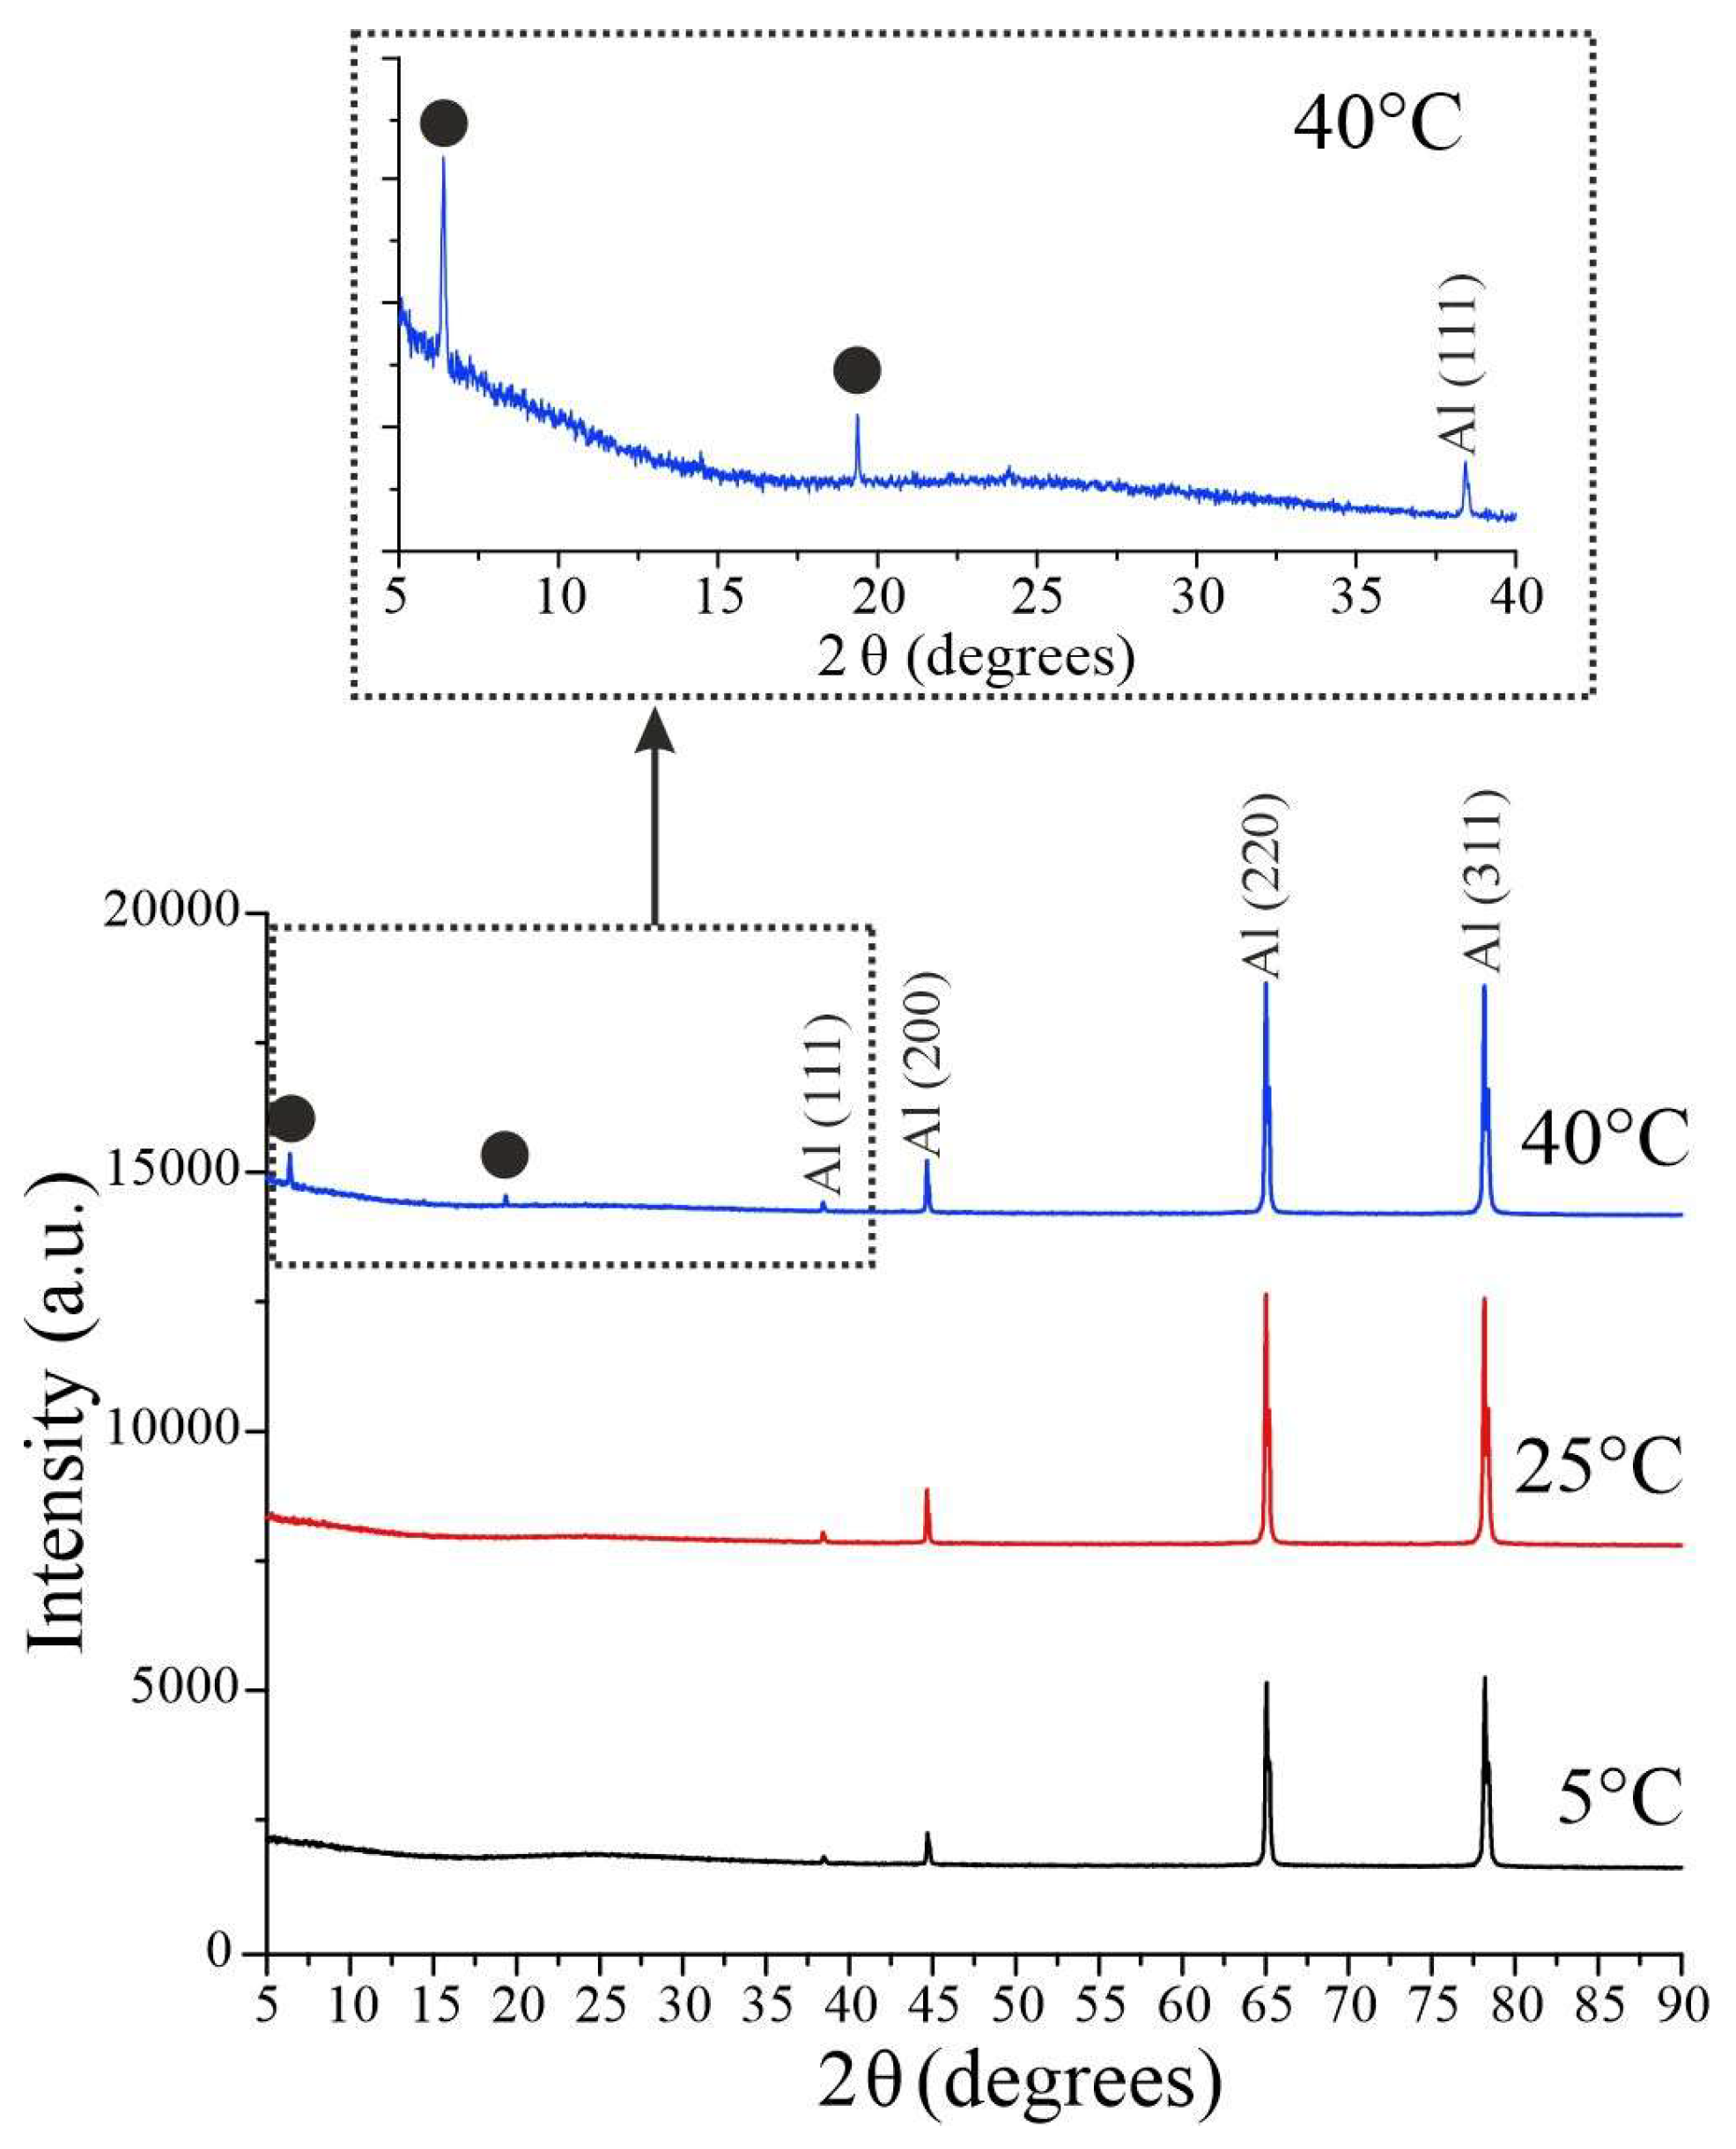
Figure 7.
Photoluminescence spectra of porous alumina synthesized in 1.5 M H2SeO4 at 5 - 40 °C and 0.45 M C2H2O4 at 5 °C under the same current densities (15 mA/cm2) and anodization durations (30 min).
Figure 7.
Photoluminescence spectra of porous alumina synthesized in 1.5 M H2SeO4 at 5 - 40 °C and 0.45 M C2H2O4 at 5 °C under the same current densities (15 mA/cm2) and anodization durations (30 min).
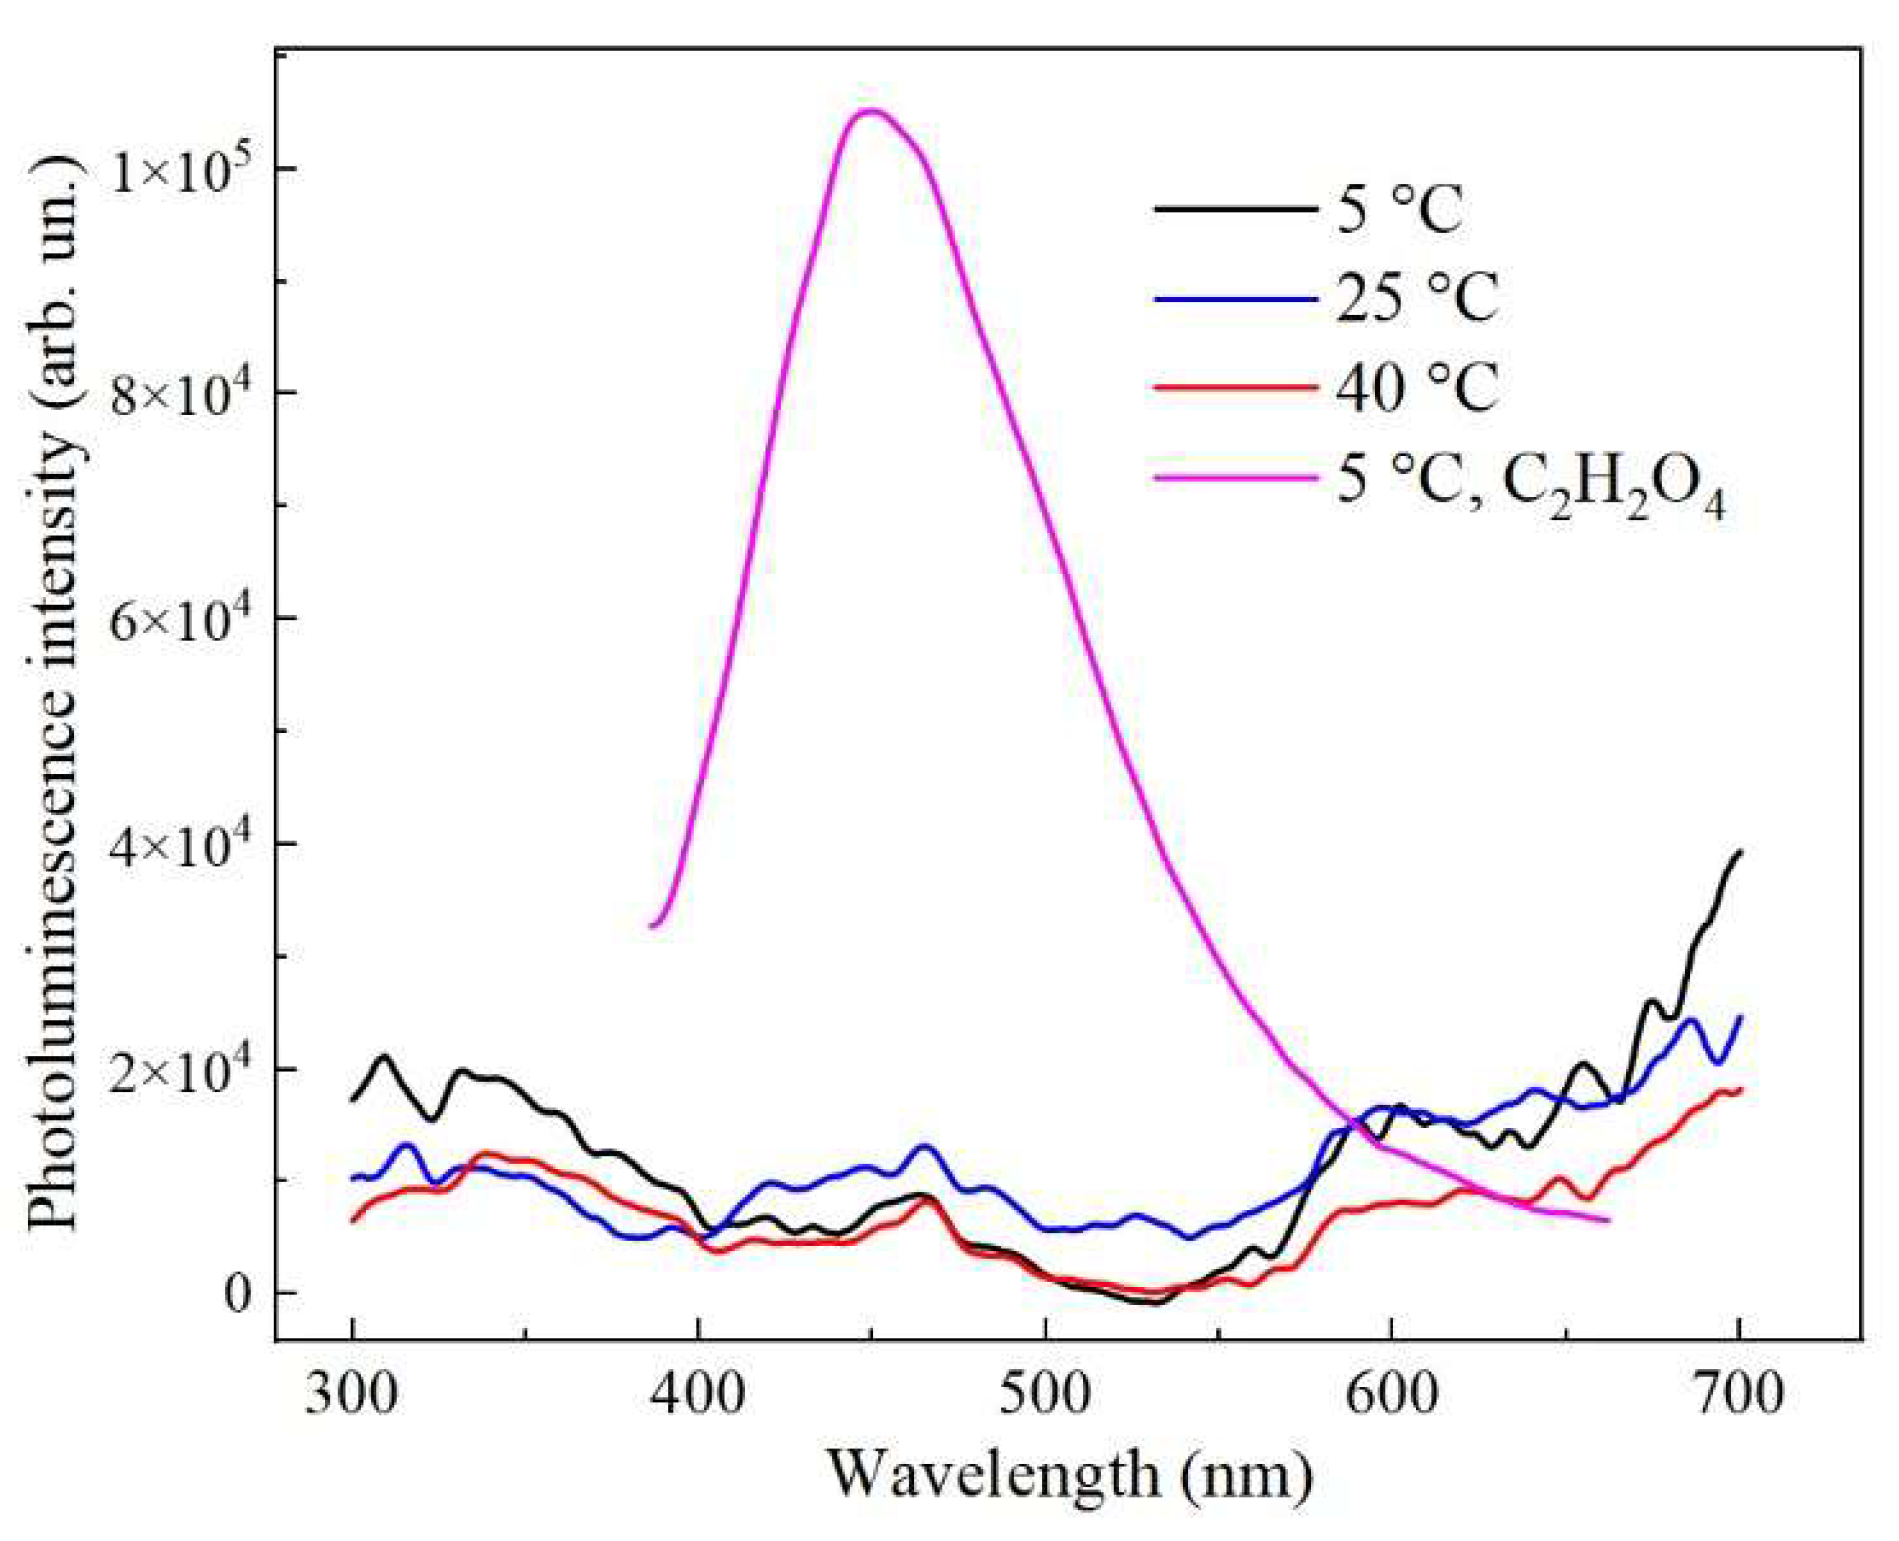
Figure 8.
Comparative EPR spectra of porous anodic alumina samples synthesized in 1.5 M H2SeO4 at 5 - 40 °C and in 0,45 M C2H2O4 at 5 °C under the same current densities (15 mA/cm2) and anodization durations (180 min).
Figure 8.
Comparative EPR spectra of porous anodic alumina samples synthesized in 1.5 M H2SeO4 at 5 - 40 °C and in 0,45 M C2H2O4 at 5 °C under the same current densities (15 mA/cm2) and anodization durations (180 min).
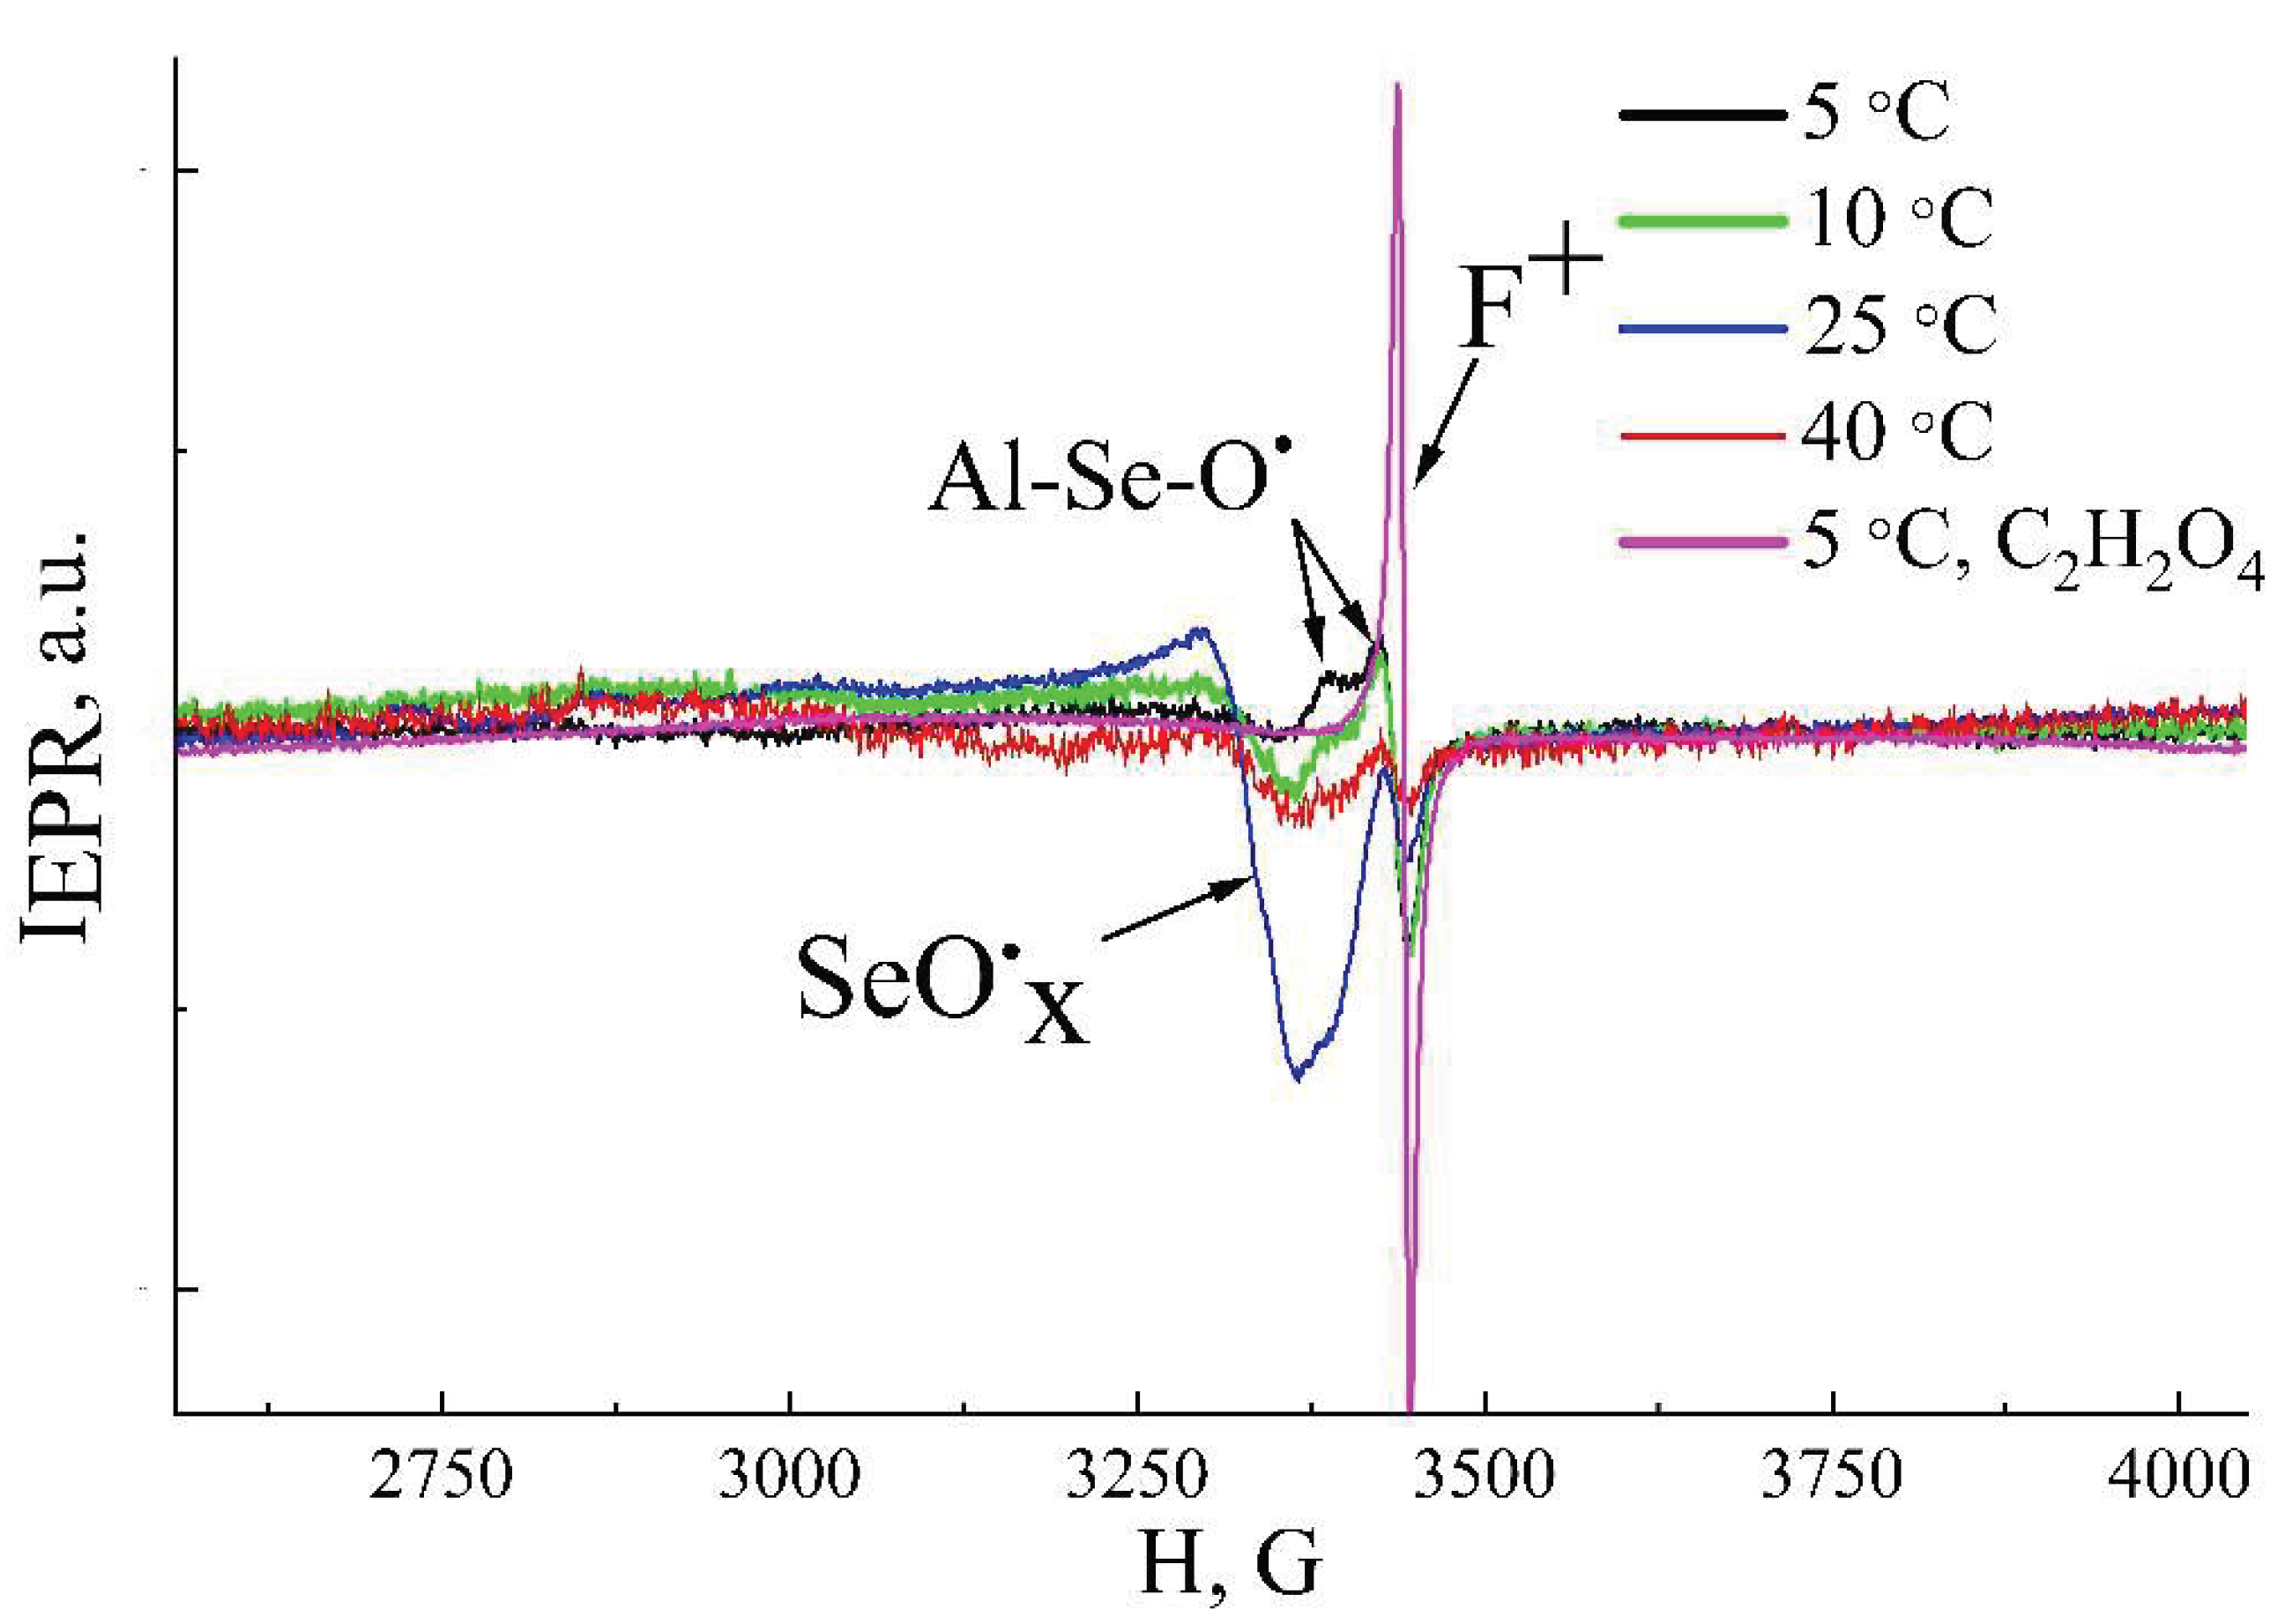
Figure 9.
Schematic representation of the cell structure of porous alumina formed in selenic acid electrolyte, showing different paramagnetic centers location for samples formed at: 5 °C (a), 25 °C (b), 40 °C (c).
Figure 9.
Schematic representation of the cell structure of porous alumina formed in selenic acid electrolyte, showing different paramagnetic centers location for samples formed at: 5 °C (a), 25 °C (b), 40 °C (c).
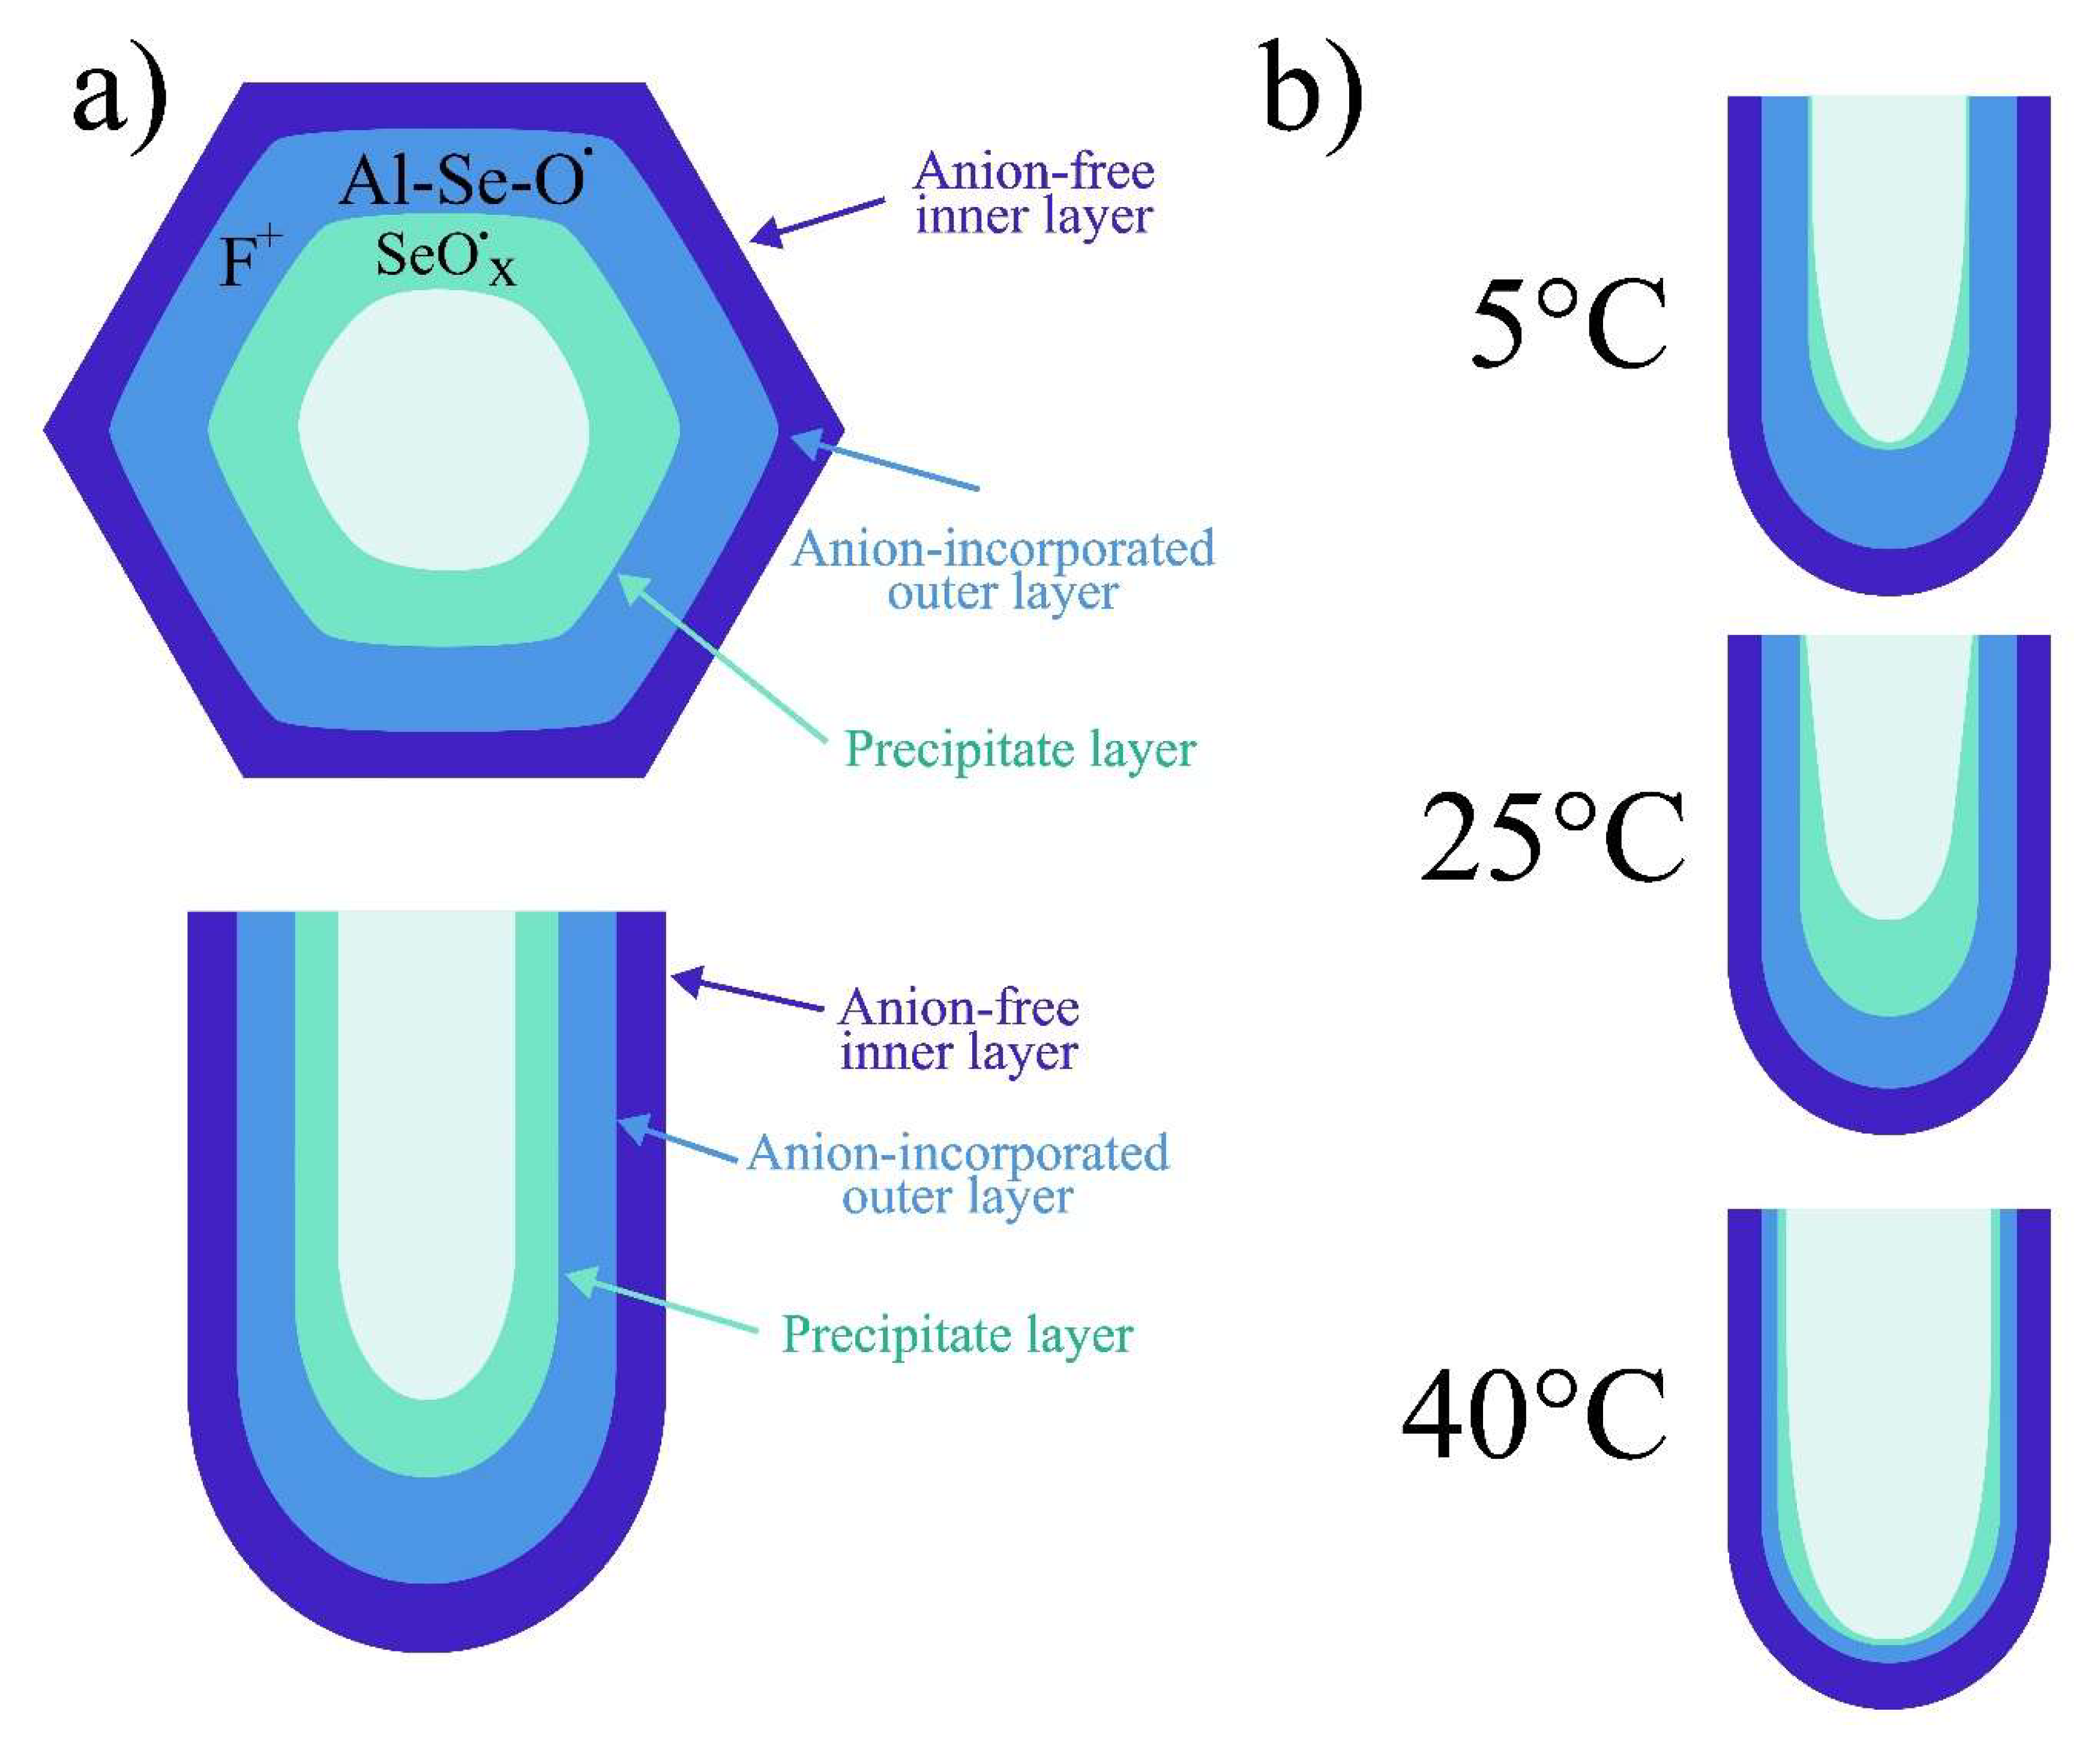

Table 1.
Main morphological parameters of the porous anodic alumina synthesized in H2SeO4 at different temperatures.
Table 1.
Main morphological parameters of the porous anodic alumina synthesized in H2SeO4 at different temperatures.
| Sample | Pore diameter, nm | Cell diameter, nm | Porosity (SEM+ Fiji), % |
|---|---|---|---|
| 0.5М-5°С-5мА/cm2 | 15±6 | 114±10 | 1.5 |
| 0.5М-25°С-5мА/cm2 | 16±9 | 101±8 | 7.5 |
| 0.5М-40°С-5мА/cm2 | 25±6 | 58±6 | 16.5 |
| 1.5М-5°С-15мА/cm2 | 17±4 | 84±7 | 2.0 |
| 1.5М-25°С-15мА/cm2 | 11±4 | 52±5 | 4.2 |
| 1.5М-40°С-15мА/cm2 * | 25±10 | 37±10 | 45.5 |
* - the pore and cell diameter values for the sample 1.5М-40°С-15мА/cm2 are estimated approximately using cross-section image of the bottom part of the AAO. The top part is unmeasurable, because alumina is etched to individual fibers.
Table 2.
Chemical content (at.%) of porous anodic alumina formed in 1,5 M H2SeO4 before and after ion beam etching.
Table 2.
Chemical content (at.%) of porous anodic alumina formed in 1,5 M H2SeO4 before and after ion beam etching.
| Sample | Ion beam etching | С | O | Al | Se | Se/Al |
|---|---|---|---|---|---|---|
| 1.5М-5°С-15мА/cm2 | - | 10.2 | 60.4 | 27.4 | 2.0 | 0.07 |
| 10 min | - | 60.4 | 38.2 | 1.4 | 0.04 | |
| 1.5М-25°С-15мА/cm2 | - | 5.1 | 62.3 | 30.2 | 1.8 | 0.06 |
| 10 min | - | 59.7 | 39.1 | 1.2 | 0.03 |
Disclaimer/Publisher’s Note: The statements, opinions and data contained in all publications are solely those of the individual author(s) and contributor(s) and not of MDPI and/or the editor(s). MDPI and/or the editor(s) disclaim responsibility for any injury to people or property resulting from any ideas, methods, instructions or products referred to in the content. |
© 2025 by the authors. Licensee MDPI, Basel, Switzerland. This article is an open access article distributed under the terms and conditions of the Creative Commons Attribution (CC BY) license (http://creativecommons.org/licenses/by/4.0/).
Copyright: This open access article is published under a Creative Commons CC BY 4.0 license, which permit the free download, distribution, and reuse, provided that the author and preprint are cited in any reuse.


