
Submitted:
14 November 2025
Posted:
17 November 2025
You are already at the latest version
Abstract
Based on multi-batch filtration and cleaning experiments, this study systematically evaluated the fouling potential of pre-treated textile dyeing wastewater by membrane bioreactor on reverse osmosis (RO) membranes and the recovery performance of fouled RO membranes after different cleaning methods. After a permeate production of 625 L/m², continuous foulants accumulation resulted in a significant decline in RO membrane permeability. Protein-like substances and sol-uble microbial products were identified as the primary organic foulants via three-dimensional fluorescence excitation-emission matrix spectrometry (3D-FEEM). The single forward flushing with pure water, acid solution (pH 3.5), alkaline solution (pH 10.5), and sodium hypochlorite with low effective chlorine concentration (1-2 mg/L) showed very limited recovery of fouled RO membrane permeability. The combined forward flushing with acid solution (pH 2) followed by alkaline solution (pH 11.5) restored fouled membrane permeability up to 87% of new RO mem-brane. The addition of pure water backwashing at transmembrane pressure of 0.5 MPa after both acid and alkaline combined forward flushing restored fouled membrane permeability up to 97% of new RO membrane but deteriorated the rejection capacity of RO membrane. The backwashing parameters were further optimized as transmembrane pressure of 0.5 MPa and crossflow veloci-ty of 0.5 m/s, achieving fouled membrane permeability up to 96% of new RO membrane and no negative effects on the rejection capacity of RO membrane. Therefore, the combined cleaning of acid forward flushing → pure water backwashing → alkaline forward flushing → pure water backwashing was proposed for RO membrane cleaning from textile dyeing wastewater reuse application.
Keywords:
combined cleaning
; conductivity
; constant-pressure crossflow filtration
; membrane fouling
; specific flux
1. Introduction
Due to the dense structure of separation layer, reverse osmosis (RO) membranes can retain the vast majority of inorganic and organic substances[1,2], leading to its intensive application in the production of high-quality reclaimed water. It has been applied on a large scale in seawater desalination and advanced treatment of difficult-to-treat organic wastewater, including sea sand washing wastewater, textile dyeing wastewater, coking wastewater, and landfill leachate [3,4].
Textile industry is one of the largest wastewater producers among all industrial sectors in China, discharging wastewater of 1.84 billion tons and accounting for 10.1% of total industrial wastewater discharge amount in 2015 [5]. In the context of textile dyeing wastewater, which is characterized by high chromaticity, substantial salinity, and complex compositions of dyes, sizing agents, and additives[6,7], RO technology presents a promising solution for achieving water reuse and meeting stringent discharge standards[8,9]. However, its application in this field is severely hampered by membrane fouling[10]. The diverse organic constituents and hydrophobic contaminants in dyeing wastewater readily adsorb onto and clog the membrane pores, leading to a significant decline in permeate flux and an increase in operating pressure. Consequently, frequent chemical cleaning is required, which shortens membrane lifespan and elevates operational cost[11,12,13].
Many scholars have dedicated to search for ways to reduce the fouling potential of RO membranes and efficient cleaning methods to extend membrane lifespan[14,15,16]. Ćurić et al.[17] achieved membrane fouling control by coupling suitable pretreatment technologies with membrane technology. Results indicate that the combined ultrafiltration (UF)+RO process outperforms sand filtration and coagulation sedimentation in removing turbidity, color, and total organic carbon (TOC), playing a significant role in reducing the fouling potential of membranes in textile dyeing wastewater. Srisukphun et al. [18] elucidated the fouling mechanism of RO membranes in textile wastewater applications. It reported that the repulsive force between the anionic charge of reactive dyes and anionic surfactants prevents their aggregation, constituting a primary factor affecting membrane flux. Zeng[19] and Ma[20] conducted a series of tests on biological removal and oxidative adsorption of dyes and surfactants in textile wastewater, aiming to achieve adsorption and degradation of scaling sources using sulfate-reducing bacteria (SRB) or oxidized graphene, respectively. Results demonstrated adsorption and degradation rates exceeding 99%, significantly reducing membrane scaling risks.
Membrane cleaning methods are primarily categorized into physical and chemical cleaning. Physical cleaning relies on mechanical force to scrape contaminants from the membrane surface under varying hydraulic conditions[21]. Chemical cleaning involves chemical agents reacting with membrane foulants to alter their structure and reduce the cohesive forces between foulants and the membrane surface, thereby restoring membrane permeability[22]. The commonly used chemical agents include acids, alkalis, surfactants, and chelating agents. Acids, such as citric acid, hydrochloric acid, nitric acid, and sulfuric acid, are used to remove inorganic contaminants[23]. Alkalis, mainly sodium hydroxide, are used to remove organic and biological contaminants[24]. In practical applications, intensive chemical cleaning is indispensable during RO treatment of textile wastewater[25]. Membrane aging necessitates refined cleaning protocols that ensure thorough cleaning while minimizing chemical corrosion of the membrane itself[15].
In this study, the fouling potential of a typical RO membrane by biologically treated textile dyeing wastewater was systematically evaluated. The causes of membrane fouling were analyzed, and the effectiveness of acid, alkaline, and their combined cleaning methods was tested. An effective cleaning protocol for addressing RO membrane fouling in dyeing wastewater was proposed, providing valuable reference for the application and promotion of RO technology in this field.
2. Materials and Methods
2.1. Lab-Scale RO Setup and RO Membranes
A constant-pressure cross-flow RO setup (Figure 1, FlowMem0021-MP, Xiamen Filter & Membrane Technology Co., Ltd.) was used for multi-batch filtration and cleaning experiments in this study and its detailed description was shown in a previous study [25,26]. The RO membrane used in this study is a flat-sheet membrane from China Vontron Technology Co., Ltd., model HOR (referring to high oxidation resistance), with the type being a polyamide composite membrane. Prior to testing, membrane discs of appropriate size must be cut using a template. New membranes should then be placed in pure water for 30 min to remove glycerol from the surface.
2.2. Wastewater Sample and Examination Methods
Effluent samples were collected from a pilot-scale membrane bioreactor (MBR) treating textile dyeing and finishing wastewater (TDFW) in Foshan, Guangdong Province, China, and used as RO feedwater (Table 1). The effluent appeared clear and yellowish-brown, with no suspended solids (SS) observed, which can be attributed to the use of an ultrafiltration membrane with a mean pore size of 40 nm. The water quality parameters of the effluent are summarized in Table 1.
As reported in previous studies[25], water quality was measured according to the standard methods [27]. pH and conductivity were measured using a pH meter (HQ4300, Hach) and a conductivity meter (HQ4300, Hach), respectively. Chemical oxygen demand (COD) was determined by potassium dichromate oxidation followed by titration with ferrous ammonium sulfate. Total organic carbon (TOC) was analyzed using an organic carbon analyzer (TOC-L, Shimadzu). Suspended solids (SS) were quantified by the gravimetric method after heating. Chroma was assessed using the dilution visual colorimetric method. The concentrations of Fe, Mn, and total hardness (as CaCO3) were measured with an inductively coupled plasma spectrometer (iCAP 7000, Thermo Scientific). Dissolved organic matter (DOM) in RO influent and effluent was characterized using three-dimensional fluorescence excitation-emission matrix spectrometry (3D-FEEM) [28].
2.3. Batch RO Tests and Analytical Methods
The evaluation of RO membrane fouling potential in TDFW reuse and its optimal cleaning program were divided into three main parts:
(1) RO Membrane Fouling Potential in TDFW Reuse. This stage focused on multi-batch filtration at an operating pressure (TMP) of 2 MPa, crossflow velocity (CFV) of 1.0 m/s, temperature of 20 °C, and each batch running until 60% water recovery. The aim was to identify the filtration volume per unit membrane area at which significant RO membrane fouling occurred, thereby establishing an experimental basis for subsequent membrane cleaning studies. The specific flux (i.e., the linear slope of flux vs. TMP) of new, fouled and cleaned RO membranes was measured via filtration test using pure water, under a temperature (T) of 20 °C, a CFV of 1 m/s and different TMP of 0.5-2.5 MPa.
(2) Testing and Optimization of Membrane Cleaning Program. For the above-mentioned fouled RO membranes, the single forward flushing with pure water, acid solution, alkaline solution, and sodium hypochlorite with low effective chlorine concentration was conducted with the details shown in Table 2. Combined forward flushing was further conducted, with the details shown in Table 3.
(3) Exploration of Optimal Backwashing Conditions. Based on previous studies[29,30] and the above-mentioned backwashing results, backwashing with improper TMP or CFV could deteriorate RO membrane rejection capability. Therefore, further optimization of backwashing parameters were conducted. Under the constant conditions of 20 °C, CFV 1 m/s and 40 min, different backwashing TMP of 0.5, 0.25, and 0.125 MPa were firstly compared to identify the optimal TMP. Then, under the constant conditions of 20 °C, 0.125 MPa and 40 min, different CFV of 1.5, 1.0, and 0.5 m/s were further compared to determine the optimal CFV.
(4) Demonstration of the Optimal Combined Cleaning Method. Following the above-mentioned investigation, the optimal combined acid → alkaline forward flushing with pure water backwashing was employed for the fouled RO membrane after 6 batches filtration to demonstrate its cleaning performance.
3. Results and Discussion
3.1. RO Membrane Fouling Potential for TDFW Reuse Application
As shown in Figure 2a, 10 batches were conducted. The whole membrane flux showed no significant change in batches 1–3, consistent with previous repeated filtration results[25]. The membrane flux slightly decreased in batch 4, and continued to decline in batches 5 and 6, reaching its lowest value (initial membrane flux of batches 1 and 6 was 37.9 and 32.5 LMH, respectively, with batch 6 showing a 14.3% decrease). Batches 7–10 had no significant variation in membrane flux, even slightly exceeding that of batch 6. Based on the manufacturer’s specifications and test data from previous studies[25,31,32], when the membrane permeate production reached 625 L/m2(i.e., after 10 batches), the accumulated fouling could lead to a significant decline in flux. To verify this hypothesis, 13 batches were repeated with results shown in Figure 2b, where only partial results were presented for clearly illustrating the membrane flux variation. During the 11th batch experiment, the membrane flux decreased significantly compared to batches 6–10. The initial membrane flux of batch 10 was 27.36 LMH, a decrease of 2.11% relative to batch 6. While the initial membrane flux of batch 11 was only 26.36 LMH, which was a 3.65% decrease relative to batch 10, this confirmed that 625 L/m2 as the critical limit for cumulative membrane fouling, beyond which fouling increased significantly.
3.2. Testing and Optimization of Fouled RO Membrane Cleaning Program
Membrane cleaning tests were performed on fouled membranes from Batch 10. The cleaning was conducted via forward flushing consisted of pure water, acid, alkaline, and sodium hypochlorite solutions with low effective chlorine concentration of 1.0, 1.5, and 2.0 mg/L in sequence. The results are presented in Figure 3. After pure water flushing (i.e., physical cleaning), Batch 11 exhibited a slower decline in membrane flux compared to Batch 10, though no significant improvement in overall flux levels was observed. Following acid flushing, Batch 12 showed a pronounced decrease in flux relative to Batch 11, likely due to the accumulation of membrane fouling beyond a critical threshold, which accelerated flux decrease. In Batch 13 after alkaline flushing, only a minor flux reduction occurred compared to Batch 12. When oxidative cleaning was applied with 1.0 mg/L effective chlorine (Batch 14), the membrane flux remained largely stable. Increasing the effective chlorine concentration to 1.5 mg/L (Batch 15) led to a partial recovery of membrane flux, with an effluent conductivity of 76.5 μS/cm. However, at 2.0 mg/L effective chlorine (Batch 16), a slight decline in membrane flux was observed, along with a significant rise in effluent conductivity to 619 μS/cm. These findings suggested that the higher effective chlorine concentration could damage the membrane structure, thus deteriorating its ion rejection capacity and resulting in elevated effluent conductivity.
Based on the very limited cleaning performance of the above-mentioned single forward flushing methods, the combined acid → alkaline flushing (Plan 1) was employed for the fouled RO membrane after 6 batches filtration in order to improve cleaning performance. The results are summarized in Figure 4. Analysis of the membrane flux variation at different TMP revealed that the specific flux (SF) of the new membrane decreased from an initial value of 21.38 LMH/MPa to 17.67 LMH/MPa after 6 batches of filtration, retaining only 82.5% of its original permeability. Acid cleaning restored the SF to 18.17 LMH/MPa, corresponding to 85% of the initial SF, while subsequent alkaline cleaning further increased it to 18.63 LMH/MPa, recovering 87.2% of the new membrane’s SF. These results suggest that the combined acid → alkaline flushing strategy exhibited limited effectiveness in restoring RO membrane permeability under the tested conditions.
A combined acid → alkaline forward flushing and pure water backwashing protocol (Plan2) was employed for the fouled RO membrane after 6 batches filtration in order to further improve cleaning performance. The results are presented in Figure 5. The initial SF of the new membrane was 21.68 LMH/MPa, which declined to 16.77 LMH/MPa after 96 filtration batches, corresponding to approximately 77.4% of the original SF. After acid forward flushing and pure water backwashing, the SF recovered to 17.20 LMH/MPa, restoring it to 79.3% of the initial SF. Subsequent alkaline forward flushing and pure water backwashing further enhanced the SF recovery to 21.20 LMH/MPa, reaching 97.8% of the new membrane’s SF. These results demonstrated that the modified cleaning strategy (i.e., combined acid → alkaline forward flushing and pure water backwashing) was highly effective and led to significant permeability restoration of fouled RO membranes after filtrating biologically treated TDFW via MBR of 625 L/m2.
3.3. Exploration of Optimal Backwashing Conditions
Compared to the backwashing effluent after acid cleaning (Figure 6a), backwashing effluent after alkaline cleaning (Figure 6b) contained significantly higher levels of organics, primarily consisting of protein-like substances and soluble microbial products (SMP). Combined with the aforementioned cleaning test results, this further confirmed that organic foulants on the RO membrane surface was the primary cause of reduced membrane permeability.
The RO membrane used in the experiment was a polyamide-based membrane, which was an asymmetric membrane with a non-robust supporting layer on the permeate side[33,34]. Considering the risk of mechanical damage to the supporting layer during backwashing, further refinement of the backwashing conditions was required. Based on 3D-FEEM analysis, compared with the filtered effluent after the 6th batch (Figure 7a), the organic matter content in the membrane effluent after backwashing increased significantly, as shown in Figure 7b. Therefore, the excessively high backwashing TMP and CFV could cause some damage to the membrane structure, resulting in a reduced rejection efficiency of organic matter by the RO membrane.
Further optimization of backwashing parameters were conducted. Under the constant conditions of 20 °C, CFV 1 m/s and 40 min, different backwashing TMP of 0.5, 0.25, and 0.125 MPa were firstly compared to identify the optimal TMP. The new RO membrane was backwashed under these conditions, followed by one batch filtration test. The effluent was analyzed by 3D-FEEM (Figure 8). As backwashing TMP increased, protein-like substances in the effluent gradually rose (Figures 8d-8b). This indicated that higher TMP caused more damage to the RO membrane structure[35]. When the TMP was 0.125 MPa (Figure 8d), the organic content in the effluent was comparable to the new membrane without backwashing. Thus, it could be determined that the optimal backwashing TMP was 0.125 MPa.
Then, under the constant conditions of 20 °C, 0.125 MPa and 40 min, different CFV of 1.5, 1.0, and 0.5 m/s were further compared to determine the optimal CFV. The new RO membrane was backwashed under these conditions, followed by one batch filtration test. The effluent was analyzed by 3D-FEEM (Figure 9). Compared to the filtered effluent from RO membrane without backwashing (Figure 9a), higher CFV resulted in more membrane structural damage (Figure 9b, 9c)[36]. When the CFV was 0.5 m/s (Figure 9d), the organic matter content in the effluent showed no significant change compared to the new membrane. Therefore, the optimal backwashing CFV was determined to be 0.5 m/s.
3.4. Demonstration of the Optimal Combined Cleaning Method
Based on the above-mentioned results, the optimal combined cleaning method (i.e., acid → alkaline forward flushing and pure water backwashing with TMP of 0.125 MPa and CFV of 0.5 m/s) was employed for the fouled RO membrane after 6 batches filtration to demonstrate its cleaning performance. The results are presented in Figure 10. From Figure 10a, the initial SF of the new membrane was 22.30 LMH/MPa, which declined to 17.88 LMH/MPa after 6 filtration batches, corresponding to approximately 80.2% of the original SF. After acid forward flushing and pure water backwashing, the SF recovered to 18.39 LMH/MPa, restoring it to 82.5% of the initial SF. Subsequent alkaline forward flushing and pure water backwashing further enhanced the SF recovery to 21.41 LMH/MPa, reaching 96.0% of the new membrane’s SF. Comparing Figure 10b and 10c, there was no significant changes in fluorescent organics before and after the optimal combined cleaning, indicating no damage of RO membrane structure caused by the optimal combined cleaning.
4. Conclusions
This study investigated the membrane fouling potential and cleaning of typical RO membranes during textile wastewater reuse. Multiple batch filtration experiments revealed that when cumulative filtrate volume reached 625 L/m2, RO membrane fouling accumulated to a point causing significant permeability decline (more than 20%). At this stage, membrane cleaning was required to remove foulants and restore permeability. Results from single forward flushing with pure water, acid, alkaline, and sodium hypochlorite with low effective chlorine concentrations of 1-2 mg/L showed very limited cleaning performance except that sodium hypochlorite cleaning with 1.5 mg/L effective chlorine partially restored permeability. Moreover, sodium hypochlorite cleaning was sensitive to damage membrane structure and thus deteriorate effluent quality. The combined acid → alkaline forward flushing yielded limited cleaning performance (specific flux recovered to only 85% of original levels after acid cleaning and 87.2% after alkaline cleaning). The combined acid → alkaline forward flushing and intensive pure water backwashing effectively restored specific flux up to 97.8% but deteriorated membrane rejection capability. Further optimization determined the optimal backwashing TMP of 0.125 MPa and CFV of 0.5 m/s. The optimal combined acid → alkaline forward flushing and pure water backwashing effectively restored specific flux up to 96% without deteriorating membrane rejection capability.
Author Contributions
Conceptualization, C.W., W.Z. and R.O.; methodology and investigation, W.Z., R.O., G.Z. and S.J.; validation, Q.L. and C.T.; writing—original draft preparation, Z.W. and R.O.; writing—review and editing, C.W. and H.R.; supervision, C.W.; funding acquisition, C.W. and H.R. All authors have read and agreed to the published version of the manuscript.
Funding
This research was jointly supported by Guangdong Basic and Applied Basic Research Foundation (2024A1515011347) and National Natural Science Foundation of China (52470102, 52170071).
Institutional Review Board Statement
Not applicable.
Data Availability Statement
Not applicable.
Acknowledgments
The authors acknowledge Vontron for technical supports.
Conflicts of Interest
The authors declare no conflict of interest.
References
- Wang, J.; Xing, J.; Li, G.; Yao, Z.; Ni, Z.; Wang, J.; Liang, S.; Zhou, Z.; Zhang, L. How to extend the lifetime of RO membrane? From the perspective of the end-of-life RO membrane autopsy. Desalination 2023. [Google Scholar] [CrossRef]
- Yu, W.; Song, D.; Chen, W.; Yang, H. Antiscalants in RO membrane scaling control. Water Research 2020. [Google Scholar] [CrossRef]
- Tay, M.F.; Liu, C.; Cornelissen, E.R.; Wu, B.; Chong, T.H. The feasibility of nanofiltration membrane bioreactor (NF-MBR)+reverse osmosis (RO) process for water reclamation: Comparison with ultrafiltration membrane bioreactor (UF-MBR)+RO process. Water Research 2017. [Google Scholar] [CrossRef]
- Yamamoto, K.; Koge, S.; Gunji, T.; Kanezashi, M.; Tsuru, T.; Ohshita, J. Preparation of POSS-derived robust RO membranes for water desalination. Desalination 2017. [Google Scholar] [CrossRef]
- Zhou, C.Q.; Gu, H.K.; Wei, C.H.; Rong, H.W.; Ng, H.Y. Dyeing and finishing wastewater treatment via a low-cost hybrid process of hydrolysis-acidification and alternately anoxic/oxic sequencing batch reactor with synchronous coagulation. J Water Process Eng 2022, 49, 12. [Google Scholar] [CrossRef]
- Ewuzie, U.; Saliu, O.D.; Dulta, K.; Ogunniyi, S.; Bajeh, A.O.; Iwuozor, K.O.; Ighalo, J.O. A review on treatment technologies for printing and dyeing wastewater (PDW). Journal of Water Process Engineering 2022. [Google Scholar] [CrossRef]
- Xu, H.; Zhang, H.; Huang, J.; Zhang, L.; Wang, F.; Liu, G.; Yu, X.; Liu, W.; Huang, C. Optimization of Fenton combined with membrane bioreactor in the treatment of printing and dyeing wastewater. International Biodeterioration & Biodegradation. [CrossRef]
- Myung, S.W.; Choi, I.H.; Lee, S.H.; Kim, I.C.; Lee, K.H. Use of fouling resistant nanofiltration and reverse osmosis membranes for dyeing wastewater effluent treatment. Water Science and Technology 2018. [Google Scholar] [CrossRef]
- Xu, L.; Li, W.; Lu, S.; Wang, Z.; Zhu, Q.; Ling, Y. Treating dyeing waste water by ceramic membrane in crossflow microfiltration. Desalination 2002. [Google Scholar] [CrossRef]
- Kim, I.-C.; Lee, K.-H. Dyeing process wastewater treatment using fouling resistant nanofiltration and reverse osmosis membranes. Desalination 2006. [Google Scholar] [CrossRef]
- Huang, C.; Zhang, H.; Huang, J.; Zhang, L.; Tong, S.; Wang, F.; Liu, G.; Yu, X.; Xu, H.; Liu, W. Performance of anoxic and aerobic flocs in anoxic/aerobic-membrane bioreactor (A/O–MBR) for the treatment of printing and dyeing wastewater (PDW). Biochemical Engineering Journal 2025. [Google Scholar] [CrossRef]
- Liu, G.; Zhang, H.; Huang, J.; Zhang, L.; Zhang, T.; Yu, X.; Liu, W.; Huang, C. Treatment of printing and dyeing wastewater using Fenton combined with ceramic microfiltration membrane bioreactor. Biochemical Engineering Journal 2023. [Google Scholar] [CrossRef]
- Myung, S.W.; Choi, I.H.; Lee, S.H.; Kim, I.C.; Lee, K.H. Use of fouling resistant nanofiltration and reverse osmosis membranes for dyeing wastewater effluent treatment. Water Science and Technology 2005. [Google Scholar] [CrossRef]
- Lai, Y.; Xu, H.; Xiao, K.; Wei, C.; Huang, X. Unravelling essential factors of membrane organic fouling via source apportionment analysis of FTIR features. Separation and Purification Technology 2025. [Google Scholar] [CrossRef]
- Wei, C.-H.; Sun, C.-X.; Chen, Z.-B.; Tang, X.; Kuang, K.; Yu, H.-R.; Rong, H.-W.; Xiao, K.; Ngo, H.H.; Huang, X. Membrane fouling analysis and chemical cleaning optimization via membrane autopsy for membrane bioreactor from lab to engineering application. Separation and Purification Technology 2025. [Google Scholar] [CrossRef]
- Wei, C.-H.; Wang, Z.-W.; Dai, J.-H.; Xiao, K.; Yu, H.-R.; Qu, F.-S.; Rong, H.-W.; He, J.-G.; Ngo, H.H. Enhanced anaerobic digestion performance and sludge filterability by membrane microaeration for anaerobic membrane bioreactor application. Bioresource Technology 2024. [Google Scholar] [CrossRef]
- Ćurić, I.; Dolar, D.; Bošnjak, J. Reuse of textile wastewater for dyeing cotton knitted fabric with hybrid treatment: Coagulation/sand filtration/UF/NF-RO. Journal of Environmental Management 2021. [Google Scholar] [CrossRef]
- Srisukphun, T.; Chiemchaisri, C.; Urase, T.; Yamamoto, K. Experimentation and modeling of foulant interaction and reverse osmosis membrane fouling during textile wastewater reclamation. Separation and Purification Technology 2009. [Google Scholar] [CrossRef]
- Zeng, Q.; Wang, Y.; Zan, F.; Khanal, S.K.; Hao, T. Biogenic sulfide for azo dye decolorization from textile dyeing wastewater. Chemosphere 2021. [Google Scholar] [CrossRef]
- Ma, H.; Yu, L.; Yang, L.; Yao, Y.; Shen, G.; Wang, Y.; Li, B.; Meng, J.; Miao, M.; Zhi, C. Graphene oxide composites for dye removal in textile, printing and dyeing wastewaters: a review. Environmental Chemistry Letters 2024. [Google Scholar] [CrossRef]
- Jang, Y.; Cho, H.; Shin, Y.; Choi, Y.; Lee, S.; Koo, J. Comparison of fouling propensity and physical cleaning effect in forward osmosis, reverse osmosis, and membrane distillation. DESALINATION AND WATER TREATMENT 2016. [Google Scholar] [CrossRef]
- Ma, Z.; Shu, G.; Lu, X. Preparation of an antifouling and easy cleaning membrane based on amphiphobic fluorine island structure and chemical cleaning responsiveness. Journal of Membrane Science 2020. [Google Scholar] [CrossRef]
- Lee, E.-J.; An, A.K.J.; Hadi, P.; Yan, D.Y.S.; Kim, H.-S. A mechanistic study ofin situchemical cleaning-in-place for a PTFE flat sheet membrane: fouling mitigation and membrane characterization. Biofouling 2016. [Google Scholar] [CrossRef]
- Malczewska, B.; Żak, A. Structural Changes and Operational Deterioration of the Uf Polyethersulfone (Pes) Membrane Due to Chemical Cleaning. Scientific Reports 2019. [Google Scholar] [CrossRef] [PubMed]
- Ouyang, R.; Huang, B.; Wei, C.-H.; Rong, H.; Yu, H.; Qu, F.; Xiao, K.; Huang, X. Cake Layer Fouling Potential Characterization for Wastewater Reverse Osmosis via Gradient Filtration. Membranes 2022. [Google Scholar] [CrossRef]
- Ouyang, R.L.; Huang, B.; Wei, C.H.; Rong, H.W.; Yu, H.R.; Qu, F.S.; Xiao, K.; Huang, X. Cake Layer Fouling Potential Characterization for Wastewater Reverse Osmosis via Gradient Filtration. Membranes-Basel 2022, 12. [Google Scholar] [CrossRef] [PubMed]
- Rice, E.W.; Baird, R.B.; Eaton, A.D. , (Eds.) Standard Methods for the Examination of Water and Wastewater (23rd edn) American Public Health Association, American Water Works Association, Water Environment Federation: Washington DC, 2017.
- Jacquin, C.; Lesage, G.; Traber, J.; Pronk, W.; Heran, M. Three-dimensional excitation and emission matrix fluorescence (3DEEM) for quick and pseudo-quantitative determination of protein- and humic-like substances in full-scale membrane bioreactor (MBR). Water Research 2017. [Google Scholar] [CrossRef]
- Hoek, E.M.V.; Weigand, T.M.; Edalat, A. Reverse osmosis membrane biofouling: causes, consequences and countermeasures. npj Clean Water 2022. [Google Scholar] [CrossRef]
- Zhang, W.; Xu, X.; Zhang, G.; Jin, S.; Dong, L.; Gu, P. Treatment of Membrane Cleaning Wastewater from Thermal Power Plant Using Membrane Bioreactor. Membranes 2022. [Google Scholar] [CrossRef]
- Wei, C.; Huang, X.; Wen, X. Pilot study on municipal wastewater treatment by a modified submerged membrane bioreactor. Water Science and Technology 2006. [Google Scholar] [CrossRef]
- Yu, H.; Shangguan, S.; Xie, C.; Yang, H.; Wei, C.; Rong, H.; Qu, F. Chemical Cleaning and Membrane Aging in MBR for Textile Wastewater Treatment. Membranes 2022. [Google Scholar] [CrossRef]
- Chowdhury, M.R.; Steffes, J.; Huey, B.D.; McCutcheon, J.R. 3D printed polyamide membranes for desalination. Science 2018. [Google Scholar] [CrossRef] [PubMed]
- Freger, V.; Ramon, G.Z. Polyamide desalination membranes: Formation, structure, and properties. Progress in Polymer Science 2021. [Google Scholar] [CrossRef]
- Di, H.; Martin, G.J.O.; Dunstan, D.E. Characterization of particle deposition during crossflow filtration as influenced by permeate flux and crossflow velocity using a microtiuidic filtration system. Frontiers of Chemical Science and Engineering 2020. [Google Scholar] [CrossRef]
- Suwarno, S.R.; Chen, X.; Chong, T.H.; McDougald, D.; Cohen, Y.; Rice, S.A.; Fane, A.G. Biofouling in reverse osmosis processes: The roles of flux, crossflow velocity and concentration polarization in biofilm development. Journal of Membrane Science 2014. [Google Scholar] [CrossRef]
Figure 1.
Constant-pressure cross-flow RO setup with concept diagram (left) and field photo (right).
Figure 1.
Constant-pressure cross-flow RO setup with concept diagram (left) and field photo (right).
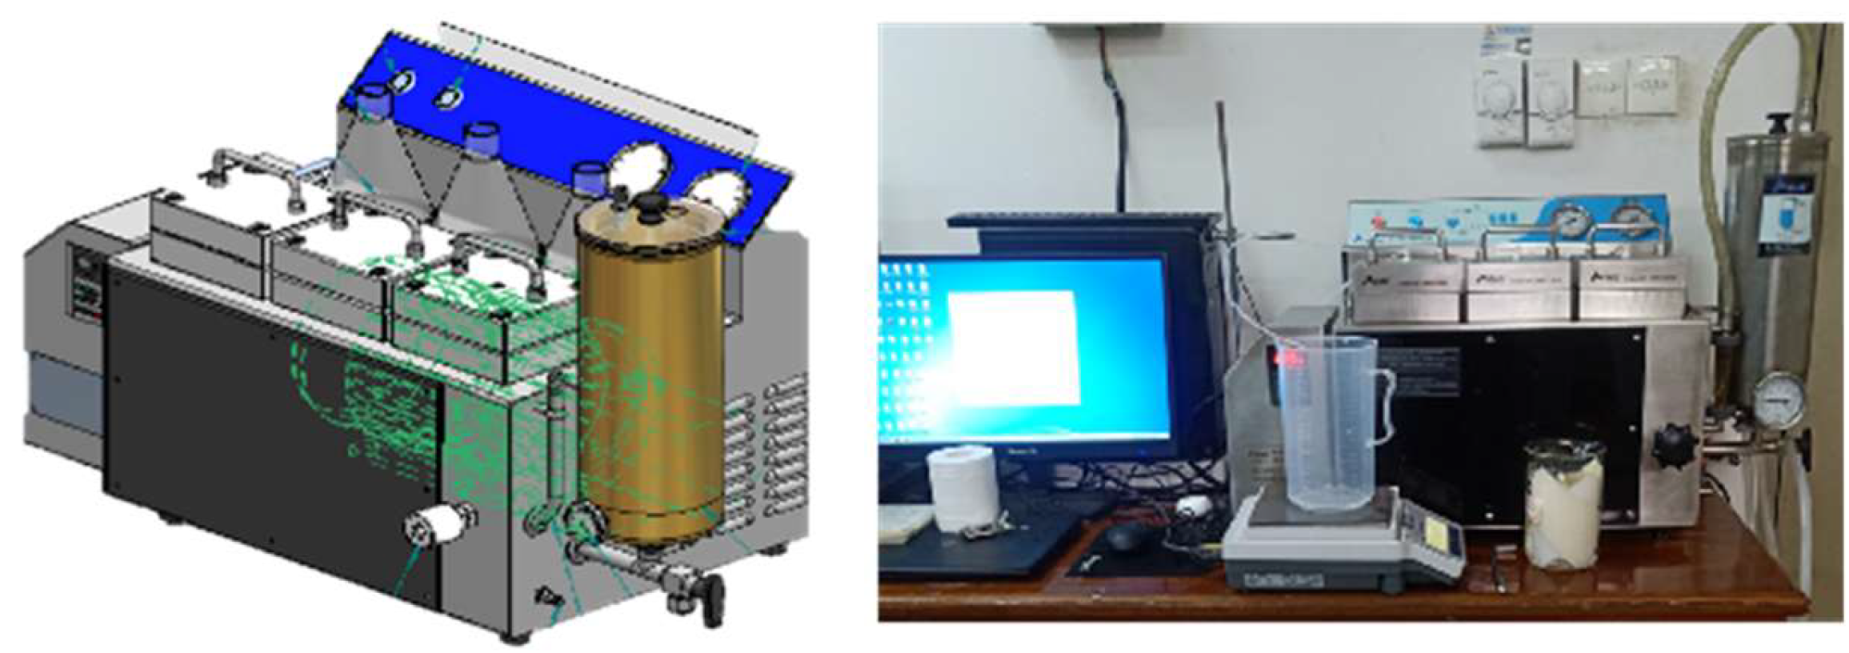
Figure 2.
RO membrane flux changes during 10 (a) and 13 (b) batches filtration.
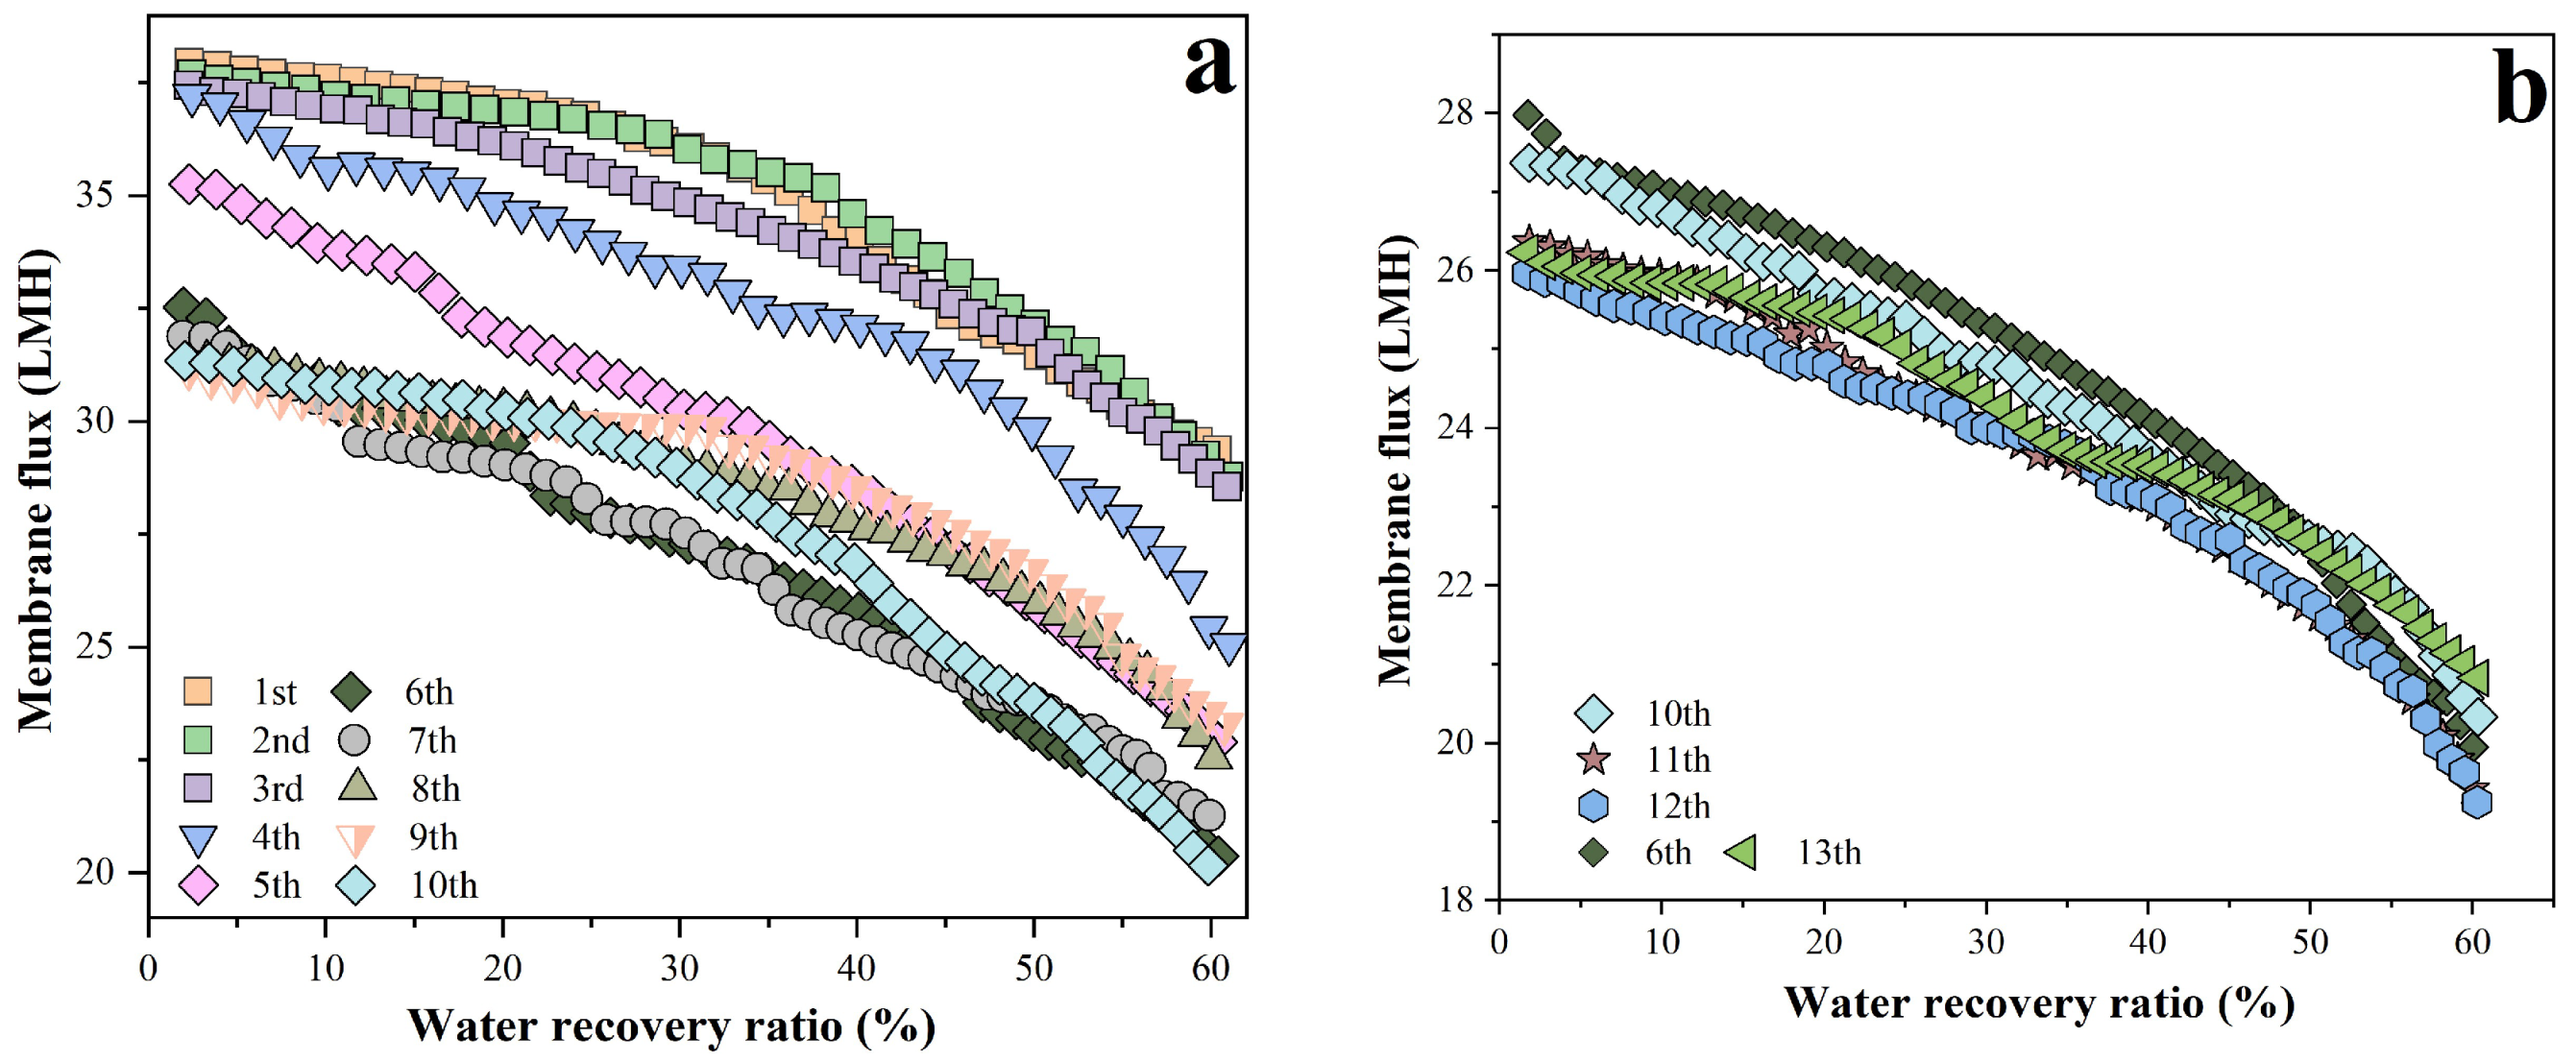
Figure 3.
RO membrane flux variation under different single cleaning methods.
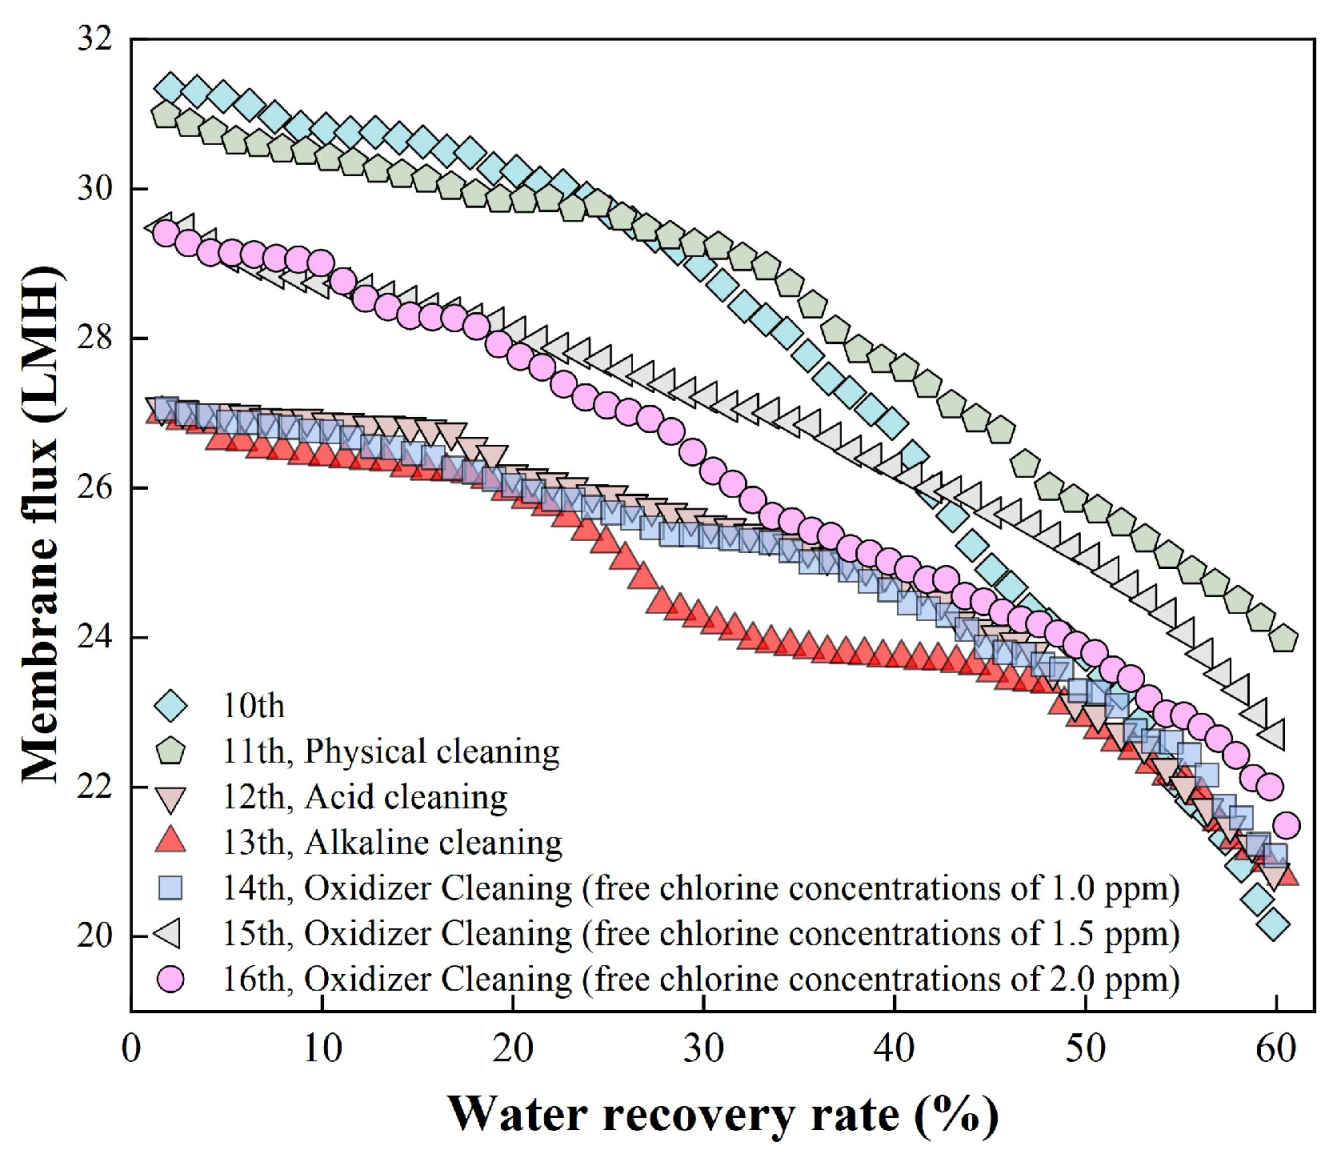
Figure 4.
Pure water flux at different TMP of new, fouled and cleaned RO membrane via combined acid → alkaline forward flushing.
Figure 4.
Pure water flux at different TMP of new, fouled and cleaned RO membrane via combined acid → alkaline forward flushing.
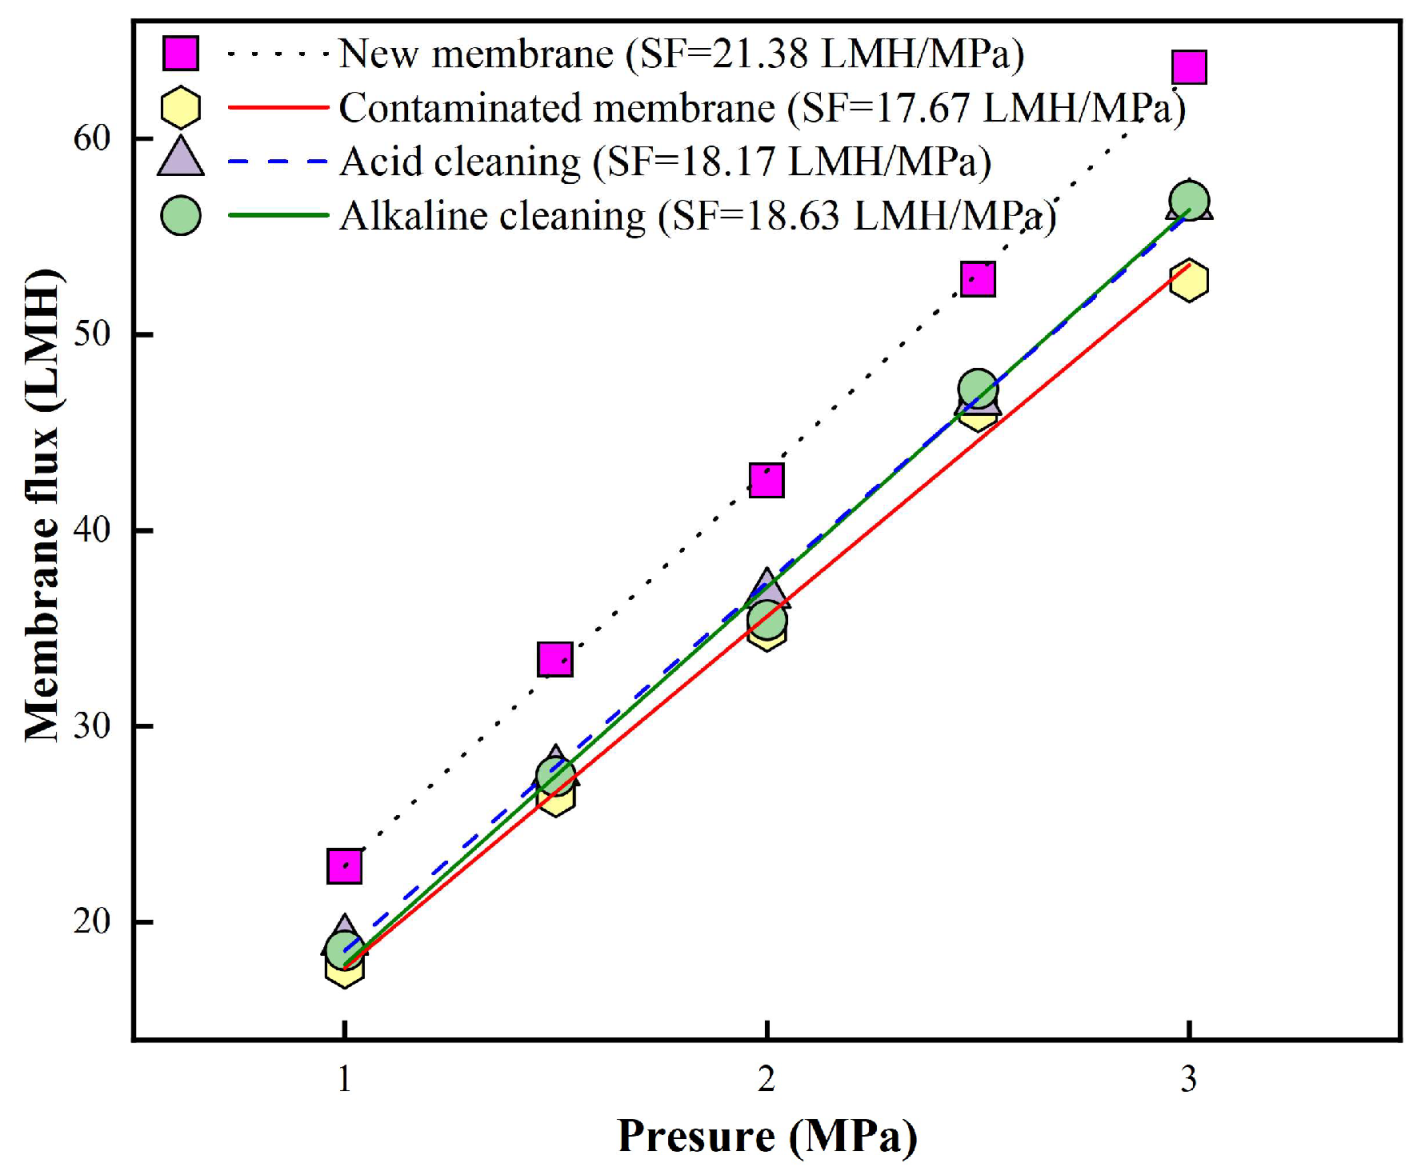
Figure 5.
Pure water flux at different TMP of new, fouled and cleaned RO membrane via combined acid → alkaline forward flushing and pure water backwashing.
Figure 5.
Pure water flux at different TMP of new, fouled and cleaned RO membrane via combined acid → alkaline forward flushing and pure water backwashing.
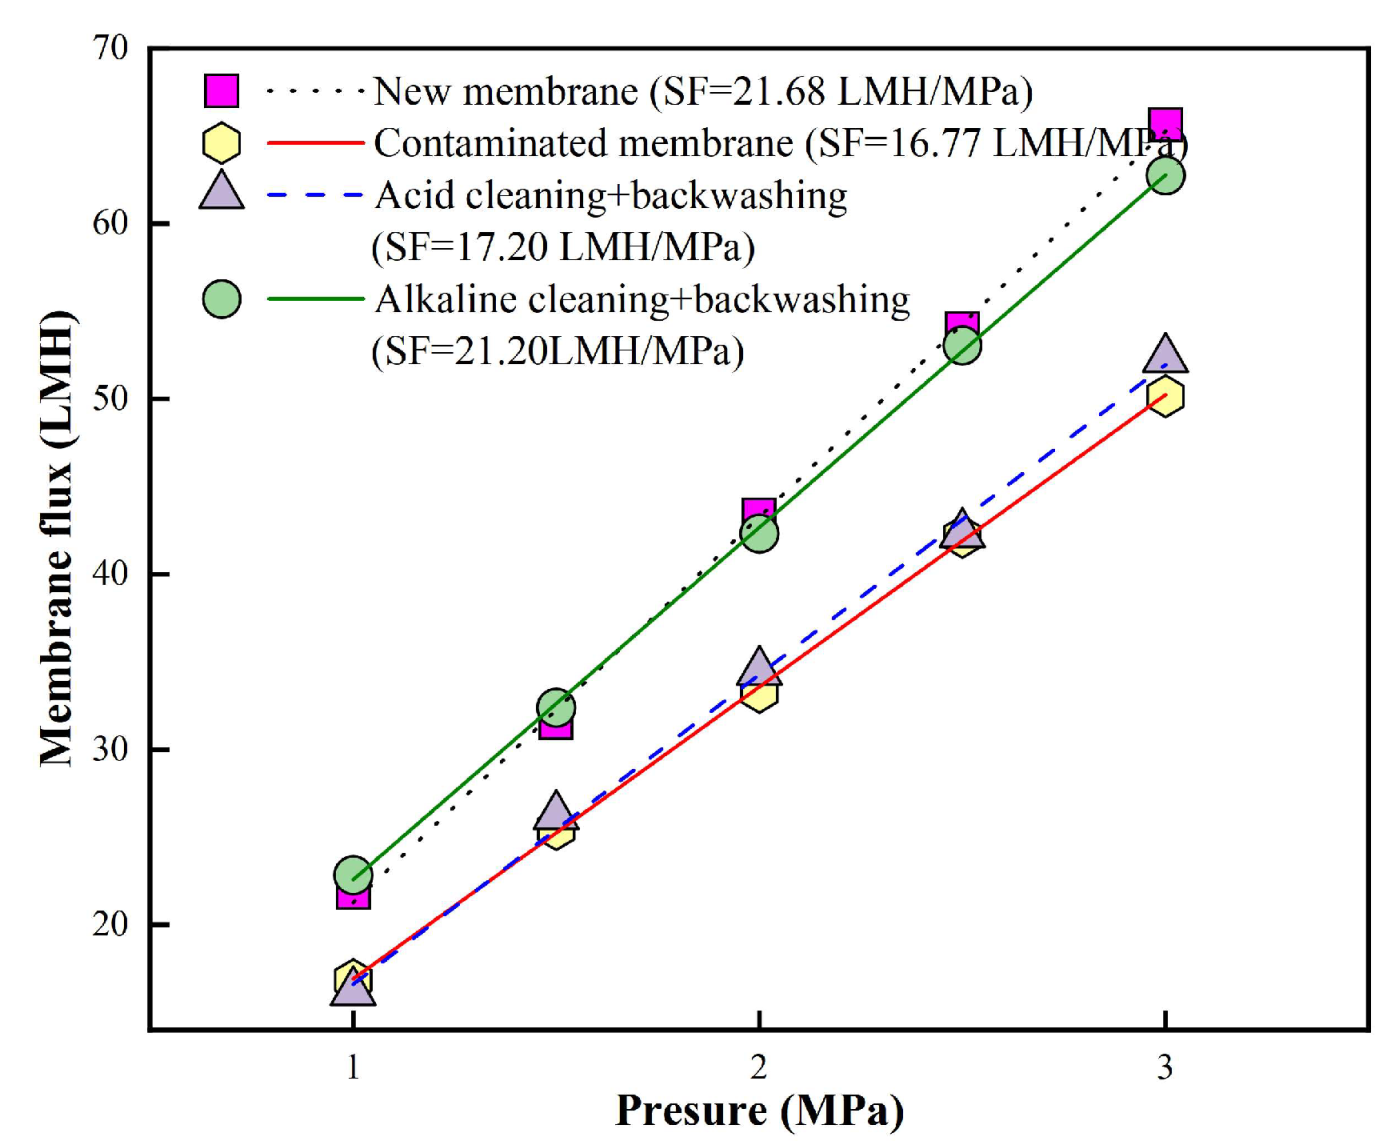
Figure 6.
Fluorescence spectra of backwashing effluent after acid cleaning (a) and alkaline cleaning (b).
Figure 6.
Fluorescence spectra of backwashing effluent after acid cleaning (a) and alkaline cleaning (b).
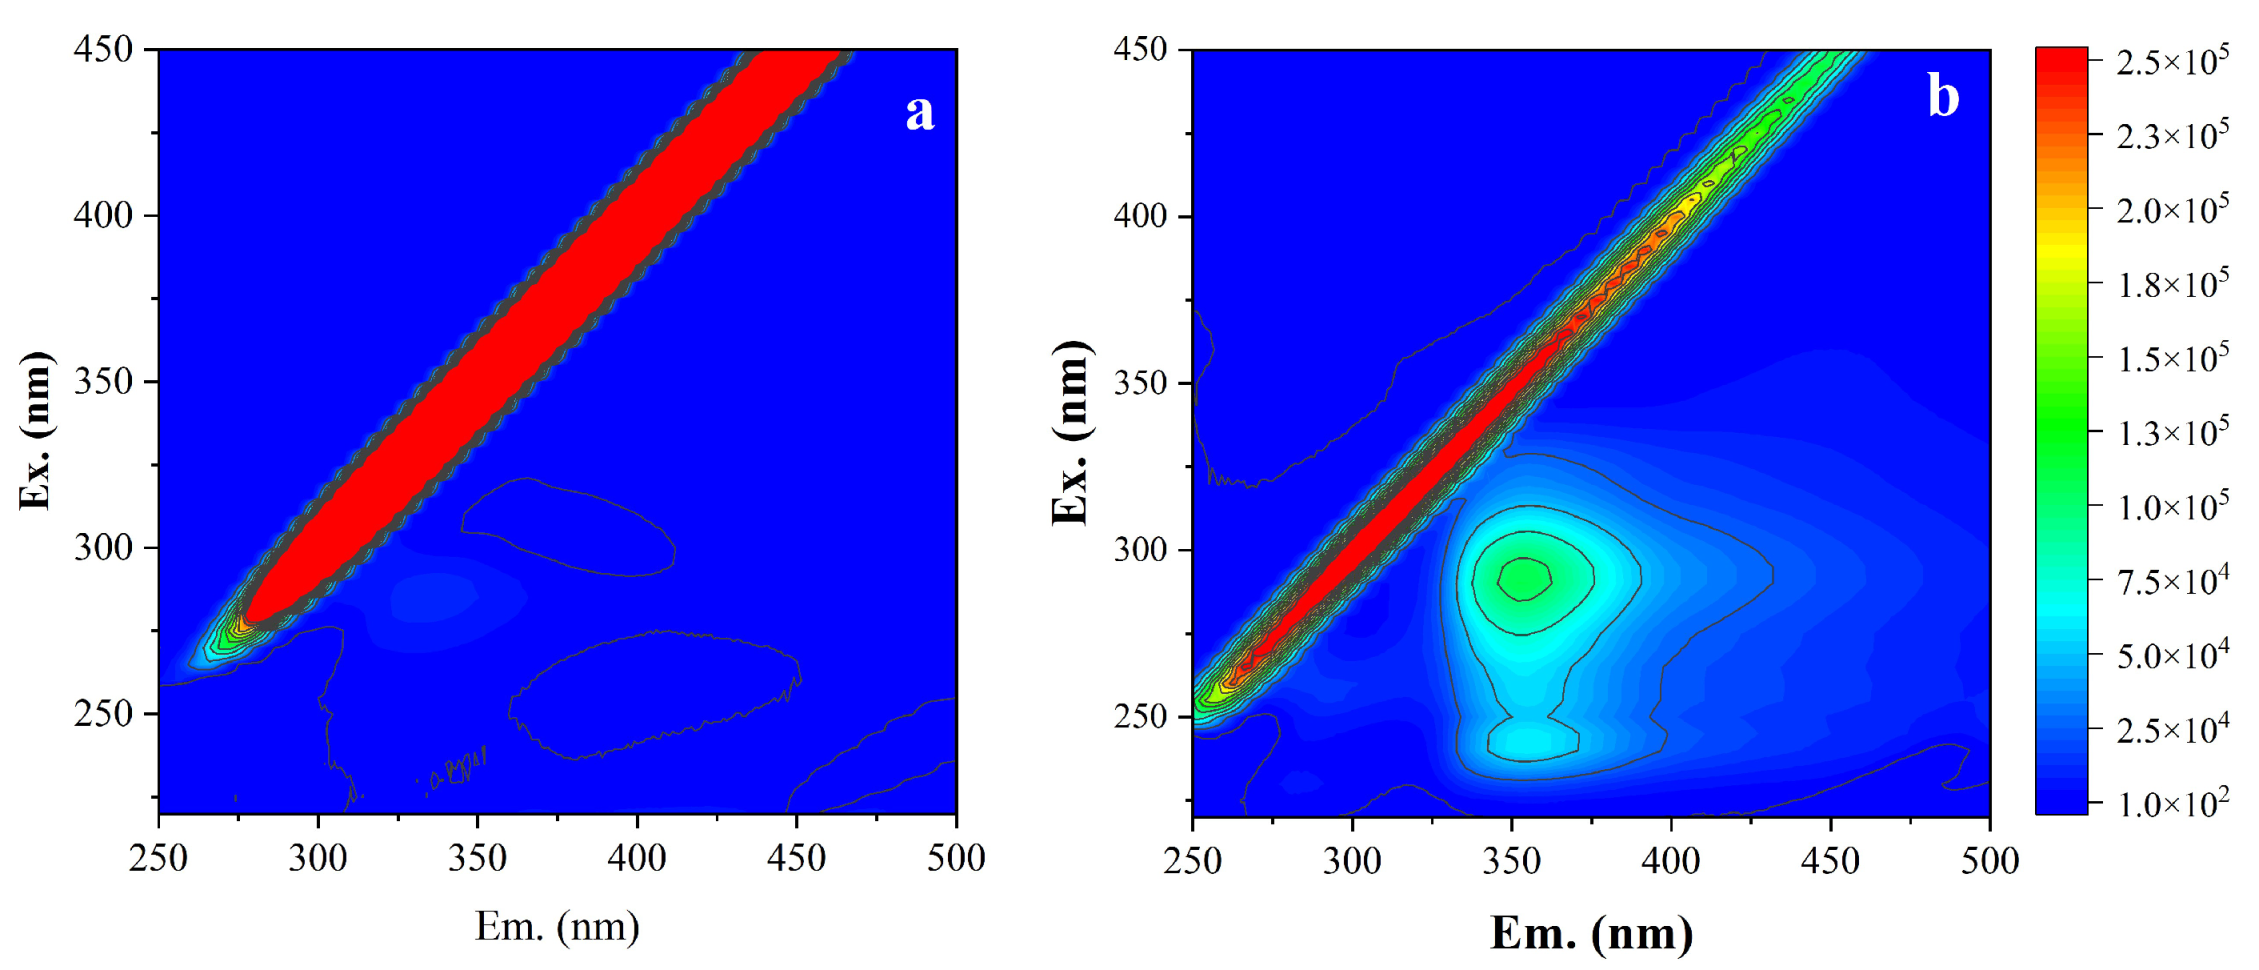
Figure 7.
Fluorescence spectra of RO membrane effluent from the 6th batch (a) and after backwashing at TMP 0.5 MPa and CFV 1.5 m/s (b).
Figure 7.
Fluorescence spectra of RO membrane effluent from the 6th batch (a) and after backwashing at TMP 0.5 MPa and CFV 1.5 m/s (b).
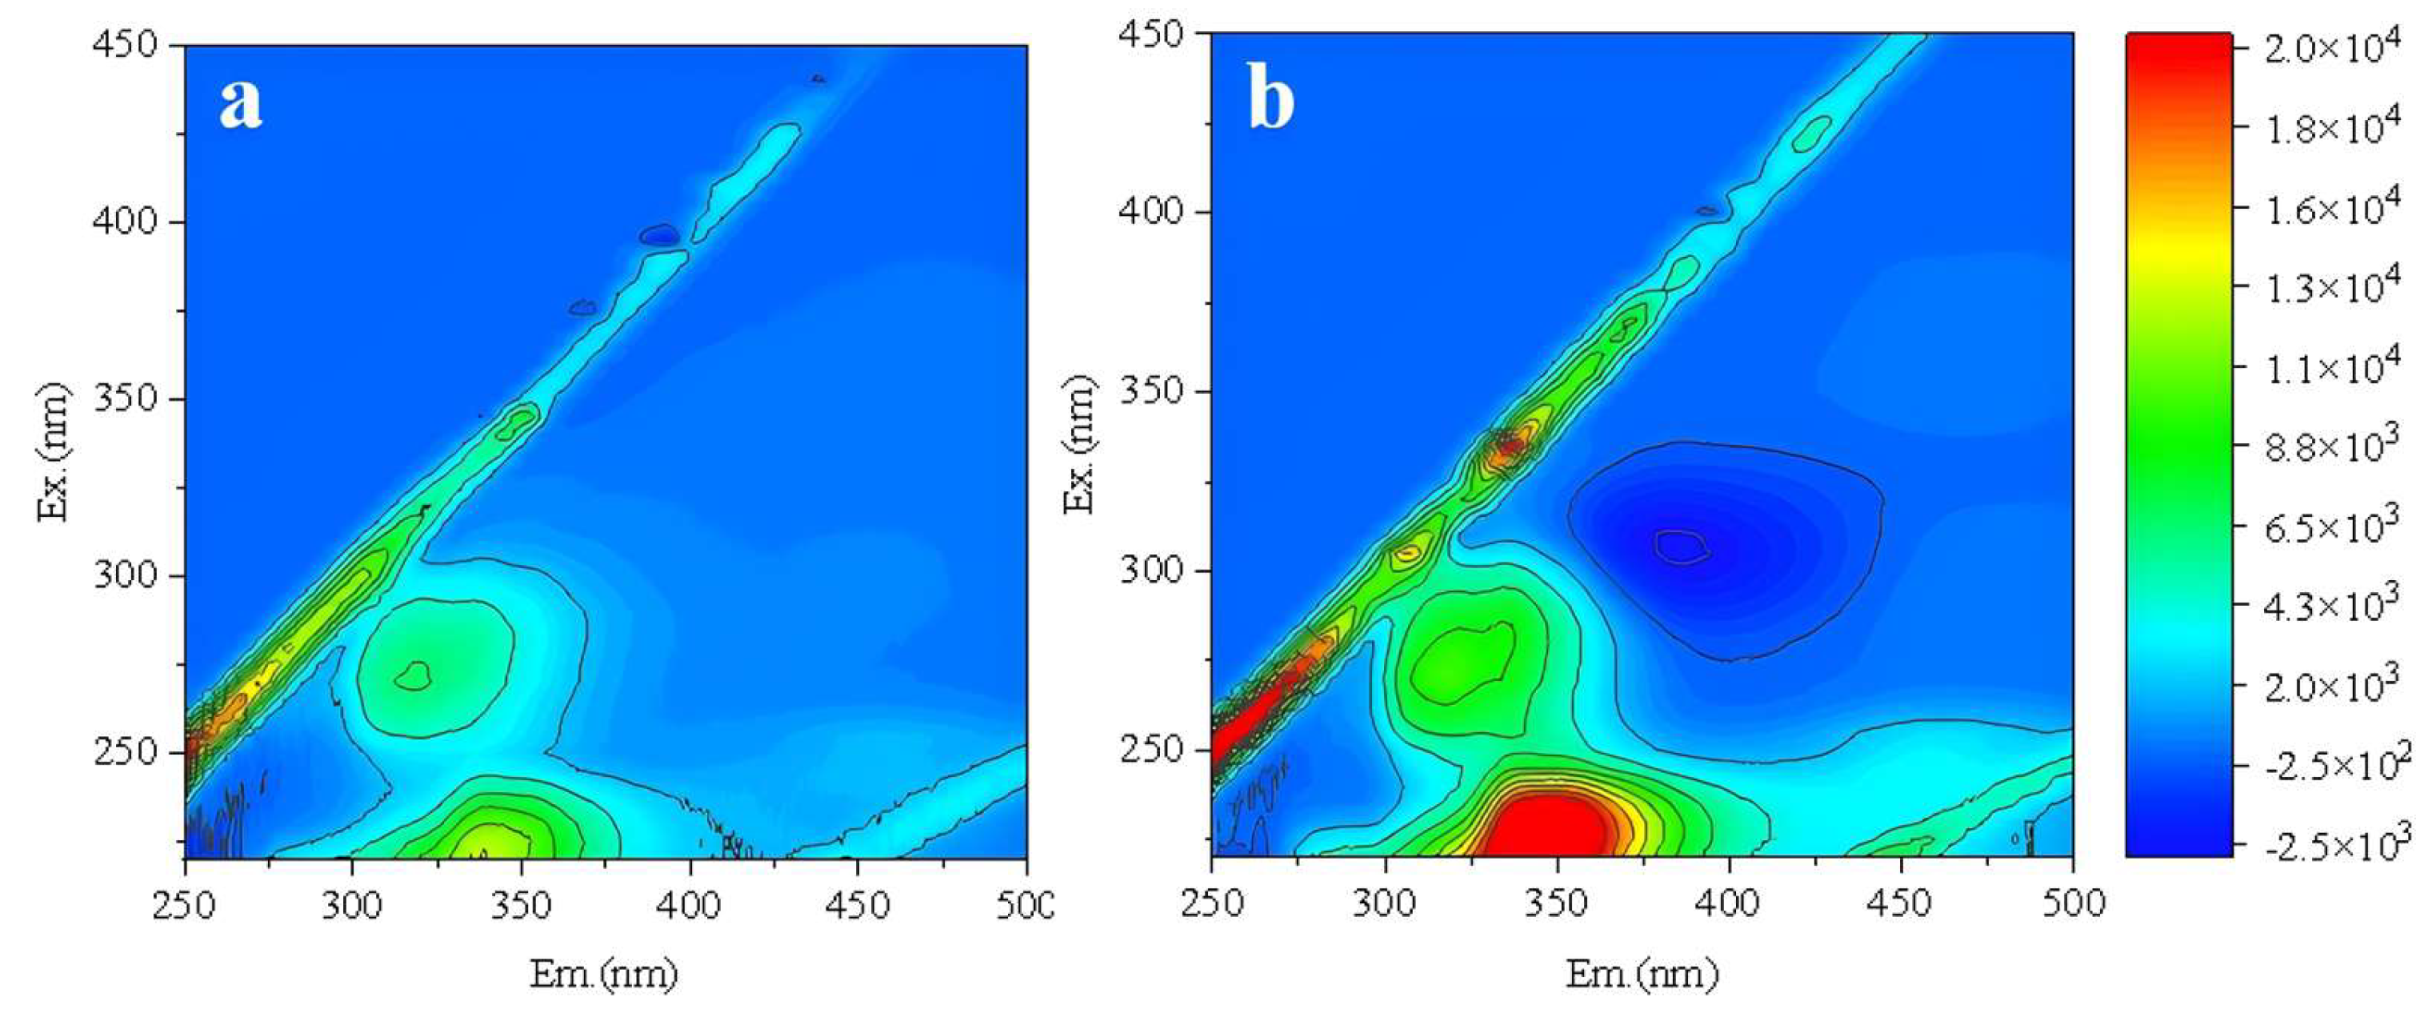
Figure 8.
Fluorescence spectra of new RO membrane effluent without backwashing (a) and with backwashing TMP of 0.5 MPa (b), 0.25 MPa (c), 0.125 MPa (d).
Figure 8.
Fluorescence spectra of new RO membrane effluent without backwashing (a) and with backwashing TMP of 0.5 MPa (b), 0.25 MPa (c), 0.125 MPa (d).
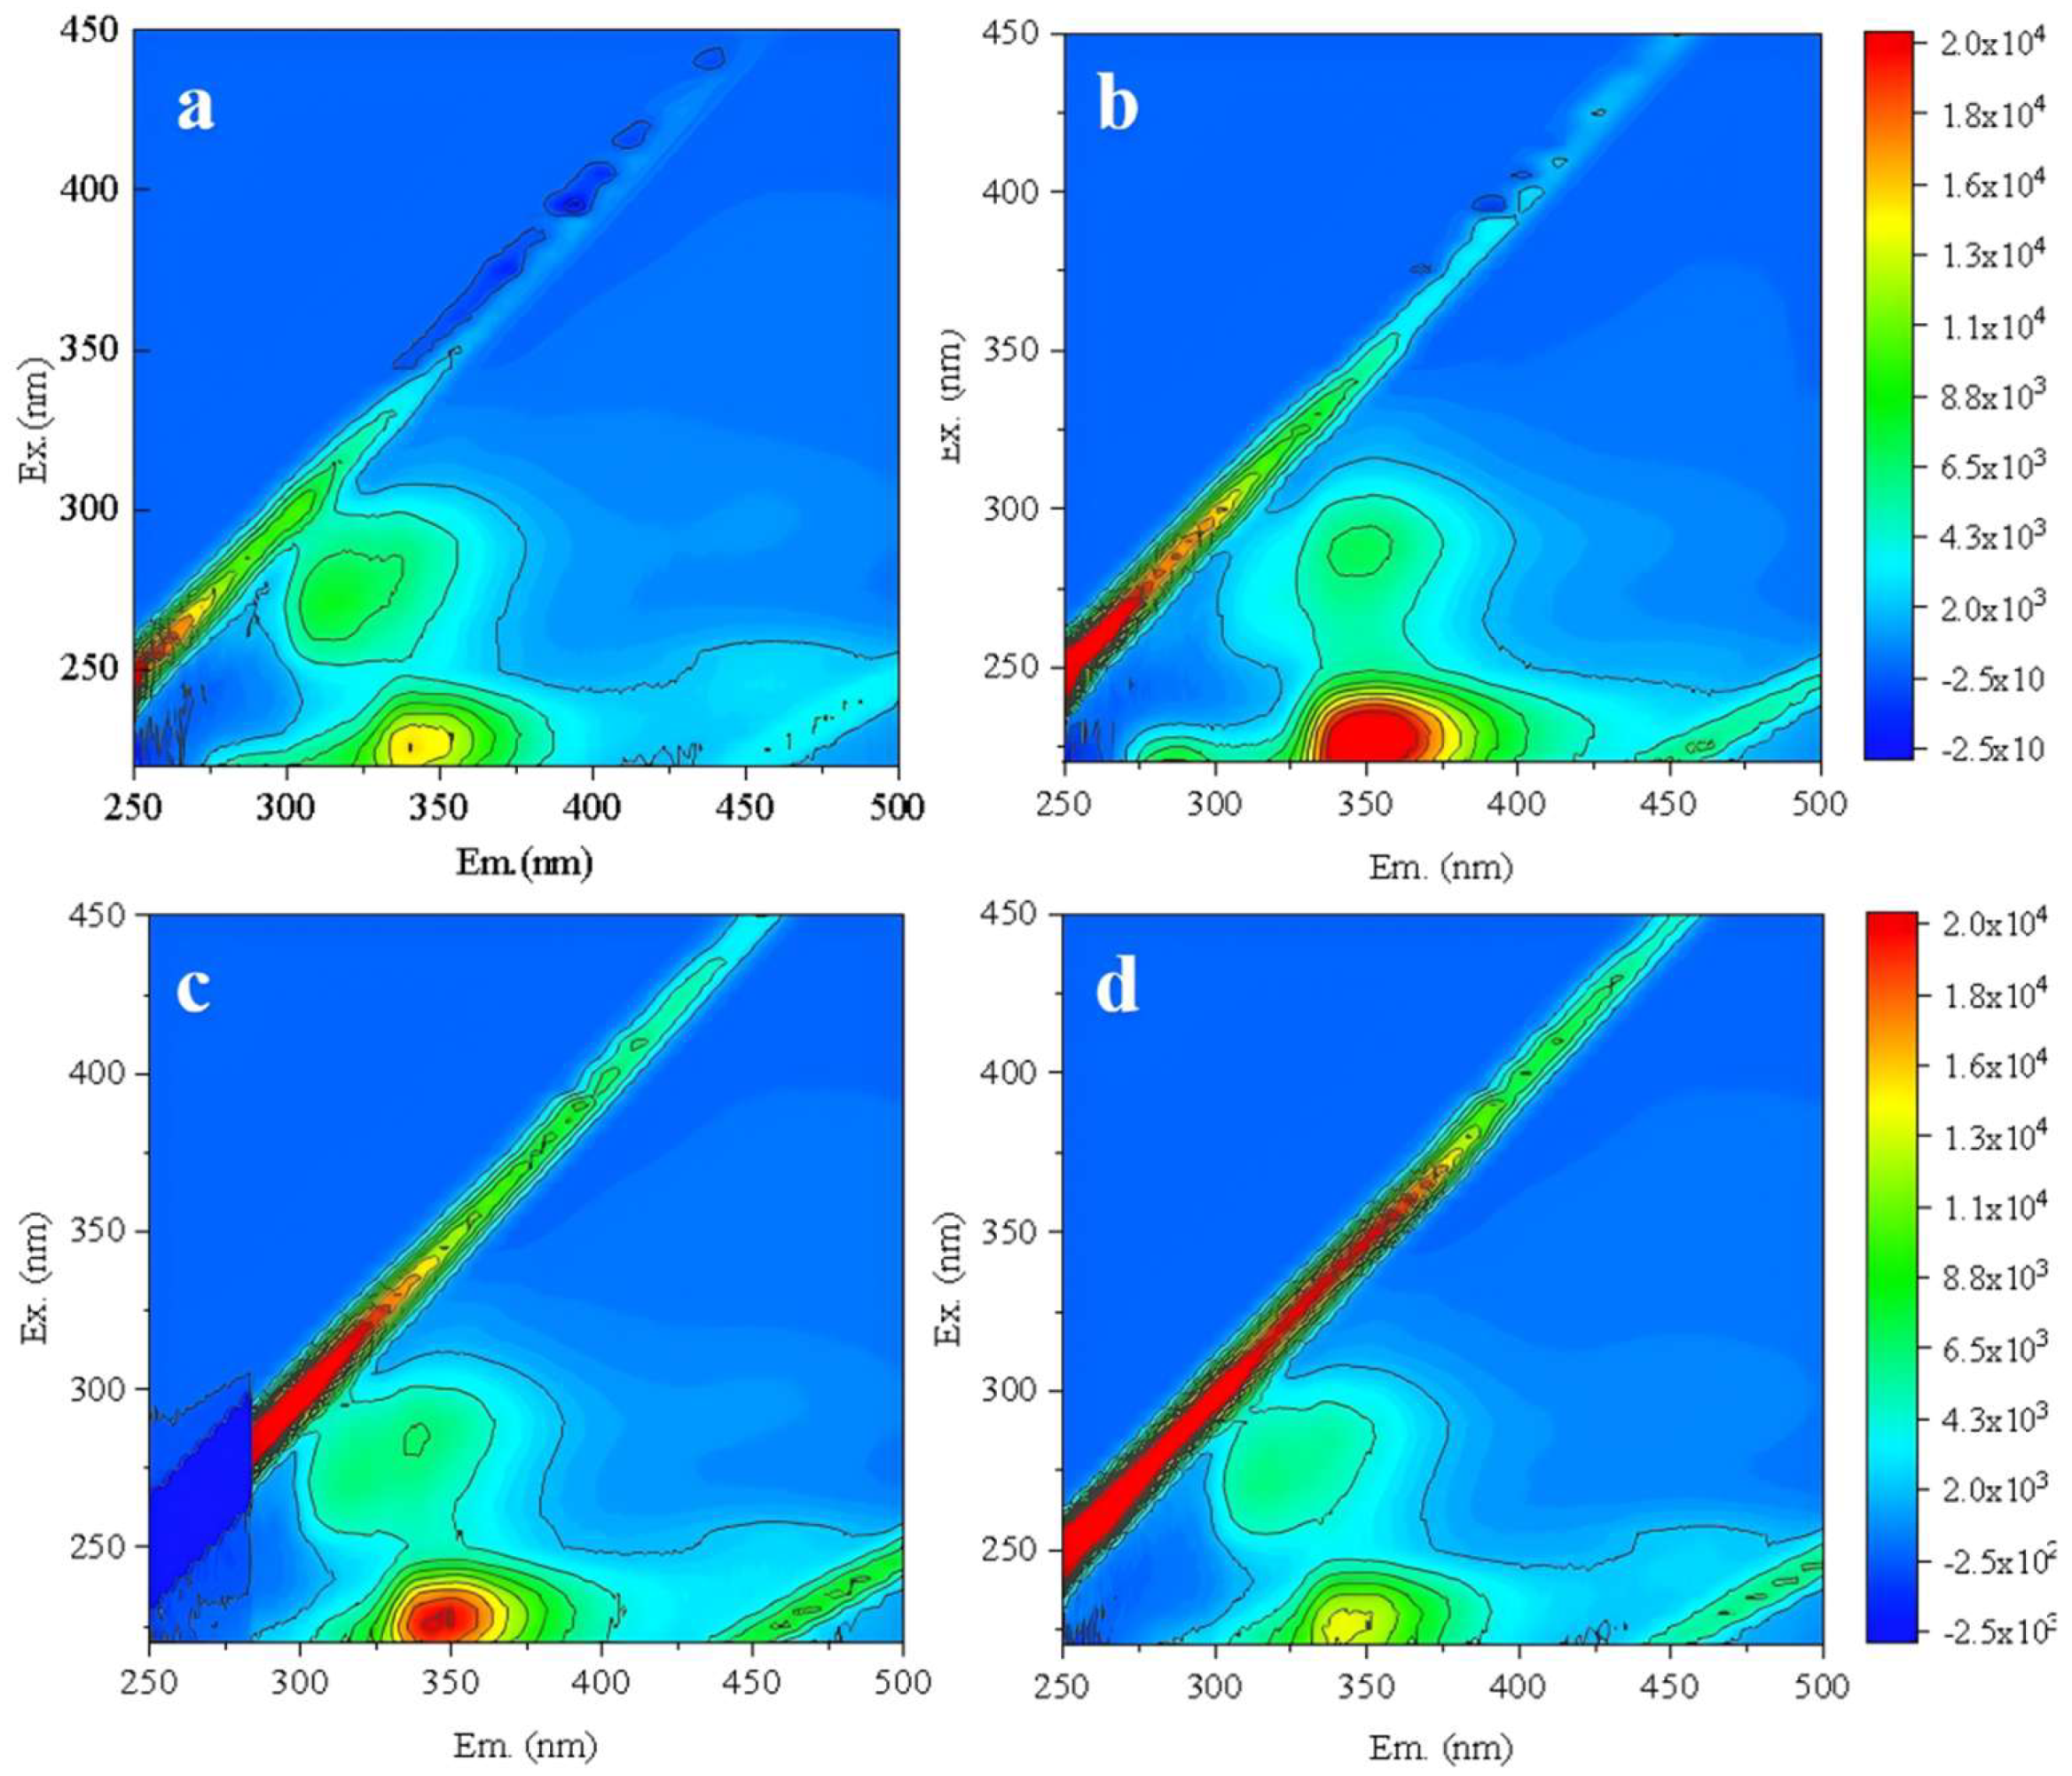
Figure 9.
Fluorescence spectra of new RO membrane effluent without backwashing (a) and with backwashing CFV of 1.5 m/s (b), 1 m/s (c), 0.5 m/s (d).
Figure 9.
Fluorescence spectra of new RO membrane effluent without backwashing (a) and with backwashing CFV of 1.5 m/s (b), 1 m/s (c), 0.5 m/s (d).
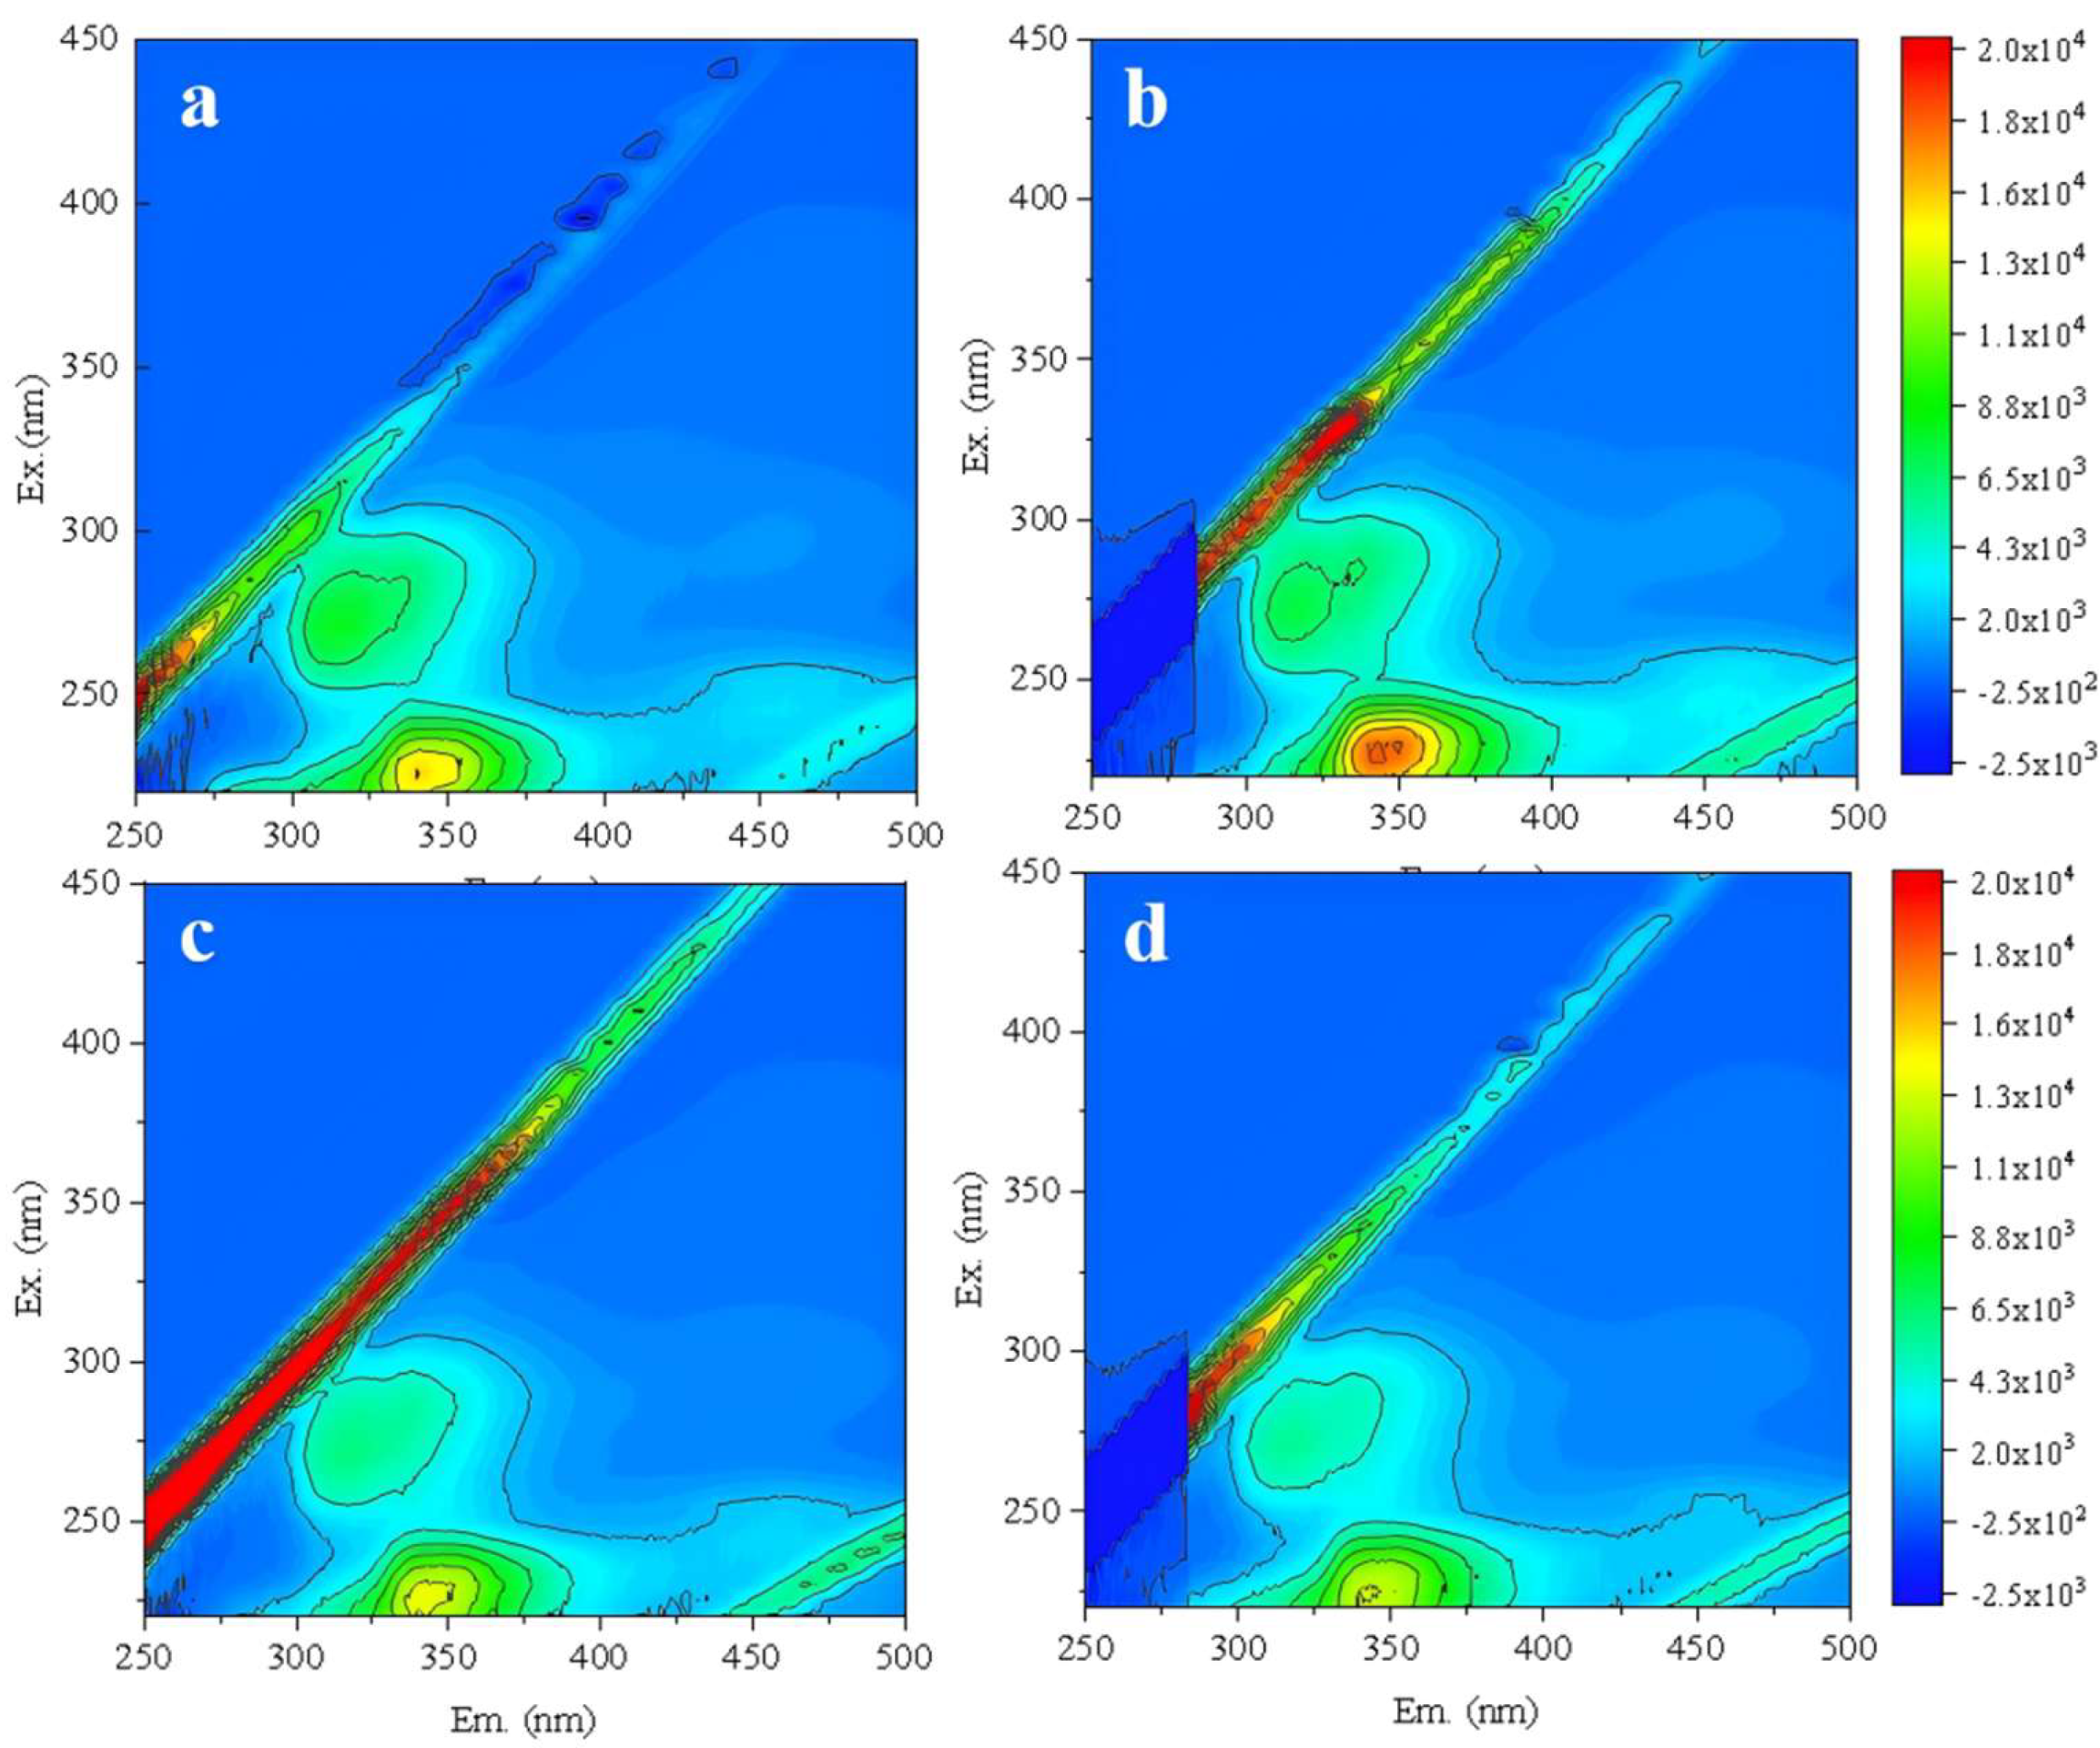
Figure 10.
Results from the optimal combined cleaning method including specific flux (a), fluorescence spectra of membrane effluent after 6 batches filtration (b) and after combined cleaning (c).
Figure 10.
Results from the optimal combined cleaning method including specific flux (a), fluorescence spectra of membrane effluent after 6 batches filtration (b) and after combined cleaning (c).
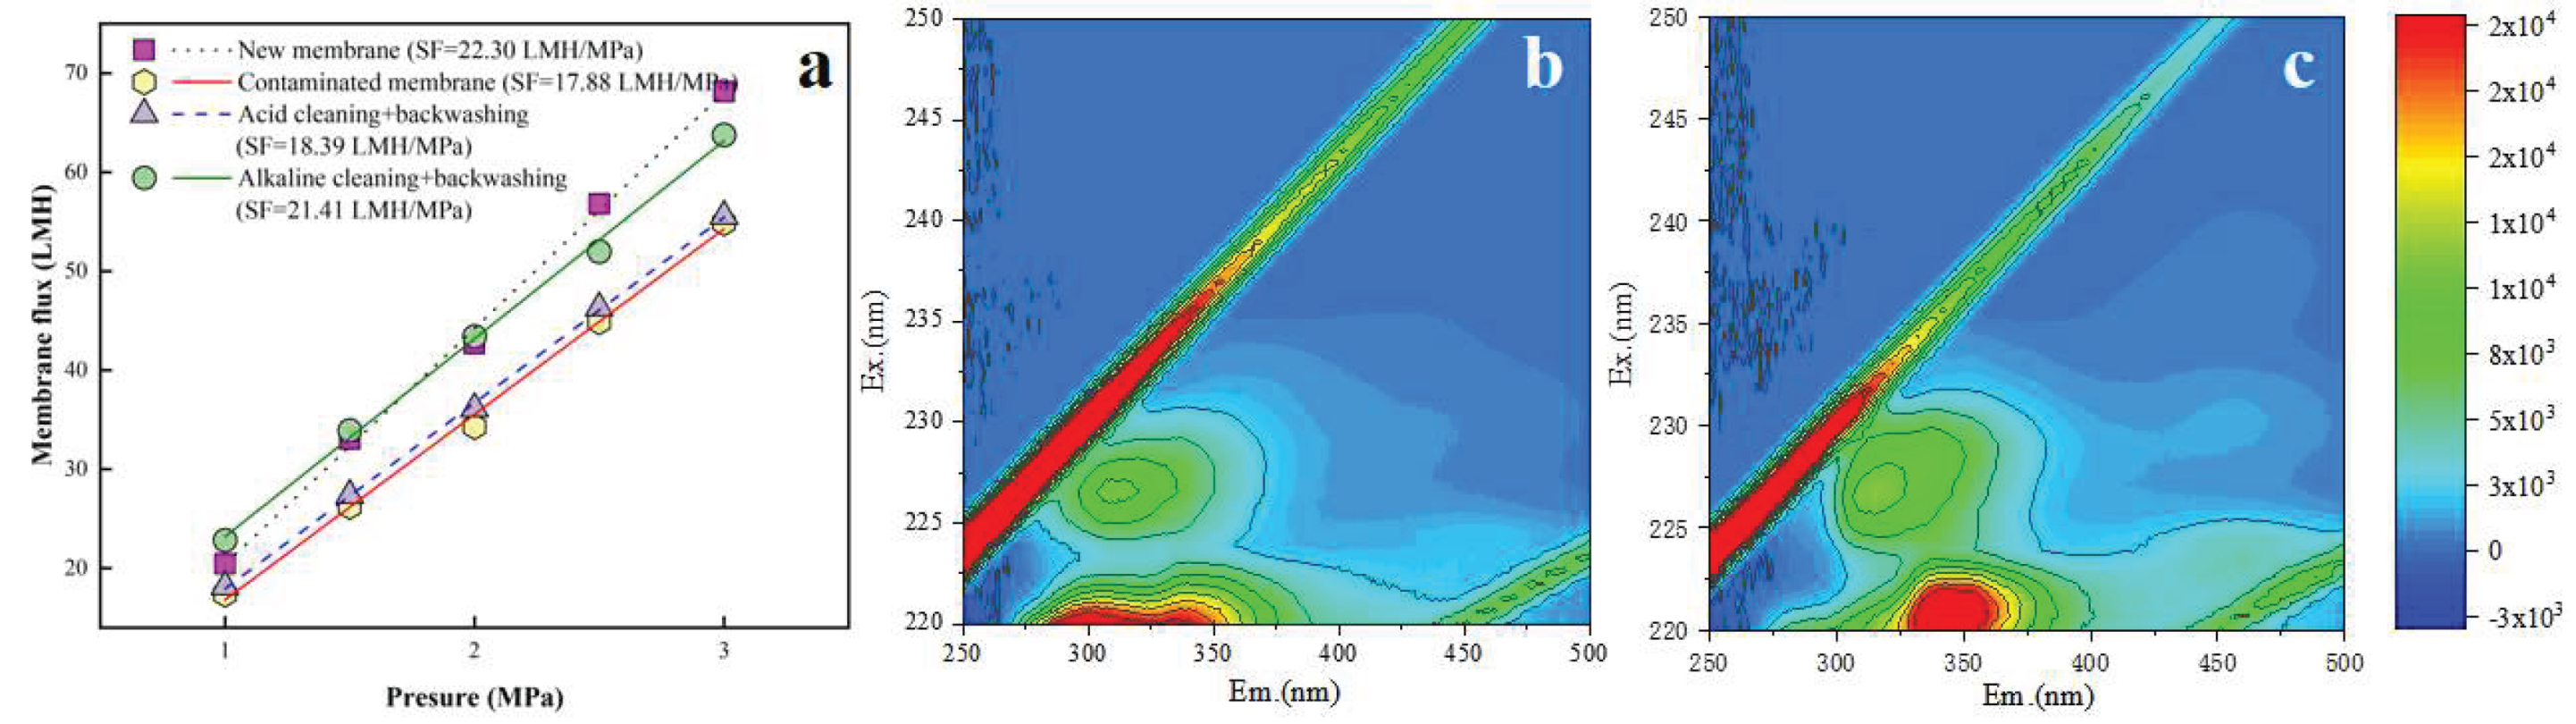

Table 1.
Table 1. MBR effluent quality and the TDFW reuse standard in China.
| Water type | pH |
COD (mg/L) |
TOC (mg/L) |
SS (mg/L) |
Chroma (dilution times) |
Fe (mg/L) |
Mn (mg/L) |
Total hardness as CaCO3 (mg/L) |
Conductivity (mS/cm) |
|
| MBR effluent | 8.52 | 80 | 12 | 0 | 95 | 0.27 | 0.06 | 422 | 8.82 | |
| Reuse water | 6.5–8.5 | ≤50 | - | ≤30 | ≤25 | ≤0.3 | ≤0.2 | ≤450 | ≤2.5 | |
Table 2.
Single forward flushing for fouled RO membrane cleaning.
| Cleaning types | Physical cleaning | Acid cleaning | Alkaline cleaning | Oxidizer cleaning |
| Cleaning solution | pure water | Nitric acid solution with a pH of 3.5 | Commercial alkaline cleaning agents with a mass concentration of approximately 0.5%, adjusted to a pH of 10.5 | Sodium hypochlorite solutions with effective chlorine concentration of 1.0, 1.5, and 2.0 mg/L, respectively |
| Operating conditions | CFV 1.5 m/s, 20 °C, 40-min circulating cleaning | CFV 1.0 m/s, 35 °C , 40-min circulating cleaning | CFV 1.0 m/s, 30 °C , 40-min circulating cleaning | |
Table 3.
Table 3. Combined forward flushing and backwashing for fouled RO membrane cleaning.
| Cleaning types | Acid → alkalineforward flushing(Plan 1) | Acid → alkalineforward flushing with pure water backwashing(Plan 2) | ||
| Cleaning solution | 1% citric acid, pH=2, 30±2 °C | 2% sodium tripolyphosphate, 1% EDTA, 0.3% NaOH, 0.02% sodium dodecylbenzenesulfonate,pH=11.5, 35±2 °C | 1% citric acid, pH=2, 30±2 °C | 2% sodium tripolyphosphate, 1% EDTA, 0.3% NaOH, 0.02% sodium dodecylbenzenesulfonate,pH=11.5, 35±2 °C |
| Operating conditions | Circulating the fouled membrane in a low-flow acid/alkaline flushing at CFV 0.75 m/s for 30/60 min with pH 2/11.5. Subsequently, halting the system and immersing the fouled membrane in an acid/alkaline solution for 1/2 h). Then restarting the system and circulating the membrane in a high-flow pure water flushing at CFV 1.5 m/s for 0.5/1 h. | Pure water backwashing for 40 min at 0.5 MPa, 20 °C and CFV 1.5 m/s serves as the subsequent step for each cleaning phase in Plan 1. | ||
Disclaimer/Publisher’s Note: The statements, opinions and data contained in all publications are solely those of the individual author(s) and contributor(s) and not of MDPI and/or the editor(s). MDPI and/or the editor(s) disclaim responsibility for any injury to people or property resulting from any ideas, methods, instructions or products referred to in the content. |
© 2025 by the authors. Licensee MDPI, Basel, Switzerland. This article is an open access article distributed under the terms and conditions of the Creative Commons Attribution (CC BY) license (http://creativecommons.org/licenses/by/4.0/).
Copyright: This open access article is published under a Creative Commons CC BY 4.0 license, which permit the free download, distribution, and reuse, provided that the author and preprint are cited in any reuse.


