Submitted:
14 November 2025
Posted:
14 November 2025
You are already at the latest version
Abstract
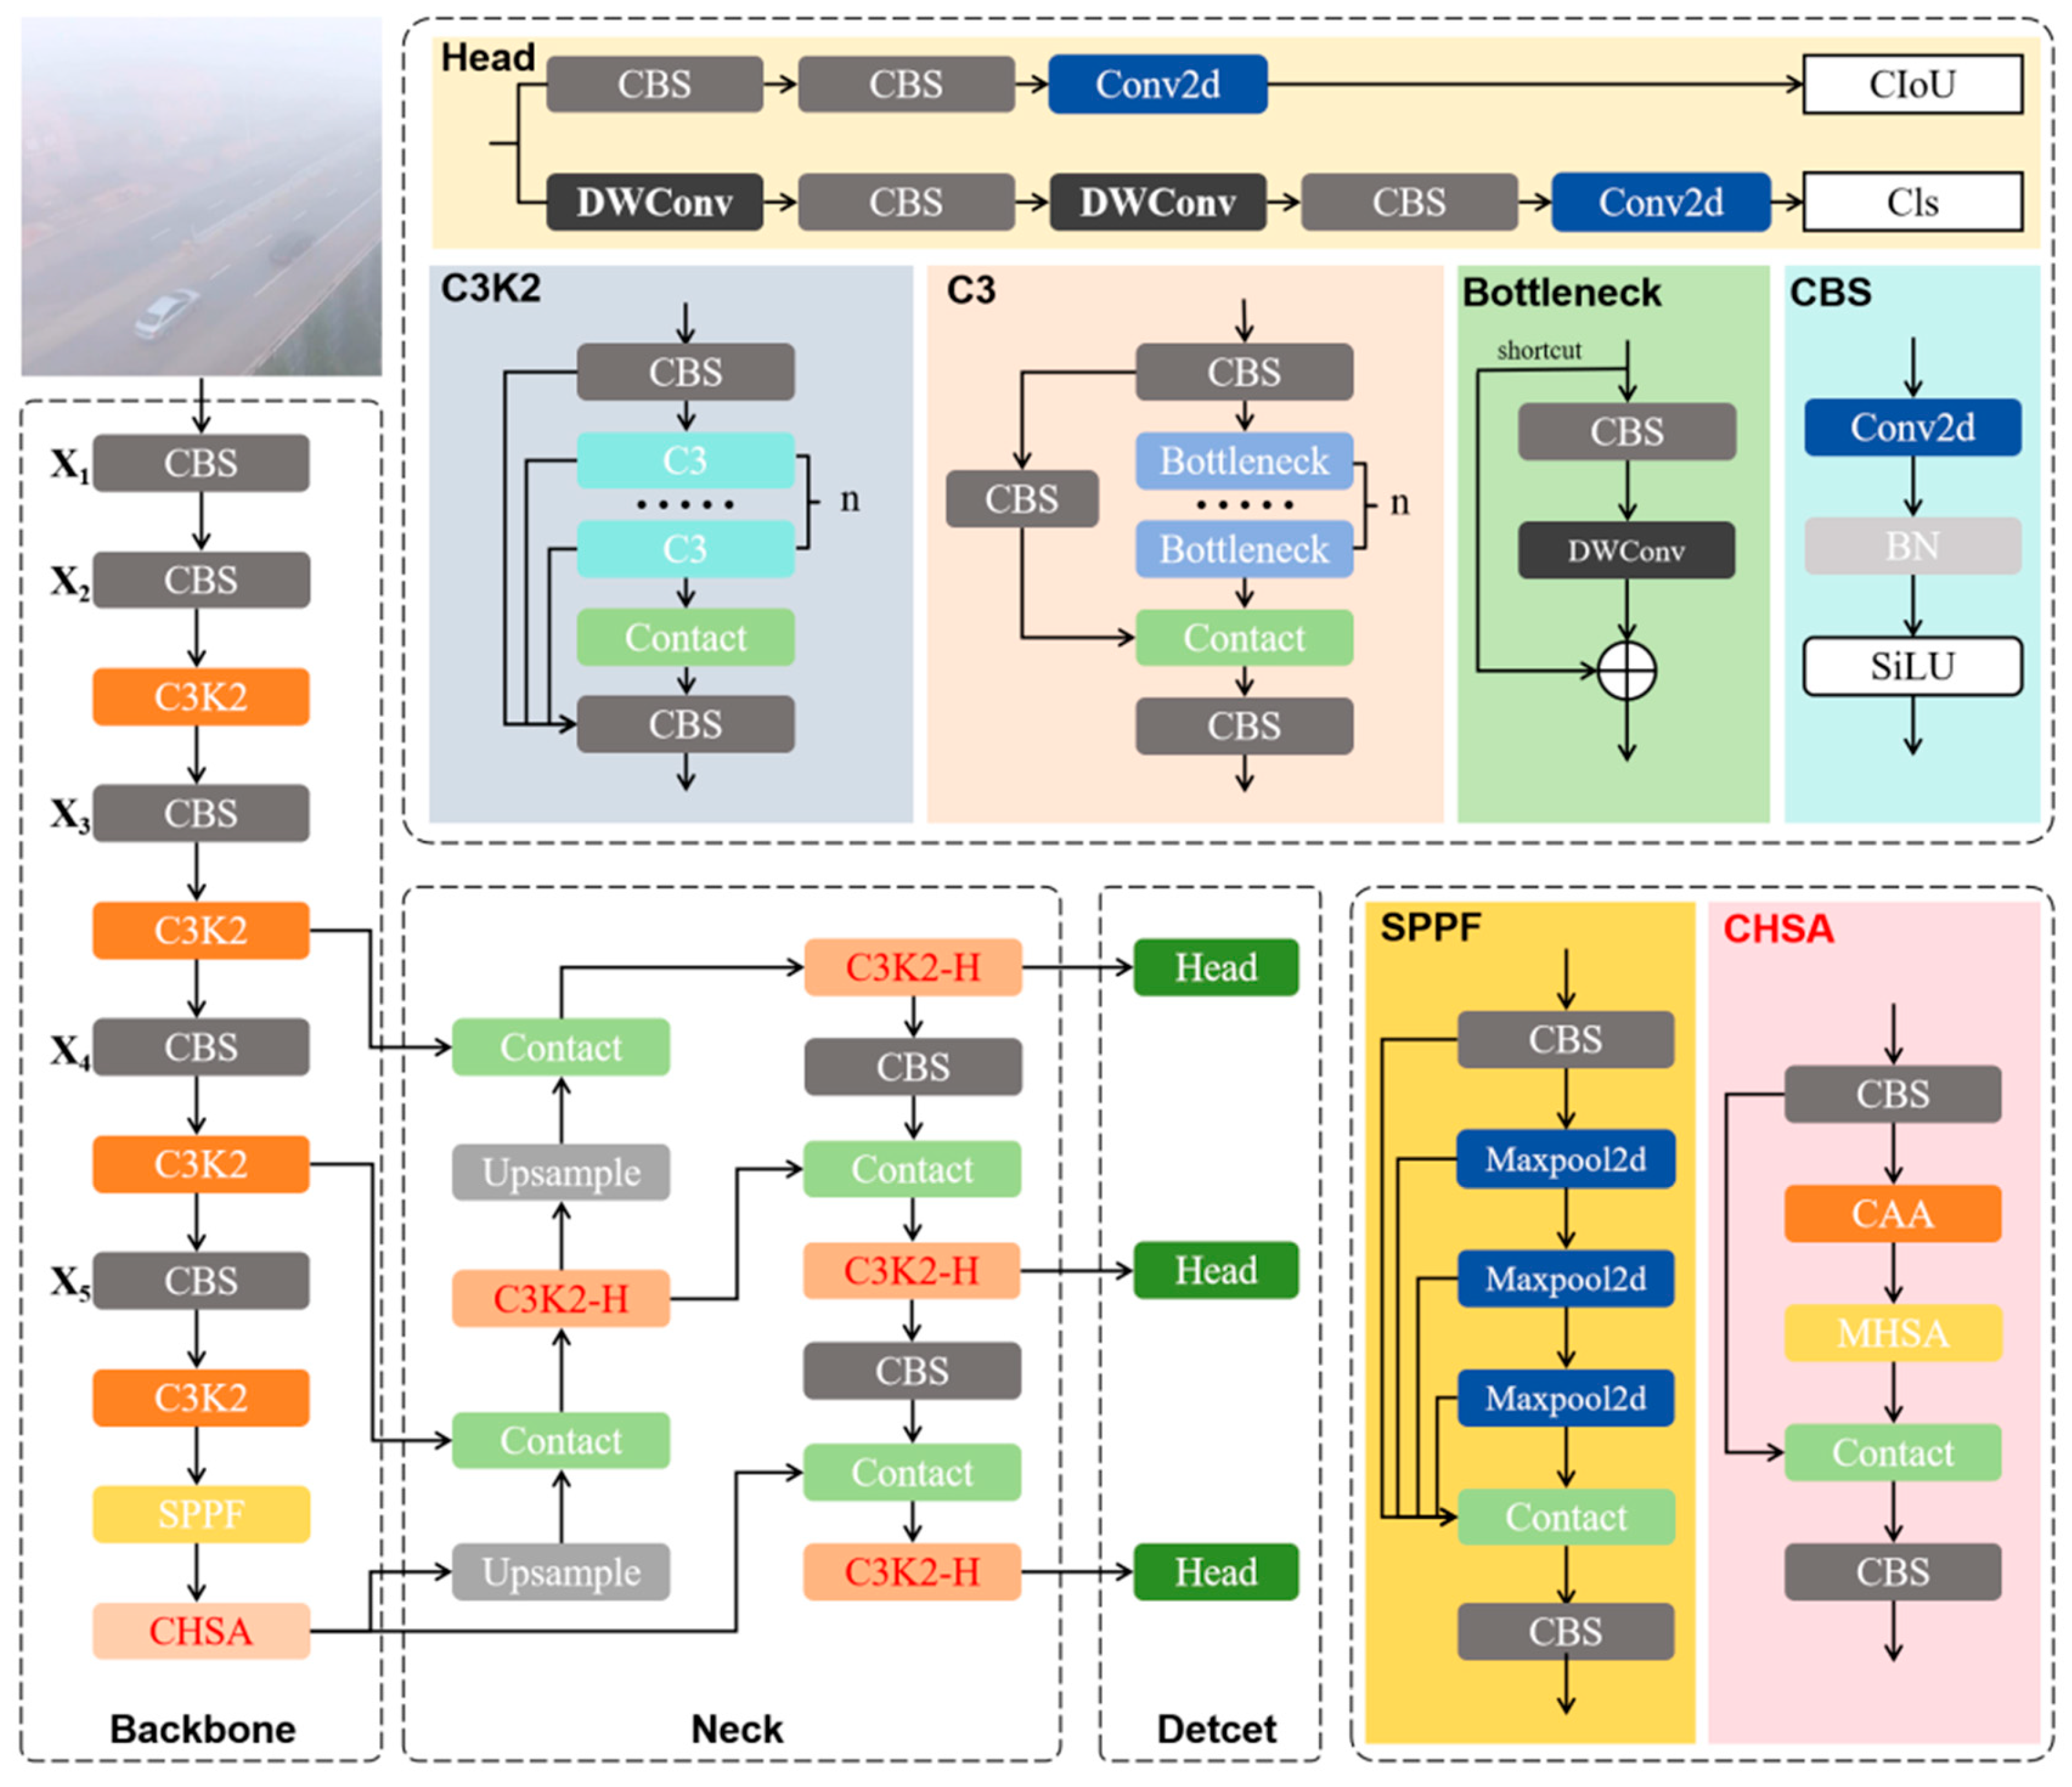
Foggy weather poses substantial challenges for unmanned aerial vehicle (UAV) object detection by severely degrading image contrast, obscuring object structures, and impairing small target recognition, often leading to significant performance deterioration in existing detection models. To address these issues, this work presents an enhanced YOLO11-based framework, called hazy aware-YOLO (HA-YOLO), which is specifically designed for robust UAV object detection in foggy weather. HA-YOLO incorporates wavelet convolution into its structure to suppress haze-induced noise and strengthen multi-scale feature fusion without introducing additional computational overhead. In addition, a novel context-enhanced hybrid self-attention (CEHSA) module is developed, which sequentially combines channel attention aggregation (CAA) and multi-head self-attention (MHSA) to simultaneously capture local contextual cues and mitigate global noise interference. Experimental results demonstrate that the proposed HA-YOLO and its variants achieve higher detection and precision with robustness compared to the baseline YOLO11, while maintaining model efficacy. In particular, in comparison with several state-of-the-art detectors, HA-YOLO exhibits a better balance between detection accuracy and complexity, offering a practical solution for real-time UAV perception tasks in adverse weather conditions.
Keywords:
1. Introduction
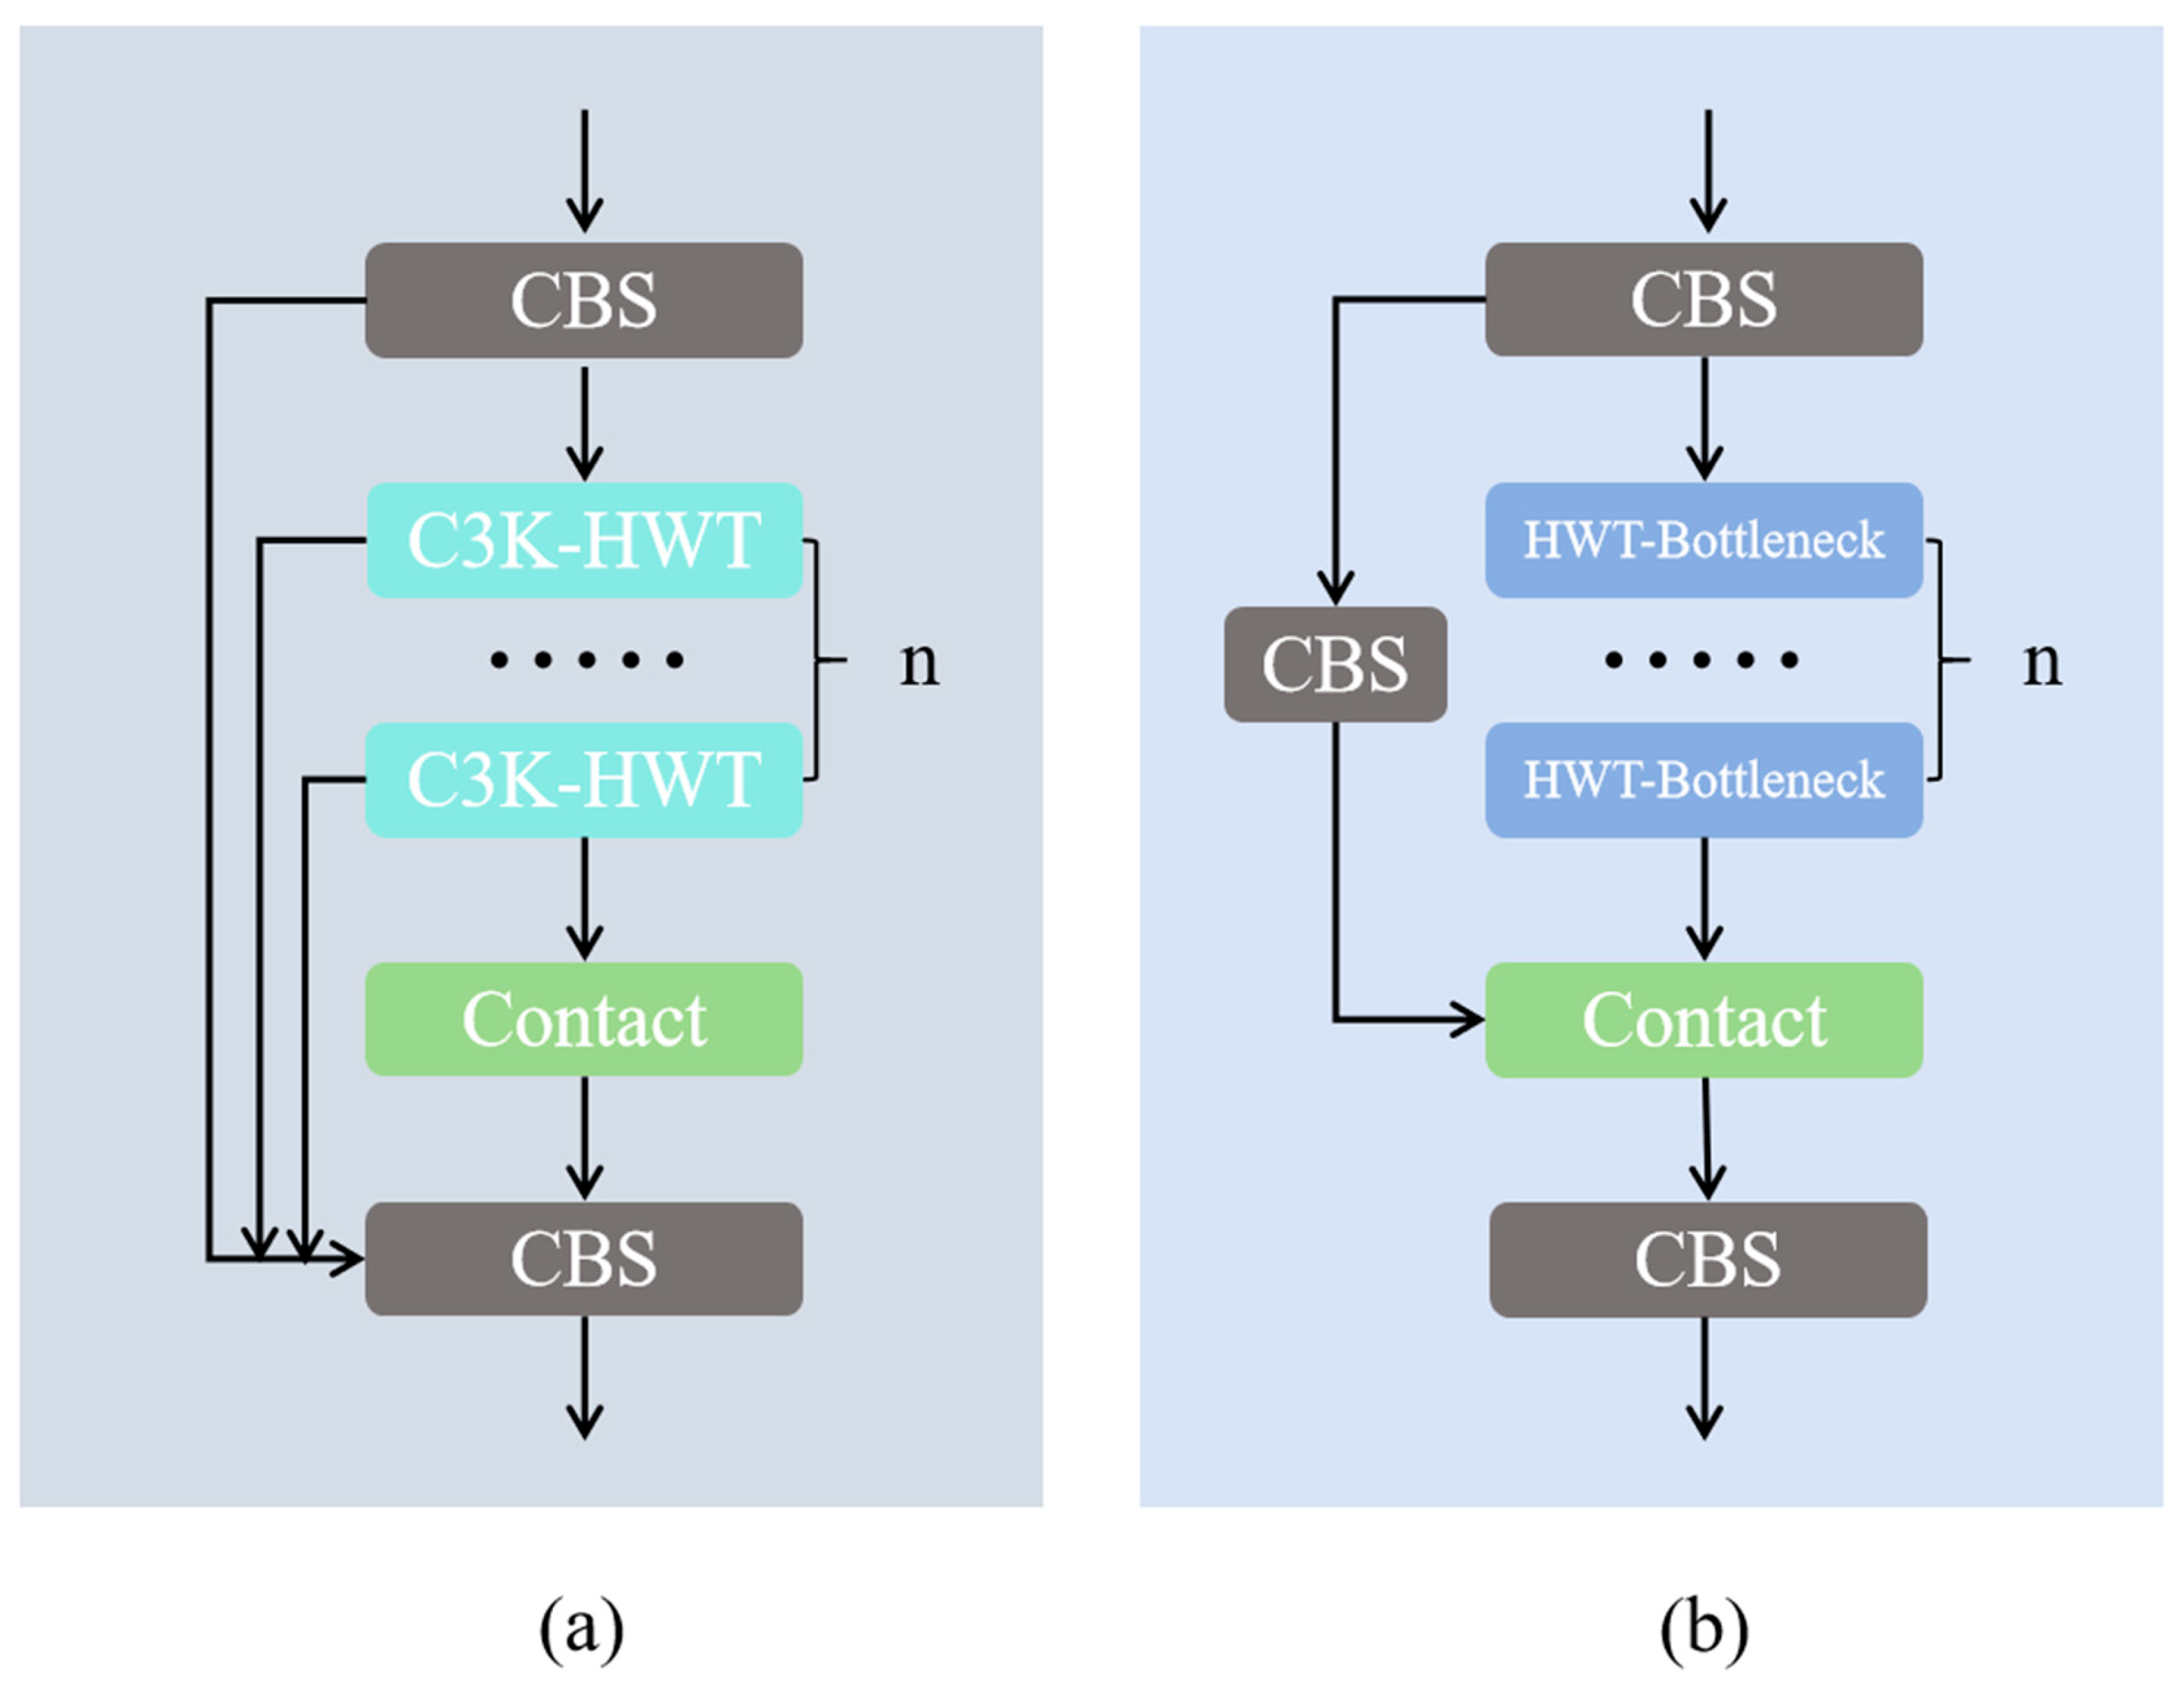
- C3K2-H module — a wavelet convolution-based feature enhancement module designed to emphasize local image details and suppress fog-induced feature degradation.
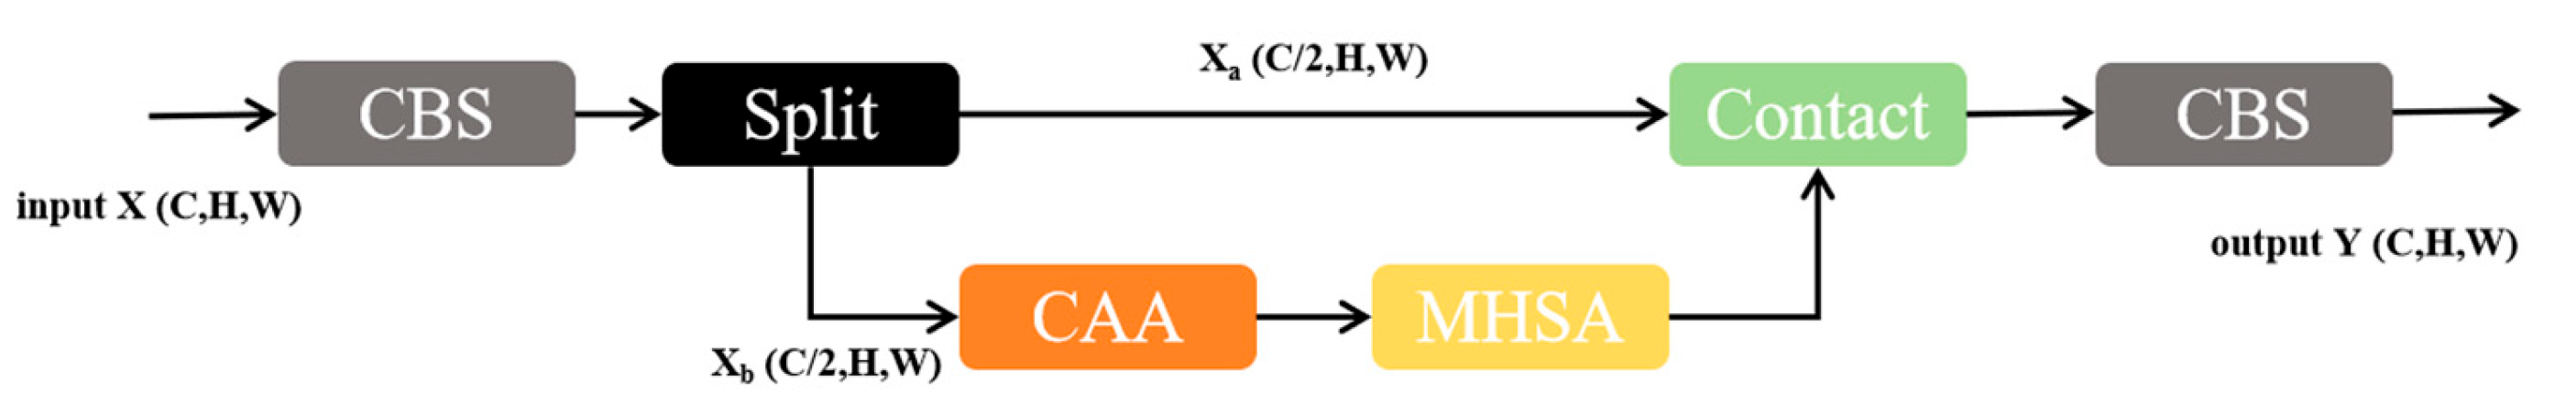
- CEHSA (Context-Enhanced Hybrid Self-Attention) module — a hybrid attention mechanism that sequentially integrates Context Anchor Attention (CAA) and Multi-Head Self-Attention (MHSA) to jointly capture local structural information and global semantic relationships, thereby improving the detection of various scales and blurred targets.
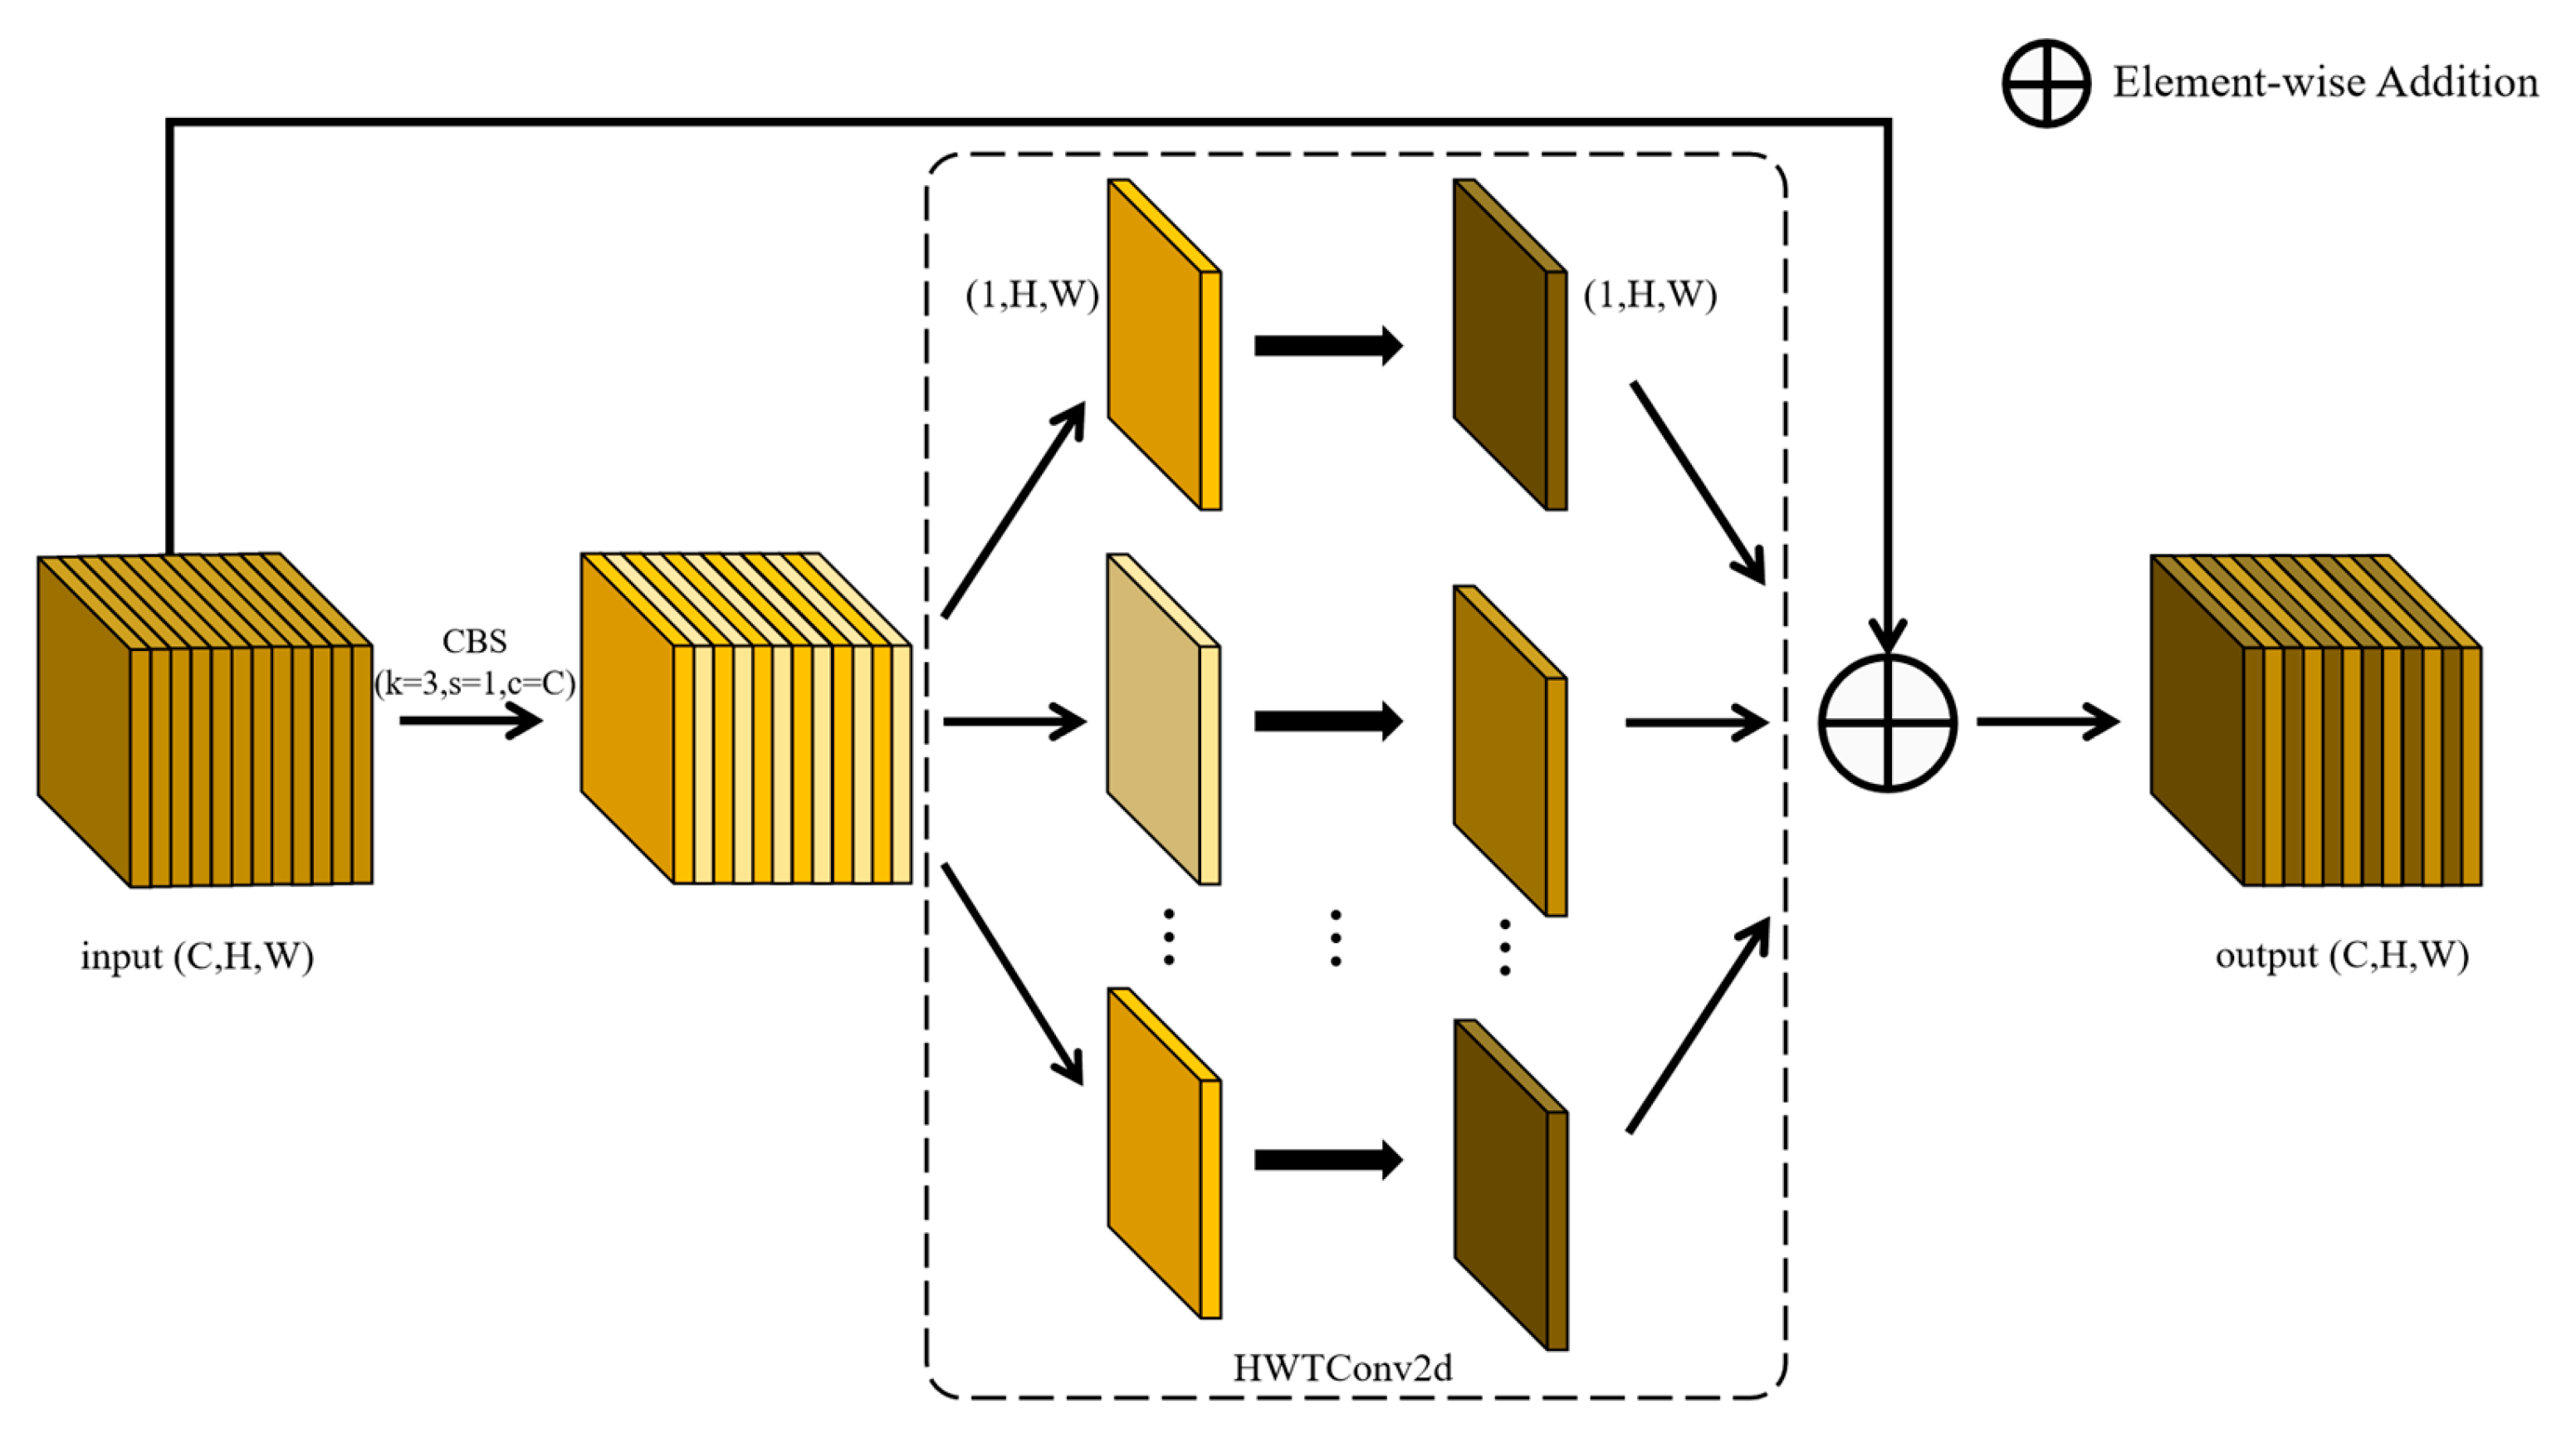
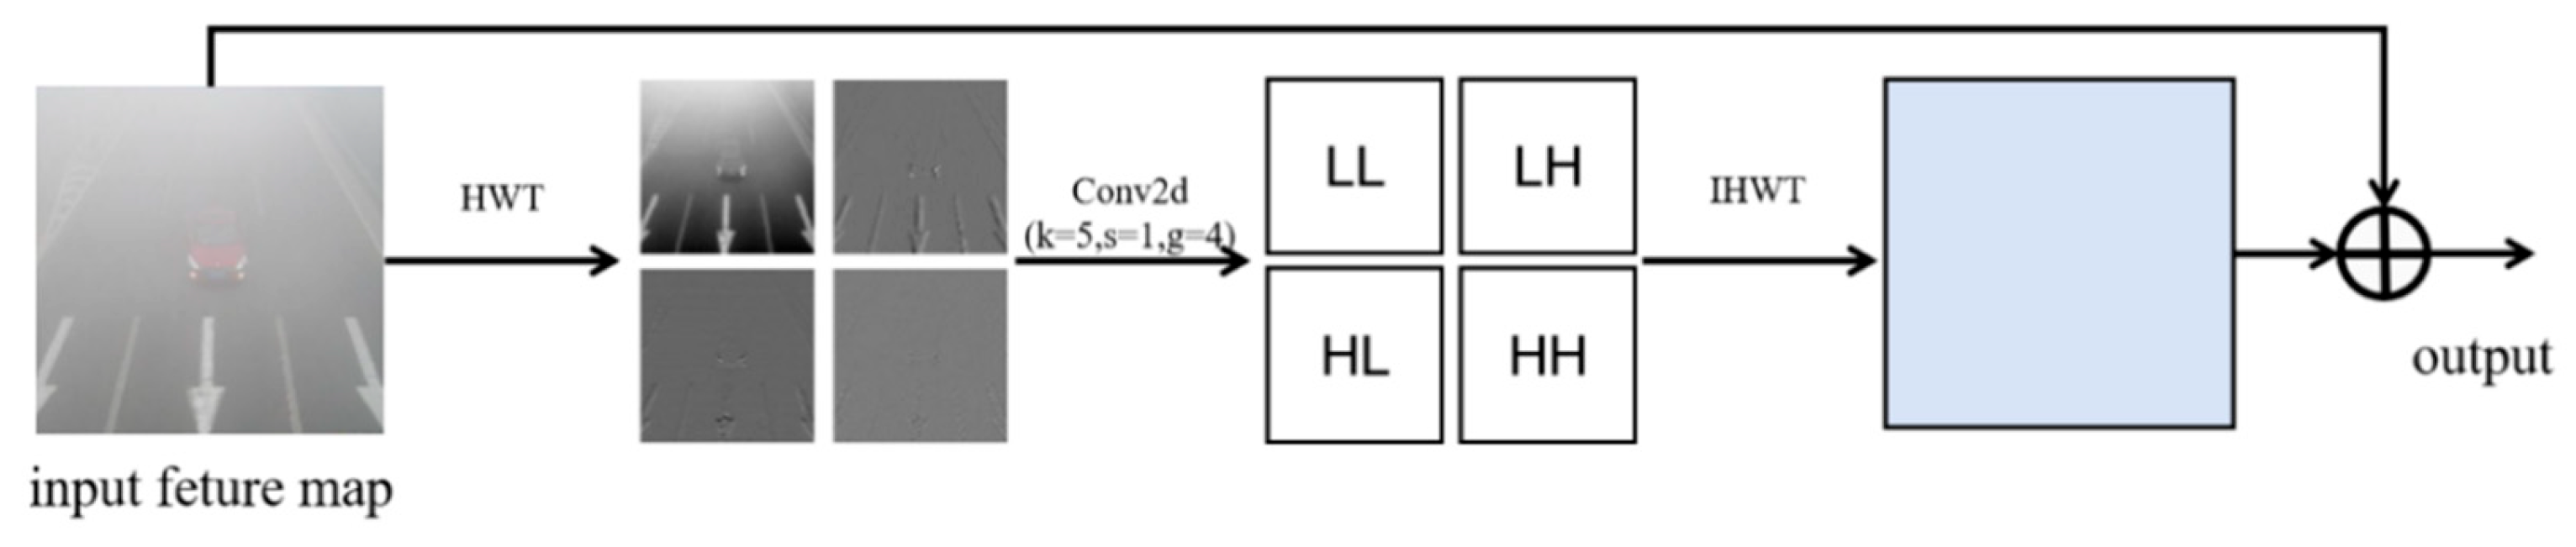
- A wavelet convolution-based feature enhancement module is developed to improve robustness against fog-induced degradation.
- A novel hybrid attention mechanism (CEHSA) is proposed to jointly enhance local detail extraction and global context modeling under foggy conditions.
- Comprehensive experiments demonstrate that HA-YOLO achieves state-of-the-art performance on challenging UAV foggy weather datasets, maintaining an optimal balance between detection accuracy and computational efficiency.
2. Related Work
2.1. UAV-Based Object Detection
2.2. Object Detection and Image Enhancement Algorithms in Foggy Conditions
2.3. Application of Attention Mechanism to Object Detection in Remote Sensing Images
3. Proposed Method
| Algorithm 1: HA-YOLO for UAV Foggy Target Detection |
| Input: |
|
|
Output:
|
|
|
|
|
|
|
3.1. C3K2-H Module
3.2. CEHSA Module
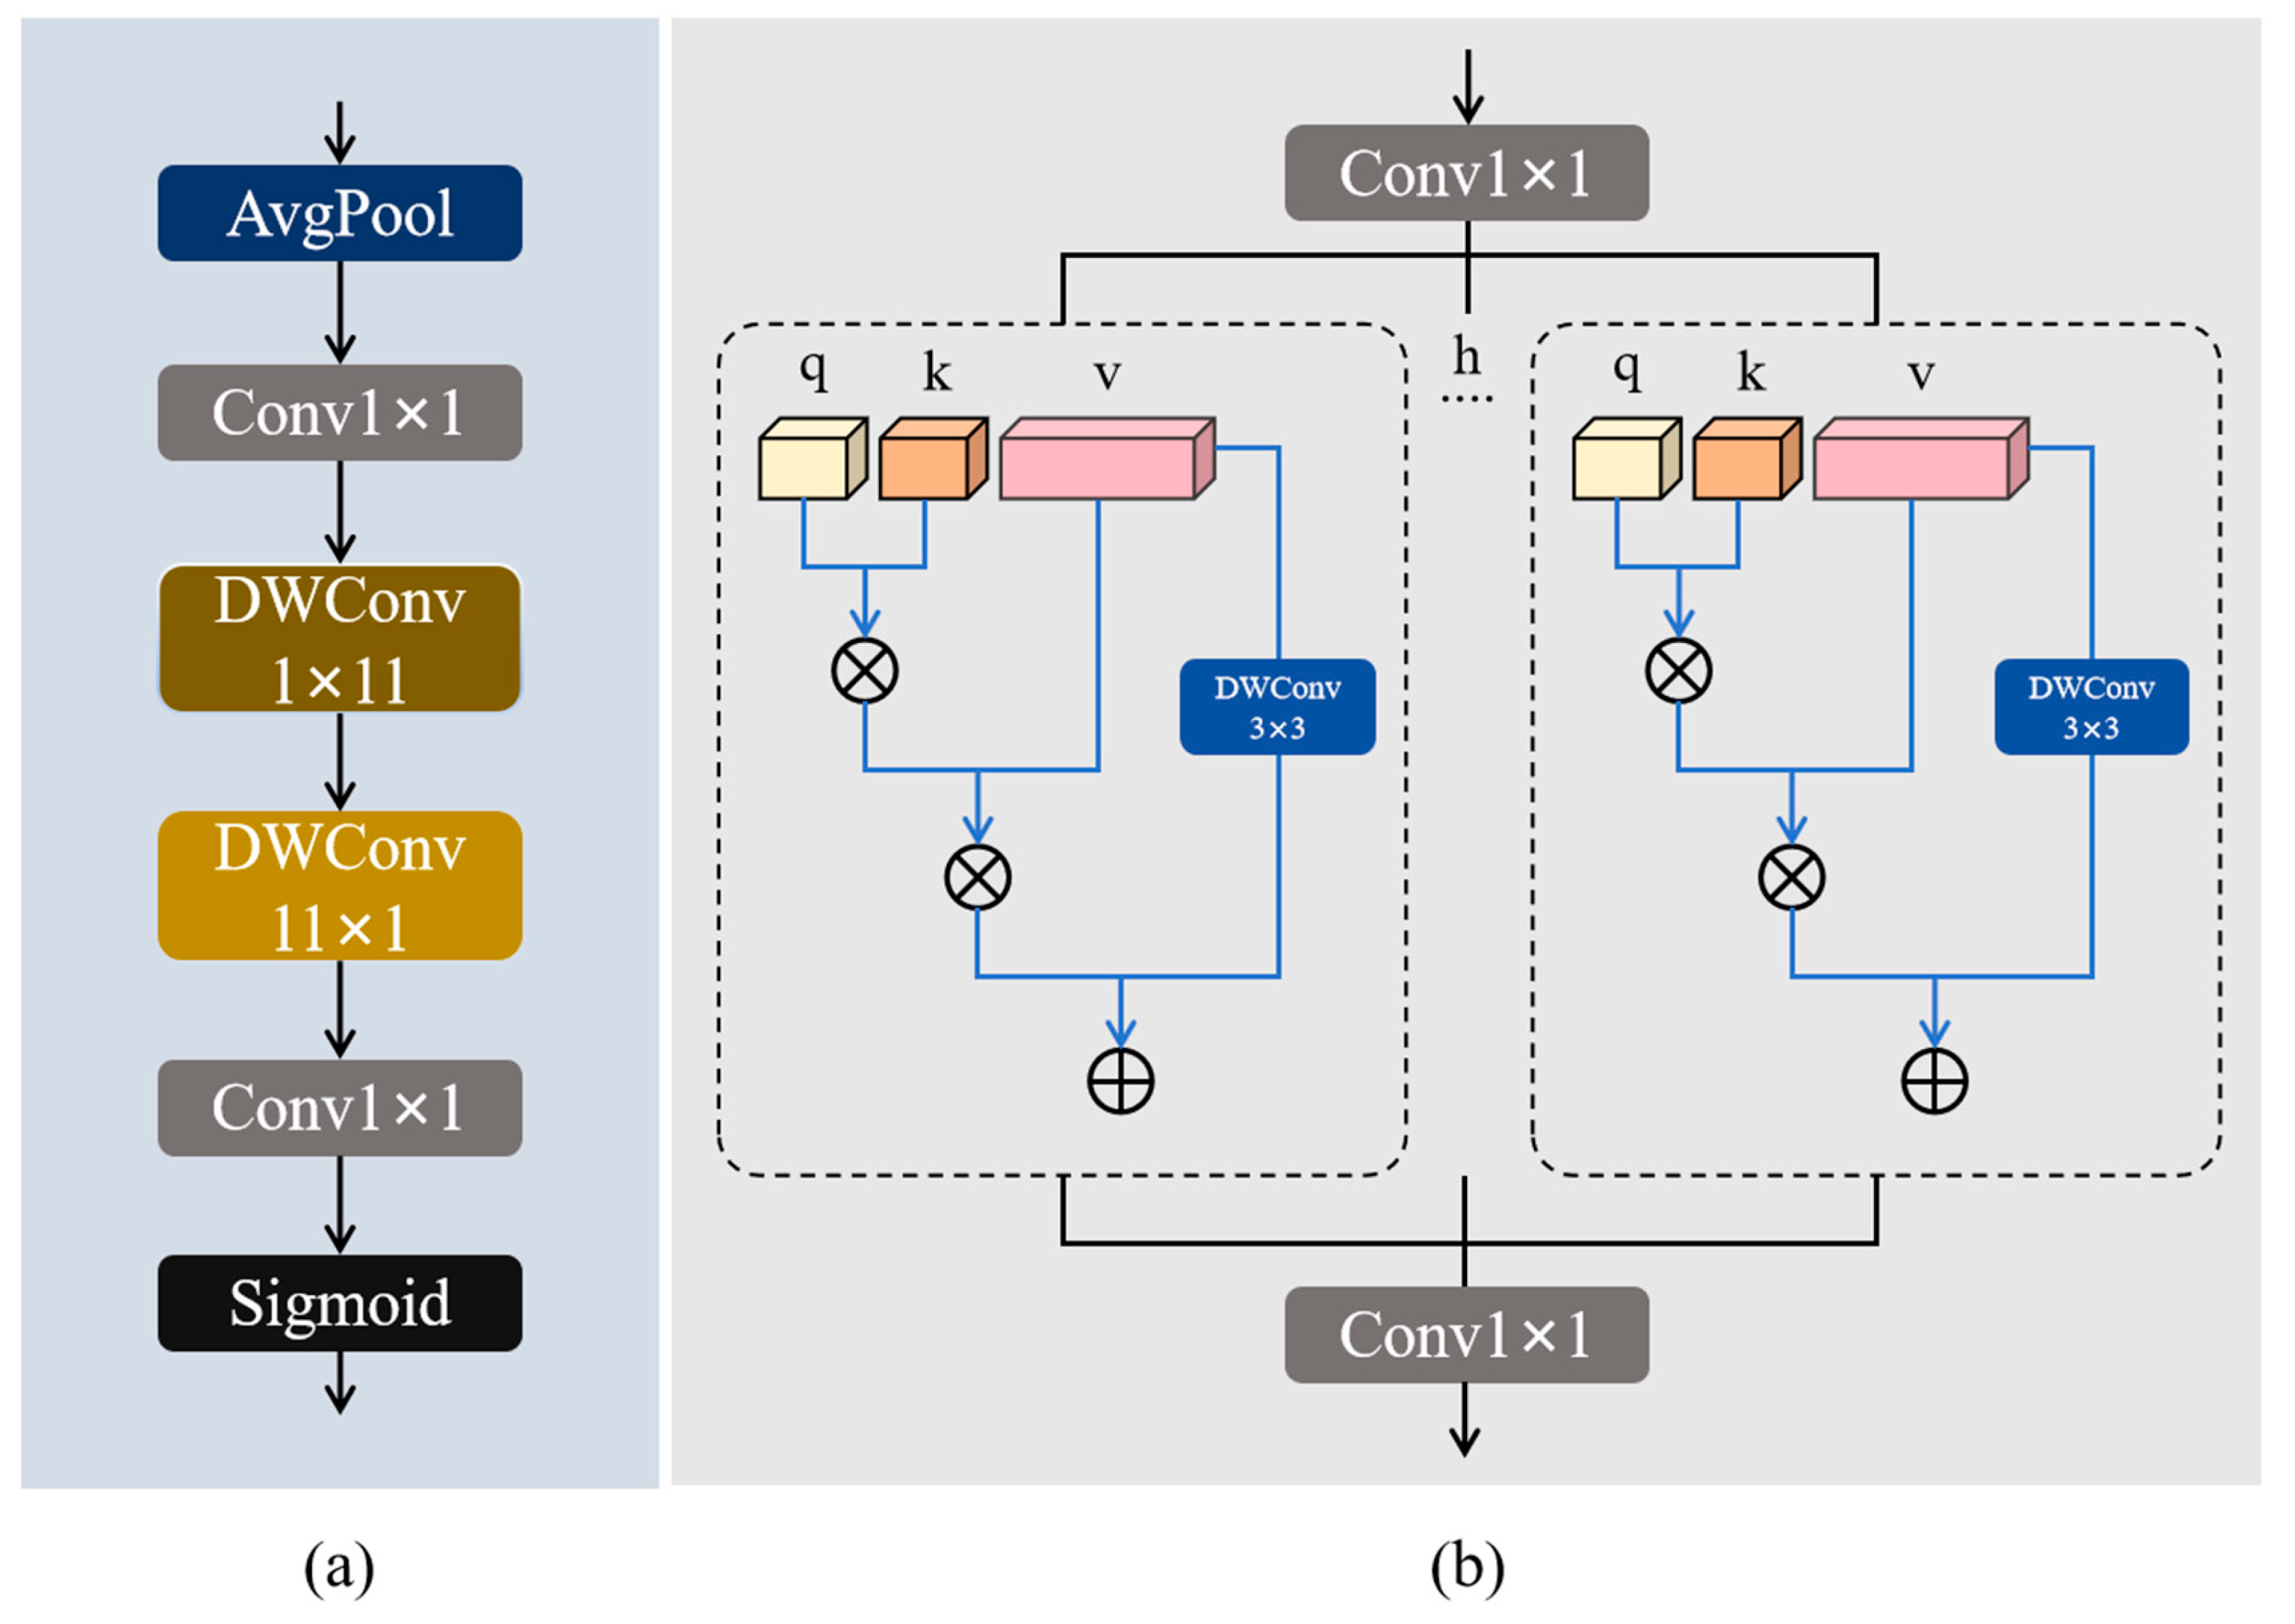
3.2.1. CAA Module
3.2.2. MHSA Module
4. Experimental Validation and Analysis
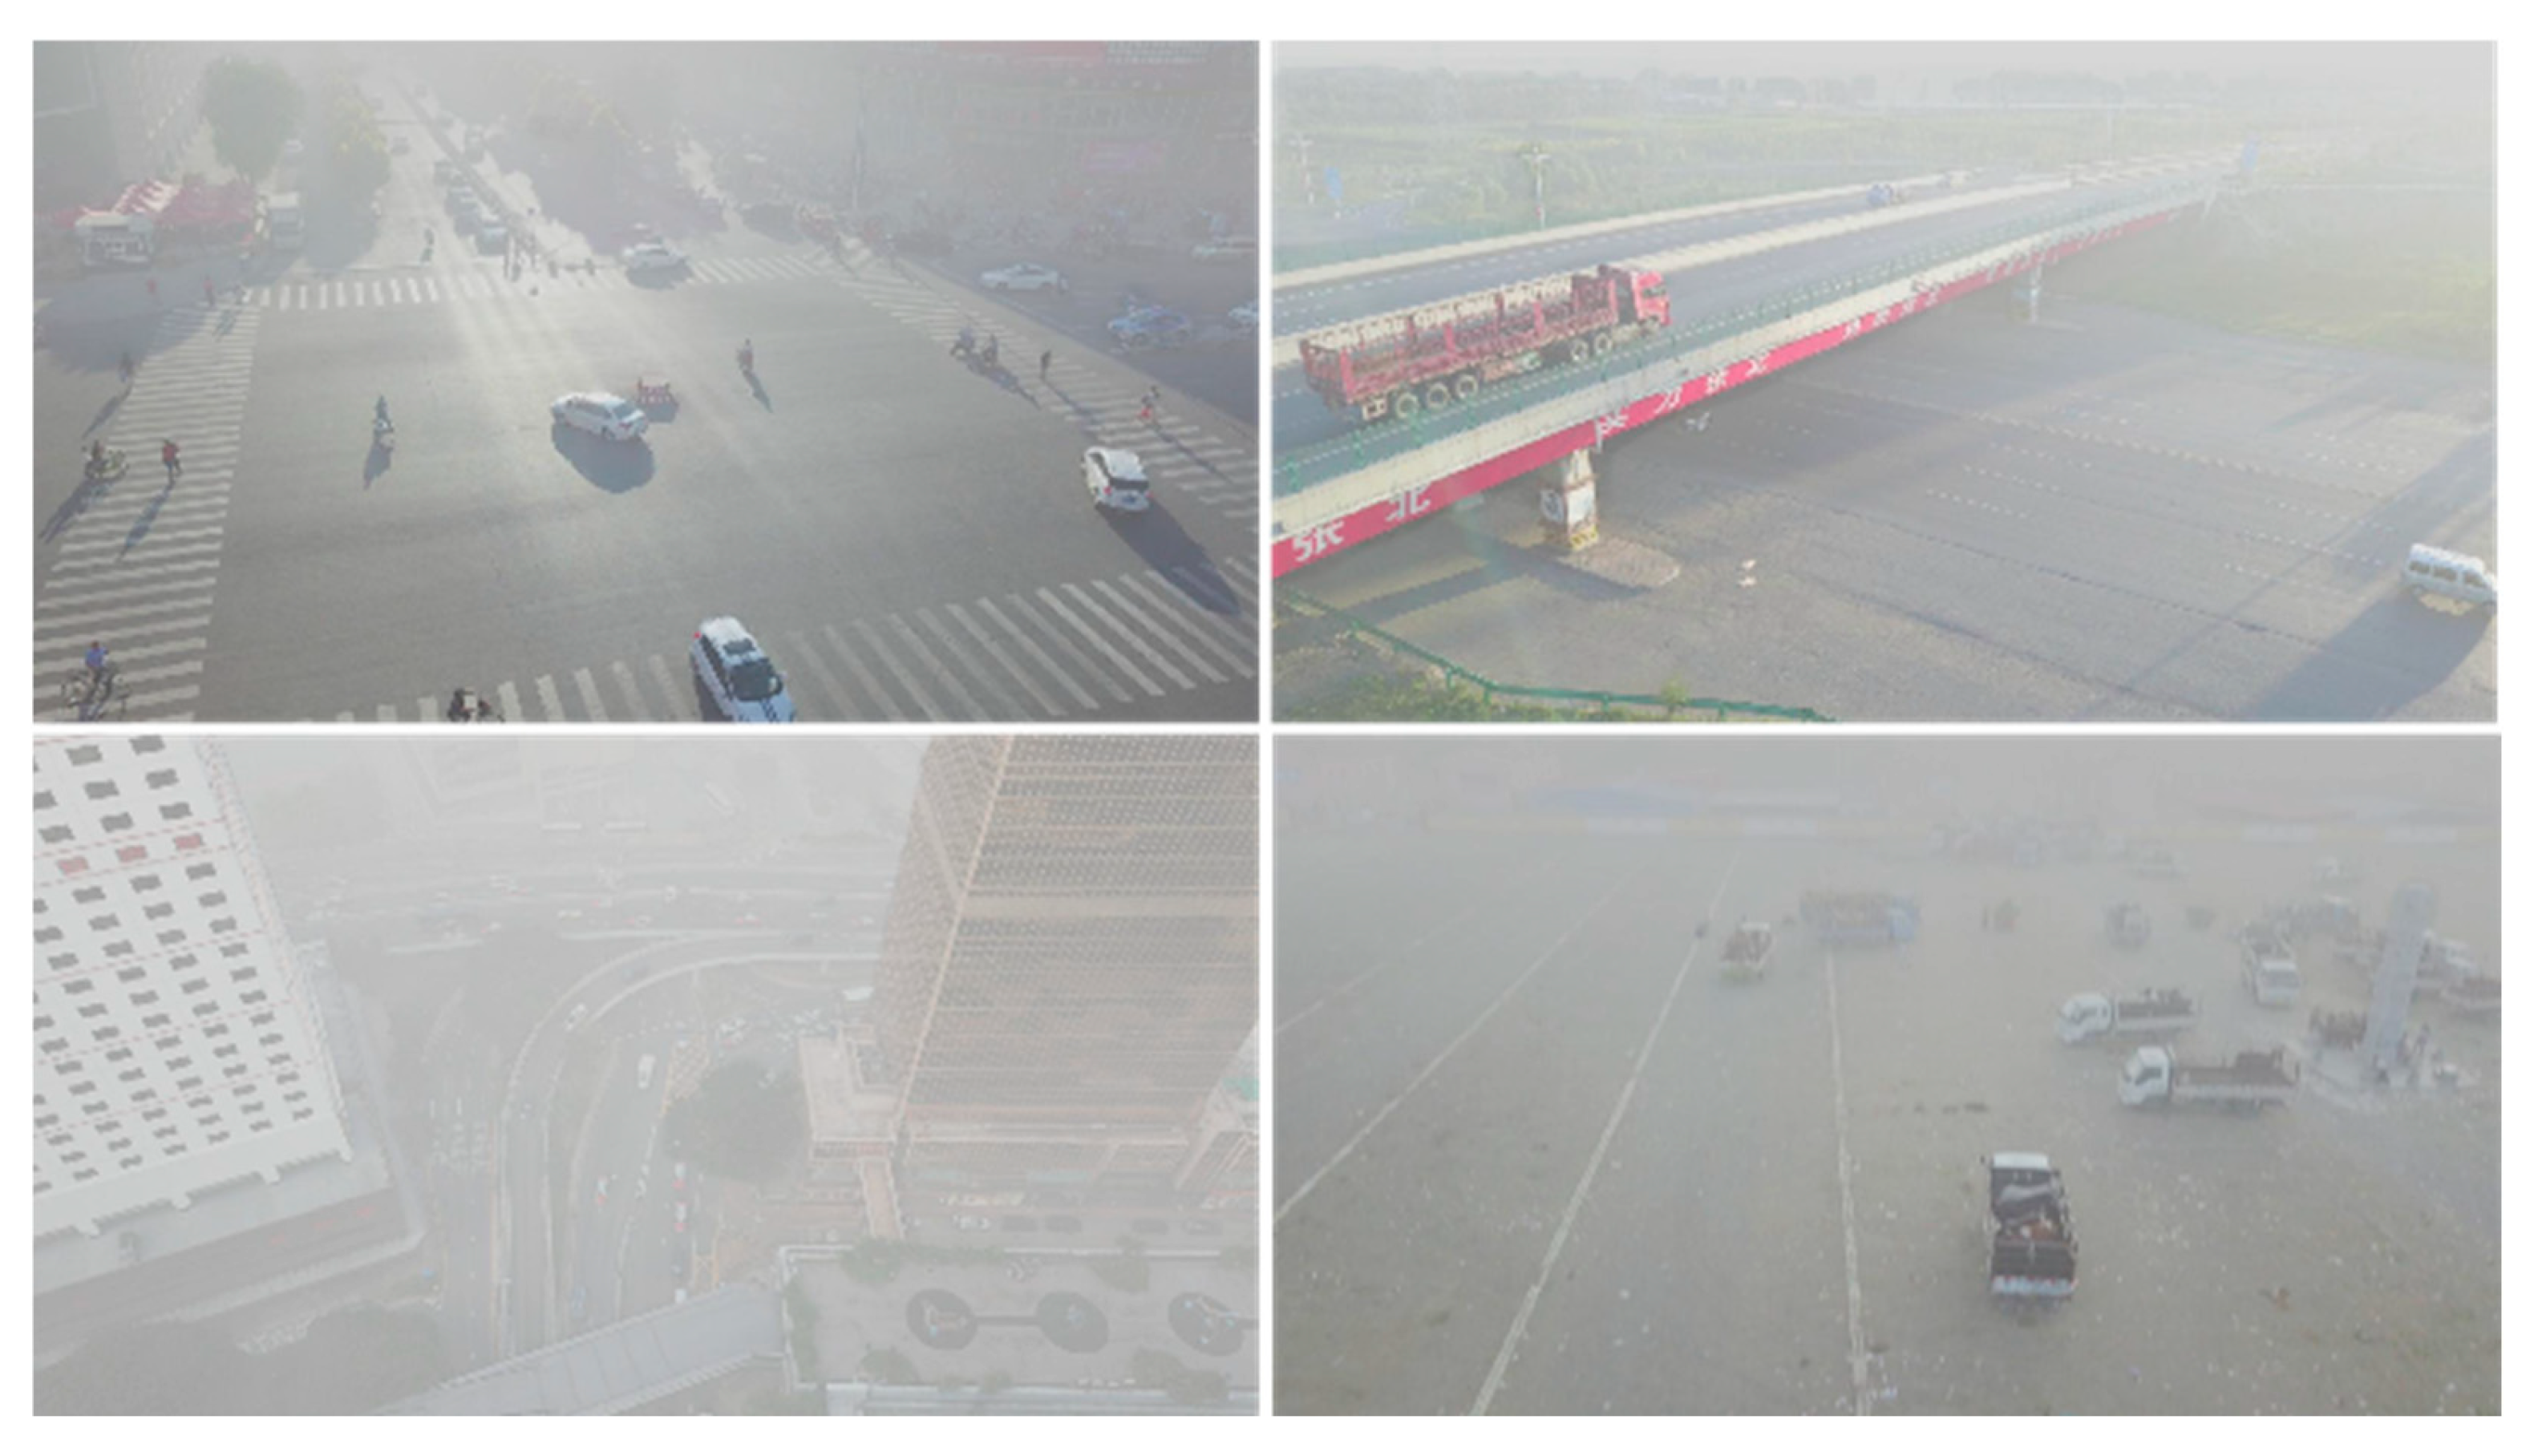
4.1. Data Set Used for Experiments
4.2. Ablation Experiments
4.2.1. Module Comparison Experiments
4.2.2. Attention Comparison Experiments
4.2.3. Module Ablation Experiments
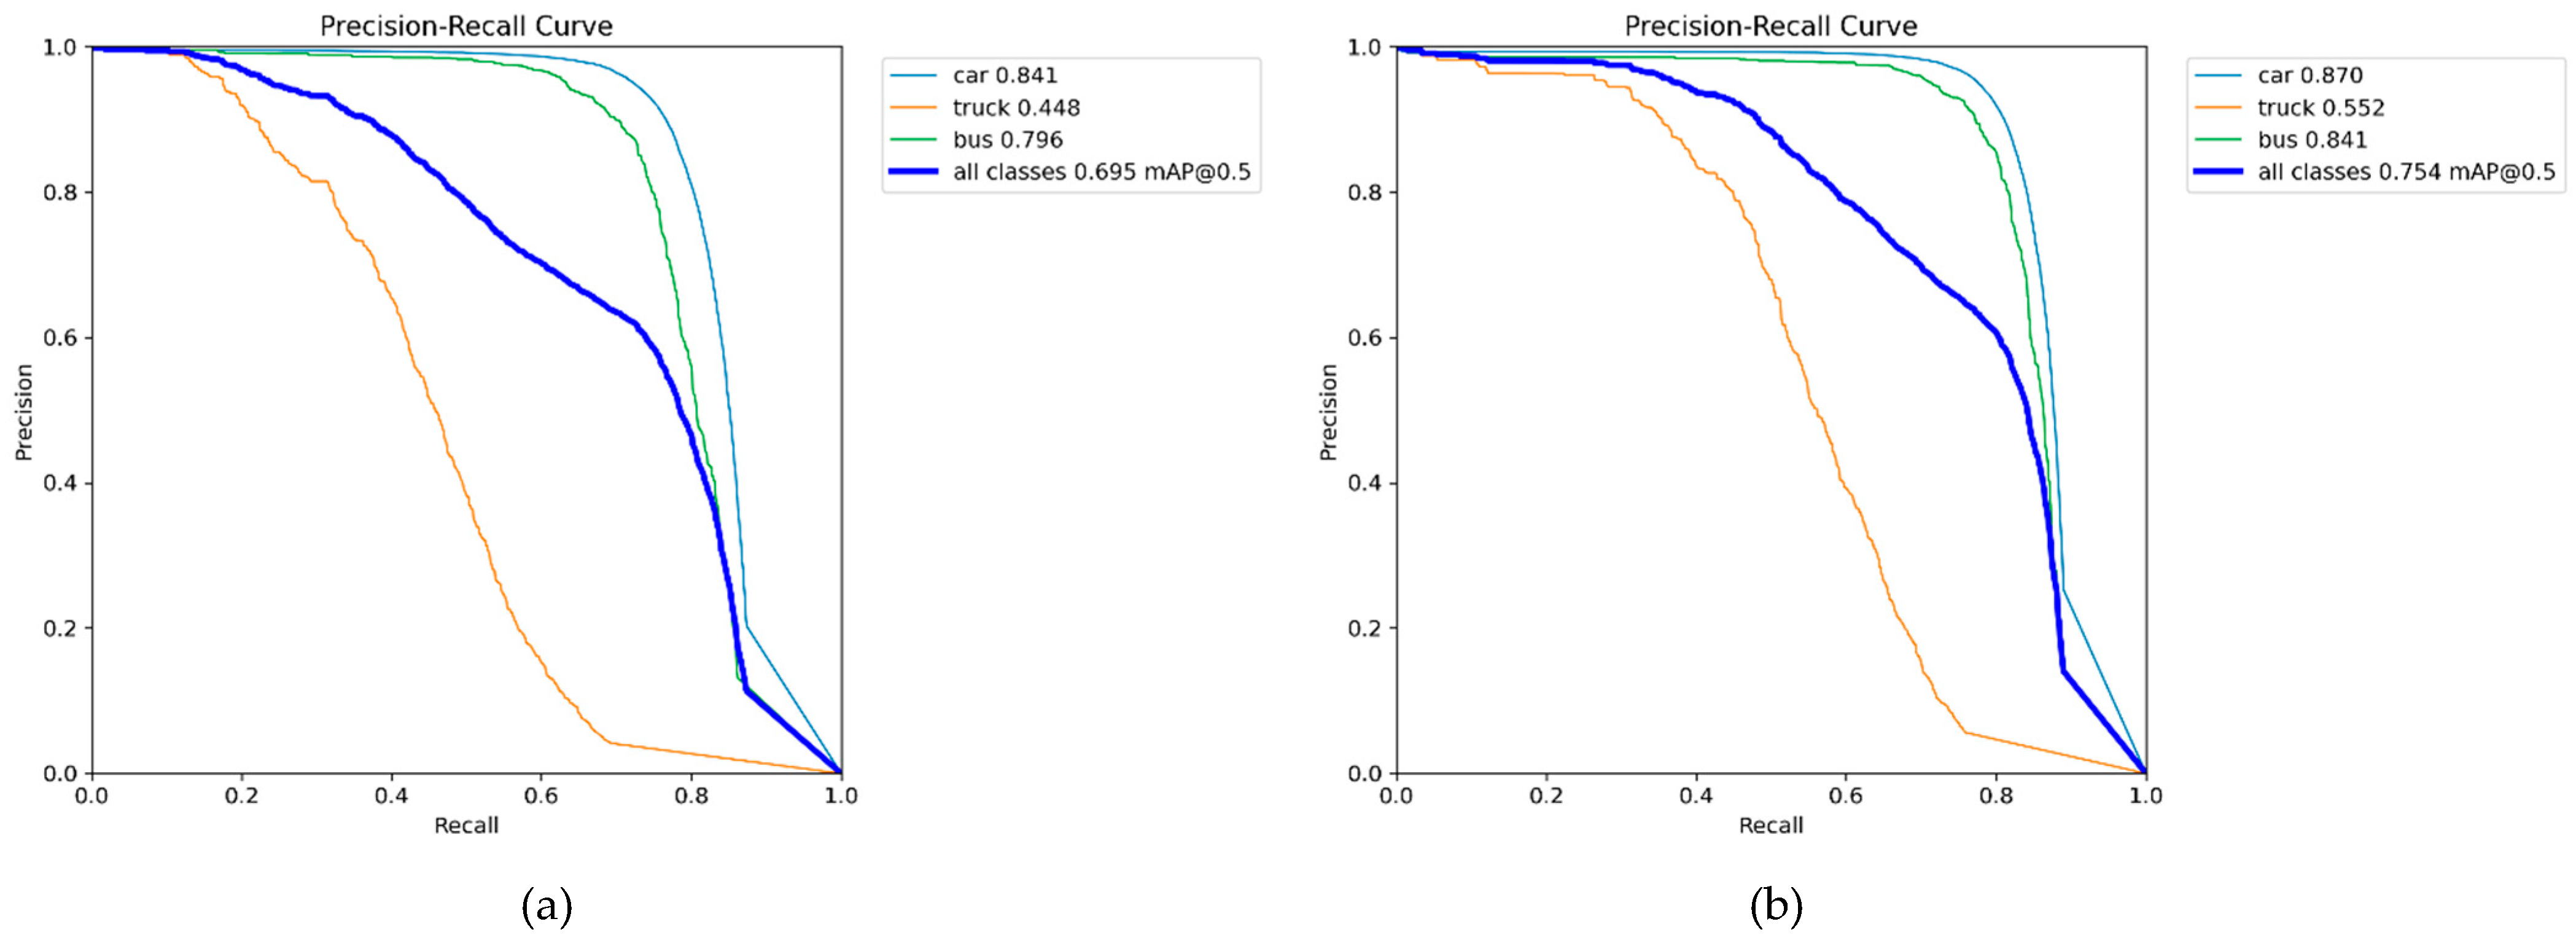
4.3. Comparisons with Other Object Detection Networks
5. Conclusions
References
- Outay, F.; Mengash, H. A.; Adnan, M. Applications of Unmanned Aerial Vehicle (UAV) in Road Safety, Traffic and Highway Infrastructure Management: Recent Advances and Challenges. Transp. Res. Part A Policy Pract. 2020, 141, 116–129. [Google Scholar] [CrossRef]
- Liu, X.; Zhang, Z. A Vision-Based Target Detection, Tracking, and Positioning Algorithm for Unmanned Aerial Vehicle. Wirel. Commun. Mob. Comput. 2021, 2021, 5565589. [Google Scholar] [CrossRef]
- Viola, P.; Jones, M. Rapid Object Detection Using a Boosted Cascade of Simple Features. In Proceedings of the 2001 IEEE Computer Society Conference on Computer Vision and Pattern Recognition (CVPR), Kauai, HI, USA, 8–14 December 2001; Volume 1, pp. 511–518. [Google Scholar] [CrossRef]
- Felzenszwalb, P.F.; Girshick, R.B.; McAllester, D.; Ramanan, D. Object Detection with Discriminatively Trained Part-Based Models. IEEE Trans. Pattern Anal. Mach. Intell. 2010, 32, 1627–1645. [Google Scholar] [CrossRef]
- Bodla, N.; Singh, B.; Chellappa, R.; Davis, L.S. Soft-NMS—Improving Object Detection with One Line of Code. In Proceedings of the IEEE International Conference on Computer Vision (ICCV), Venice, Italy, 22–29 October 2017; pp. 5561–5569. [Google Scholar] [CrossRef]
- Girshick, R.; Donahue, J.; Darrell, T.; Malik, J. Rich Feature Hierarchies for Accurate Object Detection and Semantic Segmentation. In Proceedings of the IEEE Conference on Computer Vision and Pattern Recognition (CVPR), Columbus, OH, USA, 23-28 June 2014; pp. 580–587. [Google Scholar] [CrossRef]
- Girshick, R. Fast R-CNN. In Proceedings of the IEEE International Conference on Computer Vision (ICCV), Santiago, Chile, 7-13 December 2015; pp. 1440–1448. [Google Scholar] [CrossRef]
- Ren, S.; He, K.; Girshick, R.; Sun, J. Faster R-CNN: Towards Real-Time Object Detection with Region Proposal Networks. In Advances in Neural Information Processing Systems 28 (NIPS 2015); Cortes, J., Lawrence, N., Lee, D., Sugiyama, M., Garnett, R., Eds.; Curran Associates, Inc.: Red Hook, NY, USA, 2015; pp. 91–99. [Google Scholar] [CrossRef]
- Redmon, J.; Divvala, S.; Girshick, R.; Farhadi, A. You Only Look Once: Unified, Real-Time Object Detection. In Proceedings of the IEEE Conference on Computer Vision and Pattern Recognition (CVPR), Las Vegas, NV, USA, 27-30 June 2016; pp. 779–788. [Google Scholar] [CrossRef]
- Redmon, J.; Farhadi, A. YOLOv3: An Incremental Improvement. arXiv 2018, arXiv:1804.02767. [Google Scholar] [CrossRef]
- Bochkovskiy, A.; Wang, C. Y.; Liao, H. Y. M. YOLOv4: Optimal Speed and Accuracy of Object Detection. arXiv 2020, arXiv:2004.10934. [Google Scholar] [CrossRef]
- Liu, W.; Anguelov, D.; Erhan, D.; Szegedy, C.; Reed, S.; Fu, C.-Y.; Berg, A.C. SSD: Single Shot Multibox Detector. In Proceedings of the European Conference on Computer Vision (ECCV), Amsterdam, The Netherlands, 8–16 October 2016; pp. 21–37. [Google Scholar] [CrossRef]
- Lin, T.-Y.; Dollár, P.; Girshick, R.; He, K.; Hariharan, B.; Belongie, S. Feature Pyramid Networks for Object Detection. In Proceedings of the IEEE Conference on Computer Vision and Pattern Recognition (CVPR), Honolulu, HI, USA, 21–26 July 2017; pp. 2117–2125. [Google Scholar] [CrossRef]
- Dosovitskiy, A.; Beyer, L.; Kolesnikov, A.; Weissenborn, D.; Zhai, X.; Unterthiner, T.; et al. An Image Is Worth 16x16 Words: Transformers for Image Recognition at Scale. arXiv 2020, arXiv:2010.11929. [Google Scholar]
- Feng, C.; Chen, Z.; Li, X.; Zhang, Y.; Wang, J.; Yang, J.; Cheng, M.-M.; Dai, Y.; Fu, Q. HazyDet: Open-Source Benchmark for Drone-View Object Detection with Depth-Cues in Hazy Scenes. arXiv 2024, arXiv:2409.19833. [Google Scholar]
- Yang, R.; Zhang, J.; Shang, X.; et al. A Lightweight Small Target Detection Algorithm with Multi-Feature Fusion. Electronics 2023, 12, 2739. [Google Scholar] [CrossRef]
- Li, Y.; Wang, Y.; Ma, Z.; et al. SOD-UAV: Small Object Detection for Unmanned Aerial Vehicle Images via Improved YOLOv7. In Proceedings of the 2024 IEEE International Conference on Acoustics, Speech and Signal Processing (ICASSP), Seoul, Korea (South), 14–19 April 2024; pp. 7610–7614. [Google Scholar] [CrossRef]
- Cao, L.; Wang, Q.; Luo, Y.; et al. YOLO-TSL: A Lightweight Target Detection Algorithm for UAV Infrared Images Based on Triplet Attention and Slim-Neck. Infrared Phys. Technol. 2024, 141, 105487. [Google Scholar] [CrossRef]
- Shao, Y.; Yang, Z.; Li, Z.; et al. Aero-YOLO: An Efficient Vehicle and Pedestrian Detection Algorithm Based on Unmanned Aerial Imagery. Electronics 2024, 13, 1190. [Google Scholar] [CrossRef]
- Fan, Q.; Li, Y.; Deveci, M.; et al. LUD-YOLO: A Novel Lightweight Object Detection Network for Unmanned Aerial Vehicle. Inf. Sci. 2025, 686, 121366. [Google Scholar] [CrossRef]
- Chen, C.; Zhang, Y.; Lv, Q.; et al. RRNet: A Hybrid Detector for Object Detection in Drone-Captured Images. In Proceedings of the IEEE/CVF International Conference on Computer Vision Workshops (ICCVW), Seoul, Korea (South), 27–28 October 2019; pp. 100–108. [Google Scholar] [CrossRef]
- Kyrkou, C.; Plastiras, G.; Theocharides, T.; et al. DroNet: Efficient Convolutional Neural Network Detector for Real-Time UAV Applications. In Proceedings of the 2018 Design, Automation & Test in Europe Conference & Exhibition (DATE), Dresden, Germany, 19–23 March 2018; pp. 967–972. [Google Scholar] [CrossRef]
- He, K.; Sun, J.; Tang, X. Single Image Haze Removal Using Dark Channel Prior. IEEE Trans. Pattern Anal. Mach. Intell. 2011, 33, 2341–2353. [Google Scholar] [CrossRef]
- Li, B.; Peng, X.; Wang, Z.; et al. AOD-Net: All-in-One Dehazing Network. In Proceedings of the IEEE International Conference on Computer Vision (ICCV), Venice, Italy, 22–29 October 2017; pp. 4770–4778. [Google Scholar] [CrossRef]
- Fu, X.; Zhuang, P.; Huang, Y.; et al. A Retinex-Based Enhancing Approach for Single Underwater Image. In Proceedings of the 2014 IEEE International Conference on Image Processing (ICIP), Paris, France, 27–30 October 2014; pp. 4572–4576. [Google Scholar] [CrossRef]
- Liu, W.; Ren, G.; Yu, R.; et al. Image-Adaptive YOLO for Object Detection in Adverse Weather Conditions. Proc. AAAI Conf. Artif. Intell. 2022, 36, 1792–1800. [Google Scholar] [CrossRef]
- Qiu, Y.; Lu, Y.; Wang, Y.; et al. IDOD-YOLOV7: Image-Dehazing YOLOV7 for Object Detection in Low-Light Foggy Traffic Environments. Sensors 2023, 23, 1347. [Google Scholar] [CrossRef]
- Wan, Y.; Li, J.; Lin, L.; et al. Collaboration of Dehazing and Object Detection Tasks: A Multi-Task Learning Framework for Foggy Image. IEEE Trans. Geosci. Remote Sens. 2025, 63, 5600815. [Google Scholar] [CrossRef]
- Hu, J.; Shen, L.; Sun, G. Squeeze-and-Excitation Networks. In Proceedings of the IEEE Conference on Computer Vision and Pattern Recognition (CVPR), Salt Lake City, UT, USA, 18–22 June 2018; pp. 7132–7141. [Google Scholar] [CrossRef]
- Wang, Q.; Wu, B.; Zhu, P.; et al. ECA-Net: Efficient Channel Attention for Deep Convolutional Neural Networks. In Proceedings of the IEEE/CVF Conference on Computer Vision and Pattern Recognition (CVPR), Seattle, WA, USA, 13–19 June 2020; pp. 11534–11542. [Google Scholar] [CrossRef]
- Woo, S.; Park, J.; Lee, J.Y.; et al. CBAM: Convolutional Block Attention Module. In Proceedings of the European Conference on Computer Vision (ECCV), Munich, Germany, 8–14 September 2018; pp. 3–19. [Google Scholar] [CrossRef]
- Zhang, Q.; Tang, J.; Zheng, H.; et al. Efficient Object Detection Method Based on Aerial Optical Sensors for Remote Sensing. Displays 2022, 75, 102328. [Google Scholar] [CrossRef]
- Jian, J.; Liu, L.; Zhang, Y.; et al. Optical Remote Sensing Ship Recognition and Classification Based on Improved YOLOv5. Remote Sens. 2023, 15, 4319. [Google Scholar] [CrossRef]
- Carion, N.; Massa, F.; Synnaeve, G.; et al. End-to-End Object Detection with Transformers. In Proceedings of the European Conference on Computer Vision (ECCV), Glasgow, UK, 23–28 August 2020; pp. 213–229. [Google Scholar] [CrossRef]
- Liu, Z.; Lin, Y.; Cao, Y.; et al. Swin Transformer: Hierarchical Vision Transformer Using Shifted Windows. In Proceedings of the IEEE/CVF International Conference on Computer Vision (ICCV), Montreal, QC, Canada, 10–17 October 2021; pp. 10012–10022. [Google Scholar] [CrossRef]
- Xu, X.; Feng, Z.; Cao, C.; et al. An Improved Swin Transformer-Based Model for Remote Sensing Object Detection and Instance Segmentation. Remote Sens. 2021, 13, 4779. [Google Scholar] [CrossRef]
- Finder, S. E.; Amoyal, R.; Treister, E.; Freifeld, O. Wavelet Convolutions for Large Receptive Fields. In Proceedings of the European Conference on Computer Vision (ECCV); 2024; pp. 363–380. [Google Scholar]
- Cai, X.; Lai, Q.; Wang, Y.; et al. Poly Kernel Inception Network for Remote Sensing Detection. In Proceedings of the IEEE/CVF Conference on Computer Vision and Pattern Recognition (CVPR), Seattle, WA, USA, 17–21 June 2024; pp. 27706–27716. [Google Scholar]
- Tian, Y.; Ye, Q.; Doermann, D. YOLOv12: Attention-Centric Real-Time Object Detectors. arXiv 2025, arXiv:2502.12524. [Google Scholar]
- Zhao, Y.; Lv, W.; Xu, S.; et al. DETRs Beat YOLOs on Real-Time Object Detection. In Proceedings of the IEEE/CVF Conference on Computer Vision and Pattern Recognition (CVPR); 2024; pp. 16965–16974. [Google Scholar]
- Liu, S.; Li, F.; Zhang, H.; et al. Dab-DETR: Dynamic anchor boxes are better queries for DETR. arXiv 2022, arXiv:2201.12329. [Google Scholar] [CrossRef]
- Zhu, X.; Su, W.; Lu, L.; et al. Deformable DETR: Deformable transformers for end-to-end object detection. arXiv 2020, arXiv:2010.04159. [Google Scholar]

| Split | Images | Objects | Class | Object Size | ||
| Small | Medium | Large | ||||
| Training | 8,000 | 264,511 | car | 159,491 | 77,527 | 5,177 |
| truck | 4,197 | 6,262 | 1,167 | |||
| bus | 1,990 | 7,879 | 861 | |||
| Validation | 1,000 | 34,560 | car | 21,051 | 9,881 | 630 |
| truck | 552 | 853 | 103 | |||
| bus | 243 | 1,122 | 125 | |||
| Test | 2,000 | 65,322 | car | 38,910 | 19,860 | 1,256 |
| truck | 881 | 1,409 | 263 | |||
| bus | 473 | 1,991 | 279 | |||
| RDDTS | 600 | 19,296 | car | 8,167 | 8,993 | 1,060 |
| truck | 112 | 290 | 87 | |||
| bus | 69 | 363 | 155 | |||
| Environment | Parameter |
| CPU | Intel(R) Core(TM) i9-10850K @3.60GHz |
| GPU | NVIDIA GeForce RTX 3090 |
| Memory capacity | 32GB |
| Language | Python 3.10.16 |
| Frame | Pytorch 2.5.1 |
| CUDA Version | 12.4 |
| Training parameters | Configuration |
| Optimizer | SGD |
| Image size | 640×640 |
| Learning rate | 0.01 |
| Epoch | 300 |
| Batch size | 16 |
| Patience | 20 |
| NMS IoU | 0.7 |
| Weight-Decay | 5e-4 |
| Data | Backbone | Neck | Precision | Recall | F1-Score | mAP50 | mAP50-95 | Para(M) | FPS |
| Val | × | × | 0.802 | 60.5 | 0.690 | 0.674 | 0.469 | 2.58 | 599.1 |
| √ | × | 0.796 | 0.612 | 0.692 | 0.679 | 0.467 | 2.57 | 554.6 | |
| × | √ | 0.814 | 0.607 | 0.695 | 0.680 | 0.475 | 2.53 | 571.0 | |
| √ | √ | 0.791 | 0.622 | 0.696 | 0.683 | 0.481 | 2.79 | 521.6 | |
| Test | × | × | 0.805 | 0.623 | 0.702 | 0.690 | 0.486 | 2.58 | 669.3 |
| √ | × | 0.828 | 0.626 | 0.713 | 0.698 | 0.492 | 2.57 | 656.9 | |
| × | √ | 0.815 | 0.638 | 0.716 | 0.702 | 0.495 | 2.53 | 670.7 | |
| √ | √ | 0.822 | 0.631 | 0.714 | 0.700 | 0.490 | 2.79 | 590.4 |
| Wavelet bases | Precision | Recall | F1-Score | mAP@0.5 | mAP@0.5:0.95 | Params (M) | FPS |
| Haar (db1) | 0.815 | 0.638 | 0.716 | 0.702 | 0.495 | 2.53 | 670.7 |
| Db4 | 0.809 | 0.631 | 0.709 | 0.695 | 0.487 | 2.61 | 650.4 |
| Db6 | 0.806 | 0.629 | 0.707 | 0.692 | 0.485 | 2.68 | 623.1 |
| Sym4 | 0.811 | 0.633 | 0.711 | 0.698 | 0.490 | 2.60 | 663.5 |
| Coif1 | 0.808 | 0.630 | 0.708 | 0.694 | 0.486 | 2.57 | 659.8 |
| Data | Attention | Precision | Recall | F1-Score | mAP50 | mAP50-95 | Para(M) | FPS |
| Val | MSHA (baseline) | 0.802 | 0.605 | 0.690 | 0.674 | 0.469 | 2.58 | 599.1 |
| CAA | 0.811 | 0.616 | 0.700 | 0.687 | 0.482 | 2.56 | 600.9 | |
| MSHA→CAA | 0.77 | 0.592 | 0.669 | 0.660 | 0.457 | 2.57 | 590.0 | |
| CAA+MSHA(Parallel) | 0.805 | 0.622 | 0.702 | 0.689 | 0.483 | 2.68 | 569.9 | |
| CEHSA | 0.825 | 0.616 | 0.705 | 0.692 | 0.486 | 2.57 | 595.4 | |
| Test | MSHA (baseline) | 0.805 | 0.623 | 0.702 | 0.690 | 0.486 | 2.58 | 669.3 |
| CAA | 0.812 | 0.642 | 0.717 | 0.705 | 0.499 | 2.56 | 671.3 | |
| MSHA→CAA | 0.798 | 0.606 | 0.689 | 0.673 | 0.467 | 2.57 | 673.2 | |
| CAA+MSHA (Parallel) | 0.815 | 0.631 | 0.711 | 0.702 | 0.498 | 2.68 | 654.4 | |
| CEHSA | 0.824 | 0.641 | 0.721 | 0.707 | 0.502 | 2.57 | 675.1 |
| Data | Model | Precision | Recall | F1-Score | mAP50 | mAP50-95 |
| Test | YOLOv5n | 0.804 | 0.592 | 0.682 | 0.666 | 0.461 |
| YOLOv8n | 0.794 | 0.599 | 0.683 | 0.662 | 0.46 | |
| YOLOv5n+CEHSA | 0.807 | 0.608 | 0.694 | 0.678 (+1.2%) | 0.473 (+1.2%) | |
| YOLOv8n+CEHSA | 0.807 | 0.621 | 0.702 | 0.688 (+2.6%) | 0.484 (+1.8%) | |
| RDDTS | YOLOv5n | 0.494 | 0.397 | 0.440 | 0.388 | 0.248 |
| YOLOv8n | 0.527 | 0.38 | 0.442 | 0.399 | 0.252 | |
| YOLOv5n+CEHSA | 0.547 | 0.386 | 0.453 | 0.408 (+2.0%) | 0.26 (+1.2%) | |
| YOLOv8n+CEHSA | 0.580 | 0.381 | 0.460 | 0.418 (+1.9%) | 0.268 (+1.6%) |
| Data | C3K2-H | CEHSA | Precision | Recall | F1-Score | mAP50 | mAP50-95 | Para(M) | FPS |
| Val | × | × | 0.802 | 0.605 | 0.690 | 0.674 | 0.469 | 2.58 | 599.1 |
| √ | × | 0.814 | 0.607 | 0.695 | 0.68 | 0.475 | 2.53 | 571.0 | |
| × | √ | 0.810 | 0.618 | 0.701 | 0.692 | 0.484 | 2.57 | 595.4 | |
| √ | √ | 0.812 | 0.627 | 0.708 | 0.695 | 0.487 | 2.56 | 588.2 | |
| Test | × | × | 0.805 | 0.623 | 0.702 | 0.69 | 0.486 | 2.58 | 680.0 |
| √ | × | 0.815 | 0.638 | 0.716 | 0.702 | 0.495 | 2.53 | 670.7 | |
| × | √ | 0.824 | 0.641 | 0.721 | 0.707 | 0.502 | 2.57 | 675.1 | |
| √ | √ | 0.837 | 0.642 | 0.727 | 0.712 | 0.506 | 2.56 | 649.5 |
| Data | C3K2-H | CEHSA | Precision | Recall | F1-Score | mAP50 | mAP50-95 | Para(M) | FPS |
| Val | × | × | 0.849 | 0.679 | 0.754 | 0.740 | 0.537 | 9.41 | 388.7 |
| √ | × | 0.845 | 0.682 | 0.755 | 0.749 | 0.541 | 9.16 | 384.5 | |
| × | √ | 0.841 | 0.679 | 0.751 | 0.748 | 0.541 | 9.32 | 394.2 | |
| √ | √ | 0.866 | 0.679 | 0.761 | 0.754 | 0.551 | 9.21 | 382.4 | |
| Test | × | × | 0.847 | 0.681 | 0.755 | 0.745 | 0.543 | 9.41 | 455 |
| √ | × | 0.853 | 0.677 | 0.755 | 0.751 | 0.547 | 9.16 | 444.2 | |
| × | √ | 0.860 | 0.683 | 0.761 | 0.757 | 0.554 | 9.32 | 456.0 | |
| √ | √ | 0.859 | 0.686 | 0.763 | 0.760 | 0.558 | 9.21 | 446.0 |
| Methods | APs | APm | APl | MaxDets |
| YOLO11n | 0.110 | 0.313 | 0.402 | 100 |
| YOLO11s | 0.145 | 0.331 | 0.456 | 100 |
| HA-YOLOn | 0.124 (+1.2%) | 0.328 (+2.2%) | 0.455(+5.3%) | 100 |
| HA-YOLOs | 0.158 (+1.1%) | 0.364 (+3.3%) | 0.502(+4.6%) | 100 |
| model | mAP50 | map50-95 | GFLOPS | FPS | Para(M) | |||
| car | truck | bus | all | |||||
| DAB DETR [41]* | 0.368 | 0.151 | 0.423 | 0.313 | - | 97.2 | - | 43.70 |
| RT-DETR-l [40] | 0.757 | 0.203 | 0.667 | 0.542 | 0.330 | 103.4 | 121.3 | 31.99 |
| Deform DETR [42]* | 0.588 | 0.341 | 0.629 | 0.519 | - | 192.5 | - | 40.01 |
| YOLOv5n | 0.833 | 0.404 | 0.762 | 0.666 | 0.461 | 7.1 | 714.1 | 2.50 |
| YOLOv5s | 0.865 | 0.515 | 0.808 | 0.729 | 0.526 | 23.8 | 464.4 | 9.11 |
| YOLOv8n | 0.831 | 0.394 | 0.762 | 0.662 | 0.460 | 8.1 | 673.0 | 3.00 |
| YOLOv8s | 0.867 | 0.506 | 0.807 | 0.727 | 0.527 | 28.4 | 443.0 | 11.13 |
| YOLOv12n [39] | 0.841 | 0.431 | 0.776 | 0.682 | 0.478 | 6.3 | 265.2 | 2.56 |
| YOLOv12s [39] | 0.859 | 0.505 | 0.812 | 0.726 | 0.524 | 21.2 | 228.0 | 9.23 |
| YOLO11n | 0.840 | 0.449 | 0.781 | 0.690 | 0.486 | 6.3 | 680.0 | 2.58 |
| YOLO11s | 0.874 | 0.539 | 0.823 | 0.745 | 0.547 | 21.3 | 455.0 | 9.41 |
| HA-YOLOn | 0.849 | 0.488 | 0.800 | 0.712 | 0.506 | 6.3 | 649.5 | 2.56 |
| HA-YOLOs | 0.875 | 0.566 | 0.838 | 0.760 | 0.554 | 21.1 | 446.0 | 9.21 |
| model | mAP50 | map50-95 | GFLOPS | FPS | Para(M) | |||
| car | truck | bus | all | |||||
| DAB DETR [41]* | 0.222 | 0.023 | 0.112 | 11.7 | - | 97.2 | - | 43.70 |
| RT-DETR-l [40] | 0.696 | 0.062 | 0.187 | 0.315 | 0.178 | 103.4 | 117.3 | 31.99 |
| Deform DETR [42]* | 0.463 | 0.112 | 0.219 | 0.265 | - | 192.5 | - | 40.01 |
| YOLOv5n | 0.744 | 0.123 | 0.297 | 0.388 | 0.248 | 7.1 | 404.3 | 2.50 |
| YOLOv5s | 0.788 | 0.194 | 0.38 | 0.454 | 0.303 | 23.8 | 330.8 | 9.11 |
| YOLOv8n | 0.754 | 0.144 | 0.300 | 0.399 | 0.252 | 8.1 | 389.1 | 3.00 |
| YOLOv8s | 0.798 | 0.178 | 0.362 | 0.446 | 0.298 | 28.4 | 332.8 | 11.13 |
| YOLOv12n [39] | 0.764 | 0.144 | 0.303 | 0.404 | 0.259 | 6.3 | 160.0 | 2.56 |
| YOLOv12s [39] | 0.802 | 0.200 | 0.392 | 0.465 | 0.314 | 21.2 | 144.0 | 9.23 |
| YOLO11n | 0.764 | 0.144 | 0.337 | 0.415 | 0.272 | 6.3 | 371.2 | 2.58 |
| YOLO11s | 0.813 | 0.173 | 0.365 | 0.450 | 0.303 | 21.3 | 310.0 | 9.41 |
| HA-YOLOn | 0.779 | 0.165 | 0.389 | 0.444 | 0.289 | 6.3 | 355.7 | 2.56 |
| HA-YOLOs | 0.820 | 0.206 | 0.435 | 0.487 | 0.327 | 21.1 | 303.5 | 9.21 |
| Method | Para(M) | GFLOPS | AP on Test-set | AP on RDDTS | ||||||
| car | truck | bus | mAP | car | truck | bus | mAP | |||
| IDOD-YOLOv7 [27]* | 46.5 | 93.6 | - | - | - | - | - | - | - | - |
| IA-YOLO [26]* | 62.5 | 75.3 | 0.441 | 0.222 | 0.486 | 0.383 | 0.419 | 0.08 | 0.173 | 0.224 |
| HA-YOLOn | 2.56 | 6.3 | 0.849 | 0.488 | 0.800 | 0.712 | 0.779 | 0.165 | 0.389 | 0.444 |
| HA-YOLOs | 9.21 | 21.1 | 0.875 | 0.566 | 0.838 | 0.760 | 0.820 | 0.206 | 0.435 | 0.487 |
Disclaimer/Publisher’s Note: The statements, opinions and data contained in all publications are solely those of the individual author(s) and contributor(s) and not of MDPI and/or the editor(s). MDPI and/or the editor(s) disclaim responsibility for any injury to people or property resulting from any ideas, methods, instructions or products referred to in the content. |
© 2025 by the authors. Licensee MDPI, Basel, Switzerland. This article is an open access article distributed under the terms and conditions of the Creative Commons Attribution (CC BY) license (http://creativecommons.org/licenses/by/4.0/).


