Submitted:
14 November 2025
Posted:
17 November 2025
You are already at the latest version
Abstract
The effects of forced aeration on sweet potato growth and yield by decreasing CO2 concentrations in the rooting zone were investigated.. The following four experiments were conducted with forced aeration in the rooting zone: (1) with air containing different CO2 concentrations to clarify the effects of CO2 in the rooting zone on the net photosynthetic rate and leaf conductance, (2) with atmospheric air into cultivating soil ridges through porous pipes as a feasibility study, (3) with varying forced-aeration rates, and (4) with varying time intervals of forced aeration to find a more efficient aeration method. The results are summarized as follows: (1) During the six-week growing period, the mean values of net photosynthetic rates and leaf conductance for 1% CO2 and 2% CO2 were 0.8 and 0.7 times, respectively, those in the Control with 0.04% CO2. (2) When the aeration rate was 1.5 L min-1 per 1 m of ridge length, the CO2 concentration reduced to 0.1-0.2% in the rooting zone, whereas the control ridge with non-forced aeration was 0.5-1.4% CO2. The fresh and dry weight yields of sweet potato tubers were 1.18 and 1.19 times those of the control, respectively. (3) The CO2 concentrations decreased as the aeration rate increased. The dry weights of tuberous roots in forced-aeration ridges at aeration rates of 1.25 and 2.5 L min-1 were 1.19 and 1.26 times those in the control, respectively. Sweet potato growth was promoted when forced aeration reduced CO2 in the rooting zone. (4) The yield increased by 24% even when forced aeration was performed for just 15 min per day after irrigation. In conclusion, forced aeration into the rooting zone decreased CO2 concentrations and increased sweet potato yield by approximately 20%. The sweet potato yield can be increased even with forced aeration for 15 min per day. Forced aeration to reduce CO2 concentrations in the rooting zone can improve the yield of root crops.
Keywords:
aeration
; CO2 concentration
; forced aeration
; root crops
; soil
; sweet potato
1. Introduction
The world’s population is experiencing massive growth, particularly in developing countries [1]. This rapid increase poses a serious issue, as it will be accompanied by a significant food shortage. Consequently, promoting food and feed production in these countries is becoming increasingly important. Many countries, especially in developing countries, are experiencing a shortage of fresh vegetables. This is due to factors such as production and distribution issues, significant post-harvest food losses, and economic barriers that make accessing nutritious food challenging [2]. Regular consumption of adequate amounts of fruit and vegetables could reduce the risk of all-cause mortality, particularly cardiovascular disease, chronic diseases, and cancer [3].
For example, in Southeast Asia, where limited farmland and labor resources are available, increasing agricultural production to meet rapidly growing food demand and prevent malnutrition is the most essential and effective solution [4]. Many of these areas have been developed for agriculture, mainly for paddy fields. However, excessive wetting of cultivated fields, especially during the rainy or monsoon seasons, often leads to a shortage of vegetable and root crops. This underscores the urgent need for improved cultivation techniques to maintain the productivity of vegetables and root crops.
The sweet potato (Ipomoea batatas (L.) Lam.) is cultivated in temperate and tropical regions worldwide and is considered an important food source. Sweet potato is recognized as the seventh most important agricultural crop worldwide and has potential as an energy source [5,6]. It can fix relatively large amounts of energy and produce food even under poor soil conditions, contributing to its role as a food security crop in many parts of the world [7]. Sweet potato is actively incorporated into the diet as a second staple food, especially in developing countries [8]. It is a highly resilient crop with great potential to improve diets and food security [9]. In tropical and subtropical regions, it is particularly known for its nutritional balance, pest and disease resistance, drought tolerance, and year-round availability as a short-season crop [10]. Sweet potato tubers contain more vitamins, minerals, and proteins than other vegetables [11]. They also contain antioxidants such as β-carotene, ascorbic acid, and tocopherol, which are effective in preventing heart disease and cancer [12]. Sweet potato tubers are rich in bioactive compounds and health-promoting carbohydrates [13]. Sweet potato is also a useful leafy vegetable [14], and its leaves and stems contain relatively high levels of antioxidant and polyphenolic compounds [15,16]. Therefore, sweet potato is recognized as a useful functional food for human health.
Soil aeration is generally essential for healthy plant growth. A decrease in soil O2 concentration inhibits plant growth. The O2 concentration in cultivated soil is typically 18–21% and seldom approaches the critical value below which plant growth is suppressed under adequate soil moisture conditions. In many plant species, O2 deficiency in the root environment induces root injuries and growth inhibition. However, root elongation of many plant species is generally maintained at normal rates in solution culture experiments even at oxygen partial pressures as low as 100 hPa (approximately 10%), roughly half the atmospheric oxygen concentration [17].
Previous studies have qualitatively demonstrated the adverse effects of elevated soil CO2 on plant growth. The root biomass of creeping bentgrass decreased when soil CO2 concentrations exceeded 2.5% [18]. Elevated soil CO2 concentrations between 0.5% and 2% suppress the growth of cucumber [19], bamboo [20], and carrot [21]. Sweet potato growth was also suppressed when soil CO2 concentrations rose from 0.5% to 2% [22,23]. Bouma et al. (1997) [24] reported that the growth of kidney bean (Phaseolus vulgaris) was unaffected by soil CO2 concentrations ranging from 0.06% to 2%. Information on the effects of elevated soil CO2 on plant growth, particularly tuberous root development, in cultivated fields remains insufficient. We hypothesized that elevated CO2 concentrations in the rooting zone lead to growth retardation in sweet potato. In contrast, their productivity was increased by placing rice or wheat straws, rice husk charcoal, and porous plastic pipes into soil ridges to promote soil aeration and thus decrease CO2 concentrations in the rooting zone in wet lowland conditions [25,26]
In this study, the effects of CO2 concentration in the rooting zone on the net photosynthetic rate and leaf conductance in sweet potato were investigated to clarify the cause of growth suppression under elevated soil CO2. The effect of forced aeration on sweet potato growth and yield was investigated as a feasibility study by reducing CO2 concentration in the rooting zone through forced aeration with atmospheric air.
2. Materials and Methods
Sweet potato (Ipomoea batatas L., cv. Kokei No. 14) plants were used in a series of experiments. Plants established from cuttings were used as nursery plants for planting. The experiment was conducted at the experimental farm of Osaka Metropolitan University (34°32′N, 135°30′E).
2.1. Effect of CO2 in the Rooting Zone on Net Photosynthetic Rate and Leaf Conductance
Net photosynthetic rate and leaf conductance as an indicator of the transpiration rate in sweet potato leaves were investigated over 42 days.
Sweet potato was cultivated in containers (0.45 x 0.3 x 0.2 m3 each) filled with sand soil (Figure 1) and placed in a greenhouse in mid-April. Fresh atmospheric air containing 21% O2 and 0.04% CO2 was forced into each cultivation container through its bottom for one week after planting. Two weeks after planting, air containing 1% and 2% CO2, and atmospheric air (0.04% CO2) as a control, was forced from the bottom of each container into the soil to achieve varying CO2 concentrations in the rooting zone. To prevent drying due to forced aeration, the air was saturated with water vapor by passing it through a water tower, as shown in Figure 1. For irrigation and fertilization, a 1/2-concentration solution of standard Otsuka House No. 1 and No. 2 was used as a nutrient solution. The solution was supplied at 1 L d−1 for each cultivation container.
The net photosynthetic rate was measured using a photosynthesis system (Li-6400, Li-Cor, Inc., Lincoln, NE, USA). Leaf conductance was measured using a porometer (Li-1600, Li-Cor, Inc., Lincoln, NE, USA). Measurements were performed every 2-3 days after the plants were transferred from the cultivation greenhouse to an environmentally controlled chamber. The chamber was maintained at an air temperature of 23 °C, a relative humidity of 75%, a CO2 concentration of 0.04%, and a photosynthetic photon flux density of 300 μmol m−2 s−1.
2.2. Effect of Forced Aeration on Sweet Potato Growth in Cultivation Ridges
This study examined the growth of sweet potato grown in soil ridges with forced aeration and compared it with that grown in ridges with non-forced aeration. The relatively long-term effects of forced aeration on sweet potato growth were investigated by cultivating on ridges in loamy soil. The length, width, and height of each ridge were 10, 0.5, and 0.2 m, respectively. For fertilization, 200 g of compound fertilizer (8.0% ammonium nitrogen, 8.0% water-soluble potassium, and 8.0% water-soluble potassium) was mixed into the soil per meter of ridge length. Each nursery plant was planted 0.5 m apart. The experimental cultivation period was 111 days from mid-May to late August.
Atmospheric air was forced into the soil using an air pump and porous pipes to reduce CO2 concentrations in the rooting zone (Figure 2a). The forced-aeration air was saturated with water vapor by passing it through the water. The four ridges were used in the cultivation experiment. Half of each ridge was forcedly aerated to ensure uniform light conditions for each treatment area, and the other half was not forcedly aerated as a control (Figure 2b). To prevent edge effects, other cultivation ridges were established around the experimental ridges. The forced-aeration treatment was initiated 2 weeks after planting.
A plastic porous pipe (13 mm in diameter) was buried at a depth of 0.2 m in the center of each ridge, and fresh air was forced into the soil to decrease the soil CO2 concentration. The airflow rate per meter of ridge length was 1 L min−1. To prevent drying due to forced aeration, the air was humidified in a water tower until saturated with water vapor, then sent into the soil ridges, as shown in Figure 2a.
For the analysis of soil gas composition, soil gas samples were collected using soil air sampling tubes and syringes (Figure 2a) placed at depths of 1, 5, 10, 15, and 20 cm from the soil surface at the center of the ridge. Each sample volume was 1 mL. The CO2 and O2 in the sample gases were analyzed using gas chromatography (Model 633, Hitachi Co., Tokyo, Japan). Measurements were performed 30, 41, 52, 61, 72, and 90 days after the start of the experiment.
2.3. Effect of Forced-Aeration Airflow Rates on Sweet Potato Growth in Cultivation Ridges
The same type of ridges as those shown in Figure 2 were used in this experiment. The experimental ridges were set up with airflow rates of 1.25 and 2.5 L min-1 per meter of ridge length, and a non-forced aeration ridge was used as a control. For the analysis of soil gas composition, soil gases were collected in the same manner as shown in Figure 2a. Each forced-aeration treatment was initiated 2 weeks after planting. The experimental cultivation period was 69 days from early August to mid-October.
2.4. Effect of Forced-Aeration Time Intervals in the Rooting Zone on Sweet Potato Growth
The sweet potato was cultivated in containers (1 x 1 x 0.3 m3) filled with a loamy soil-vermiculite mixture (volume ratio 1:1) and placed in a greenhouse. Each forced-aeration treatment was initiated 2 weeks after planting. The experimental cultivation period was 60 days from early July to early September.
The rooting zone was forcedly aerated from the bottom of each container using air pumps (Figure 5). The forced-aeration air was saturated with water vapor by passing it through water at an aeration rate of 10 L min−1 per cultivation container. Time intervals of 4 and 24 h were applied, and continuously forced-aeration and non-forced-aeration ridges were established as controls. To prevent drying due to forced aeration, the air was humidified in a water tower until saturated with water vapor, then sent into the soil ridges, as shown in Figure 3.
For fertilization, 500 g of a compound fertilizer (8.0% ammonium nitrogen, 8.0% water-soluble phosphate, and 8.0% water-soluble potassium) was mixed into the soil before transplanting. Irrigation was performed daily until the 16th day after planting and every two days thereafter. The amount of water supplied each time was 10 L per cultivation container.
3. Results
3.1. Effect of CO2 in the Rooting Zone on Net Photosynthetic Rate and Leaf Conductance
The net photosynthetic rate of sweet potato under forced aeration with fresh air (control) remained almost constant for 34 days from day 2 to day 35 after treatment initiation. The net photosynthetic rate decreased by 20% 4 days after treatment initiation when the rooting zone was forcedly aerated with 1% CO2. The net photosynthetic rate decreased by 20% 2 days after treatment initiation when forced with 2% CO2. The net photosynthetic rate for both treatments decreased to 70% of the initial rate after 35 days. The conductance showed the same trend of the net photosynthetic rate. The values for both high-CO2 treatments decreased to 60% of their initial values.
Figure 4 shows the mean values of net photosynthetic rate and leaf conductance for sweet potato leaves from day 4 to day 35 after the start of the treatments. The mean net photosynthetic rates were 17.1, 14.0, and 12.7 µmol m−2 s−1 for the control, 1% CO2, and 2% CO2, respectively. The mean net photosynthetic rates for both elevated CO2 treatments were 82% and 74% of that in the control. As an indicator of transpiration rate, leaf conductance showed the same trend as the net photosynthetic rate. The mean leaf conductance over 35 days was 0.20, 0.14, and 0.13 m s−1 for the control, 1% CO2, and 2% CO2, respectively, indicating that the mean leaf conductance for both elevated CO2 treatments was approximately 70% and 65% of that in the control, respectively.
3.2. Effect of Forced Aeration in the Rooting Zone on Sweet Potato Growth
Figure 5 shows the distributions of CO2 concentrations in dry and wet soil ridges before and after rainfall. The dry ridge surface was relatively dry, and the pF value at a depth of 10 cm in the center of the ridge was 2.8 (equivalent to a water potential of -0.062 MPa). The pF value for the wet ridge was 1.8 (equivalent to a water potential of -0.006 MPa).
The CO2 concentrations in the non-forced aeration ridge increased with depth (Figure 5B,D). The CO2 concentrations were higher, and the change in CO2 concentration with distance from the aeration pipe was more drastic when the soil was wetted by rainfall than when it was dry (Figure 5). When the soil was relatively dry, the CO2 concentration was 0.2% and 0.7% at depths of 5 and 15 cm, respectively, at the center of the non-aeration ridge (Figure 5B). The CO2 concentration in the forced aeration ridge was almost uniformly 0.2–0.3%, even at a depth of 15 cm (Figure 5A). The CO2 concentrations in the wet ridges were higher than those in the dry ridges (Figure 5C,D). Forced aeration significantly reduced CO2 concentrations. For example, at a depth of 15 cm in the center of the ridge, the CO2 concentration was decreased to 0.4% for the aeration ridge (Figure 5C) from 1.2% for the non-forced aeration ridge (Figure 5D). Thus, forced aeration appeared to have a greater influence on CO2 reduction, especially when the soil was wet.
Figure 6 shows the cultivation landscape at the end of the experimental period and the root system just before the harvest survey. The rooting system, including tuberous roots, showed vigorous growth in the forced aeration ridge compared with that in the non-forced aeration ridge.
Figure 7 shows the effect of forced aeration on the growth characteristics of sweet potato grown for 111 days. The fresh weights of foliage and tuberous roots in the forced-aeration ridge were 21% and 18% higher than those in the non-forced-aeration ridge, respectively. The dry weights of foliage and tuberous roots in the forced aeration ridge were 28% and 19% higher than those in the non-forced aeration ridge. Thus, when the soil was forcedly aerated at the rate of 1 L min−1 per meter of ridge length, the yield of tuberous roots was approximately 1.2 times higher than that in the non-forced aeration.
3.3. Effect of Forced Aeration Airflow Rates on Sweet Potato Growth in Cultivation Ridges
The CO2 concentration tended to increase with increasing distance from the soil surface in the non-forced aeration ridge (Figure 8). In the ridge forcedly aerated with atmospheric air at the rate of 1.25 L min−1, the CO2 concentration at depths of 5–10 cm was higher than that at depths of 15–20 cm. At a depth of 15 cm, the CO2 concentrations in the non-forced aeration (control), 1.25 L min−1, and 2.5 L min−1 treatments ranged from 0.5% to 1.4%, 0.2% to 0.3%, and 0.1% to 0.2%, respectively. The CO2 concentrations decreased as the aeration rate increased. At the ridge, forcedly aerated at 2.5 L min−1, the CO2 concentration was lowest at every depth.
Figure 9 shows the growth characteristics of sweet potatoes treated with different forced-aeration rates. The dry weight of tuberous roots at aeration rates of 1.25 and 2.5 L min−1 was 19% and 26% higher than that of the control. The fresh weight of foliage (leaves and stems) at the rate of 2.5 L min−1 was also 26% higher than that of the control. Sweet potato growth was promoted when forced aeration reduced the CO2 in the ridge.
3.4. Effects of Forced-Aeration Time Intervals in the Rooting Zone on Sweet Potato Growth
Figure 10 shows an example of the daily change in soil CO2 concentration in each treatment 12 days after the initiation of forced-aeration treatment. Each value represents the average CO2 concentration at depths of 5, 10, and 15 cm. After irrigation at 11:00, the CO2 concentration in the non-forced aeration soil increased by 0.5% from 1.1% to 1.6%, then gradually decreased. In contrast, forced aeration lasted for 15 min at 13:00 in the 24-hourly forced-aeration treatment, thus, the increase in CO2 concentration due to irrigation was limited to 0.15%. A significant decrease in CO2 concentration was observed in the 4-h forced aeration treatment. In continuous forced-aeration treatment, daily CO2 concentration changes were almost negligible. The average daily CO2 concentrations were 1.2%, 0.8%, 0.5%, and 0.1% in the non-forced-aeration treatment, 24-hourly forced-aeration treatment, 4-hourly forced-aeration treatment, and continuous forced-aeration treatment, respectively. The shorter the forced-aeration interval, the higher the increase in soil CO2 concentration.
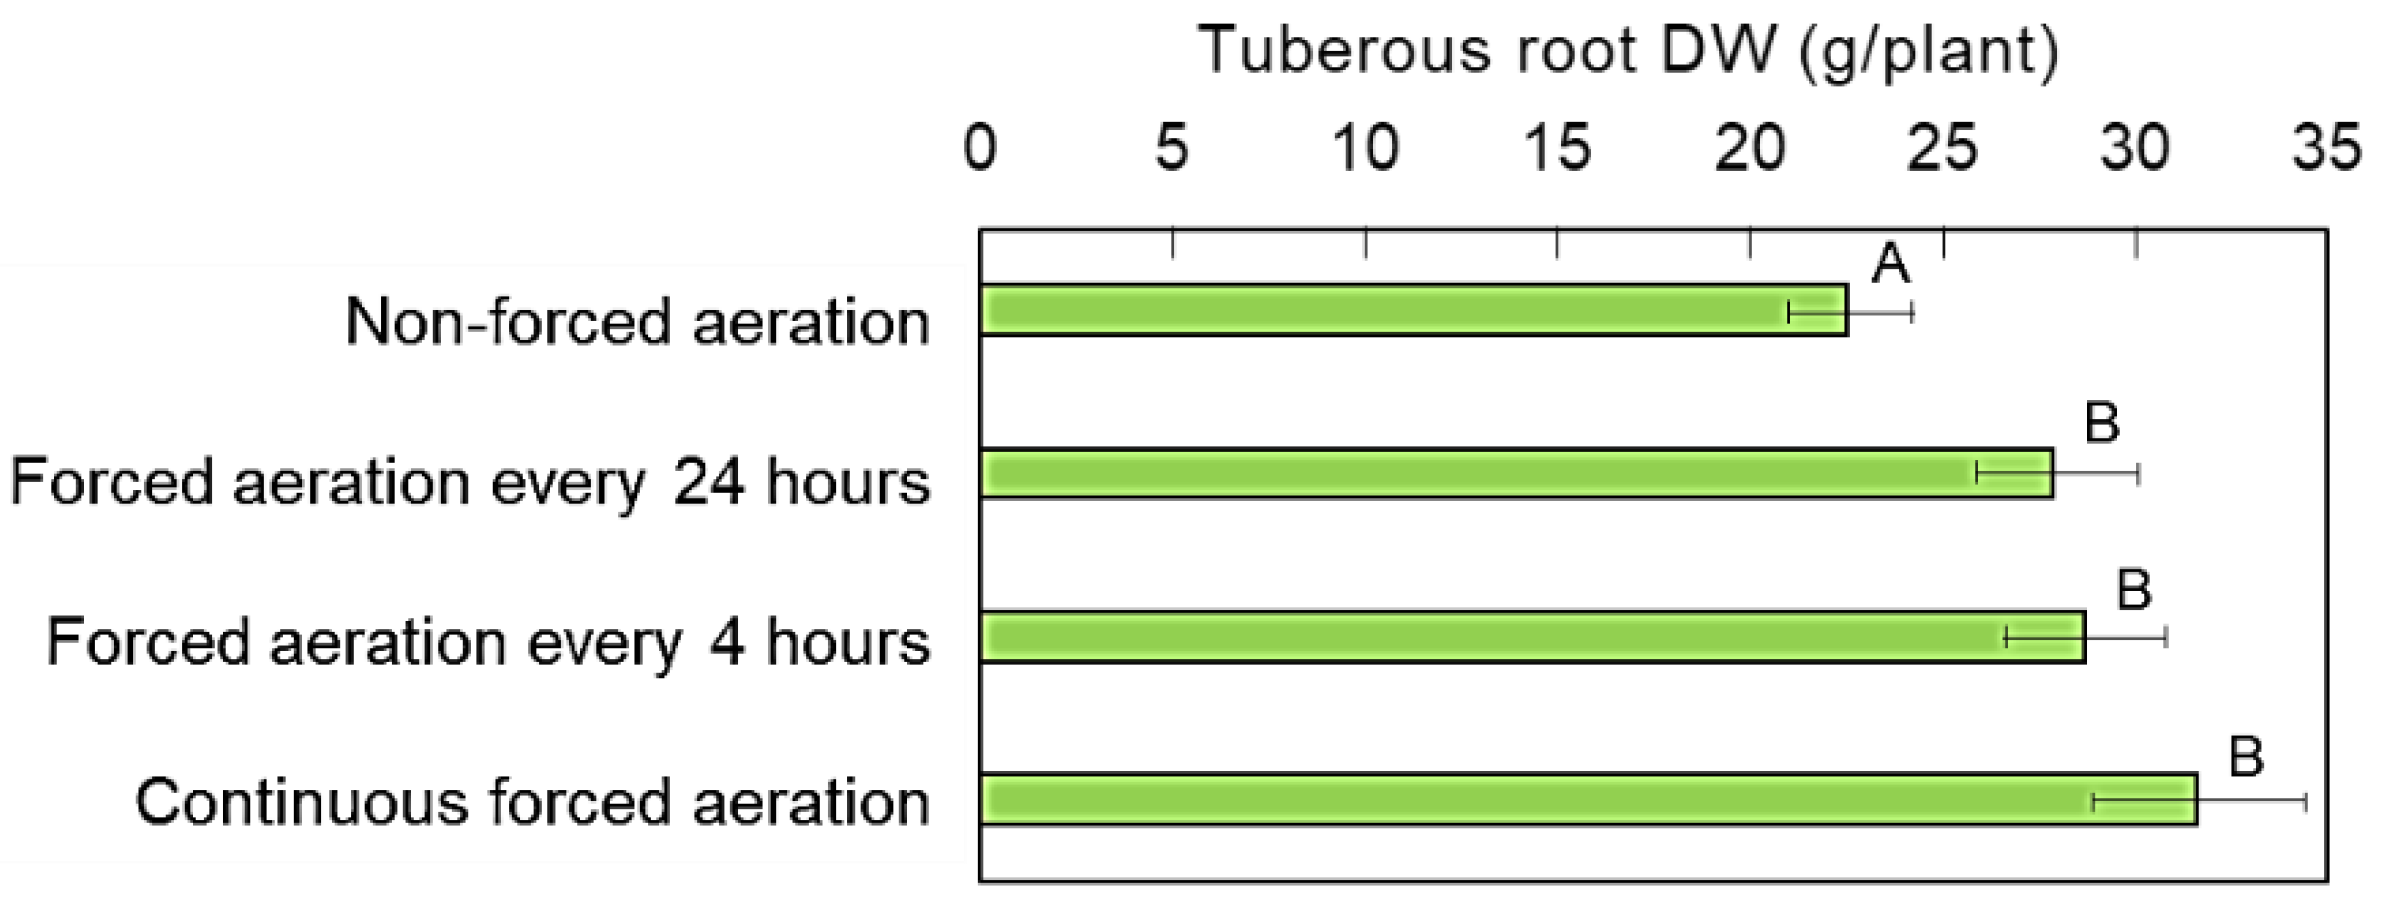
In this experiment, sweet potato plants were cultivated with a leaf number of 10 per plant; therefore, differences in aboveground dry weight between treatments are unclear. Figure 11 shows the growth characteristics of sweet potato treated with different forced-aeration intervals. Forced-aeration increased by 24%, 27%, and 40% compared with the non-forced-aeration treatment for the 24-hourly, 4-hourly, and continuous forced-aeration treatments, respectively. The shorter the forced-aeration interval and the lower the soil CO2 concentration, the higher the tuberous root yield of sweet potato. Forced aeration for 15 min once a day was found to maintain low soil CO2 concentrations and effectively promote sweet potato growth.
4. Discussion
The O2 concentration in the rooting zone was 19–20% throughout this study. Decreased soil O2 concentration inhibits the growth of many plant species. O2 concentrations lower than 10% retard tuberous root formation in sweet potatoes, which can partly account for the poor performance of sweet potatoes in waterlogged soils [27].
Previous studies have qualitatively demonstrated the adverse effects of elevated soil CO2 on plant growth. The root biomass of creeping bentgrass (Agrostis palustris) decreased when soil CO2 concentrations exceeded 2.5% [28]. Elevated soil CO2 concentrations between 0.5% and 2% suppress the growth of bamboo [20] and carrot [21]. Sweet potato growth was also suppressed when soil CO2 concentrations increased from 0.5 to 2% [22,23,25].
Soil moisture conditions affect sweet potato growth throughout the growing season [29]. The effects of flooding on the growth of several field crops, including sweet potato, and the harmful effects of waterlogging on sweet potato tubers were examined. The literature on the effects of excess soil moisture on sweet potato performance is limited. Pardales and Escalante (1978) [30] reported that tuber formation is highly dependent on the soil water table, with shallow water tables resulting in fewer marketable tubers. The yield of sweet potato tuber decreased when the irrigation water was excessive [31]. Increased soil aeration through the insertion of plastic porous pipes into the soil ridges to reduce CO2 concentrations under an excess soil moisture condition improved the tuberous root biomass production to four times that observed in soil without porous pipes [22], indicating that soil aeration can considerably affect the tuberous root formation of sweet potato, especially under wet soil conditions.
The CO2 concentrations were higher, and the decrease in CO2 concentration with forced aeration was more significant when the soil was wet than when it was dry (Figure 5). The CO2 concentration in the soil decreased rapidly due to the irrigation-induced increase in the gaseous diffusion coefficient. Then, it decreased very slowly because of the slow recovery of the coefficient [32]. Therefore, forced aeration is more effective in reducing CO2 concentration in wetter soil.
Leaf conductance decreased by 30% as soil CO2 concentration increased to 2% (Figure 4). Because there is generally a positive relationship between transpiration rate and leaf conductance, it is estimated that transpiration is suppressed as the rooting-zone CO2 concentration increases. There is also generally a positive relationship between the net photosynthetic rate and leaf conductance. The net photosynthetic rate decreased by 20% as the CO2 concentration increased to 1-2% in the soil (Figure 4). This means that increased CO2 in the rooting zone would also suppress photosynthesis in leaves and, thus, plant biomass production. Consequently, soil water content can be manipulated to control soil gas composition.
The CO2 level in the air adhering to the root surface is expected to be higher than the average CO2 level in the rooting zone, even in well-cultivated soil, because CO2 takes some time to diffuse from the root surface into the rooting zone aerial space. Therefore, the effect of aeration in the rooting zone may not only be to reduce CO2 in the rooting zone but also at the root surface.
Forced aeration for 15 min once a day increased the sweet potato yield by 24% (Figure 11). Therefore, yields are expected to rise when intermittent forced aeration is combined with air pumps and solar power generation if the production cost budget allows.
5. Conclusions
Forced aeration into the rooting zone could decrease CO2 concentrations and increase the sweet potato yield by 20%. The sweet potato yield can be increased with forced aeration for 15 min per day. The proposed forced-aeration method can be applied to other root crops, such as carrots.
Forced aeration in the rooting zone can potentially improve yield of root crops. If forced aeration is introduced into production fields, it is expected to increase yields compared to conventional cultivation. This would prevent growth inhibition caused by excess soil moisture and increase the productivity of root vegetables, such as sweet potato.
References
- World Health Organization. World health statistics 2025: Monitoring health for the SDGs, Sustainable Development Goals. World Health Organization. 2025.
- Food and Agriculture Organization of the United Nations. Available online: https://openknowledge.fao.org/server/api/core/bitstreams/11189609-7fd0-49c7-b234-eef18ab7ed17/content.
- Cheung, J. T. H.; Lok, J.; Gietel-Basten, S.; Koh, K. The food environments of fruit and vegetable consumption in East and Southeast Asia: A systematic review. Nutrients 2021, 13, 148. [Google Scholar] [CrossRef] [PubMed]
- Liu, J.; Wang, M.; Yang, L.; Rahman, S.; Sriboonchitta, S. Agricultural productivity growth and its determinants in south and southeast asian countries. Sustainability 2020, 12, 4981. [Google Scholar] [CrossRef]
- Truong, V.D.; Avula, R.Y.; Pecota, K.V.; Yencho, G.C. Sweetpotato production, processing, and nutritional quality. Handbook of vegetables and vegetable processing; 2018; pp. 811-838.
- Alam, M.K.A. comprehensive review of sweet potato (Ipomoea batatas L. Lam): Revisiting the associated health benefits. Trends Food Sci. Technol. 2021, 115, 512–529. [Google Scholar] [CrossRef]
- Tedesco, D.; de Almeida Moreira, B. R.; Júnior, M. R. B.; Maeda, M.; da Silva, R. P. Sustainable management of sweet potatoes: A review on practices, strategies, and opportunities in nutrition-sensitive agriculture, energy security, and quality of life. Agricultural Systems 2023, 210, 103693. [Google Scholar] [CrossRef]
- van Jaarsveld, P.J.; Faber, M.; Tanumihardjo, S.A.; Nestel, P.; Lombard, C.J.; Benadé, A.J.S. β-Carotene–rich orange-fleshed sweet potato improves the vitamin A status of primary school children assessed with the modified-relative-dose-response test 1–3. Am J Clin Nutr 2005, 81, 1080–1087. [Google Scholar]
- Mounika, V.; Gowd, T.Y. M.; Lakshminarayana, D.; Krishna, G.V.; Reddy, I.V.; Soumya, B.K. Reddy, P.M. Sweet potato (Ipomoea batatas (L.) Lam): a comprehensive review of its botany, nutritional composition, phytochemical profile, health benefits, and future prospects. European Food Research and Technology 2025, 1-15.
- Motsa, N.M.; Modi, A.T.; Mabhaudhi, T. Sweet potato (Ipomoea batatas L.) as a drought tolerant and food security crop. South African J. Sci. 2015, 111, 1–8. [Google Scholar] [CrossRef]
- Woolfe, 1992Woolfe, J. A. Sweet potato: an untapped food resource. Cambridge University Press. 1992.
- Ahn, Y.S.; Jeong, B.C.; Oh, Y.B. Production and utilization of sweet potato in Korea. In “Proceedings of International workshop on sweet potato production system toward the 21st century”. National Agricultural Experiment Station in Kyushu, Japan, 1998, pp. 137-147.
- Amagloh, F.C.; Yada, B.; Tumuhimbise, G.A.; Amagloh, F.K.; Kaaya, A.N. The potential of sweet potato as a functional food in sub-Saharan Africa and its implications for health: a review. Molecules 2021, 26, 2971. [Google Scholar]
- Islam, A.F.M.S.; Kitaya, Y.; Hirai, H.; Yanase, M.; Mori, G.; Kiyota, M. Growth characteristics and yield of sweet potato grown by a modified hydroponic cultivation method under field conditions in a wet lowland. Environ. Control in Biol. 1997, 35, 123–129. [Google Scholar]
- Ishiguro, K.; Yoshimoto, M. Content of the eye-protective nutrient lutein in sweet potato leaves: Concise Papers of the Second International Symposium on sweet potato and Cassava. Kuala Lumpur, Malaysia, 2005, pp. 213–214.
- Yoshimoto, M. Sweet potato as a multifunctional food. Proceedings of International work shop on sweet potato production system toward the 21st century, Kyushu National Agricultural Experiment Station, Japan, 1998, pp. 273-283.
- Drew, M.C. Oxygen Deficiency and Root Metabolism: Injury and Acclimation under Hypoxia and Anoxia Annual Review of Plant Physiology and Plant Molecular Biology 1997, 48, 223-250.
- Bunnell, B. T.; McCarty, L. B.; Hill, H. S. Soil gas, temperature, matric potential, and creeping bentgrass growth response to subsurface air movement on a sand-based golf green. HortScience 2004, 39, 415–419. [Google Scholar] [CrossRef]
- Kitaya, Y.; Yabuki, K.; Kiyota, M. Studies on the control of gaseous environment in the rhizosphere. (2) Effect of carbon dioxide in the rhizosphere on the growth of cucumber. J. Agr. Met. 1984, 40, 119–124, (in Japanese with English abstract, tables, and figures). [Google Scholar]
- Wei, X.; Kitaya, Y.; Shibuya, T.; Kiyota, M. Effects of soil gas composition on transpiration and leaf conductance Journal of Agricultural Meteorology 2005, 60, 845-848.
- Islam, A.F.M.S.; Kitaya, Y.; Hirai, H.; Yanase, M.; Mori, G.; Kiyota, M. Growth characteristics and yield of carrots grown in a soil ridge with a porous tube for soil aeration in a wet lowland. Scientia horticulturae 1998, 77, 117–124. [Google Scholar]
- Islam, A. F. M. S.; Kitaya, Y.; Hirai, H.; Yanase, M.; Mori, G.; Kiyota, M. Growth characteristics and yield of sweet potato (Ipomoea batatas) grown by a modified hydroponic cultivation method under field conditions in a wet lowland Environment Control in Biology 1997, 35, 123-129.
- Siqynbatu; Kitaya, Y.; Hirai, H.; Endo, R.; Shibuya, T. Effects of water contents and CO2 concentrations in soil on growth of sweet potato. Field Crops Research 2013, 152, 36–43. [Google Scholar] [CrossRef]
- Bouma, T. J.; Nielsen, K. L.; Eissenstat, D. M.; Lynch, J. P. Soil CO2 concentration does not affect growth or root respiration in bean or citrus. Plant, Cell & Environment 1997, 20, 1495–1505. [Google Scholar] [CrossRef]
- Islam, A.F.M.S.; Kitaya, Y.; Hirai, H.; Yanase, M.; Mori, G.; Kiyota, M. Effects of placing rice straw, wheat straw, and rice husks in soil ridges on growth, morphological characteristics, and yield of sweet potato in wet lowlands. J. Agric. Meteorol. 1997, 53, 201–207. [Google Scholar]
- Islam, A.F.M.S.; Kitaya, Y.; Hirai, H.; Yanase, M.; Mori, G.; Kiyota, M. Sweet potato cultivation with rice husk charcoal as a soil aerating material under wet lowland field conditions. Environ Control in Biol. 1998, 36, 13–20. [Google Scholar] [CrossRef]
- Watanabe, K.; Ozaki, K.; Yashiki, T. Studies on the Effects of Soil Physical Conditions on the Growth and Yield of Crop Plants: VII. Effects of soil air composition and soil bulk density and their interaction on the growth of sweet potato. Japanese Journal of Crop Science 1968, 37, 65–69. [Google Scholar] [CrossRef]
- Bunnell, B.T.; McCarty, L.B.; Hill, H.S. Soil gas, temperature, matric potential, and creeping bentgrass growth response to subsurface air movement on a sand-based golf green. HortScience 2004, 39, 415–419. [Google Scholar] [CrossRef]
- Rao, R.; Li, Y. Management of flooding effects on growth of vegetable and selected field crops. Philippine Journal of Crop Science 2003, 3, 610–616. [Google Scholar]
- Pardales, J.J.; Escalante, M.C. The effect of various water table depths on the growth and yield of sweet potato. Philippine Journal of Crop Science 1978, 3, 58–59. [Google Scholar]
- Thompson, P. G.; Smittle, D. A.; Hall, M. R. Relationship of sweetpotato yield and quality to amount of irrigation. HortScience 1992, 27, 23–26. [Google Scholar] [CrossRef]
- Kitaya, Y.; Yabuki, K. Studies on the Control of Gaseous Environment in the rhizosphere. (1) Changes in CO2 concentration and gaseous diffusion coefficient in soils after illigation. J. Agr. Met. 1984, 40, 1–7, (in Japanese with English abstract, tables, and figures). [Google Scholar]
Figure 1.
Outline of the experimental cultivation system with forced aeration into the rooting zone with air containing different CO2 concentration air.
Figure 1.
Outline of the experimental cultivation system with forced aeration into the rooting zone with air containing different CO2 concentration air.
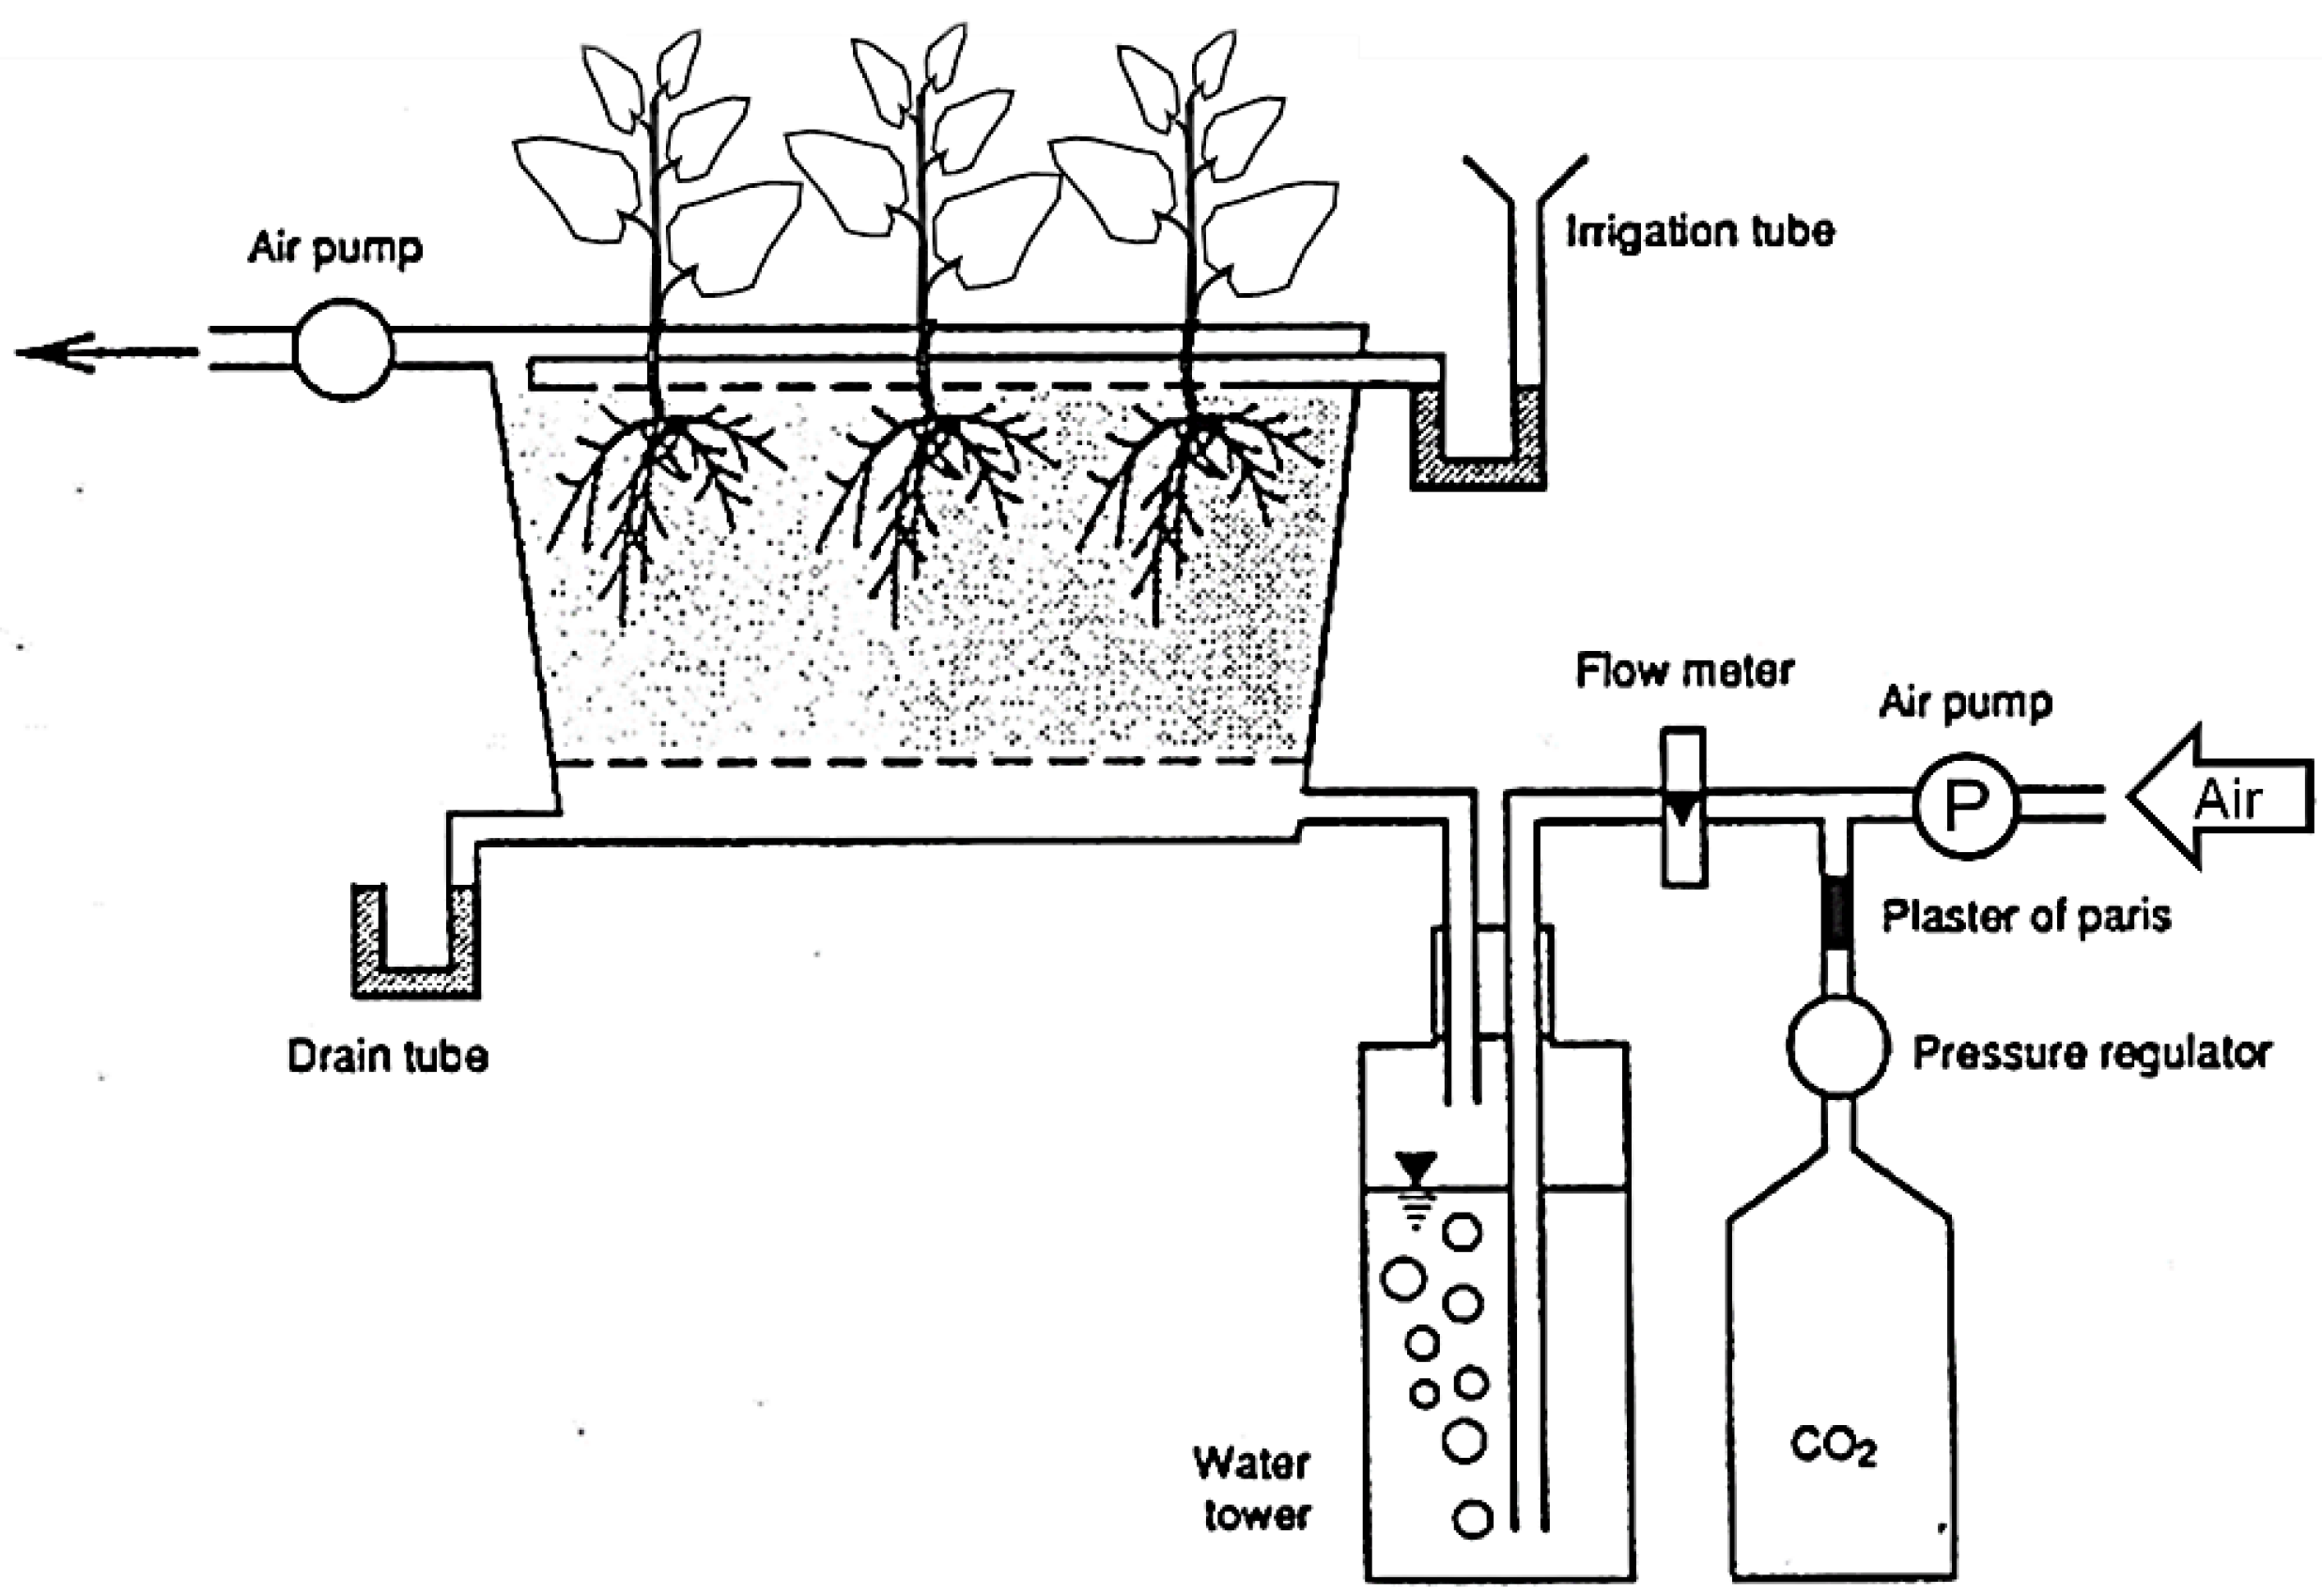
Figure 2.
Overview of the aeration and soil gas sampling methods for each cultivation ridge to examine the effect of forced aeration on sweet potato growth. (a) Forced aeration and soil gas sampling methods for each cultivation ridge. (b) Layout of cultivation ridges.
Figure 2.
Overview of the aeration and soil gas sampling methods for each cultivation ridge to examine the effect of forced aeration on sweet potato growth. (a) Forced aeration and soil gas sampling methods for each cultivation ridge. (b) Layout of cultivation ridges.
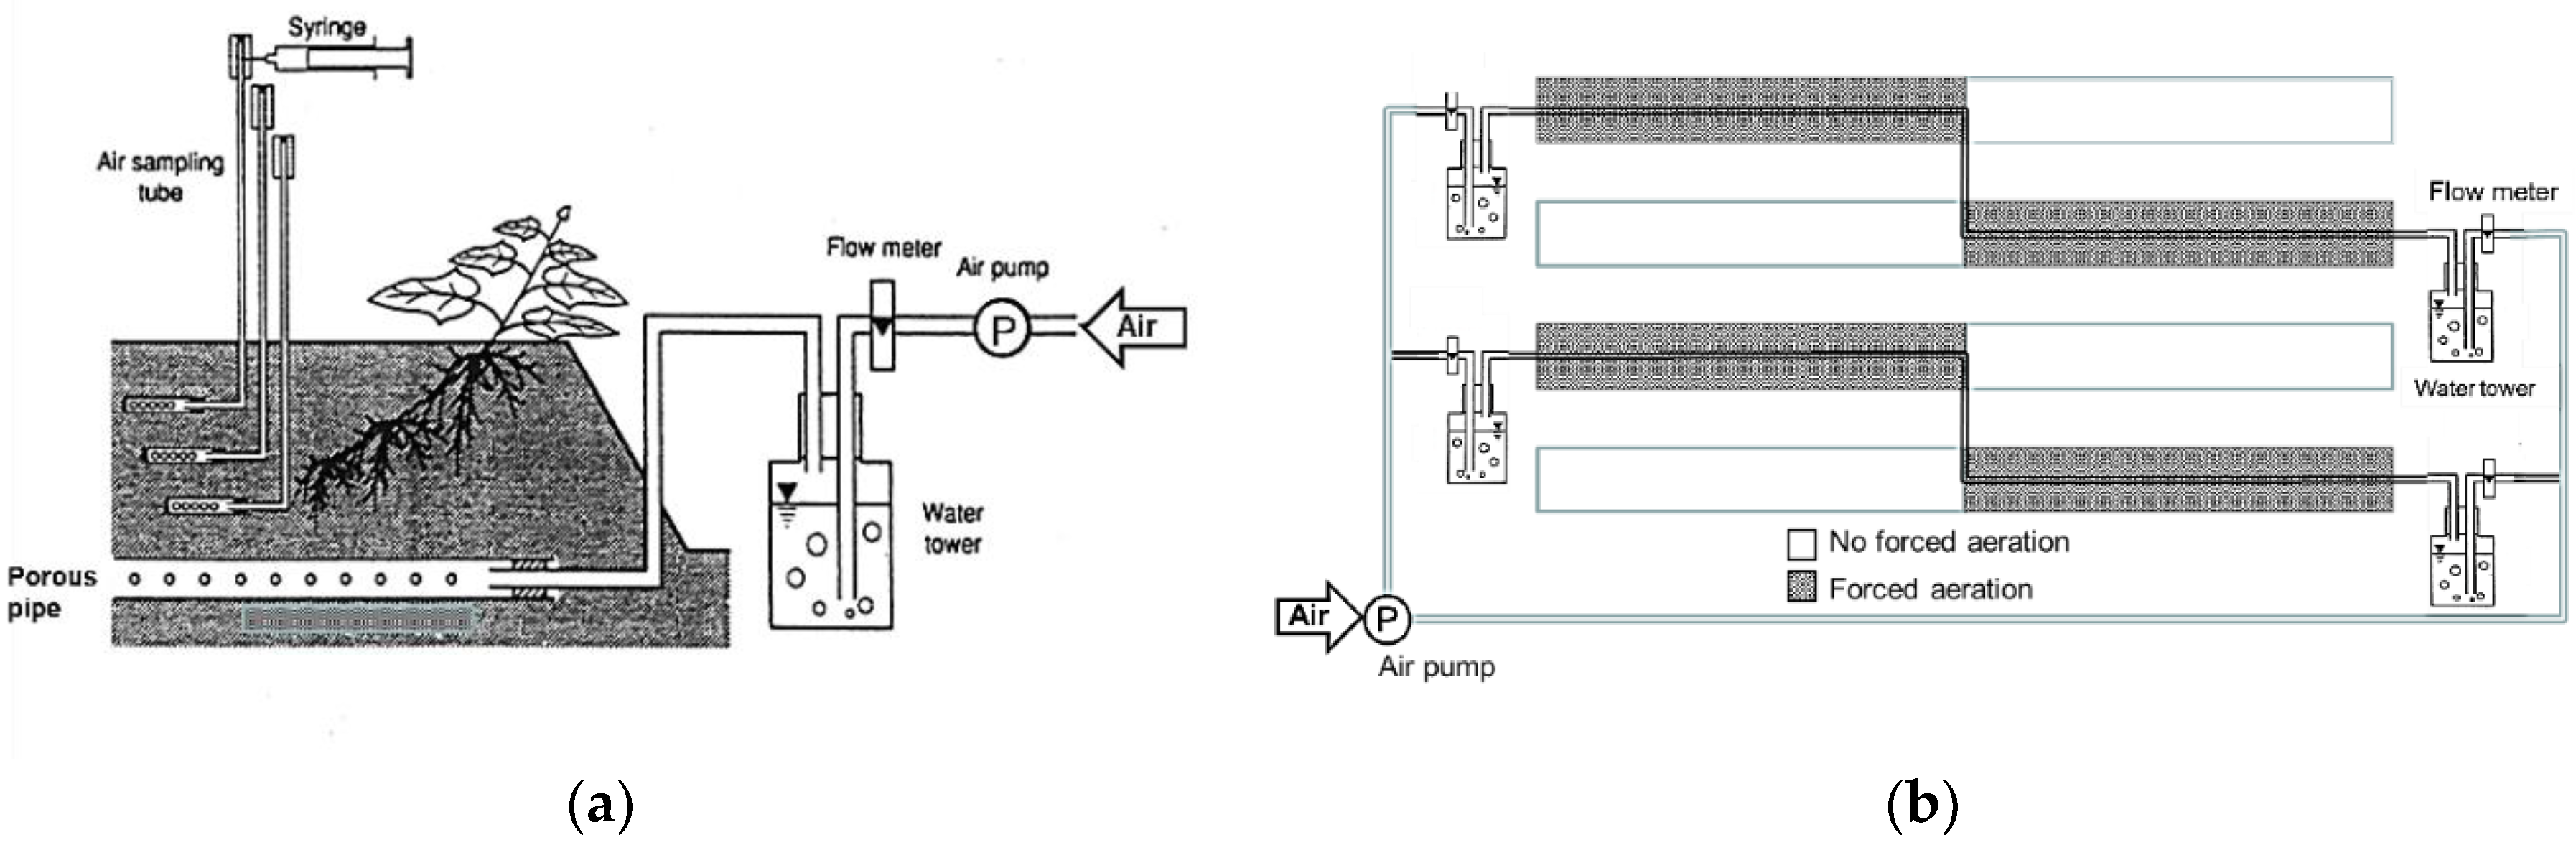
Figure 3.
Outline of the experimental cultivation system with forced aeration into the rooting zone at different time intervals.
Figure 3.
Outline of the experimental cultivation system with forced aeration into the rooting zone at different time intervals.
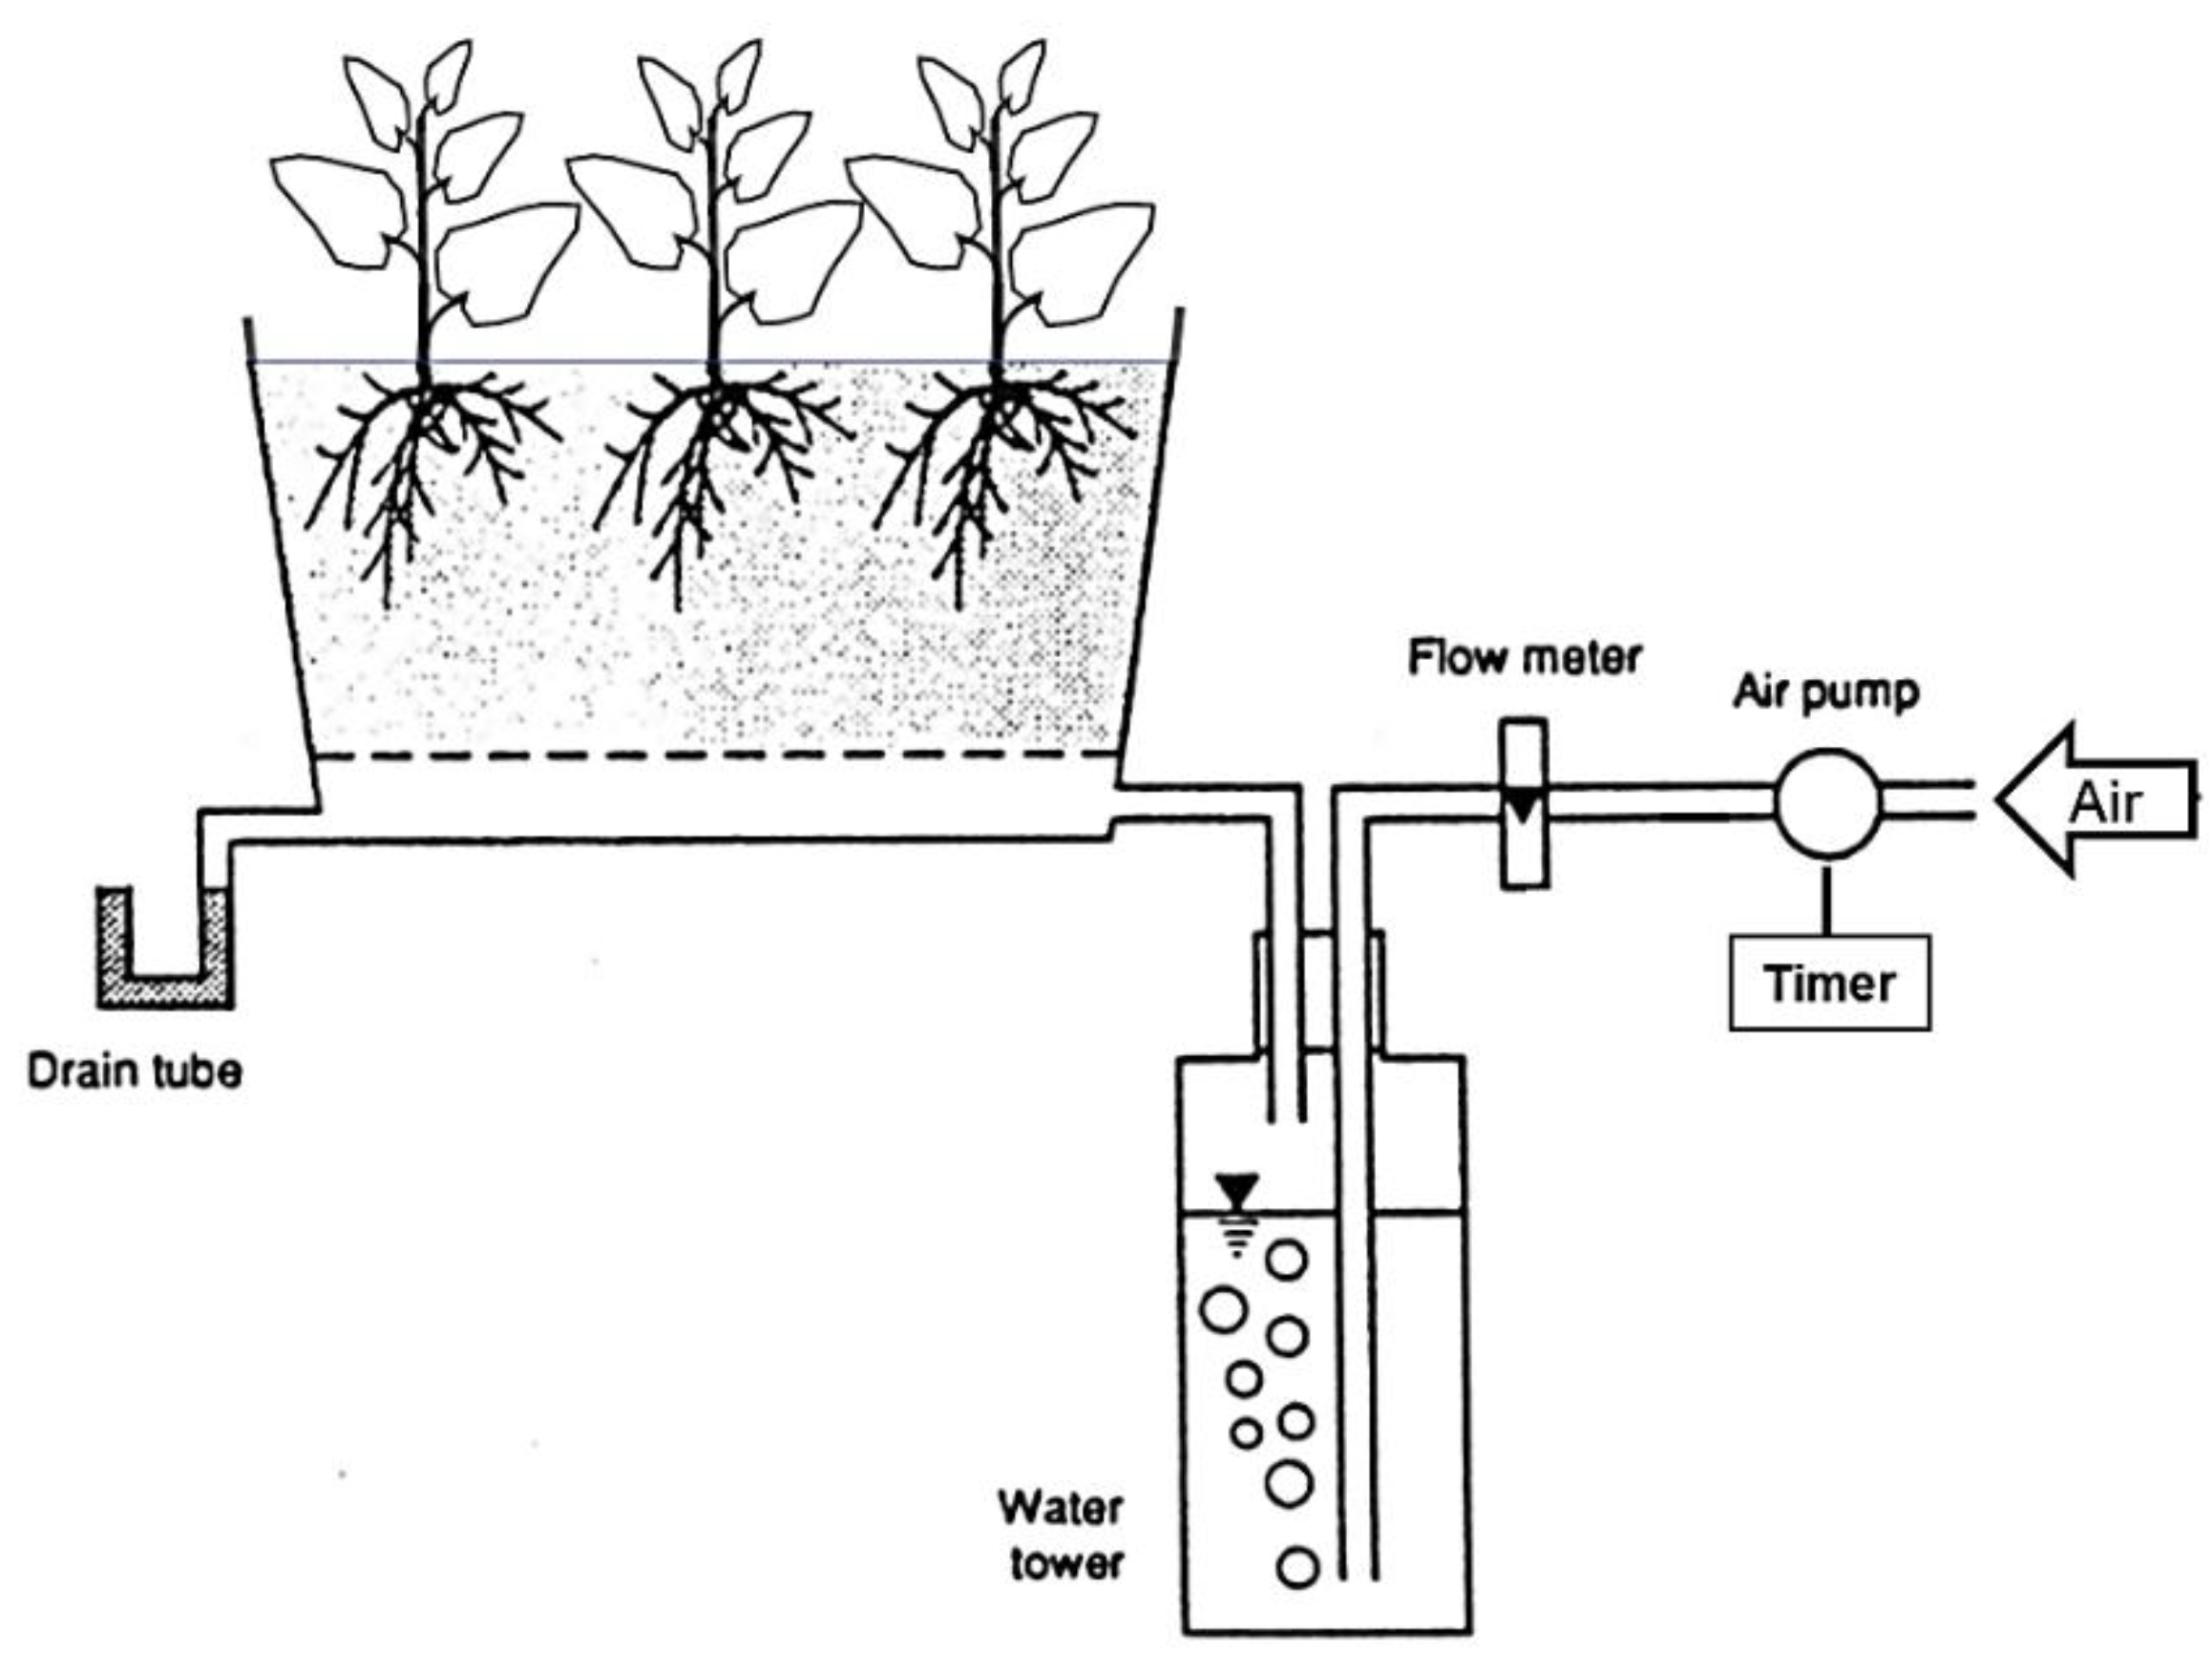
Figure 4.
Effects of CO2 in the rooting zone on mean values of net photosynthetic rate and leaf conductance for sweet potato leaves from 4 to 35 days after the start of the treatments.Mean values ± S.D. with the same letter are not significantly different based on analysis of variance (ANOVA) followed by Tukey’s HSD test at p < 0.05.
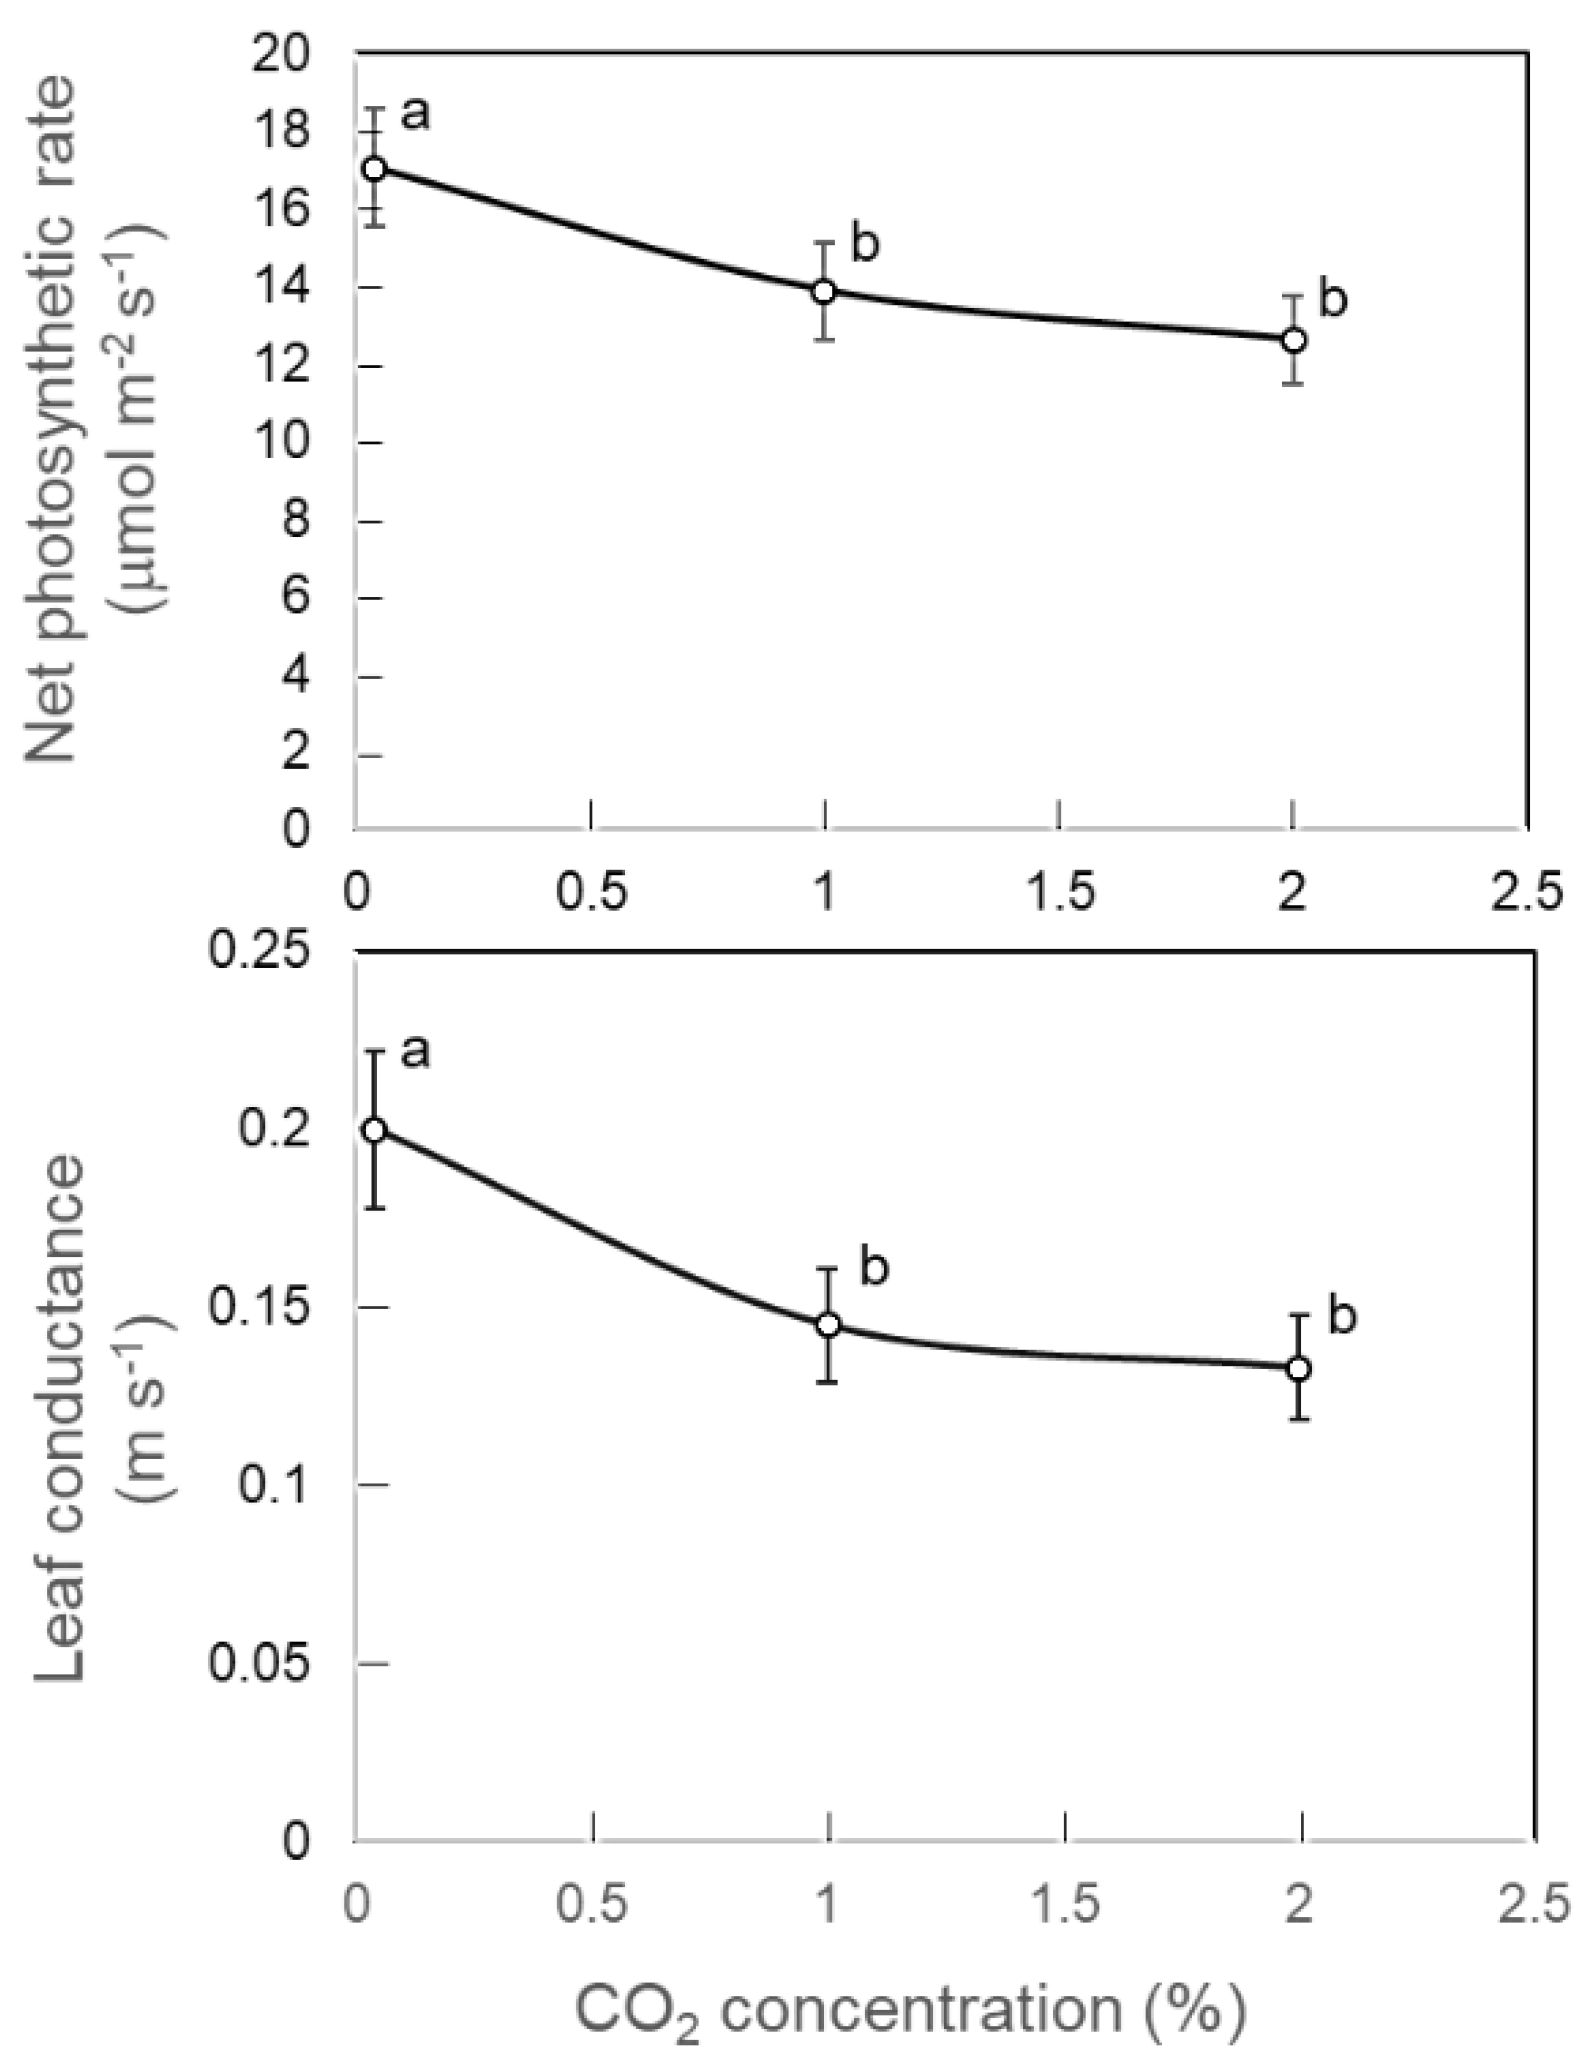
Figure 5.
Distribution of CO2 concentrations in dry (A and B) and wet (C and D) soil ridges with and without forced aeration.
Figure 5.
Distribution of CO2 concentrations in dry (A and B) and wet (C and D) soil ridges with and without forced aeration.
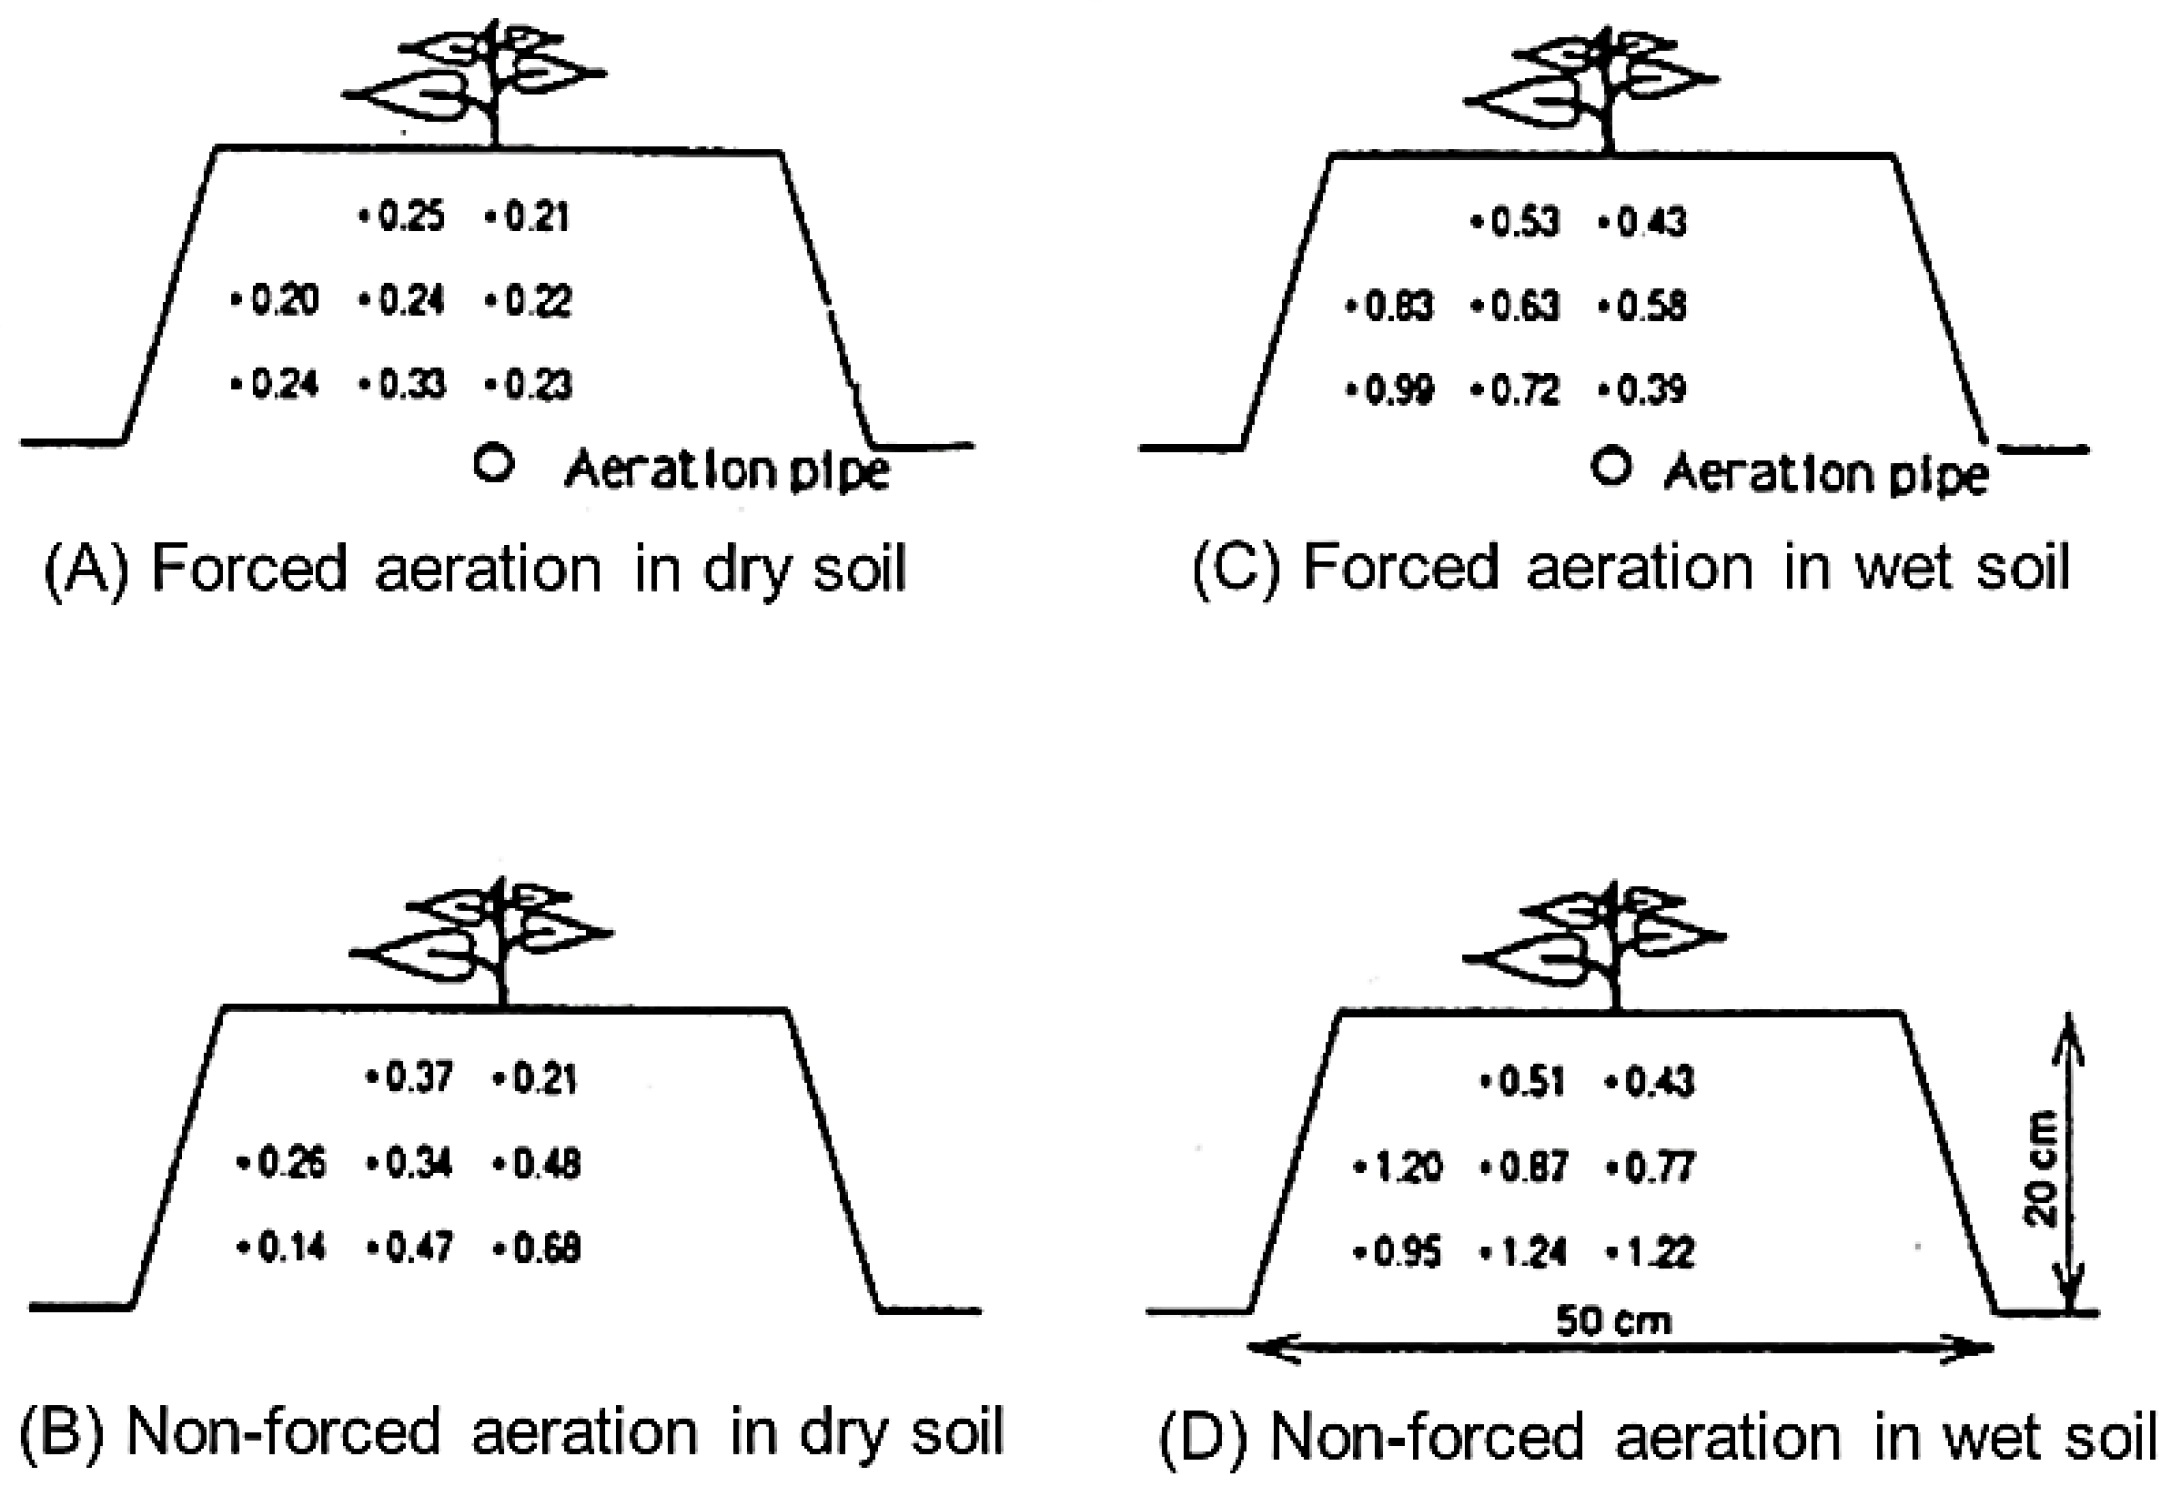
Figure 6.
Photographs of the experimental field and tuberous roots in forcedly aerated and non-forcedly-aerated ridges.
Figure 6.
Photographs of the experimental field and tuberous roots in forcedly aerated and non-forcedly-aerated ridges.
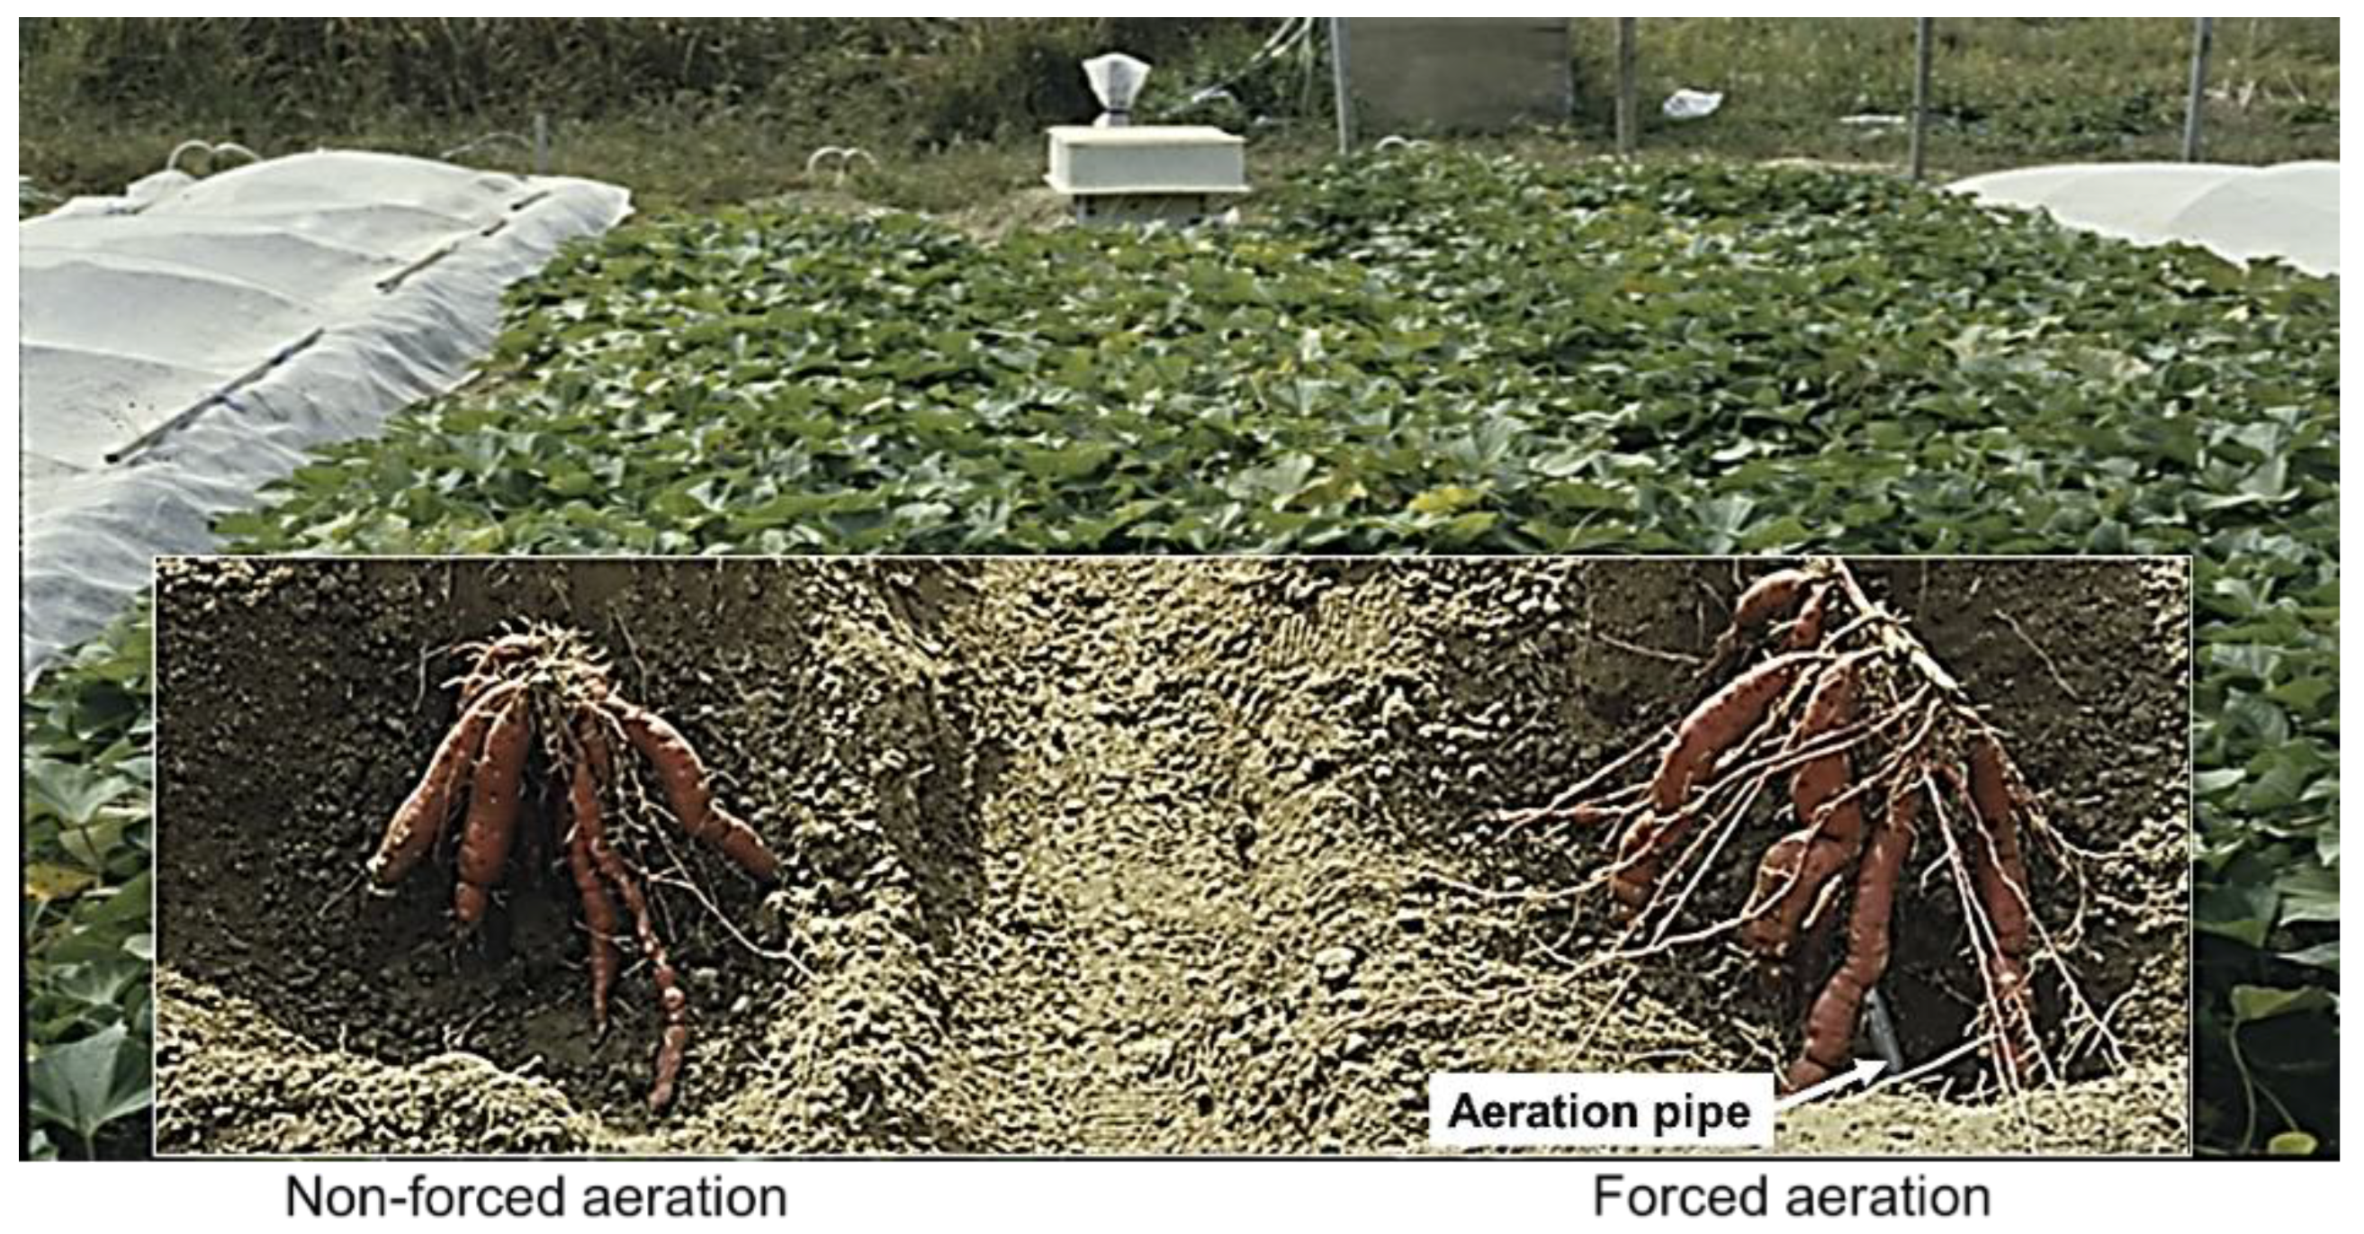
Figure 7.
Effects of forced aeration on sweet potato growth. Mean values ± S.D. with the same letter are not significantly different based on ANOVA followed by Tukey’s HSD test at p < 0.05.
Figure 7.
Effects of forced aeration on sweet potato growth. Mean values ± S.D. with the same letter are not significantly different based on ANOVA followed by Tukey’s HSD test at p < 0.05.
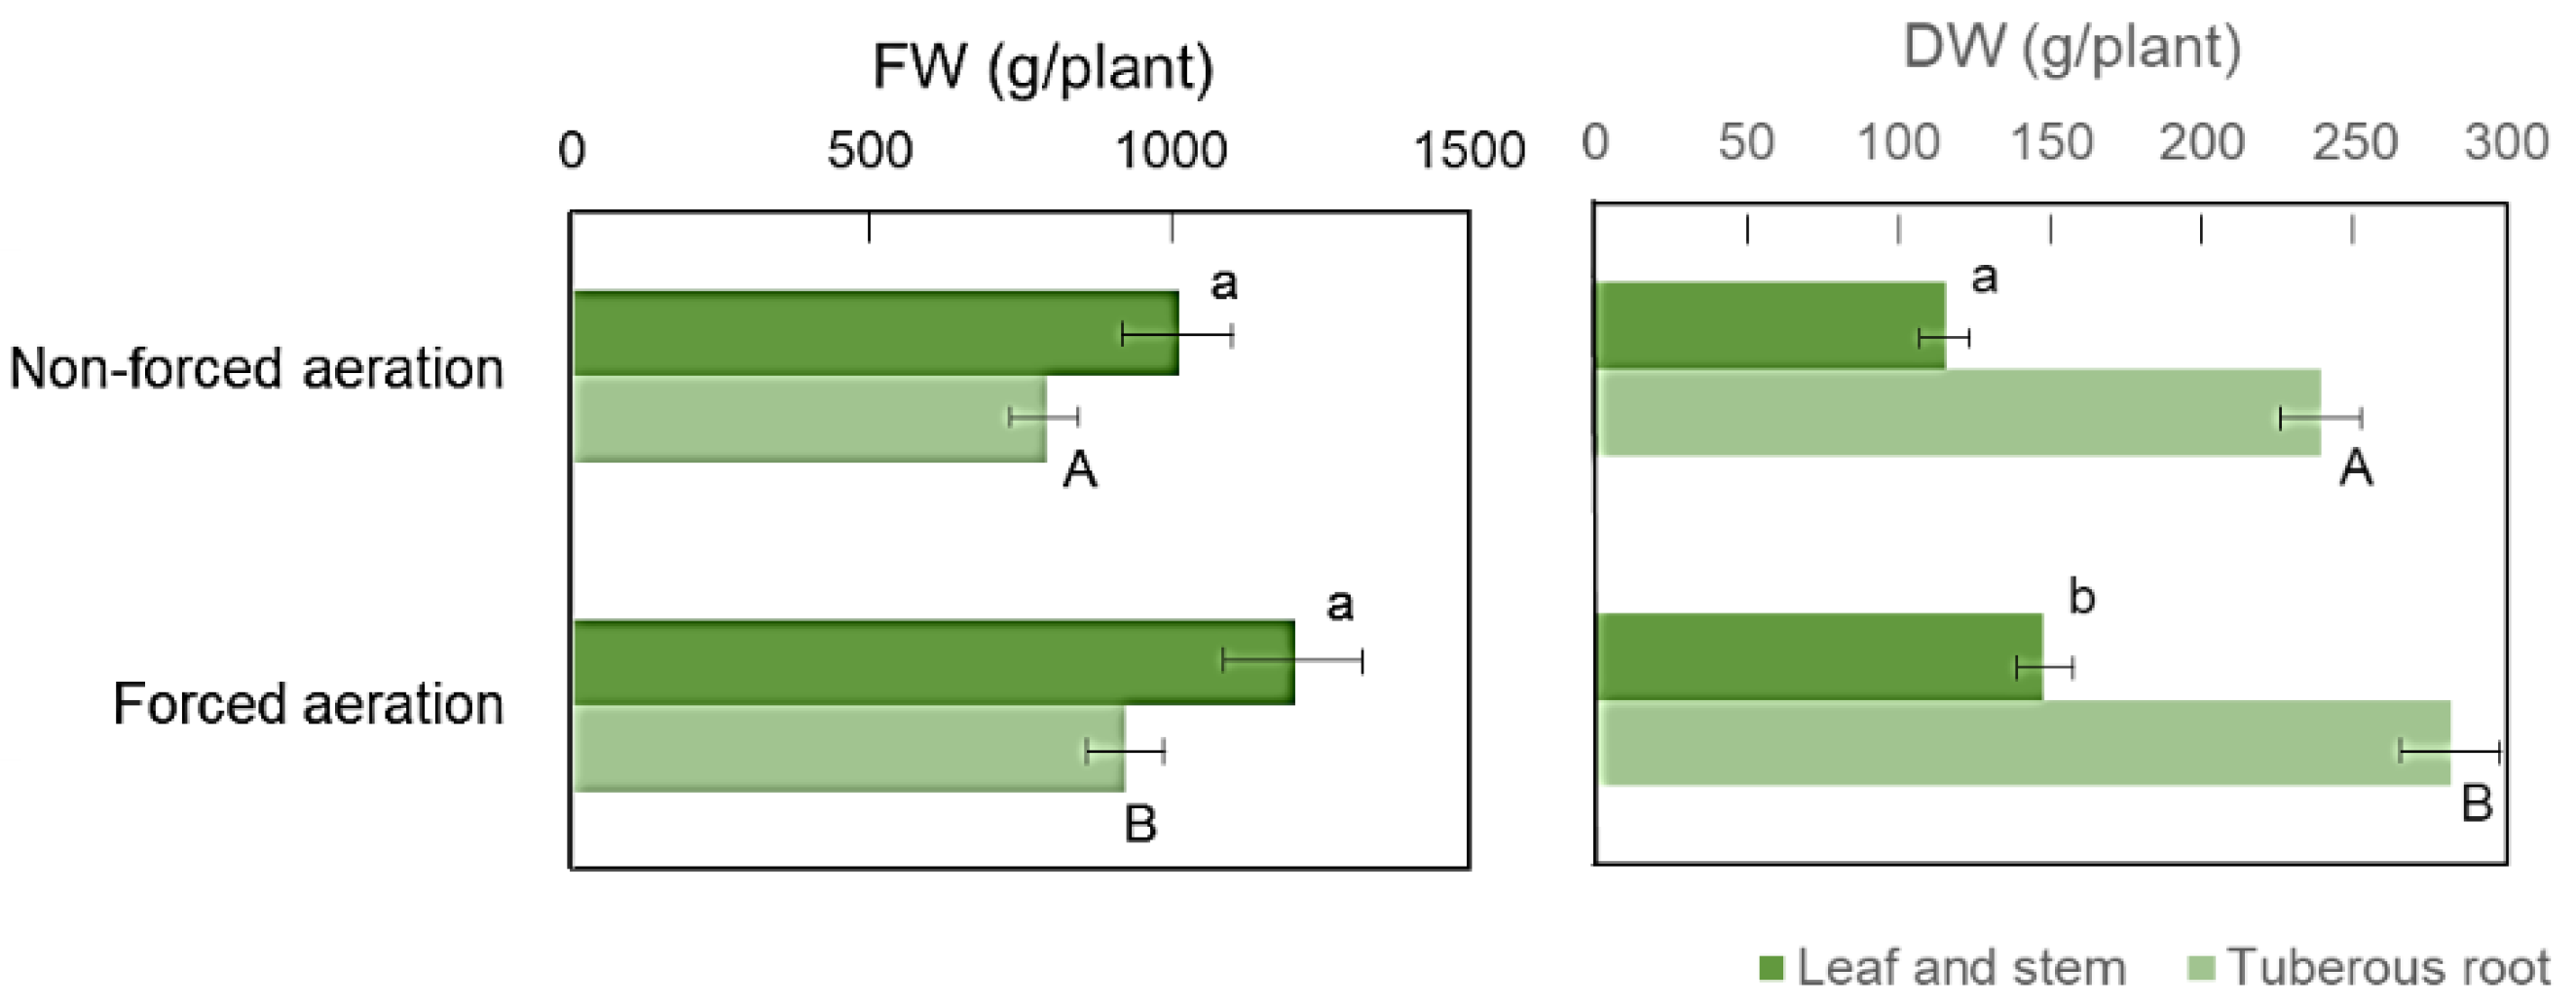
Figure 8.
Profiles of CO2 concentrations in soil with non-forced aeration and airflow rates of 1.25 and 2.5 L min-1per 1-m ridge length. Each plot represents the mean of the measurements taken on the four cultivation days. Error bars indicate the standard deviations (S.D.).
Figure 8.
Profiles of CO2 concentrations in soil with non-forced aeration and airflow rates of 1.25 and 2.5 L min-1per 1-m ridge length. Each plot represents the mean of the measurements taken on the four cultivation days. Error bars indicate the standard deviations (S.D.).
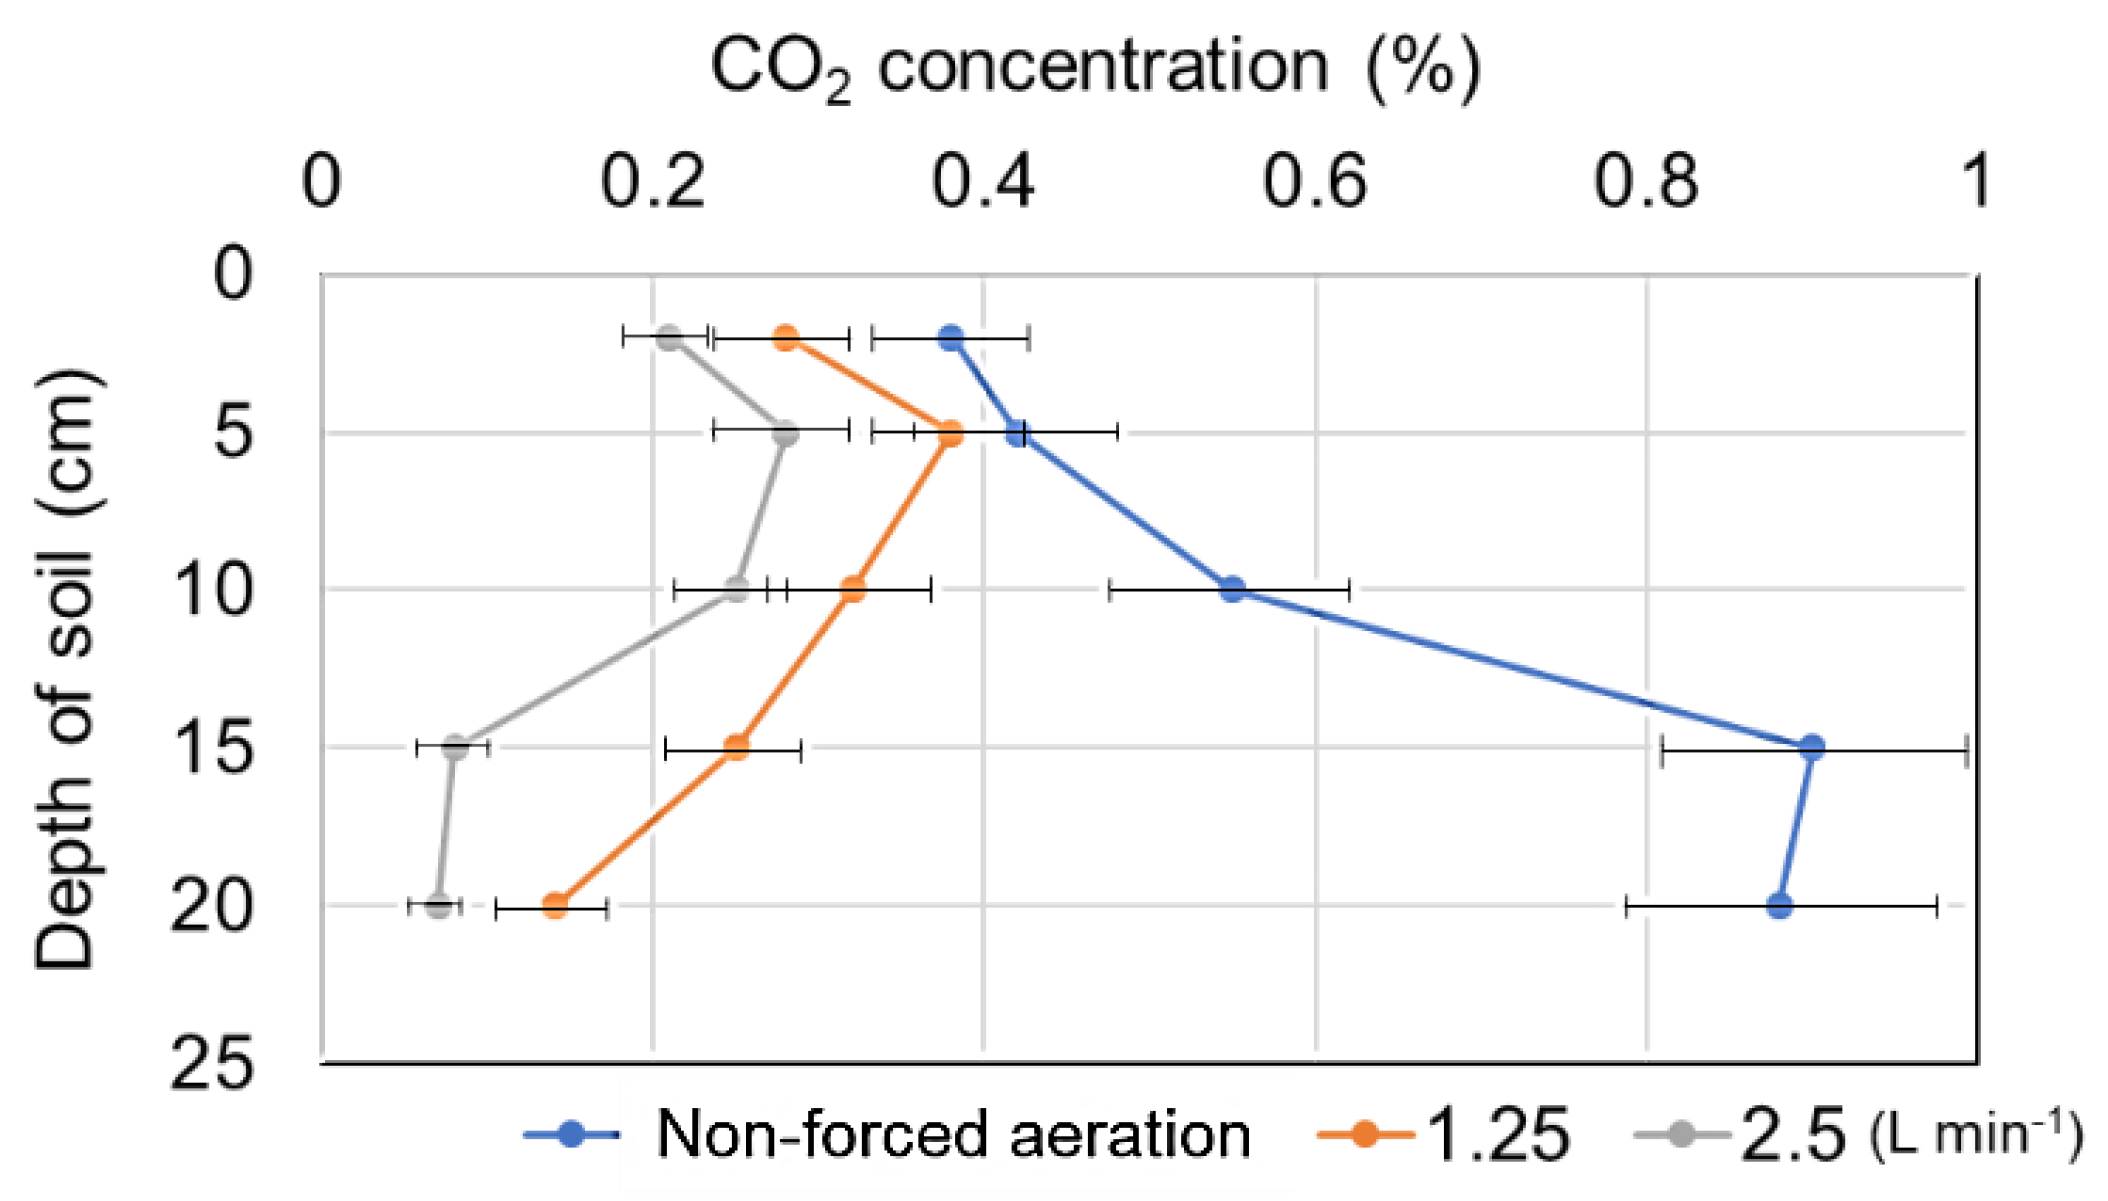
Figure 9.
Effects of forced-aeration airflow rates on sweet potato growth. Mean values ± S.D. with the same letter are not significantly different based on ANOVA followed by Tukey’s HSD test at p < 0.05.
Figure 9.
Effects of forced-aeration airflow rates on sweet potato growth. Mean values ± S.D. with the same letter are not significantly different based on ANOVA followed by Tukey’s HSD test at p < 0.05.
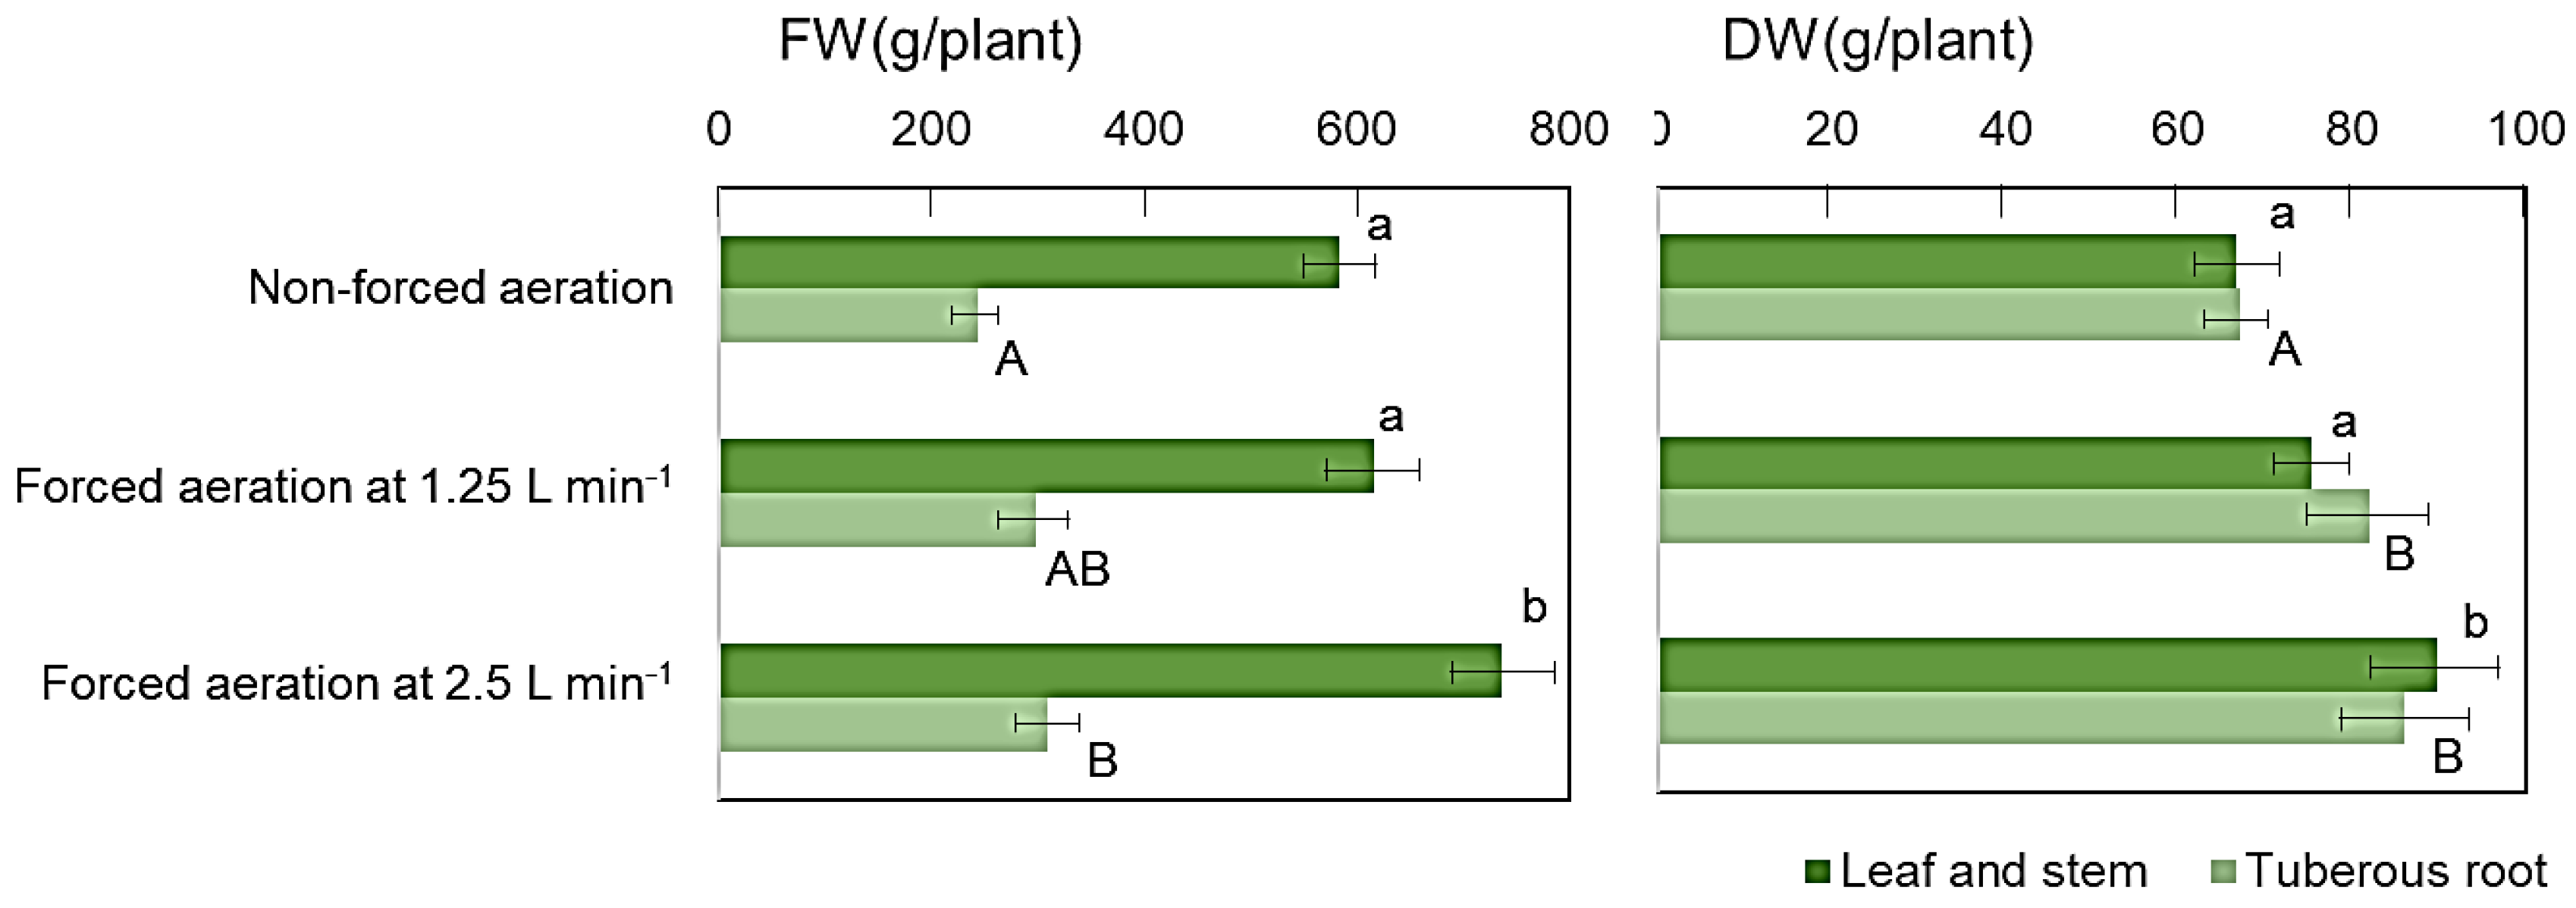
Figure 10.
CO2 concentrations in each rooting zone without forced aeration (non-forced aeration), with forced aeration every 24 and 4 h, and with continuous forced aeration. Irrigation was conducted daily at 11 h.
Figure 10.
CO2 concentrations in each rooting zone without forced aeration (non-forced aeration), with forced aeration every 24 and 4 h, and with continuous forced aeration. Irrigation was conducted daily at 11 h.
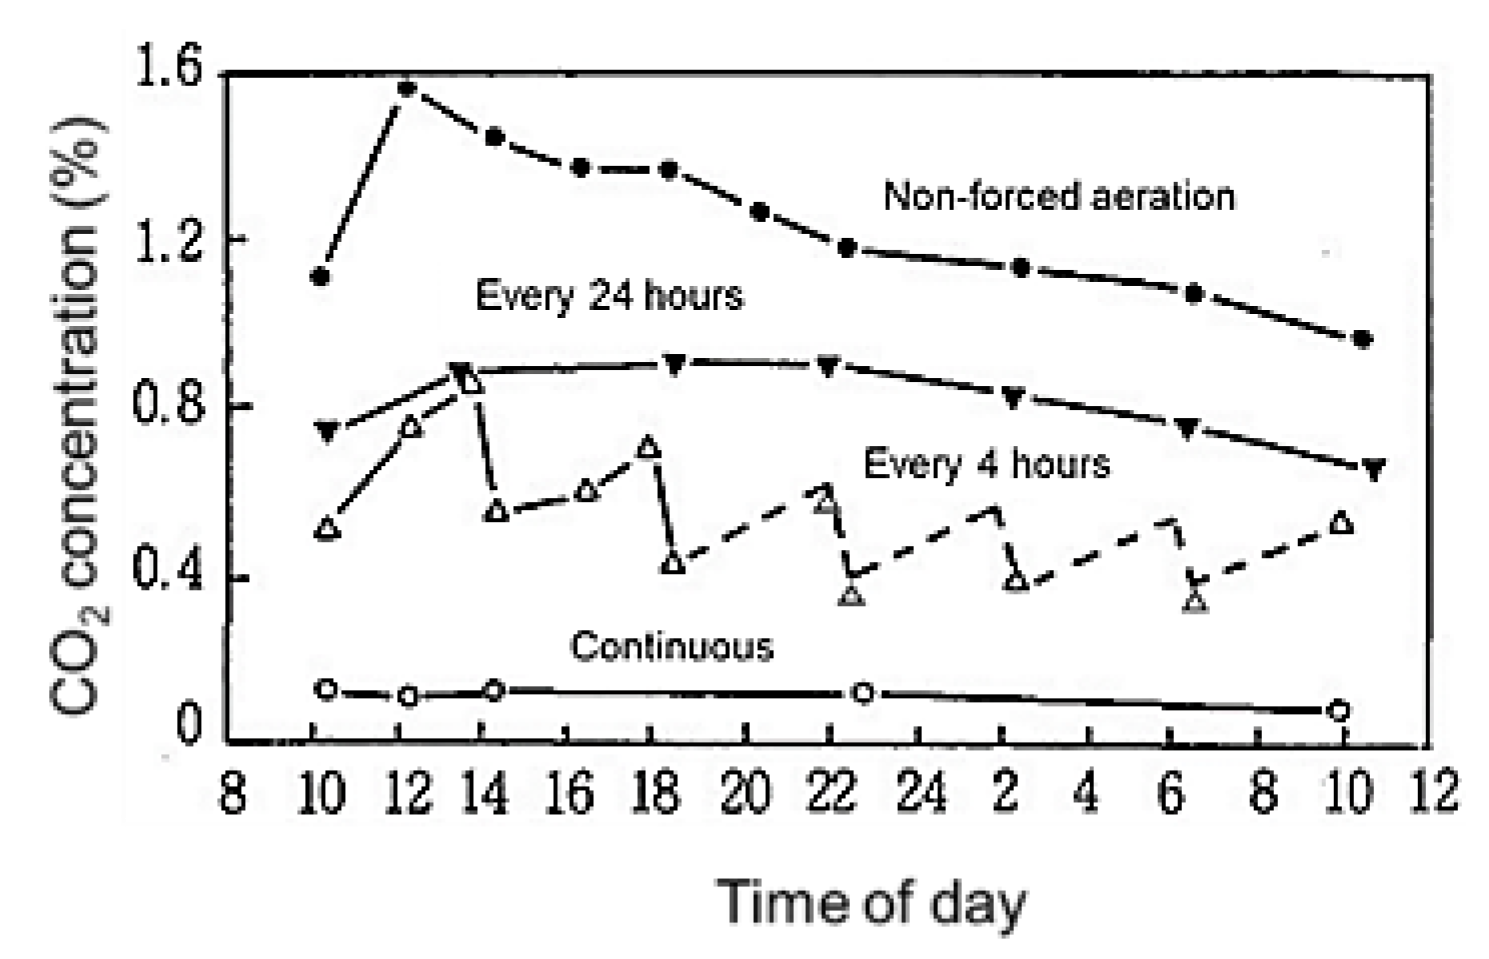
Figure 11.
Effects of the time intervals of forced aeration in the rooting zone on sweet potato growth. Mean values ± S.D. with the same letter are not significantly different based on ANOVA followed by Tukey’s HSD test at p < 0.05.
Figure 11.
Effects of the time intervals of forced aeration in the rooting zone on sweet potato growth. Mean values ± S.D. with the same letter are not significantly different based on ANOVA followed by Tukey’s HSD test at p < 0.05.
Disclaimer/Publisher’s Note: The statements, opinions and data contained in all publications are solely those of the individual author(s) and contributor(s) and not of MDPI and/or the editor(s). MDPI and/or the editor(s) disclaim responsibility for any injury to people or property resulting from any ideas, methods, instructions or products referred to in the content. |
© 2025 by the authors. Licensee MDPI, Basel, Switzerland. This article is an open access article distributed under the terms and conditions of the Creative Commons Attribution (CC BY) license (http://creativecommons.org/licenses/by/4.0/).
Copyright: This open access article is published under a Creative Commons CC BY 4.0 license, which permit the free download, distribution, and reuse, provided that the author and preprint are cited in any reuse.


