Submitted:
13 November 2025
Posted:
14 November 2025
You are already at the latest version
Abstract
The vibrational properties of the chiral sulfoxide methyl-p-tolyl-sulfoxide (Metoso) were investigated by infrared and Raman spectroscopy in the solid, liquid and aqueous solution phases, for both the enantiopure compounds and their racemic mixture. Experimental data were complemented by DFT calculations on the isolated enantiomer and on the two RR and RS dimeric conformers to support spectral interpretation and mode assignment. The IR and Raman spectra of the crystalline enantiomer and racemic mixture are similar, indicating comparable molecular organization and intermolecular interactions in the solid state. Upon melting, band broadening and frequency shifts are observed, consistent with molecular disorder and the breaking of weak intramolecular interactions, accompanied by changes in the S–O and S–CH₃ and C-H stretching frequencies. In aqueous solution, further broadening and opposite shifts of these bands reflect the formation of Metoso–H₂O complexes through hydrogen bonds. Theoretical spectra reproduce the observed trends and confirm that either solvent or phase transitions control the balance between intra- and intermolecular interactions thus influencing the vibrational degrees of freedom of the model chiral sulfoxide.
Keywords:
chiral molecules
; aromatic sulfoxides
; vibrational spectroscopy
; DFT calculation
1. Introduction
Stereospecific intermolecular interactions are central to numerous fundamental chemical and biological processes, including molecular recognition, supramolecular assembly, and asymmetric catalysis. Understanding how chirality shapes non-covalent interactions has a profound impact across a wide range of disciplines, from chemistry and biology to pharmacology, materials science, and even astrophysics.
Measurements of binding energies and vibrational frequencies on model dimers of chiral molecules in the gas phase, [1,2,3] have proven to be a powerful tool for elucidating key mechanisms underlying chiral recognition and enantioselective behavior. Motivated by this insight, the present work turns to the condensed phase, where intermolecular forces are further modulated by environment, crystal packing, and collective dynamics. While condensed-phase systems lack the resolution typically attainable in gas-phase studies, they allow us to explore whether stereospecific vibrational features, however subtle, can still be detected under conditions that better reflect real-world molecular environments.
Although condensed-phase investigations using non-chiroptical vibrational spectroscopies to probe stereospecific intermolecular interactions are relatively limited, previous Raman and infrared spectroscopic studies conducted on model chiral systems [4,5,6,7] reported infrared or Raman spectra of enantiopure and racemic crystals where spectral differences associated with supramolecular arrangement and hydrogen bonding topology are observed. Moreover, recent advancements in optical filter technology have enabled the implementation of Raman spectroscopy for the investigation of low-frequency vibrational (LFV) modes, which exhibit significant variations in racemic crystals, thereby facilitating their distinction from the enantiopure forms.[8]
In this work, we selected methyl para-tolyl sulfoxide (Metoso), a sulfoxide bearing a stereogenic sulfur atom. Chiral aromatic sulfoxides are particularly attractive for chiral recognition studies due to their pronounced dipole moments, chemical stability, and the relevance of their stereoelectronic properties in pharmaceutical and catalytic contexts. The structural simplicity of this aromatic sulfoxide makes it a less conventional yet informative system for exploring chirality-dependent interactions in different condensed-phase environments.
The compound was studied by infrared and Raman spectroscopies in the crystalline and liquid states both as pure enantiomers and racemic mixtures and in diluted aqueous solution. Raman spectra were collected over a broad spectral range (20–4000 cm−1) to capture both high-frequency intramolecular modes and low-frequency collective vibrations. Quantum chemical calculations were performed to assist in spectral interpretation.
2. Experimental
R (+)-Methyl p-tolyl sulfoxide (R-Metoso) with 99% purity and racemic Methyl p-tolyl sulfoxide (RS-Metoso) with 97.5% purity were purchased from Sigma-Aldrich.
Raman measurements were carried out using a home-built spectrometer consisting of a 550 mm monochromator (Horiba Jobin-Yvon TRIAX 550) equipped with a triple-grating turret, coupled to a liquid-nitrogen-cooled CCD detector (Horiba Jobin-Yvon Symphony II). The system was fiber-coupled to a metallographic microscope (Leitz Metallux II). Excitation was provided by a 532 nm laser source (Lapsos), spectrally filtered using an Optigrate BraggGrate bandpass laser line filter to eliminate spurious background light and attenuated by neutral density filters to adjust the power delivered to the sample to approximately 5 mW. The laser beam was delivered to the sample using a 32× long-working distance objective (Leitz), and and the scattered light was collected by the same objective in a backscattering configuration. An edge filter (Semrock Razor Edge) was used to suppress the elastically scattered light before directing the signal to the spectrometer. To perform measurements below 80 cm−1 the backscattered light was filtered through a set of notch filters Optigrate BraggGrate).
Temperature-controlled measurements in the 290–360 K range were performed by placing the sample in the crucible of a Linkam FTIR-600 (FDCS196) heating–cooling microscope stage, equipped with a glass window. The stage was connected to a Linkam TP-94 programmable temperature controller and an LP94/2 liquid nitrogen cooling system. Raman spectra in the liquid phase were acquired at temperatures slightly above the melting points of the pure enantiomer (348K) and of the racemic mixture (318K).
All Raman spectra in the region of 20−3200 cm−1 were collected using a 1200 grooves/mm grating and consisted of 3 averaged measurements of 30 s each. Raw data were corrected by subtracting a smooth photoluminescence background and normalized to the peak at 1090 cm−1. The Raman shift was calibrated to ±1 cm−1 by using a reagent grade cyclohexane reference sample and the published cyclohexane Raman lines. [9]
Fourier-transform infrared (FTIR) absorption spectra were collected in attenuated total reflectance (ATR) mode using a Spectrum 100 Perkin Elmer spectrometer, in the spectral range between 500 cm-1 and 4000 cm-1, with a spectral resolution of 4 cm-1, using a multipass KRS5 crystal. To correct the bands intensities in the ATR spectrum which are affected by the wavelength-dependent penetration depth of the evanescent wave into the sample, a simple ATR correction is was applied by multiplying the ATR absorbance values by the wavenumber [10].
3. Computational Details
Initial minimum energy structures of the R enantiomer of methyl para tolyl sulfoxide, and of the corresponding RR and RS dimers have been obtained using the “GOAT” algorithm implemented in Orca version 6.0.[11,12] and using the semiempirical extended tight binding [13] GFN2-xTB method.[14] Due to the energetic proximity of the lowest lying conformers of the two RR and RS dimers, two structurally distinct member of each conformers ensemble was then reoptimized using the B3LYP-D3BJ functional that includes dispersion corrections [15,16] and the jun-cc-pV(T+d)Z [17] basis set that is not prohibitively rich, but has shown a decent accuracy for Raman activities calculations. The DFT calculation has been done using the density fitting approximation for 4 center orbitals in the RIJCOSX variant [18]and allowing the Orca program to generate its own density fitting basis by using the “autoaux” keyword. [19] This optimization has been done both in the gas phase and in water solvent through the use of the CPCM method as implemented in the Orca program with default parameters. [20] The Hessian and the vibrational frequencies have been computed at the stationary point using a numerical differentiation scheme that allows for the evaluation of the IR intensities and Raman activities. A scaling factor of 0.975 is applied to calculated frequencies in the 1000-1800 cm-1 spectral region and of 0.965 in the 2000-4000 cm-1 spectral region.
4. Results and Discussion
4.1. Calculated Structures
The most stable structures of the RR an RS dimers of Metoso obtained in vacuo are shown in Figure 1. The corresponding structures obtained in the water model solvent are essentially the same. In the gas phase, the energy difference between the RR and RS dimeric structures was found to be 0.2 kcal/mol, with RR being the more stable dimer. Considering that the accuracy of DFT under favorable conditions is approximately 0.7 kcal/mol, this value falls within the typical range observed for gas-phase homo- and heterochiral dimers.[1,3]
Both complexes are characterized by π–π interactions between the aromatic rings. The distance between the ring centroids is 3.5 Å in RS and 3.4 Å in RR. The rings are misaligned, with the centroid–centroid axis tilted by 19° and 26° from the perpendicular in the RR and RS dimers, respectively. The two molecules adopt a geometry that prioritizes, together with aromatic π–π stacking, Cpmethyl–H···O hydrogen bonding interactions between the methyl groups in in the para position of the aromatic rings and the oxygen atom of the neighbouring Metoso molecule. The H···O distance of this non covalent interaction is 2.5 Å in the RR dimer and 2.7 Å in the RS dimer.
4.2. FTIR and Raman Spectra of Solid Compounds
To investigate the intramolecular interactions occurring in the pure enantiomer (R-Metoso) and racemic (RS-Metoso) samples, ATR-FTIR and Raman spectroscopy measurements were performed in the solid state. In the following, after a brief description of the experimental spectra and their comparison with the calculated ones, the vibrational modes will be discussed.
Figure 2 shows a comparison between the corrected ATR-FTIR spectra of enantiopure and racemic Metoso and the corresponding calculated IR spectra. A very good agreement is observed in the fingerprint region between the calculated infrared spectra and the experimental data. Table 1 reports the measured IR frequencies, which are assigned to their respective vibrational modes based on comparison with the calculated spectra. The most intense band measured at 1039 (1037) cm-1 is assigned to the S-O stretching mode combined with CH3 rocking mode. The first value refers to the pure enantiomer, while the value in parentheses corresponds to the racemic mixture.
Only minimal differences are observed between the experimental IR spectra of the pure enantiomer and the racemic mixture. DFT calculations likewise predict minor variations in both the position and intensity of the IR bands in the fingerprint region and the high frequency region between 2700 cm-1 and 3000 cm-1.
Figure 3 shows the Raman spectra of R- and RS-Metoso (black lines), normalized to the peak at 1087 (1085) cm−1, which is attributed to the aromatic C=C stretching (breathing) mode, together with the corresponding calculated spectra for the RR and RS dimers. The experimentally measured vibrational frequencies are reported in Table 1. Similarly to what found for the infrared results, both the experimental and calculated Raman spectra of the two samples appear as almost identical with slight differences in intensity and in the positions of the peaks, suggesting that there are high structural analogies between the crystallized enantiomer and crystallized racemic mixture.
Despite the presence of significant mode coupling, the vibrational modes measured for solid methyl para-tolyl sulfoxide have been assigned to their principal components. In the following section, we briefly detail several vibrational modes that are known to be sensitive to intermolecular interactions.
The S-O stretching vibration is characterized by strong IR activity and moderate Raman intensity. It is measured at 1039 (1037) cm-1 in the IR spectra of the solid compounds and exhibits coupling with aromatic ring breathing modes. The S-CH3 stretching mode is measured at 690 (687) cm-1 in the Raman spectra of the solid compounds. Several aromatic ring modes, including breathing and deformation vibrations, are distributed across the 800–1200 cm−1 region, with distinct activity in both IR and Raman spectra.
The C–H bending vibrations of the methyl group in para of the aromatic ring are in the 1400-1500 cm−1 region while the C-H bending modes of the aromatic carbon atoms are measured at slightly higher frequencies, in the 1500-1600 cm-1 region. In the high frequency region, the C–H stretching vibrations, appear as sharp bands in the Raman spectra and less resolved, broadened, in the IR spectra. The aliphatic C–H symmetric and asymmetric stretching modes of the two methyl groups of the Metoso molecule are found between 2870–3000 cm−1, while the aromatic C-H stretching modes are measured at 3048 and 3058 cm-1 in the Raman spectra.
To achieve a more comprehensive understanding of the structural properties of the two samples, the Raman spectra were also acquired in the spectral region between 20 and 200 cm−1which is particularly sensitive to collective motions and weak interactions, such as van der Waals forces and lattice vibrations.
In Figure 4 the Raman spectra in the low-frequency region (20–200 cm−1) of the two samples are shown and compared with the calculated spectra. Although the two experimental spectra appear similar, differences in the band intensities are found for the bands measured at about 84 cm−1 and 24 cm−1. At variance, the calculated Raman spectra in this region display important differences in the position and intensities of the bands of the RR and SS dimers. The RR dimer’s calculated spectrum shows closer agreement with the experimental spectra of both the pure enantiomer and the racemic mixture. Animations of the vibrational modes calculated at 30, 40, 60, 90, and 116 cm−1 for the RR dimer, which reasonably match the experimentally observed bands, are provided in the Supporting Information.
In summary, the experimental vibrational spectra of the crystalline samples, whether pure enantiomers or racemic mixtures, are remarkably similar across all regions, including the low-frequency domain. Accordingly, the calculated RR and RS dimer structures share similar intermolecular features, and their vibrational spectra show only modest deviations in the 200-3200 cm-1 region. In the low frequency region, the fact that the RR dimer’s calculated spectrum shows closer agreement with the experimental spectra of both the pure enantiomer and the racemic mixture suggests that part of the molecules in the crystal of the racemic sample might adopt a solid state arrangement with homochiral domains, that is, a conglomerate like arrangement.[8]
4.3. Raman Spectra of Liquid Compounds
Figure 5 shows the Raman spectra of the liquid samples in the spectral range between 200 cm-1 and 3200 cm-1 normalized to the intense band around 1091(1085) cm-1 as already done for the solid phase. The comparison of the two spectra shows some differences in the relative intensities and in the positions of the bands in both the fingerprint and high frequencies spectral region that can be related to the different intermolecular interactions or to dynamic behavior in the liquid phase.
To gain insight into intermolecular interactions, the spectra measured in the liquid phase were compared with those obtained in the solid state in different spectral ranges (Figure 6). Some bands observed in the solid-state spectra are, in the liquids, either absent or below the detection threshold. In the low-frequency region between 200 and 500 cm−1, the Raman spectra of both RR and RS samples in the liquid phase broaden significantly with respect to the solid phase though they display similar features. A band observed in the solid phase at 335(338) cm−1, attributable to a mixed C-H, S-O bending mode is very weak or not resolved in the spectrum of the liquid phase.
In the fingerprint region between 600 cm−1 and 1800 cm−1 (see Figure 6b,c), both samples exhibit, in the liquid phase, a red shift of the band observed around 690 cm−1 in the spectra of the solid samples and attributed to the S–CH3 stretching vibrational mode. The weak band found at 1037(1038) cm-1 in the Raman spectrum of the solid compounds and assigned to the S-O stretching vibration is broadened and blue shifted in the spectra of the liquid compounds. The broadening is related to molecular disorder, while the blue shift of the S–O stretching mode indicates a strengthening of the S–O bond, likely associated with the disaggregation process occurring upon transition from the solid to the liquid phase. The strengthening of the S–O bond resulting from disaggregation induces a charge redistribution and a concomitant weakening of the S–CH3 bond, leading to a red shift of the S–CH3 stretching mode. [21,22,23]
The bands around 1400 cm−1 and 1600 cm−1 (Figure 6c), are more intense in the liquid with respect to the solid samples. This may be correlated to the increased molecular freedom and reduced intermolecular interactions in the liquid, which allow these particular vibrational motions to induce more pronounced changes in the electronic distribution.
In the C-H stretching region, shown in Figure 6d, the Raman spectrum of the liquid pure enantiomer displays well-resolved and only slightly broadened bands. Aside from differences in relative band intensities, it closely resembles the solid-state spectrum. In contrast, the spectrum of the liquefied racemic mixture shows significantly broadened bands, indicative of greater molecular disorder at a temperature just a few degrees above its melting point when compared to the pure enantiomer. In the spectral range between 2800 cm−1 and 3200 cm−1 shown in Figure 6d a significant blue shift, especially for the RS-Metoso sample, is observed for the bands measured at 2915 cm−1 and 3003 cm−1 in the liquid-state spectra when compared to their counterparts in the solid phase. These bands correspond to the C–H symmetric and asymmetric stretching modes of the methyl group in para of the aromatic ring (Cpmethyl). The blue-shift indicates that the Cpmethyl-H bond becomes stronger upon transition to the liquid phase, a change that can be correlated to disaggregation occurring during the solid to liquid phase transition. Examination of the dimer structures reveals that the dissociation of the weak Cpmethyl-H….O hydrogen bond is consistent with both the red shift observed for these specific bands and the blue shift of the S-O stretching mode.
4.4. Raman Spectrum of Metoso in Aqueous Solution
The Raman spectrum of Metoso in aqueous solution at a concentration of 10−1 mol/L, measured at room temperature in the spectral range between 200 and 3400 cm−1 is reported in Figure S1. The measured vibrational frequencies are summarized in Table 1. To assess the effect of aqueous dilution and solvation, the experimental Raman spectra of the 0.1 M aqueous solution of Metoso, are compared with those of the solid compounds in the 600–1200 cm−1 and 2800–3100 cm−1 spectral regions, as shown in Figure 7a,c. Dilution in water leads to a broadening of the Raman bands, reflecting an increased molecular disorder and the formation of various Metoso*H2O aggregates. [24,25,26]
The band attributed to S-O stretching mode measured at 1037 cm-1 in the Raman spectrum of the solid compound, highlighted with a dashed grey line in Figure 7a, is found as a broad red-shifted band in the 980-1030 cm-1 spectral range in the spectrum of the water solution. Conversely, the band attributed to S-CH3 stretching, measured at 690 cm-1 in the spectra of the solid sample and also marked with a dashed grey line in Figure 7a is blue-shifted in water solution (Table 1). In the high frequency region around 3000 cm−1 all the bands attributed to C-H stretching vibrations are broadened and blue-shifted in the water solution, as shown in Figure 7c. In particular, the blue shift is more significant for the bands attributed to the aliphatic CS-H and Cpmethyl-H stretching with respect to the shift of the bands assigned to the Carom-H stretching modes.
The calculated Raman spectra for the RR complex and that of R molecule in water, shown in black and blue lines respectively in Figure 7b,d, correctly predict the red and blue shifts of the measured vibronic transitions assigned to S-O, S-CH3 andC-H stretching vibrations. . The shifts of the vibrational transitions are due to the formation of Metoso-water complexes.14 In particular, the red shift of the S-O stretching bands is consistent with the formation of Ow–H…OMetoso–S hydrogen bonds between water and Metoso. As a consequence, both S-CH3 and CS-H bonds are strengthened via charge redistribution caused by hydrogen bonding between H2O and the oxygen atom of the sulfoxide. [27] However, the significant blue shift of the bands attributed to the various aliphatic C-H stretching modes is mainly the result of the formation of weak C-H….O (CS–H…Ow–H and Cpmethyl–H…Ow–H) hydrogen bonds between the methyl groups and water.14
5. Conclusions
The analysis of IR and Raman spectra, supported by DFT calculations have allowed the vibrational characterization of Metoso in the solid and liquid phases, both in its enantiopure and racemic forms and in diluted water solution. The experimental data reveal minimal spectral differences between the crystalline enantiomer and racemic mixture, indicating highly analogous structural organization and intermolecular interactions in the solid state. Phase transitions and solvent effects introduce measurable spectral shifts and band broadening, both in the fingerprint and high-frequency regions, which are consistent with increased molecular disorder and solvation. The observed blue and red shifts of the S–O and S–CH3 stretching modes in the liquids are rationalized in terms of disaggregation with dissociation of the weak CptolylH…OMetosoS bond, as confirmed by dimer structural analysis. In aqueous solution, further broadening with respect to the liquid phase and opposite frequency shifts reflect the formation of Metoso-H2O aggregates, with Ow–H…OMetoso–S and C–H…Owater hydrogen bonds contributing to the spectral shifts. DFT calculated frequencies are found in good agreement with the measured spectra and in agreement with the observed trends of the spectral shifts.
Supplementary Materials
The following supporting information can be downloaded at the website of this paper posted on Preprints.org, Figure S1: Experimental Raman spectrum of a 10-1 M water solution of R-Metoso in the spectral range 200-3600 cm−1. Video S1-S5: Animations of the vibrational modes calculated at 31, 43, 60, 90 and 116 cm-1 respectively.
Author Contributions
Conceptualization, S.P. and F.R.; methodology, F.R. , M.F. and S.G.; investigation, F.R and S.P.; theoretical calculations, M.S and E.B.; writing—original draft preparation, S.P., F.R. and E.B.; writing—review and editing, S.P., F.R. E.B., M.F., M.S. and S.G. All authors have read and agreed to the published version of the manuscript.
Funding
This research received no external funding.
Data Availability Statement
The data presented in this study are available in the article and supporting information.
Acknowledgments
S.P. acknowledges financial support from Università di Roma Tor Vergata through Progetto d’Ateneo 2021 (Project DYNAMOL).
Conflicts of Interest
The authors declare no conflicts of interest.
References
- Ciavardini, A; Rondino, F. ; Paladini, A.; Speranza, M.; Fornarini, S.; Satta, M.; Piccirillo, S.; The effect of fluorine substitution on chiral recognition: interplay of CH…π, OH…π and CH…F interactions in gas-phase complexes of 1-aryl-1-ethanol with butan-2-ol. Phys. Chem. Chem. Phys. 2013, 15, 19360–19370. [Google Scholar] [CrossRef]
- Filippi, A.; Fraschetti, C. , Piccirillo, S.; Rondino, F.; Botta, B.; D’Acquarica, I.; Calcaterra, A.; Speranza, M; Chirality effects on the IRMPD spectra of basket resorcinarene/nucleoside complexes. Chem. Eur. J. 2012, 18, 8320–8328. [Google Scholar] [CrossRef] [PubMed]
- M. Speranza, M.; Rondino, F.; Satta, M.; Paladini, A. ; Giardini, A.; Catone, D.; Piccirillo, S.; Molecular and supramolecular chi-rality: R2PI spectroscopy as a tool for the gas-phase recognition of chiral systems of biological interest. CHIRALITY 2009, 21, 119–144. [Google Scholar] [CrossRef] [PubMed]
- Buchholz, A.; Mukherjee, A.; Myerson, A.S. Thermochemistry of racemic and enantiopure organic crystals for predicting enantiomer separation. Cryst. Growth Des. 2017, 17, 4676–4686. [Google Scholar] [CrossRef]
- Fujii, K. Crystal structures of racemic and enantiopure synephrine correlated with physicochemical properties from IR spectroscopy and thermal analysis. Acta Crystallogr. Sect. C 2018, 74, 1333–1341. [Google Scholar] [CrossRef]
- Parcheta, M.; Świsłocka, R.; Świderski, G.; Matejczyk, M.; Lewandowski, W. ; Spectroscopic characterization and antioxidant properties of mandelic acid and its derivatives in a theoretical and experimental approach. Materials 2022, 15, 5413. [Google Scholar] [CrossRef]
- Barańska, M.; Wesełucha-Birczyńska, A.; Mączka, M. ; Vibrational spectra of racemic and enantiomeric malic acids. J. Raman Spectrosc. 2003, 34, 68–76. [Google Scholar] [CrossRef]
- Aviv, H.; Nemtsov, I.; Mastai, Y.; Tischler, Y.R.J. Characterization of Crystal Chirality in Amino Acids Using Low-Frequency Raman Spectroscopy. Phys. Chem. A 2017, 121, 7882–7888. [Google Scholar] [CrossRef]
- McCreery research group. https://www.chem.ualberta.ca/~mccreery/ramanmaterials.html.
- Mayerhöfer, T.G.; Costa, W.D.P.; Popp, J. A simplified, effective ATR correction method for spectral identification. Spectro-Chim. Acta Part A Mol. Biomol. Spectrosc. 2025, 341, 126425. [Google Scholar] [CrossRef] [PubMed]
- Neese, F.; Becker, U.; Riplinger, C. The ORCA quantum chemistry program package. J. Chem. Phys. 2020, 152, 224108. [Google Scholar] [CrossRef] [PubMed]
- Neese, F. Software update: The ORCA program system—Version 5.0 WIREs. Comput. Mol. Sci. 2022, 12, e1606. [Google Scholar] [CrossRef]
- Bannwarth, C.; Caldeweyher, E.; Ehlert, S.; Hansen, A.; Pracht, P.; Seibert, J.; Spicher, S.; Grimme, S. ; Extended tight-binding quantum chemistry methods. WIREs Comput. Mol. Sci. 2021, 11, 1493. [Google Scholar] [CrossRef]
- Bannwarth, C.; Ehlert, S.; Grimme, S. ; GFN2-xTB—An Accurate and Broadly Parametrized Self-Consistent Tight-Binding Quantum Chemical Method with Multipole Electrostatics and Density-Dependent Dispersion Contributions. J. Chem. Theory Comput. 2019, 15, 1652–1671. [Google Scholar] [CrossRef]
- Antony, J.; Ehrlich, S. ; Krieg,; A consistent and accurate ab initio parametrization of density functional dispersion correction (DFT-D) for the 94 elements H-Pu. J. Chem. Phys. 2010, 132, 154104. [Google Scholar] [CrossRef]
- Grimme, S.; Ehrlich, S.; Goerigk, L. ; Effect of the damping function in dispersion corrected density functional theory. J. Comp. Chem. 2011, 32, 1456–1465. [Google Scholar] [CrossRef]
- Papajak, E.; Truhlar, D.G. , Convergent Partially Augmented Basis Sets for Post-Hartree−Fock Calculations of Molecular Properties and Reaction Barrier Heights. J. Chem. Theory Comput. 2011, 7, 10–18. [Google Scholar] [CrossRef]
- Neese, F.; Wennmohs, F.; Hansen, A.; Becker, U.; Efficient, approximate and parallel Hartree–Fock and hybrid DFT calculations. A ‘chain-of-spheres’ algorithm for the Hartree–Fock exchange. Chem. Phys. 2008, 356, 98–109. [Google Scholar] [CrossRef]
- Stoychev, G.L.; Auer, A.A. ; Neese, F; Automatic Generation of Auxiliary Basis Sets. J. Chem. Theory Comput. 2017, 13, 554–562. [Google Scholar] [CrossRef] [PubMed]
- Garcia-Ratés, M.; Frank Neese, F. ; Effect of the Solute Cavity on the Solvation Energy and its Derivatives within the Framework of the Gaussian Charge Scheme. J. Comput. Chem. 2020, 41, 922–939. [Google Scholar] [CrossRef] [PubMed]
- Marble, C.B.; Xu, X.; Petrov, G.I.; Wang, D.; Yakovleva, V.V. ; New Insights into a Hydrogen Bond: Hyper-Raman Spectroscopy of DMSO-Water Solution. Phys. Chem. Chem. Phys. 2021, 23, 24047–24051. [Google Scholar] [CrossRef]
- Wallace, V.M.; Dhumal, N.R.; Zehentbauer, F.M.; Kim, H.J.; Kiefer, J. ; Revisiting the Aqueous Solutions of Dimethyl Sulfoxide by Spectroscopy in the Mid- and Near Infrared: Experiments and Car−Parrinello Simulations. J. Phys. Chem. B 2015, 119, 14780–14789. [Google Scholar] [CrossRef]
- Noack, K.; Kiefer, J. Concentration-Dependent Hydrogen-Bonding Effects on the Dimethyl Sulfoxide Vibrational Structure in the Presence of Water, Methanol, and Ethanol. Chem. Phys. Chem. 2010, 11, 630–637. [Google Scholar] [CrossRef] [PubMed]
- Oh, K.I.; Rajesh, K.; Stanton, J.F.; Baiz. C. R. Quantifying Hydrogen-Bond Populations in Dimethyl Sulfoxide/Water Mixtures. Angew. Chem. Int. Ed. 2017, 56, 11375–11379. [Google Scholar] [CrossRef] [PubMed]
- Oh, K.I. Baiz, C.R. Crowding Stabilizes DMSO−Water Hydrogen-Bonding Interactions. J. Phys. Chem. B 2018, 122, 5984–5990. [Google Scholar] [CrossRef] [PubMed]
- Yang, B.; Cao, X.; Wang, C.; Wang, S.; Sun, C. ; Investigation of hydrogen bonding in Water/DMSO binary mixtures by Raman spectroscopy. Spectrochim. Acta Part A Mol. Biomol. Spectrosc. 2020, 228, 117704. [Google Scholar] [CrossRef]
- Mrazkova, E.; Pavel Hobza, P. ; Hydration of Sulfo and Methyl Groups in Dimethyl Sulfoxide Is Accompanied by the Formation of Red-Shifted Hydrogen Bonds and Improper Blue-Shifted Hydrogen Bonds: An ab Initio Quantum Chemical Study. J. Phys. Chem. A 2003, 107, 1032–1039. [Google Scholar] [CrossRef]
Figure 1.
The most stable conformers of the homochiral RR (left) and heterochiral RS (right) dimers of Metoso.
Figure 1.
The most stable conformers of the homochiral RR (left) and heterochiral RS (right) dimers of Metoso.
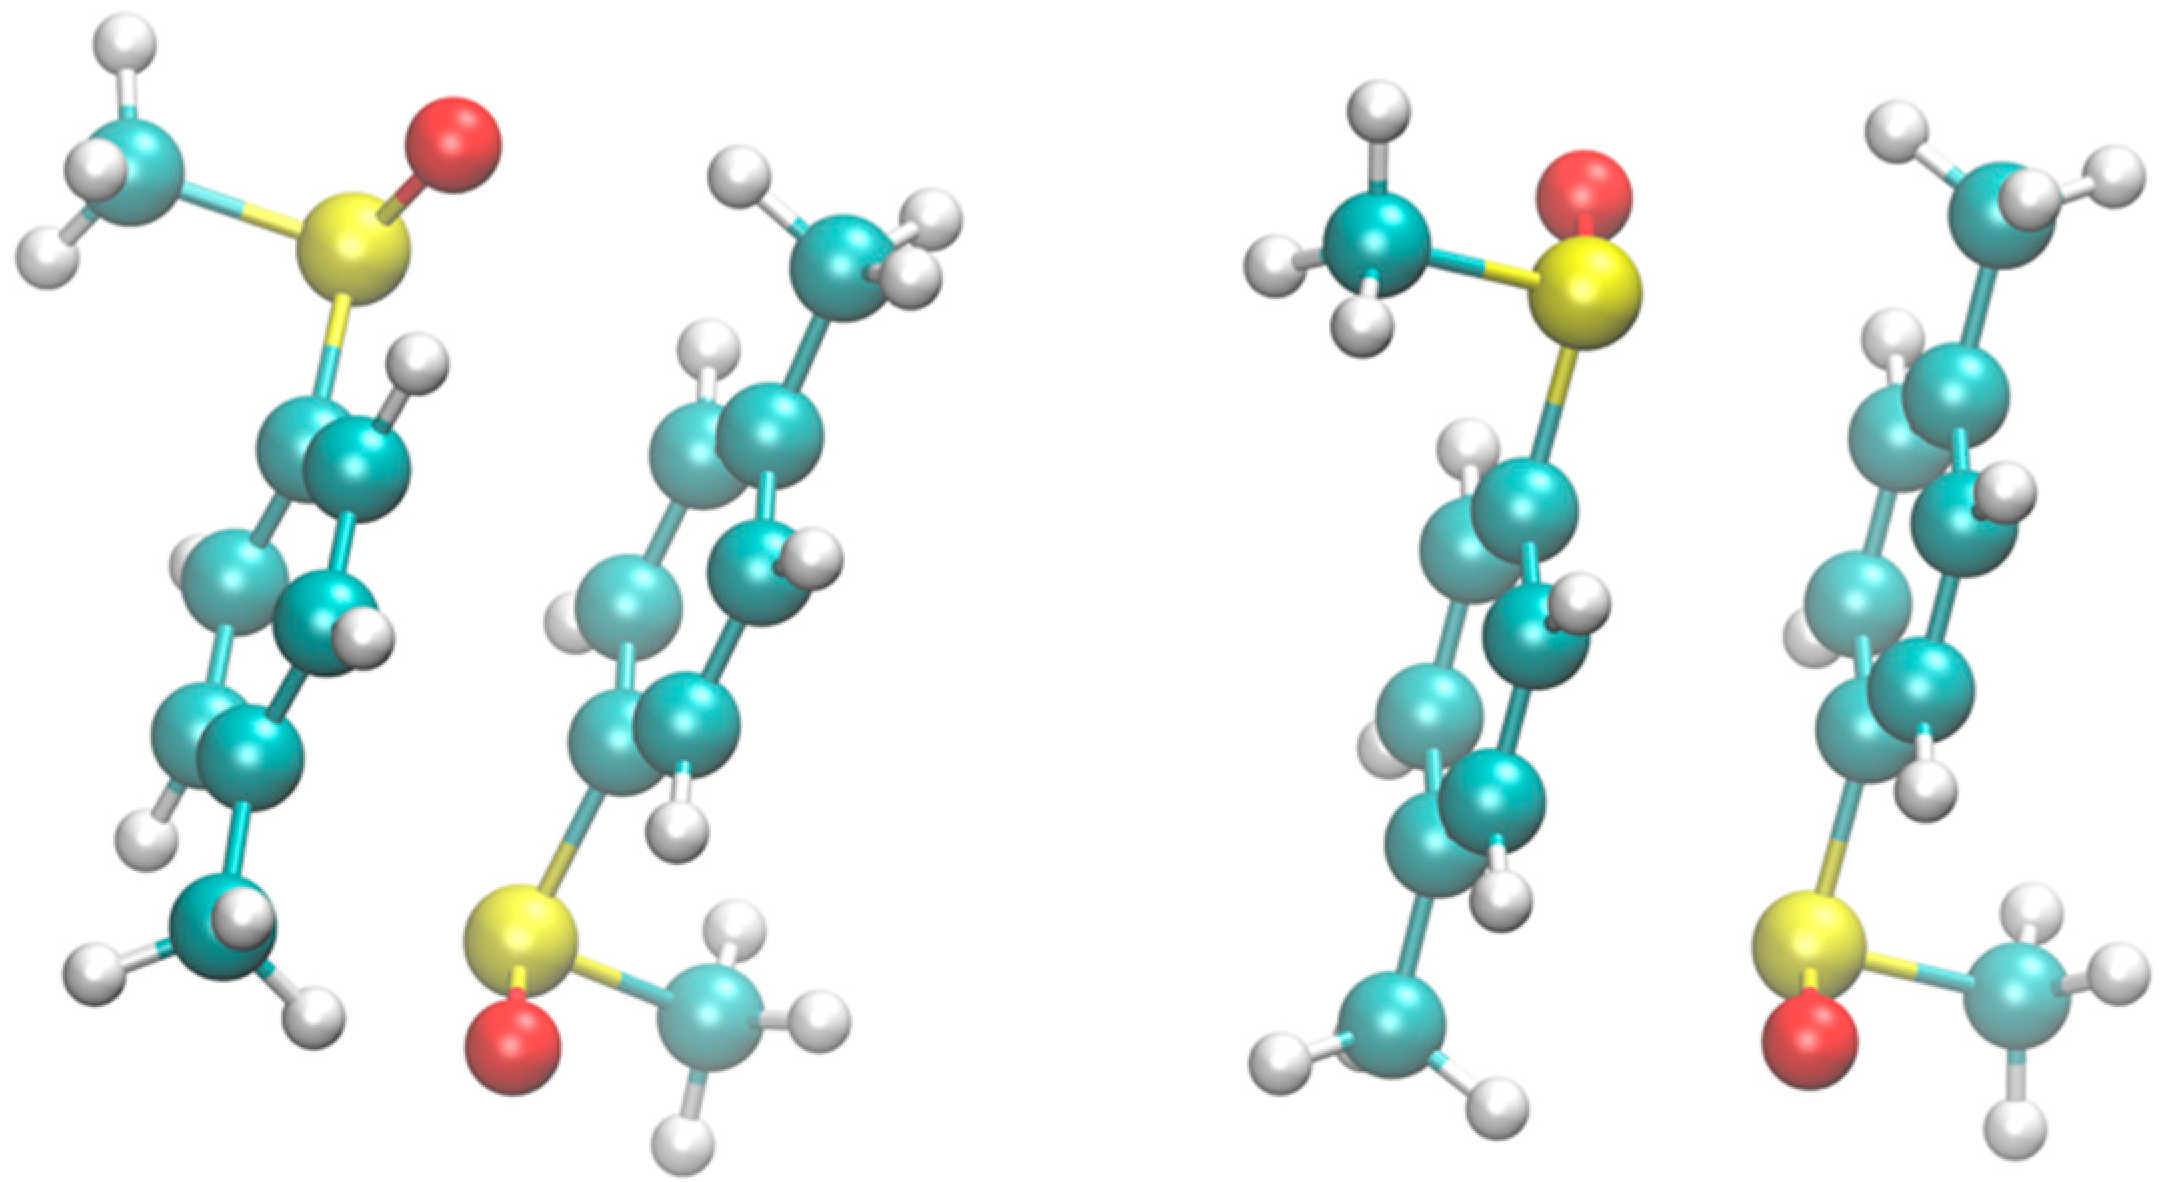
Figure 2.
Absorbance-corrected ATR-FTIR spectra of the solid pure R-enantiomer Metoso and RS-Metoso racemic mixture (black lines) and calculated infrared spectra for the homochiral RR dimer and for the heterochiral RS dimer (grey lines).
Figure 2.
Absorbance-corrected ATR-FTIR spectra of the solid pure R-enantiomer Metoso and RS-Metoso racemic mixture (black lines) and calculated infrared spectra for the homochiral RR dimer and for the heterochiral RS dimer (grey lines).
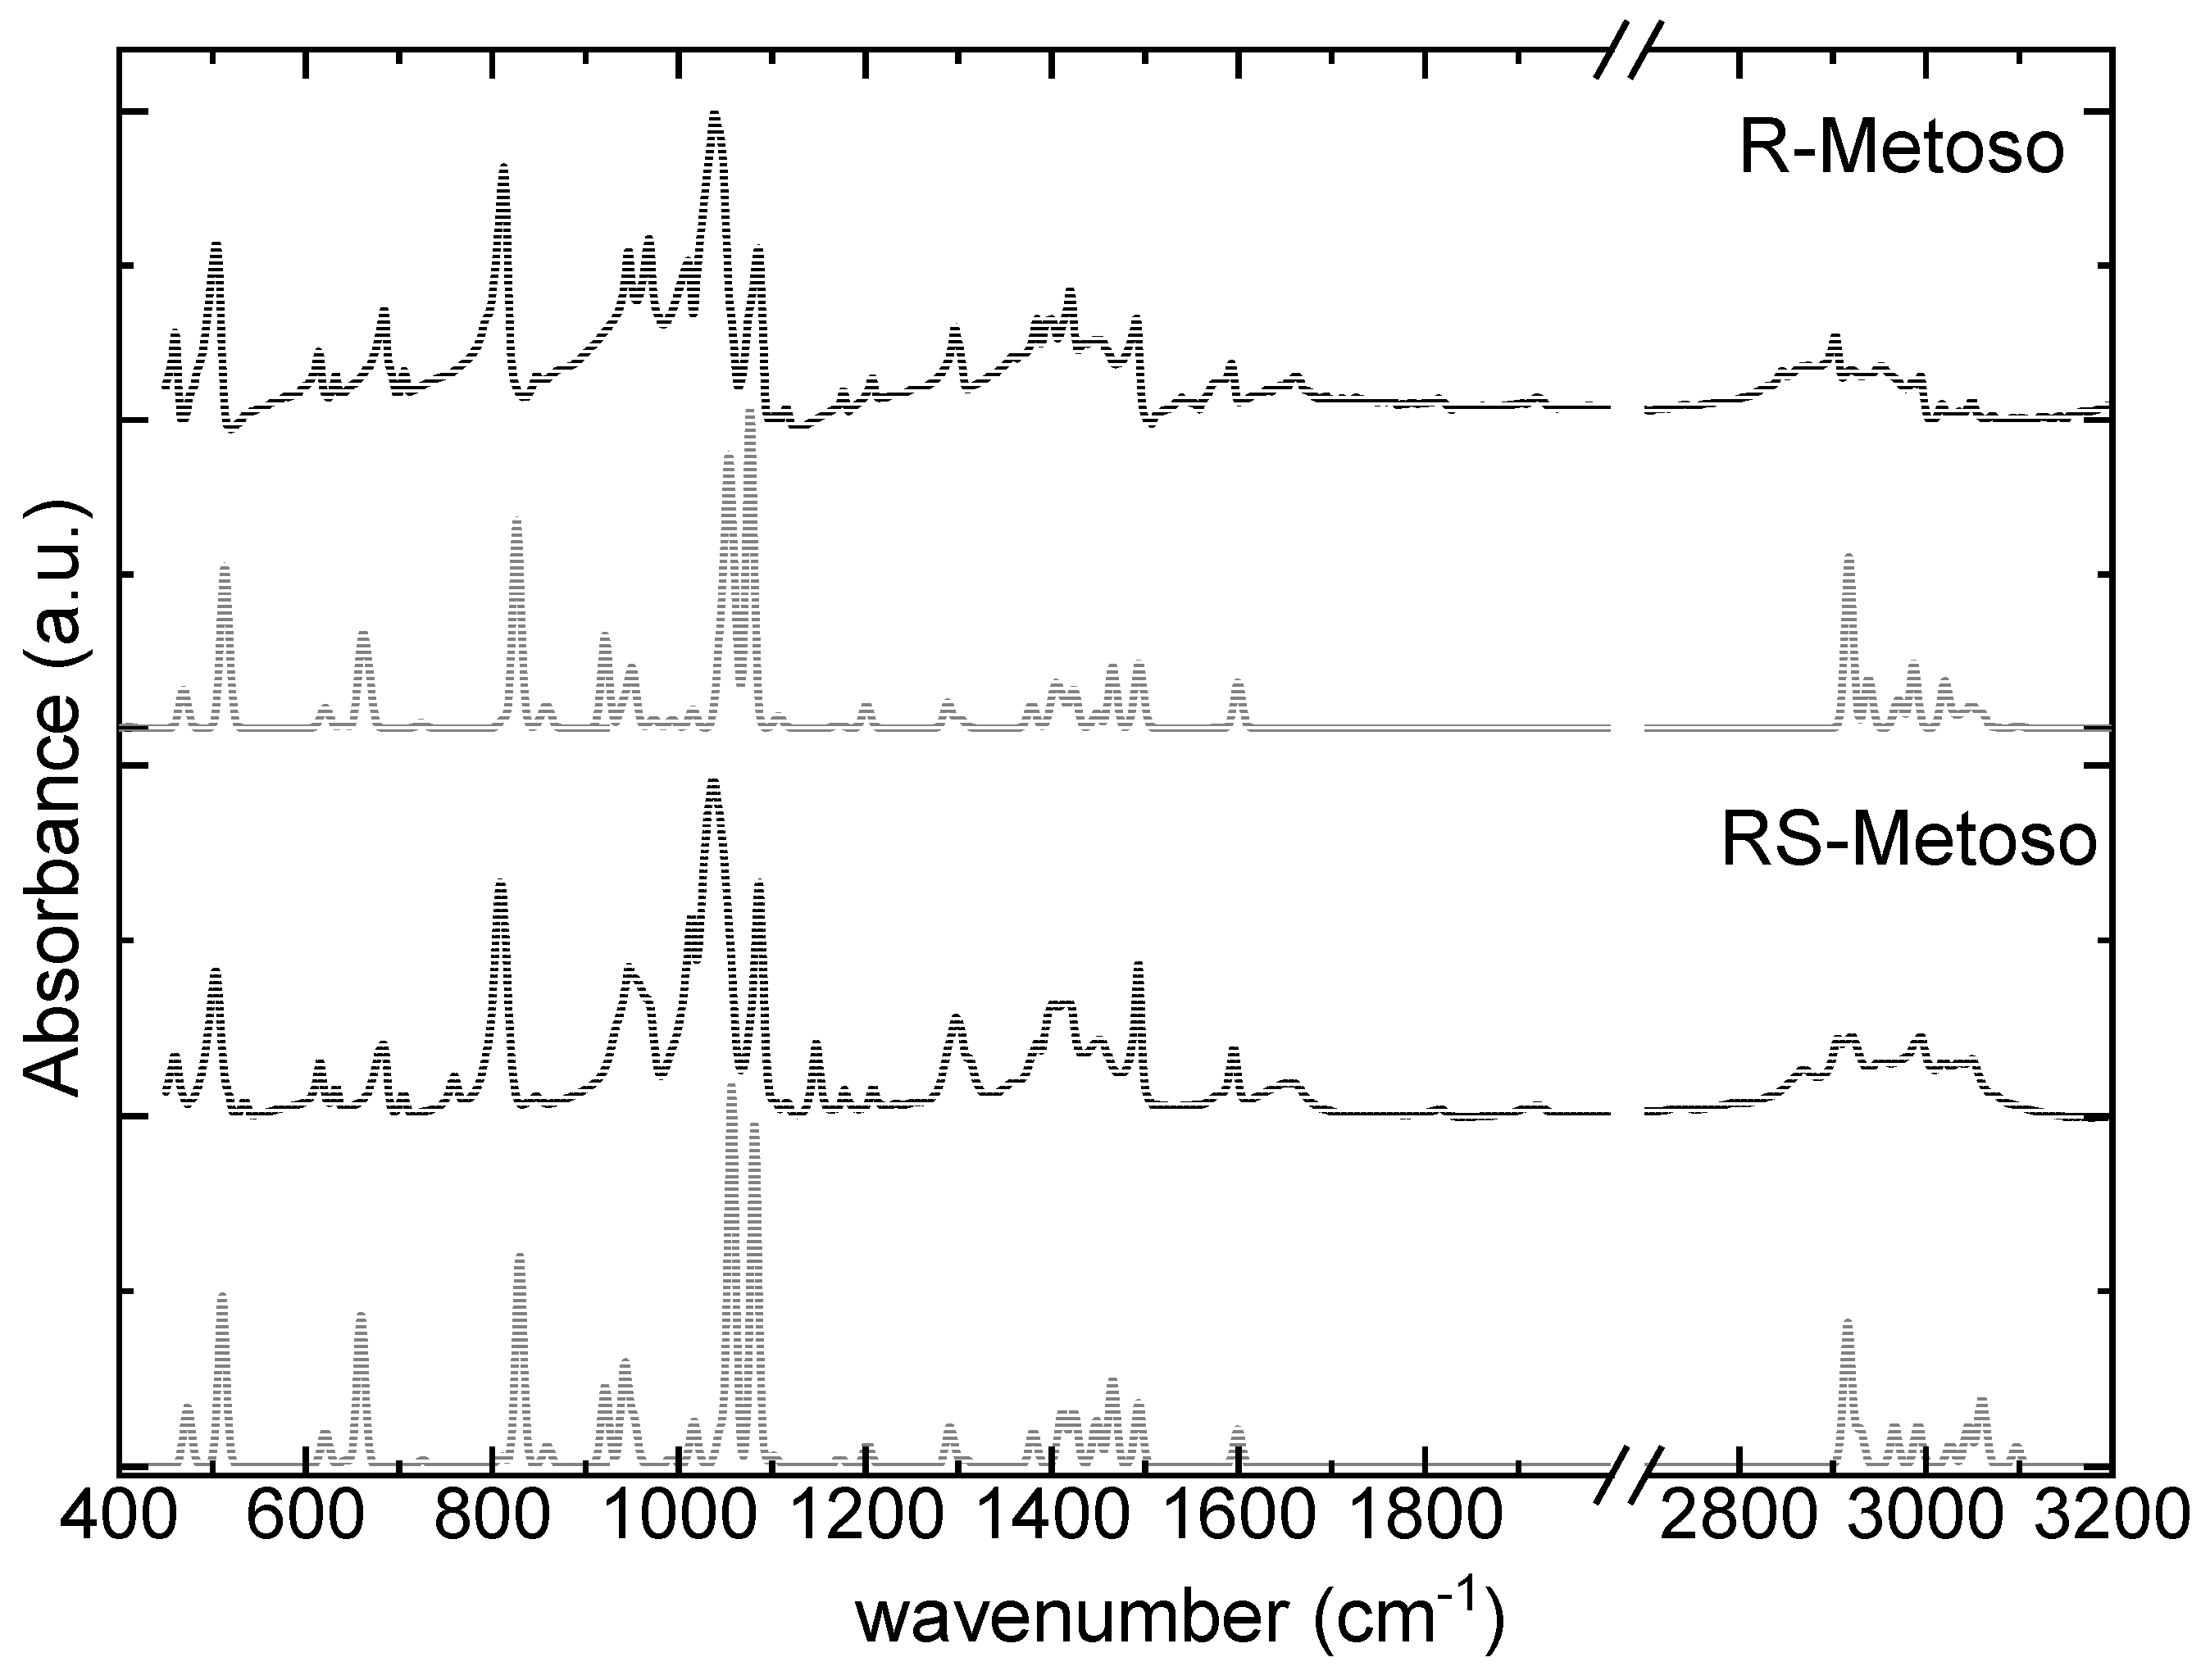
Figure 3.
Experimental Raman spectra of the solid pure R-enantiomer Metoso and racemic mixture (black lines) compared with calculated Raman spectra of the RR and RS dimers (grey lines). The intensity of the theoretical data in the spectral region between 2880 cm-1 and 3200 cm-1 are multiplied by 0.1.
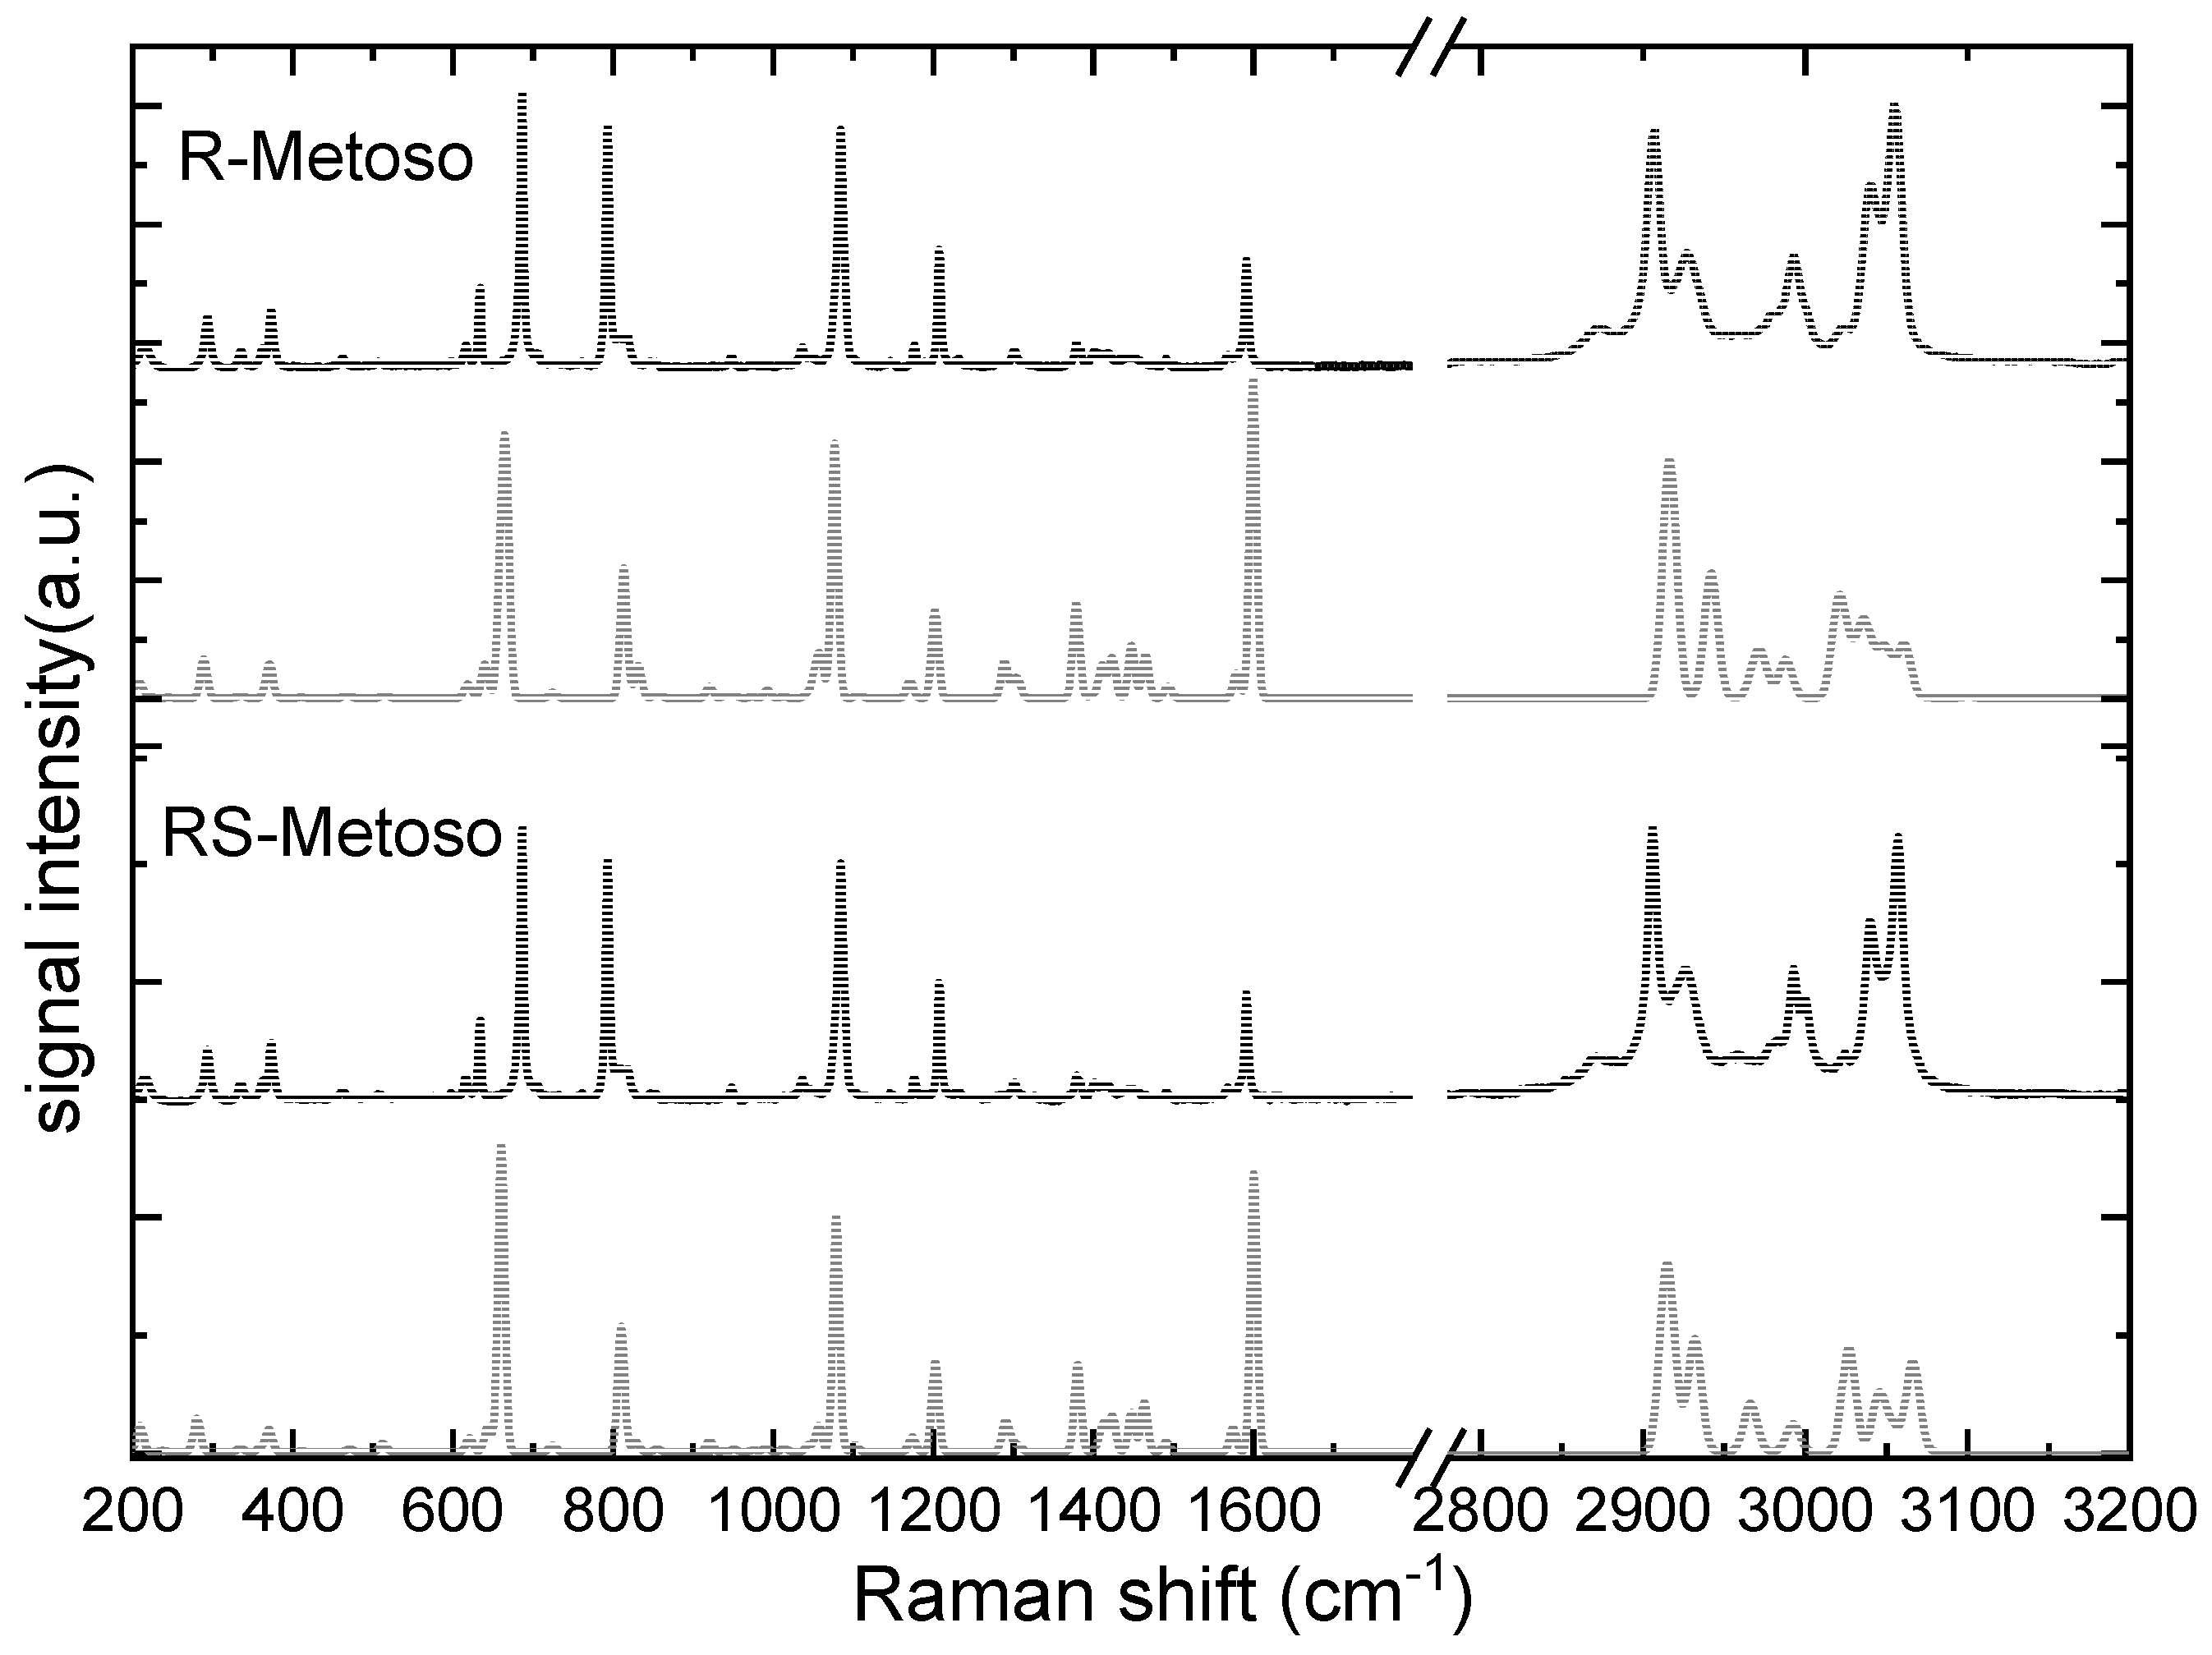
Figure 4.
Experimental Raman spectra of the solid pure R- Metoso and RS-Metoso (black lines) and calculated Raman spectra of the RR- and RS dimers (grey lines).
Figure 4.
Experimental Raman spectra of the solid pure R- Metoso and RS-Metoso (black lines) and calculated Raman spectra of the RR- and RS dimers (grey lines).
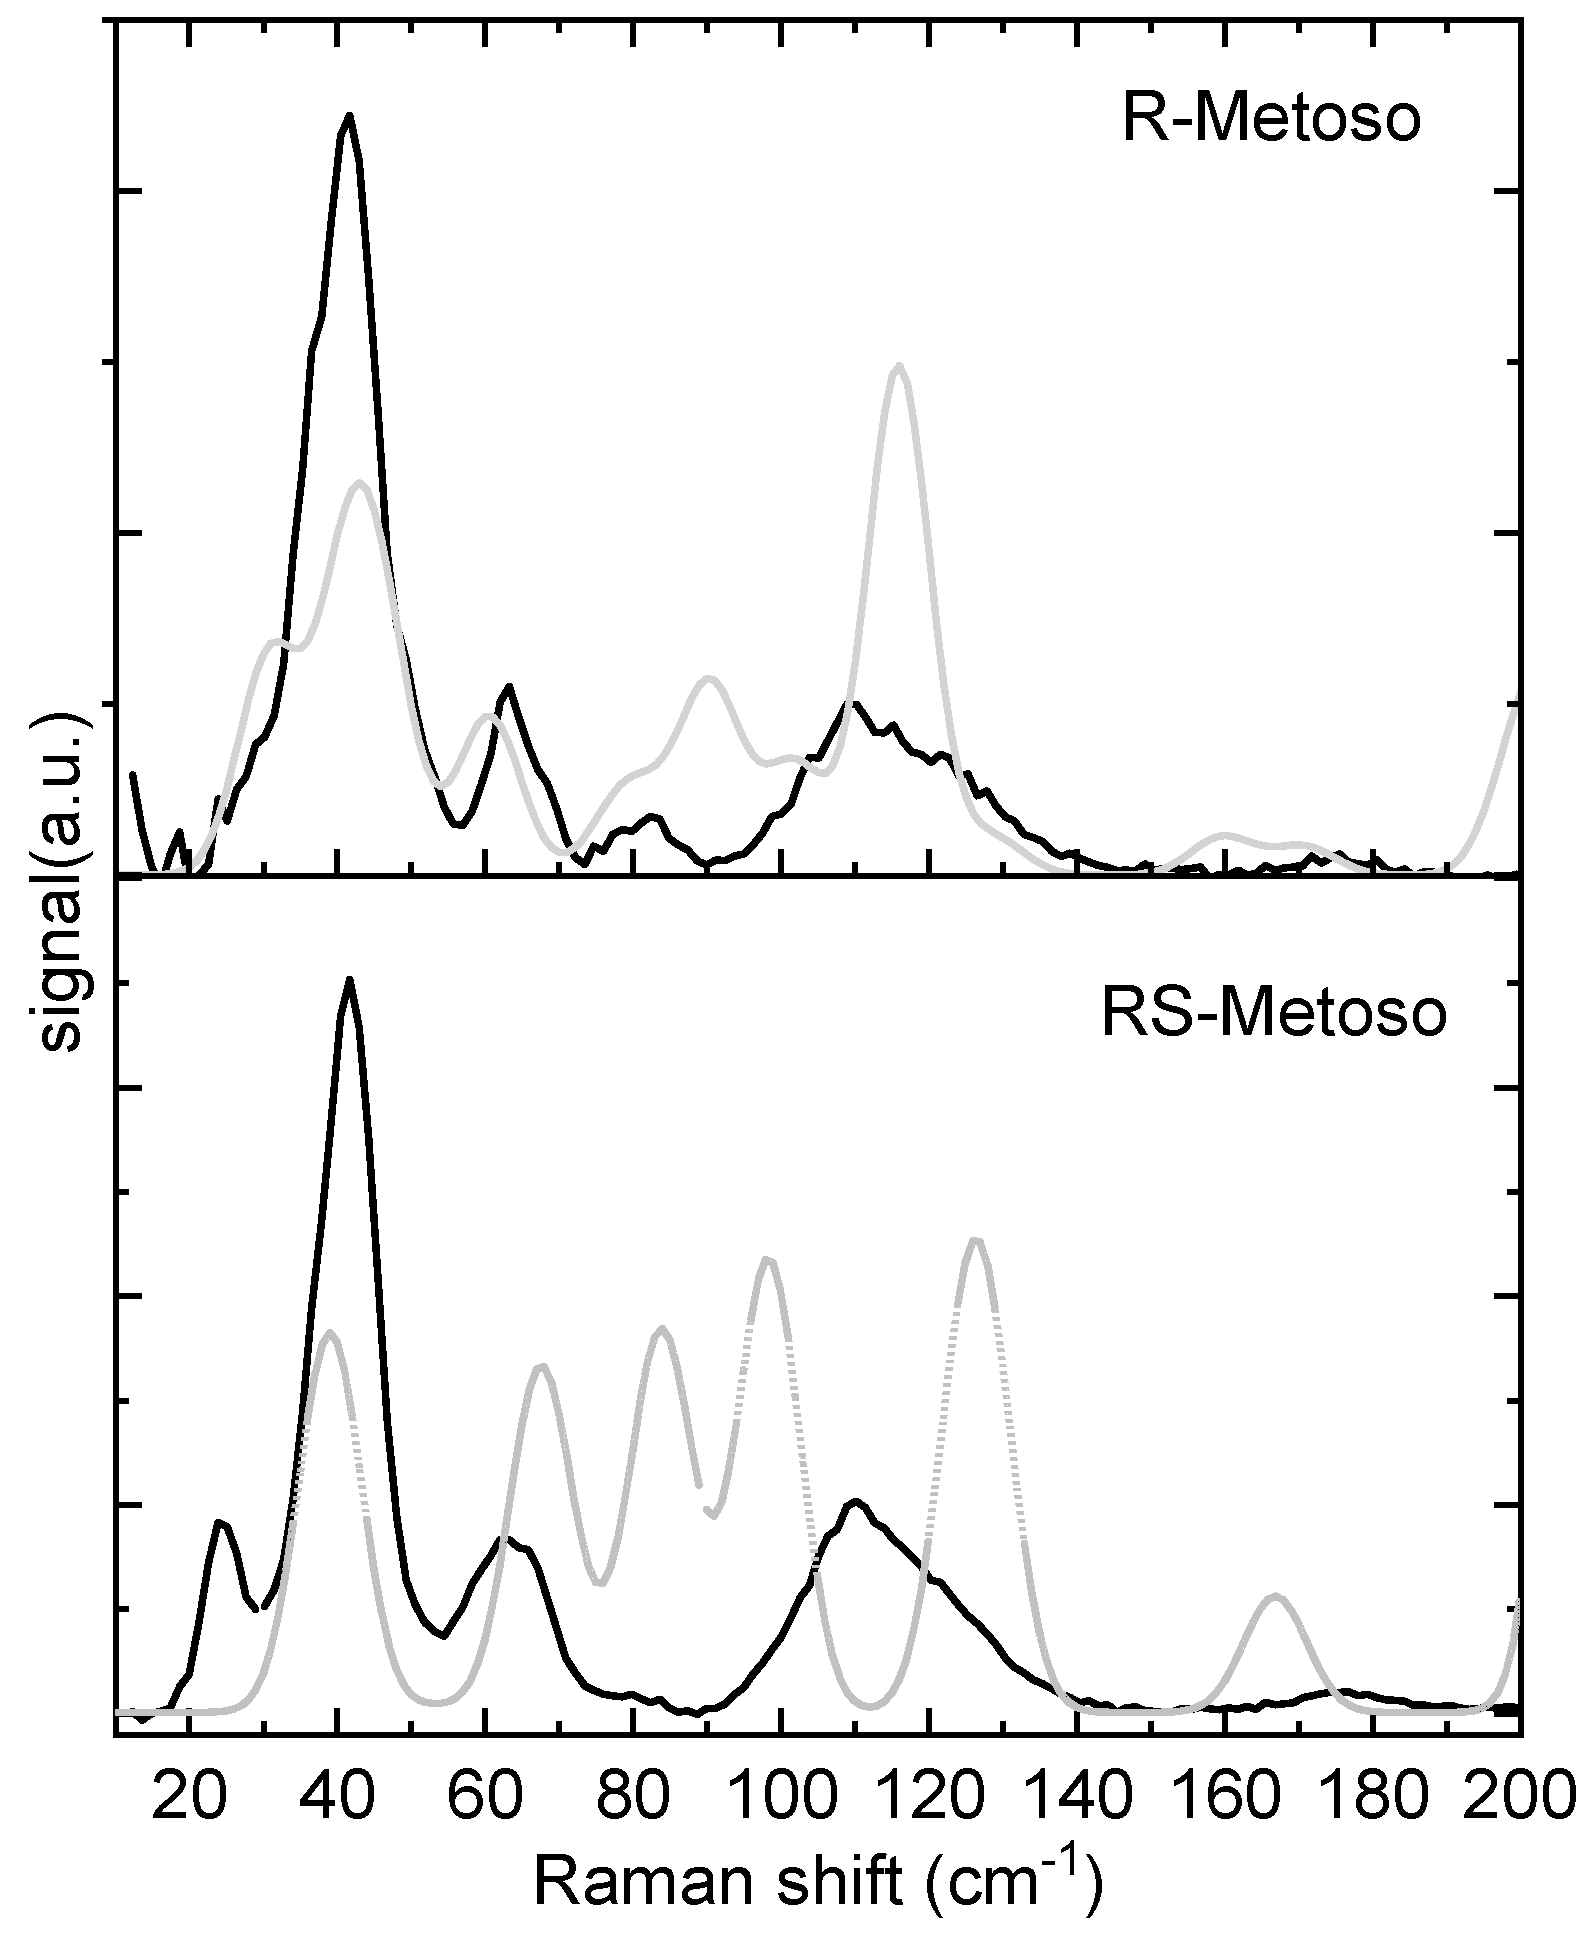
Figure 5.
Experimental Raman spectra of the liquid RS- and R- Metoso measured at the temperature indicated in the inset.
Figure 5.
Experimental Raman spectra of the liquid RS- and R- Metoso measured at the temperature indicated in the inset.
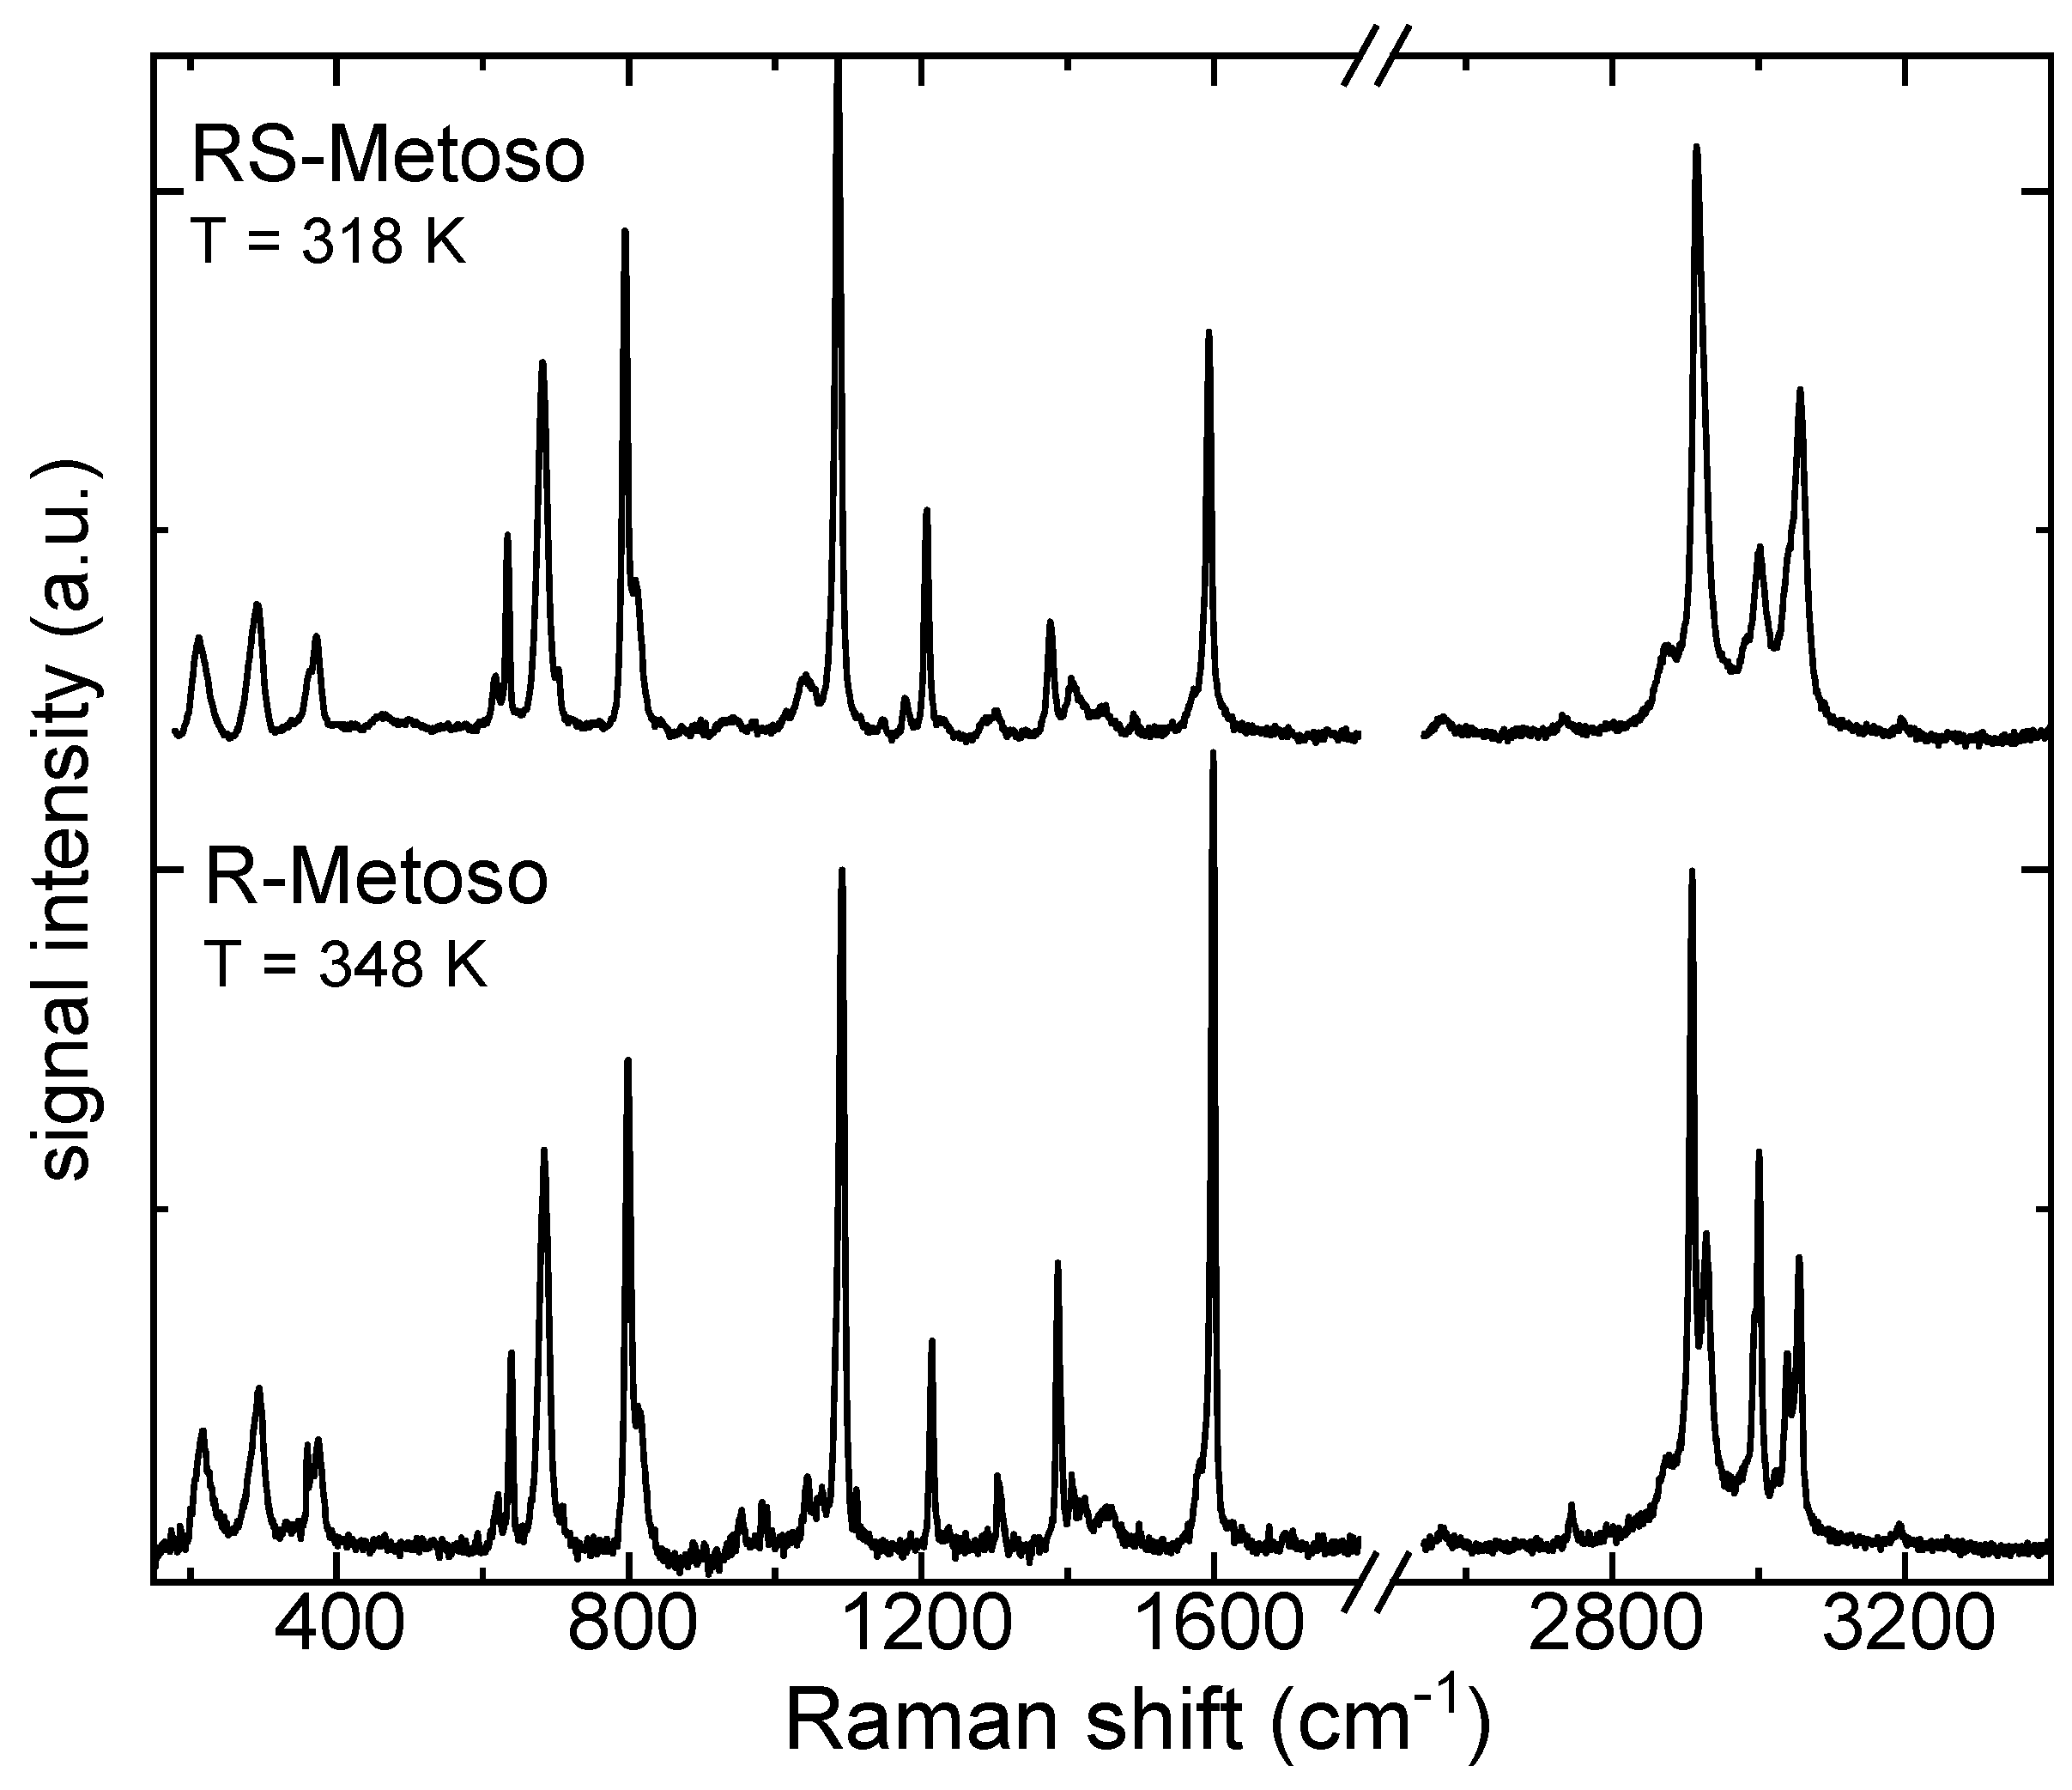
Figure 6.
Experimental Raman spectra of the RS-and R- Metoso in the solid (black lines) and in the liquid phases (green lines) in the spectral range between 180-400 cm−1 a), 600-900 cm−1 b), 1000-1800 cm−1 c) and 2800-3200 cm−1 d).
Figure 6.
Experimental Raman spectra of the RS-and R- Metoso in the solid (black lines) and in the liquid phases (green lines) in the spectral range between 180-400 cm−1 a), 600-900 cm−1 b), 1000-1800 cm−1 c) and 2800-3200 cm−1 d).
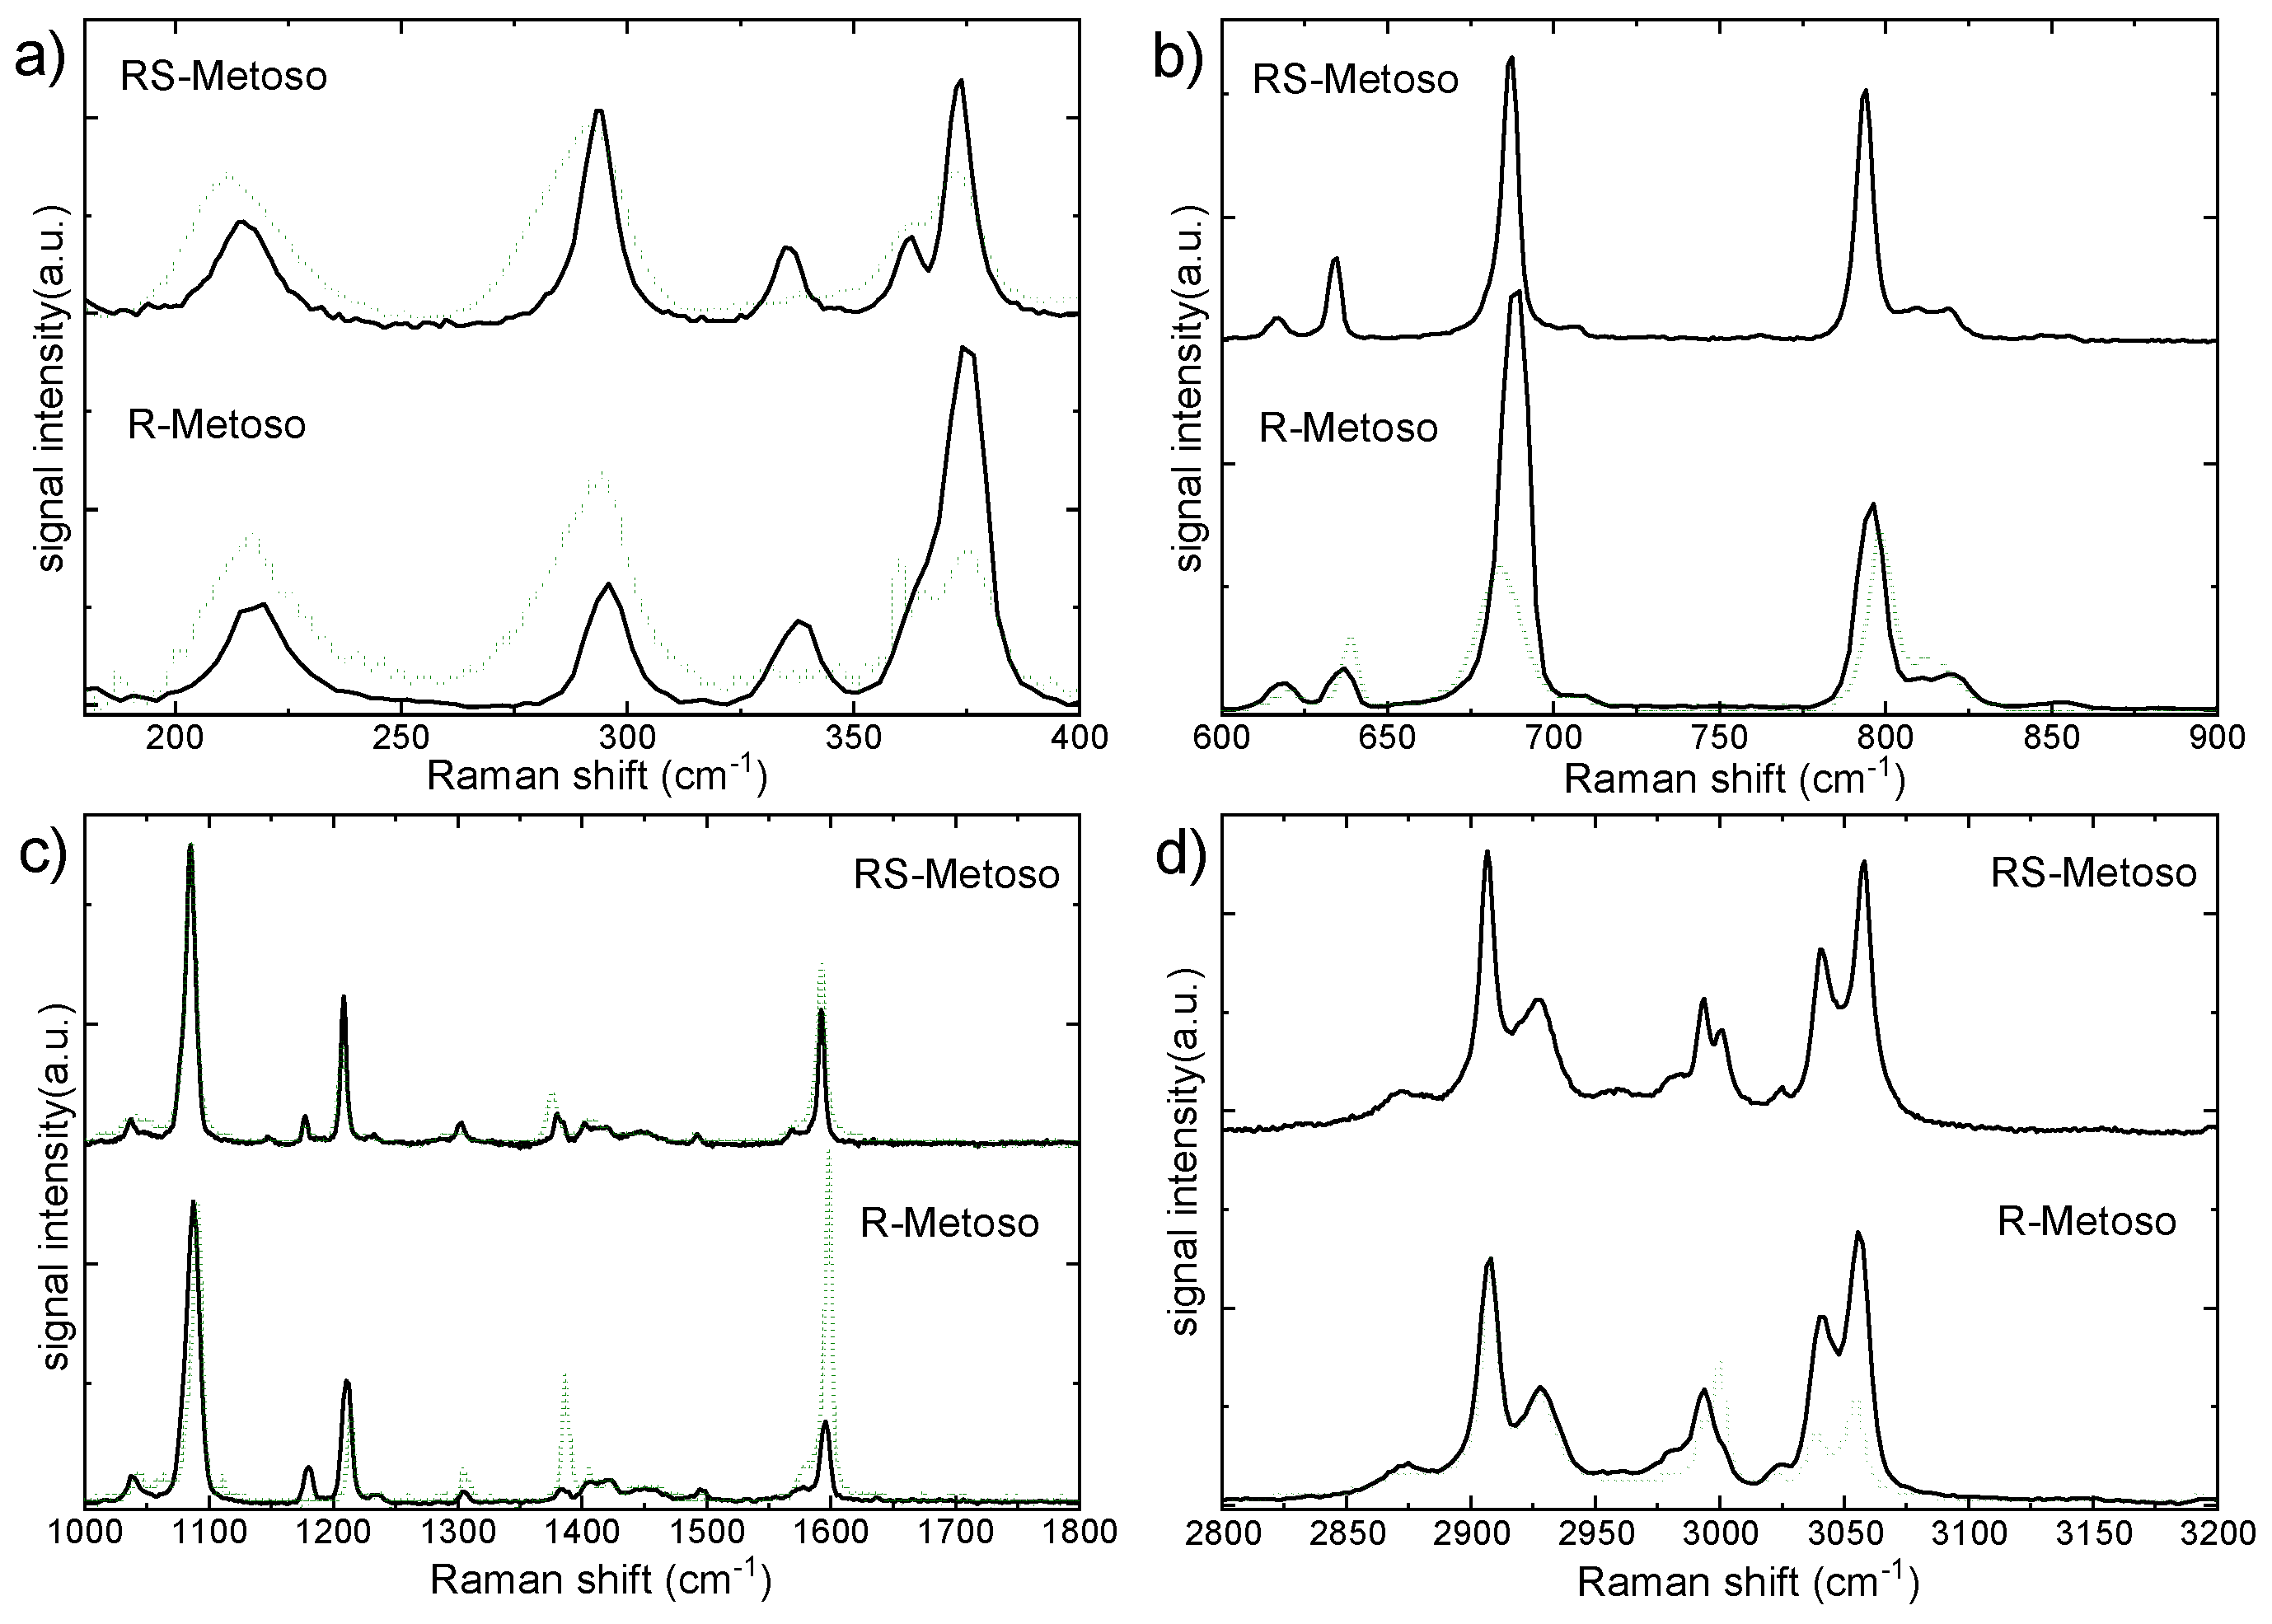
Figure 7.
On the left side, the experimental Raman spectra of a 10-1 M water solution of R-Metoso (a,c blue lines) compared with the Raman spectra of the solid pure R-Metoso (a,c black lines) in the spectral ranges between 600-1200 cm−1 a) and 2800-3200 cm−1 c). On the right side, the calculated Raman spectra for the RR dimer (black lines) and for R molecule in water (blue lines) are shown in the same spectral regions (b) 600-1200 cm−1 and (d) 2800-3200 cm−1.
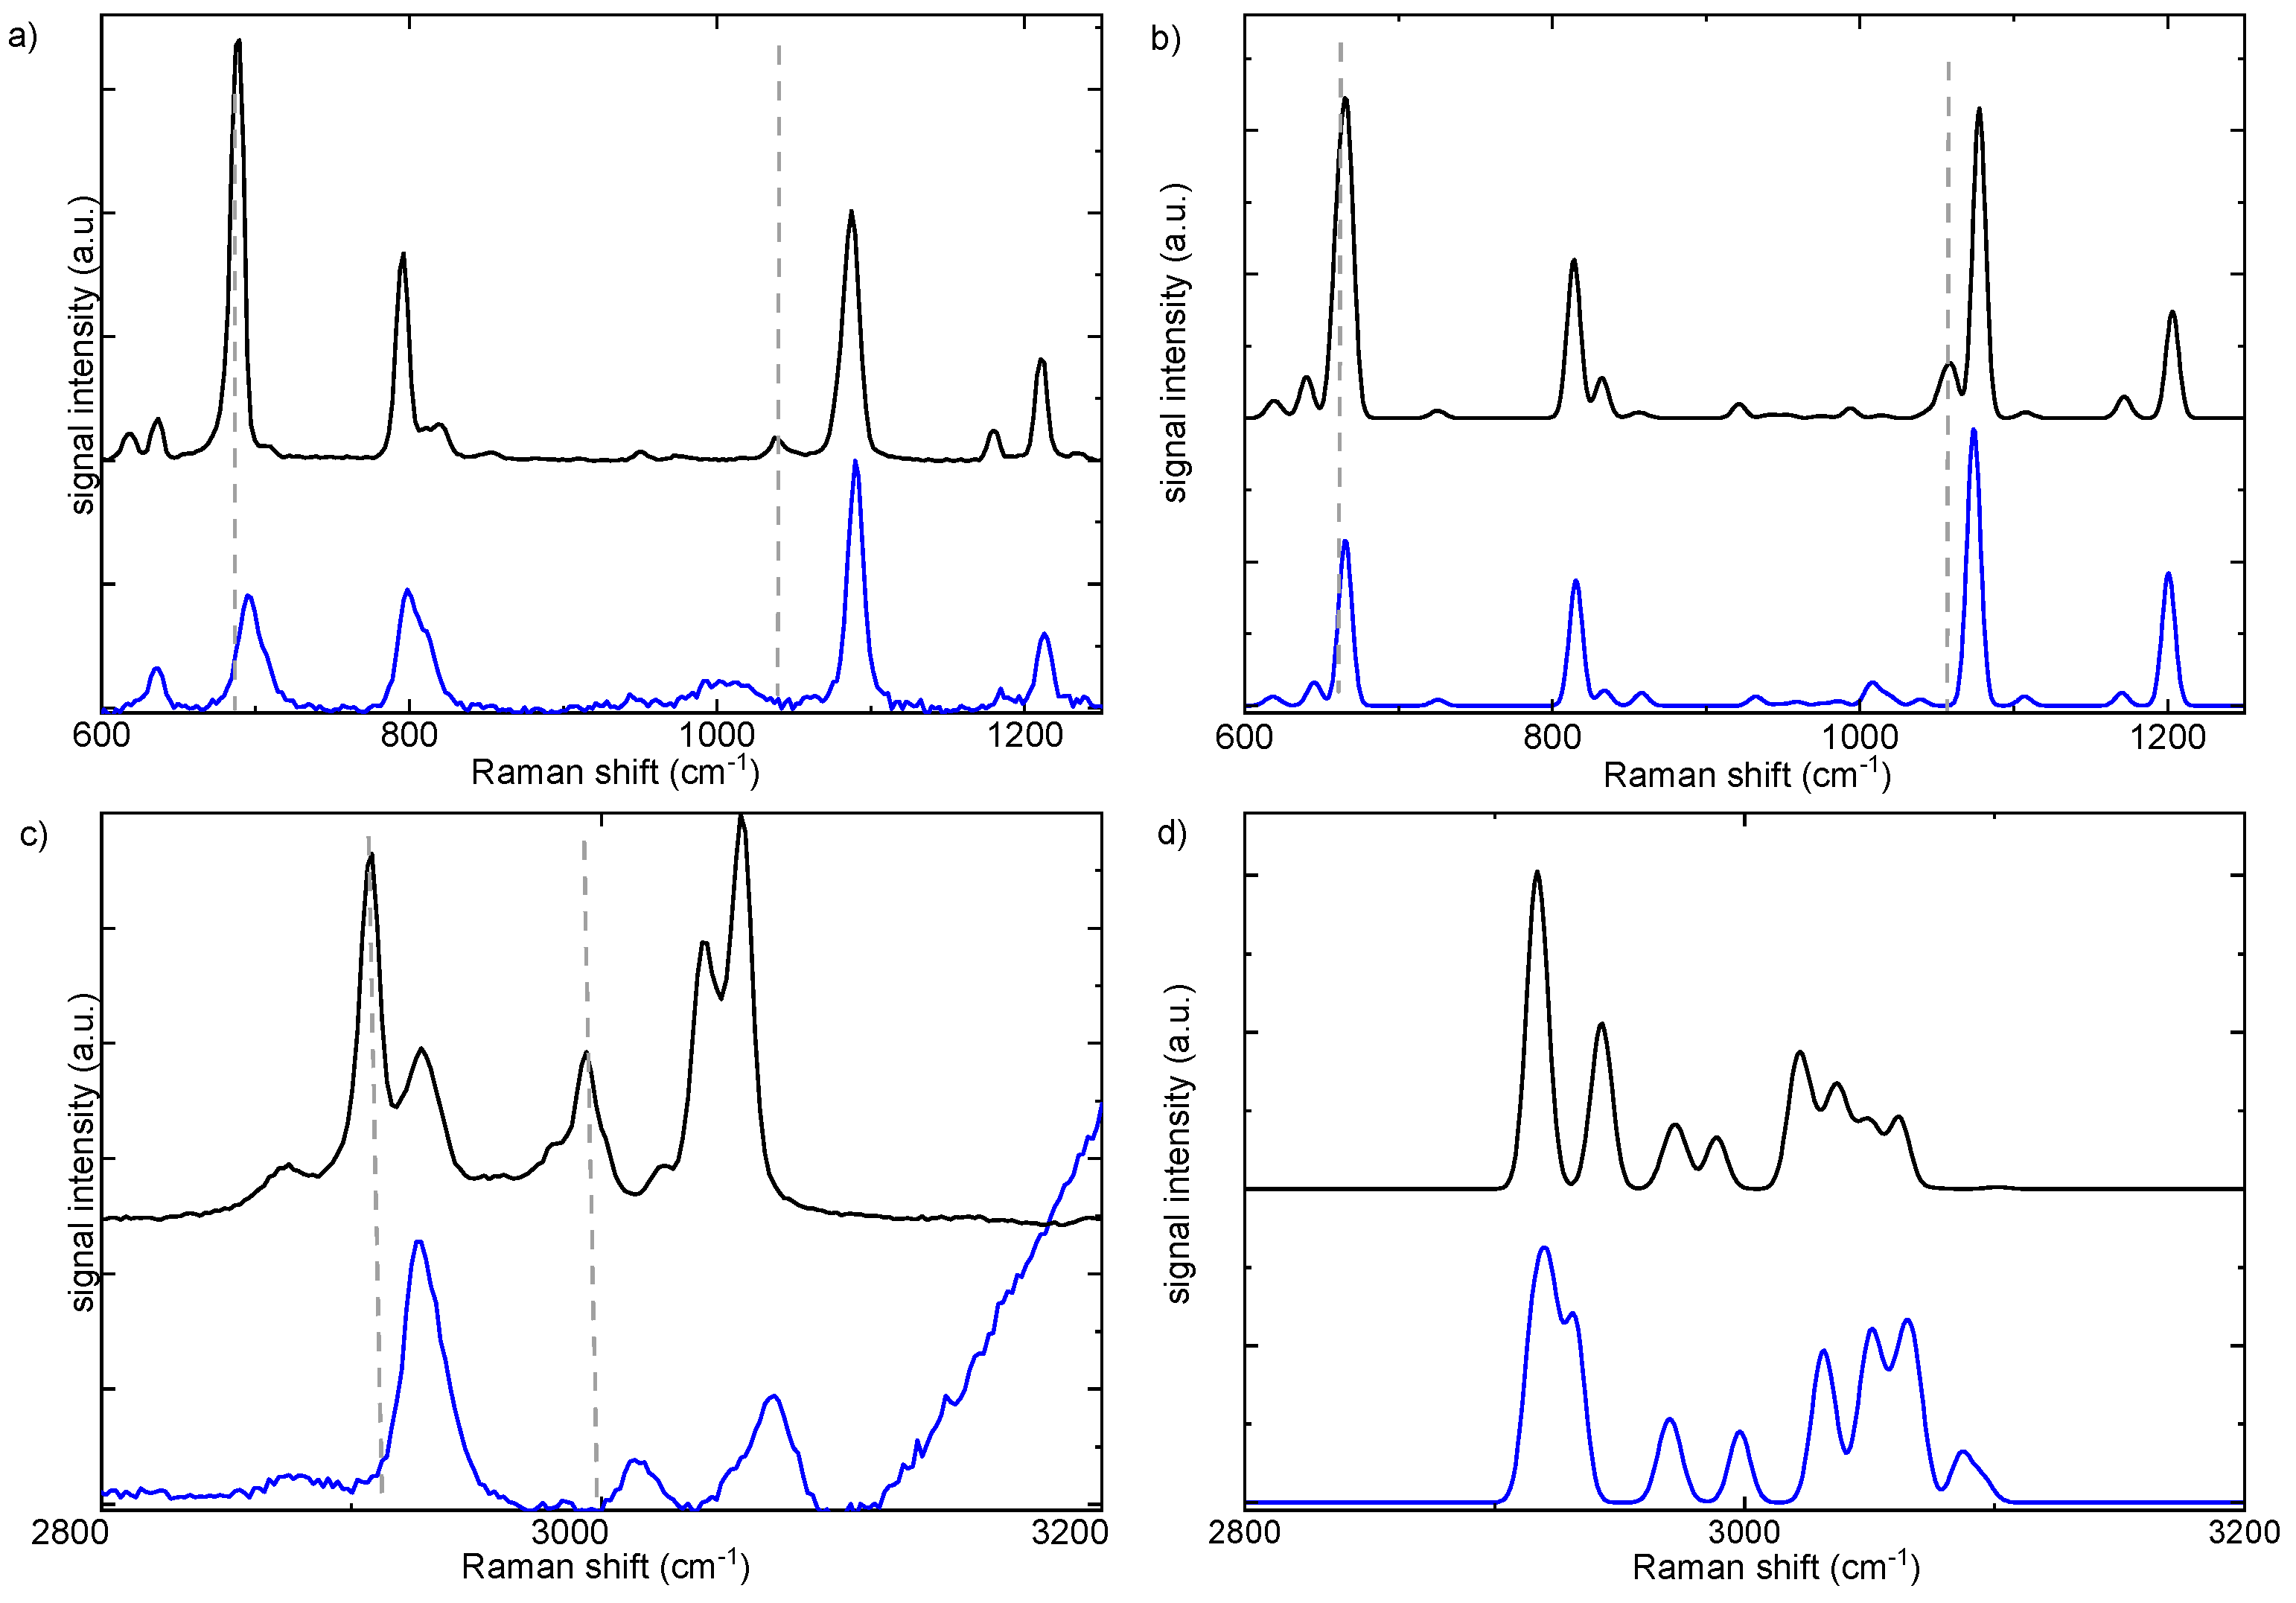

Table 1.
Experimental IR and Raman active modes and their descriptions.
| Description | R-Metoso | Racemic mixture | |||||
|---|---|---|---|---|---|---|---|
| IR | Raman | IR | Raman | ||||
| Solid 292 K |
Solid 292 K |
Liquid 348 K |
Solid 292 K |
Solid 292 K |
Liquid 318 K |
Solution 10-1 M in H2O 292 K |
|
| Caromatic-H str | 3051(m) | 3058(vs) | 3058(s) | 3051(m) | 3058(vs) | 3058(vs) | 3070(s) |
| Caromatic-H str | 3038(w) | 3048(vs) | 3048(s) | 3037(m) | 3048 (vs) | sh | 3053 (sh) |
| CS-H asym str | 3019(m) | 3024(w) | 3024(w) | 3021(m) | 3024(w) | ||
| Cpmetyl-H asym str | 2996(m) | 3000(s,sh) | 2996(m) | 3000(s) | 3013(m) | ||
| Cpmetyl-H asym str | 2988(m) | 2993(s) | 3000(s) | 2990(sh) | 2993(s) | 3003(s) | |
| Cpmetyl-H asym str | shoulder | 2982(sh) | 2993(sh) | sh | 2982(sh) | sh | |
| Cpmetyl-H asym str | 2954(m) | 2957(w) | 2954(m) | 2957(w) | |||
| CS-H sym str | 2921 (w) | 2926(s) | 2926(s) | 2922 (m) | 2926(s) | ||
| Cpmetyl-H sym str | 2904 (m) | 2907(vs) | 2907(vs) | 2907(m) | 2907(vs) | 2915(vvs) | 2928 (vs) |
| 2875(w) | 2871(m) | 2871(m) | 2871(m) | 2874(s) | 2875 (vw) | ||
| in plane Caromatic-H bending | 1663(w) | 1655(w) | |||||
| in plane Caromatic-H bending | 1594(w) | 1596(s) | 1599(vs) | 1596(m) | 1592(s) | 1593(s) | 1598(vs) |
| in plane Caromatic-H bending | 1540(vw) | 1578(sh) | 1582(sh) | 1569(sh) | |||
| CpmetylH3 rocking/twisting | 1492(m) | 1496(vw) | 1497(vw) | 1494(s) | 1492(vw) | ||
| CpmetylH3 rocking/twisting | 1451(w) | 1451(vw) | 1458(w) | 1451(m) | 1450(vw) | 1446(w) | |
| CpmetylH3 bending sym and asym | 1401(m) | 1403-1424(w) | 1406-1425(w) | 1403-1420(m) | 1403-1420(w) | 1405(w) | |
| CpmetylH3 umbrella | 1385(m) | 1382(w) | 1386(s) | 1386(m sh) | 1380(w) | 1375(m) | 1382(m) |
| CSH3 3 umbrella | 1297(m) | 1304(w) | 1304(m) | 1298(m) | 1303(w) | 1302(w) | 1313(vvw) |
| Cpmetyl-H scissoring | 1208(w) | 1210(s) | 1215(s) | 1209(m) | 1208(s) | 1208(s) | 1213(m) |
| Cpmetyl-H scissoring +C-CH3 stretch | 1177(w) | 1180(m) | 1178(w) | 1178(m) | 1178(w) | ||
| In plane C-H scissoring | 1148(m) | 1147(vvw) | |||||
| Caromatic -S stretching | 1115(vw) | 1116(w) | |||||
| aromatic C-C breath + CpmetylH3 rock | 1086(s) | 1087(vs) | 1091(vvs) | 1087(s) | 1085(vs) | 1085(vs) | 1089(vs) |
| S-O stretch + ring breath | 1039(vs) | 1037(m) | 1044(vw) | 1037(vvs) | 1038(w) | 1042(w) | 983-1030 |
| out of plane C-H arom + S-CH3 rock | 1011(m) | 1014(ssh) | |||||
| out of plane C-H arom + S-CH3 rock | 970(m) | sh | |||||
| S-CH3 rock | 947(m) | 950(vw) | 954(s) | 949(w) | |||
| out of plane Carom-H (sym) | 813(vs) | 818(m) | 812(sh) | 809(s) | 810(sh) | 809(sh) | |
| C-C arom breathing | 796(s) | 798(s) | 794(s) | 795(s) | 799(s) | ||
| out of plane CaromH (asym) | 706(w) | 705(w) | 705(sh) | ||||
| S-CH3 stretch | 684(m) | 690(vs) | 684(s) | 683(m) | 687(vs) | 681(s) | 695(s) |
| C-CH3 stretch | 633(w) | 637(m) | 639(s) | 633(w) | 635(m) | 635(m) | 634(m) |
| Carom-SCH3 stretch | 614(m) | 619(m) | 622(w) | 615(m) | 617(m) | 618(sh) | |
| Ring butterfly | 504(s) | 510(vw) | 504(vs) | 507(vw) | |||
| Asym ring stretch | 460(m) | 464(vw) | 460(m) | 462(vw) | 462(vvw) | ||
| C-S-O bending | 374(s) | 375(m) | 374(m) | 373(m) | 382(m) | ||
| C-C-CH3 3 bending | 364(sh) | 363(m) | |||||
| mixed | 338(w) | 335(w) | |||||
| C-S-C bending | 296(m) | 295(s) | 293(s) | 292(m) | 296(m) | ||
| C-CH3 torsion | 220(m) | 218(m) | 215(m) | 211(m) | 212(m) | ||
| C-SOCH3 torsion | 176(vw) | 176(vw) | |||||
| animation S5 | 109(s) | 109(s) | |||||
| animation S4 | 84(w) | 84 (vvw) | |||||
| animation S3 | 65(s) | 65(s) | |||||
| animation S2 | 42(vs) | 42(vs) | |||||
| animation S1 | shoulder | 24(s) | |||||
Disclaimer/Publisher’s Note: The statements, opinions and data contained in all publications are solely those of the individual author(s) and contributor(s) and not of MDPI and/or the editor(s). MDPI and/or the editor(s) disclaim responsibility for any injury to people or property resulting from any ideas, methods, instructions or products referred to in the content. |
© 2025 by the authors. Licensee MDPI, Basel, Switzerland. This article is an open access article distributed under the terms and conditions of the Creative Commons Attribution (CC BY) license (http://creativecommons.org/licenses/by/4.0/).
Copyright: This open access article is published under a Creative Commons CC BY 4.0 license, which permit the free download, distribution, and reuse, provided that the author and preprint are cited in any reuse.


