Submitted:
31 October 2025
Posted:
17 November 2025
You are already at the latest version
Abstract
This study examined how soluble and insoluble fibers affect blood sugar control, gut bacteria, and intestinal health in mice with type 2 diabetes. Thirty C57BL/6J mice were divided into three groups: diabetic control, inulin-fed, and wheat-bran-fed. After 12 weeks, fasting glucose dropped by 31% and HOMA-IR by 45% in the inulin group, while the wheat bran group showed smaller drops of 18% and 20%. Analysis of metabolites showed that inulin raised butyrate and lactate levels, while wheat bran increased propionate and valerate. The inulin group also had about 60% higher Occludin protein levels (P < 0.01), showing better gut barrier function. These results show that soluble fiber improves insulin response by supporting short-chain fatty acid formation and maintaining gut integrity, while insoluble fiber works mainly through slower fermentation. The study shows that fiber type plays an important role in managing blood sugar, offering evidence for choosing the right kind of fiber to support diabetes care.
Keywords:
soluble fiber
; insoluble fiber
; butyrate
; insulin response
; gut bacteria
; intestinal barrier
; type 2 diabetes
1. Introduction
Type 2 diabetes mellitus (T2DM) is a complex metabolic disorder characterized by chronic hyperglycemia, insulin resistance, and altered gut microbial composition [1]. Growing evidence suggests that gut microbiota and their metabolic products play a critical role in glucose regulation and insulin sensitivity [2]. Dietary factors, particularly fiber intake, have become a cornerstone of nutritional therapy for diabetes due to their ability to modulate microbial metabolism and improve glycemic control [3,4]. Among different dietary approaches, both high-fiber and low-carbohydrate (ketogenic) interventions have shown beneficial effects on blood glucose regulation, though their mechanisms differ—fiber acts primarily through microbial fermentation and SCFA production, while carbohydrate restriction alters lipid and ketone metabolism [5]. Understanding how specific fiber types affect microbial activity, fermentation patterns, and host metabolism is therefore essential for designing effective nutritional strategies for T2DM management. Dietary fibers differ in their physical and chemical properties, influencing how they are processed by gut microbes. Soluble fibers, such as inulin, are highly fermentable and can increase the production of short-chain fatty acids (SCFAs) like acetate, propionate, and butyrate, which are associated with improved insulin sensitivity and enhanced intestinal barrier function [6]. In contrast, insoluble fibers such as wheat bran have limited fermentability but contribute to increased stool bulk, accelerated intestinal transit, and potential indirect effects on microbial ecology [7]. Comparative studies suggest that soluble fibers may provide stronger metabolic benefits through selective stimulation of beneficial bacteria (e.g., Bifidobacterium, Faecalibacterium) and upregulation of SCFA pathways, while insoluble fibers may support gut motility and reduce endotoxin absorption [8]. However, direct comparisons between soluble and insoluble fibers in diabetic contexts remain limited, and most studies have not simultaneously assessed microbial metabolites, gut barrier integrity, and insulin sensitivity within a unified experimental design [9,10].
SCFAs serve as key intermediates linking dietary fiber fermentation to metabolic outcomes. Butyrate strengthens epithelial tight junctions (e.g., Occludin, ZO-1), suppresses inflammation, and promotes insulin responsiveness through GPR41/43 and AMPK pathways [11]. Propionate plays a dual role—it supports energy balance at physiological levels but may enhance hepatic glucose output when elevated [12]. Acetate and lactate, often precursors in cross-feeding interactions among gut microbes, influence butyrate formation and overall energy metabolism [13]. Differences in fiber fermentability can therefore lead to distinct SCFA patterns that differentially affect insulin action and gut integrity [14]. Nevertheless, existing research often suffers from methodological inconsistencies, including non-standardized fiber formulations, unequal caloric intake among groups, and incomplete metabolomic profiling [15]. Moreover, many studies rely solely on fecal SCFA concentrations, which reflect residual rather than total SCFA production or absorption, thereby underestimating systemic metabolic effects [16]. Few studies combine SCFA analysis with gut barrier protein quantification, leaving the mechanistic relationship between fiber-induced microbial changes and host insulin sensitivity insufficiently defined [17].
This study systematically compared a soluble fiber (inulin) and an insoluble fiber (wheat bran) in a controlled T2DM mouse model. Both groups were fed isocaloric diets to ensure comparable energy intake. We measured blood glucose, HOMA-IR, and gut barrier protein Occludin, alongside targeted metabolomics of SCFAs and lactate to characterize fermentation dynamics. The analysis focused on how distinct fermentation patterns correspond to improvements in insulin sensitivity and intestinal barrier integrity. This approach provides an integrated view of how fiber type influences microbial metabolism and metabolic health, contributing to a deeper understanding of gut-mediated glycemic regulation. By linking fiber fermentation, metabolite profiles, and host responses, this study offers new evidence supporting diet-based metabolic interventions for diabetes management and highlights how fiber composition can complement broader nutritional strategies such as ketogenic or mixed-diet approaches in improving glycemic control.
2. Materials and Methods
2.1. Animal Model and Experimental Setup
Thirty male C57BL/6J mice, aged eight weeks and weighing 22–25 g, were obtained from the Animal Facility of Zhejiang University. Mice were housed under controlled temperature (23 ± 1 °C), humidity (55 ± 5%), and a 12-hour light/dark cycle, with free access to food and water. After one week of adjustment, type 2 diabetes was induced by feeding a high-fat diet for eight weeks and injecting streptozotocin (40 mg/kg, i.p.). Mice with fasting glucose levels above 11.1 mmol/L were included in the diabetic model. All animal procedures followed ethical standards and were approved by the institutional committee (Approval No. ZJU-T2DM-2024-10).
2.2. Dietary Design and Control Groups
After model confirmation, the mice were divided into three groups (n = 10 per group): diabetic control (DC), inulin-fed (IN), and wheat-bran-fed (WB). The IN group received a diet containing 10% inulin, while the WB group received 10% wheat bran as a replacement for starch. The total caloric value of all diets was kept equal. The feeding lasted for 12 weeks. Body weight, food intake, and fasting glucose were measured weekly. The setup allowed a clear comparison between soluble and insoluble fibers under similar nutrient intake and diabetic conditions.
2.3. Sample Collection and Analytical Procedures
At the end of the trial, fasting blood was collected after a 12-hour fast. Fasting plasma glucose was measured using a handheld glucose meter (Roche, Germany). Serum insulin was determined using a mouse ELISA kit (Thermo Fisher Scientific, USA). The insulin sensitivity index (ISI) was calculated to evaluate insulin response. Fecal samples were collected for metabolite detection using gas chromatography–mass spectrometry (GC–MS, Agilent 7890B/5977B, USA). Intestinal Occludin levels were tested by Western blot.For quality control, each analytical batch included blank and mixed reference samples. Repeatability was checked every ten injections, and values with more than 10% deviation were re-measured.
2.4. Data Processing and Equations
All results were expressed as mean ± standard deviation (SD). Group differences were analyzed by one-way ANOVA followed by Tukey’s test. Correlations between SCFAs and insulin sensitivity were evaluated using Pearson’s r.
The insulin sensitivity index (ISI) was calculated as:
where is fasting plasma glucose (mmol/L), FINSFINSFINS is fasting insulin (μU/mL), is mean glucose, and is mean insulin.
The total SCFA production efficiency (E) was estimated using the formula:
where , , and are butyrate, propionate, and acetate concentrations, and is the total carbon input from fiber fermentation. Statistical significance was set at P < 0.05.
2.5. Ethics and Data Verification
All animal procedures complied with the National Guidelines for Laboratory Animal Welfare. The number of animals used was minimized to reduce unnecessary suffering. Raw data were verified by two independent researchers. Outliers were rechecked using Grubbs’ test and replaced only when justified. All GC–MS files were screened for baseline shifts and noise peaks before analysis. Data files have been deposited in the NCBI repository (Accession No. PRJNA1064582). The study maintained strict control for analytical consistency and data accuracy.
3. Results and Discussion
3.1. Effects of Different Fiber Types on Blood Glucose and Insulin Response
The inulin-fed group showed a 31% drop in fasting glucose and a 45% decline in HOMA-IR, while the wheat-bran-fed group only showed decreases of 18% and 20%, respectively. These changes indicate that soluble fibers have a stronger effect on insulin sensitivity than insoluble ones. Body weight and energy intake remained stable across all groups, confirming that the glycemic improvement came from metabolic effects rather than calorie restriction. Similar patterns were observed in clinical studies where soluble fibers enhanced insulin signaling through gut-derived metabolites [18]. These findings suggest that fermentation products from soluble fibers play a larger role in modulating glucose control than structural bulking effects from insoluble fibers (Figure 1).
3.2. SCFA Patterns and Relation to Gut Barrier Integrity
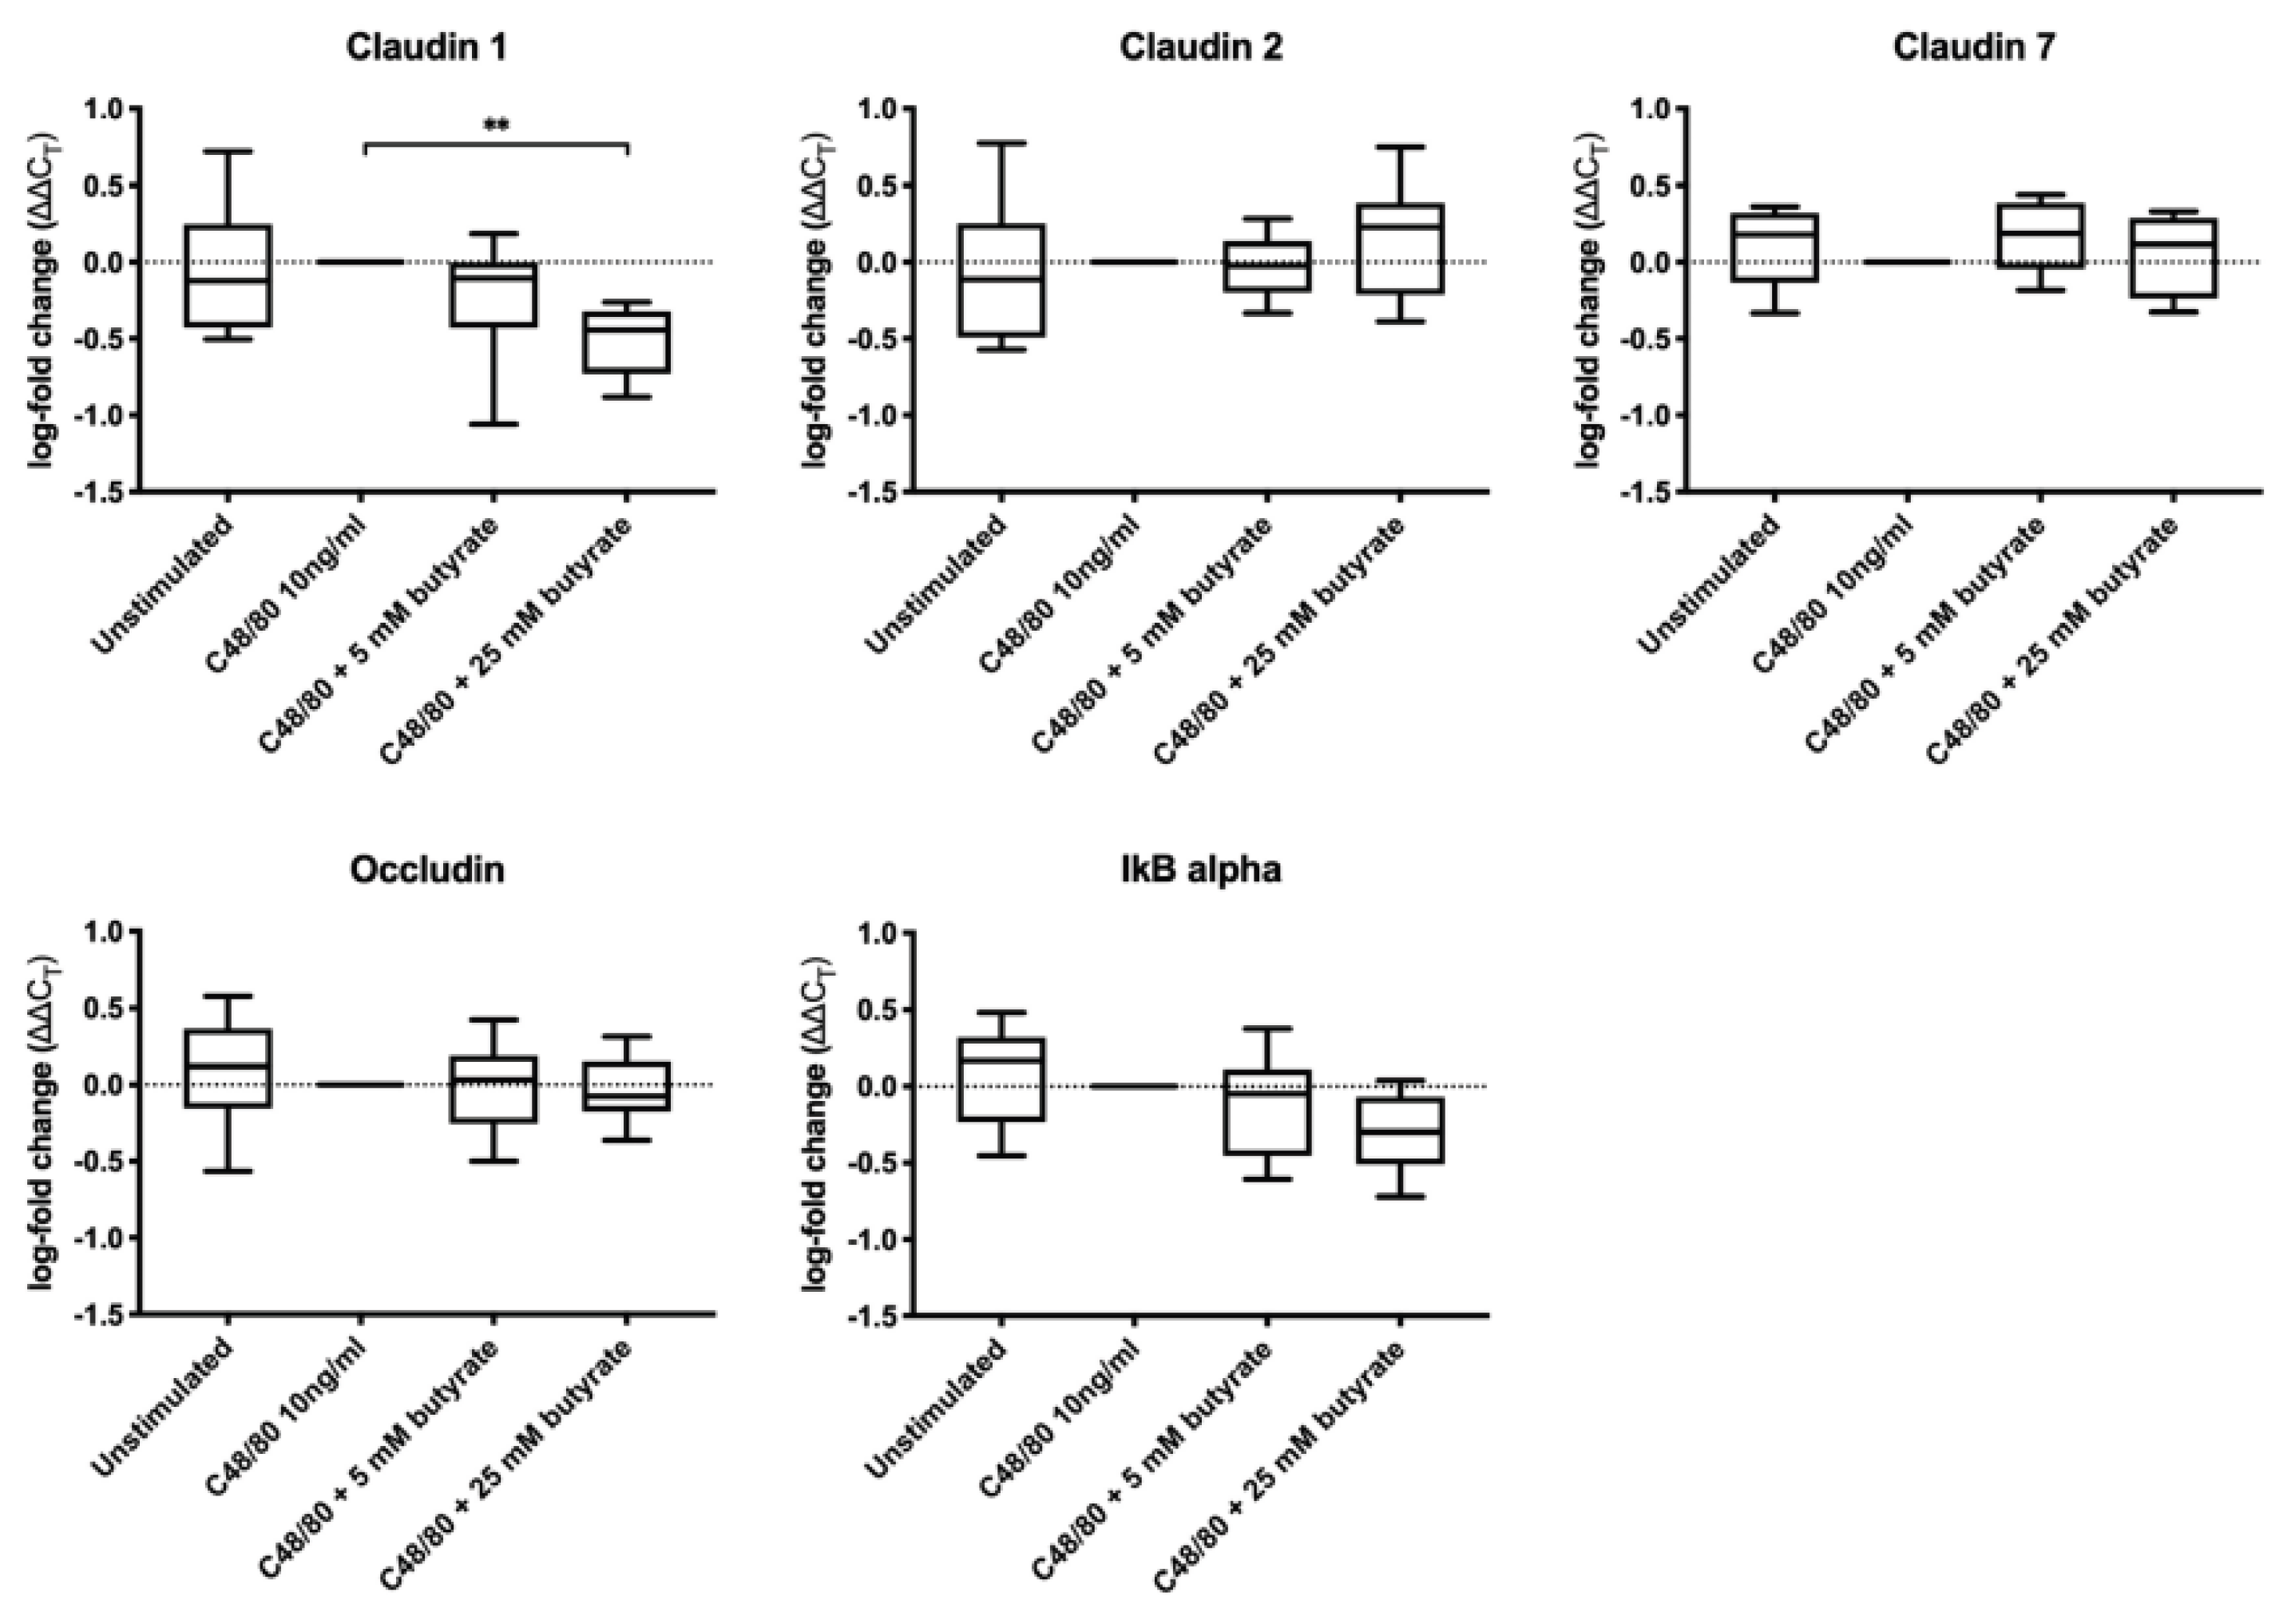
Gas chromatography–mass spectrometry showed that the inulin group had higher levels of butyrate and lactate, while the wheat bran group produced more propionate and valerate. Intestinal Occludin expression increased in both fiber groups, but the gain was nearly 60% higher in the inulin-fed mice (P < 0.01). Butyrate is known to support epithelial barrier strength and regulate inflammation, which explains its close link with higher Occludin levels [19]. This result agrees with reports showing that SCFA-driven signaling helps maintain tight-junction proteins and prevents bacterial translocation. As shown in Figure 2, similar protective effects were observed in a human ex vivo model
3.3. Gut Microbial Shifts and Metabolic Outcomes
Sequencing data showed that inulin intake increased the relative abundance of Bifidobacterium and Faecalibacterium, whereas wheat bran favored Lactobacillus and Prevotella. The rise of Bifidobacterium in the inulin group coincided with higher butyrate levels, reflecting enhanced carbohydrate fermentation. Previous studies have linked these microbes to improved glycemic control and lipid balance [20]. The correlation between Faecalibacterium and butyrate production (r = 0.79, P < 0.01) indicates that specific taxa are key contributors to the metabolic benefits of soluble fibers. However, some variability was observed among individuals, likely due to inherent microbiome differences before the intervention, a factor that limits reproducibility in both animal and human studies.
3.4. Integrated Metabolic Interpretation and Comparison with Earlier Work
Together, these results show that soluble and insoluble fibers affect metabolism through distinct gut–microbial–host interactions. Soluble fibers like inulin promote butyrate formation, strengthen gut barriers, and improve insulin action, while insoluble fibers mainly provide structural support and favor slower fermentation. This pattern agrees with prior reviews on fiber-specific microbial fermentation and metabolic outcomes. Compared with previous studies focusing on single-fiber interventions, our work directly compared two fiber types under equal energy intake, offering a more controlled insight into fiber–microbiome–metabolism interactions [21]. Yet, the study duration and limited sample size may constrain long-term extrapolation, and future work should include mixed-fiber interventions and metabolite tracking in humans for translational validation.
4. Conclusion
This study compared how soluble and insoluble fibers affect blood sugar, gut bacteria, and intestinal barrier function in mice with type 2 diabetes. The results showed that inulin, a soluble fiber, lowered blood glucose by 31% and HOMA-IR by 45%, while wheat bran caused smaller changes. Inulin also raised butyrate levels and increased Occludin protein, showing better gut barrier protection. Wheat bran mainly increased propionate and valerate, with weaker effects on insulin control. These findings show that different fiber types work through distinct microbial and metabolic routes. The study adds evidence that soluble fibers help regulate diabetes by improving gut fermentation rather than simply lowering calorie intake. Still, the short study period and use of an animal model limit the broader meaning of the results. Future work should include longer human studies and mixed-fiber diets to confirm how fiber combinations support long-term glucose balance.
References
- Galicia-Garcia, U., Benito-Vicente, A., Jebari, S., Larrea-Sebal, A., Siddiqi, H., Uribe, K. B., … & Martín, C. (2020). Pathophysiology of type 2 diabetes mellitus. International journal of molecular sciences, 21(17), 6275.
- Cani, P. D., Geurts, L., Matamoros, S., Plovier, H., & Duparc, T. (2014). Glucose metabolism: focus on gut microbiota, the endocannabinoid system and beyond. Diabetes & metabolism, 40(4), 246-257. [CrossRef]
- Wang, Y., Wen, Y., Wu, X., Wang, L., & Cai, H. (2024). Modulation of Gut Microbiota and Glucose Homeostasis through High-Fiber Dietary Intervention in Type 2 Diabetes Management. [CrossRef]
- Murugesan, R., Kumar, J., Leela, K. V., Meenakshi, S., Srivijayan, A., Thiruselvam, S., … & Chaithanya, V. (2025). The role of gut microbiota and bacterial translocation in the pathogenesis and management of type 2 diabetes mellitus: Mechanisms, impacts, and dietary therapeutic strategies. Physiology & Behavior, 114838. [CrossRef]
- Ge, G., Zelig, R., Brown, T., & Radler, D. R. (2025). A review of the effect of the ketogenic diet on glycemic control in adults with type 2 diabetes. Precision Nutrition, 4(1), e00100.
- McNabney, S. M., & Henagan, T. M. (2017). Short chain fatty acids in the colon and peripheral tissues: a focus on butyrate, colon cancer, obesity and insulin resistance. Nutrients, 9(12), 1348. [CrossRef]
- Chen, D., Liu, J., Wu, J., & Suk, J. S. (2021). Enhancing nanoparticle penetration through airway mucus to improve drug delivery efficacy in the lung. Expert opinion on drug delivery, 18(5), 595-606. [CrossRef]
- Rezende, E. S. V., Lima, G. C., & Naves, M. M. V. (2021). Dietary fibers as beneficial microbiota modulators: A proposed classification by prebiotic categories. Nutrition, 89, 111217. [CrossRef]
- Xu, K., Lu, Y., Hou, S., Liu, K., Du, Y., Huang, M., … & Sun, X. (2024). Detecting anomalous anatomic regions in spatial transcriptomics with STANDS. Nature Communications, 15(1), 8223. [CrossRef]
- Horvath, A., Leber, B., Feldbacher, N., Tripolt, N., Rainer, F., Blesl, A., … & Stadlbauer, V. (2020). Effects of a multispecies synbiotic on glucose metabolism, lipid marker, gut microbiome composition, gut permeability, and quality of life in diabesity: a randomized, double-blind, placebo-controlled pilot study. European journal of nutrition, 59(7), 2969-2983. [CrossRef]
- Deng, T., Huang, M., Xu, K., Lu, Y., Xu, Y., Chen, S., … & Sun, X. (2024). LEGEND: Identifying Co-expressed Genes in Multimodal Transcriptomic Sequencing Data. bioRxiv, 2024-10. [CrossRef]
- Perry, R. J., Borders, C. B., Cline, G. W., Zhang, X. M., Alves, T. C., Petersen, K. F., … & Shulman, G. I. (2016). Propionate increases hepatic pyruvate cycling and anaplerosis and alters mitochondrial metabolism. Journal of Biological Chemistry, 291(23), 12161-12170. [CrossRef]
- Xu, J., Wang, H., & Trimbach, H. (2016, June). An OWL ontology representation for machine-learned functions using linked data. In 2016 IEEE International Congress on Big Data (BigData Congress) (pp. 319-322). IEEE.
- Portincasa, P., Bonfrate, L., Vacca, M., De Angelis, M., Farella, I., Lanza, E., … & Di Ciaula, A. (2022). Gut microbiota and short chain fatty acids: implications in glucose homeostasis. International journal of molecular sciences, 23(3), 1105. [CrossRef]
- Yuan, M., Mao, H., Qin, W., & Wang, B. (2025). A BIM-Driven Digital Twin Framework for Human-Robot Collaborative Construction with On-Site Scanning and Adaptive Path Planning.
- Sakata, T. (2019). Pitfalls in short-chain fatty acid research: a methodological review. Animal science journal, 90(1), 3-13. [CrossRef]
- Chen, H., Ning, P., Li, J., & Mao, Y. (2025). Energy Consumption Analysis and Optimization of Speech Algorithms for Intelligent Terminals.
- Wu, C., Zhu, J., & Yao, Y. (2025). Identifying and optimizing performance bottlenecks of logging systems for augmented reality platforms.
- Salvi, P. S., & Cowles, R. A. (2021). Butyrate and the intestinal epithelium: modulation of proliferation and inflammation in homeostasis and disease. Cells, 10(7), 1775. [CrossRef]
- Wang, Y., Wen, Y., Wu, X., & Cai, H. (2024). Application of Ultrasonic Treatment to Enhance Antioxidant Activity in Leafy Vegetables. International Journal of Advance in Applied Science Research, 3, 49-58.
- Connors, B. M., Thompson, J., & Venturelli, O. S. (2025). Machine learning-guided design of human gut microbiome dynamics in response to dietary fibers. bioRxiv, 2025-03.
Figure 1.
Changes in fasting glucose and HOMA-IR after 12 weeks of inulin or wheat bran intake in diabetic mice.
Figure 1.
Changes in fasting glucose and HOMA-IR after 12 weeks of inulin or wheat bran intake in diabetic mice.
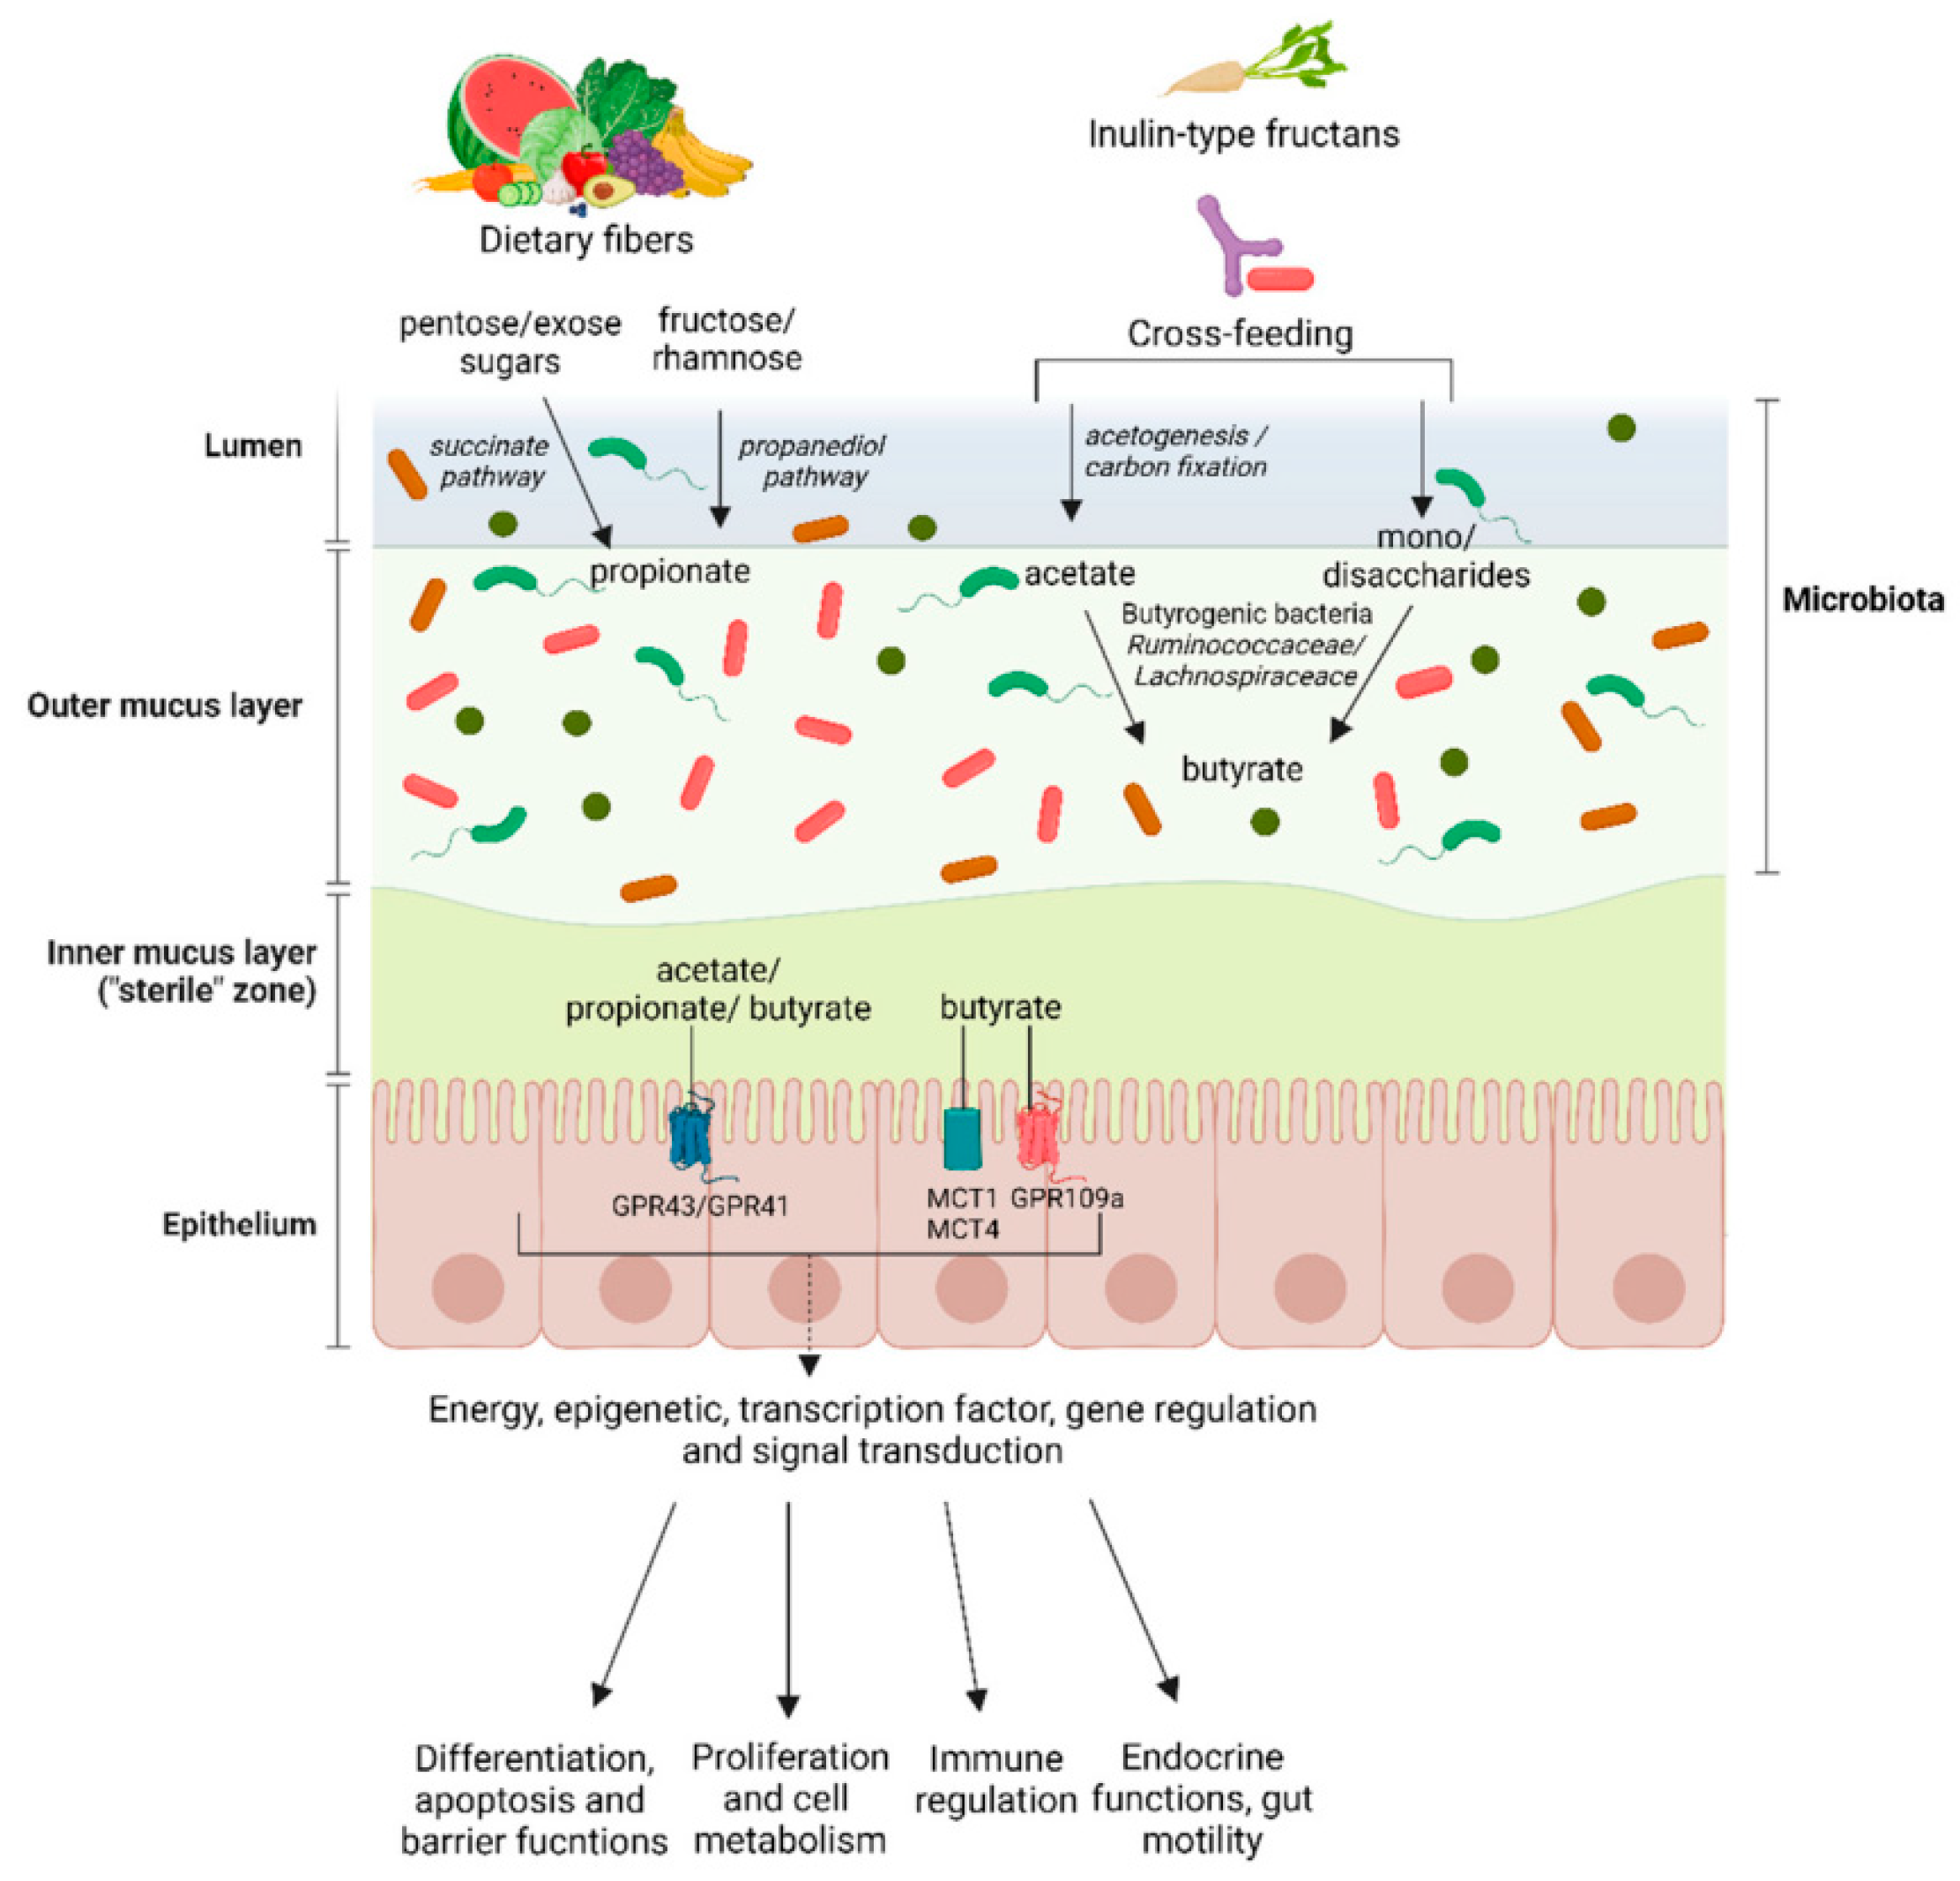
Figure 2.
Link between SCFA concentration and Occludin expression in intestinal tissue.
Disclaimer/Publisher’s Note: The statements, opinions and data contained in all publications are solely those of the individual author(s) and contributor(s) and not of MDPI and/or the editor(s). MDPI and/or the editor(s) disclaim responsibility for any injury to people or property resulting from any ideas, methods, instructions or products referred to in the content. |
© 2025 by the authors. Licensee MDPI, Basel, Switzerland. This article is an open access article distributed under the terms and conditions of the Creative Commons Attribution (CC BY) license (https://creativecommons.org/licenses/by/4.0/).
Copyright: This open access article is published under a Creative Commons CC BY 4.0 license, which permit the free download, distribution, and reuse, provided that the author and preprint are cited in any reuse.


