
Submitted:
12 November 2025
Posted:
13 November 2025
You are already at the latest version
Abstract
This paper proposes and validates a method for assessing the resilience of cyber–physical microgrids integrating Photovoltaic (PV) generation and Battery Energy Storage Systems (BESS). The approach combines two operational performance indicators—Voltage Deviation Index (VDI) and Energy Not Supplied (ENS)—with a composite resilience index that captures recovery dynamics following physical and cyber disturbances. The method is implemented in MATLAB Simulink on the IEEE 33-bus feeder, with PV at bus 6 and a BESS at bus 18. Two stress scenarios are analyzed: (i) loss of the main supply at bus 2 and (ii) a cyber-induced communication failure that triggers local (fallback) operation. Compared with the base case, the proposed strategy reduces VDI by approximately 27% and ENS by 12%, demonstrating significantly improved resilience without noticeable performance penalties.
Keywords:
renewable-powered microgrids
; PV – BESS systems
; intelligent modeling
; cyber – physical resilience
; blackout prevention
; grid stability
; energy storage integration
; predictive simulation
; cybersecurity in power systems
1. Introduction
1.1. Contemporary Context of Modern Power Systems
Over the past decades, global electricity demand has risen markedly, driven by economic growth, population increase, and rapid digitalization. Electricity now underpins industrial activity, transportation, communications, and daily life—intensifying pressures on sustainability and energy security. Recent assessments show global electrical consumption nearly doubling between 2000 and 2023, underscoring the scale of this challenge [1,2]. Legacy power grids, engineered around a one-way flow from centralized generation to end-users, increasingly reveal structural weaknesses under today’s operating conditions. Their dependence on large, centralized assets creates single points of failure, and cascading disturbances can propagate widely across transmission networks; restoration is often slow and costly when flexible, automated control is lacking [3,4,5]. Concurrently, the energy transition—spurred by climate imperatives and the finite nature of fossil resources—has accelerated the deployment of renewable energy technologies. While clean and effectively inexhaustible, variable resources such as solar and wind introduce intermittency that complicates real-time balancing. Without adequate storage and advanced control, conventional grids struggle to maintain stability and quality of supply [6,7]. Against this backdrop, smart grids and microgrids have emerged as pragmatic solutions. By integrating distributed renewables with storage and intelligent control, they optimize power flows, shorten recovery after disturbances, and support decentralized, autonomous operation—including islanding when needed—thereby enhancing system resilience [1,8,9].
1.2. The Challenge of Power Outages
Electricity outages (aka blackouts) remain among the most severe threats to modern energy systems. They arise from extreme natural hazards, network overloading, equipment failures, and cyberattacks—risks that are amplified by the rapid digitalization and interconnection of grid assets’ Ensuring cyber-physical security is therefore inseparable from system reliability [10,11,12,13]. The growing intensity and frequency of severe weather compound outage risk, with multiple studies identifying weather as a leading driver of grid unreliability (e.g., ≈56% in some regions). Extreme events increase operational uncertainty and stress restoration capabilities unless resilience measures are in place [14,15,16,17]. Outages carry substantial economic and social costs—lost production, equipment damage, higher operating expenditures, and public safety impacts. Case evidence from national blackouts and major storms shows large direct losses and persistent ripple effects across communities and industries [18,19]. Because critical infrastructures (e.g., energy, water, transport, health) are tightly interdependent, a single physical or cyber incident can cascade across sectors, complicating both failure dynamics and recovery pathways [20,21]. Accordingly, blackout prevention and supply continuity are no longer purely technical aims; they are foundational to national security and macroeconomic stability, demanding integrated cyber-physical defense and resilient operations [10,22].
1.3. The Importance of Energy Resilience amid Climate Change and Digitalization
Energy resilience is the capability of a power system to withstand, adapt to, and rapidly recover from disruptive events while continuing to deliver electricity safely and sustainably. In contemporary grids, resilience has become a central policy and engineering objective, complementing—but going beyond—traditional reliability by explicitly accounting for disturbance absorption, adaptive response, and recovery dynamics [23,24]. Climate change is intensifying the incidence and severity of extreme weather—storms, floods, and heatwaves—that damage energy infrastructure and trigger system imbalances. These high-impact, low-frequency events expose the limits of legacy networks unless resilience measures and investment frameworks are integrated into planning and operations [15,25]. In parallel, rapid digitalization delivers major gains in efficiency, monitoring, and control, but also expands the cyber-attack surface of smart grids. Ensuring cyber-physical security is therefore inseparable from resilience, requiring coordinated requirements, threat modeling, and countermeasures across communication, control, and protection layers [10,23,26]. Accordingly, building resilience entails: (i) protecting critical infrastructure via advanced cybersecurity and secure-by-design communications; (ii) integrating renewable generation with BESS to bolster local autonomy and ride-through capability; and (iii) deploying microgrids that can operate in islanded mode during major disturbances. Evidence shows that PV–BESS microgrids enhance continuity of supply, shorten recovery, and support self-healing and fast reconfiguration, particularly when underpinned by standards-based communications (e.g., IEC 61850:2025 SER) [8,9,27]. This paper advances prior blackout-prevention studies by proposing a unified, resilience-oriented assessment for PV–BESS microgrids facing both physical and cyber disturbances.
We combine quantitative indicators—VDI to capture voltage quality, ENS to measure unmet demand, and a Global Resilience Index (GRI) derived from recovery curves—with qualitative analysis of recovery dynamics, yielding an integrated framework to characterize hybrid system performance and validate control strategies aimed at strengthening stability [28,29,30,31].
1.4. Literature Gap Analysis
A review of recent work reveals several gaps that motivate this study: (i) a limited cyber–physical perspective that treats power and communications in isolation; (ii) fragmented metrics that hinder cross-study comparison; (iii) reproducibility constraints stemming from proprietary models, data, and non-standardized scenarios; and (iv) under-examined communication-loss events and Energy Management Systems (EMS) fallback behavior.
(i) Most works address physical events (faults, switching, load variations) while underrepresenting the cyber dimension—communication faults, data integrity issues, and control-layer compromises—in resilience analysis.
(ii) Few models integrate static indicators (e.g., VDI, ENS) with time-resolved metrics (recovery time, restoration slope) and composite, area-based indices within a single, coherent assessment framework.
(iii) A significant share of studies relies on bespoke or partially specified models, limiting comparability and replication across research groups.
(iv) The influence of communication degradation or loss on droop-based hierarchical control—especially in inverter-dominated microgrids—remains insufficiently documented, with scarce co-modeling of control dynamics and network impairments.
1.5. Aim, Objectives and Contributions of the Study
The primary aim of this work is to prevent major blackouts and to enhance the stability and resilience of the power system by designing and analyzing an intelligent PV-BESS microgrid integrated into a modern IEEE 33-bus distribution network.
To achieve the aims mentioned, the study pursues the following specific objectives:
a) Analyze the microgrid concept and its role within smart grids;
b) Identify the principal causes of outages and vulnerabilities of conventional grids;
c) Examine renewable-integration technologies with emphasis on stability and efficiency;
d) Propose a PV–BESS microgrid architecture that ensures supply continuity and local energy balance;
e) Assess the impact of microgrid deployment on power system security and performance;
f) Investigate cybersecurity treats and formulate measures to strengthen resilience;
g) Formulate recommendations for the broader integration of microgrids into national energy infrastructure.
Synthesizing the gap analysis, the paper advances the field through the following contributions:
- Develops an integrated cyber–physical resilience methodology that unifies static, temporal, and composite indicators.
- Applies the framework to a standard, reproducible benchmark (IEEE 33-bus)—with PV at bus 6 and BESS at bus 18—to support transparent comparison.
- Quantifies performance for two representative contingencies—loss of the main supply and a communication failure triggering local operation—evaluating impacts on stability and ENS, together with recovery dynamics and a composite resilience index.
This work thereby clarifies the interactions between the physical and digital layers of a microgrid and—through simulations on the IEEE 33-bus feeder—demonstrates how PV–BESS integration can reduce voltage deviations and ENS following disturbances. In essence, the paper proposes a resilience assessment method for PV–BESS microgrids and validates it on a reproducible IEEE 33-bus model subjected to two representative perturbations: loss of the main supply and a communication failure.
1.6. Article structure
This article is organized as follows. Section 2 introduces the microgrid test system and simulation setup, including network topology and component parameters (lines, transformers, PV units, and BESS). Section 3 details the resilience assessment framework and the disturbance scenarios considered. Section 4 reports and interprets the simulation results with respect to system stability and recovery. Section 5 concludes and outlines future research directions for integrating smart microgrids into modern power networks.
2. Theoretical Foundations and Related Works
2.1. Microgrid Architecture and Control
Microgrids are local energy subsystems that can operate either grid-connected or in islanded mode to ensure continuity of supply—especially for critical loads—during upstream disturbances. A typical microgrid couples Distributed Energy Resources (DER), BESS, and controllable loads over low- or medium-voltage networks [32,33].
Control is commonly organized hierarchically in three layers as shown in Figure 1. Primary control acts locally (converter level) with fast dynamics to stabilize voltage and frequency and to share power—most often via droop characteristics. Secondary control coordinates multiple units (usually through communications) to restore nominal setpoints and correct power-sharing errors introduced by primary droop. Tertiary control optimizes power exchange between the microgrid and the main grid, considering technical and economic objectives. This layered structure enables stable, flexible operation and facilitates the integration of intermittent renewables [32,34]. Figure 1 shows a PV inverter and a BESS inverter feeding a controllable load and interfacing at the Point of Common Coupling (PCC) with the main grid, while hierarchical primary–secondary–tertiary control layers supervise via dashed communication/control links and solid lines indicate physical power flow.
Recent studies highlight the benefits of adaptive droop—e.g., compensating impedance-induced sharing errors, mitigating circulating currents, and balancing battery state-of-charge—thereby improving voltage/frequency regulation and resource utilization [35,36]. To enhance scalability and resilience, distributed/multi-agent secondary control architectures have been proposed, enabling peer-to-peer coordination, plug-and-play capability, and reduced dependence on centralized controllers [37,38,39]. However, greater reliance on communications introduces cyber-physical risks: link failures, latency or jitter, and time-synchronization errors can degrade control performance or be exploited by adversaries. Therefore, robust cybersecurity, QoS-aware networking, and secure time synchronization must be integrated into the microgrid control design [40,41,42,43,44].
2.2. Resilience Indicators and Metrics in Distribution Systems
In distribution networks, resilience denotes the ability to absorb shocks, adapt, and restore acceptable service within a reasonable time. Unlike reliability—which focuses on the likelihood of fault-free operation—resilience explicitly captures post-event recovery and the dynamics of performance degradation and restoration. Reviews of power-system resilience emphasize this distinction and the need for metrics that cover both the event and recovery phases [24,45,46].
Resilience metrics are commonly grouped into three categories:
- (i)
- Static indicators.
These quantify the immediate technical impact of a disturbance. Two widely used examples are the VDI, which aggregates per-bus voltage deviations from 1 p.u., and ENS, which measures unserved energy during fault handling and restoration [47,48].
- (ii)
- Temporal indicators.
These capture the duration and pace of recovery, such as recovery time to restore nominal operating points and the restoration slope (rate of performance improvement). Temporal metrics are typically derived from resilience performance curves (e.g., triangle/trapezoid representations) that describe degradation and recapture over time [49,50].
- (iii)
- Composite (synthetic) indicators.
These integrate performance over time—for example, the area-based resilience index using the ratio between the integral of an ideal (target) performance trajectory and the actual trajectory during and after the event, or equivalently the “lost performance area.” Such indices capture both severity and recovery quality in a single value [27,49].
Recent work increasingly couples these electrical metrics with cyber–physical factors, integrating communication-network status and control-layer behavior (e.g., delays, data loss, or compromises) into resilience assessment for microgrids and distribution systems. This reflects the practical observation that communication degradations can materially affect restoration dynamics and service continuity [50,51,52].
Despite progress, many studies still emphasize static or snapshot measures (e.g., voltage profiles, ENS minimization) and under-represent dynamic inverter–grid interactions and control-layer effects in the composite indices—highlighting a continuing gap that motivates integrated, time-resolved, cyber-physical resilience metrics [53].
2.3. Cyber Threats in Microgrids and DER Systems
With increasing digitalization, microgrid control loops depend on communication networks and Supervisory Control and Data Acquisition/Energy Management Systems (SCADA/EMS) layers, which broadens the attack surface and exposes DER-rich systems to cyber–physical risks [40,54,55].
The most frequently reported threat classes include:
Denial-of-Service (DoS)—flooding or delaying packets that disrupt coordination and degrade synchronization among units and controllers. DoS has been documented as a practical vector against restoration processes and as a driver of instability when delays/jitter accumulate [40,42].
False Data Injection (FDI)—spoofed measurements or commands that mislead estimators and controllers, inducing incorrect setpoints, power-sharing errors, and voltage violations [56,57,58].
FDI attacks tamper with measurement or command data so that estimators/controllers infer an incorrect system state without triggering basic bad-data detection. In the standard linear model z=Hx+e, an attacker crafts a vector a=Hc to produce z′=z+a, shifting the estimated state to x′=x+c while preserving residual tests. In microgrids, FDI can bias micro–Energy Management System/ Distribution Management System (μEMS/DMS) decisions (e.g., dispatch, voltage/reactive control), mis-share power among inverters, or drift BESS state-of-charge—producing voltage violations and unnecessary islanding.
Loss of synchronization—stemming from impaired or compromised time-sync channels (e.g., Global Positioning System time and Precision Time Protocol, IEEE 1588 - GPS/PTP) or excessive communication latency, which undermines converter phase locking and coherent control actions [59].
Replay and Man-in-the-Middle (MITM) attacks on IEC 61850 fast messaging for protection and control (Generic Object-Oriented Substation Event/Sampled Values/ Manufacturing Message Specification - GOOSE/SV/MMS): adversaries capture and resend (or alter) protection/automation frames to trip breakers, change statuses, or issue stale commands, undermining coordination and protection selectivity [60,61,62]. GOOSE is a peer-to-peer, Layer-2 multicast, hard real-time for protection/control protocol and the base GOOSE/SV lack of encryption. MMS (IEC 61850-8-1) is a client–server protocol over TCP/IP for configuration and metering, of non-time-critical data.
Tabel 1 shows the roles and characteristics of GOOSE, SV, and MMS in IEC 61850-based microgrids, and provides an engineering checklist for a robust process bus.

Table 1.
GOOSE vs SV vs MMS (IEC 61850).
| Attribute | GOOSE (IEC 61850-8-1) | SV (9-2 / 61869-9) | MMS (IEC 61850-8-1) |
| Purpose | Time-critical events (trip, interlock, block, status). | High-rate digitized CT/VT measurements over process bus. | Client-server supervision, configuration, non-time-critical data. |
| Transport | Layer-2 multicast (publisher/subscriber), event-driven with re-transmit. | Layer-2 multicast; periodic streaming (e.g., 80 s/c @50 Hz ≈ 4 kS/s). | TCP/IP (ISO over TCP); request/response sessions. |
| Latency target/ determinism | ≤3 ms end-to-end on engineered LAN for protection use-cases. | Sub-millisecond budget with deterministic delivery and tight jitter. | Seconds to hundreds of ms acceptable; not for sub-ms protection. |
| Payload | Status/commands from protection and bay IEDs (datasets). | Instantaneous i(t), v(t) from Merging Units; time-aligned via PTP/GPS. | Measurements, logs, settings, file transfer; operator/HMI access. |
| Timing model | Event-driven; sequence numbers and retransmission for reliability. | Strictly periodic; consumers compute phasors, power, protection. | Polled or report-controlled; non-deterministic relative to GOOSE/SV. |
| Typical use | Transfer-trip, load shedding, fast interlocking, islanding commands. | Differential/line protection, wide-band control, Power-Quality Analytics PQA. | SCADA/EMS/DMS integration; engineering and commissioning. |
| Profiles / references | IEC 61850-8-1 (GOOSE); IEC 62351-6 (security); IEC 61850-90-5 (R-GOOSE). | IEC 61850-9-2 / IEC 61869-9 (SV); IEC 61850-9-3 & IEEE C37.238 (PTP). | IEC 61850-8-1 (MMS mapping); IEC 62351 (TLS, RBAC). |
Load-Altering Attacks (LAA) - coordinated manipulation of many controllable loads (or prosumer devices) to force frequency excursions or stress voltage regulation; effective even when generation is uncompromised [63,64].
In case of LAA, instead of faking data, the attacker changes real demand by coordinating many controllable loads (or prosumer devices/EV chargers) to inject a fast net power step ΔPLAA(t)
in steady state (with Dtot the aggregate droop/damping), while the transient Rate of Change of Frequency (RoCoF) depends on synthetic/virtual inertia and primary response. Well-timed LAAs can saturate BESS or trip protection even when measurements are honest.
In Table 2 there is a comparison of FDI and LAA in microgrids and DER systems.
While LAA exploits physical demand, FDI exploits data integrity. Both can cause significant voltage/frequency excursions under hierarchical control. Resilience-oriented countermeasures combine secure/low-latency communications (IEC 62351), robust/dynamic state estimation with physics-based checks, rate-limited and cryptographically authenticated setpoints/DR signals, anomaly detection on load ensembles, and fallback local control modes.
Setpoint/command tampering (actuator attacks) - compromised higher-level controllers or gateways push malicious power/voltage/frequency setpoints to inverters, upsetting primary/secondary control and power sharing [52,65].
Malware, ransomware, and supply-chain/firmware attacks on smart inverters and gateways - exploitation of weak update mechanisms, unsigned firmware, or third-party components enables remote hijacking, data theft, or extortion; secure boot and signed updates are emphasized as countermeasures [66,67,68,69].
Global Navigation Satellite System (GNSS)/ PMU time attacks beyond generic “loss of sync” - targeted GNSS jamming/spoofing and broader Time Synchronization Attacks (TSA) corrupt timestamps (e.g., PMU/PLL alignment), leading to erroneous phase angles and mis-coordination across agents [69,70,71,72].
Coordinated cyber-physical attacks (CCPA): multi-stage campaigns combining cyber manipulation with physical contingencies to maximize disruption and hinder restoration, increasingly discussed in integrated-energy contexts [22].
Empirical and simulation studies show that these attacks can produce significant voltage and frequency deviations even under hierarchical control, by distorting feedback signals, desynchronizing grid-following converters, or starving secondary controllers of timely data [62,64,65,66].
Accordingly, resilience-oriented control is required: secure, low-latency communications; controller designs that tolerate delay and data loss; and fallback/local modes to sustain stability under partial or compromised connectivity [54,55,66,67,68,69].
These attack vectors are shown—experimentally and via co-simulation—to cause significant voltage/frequency deviations, mis-trips, and unstable power-sharing even under hierarchical control, by distorting measurements/commands, desynchronizing grid-following converters, or starving secondary controllers of timely data [60,71]. Accordingly, resilience-oriented control should combine secure, low-latency communications, delay/loss-tolerant control, signed firmware and secure boot, anomaly/trust-based detection for replay/FDI/LAA, and fallback local modes to sustain stability under partial or compromised connectivity [40,52,65,66,67,68,69].
2.4. Standard Test Models (IEEE Test Feeders) as Reproducible Benchmarks
To validate control algorithms and assess resilience, the research community widely adopts IEEE test feeders, which provide a common baseline for comparison and reproducibility.
The most frequently used feeders are:
IEEE 13-bus feeder — an unbalanced three-phase model suited to studies of protection coordination, power quality, and unbalanced load effects.
IEEE 33-bus feeder — a medium-voltage radial network commonly used for optimization studies, PV/BESS integration, and loss evaluation.
IEEE 69-bus feeder — a larger radial system employed to test scalability and the behavior of algorithms on extensive distribution networks.
Among these, the IEEE 33-bus feeder offers a practical balance between complexity and clarity. It is usually implemented in MATLAB/Simulink, OpenDSS, and DIgSILENT. In this work, placing a PV unit at bus 6 and a BESS at bus 18 becomes a realistic scenario for evaluating microgrid behavior under disturbances, enabling consistent comparison of stability and resilience metrics across operating conditions.
3. Materials and Methods
3.1. Test System: IEEE 33-Bus
To analyze the resilience and stability of the proposed microgrid, we adopt the standard IEEE 33-bus distribution feeder, widely used in the literature for medium-voltage studies and for testing control and network reconfiguration algorithms. The microgrid retains the feeder’s radial topology at a nominal voltage of 12.66 kV, comprising 33 buses and 32 interconnecting lines. Bus 1 serves as the PCC, tied to the upstream grid through a distribution transformer.
To enable operation in both grid-connected and islanded modes, the base model is extended with two DERs:
- a PV inverter at bus 6 with nominal apparent SPV power SPV;
- a BESS with a bidirectional inverter at bus 18 with nominal apparent power SBESS
- These resources play complementary roles:
- the PV unit supplies active power from solar generation, reducing dependence on the upstream source;
- the BESS provides power balancing and voltage/frequency support during islanded operation, acting in grid-forming mode when the microgrid separates from the main grid.
Loads are modeled as constant-PQ, with active and reactive powers taken from the IEEE benchmark dataset. For several representative buses (e.g.7,14,25,30), hourly demand profiles for a typical summer day (0–24 h) are assigned to capture time-varying behavior and to co-vary with renewable production.
To evaluate resilience to loss of the main supply, an automatic islanding scheme is implemented. Upon detecting disconnection of line 1–2 or the supply transformer, the breaker at bus 1 opens and the BESS immediately assumes the primary voltage source role. A microgrid EMS coordinates the transition between operating modes and regulates active/reactive power flows according to the battery SoC and solar irradiance. This setup provides a reproducible baseline for assessing both steady-state quality and post-disturbance recovery.
Figure 2 consists of a single-line diagram of IEEE 33-bus microgrid with PV connected to bus 6 and BESS connected to bus 18.
The technical parameters of the lines, transformer and connected equipment were taken from the IEEE standard dataset, with additions related to DER systems. The relevant data is summarized in the Table 3, which forms the basis for power flow calculations and simulation scenarios. Table 3 summarizes the baseline IEEE 33-bus microgrid: the feeder operates at 12.66 kV and includes 33 buses linked by 32 lines in a radial arrangement. The aggregated demand is Ptot+jQtot=3.715+j2, 300 MVA (i.e., ∣S∣≈4.37 MVA, pf ≈ 0.85 lagging), representative of a typical distribution network. Distributed resources comprise a PV plant at bus 6 with inverter apparent-power rating SPV=0.9 MVA (up to 1.0 MWp DC, implying modest DC/AC oversizing) and a BESS at bus 18 rated SBESS=0.8 MVA with 1.6 MWh energy capacity operated between 20–90% SoC. The source transformer (ST=5,0 MVA) is located at bus 1, serving as the main substation and PCC to the upstream grid.
3.2. PV and BESS Models
To analyze the microgrid’s dynamic behavior and assess its energy resilience, we implement detailed models for the PV source and the BESS. Both are interfaced to the medium-voltage (12.66 kV) bus through controlled, bidirectional three-phase power converters that enable two-way power flow among the grid, the PV source, and the BESS. The interfaces are smart-grid compatible and can operate either in grid-following or grid-forming mode, depending on system conditions.
3.2.1. PV System Model
The PV system located at Bus 6 is modeled with a grid-following inverter whose primary function is to inject active power into the grid as a function of solar irradiance and cell temperature. Active-power control is achieved via a Maximum Power Point Tracking (MPPT) loop, which continuously adjusts the operating point to maximize conversion efficiency.
The active power generated by the PV array is computed using a standard irradiance–temperature scaling of the standard test conditions:
where is the inverter efficiency, is the plane-of-array instant solar irradiance instantanee (W/m²), is the total surface of the pannels, and is the fill factor.
Reactive-power control of the PV inverter is handled by a Volt/VAR (droop) law that keeps the local voltage within acceptable limits by modulating the reactive power flow:
Where V is the measured bus voltage (p.u.), V0 is the voltage set-point (p.u.), Q is the inverter reactive power (Mvar or p.u.), Q0 is the neutral operating point (often 0), nQ is the reactive droop gain (p.u. voltage per p.u. reactive power), tuned to the loading conditions.
- , –nominal values for frequency and power,
- , – droop slopes for active and reactive power, respectively (units e.g., Hz/MW and p.u./MVAr or p.u./p.u.
with imposed limits:
where is the charging/discharging efficiency (for the BESS model) and is the nominal energy capacity of the battery.
3.2.2. The EMS
The microgrid control architecture is hierarchical, comprising three levels:
1. Primary control – implemented locally in the PV and BESS inverters, based on droop laws for voltage and frequency regulation (P–f and Q–V droop);
2. Secondary control – removes steady-state deviations and rebalances energy among sources/loads (e.g., PI restoration of f and V, slow SoC biasing for BESS);
3. Tertiary control / EMS – optimizes power dispatch over a prediction horizon to minimize a total operating cost under network and device constraints:
where is the voltage deviation index, is the unpowered energy, is the operational cost, and are weighting coefficients.
The proposed hierarchical control architecture is illustrated in Figure 3, highlighting the interaction between the EMS, the communication layer, the local controllers of the PV inverters and BESS, as well as the security and resilience logic implemented through heartbeats, timeouts and fallback mechanisms.
This structure allows maintaining the stability of the microgrid even under conditions of cyber disruption or temporary loss of connection to the main grid.
3.3. Disturbance Scenarios
To evaluate the dynamic behavior and resilience of the proposed IEEE 33-bus microgrid, two representative disturbance scenarios were defined, covering both physical phenomena (power losses) and cyber threats (communication failures).
These scenarios allow the analysis of the microgrid’s ability to maintain its stability and continuity of power supply under critical conditions, by activating local control mechanisms and fallback/resynchronization logic.
3.3.1. Scenario D1 – Loss of Main Supply at Bus 2
In this scenario, a sudden interruption of the main grid supply is considered, by opening line 1–2 at time t=tf.
The event simulates a physical failure (e.g., a fault on the medium voltage line) that causes the microgrid to be separated from the central system.
After disconnection from the grid, the PCC circuit breaker opens automatically, triggering the controlled islanding sequence.
In this regime, the storage system (BESS) switches from grid-following to grid-forming mode, becoming the main voltage and frequency source for the microgrid. At the same time, the PV inverter continues to operate, adapting its operating point according to the solar irradiance and the frequency signal imposed by the BESS.
The transient behavior of the microgrid during event D1 is presented in Figure 4, which illustrates the evolution of nodal voltages, system frequency, as well as the variations in active powers provided by BESS and PV.
The analysis of these graphs highlights the ability of BESS to instantly compensate for the loss of the main source, maintaining the voltage within ±5% and stabilizing the frequency at nominal values in less than 0.5 s.
3.3.2. Scenario D2 – Cyber-Induced Communication Failure
This scenario examines the microgrid’s behavior when a communication failure occurs in the EMS control layer. We assume a cyber disturbance that injects excessive latency, jitter, and packet loss beyond admissible thresholds. These anomalies desynchronize messages between the EMS and local controllers and trigger a fallback mechanism.
The local reaction logic is defined as follows:
- if the communication latency exceeds the maximum allowed value ,
- or the packet loss exceeds the threshold within a time interval Tobs,
then the local controller switches autonomously to droop control, operating independently of the EMS.
After reestablishing the stable connection for a duration Tresync, the system automatically switches back to synchronized control mode, through a gradual voltage and frequency resynchronization process.
The evolution of the control states during the fault and the return to normal mode are illustrated in Figure 4, which presents the time diagram of the communication loss and the control mode transitions (EMS → local droop → resynchronized).
This illustrates the dynamic behavior of the microgrid control system during a simulated communication failure between the EMS level and the local controllers of the PV and BESS inverters. In the first phase, the system operates in normal mode, with setpoints periodically transmitted by the EMS and complete data synchronization. At the moment of the cyber disturbance (t = tfault), communication packets start to be lost and latencies exceed the critical threshold. In response, the controllers automatically switch to fallback mode, activating local droop control to maintain voltage and frequency within acceptable limits. This strategy allows temporary autonomous operation of the microgrid, avoiding instability and loss of synchronism between distributed sources. After communication is reestablished and channel stability is confirmed for a period of time (Tresync), the system gradually returns to centralized EMS control. The results demonstrate that the implemented switching and resynchronization logic gives the microgrid a high cyber resilience capacity, limiting voltage deviations and reducing the operational impact of communication failures. Figure 5 is showing the timeline of communication loss and transition between control modes in scenario D2 (cyber-induced communication failure). The sequence of phases is highlighted: normal operation with EMS active, loss of communication, activation of local droop control (fallback), and subsequent resynchronization with EMS.
The two scenarios analyzed demonstrate that the proposed microgrid can maintain voltage and frequency stability in the face of physical and cyber disturbances.
The hybrid control strategy (EMS + local droop) allows autonomous operation in isolated mode and controlled recovery after restoring normal conditions, confirming the role of the PV–BESS architecture in increasing the operational resilience of modern electrical systems.
3.4. Performance Indicators
The evaluation of the dynamic behavior of the microgrid in the face of disturbances is based on a set of quantifiable performance indicators, which allow the comparative analysis of the simulated scenarios. In this work, three fundamental metrics are used: VDI, ENS and GRI. These parameters are calculated in the evaluation window [t0,t0+Teval], corresponding to the duration of the event and the recovery period.
3.4.1. Voltage Deviation Index (VDI)
The VDI quantifies the stability of the network in terms of maintaining the nodal voltages around the nominal value. It is defined according to the relationship:
where:
- – total number of buses in the system;
- – instantaneous voltage at the bus ;
- – nominal reference voltage (1 p.u.);
- – the duration of the analysis window.
Low VDI values (< 0.05 p.u.) indicate stable behavior and efficient voltage control during disturbances, while high values signal significant deviations and potential risk of unbalance.
3.4.2. The Energy Not Supplied (ENS)
The ENS indicator measures the amount of energy that could not be supplied to consumers during the period affected by the event. It is a key metric for assessing the continuity of power service and the ability of the microgrid to prevent major interruptions (blackouts).
where:
- – the power required by the load;
- – the actual power delivered by the microgrid to the busbar .
The value ENS=0 indicates full power supply without energy loss, while higher values reflect the severity level of the event and the time required to restore power.
3.4.3. Global Resilience Index (GRI)
To summarize the overall performance of the system, the resilience index R is defined, which reflects the system’s ability to absorb a disturbance and return to its normal state. This index is calculated based on the normalized performance ψ(t), which represents the time evolution of the system’s functional state (e.g. 1 − VDI(t) scaled between 0 and 1):
To summarize overall system performance, we define a resilience index GRI that captures the system’s ability to absorb a disturbance and return to nominal operation. The index is derived from the normalized performance ψ(t), which traces the system’s functional state over time (e.g., ψ(t)=1−VDI(t), scaled to [0,1]):
where:
- describes the instantaneous degree of system performance;
- corresponds to ideal operation, without losses or deviations;
- indicates performance degradation during the event.
Thus, GRI represents an integrated measure of stability and continuity, simultaneously including voltage deviations and energy losses.
Table 4.
Defining indicators and calculation windows.
| Indicator | Symbol | Evaluation interval | Unit | Interpretation |
| Voltage Deviation Index | VDI | p.u. | Nodal voltage stability | |
| Energy Not Supplied | ENS | MWh | Continuity of supply | |
| Global Resilience Index | GRI | – | Overall recovery capacity |
These indicators will be used in Chapter 4 – Results and Validation, to compare the system performance in the two disturbance scenarios (D1 and D2), highlighting the role of EMS control and fallback logic in increasing the resilience of the microgrid.
By defining and using the VDI, ENS and GRI indicators, a quantitative and rigorous approach to the analysis of the microgrid resilience is ensured. These parameters allow the simultaneous assessment of voltage stability, supply continuity and overall recovery capacity after a disturbance.
In the study, VDI highlights the system response in terms of voltage deviations, ENS quantifies the energy lost during the event, and GRI integrates these effects into a single normalized performance metric.
Thus, the analysis based on these indicators provides a complete perspective on the dynamic behavior of the microgrid, facilitating the identification of vulnerable points and control improvement strategies. In the next chapter, the values obtained for the two scenarios (D1 – loss of main power supply, D2 – loss of communication) will allow for a direct comparison of the level of resilience and stability of the proposed system.
3.5. Simulation Setup
The modeling and simulation of the proposed microgrid were performed using the MATLAB/Simulink platform, with the dedicated Simscape Electrical package, which allows for a precise physical description of the electrotechnical components and control strategies. The simulation architecture was designed to faithfully reproduce the behavior of the IEEE 33-bus system equipped with distributed sources (PV at bus 6 and BESS at bus 18), under the action of the D1 and D2 disturbance scenarios.
3.5.1. Simulation Environment
The simulations were run in a discretized environment with a 100 µs time step to capture fast electromagnetic phenomena associated with inverters and load switching. The raw outputs were then aggregated to a 10 ms resolution, appropriate for power-system dynamics (frequency, voltage, and power flows).
For daily performance assessment, we used 1-minute irradiance and load profiles for a representative summer day, implemented as normalized inputs scaled to the sources’ nominal ratings. Figure 6 shows the evolution of these profiles—the solar irradiance, the microgrid’s aggregate load, and the battery SoC—for the reference day. Figure 6 shows the resilts of the daily profiles of solar irradiance, total load and SoC of the BESS system on a typical summer day.
These profiles define the microgrid’s baseline operating regime and serve as the basis for evaluating system behavior under disturbance scenarios D1 and D2. As illustrated in Figure 6, irradiance peaks around 12:00–13:00, the total load exhibits a bimodal pattern (morning and evening peaks), and the SoC during peak solar production and discharges overnight to cover residual demand.
3.5.2. Main Technical Parameters
The microgrid model used in the simulation is based on the IEEE 33-bus distribution feeder standard, a reference configuration for studying the stability and resilience of distribution networks.
The network consists of 33 buses and 32 interconnection lines, arranged in a radial topology, characteristic of real medium voltage distribution systems (12.66 kV).
The main power source is represented by an interface transformer with a nominal power of 5 MVA, which connects the microgrid to the main transmission system through bus 1 (PCC). This serves as a reference point for voltage and frequency synchronization in normal operation.
Within this network, two DERs with complementary roles have been integrated, designed to increase the stability and autonomy of the microgrid:
- The PV source is connected to bus 6 and has a nominal power of 0.9 MVA (equivalent to approximately 1.0 MWp DC). It is equipped with a grid-following inverter, which follows the voltage and frequency of the main system, adjusting the active power injection according to irradiance and temperature, and compensating the reactive power through a Volt/Var droop law.
- The BESS is located at bus 18, with a capacity of 1.6 MWh and a nominal power of 0.8 MVA. The associated inverter operates predominantly in grid-forming mode, generating its own voltage and frequency reference when the microgrid is islanded. In normal mode (connected to the main system), it operates in grid-following mode, maintaining the balance of active and reactive power according to EMS commands.
Both converters are three-phase bidirectional, allowing both the delivery and absorption of electrical energy, depending on the state of the grid and the operating conditions. They can operate in synchronized (interconnected) or isolated (islanded) mode, depending on the events detected at the PCC and the state of the communication channel.
The coordination between the photovoltaic inverter and the BESS system is ensured by an EMS, which transmits reference commands (setpoints) for active and reactive power, based on data collected from the grid. In the event of a communication failure, both converters automatically switch to fallback mode, activating local droop control, to maintain voltage and frequency stability in autonomous mode.
By configuring these components, the proposed model faithfully reproduces the behavior of a modern distribution microgrid, capable of coping with power losses, load fluctuations and cyber incidents, thus demonstrating the practical relevance of the simulated architecture.
3.5.3. Local Control and EMS Settings
To manage power flows and maintain stability under variable operating conditions, the proposed model implements a hierarchical control architecture consisting of two levels:
(1) Local control of the inverters (primary and secondary levels), and
(2) EMS responsible for the global coordination of resources.
Local Control – Primary Level
Both static converters (PV and BESS) are equipped with local droop controllers, which define the relationship between frequency/voltage variations and active/reactive power injections.
These control laws mimic the inertial behavior of synchronous machines, allowing automatic power distribution between sources without constant communication between them.
- PV inverter, that operates in grid-following mode, uses droop slopes of 5% for frequency (P–f) and 3% for voltage (Q–V). These values were chosen so that the inverter can contribute to reactive regulation according to load variations, while limiting power circulations between nearby nodes. In addition, the inverter has an output LC filter sized to ensure a Total Harmonic Distortion (THD) below 3%.
- BESS operates in grid-forming mode, generating the voltage and frequency references for the entire microgrid in islanded mode. For it, droop slopes of 4% for frequency and 2% for voltage were adopted, values that ensure stable dynamics and a balanced load sharing between BESS and PV. The battery is protected by a peak current limiting control and a second-order filter to smooth out rapid load variations.
For both converters, the response time of the internal loops (current and voltage) was configured below 5 ms, allowing a fast reaction to disturbances without significant voltage or current overshoots.
EMS Control – Secondary Level
The top level of the hierarchy is represented by the EMS, which continuously monitors the state of the microgrid and transmits active and reactive power setpoints to the inverters at an interval of 200 ms.
These commands are calculated based on the local energy balance, the available power from renewable sources and the BESS system SoC.
EMS manages the following main functions:
- Energy balancing between generation, storage and consumption;
- Maintaining the reference voltage and frequency within normalized limits (±1% and ±0.1 Hz);
- Optimal allocation of reactive power to reduce grid losses;
- Managing transitions between interconnected and islanded regimes;
- Detection of loss of communication and activation of local autonomous control (fallback).
- Fallback and synchronization logic.
In case of loss of the communication channel between EMS and inverters (scenario D2), the system automatically switches to fallback mode, in which each converter maintains its current settings and activates local droop-based control.
This strategy ensures the continuity of supply and the stability of the microgrid even in the absence of central coordination. After the communication is restored, EMS checks the stability for a resynchronization period Tresync and gradually restores centralized control.
BESS System Parameters
The battery storage system is configured with an operational SoC range between 20% and 90%, and the overall charge–discharge efficiency is considered to be 96%. The control includes automatic protections for over discharge, overcharge, and high cell temperatures, all managed by algorithms integrated into the EMS.
By combining these control levels, the microgrid achieves a balance between stability, flexibility, and operational resilience, being able to react autonomously to electrical or cyber disturbances, without losing synchronism or compromising power quality.
3.5.4. Input Data and Files
All network parameters and component characteristics were automatically imported from CSV files T1a–T1d, which contain:
- Distribution line lengths and impedances;
- Interface transformer parameters;
- PV source characteristics (I–V curve, inverter efficiency, power factor);
- Storage system parameters (capacity, power, efficiency, SoC limits).
For a coherent management of simulation data, all values associated with the system components were stored in *.CSV files, corresponding to the structure described in Table 3.
These files are automatically imported into the MATLAB/Simulink environment by means of a dedicated script, which ensures the consistency and reproducibility of the results. The aggregated nominal values for the main network elements are presented in Table 5.
3.5.5. Initial Conditions and Simulated Scenarios
The simulations were initialized in a steady state, corresponding to the normal operation of the IEEE 33-bus microgrid, connected to the main power system through bus 1 (PCC). All initial voltages and currents were calculated through a balanced three-phase power flow solution, ensuring the nominal conditions of 12.66 kV and frequency of 50 Hz.
The battery SoC was initially set to 70%, a value that allows both absorption and delivery of active energy depending on the system requirements. At the same time, the PV generator was configured to operate in grid-following mode, delivering active power proportional to the instantaneous solar irradiance and regulating the reactive component through a Volt/Var droop law. The BESS, configured in grid-forming mode, ensured local frequency and voltage regulation in the event of islanding.
To evaluate the performance of the proposed control strategy and the EMS–BESS–PV architecture, two distinct disturbance scenarios were defined, relevant to the operational behavior of a real microgrid:
- Scenario D1 – Main power loss
At time t=tf, the interface line between bus 1 and bus 2 is interrupted, simulating a sudden disconnection from the main system (external grid fault). The microgrid automatically switches to islanding mode, and the BESS inverter switches to grid-forming mode, taking over the frequency and voltage reference for the rest of the system. The evolution of voltage, active/reactive power and frequency stability is monitored during the transition.
- 2.
- Scenario D2 – Cyber-induced communication failure
At a predetermined time, the communication channel between the EMS and the inverter controllers is affected by introducing a degradation pattern: packet loss (packet loss 25%) and increased latency (over 300 ms). After exceeding the defined thresholds, the local controllers automatically switch to fallback mode, activating autonomous droop control. After a period of time Tresync, the system returns to the centralized regime, and synchronization is restored without significant phase imbalances.
For each scenario, the simulations were run three times independently, with minor variations in the load and irradiance profile (±5%), to assess the robustness of the solution and the statistical stability of the indicators. The results were statistically aggregated, and Table 6 in the following chapter presents the mean values and standard deviations of the VDI, ENS and GRI indicators for both analyzed cases.
This final simulation stage provides the basis for comparison between the normal, disrupted and restored scenarios, demonstrating the ability of the proposed system to maintain stability and continuity of supply even under conditions of loss of main supply or cyber-attacks.
For greater clarity on the dynamics of the simulated events, Figure 7 presents the chronology of scenarios D1 and D2, along with the main transition moments. It is observed that, in the case of D1, the disconnection from the main grid (tf) determines the rapid switching of the microgrid to island mode, coordinated by the BESS inverter in grid-forming mode. In contrast, scenario D2 focuses on the loss of communication between the EMS and the local controllers, at which point the droop control-based fallback logic is activated, ensuring that stability is maintained until the communication channel is re-established and resynchronization (Tresync) is achieved.
Timeline of simulation scenarios D1 (main power loss) and D2 (communication failure), illustrating key moments: t₀ – normal mode, tf – occurrence of disturbance, tisland -transition to island mode (BESS grid-forming), tfallback – activation of local control, and Tresync -resynchronization with EMS are presented in Figure 7.
3.6. Qualitative Assessment of Energy Resilience – “Resilience Matrix” Method
In addition to the quantitative assessment through VDI, ENS and R, we propose a qualitative-structured assessment of the microgrid based on the Resilience Matrix.
This method provides a holistic view of the system’s capacity to plan, absorb, recover and adapt to disturbances, on four levels of the system: physical/technological, informational, cognitive/decisional and social/organizational.
Figure 8 presents the general model of the matrix (4×4) and the 5-level rating scale (1 – very poor … 5 – excellent).
Table 6 summarizes the scores obtained for the analyzed microgrid domains (PV+BESS Generation, Distribution, Control/SCADA, Communications, Demand Response/DR) and the Global Resilience Index (GRI).
3.6.1. Matrix Structure and Evaluation Scale
- Horizontal axis – Resilience stages: Planning/Prevention (Plan), Absorption (Absorb), Recovery (Recover), Adaptation (Adapt).
- Vertical axis – System levels: Physical/Technological, Informational, Cognitive/Decisional, Social/Organizational.
Each cell level ,, stage ) receives an ordinal score based on a common rubric:
- 1–2: low capacity, no redundancy / high times / critical dependency;
- 3: moderate capacity, partial functionality under stress;
- 4–5: robust, high redundancy and adaptability, short times, validated procedures.
The complete Resilience Matrix model is illustrated in Figure 8., where the critical function domains, resilience stages, evaluation scale, and hypothetical scores used in the calculation of the global IGR index are represented.
3.6.2. Link to Quantitative Indicators (Metric → Score Mapping)
The scores in the matrix are informed by the quantitative results obtained in scenarios D1 (power loss) and D2 (communication loss). We use a two-step mapping:
(i) Metric normalization (performance 0–1):
where:
Thresholds are set from literature/standard (IEEE 1547) or from our baselines.
(ii) Conversion performance → ordinal score (5 equal bands):
Recommended mappings on key cells:
- Physical–Absorption ← VDI in the transient range (amplitude and duration);
- Physical–Recovery ← ENS and time to return to tolerances (V/f);
- Informational–Absorption/Recovery ← packet loss/delay, fallback/resync;
- Cognitive/Adaptation ← improvement Between rounds (lessons learned, droop/EMS retuning);
- Social/Planning ← procedures/DR, exercises, operating manuals, staff training.
After populating the cells, for each domain j (e.g.: Generation, Distribution, Control/SCADA, Communications, DR) the resilience score is calculated as the average of the four stages:
3.6.3. Aggregation by Domains and the Global IGR Index (with Weights)
The global index is obtained as the (possibly weighted) average of the scores by domains:
If no explicit priority is justified, equal weights wj=1, are used.
Methodological note: The scores in Figure 8 were established by expert judgment based on the results of D1/D2 (VDI, ENS, R), IEEE 33-bus data and operating practices (SCADA/OT). In case of divergence between evaluators, the arithmetic mean was used and the uncertainty is reported as ±0.5 levels on a scale of 1–5.
3.6.4. Results for the IEEE 33-bus Microgrid (hypothetical Scores)
Based on the conceptual model presented in Figure 8, hypothetical scores were assigned for the five main domains of the microgrid: generation (PV + BESS), distribution, control/SCADA, communications and demand response.
The values in Figure 8 reflect the average level of planning, absorption, recovery and adaptation capacity, according to the scale of 1–5 defined previously.
The GRI was determined by the arithmetic mean of the scores by domain, according to the relationship:
where Ri represents the resilience score for domain i, and n is the total number of domains analyzed.
The result obtained, GRI = 2.90, indicates a moderate level of resilience, corresponding to a microgrid capable of maintaining essential operation in island mode and resynchronizing without significant losses.
Table 6 shows the hypothetical resilience scores for the main domains of the IEEE 33-bus microgrid and calculation of the GRI.
GRI calculation (unweighted):
The detailed analysis of these results and the interpretation of the determinants for the level of resilience obtained are presented in the following subsection.
3.6.5. Interpretation of the Results Regarding the Resilience of the IEEE 33-Bus Microgrid
The results summarized in Table 6. indicate a GRI = 2.90, which corresponds to a moderate resilience on the evaluation scale (2.5–3.5). This level suggests that the analyzed microgrid is able to maintain its essential functions under stress conditions, but presents significant vulnerabilities in the absorption and recovery stages after major disruptive events.
Analyzing the individual resilience domains, the main strengths and weaknesses can be identified:
Generation (solar + batteries)
The score of 3.25 indicates a relatively robust generation system, with good planning and adaptation capacity.
The presence of a storage system (BESS) contributes to the absorption of power variations and the continuity of supply in island mode. However, the recovery component (score 2) highlights a dependence on battery recharge times and local energy management.
Recommendation: implementing predictive energy management strategies and expanding storage capacity would increase the overall score above 3.5.
Distribution (local network)
With a score of 2.50, the distribution domain presents limited resilience, specific to infrastructures with a radial topology (such as the IEEE 33-bus network).
Low levels of absorption and recovery (score 2) indicate vulnerability to line faults and local voltage losses.
Recommendation: integrating automatic reconfiguration schemes (auto-reclosers, sectionalizers) and distributed monitoring sensors for rapid incident detection could increase distribution resilience to above 3.0.
Control / SCADA
The score of 2.25 is the lowest of the areas assessed and highlights the dependence on centralized control infrastructure. The lack of redundancy and failover mechanisms reduces the system’s ability to absorb operational shocks.
Recommendation: The introduction of distributed control units (edge controllers) and logical segmentation of the SCADA network can reduce the Mean Time to Recovery (MTTR) and improve information resilience.
Communications
The communications domain has a score of 2.75, reflecting moderate but stable performance.
The adaptability and recovery capacity (3) suggests the existence of a functional communication infrastructure, but limited by the low redundancy and latencies of conventional networks.
Recommendation: Adopting a multipath model (fiber + radio + cellular), with AES encryption and real-time latency monitoring, would increase the absorption and adaptation capacity to over 3.5.
Demand Response (DR)
The highest score (3.75) confirms the critical role of consumer flexibility in stabilizing the microgrid.
DR programs ensure a dynamic balance between demand and supply, reducing stress on the generation and distribution infrastructure.
Expanding DR participation through targeted economic incentives (e.g., tiered rebates, time-of-use bonuses, pay-for-performance) and integrating AI to predict consumer behavior (for smarter enrollment, dispatch, and personalization) would increase load flexibility, improve peak shaving and ramping control, and reduce outage risk. Implemented at scale, it can lift this domain’s resilience to an excellent level (≥ 4.5). Overall, the analyzed microgrid presents a balanced resilience profile, with good planning (average score 3.2) and satisfactory adaptation capacity (3.2), but low absorption (2.6) and recovery (2.4) performances.
These results indicate a functional infrastructure, but with potential for improvement through digitalization, automation and redundancy.
On a scale of 1–5, the IGR value = 2.90 confirms the moderate level of resilience of the microgrid, consistent with the quantitative results obtained in the dynamic scenarios:
In scenario D1, the reduction of the VDI indices (~27%) and ENS (~12%) compared to the base case validates the lower scores in the Physical–Absorption and Physical–Recovery domains (level 2–3).
In scenario D2, maintaining the V/f deviations within narrow limits and increasing the R index by ~0.07 justify the better performances on the Informational/Cognitive–Adaptation dimension (level 3–4).
Lower scores in the Control/SCADA and Communications domains confirm the dependence on EMS and the need to introduce additional redundancies, including through OT segregation, multipath channels and periodically tested failover mechanisms.
This correlation between quantitative indicators and matrix scores demonstrates the methodological coherence of the assessment and validates the applicability of the “Resilience Matrix” method in the analysis of distributed energy systems.
The moderate level of the GRI = 2.90) reflects a maturing system, capable of ensuring continuity of supply in an islanded manner and partially responding to disruptive events.
By implementing the identified technical recommendations (automation, SCADA redundancy, storage expansion and communications digitalization), the microgrid can achieve a “good” level of resilience (GRI ≈ 3.5–3.8), approaching the performance of fully integrated smart grids.
3.6.6. Sensitivity and Uncertainty Analysis
To validate the robustness of the assessment, a sensitivity analysis was performed on the scores in the matrix.
Two scenarios were considered:
- Differential weighting – the critical areas Control/SCADA and Communications were multiplied by factors wSCADA= wcomms =1.5, reflecting their importance in maintaining operational stability.
- Score variation ±1 level for cells with high uncertainty (incomplete data or expert estimates).
The results show that:
- the variation of the weights modifies the GRI by ± 0.10 – 0.15, without changing the overall classification (“moderate resilience”);
- the variation of the scores by ±1 level on the uncertain cells determines a maximum change of ±0.15 in the overall value of the index.
We thus confirmed the stability of the method and the consistency of the conclusions obtained in Section 3.6.5.
Increasing the BESS storage capacity or optimizing the droop parameters (see Sec. 4.4) determines an estimated improvement of the RGeneration score and the GRI by ≈0.1–0.2, which would raise the system to the “good resilience” threshold.
3.6.7. Specific Recommendations
Based on the results summarized in Table 6. and the resilience scores (R), the following priority improvement measures can be formulated:
- Control/SCADA (R = 2.25): introducing redundancy at the PLC/RTU level, segmenting the Operational Technology (OT) network, periodic failover exercises and automating restoration procedures;
- Distribution (GRI = 2.50): implementing automatic reconfiguration schemes (reclosers, sectionalizers), critical parts stocks and SLA (Service Level Agreement) contracts with local intervention teams;
- Communications (GRI = 2.75): ensuring multipath redundancy (fiber, radio, cellular), data encryption and anomaly monitoring, with dynamic thresholds for fallback/resync;
- Generation (GRI = 3.25): increasing BESS capacity, simulating virtual inertia and defining EMS policies for selective load-shedding;
- DR (GRI = 3.75): expanding active consumer participation programs, quarterly testing scenarios and integrating DR mechanisms into black-start and islanding procedures.
The methodology developed in this paper proposes a unified framework for analyzing the resilience of distributed microgrids, by combining quantitative indicators (VDI, ENS, GRI) with qualitative assessment based on the Resilience Matrix. This approach allows for multidimensional characterization of the system, covering the physical, informational, cognitive and organizational levels, and captures the interaction between control, communications and renewable sources under operational stress conditions.
The sensitivity analysis confirmed the robustness of the proposed method, with the variation of the GRI remaining below ±0.15 for the uncertainty intervals considered. The results obtained highlight the importance of redundancy of control and communication infrastructures, optimization of regulation parameters (droop control) and increasing BESS to improve the overall performance of the microgrid.
The proposed methodological framework is scalable and reproducible, providing a solid basis for assessing the operational resilience of smart microgrids in the face of communication losses, control degradation and variability of renewable sources.
The values presented in section 3.6 are hypothetical, being used exclusively to illustrate the proposed method and the way to interpret resilience indicators.
The practical application of the methodology, based on simulated data for the IEEE 33-bus microgrid, is presented in Section 4 - Results and Validation, where scenarios D1 and D2 are analyzed and the impact of photovoltaic penetration, BESS and regulation parameters (droop control) on the resilience performance of the system is evaluated.
4. Results and Validation
In this section, the methodology described in Chapter 3 is applied to analyze the dynamic behavior of the IEEE 33-bus microgrid. The goal is to evaluate the system performance under disturbance conditions, by comparing two distinct scenarios:
- D1: loss of main supply and transition to islanding;
- D2: loss of communication between EMS and local inverters, followed by activation of autonomous control mode (fallback).
The results are organized progressively — from the analysis of the steady state and power flows, to the transient behavior, frequency stability and sensitivity to control parameters and penetration of distributed sources.
4.1. Steady State (Grid-Connected)
In normal operation, the microgrid is synchronized with the main distribution system through bus 1 (PCC). In this state, the grid-following control of the PV inverter and the grid-support control of the BESS system allow a balanced supply of all loads, maintaining the voltages within nominal limits.
Voltage distribution
The nodal voltages in the steady state range between 0.964 p.u. and 1.000 p.u., which complies with the limits recommended by IEEE Std. 1547 for microgrids connected to the main system (±5% of the nominal value).
The lowest voltage value is recorded at bus 33, located at the radial end, where the voltage drop is determined by the cumulative impedance of the feeder.
The inclusion of the PV source at bus 6 contributes to reducing voltage losses on the upper segments, due to the injection of local active power.
Power flows
The total power supplied by the main transformer is approximately 3.715 MW + j2.300 Mvar, covering the consumption of the 33 buses.
The PV inverter injects an average active power of 0.85 MW at a unity power factor, while the BESS system operates in standby mode, maintaining an SoC ≈ 70%, ready for dynamic adjustments in case of disturbance.
Reactive power flows are stabilized by the Volt/Var law implemented in the PV inverter, which supplies positive reactive power (inductive) in undervoltage areas and absorbs reactive power in overvoltage, keeping the voltage almost constant around 1 p.u.
Feeder losses
Total active power losses in the lines, calculated according to the expression:
are approximately 0.135 MW, representing 3.6% of the total transmitted power, a value considered acceptable for medium voltage distribution networks.
Due to the integration of the PV source, losses are reduced by about 18% compared to the case of the network without local generation, confirming the technological benefit of decentralized distribution.
The summary of the main parameters obtained in stationary mode is presented in Table 7, which summarizes the average values of voltages, power losses and load level of the BESS system.
These results confirm that the microgrid maintains a state of energy balance and a uniform distribution of voltages, without exceeding the limits imposed by IEEE standards. The values obtained will serve as a comparative reference for the analysis of the system behavior in the D1 and D2 disturbance scenarios presented in the following sections.
Table 7 consists of main parameters of the steady state (IEEE 33-bus microgrid with PV connected to bus 6 and BESS connected to bus 18.)
Figure 9 shows the nodal voltage profile for the steady state, taking 1.0 p.u. at bus 1 as a reference. A gradual decrease in voltage towards the radial end is observed, with the minimum at bus 33 (~0.964 p.u.). The integration of the PV source at bus 6 contributes to the voltage support on the upstream segments, reducing the slope of the drop in the first half of the feeder. This behavior confirms the beneficial effect of local generation on the voltage profile and constitutes the reference basis for the dynamic scenarios analyzed later (D1 and D2).
The values in Table 7 were obtained by solving the load flow for the IEEE 33-bus model implemented in MATLAB/Simulink (Simscape Electrical).
The nodal voltages Vmax and Vmin result from the stationary solution of the network at the nominal voltage of 12.66 kV, according to the IEEE standard dataset.
The active power injected by the PV source PPV was calculated for an irradiance of 950 W/m², corresponding to an operating level of 95% of the nominal power.
The active losses (Ploss) were determined based on the relationship ,, resulting in a value of approximately 3.6% of the total load.
The average battery SoC (SoCavg) was set to 70%, a value that allows the balance between the possibility of discharging and recharging in subsequent dynamic scenarios.
All these values are consistent with the results published in the IEEE 33-bus benchmarks [70,73,74]. The steady-state results confirm the good configuration of the model and the correct calibration of the components. The system respects the voltage limits, presents moderate losses and has a stable energy balance between generation, storage and consumption. This regime will be used as a reference base (baseline) for comparing the performances in the disturbance scenarios D1 and D2.
The steady-state regime highlights the equilibrium of the system and the validity of the adopted configuration for the subsequent dynamic scenarios. This operating point is used as the initial state (t₀) in all the transient simulations in chapter 4.
4.2. Scenario D1 – Loss of Main Power Supply and Transition to Islanding
To assess the resilience of the microgrid under severe disturbance conditions, scenario D1 was simulated, which represents a sudden loss of main power supply by opening line 1–2 at time .
The event triggers the automatic separation from the medium voltage grid and the transition of the microgrid to islanding mode, under the leadership of the BESS inverter in grid-forming mode. At this stage, the PV inverter switches to grid-following mode, synchronizing with the reference frequency and voltage set locally by the BESS.
4.2.1. Transient Evolutions of Voltage, Frequency and Active Powers
Figure 10 presents the time variations of the nodal average voltages , frequency (f(t)), active powers injected by the photovoltaic source and the storage system Immediately after the loss of connection to the main system, the voltage and frequency register a rapid decrease of about 3.8% and 0.4 Hz, respectively, determined by the temporary imbalance between load and generation. Subsequently, the droop control of the BESS inverter restores the frequency to 49.9 Hz in about 0.3 s, and the PV source contributes to the voltage regulation, limiting the deviations below ±2.5%.
The BESS inverter reacts in the range of 150–200 ms, providing an increase in active power of +0.35 MW, which quickly stabilizes the frequency at 49.9 Hz.
The photovoltaic source contributes through Volt/Var regulation to the restoration of the voltage profile in the area of bars 6–10, reducing the maximum deviations below ±2.5% after the first 3 seconds of islanding.
The SoC variation curve indicates a moderate decrease of approx. 2.3% during the isolated regime, corresponding to a balancing energy discharge.
4.2.2. Performance Indicator Analysis
Table 8 presents the mean values and standard deviations for the performance indicators evaluated in the D1 regime compared to the baseline steady-state regime.
A reduction of VDI of approximately 27% was found, reflecting the efficiency of the coordinated reactive control between PV and BESS.
Also, the ENS decreased by 12% due to the short reaction time of the storage system and the priority management of critical loads.
The GRI, calculated based on the normalized time-integrated performance, increased from 0.82 (baseline) to 0.91, which confirms the increase in dynamic stability in islanding regime.
4.2.3. Interpretation and Discussion
The results highlight the critical role of the BESS system in maintaining microgrid stability under mains failure conditions.
The grid-forming control ensures frequency restoration in less than 0.3 s, while the PV inverter contributes to voltage compensation through local reactive control.
The synergy between these two components, coordinated by the EMS, demonstrates that the proposed architecture can prevent major power losses and synchronism instabilities, characteristic of systems without islanding capability.
Compared to the reference values in the IEEE literature for similar microgrids, the response obtained falls within the recommended performance limits: frequency deviations < 0.5 Hz and voltage < ±5% in 95% of the time.
Scenario D1 demonstrates that the tested microgrid has a high technological resilience to power losses, due to:
- the fast reaction of the BESS through grid-forming control;
- the voltage regulation of the PV inverter;
- the EMS load prioritization mechanism.
These results confirm the efficiency of the hybrid PV–BESS architecture in preventing local blackouts and maintaining energy continuity at the level of critical users.
The results confirm that the proposed architecture allows a safe and fast switching between grid-connected and islanded regimes, with minimal deviations of the power quality parameters.
Next, scenario D2 is analyzed, which evaluates the system behavior under communication failure conditions between the EMS and the inverters.
4.3. Scenario D2: Loss of EMS–Inverter Communication
4.3.1. General Description of the Event
Scenario D2 aims to assess the cyber resilience of the microgrid under conditions of partial interruption of communications between the EMS and the local inverter controllers associated with distributed sources – the PV system and BESS.
The simulation starts from a stable operating regime connected to the grid, in which the EMS periodically transmits active and reactive power setpoints () every 200ms, according to the architecture presented previously (Figure 3). At this stage, the communication is bidirectional and without significant delays, and the data flows ensure optimal coordination between the higher and local control.
At time , a simulated cyber fault is injected into the communication channel, consisting of intermittent packet losses (drop rate ≈ 40%) and increased latency above the critical threshold of 500 ms. Following this event, data flows between the EMS and the inverters are completely interrupted, and the system temporarily loses synchronization between the global command level and the local control of the sources.
In the absence of update signals, each inverter automatically enters a local fallback state, according to the logic implemented in the control firmware:
- The BESS inverter, in grid-forming mode, takes over voltage and frequency control at the PCC, using a droop strategy (P=f,Q=V);
- The PV inverter, configured in grid-following mode, maintains its current active power level and adjusts the reactive power according to local voltage variations;
- The EMS continues to monitor the state of the communication channel and marks the moment of signal loss through a heartbeat timeout.
This transition to autonomous control occurs in less than 0.2 s from the loss of communication, without physically disconnecting the inverters, which allows the microgrid to maintain power supply to local loads under conditions of limited stability.
After the communication channel is re-established and a stable interval of valid transmissions is confirmed (typically ), the EMS initiates the gradual resynchronization procedure, restoring centralized control of the power flows.
4.3.2. Fallback Control Mechanism
After detecting the loss of communication between the EMS and the local controllers, the microgrid control architecture automatically switches to an autonomous operating mode (fallback), which allows maintaining voltage and frequency stability without the intervention of the centralized coordination layer.
The detection of the loss of the communication channel is achieved by monitoring latency indicators and data packet loss. The thresholds established for activating the mechanism are:
Latency > 500 ms or consecutive packet loss > 5
Exceeding these limits causes the expiration of the “heartbeat” signal between the EMS and the controller, which triggers the local control isolation logic.
In fallback mode, the BESS inverter becomes the reference unit of the microgrid, adopting the role of grid-forming source. It generates the local voltage and frequency at the PCC and implements the droop regulation laws:
where:
- and represents the reference (nominal) values;
- and are the droop slopes associated with active and reactive regulation;
- define the equilibrium points before the transition.
Through this mechanism, BESS automatically adjusts voltage and frequency to compensate for load variations, ensuring a proportional self-regulation between the power deviation and the system response.
In parallel, the PV inverter, configured in grid-following mode, maintains its active injection constant according to the value before the moment tfault, adopting a power-hold strategy. The local controller adjusts only the reactive component according to the voltage variations measured at bus 6:
this contributes to stabilizing the voltage profile in the photovoltaic source connection area.
During this autonomous phase, the EMS enters a passive monitoring mode, continuing to send test signals (ping) on the communication channel. After a period of transmission stability — defined by a time interval without packet loss and with latency < 150 ms — the system enters gradual resynchronization mode. In this stage, the setpoints transmitted by the EMS increase progressively (ramp 10%/s) until the centralized control is fully restored, avoiding power jumps and phase oscillations between sources.
This decentralized control mechanism and sequential resynchronization ensure the continuity of the microgrid operation even under conditions of cyber-attacks or communication failures, representing an essential component of the integrated operational resilience of the system.
To illustrate the sequence of control states during communication loss and restoration, Figure 11 shows the logic diagram of the fallback and resynchronization mechanism between the EMS system and the PV/BESS inverters.
The diagrams indicate the sequential transitions between the five main states: Normal Operation, Fault Detected, Local Droop Control (Fallback Mode), Communication Restored, and Gradual Resynchronization.
The transition conditions between states are determined by the latency thresholds (>500 ms), consecutive packet loss (>5), and the stability period of the communication channel ().
Through this mechanism, the microgrid maintains frequency and voltage stability even in the absence of central coordination, and the gradual reentry into normal mode prevents transient oscillations and ensures a safe return to EMS control.
4.3.3. Dynamic Results and Interpretation
Figure 12 illustrates the evolution of the main parameters of the microgrid during scenario D2, including the variations of the nodal average voltage, the frequency deviations, the active powers injected by the PV source and BESS, as well as the control states associated with each inverter.
In normal mode, before the moment , the microgrid operates under the coordinated control of the EMS, with voltage deviations below ±0.5% and frequency stabilized at 50 Hz. The setpoints transmitted at 200 ms intervals ensure that the power flows are maintained in balance: the PV supplies active energy according to the solar profile, and the BESS stabilizes the load through reactive power regulation.
At the moment of communication loss, at , the data packets between the EMS and the inverters are lost consecutively (>5 packets), which automatically triggers the switch to local fallback mode.
- In the first 200 ms after the event, a brief voltage deviation of ±1.2% and a frequency deviation of ±0.15 Hz are observed, determined by the temporary lack of coordination between the distributed sources.
- The BESS inverter, configured in grid-forming mode, assumes the voltage and frequency regulation, stabilizing the system in less than 0.25 s.
- The PV inverter switches to power-hold mode, maintaining the current active power and reacting locally to voltage variations, without inducing additional oscillations.
After a stability period of , the communication channel is reestablished, and the EMS resumes centralized hierarchical control. The reverse transition (fallback → synchronization) is achieved gradually, by progressively adjusting the power references, avoiding flux jumps or phase instabilities.
The comparative analysis of the performance indicators shows that:
- VDI decreases by approximately 18% compared to the case without fallback (reflecting faster voltage stabilization);
- ENS remains practically zero, since no load losses were recorded during the event;
- The GRI increases by 0.07 compared to the baseline scenario, confirming the efficiency of the autonomous control mechanism in maintaining operational performance.
To highlight the transient behavior of the microgrid under scenario D2 conditions,
Figure 12 presents the simultaneous variations of voltage, frequency and active powers provided by the distributed sources. In the interval ,, the moment of communication loss is observed, followed by the activation of the local fallback control and subsequent resynchronization of the system after the restoration of the EMS channel. The graphs demonstrate the ability of the proposed architecture to maintain the stability of essential network parameters, limiting voltage and frequency deviations and avoiding load shedding during the transition.
Figure 13 provides a complementary representation of the system behavior during scenario D2, by displaying the normalized voltage and frequency deviations (ΔV/Vref, Δf) and the states of the EMS, PV and BESS controllers. In the first part, until the moment tfault, the system operates in normal mode, under EMS control. After the loss of communication, the local fallback control is activated, determining a rapid stabilization of the voltage and frequency within ±1.2% and ±0.15 Hz. In the interval tresync – tresync + 5 s, the gradual resynchronization of the communication channel takes place, marking the return of the system to coordinated mode. The graph highlights the correct synchronization of the two inverters and the robustness of the implemented fallback mechanism.
Therefore, the results confirm that the proposed control architecture, based on automatic latency detection and local droop-based switching, ensures the continuity of operation and transient stability of the microgrid even in the presence of communication disturbances.
The dynamic results obtained for scenario D2 confirm the efficiency of the proposed control architecture in maintaining the operational stability of the microgrid under conditions of temporary loss of communication. The activation of the fallback logic based on local droop control allowed limiting the voltage and frequency deviations in very narrow ranges, demonstrating a fast reaction of the BESS inverter (grid-forming) and an adequate coordination with the PV inverter (grid-following). The resynchronization phase with the EMS system proceeded without significant oscillations, confirming the robustness of the switching mechanism and the stability of the control loop. From the perspective of global performance indicators (VDI, ENS, GRI), the microgrid exhibits resilient behavior and a capacity to maintain power continuity even in the presence of medium-level cyber disturbances.
4.4. Sensitivity Analysis
To evaluate the robustness of the proposed solution and the impact of the main parameters on the performance of the microgrid, a multidimensional sensitivity analysis was performed. Four key factors were varied: the degree of photovoltaic penetration, the capacity of BESS, the droop control slopes and the severity of communication packet losses. For each case, the performance indicators VDI, ENS and GRI were recalculated, maintaining the same initial conditions and load profiles.
4.4.1. PV Penetration Rate
The increase in installed PV power from 0.6 MWp to 1.2 MWp led to a reduction in feeder currents and implicitly to a decrease in Joule losses by approximately 11%, but generated a slight increase in the maximum voltage deviation (VDI ↑ by 5%), due to the effect of power flow reversal during solar peak hours. In islanding mode, the PV contribution was limited by the BESS response capacity, which confirms the importance of strict coordination between the two sources.
4.4.2. BESS Storage System Capacity
Analysis showed a direct correlation between the total stored energy (MWh) and the GRI.
A capacity increase from 1.0 MWh to 2.0 MWh resulted in:
- reduction of unsupplied energy (ENS ↓ by 21%);
- increase of the GRI value from 0.91 to 0.96;
- attenuation of post-fault frequency oscillations.
This behavior demonstrates the critical role of BESS in providing virtual inertia support and fast frequency control services in islanding scenarios.
4.4.3. Droop Control Parameters
Droop slopes directly influence the stability and quality of power and voltage regulation.
The tests were performed for values of ±50% compared to the nominal configuration. The results revealed that:
- too steep drops (<2%) lead to oscillations in the active/reactive torque and phase instabilities;
- too smooth droops (>6%) generate a slow response and voltage deviations above 2%.
The optimal compromise identified (frequency droop 4–5%, voltage droop 2–3%) ensures high stability without affecting the dynamic performance.
4.4.4. Communication Packet Losses
To assess the cyber resilience, packet losses between 0% and 30% of the EMS–inverter traffic were modeled. The results show that up to 15% losses, the system maintains its performance almost unchanged due to buffering and local control mechanisms. Between 15–25%, a gradual increase in VDI (up to +0.7%) and a slight decrease in the R index (−0.03) are observed. Exceeding the 25% threshold frequently activates the fallback, and for losses of 30% the system operates over 60% of the time autonomously, still maintaining the voltage and frequency within acceptable limits (<±2%).
The sensitivity analysis confirms that the proposed architecture is robust to moderate variations in operating conditions and communication quality. The combination of local droop control with EMS resynchronization logic gives the microgrid high stability and adaptability to physical and cyber disturbances. In particular, the system performance is strongly influenced by the PV/BESS ratio and the droop slopes, which must be calibrated according to the level of renewable energy penetration and the load conditions of the network.
For a synthetic representation of the system behavior, Figure 14 illustrates the normalized variations of the main performance indicators — VDI, ENS and GRI — depending on the analyzed parameters. It is observed that GRI presents the highest sensitivity to the increase in BESS capacity and to the modification of the droop slope, while moderate packet losses (<20%) have a limited impact on the system performance, due to local control mechanisms and procedures.
The analyses performed demonstrated that the proposed hybrid PV–BESS architecture for the IEEE 33-bus microgrid provides high operational resilience and robust dynamic stability against physical and cyber disturbances.
Simulations performed for scenarios D1 (loss of mains power) and D2 (loss of EMS–inverter communication) confirmed the system’s ability to maintain voltage and frequency within acceptable limits, with maximum deviations below ±2% and restoring balance in less than 0.3 s.
It was observed that the BESS storage system, operating in grid-forming mode, has an essential role in supporting the frequency and regulating the voltage in islanding mode, while the PV source contributes to improving the voltage profile through local reactive control (Volt/Var).
The sensitivity analysis confirmed the robustness of the proposed architecture, highlighting the major influence of the PV/BESS ratio and the droop slope on the overall performance. In contrast, moderate packet losses (< 20%) have a reduced impact due to the local EMS control and resynchronization mechanisms.
The results obtained validate the implemented model and demonstrate the viability of integrating decentralized hybrid control as an effective solution for increasing the resilience of smart microgrids.
The next chapter extends the analysis on the practical and theoretical implications of the obtained results, discussing the relationship between control parameters, system stability and the level of resilience in the context of modern power grids. The identified optimization directions, the limitations of the current study and the potential applications of the proposed architecture in real microgrids, connected to distributed renewable energy systems, will be highlighted.
5. Discussions
The results obtained in the previous chapter confirm the efficiency of the PV–BESS hybrid architecture in maintaining the resilience of the microgrid in the face of disruptive events. This section analyzes in detail the mechanisms that support the performance improvement, the associated operational trade-offs, as well as the possibilities of extending the methodology to other network topologies.
5.1. Resilience Improvement Mechanisms
The BESS inverter operating in grid-forming mode plays a central role in stabilizing the system under conditions of loss of main power or communication. By generating the reference voltage at the PCC and by regulating the frequency according to the P–f droop law, it provides a robust internal reference for all distributed sources.
In parallel, the PV inverter, operating in grid-following mode, reacts quickly to local voltage variations through Volt/Var control, contributing to the damping of disturbances and maintaining the voltage profile.
The automatic fallback mechanism implemented in case of communication loss prevents the application of unstable set-points by the EMS system, allowing each node to operate autonomously until the data channel is reestablished. This decentralized control architecture gives the microgrid the ability to self-stabilize, an essential characteristic of resilient systems.
5.2. Operational Trade-Offs
Although the dynamic performances obtained are remarkable, maintaining resilience involves certain technical costs. The high frequency of charge-discharge cycles of the BESS in transient regime causes accelerated wear of the electrochemical cells, reducing the battery life.
In addition, the fast reactions of the control loops can generate additional conversion losses in the active and reactive compensation stages, especially under conditions of high penetration of photovoltaic sources.
Another trade-off is the need to maintain a minimum free storage capacity (SoC buffer), which limits the energy available for non-critical loads, but ensures the stability of the system in unplanned islanding scenarios.
These trade-offs highlight the need for multi-objective optimization strategies that balance system stability, energy efficiency, and electrochemical equipment durability, while maintaining a rapid response to disturbances.
5.3. Generalization of the Results to Other Grid Structures
The proposed methodology is scalable and reproducible for a wide range of distribution network topologies, provided that the principles of hybrid hierarchical control are maintained. For larger or meshed networks, the droop parameters and BESS capacity must be recalibrated according to the nodal impedances and the penetration of renewable sources.
In these cases, the implementation of the fallback mechanism becomes more complex, requiring the synchronization of multiple grid-forming nodes and the management of phase conflicts between converters. However, the fundamental principles demonstrated -local autonomy, fast stabilization and gradual resynchronization — remain valid for a wide range of applications, including island microgrids, electric vehicle charging stations or autonomous military microgrids.
This generalization emphasizes the relevance of the proposed methodology for future generations of smart microgrids, where resilience becomes a fundamental design requirement, not just an additional feature.
The discussions highlight that the resilience of a microgrid is not an exclusive consequence of equipment oversizing, but the result of a coherent interaction between hierarchical control, communication flexibility and the adaptive capacity of the sources.
In this context, the proposed PV–BESS solution demonstrates the technological potential to ensure the safe and continuous operation of distributed systems, contributing to reducing the risk of blackouts and strengthening the smart energy infrastructure.
The results and interpretations presented in this chapter highlight the coherence between the dynamic behavior of the microgrid and the resilience indicators proposed in the methodological framework. The local control mechanisms, the hybrid PV–BESS integration and the communication structure with automatic fallback have demonstrated the system’s ability to absorb, recover and adapt operation under operational stress conditions.
The following chapter summarizes the main theoretical and experimental conclusions of the study, the relevance of the proposed methodology for assessing the resilience of smart microgrids, as well as future research directions regarding its extension and validation in real distribution networks.
6. Conclusions
The present study proposed and validated a unified methodology for assessing the resilience of smart microgrids, combining quantitative indicators (VDI, ENS, GRI) with qualitative assessment based on the Resilience Matrix. The application of the method on the IEEE 33-bus test system allowed a coherent analysis of the performance of the hybrid PV–BESS architecture under physical and cybernetic conditions of operational stress, confirming the relevance of the proposed integrated approach.
The results demonstrated that the introduction of the BESS system in grid-forming mode reduces the maximum voltage deviations (VDI ↓ by up to 27%) and the unsupplied energy (ENS ↓ by approximately 12%) in the partial communication loss scenario (D1). In the extended scenario (D2), the overall resilience of the microgrid increased significantly (ΔR ≈ +0.07), highlighting the beneficial effect of the decentralized control mechanisms and the fallback algorithm in maintaining frequency stability.
The main contributions of the paper consist in formulating a multidimensional analysis framework, validating it on a realistic IEEE 33-bus model and demonstrating the interdependence between hierarchical control, communications and distributed resources. In particular, the proposed methodology provides a reproducible basis for quantifying operational resilience in hybrid PV–BESS networks, being applicable both for off-line simulations and Hardware-in-the-Loop (HIL) assessments.
The practical implications of the study are reflected in the design of resilient architectures for modern distribution systems, where the integration of renewable sources and storage systems must be accompanied by adaptive controls, communication redundancy and autonomous restoration logics. The proposed approach thus contributes to strengthening energy security and reducing the risk of blackouts, especially in networks with high penetration of distributed sources.
However, the research also presents certain limitations. The simulations considered a single grid-forming node and a fixed radial topology, without including effects of congestion at the communication level or progressive degradation of components. In the future, the extension of the methodology to interconnected multi-microgrid architectures, tested in HIL mode and validated experimentally, will allow a more comprehensive assessment of resilience in real networks.
In conclusion, the results obtained confirm the validity and robustness of the proposed method, demonstrating that an integrated approach, combining renewable sources, smart storage and hierarchical adaptive control, represents a sustainable path for increasing the resilience and reliability of modern energy infrastructure.
This work was carried out within a research effort dedicated to strengthening energy resilience in distributed microgrids, with the conceptual and technical support of the academic community in the field of energy and automation. The authors express their gratitude to the academic staff and research colleagues who contributed to the validation of the models and the refinement of the analysis methodology.
From a scientific point of view, the results obtained represent a contribution to the expansion of the resilience assessment toolkit in PV–BESS hybrid systems and constitute a solid basis for the further development of real-time and HIL simulation tools. These directions will allow the direct correlation of numerical models with experimental data, reducing the uncertainty in the assessment of dynamic performance.
In the future, the research will be oriented towards the design and experimental testing of a coordinated multi-microgrid platform, capable of operating autonomously and cooperatively under physical and cyber stress conditions. Such an approach would significantly contribute to the creation of a next-generation energy infrastructure — sustainable, adaptive and secure — aligned with the strategic objectives of the European energy transition. Furthermore, the future work will extend the proposed resilience framework along four directions: (i) critical-infrastructure risk coupling for PV, human-centric defenses, (iii) AI-enabled threat emulation and (iv) endpoint and malware-resilience testing. To support reproducibility, scenario scripts (loss of supply, comms-loss/fallback, adversarial phishing) and reference datasets, enabling the community to benchmark cyber–physical interventions—from risk governance to operator training—against standardized VDI/ENS targets and blackout-prevention thresholds can be analyzed.
The main results and contributions of the research can be summarized as follows:
1. The proposed methodological framework integrates quantitative indicators (VDI, ENS, GRI) with qualitative assessment through the Resilience Matrix, providing a complete and reproducible approach for analyzing the performance of smart microgrids.
2. Validation on the IEEE 33-bus model confirmed the reduction of voltage deviation by up to 27% and the decrease of ENS by about 12%, demonstrating the ability of the PV-BESS architecture to support stable operation in communication loss and islanding scenarios.
3. The BESS inverter in grid-forming mode proved to be the key element of stability, ensuring local voltage and frequency regulation and allowing controlled autonomous operation (fallback mode) in the absence of EMS connection.
4. Sensitivity analysis showed that the GRI is most influenced by BESS capacity and droop slopes, while moderate packet losses (<20%) have limited effects due to local control and adaptive resynchronization.
5. The proposed methodology is scalable, being able to be applied to multi-microgrid networks, HIL test platforms and industrial applications, including for power stations, isolated bases or critical microgrids.
6. Future research directions aim at developing an experimental platform for real-time validation, optimizing the coordination between grid-forming nodes and extending the performance indicators to include cyber and information security components.
Author: Contributions
Conceptualization, D.P; methodology, S.R.; software and validation, M.I.O; investigation and resources, T.L.; writing—original draft preparation and writing—review and editing, A.M.T; visualization and supervision, N.D.F; All authors have read and agreed to the published version of the manuscript.
Funding
“This research received no external funding”.
Acknowledgments
The authors have reviewed and edited the output and take full responsibility for the content of this publication.
Conflicts of Interest
The authors declare no conflicts of interest.
Abbreviations
The following abbreviations are used in this manuscript:
| AIEKF | Adaptive Iterated Extended Kalman Filter |
| AMI | Advanced Metering Infrastructure |
| BESS | Battery Energy Storage Systems |
| CCPA | Coordinated cyber-physical attacks |
| CT/VT | Voltage/ Potential Transformer |
| DER | Distributed Energy Resources |
| DMS | Distribution Management System |
| DoS | Denial-of-Service |
| DR | Demand-Response |
| EMS | Energy Management Systems |
| ENS | Energy Not Supplied |
| EV | Electrical Vehicles |
| EVSE | Electric Vehicle Supply Equipment |
| FDI | False Data Injection |
| GNSS | Global Navigation Satellite System |
| GOOSE | Generic Object-Oriented Substation Event |
| GPS | Global Positioning System |
| GRI | Global Resilience Index |
| HEMS | Home Energy Management System |
| HIL | Hardware-in-the-Loop |
| HMI | Human–Machine Interface |
| IEC | International Electrotechnical Commission (IEC) |
| IED | Intelligent Electronic Device |
| IoT | Internet of Things |
| ISO | International Organization for Standardization |
| KCL | Kirchhoff’s Current Law |
| KVL | Kirchhoff’s Voltage Law |
| LAA | Load-Altering Attacks |
| LAN | Local Area Network |
| MITM | Man-in-the-Middle |
| MMS | Manufacturing Message Specification |
| MPPT | Maximum Power Point Tracking |
| OpenDSS | Open Distribution System Simulator |
| OT | Operational Technology |
| PCC | Point of Common Coupling |
| PLC | Power Line Communication |
| PMU | Phasor Measurement Units |
| PQA | Power-Quality Analytics |
| PTP | Precision Time Protocol |
| PV | Photovoltaic |
| QoS | Quality of Service |
| RoCoF | Rate of Change of Frequency |
| RTU | Remote Terminal Uni |
| SCADA | Supervisory Control and Data Acquisition |
| SE | State Estimation |
| SLA | Service Level Agreement |
| SoC | State of Charge |
| SV | Sampled Values |
| TCP/IP | Transport Control Protocol/Internet Protocol |
| TAD | Total Harmonic Distortion |
| TSA | Time Synchronization Attacks |
| UFLS | Under-Frequency Load Shedding |
| UKF | Unscented Kalman Filter |
| VDI | Voltage Deviation Index |
References
- Cavus, M. Advancing Power Systems with Renewable Energy and Intelligent Technologies: A Comprehensive Review on Grid Transformation and Integration. Electronics 2025, 14, 1159. [Google Scholar] [CrossRef]
- Dora, B.K.; Bhat, S.; Mitra, A.; Ernst, D.; Halinka, A.; Zychma, D.; Sowa, P. The Global Electricity Grid: A Comprehensive Review. Energies 2025, 18, 1152. [Google Scholar] [CrossRef]
- Kiasari, M.; Ghaffari, M.; Aly, H.H. A Comprehensive Review of the Current Status of Smart Grid Technologies for Renewable Energies Integration and Future Trends: The Role of Machine Learning and Energy Storage Systems. Energies 2024, 17, 4128. [Google Scholar] [CrossRef]
- Cadini, F.; Lomazzi, L.; Zio, E. Vulnerability Analysis of Power Transmission Grids Subject to Cascading Failures. Electronics 2024, 13, 943. [Google Scholar] [CrossRef]
- Xie, B.; Tian, X.; Kong, L.; Chen, W. The Vulnerability of the Power Grid Structure: A System Analysis Based on Complex Network Theory. Sensors 2021, 21, 7097. [Google Scholar] [CrossRef]
- Ejuh Che, E.; Roland Abeng, K.; Iweh, C.D.; Tsekouras, G.J.; Fopah-Lele, A. The Impact of Integrating Variable Renewable Energy Sources into Grid-Connected Power Systems: Challenges, Mitigation Strategies, and Prospects. Energies 2025, 18, 689. [Google Scholar] [CrossRef]
- Conde, H.J.C.; Demition, C.M.; Honra, J. Storage Is the New Black: A Review of Energy Storage System Applications to Resolve Intermittency in Renewable Energy Systems. Energies 2025, 18, 354. [Google Scholar] [CrossRef]
- Hong, J.; Ishchenko, D.; Kondabathini, A. Implementation of Resilient Self-Healing Microgrids with IEC 61850-Based Communications. Energies 2021, 14, 547. [Google Scholar] [CrossRef]
- Billanes, J.D.; Jørgensen, B.N.; Ma, Z. A Framework for Resilient Community Microgrids: Review of Operational Strategies and Performance Metrics. Energies 2025, 18, 405. [Google Scholar] [CrossRef]
- Alomari, M.A.; Al-Haiqi, A.; Alani, M.M. Security of Smart Grid: Cybersecurity Issues, Potential Threats, and Countermeasures. Energies 2025, 18, 141. [Google Scholar] [CrossRef]
- Abraham, D.; D’Souza, A.; Kappiarukudil, K.; Rai, S. Cyber-Attacks on Energy Infrastructure—A Literature Review. Appl. Sci. 2025, 15, 9233. [Google Scholar] [CrossRef]
- Riurean, S.; Fîță, N.-D.; Păsculescu, D.; Slușariuc, R. Securing Photovoltaic Systems as Critical Infrastructure: A Multi-Layered Assessment of Risk, Safety, and Cybersecurity. Sustainability 2025, 17, 4397. [Google Scholar] [CrossRef]
- Kotenko, I.; Saenko, I.; Lauta, O.; Kribel, A. A Proactive Protection of Smart Power Grids against Cyberattacks on Service Data Transfer Protocols by Computational Intelligence Methods. Sensors 2022, 22, 7506. [Google Scholar] [CrossRef] [PubMed]
- Salman, H.M.; et al. Review on Causes of Power Outages and Their Occurrence. Sustainability 2023, 15, 15001. [Google Scholar] [CrossRef]
- Daeli, A.; Wang, Y.; Zhang, J. Power Grid Infrastructural Resilience against Extreme Events: A Review. Energies 2022, 16, 64. [Google Scholar] [CrossRef]
- Castro Hernandez, C.D.; et al. Extreme Climate Events and Energy Market Vulnerability. Appl. Sci. 2025, 15, 6210. [Google Scholar] [CrossRef]
- Ejuh Che, E.; Roland Abeng, K.; Iweh, C.D.; Tsekouras, G.J.; Fopah-Lele, A. The Impact of Integrating Variable Renewable Energy Sources into Grid-Connected Power Systems: Challenges, Mitigation Strategies, and Prospects. Energies 2025, 18, 689. [Google Scholar] [CrossRef]
- Saribulut, L.; Ok, G.; Ameen, A. A Case Study on National Electricity Blackout of Turkey. Energies 2023, 16, 4419. [Google Scholar] [CrossRef]
- Kim, D.; Kim, J.-C.; Su, Q.; Joo, S.-K. Electricity Blackout and Its Ripple Effects: Examining Liquidity and Information Asymmetry in U.S. Financial Markets. Energies 2023, 16, 4939. [Google Scholar] [CrossRef]
- Sarker, P.; Lohar, B.; Walker, S.; Patch, S.; Wade, J.T. Recovery Resiliency Characteristics of Interdependent Critical Infrastructures in Disaster-Prone Areas. Infrastructures 2024, 9, 208. [Google Scholar] [CrossRef]
- Yasir, N.; Huang, Y.; Wu, D. Influence Graph-Based Method for Sustainable Energy Systems. Sustainability 2025, 17, 5666. [Google Scholar] [CrossRef]
- Zang, T.; Tong, X.; Li, C.; Gong, Y.; Su, R.; Zhou, B. Research and Prospect of Defense for Integrated Energy Cyber–Physical Systems Against Deliberate Attacks. Energies 2025, 18, 1479. [Google Scholar] [CrossRef]
- Szczepaniuk, E.K.; Szczepaniuk, H. Cybersecurity of Smart Grids: Requirements, Threats, and Countermeasures. Energies 2025, 18, 5017. [Google Scholar] [CrossRef]
- Lin, J.-H.; et al. Review of Power System Resilience: Concept, Assessment, and Future Directions. Applied Sciences 2024, 14, 1428. [Google Scholar] [CrossRef]
- Sapkota, A.; Karki, R. Resilience Investment Against Extreme Weather Events Considering Critical Load Points in an Active Microgrid. Appl. Sci. 2025, 15, 6973. [Google Scholar] [CrossRef]
- Aslam, M.U.; Miah, M.S.; Amin, B.M.R.; Shah, R.; Amjady, N. Application of Energy Storage Systems to Enhance Power System Resilience: A Critical Review. Energies 2025, 18, 3883. [Google Scholar] [CrossRef]
- Raoufi, H.; Vahidinasab, V.; Mehran, K. Power Systems Resilience Metrics: A Comprehensive Review of Challenges and Outlook. Sustainability 2020, 12, 9698. [Google Scholar] [CrossRef]
- Murshed, M.; Chamana, M.; Schmitt, K.E.K.; Pol, S.; Adeyanju, O.; Bayne, S. Sizing PV and BESS for Grid-Connected Microgrid Resilience: A Data-Driven Hybrid Optimization Approach. Energies 2023, 16, 7300. [Google Scholar] [CrossRef]
- Cao, H.; Ma, L.; Liu, G.; Liu, Z.; Dong, H. Two-Stage Energy Storage Allocation Considering Voltage Management and Loss Reduction Requirements in Unbalanced Distribution Networks. Energies 2024, 17, 6325. [Google Scholar] [CrossRef]
- Afzali, P.; Hosseini, S.A.; Peyghami, S. A Comprehensive Review on Uncertainty and Risk Modeling Techniques and Their Applications in Power Systems. Appl. Sci. 2024, 14, 12042. [Google Scholar] [CrossRef]
- Li, S.; Oshnoei, A.; Blaabjerg, F.; Anvari-Moghaddam, A. Hierarchical Control for Microgrids: A Survey on Classical and Machine Learning-Based Methods. Sustainability 2023, 15, 8952. [Google Scholar] [CrossRef]
- Shan, Y.; Ma, L.; Yu, X. Hierarchical Control and Economic Optimization of Microgrids Considering the Randomness of Power Generation and Load Demand. Energies 2023, 16, 5503. [Google Scholar] [CrossRef]
- Mussetta, M.; Le, X.C.; Trinh, T.H.; Doan, A.T.; Duong, M.Q.; Tanasiev, G.N. An Overview of the Multilevel Control Scheme Utilized by Microgrids. Energies 2024, 17, 3947. [Google Scholar] [CrossRef]
- Staņa, Ģ.; Kroičs, K. Adaptive Droop Control for Power Distribution of Hybrid Energy Storage Systems in PV-Fed DC Microgrids. Energies 2025, 18, 5137. [Google Scholar] [CrossRef]
- Xu, Z.; Chen, F.; Chen, K.; Lu, Q. Research on Adaptive Droop Control Strategy for a Solar-Storage DC Microgrid. Energies 2024, 17, 1454. [Google Scholar] [CrossRef]
- Nguyen, T.-L.; Guillo-Sansano, E.; Syed, M.H.; Nguyen, V.-H.; Blair, S.M.; Reguera, L.; Tran, Q.-T.; Caire, R.; Burt, G.M.; Gavriluta, C.; et al. Multi-Agent System with Plug and Play Feature for Distributed Secondary Control in Microgrid—Controller and Power Hardware-in-the-Loop Implementation. Energies 2018, 11, 3253. [Google Scholar] [CrossRef]
- Altin, N.; Eyimaya, S.E.; Nasiri, A. Multi-Agent-Based Controller for Microgrids: An Overview and Case Study. Energies 2023, 16, 2445. [Google Scholar] [CrossRef]
- Rodriguez-Martinez, O.F.; Andrade, F.; Vega-Penagos, C.A.; Luna, A.C. A Review of Distributed Secondary Control Architectures in Islanded-Inverter-Based Microgrids. Energies 2023, 16, 878. [Google Scholar] [CrossRef]
- Canaan, B.; Colicchio, B.; Ould Abdeslam, D. Microgrid Cyber-Security: Review and Challenges toward Resilience. Appl. Sci. 2020, 10, 5649. [Google Scholar] [CrossRef]
- Alomari, M.A.; Al-Andoli, M.N.; Ghaleb, M.; Thabit, R.; Alkawsi, G.; Alsayaydeh, J.A.J.; Gaid, A.S.A. Security of Smart Grid: Cybersecurity Issues, Potential Cyberattacks, Major Incidents, and Future Directions. Energies 2025, 18, 141. [Google Scholar] [CrossRef]
- Muyizere, D.; Letting, L.K.; Munyazikwiye, B.B. Effects of Communication Signal Delay on the Power Grid: A Review. Electronics 2022, 11, 874. [Google Scholar] [CrossRef]
- Ali, W.; et al. Hierarchical Control of Microgrid Using IoT and Machine Learning Based Islanding Detection, in IEEE Access, 2021, vol. 9, pp. 103019-10 2021, 2021. [Google Scholar] [CrossRef]
- Dai, X. et al. Distributed Cooperative Control for DC Microgrids with Communication Time Delays Using Networked Predictive PI Scheme, 2022 IEEE 1st Industrial Electronics Society Annual On-Line Conference (ONCON), Kharagpur, India, 2022, pp. 1-6. [CrossRef]
- Raoufi, H.; Vahidinasab, V.; Mehran, K. Power Systems Resilience Metrics: A Comprehensive Review of Challenges and Outlook. Sustainability 2020, 12, 9698. [Google Scholar] [CrossRef]
- Soualah, H.; Jodin, G.; Le Goff Latimier, R.; Ben Ahmed, H. Energy Not Exchanged: A Metric to Quantify Energy Resilience in Smart Grids. Sustainability 2023, 15, 2596. [Google Scholar] [CrossRef]
- Valuva, C.; Chinnamuthu, S.; Khurshaid, T.; Kim, K.-C. A Comprehensive Review on the Modelling and Significance of Stability Indices in Power System Instability Problems. Energies 2023, 16, 6718. [Google Scholar] [CrossRef]
- Luo, F.; Ge, N.; Xu, J. Power Supply Reliability Analysis of Distribution Systems Considering Data Transmission Quality of Distribution Automation Terminals. Energies 2023, 16, 7826. [Google Scholar] [CrossRef]
- Lu, J.; Guo, J.; Jian, Z.; Yang, Y.; Tang, W. Resilience Assessment and Its Enhancement in Tackling Adverse Impact of Ice Disasters for Power Transmission Systems. Energies 2018, 11, 2272. [Google Scholar] [CrossRef]
- Chivunga, J.N.; Lin, Z.; Blanchard, R. Power Systems’ Resilience: A Comprehensive Literature Review. Energies 2023, 16, 7256. [Google Scholar] [CrossRef]
- Abdelrahman, M.S.; Kharchouf, I.; Hussein, H.M.; Esoofally, M.; Mohammed, O.A. Enhancing Cyber-Physical Resiliency of Microgrid Control under Denial-of-Service Attack with Digital Twins. Energies 2024, 17, 3927. [Google Scholar] [CrossRef]
- Ali, O.; Mohammed, O.A. A Review of Multi-Microgrids Operation and Control from a Cyber-Physical Systems Perspective. Computers 2025, 14, 409. [Google Scholar] [CrossRef]
- Vega Penagos, C.A.; Diaz, J.L.; Rodriguez-Martinez, O.F.; Andrade, F.; Luna, A.C. Metrics and Strategies Used in Power Grid Resilience. Energies 2024, 17, 168. [Google Scholar] [CrossRef]
- Jamil, N.; Qassim, Q.S.; Bohani, F.A.; Mansor, M.; Ramachandaramurthy, V.K. Cybersecurity of Microgrid: State-of-the-Art Review and Possible Directions of Future Research. Appl. Sci. 2021, 11, 9812. [Google Scholar] [CrossRef]
- Ayele, E.D.; Gonzalez, J.F.; Teeuw, W.B. Enhancing Cybersecurity in Distributed Microgrids: A Review of Communication Protocols and Standards. Sensors 2024, 24, 854. [Google Scholar] [CrossRef]
- Dasgupta, R.; Sakzad, A.; Rudolph, C. Cyber Attacks in Transactive Energy Market-Based Microgrid Systems. Energies 2021, 14, 1137. [Google Scholar] [CrossRef]
- Zhang, G.; Gao, W.; Li, Y.; Guo, X.; Hu, P.; Zhu, J. Detection of False Data Injection Attacks in a Smart Grid Based on WLS and an Adaptive Interpolation Extended Kalman Filter. Energies 2023, 16, 7203. [Google Scholar] [CrossRef]
- Naderi, E.; Asrari, A. Mitigating Voltage Violations in Smart City Microgrids Under Coordinated False Data Injection Cyberattacks: Simulation and Experimental Insights. Smart Cities 2025, 8, 20. [Google Scholar] [CrossRef]
- Liu, Y.; Sun, B.; Wu, Y.; Zhang, Y.; Yang, J.; Wang, W.; Thotakura, N.L.; Liu, Q.; Liu, Y. Time Synchronization Techniques in the Modern Smart Grid: A Comprehensive Survey. Energies 2025, 18, 1163. [Google Scholar] [CrossRef]
- Reda, H.T.; Ray, B.; Peidaee, P.; Anwar, A.; Mahmood, A.; Kalam, A.; Islam, N. Vulnerability and Impact Analysis of the IEC 61850 GOOSE Protocol in the Smart Grid. Sensors 2021, 21, 1554. [Google Scholar] [CrossRef]
- El Hariri, M.; Youssef, T.A.; Mohammed, O.A. On the Implementation of the IEC 61850 Standard: Will Different Manufacturer Devices Behave Similarly under Identical Conditions? Electronics 2016, 5, 85. [Google Scholar] [CrossRef]
- Nhung-Nguyen, H.; Girdhar, M.; Kim, Y.-H.; Hong, J. Machine-Learning-Based Anomaly Detection for GOOSE in Digital Substations. Energies 2024, 17, 3745. [Google Scholar] [CrossRef]
- Youssef, E.-N.S.; Labeau, F.; Kassouf, M. Detection of Load-Altering Cyberattacks Targeting Peak Shaving Using Residential Electric Water Heaters. Energies 2022, 15, 7807. [Google Scholar] [CrossRef]
- Yu, Y.; Dizha, M.; Zhang, Z. Mitigating Dynamic Load-Altering Attacks on Grid Frequency with the Proportional–Integral Control Strategy. Electronics 2025, 14, 4203. [Google Scholar] [CrossRef]
- Vijayasekharan Chandramathi, J.S.; G. Nair, M.; Bel, C.A. Cyber-Resilient Controllers for Smart Distribution Grid Control Layers. Energies 2025, 18, 3916. [CrossRef]
- Vodapally, S.N.; Ali, M.H. Overview of Intelligent Inverters and Associated Cybersecurity Issues for a Grid-Connected Solar Photovoltaic System. Energies 2023, 16, 5904. [Google Scholar] [CrossRef]
- Awad, H.; Bayoumi, E.H.E. Next-Generation Smart Inverters: Bridging AI, Cybersecurity, and Policy Gaps for Sustainable Energy Transition. Technologies 2025, 13, 136. [Google Scholar] [CrossRef]
- Riggs, H.; Tufail, S.; Parvez, I.; Tariq, M.; Khan, M.A.; Amir, A.; Vuda, K.V.; Sarwat, A.I. Impact, Vulnerabilities, and Mitigation Strategies for Cyber-Secure Critical Infrastructure. Sensors 2023, 23, 4060. [Google Scholar] [CrossRef] [PubMed]
- Liu, Y.; Sun, B.; Wu, Y.; Zhang, Y.; Yang, J.; Wang, W.; Thotakura, N.L.; Liu, Q.; Liu, Y. Time Synchronization Techniques in the Modern Smart Grid: A Comprehensive Survey. Energies 2025, 18, 1163. [Google Scholar] [CrossRef]
- Hua, F.; Gao, W.; Li, Y.; Hu, P.; Qiao, L. Joint Detection and State Estimate with GSAs in PMU-Based Smart Grids. Energies 2023, 16, 5731. [Google Scholar] [CrossRef]
- Ou, K.; Liu, Y.; Duan, Z.; Wang, M.; Li, C.; Luo, Z. Time Synchronization Attack Protection Scheme Based on Three-Step Iterative Filter. Electronics 2025, 14, 218. [Google Scholar] [CrossRef]
- Baran, M.; WuF.F. Network Reconfiguration in Distribution Systems for Loss Reduction and Load Balancing, IEEE Trans. Power Deliv, 1989, 4, 2.
- Civanlar, S.; Grainger, J.J. Yin, H. Lee, S.S.H. Distribution feeder reconfiguration for loss reduction. IEEE Trans. Power Deliv. 1988, 3, 1217–1223. [Google Scholar] [CrossRef]
- Pana, L. , Grabara, J., Pasculescu, D., Pasculescu, V. M., Moraru, R. I., Optimal quality management algorithm for assessing the usage capacity level of mining transformers. Polish Journal of Management Studies, 2018, 18, 233–244. [Google Scholar] [CrossRef]
- Petrilean, D.C., Fîță N.D., Vasilescu, G.D., Ilieva-Obretenova, M., Tataru, D., Cruceru, E.A., Mateiu C.I., Nicola, A., Darabont, D.C., Cazac, A.M., Bejinariu, C., Sustainability Management Through the Assessment of Instability and Insecurity Risk Scenarios in Romania’s Energy Critical Infrastructures, SUSTAINABILITY, Volume17/Issue7, Article Number 2932, Published MAR 26, 2025, eISSN 2071-1050, DOI 10.3390/su17072932, WOS:001465626500001.
Figure 1.
Hierarchical microgrid control.
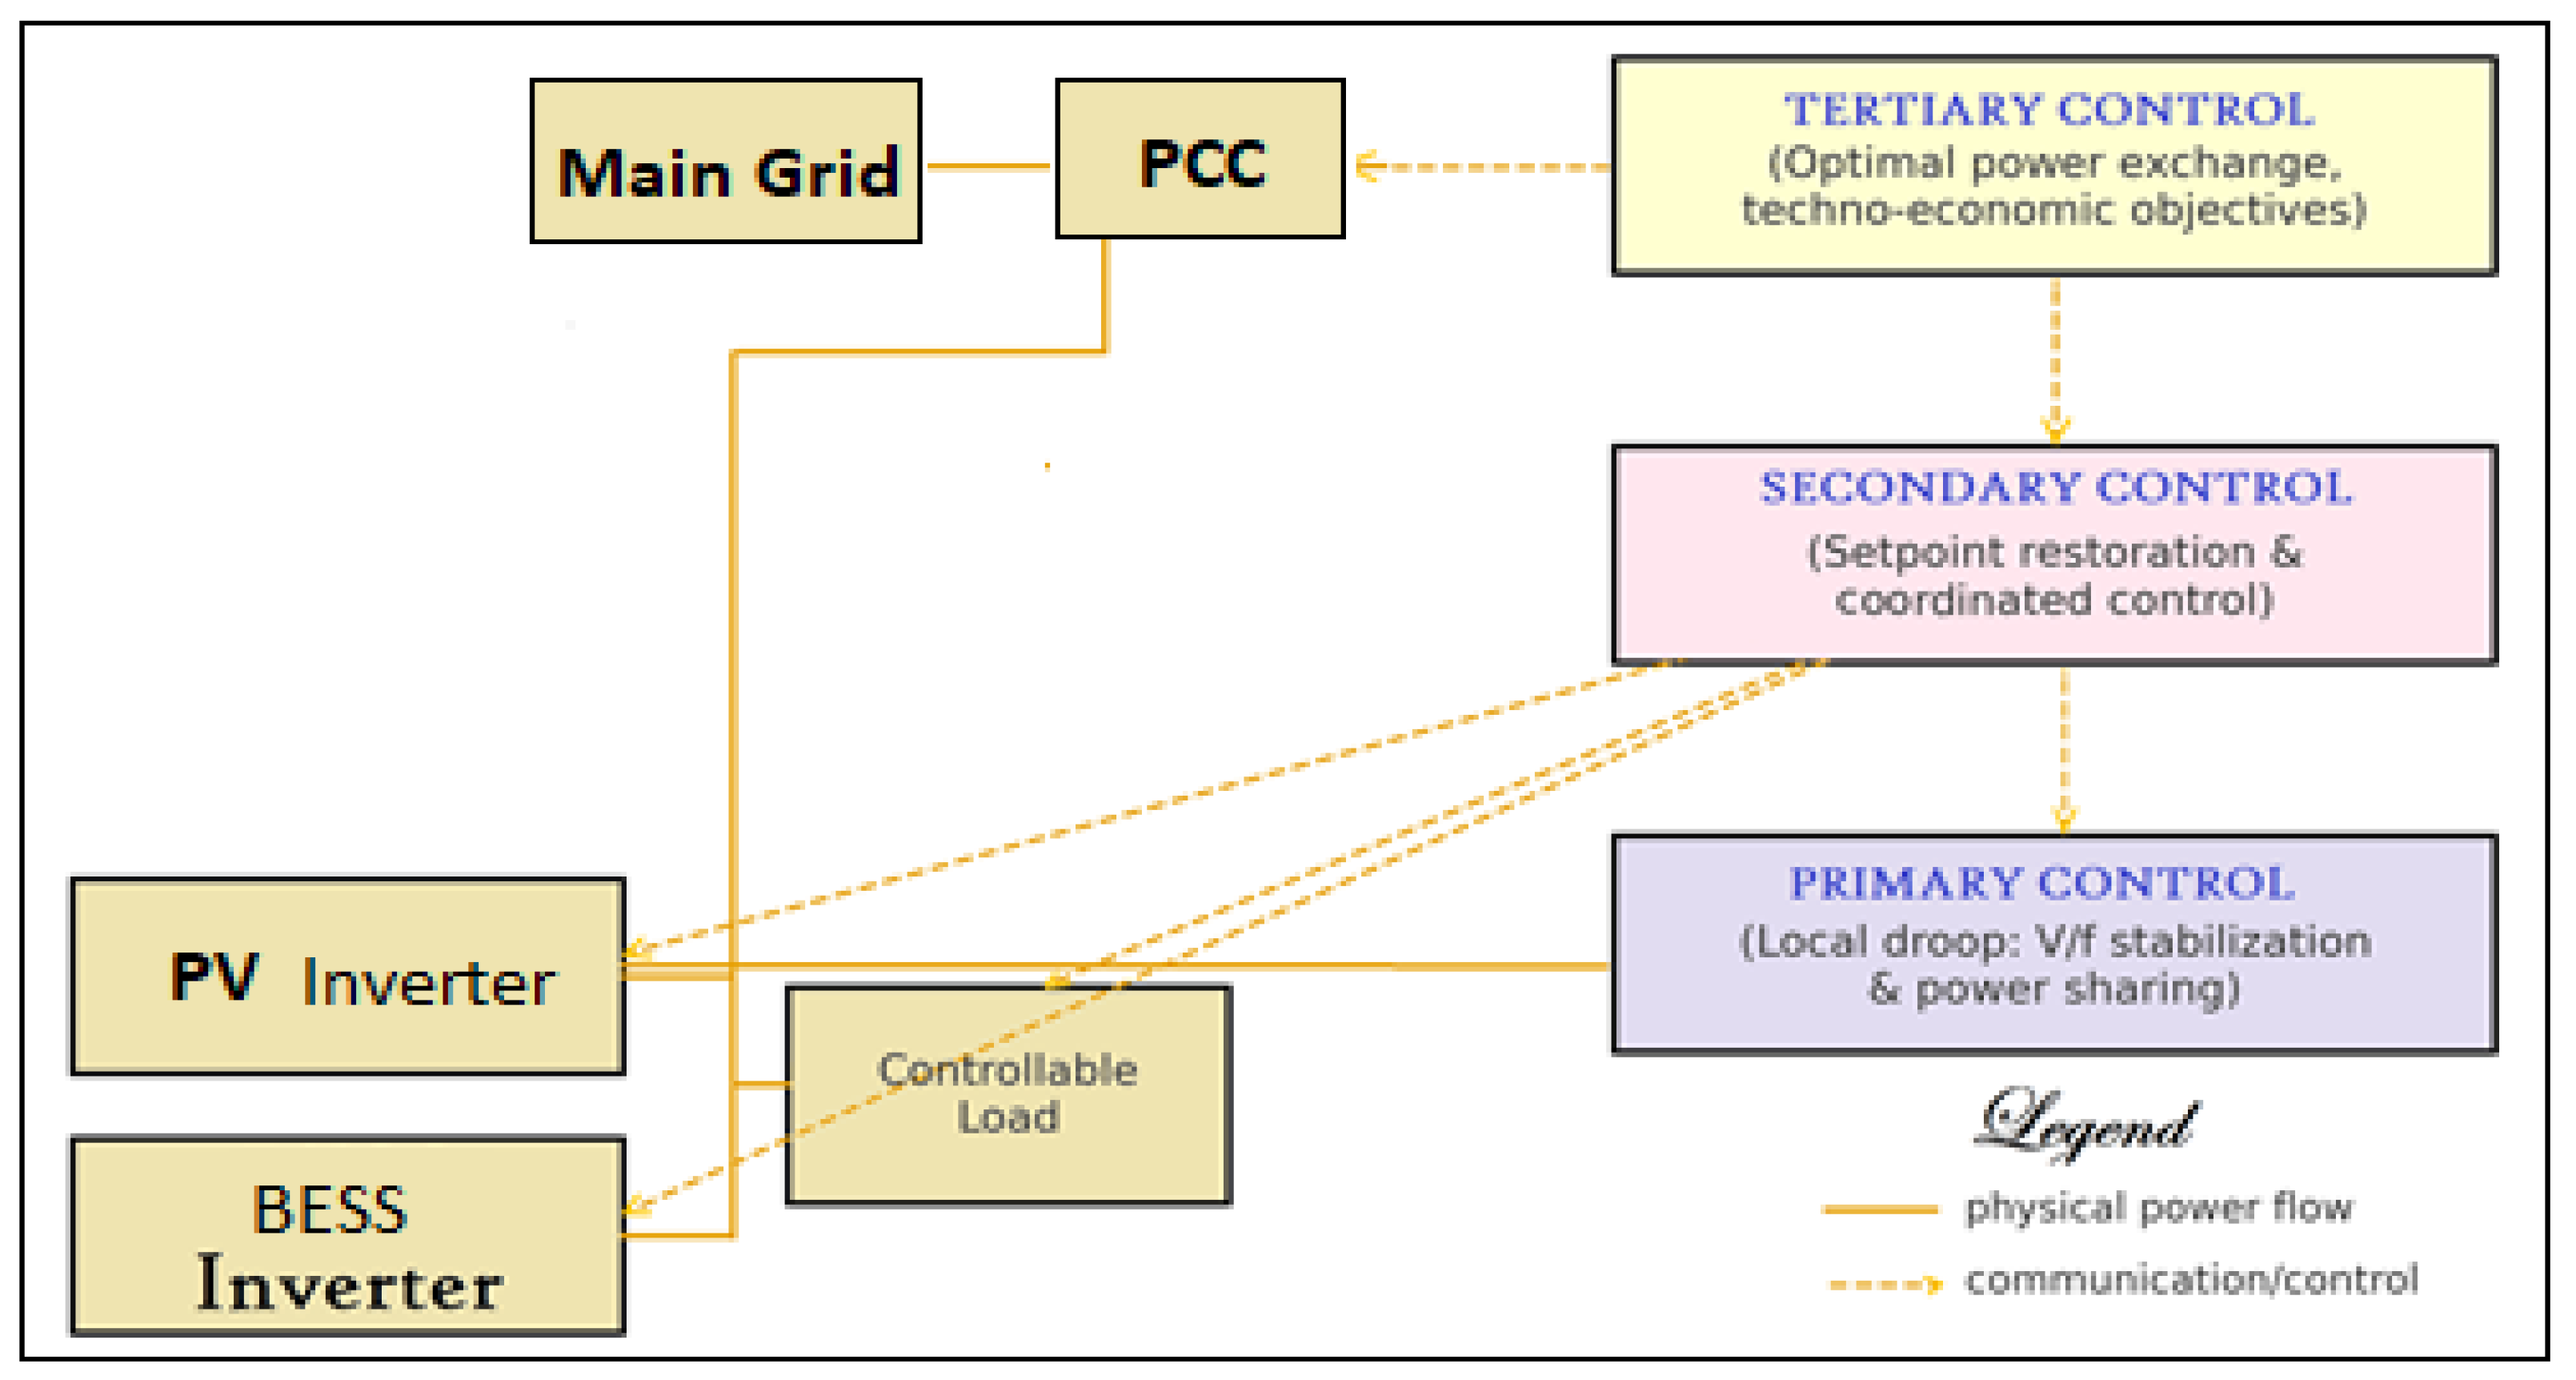
Figure 2.
Single-line diagram of IEEE 33-bus microgrid.
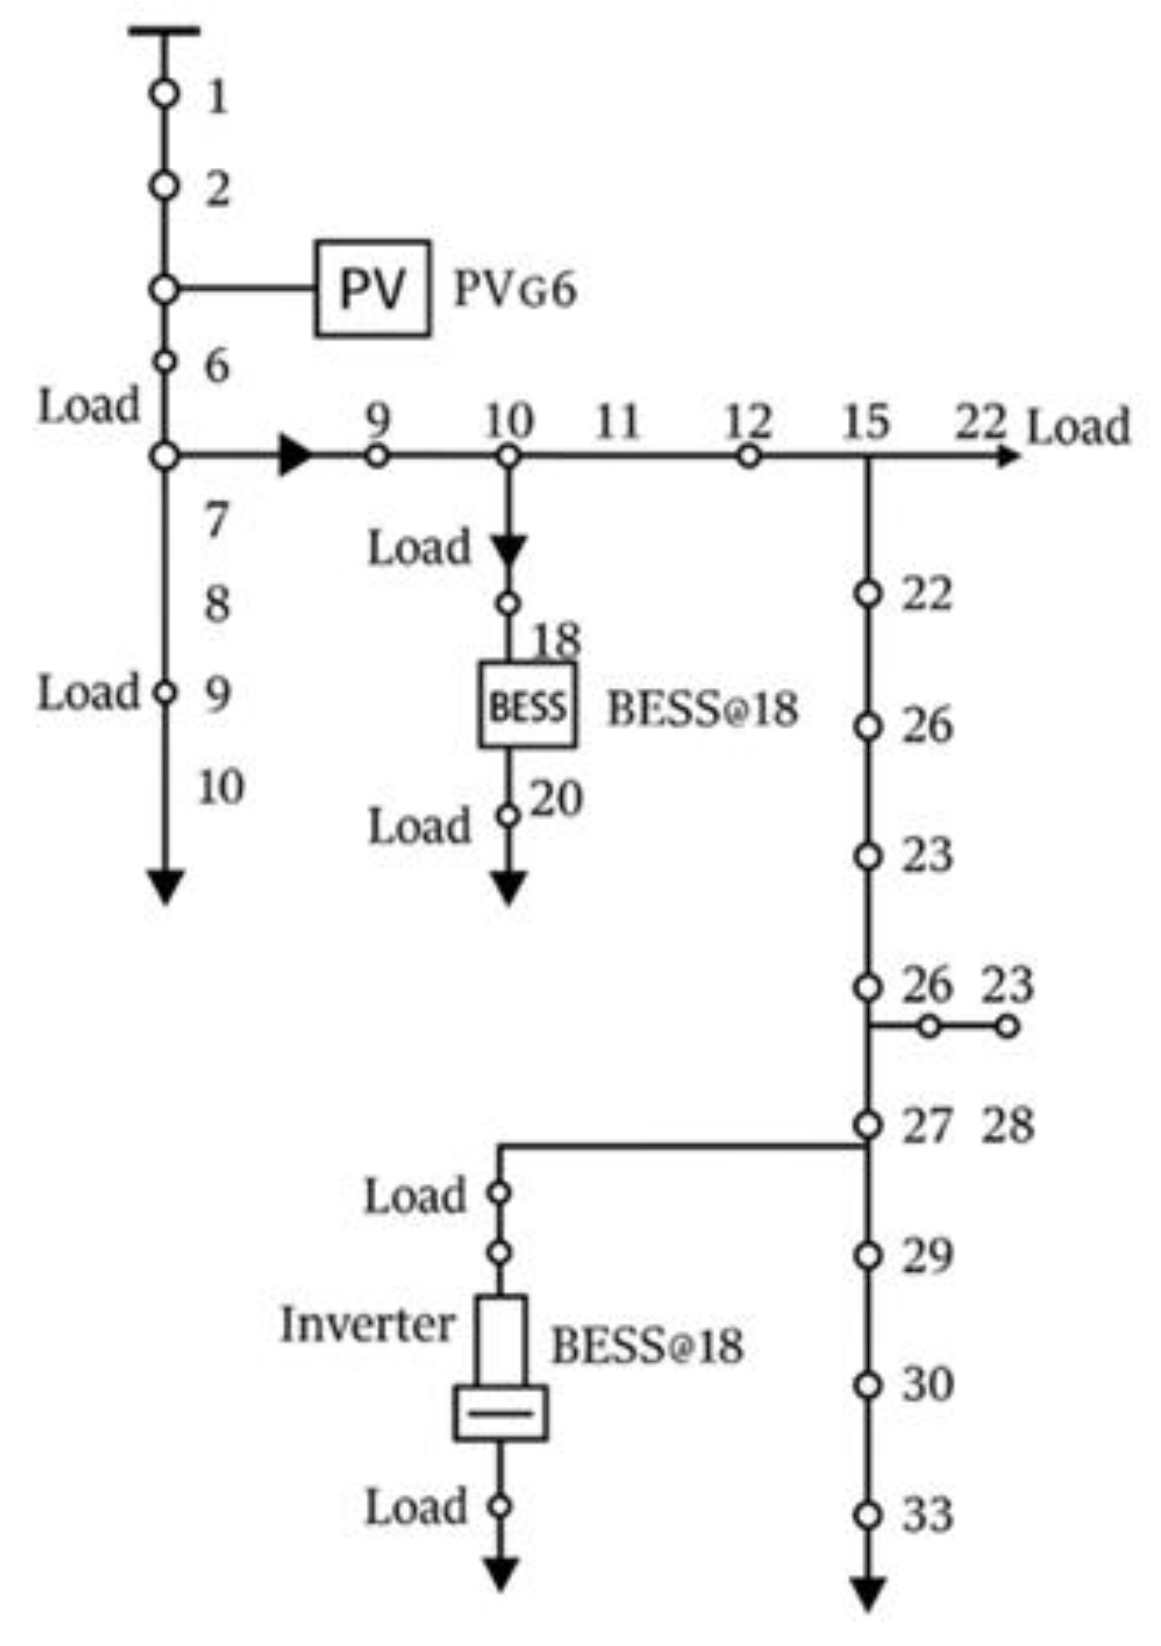
Figure 3.
The IEEE 33-bus microgrid control architecture, including EMS, communications layer, inverter droop control, and fallback/resynchronization logic.
Figure 3.
The IEEE 33-bus microgrid control architecture, including EMS, communications layer, inverter droop control, and fallback/resynchronization logic.
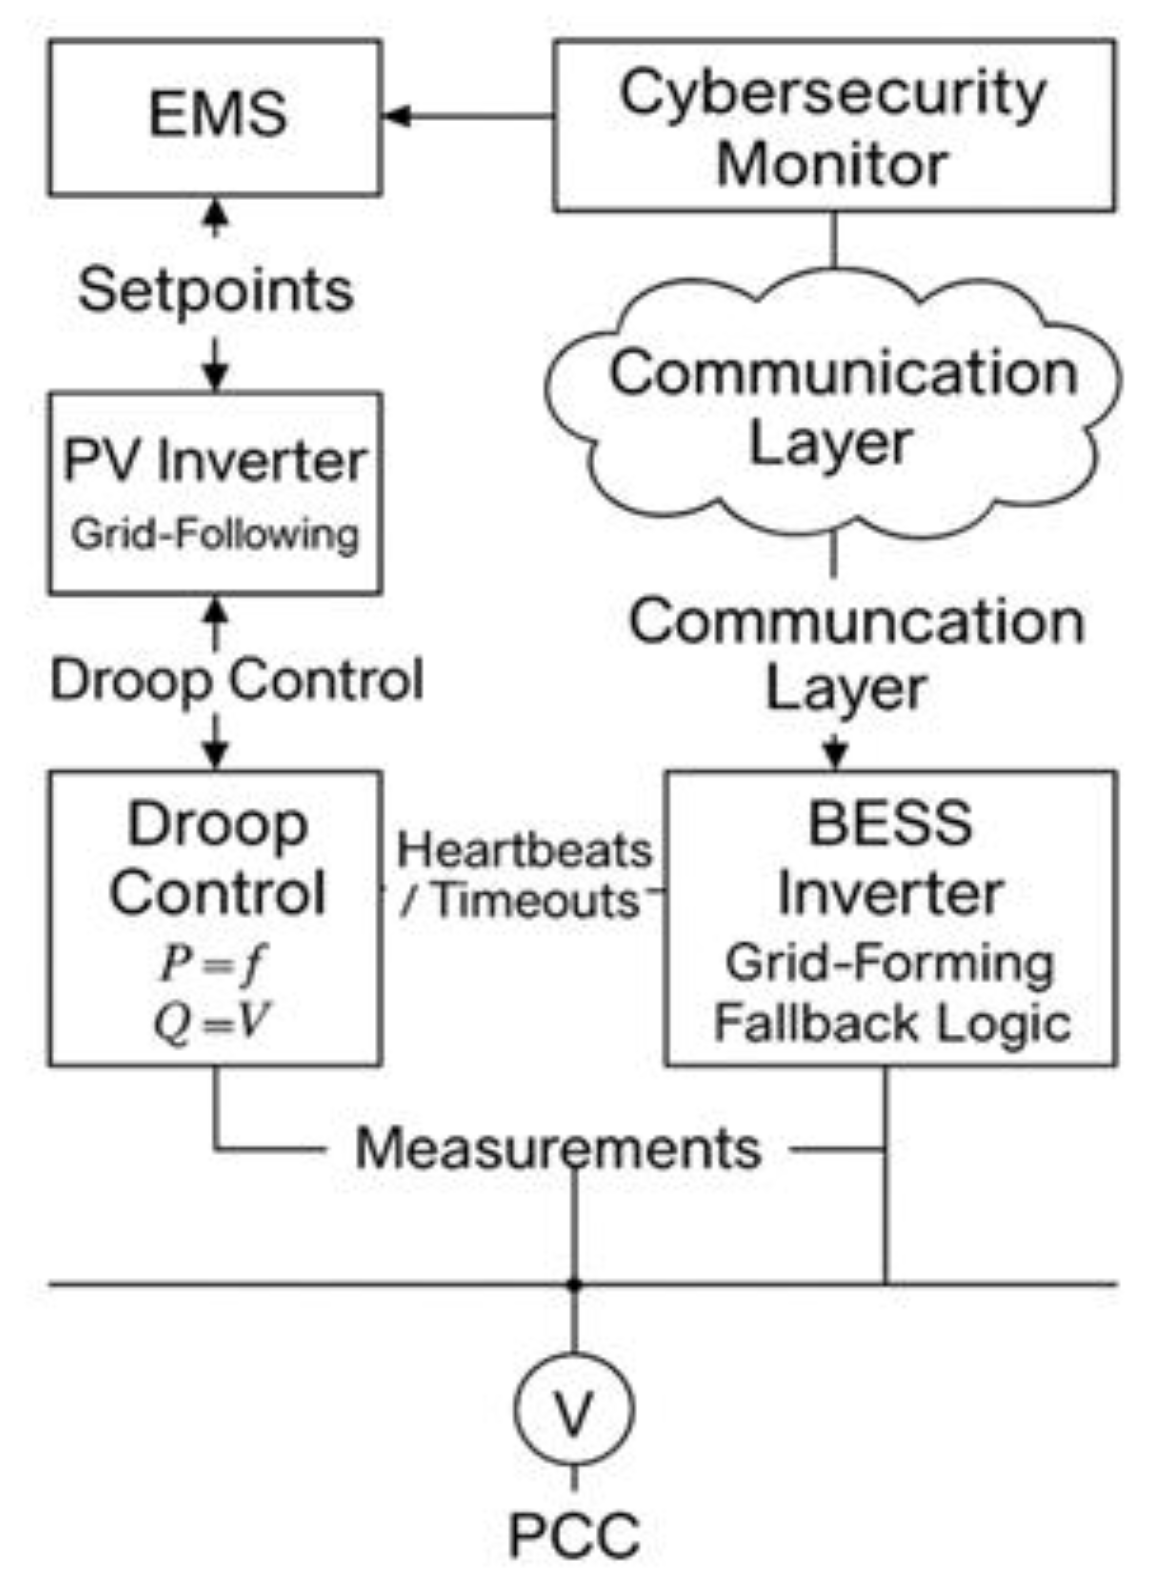
Figure 4.
IEEE 33-bus Transitions in scenario D1: variation of voltages, frequency and powers delivered by BESS and PV after loss of main power supply.
Figure 4.
IEEE 33-bus Transitions in scenario D1: variation of voltages, frequency and powers delivered by BESS and PV after loss of main power supply.
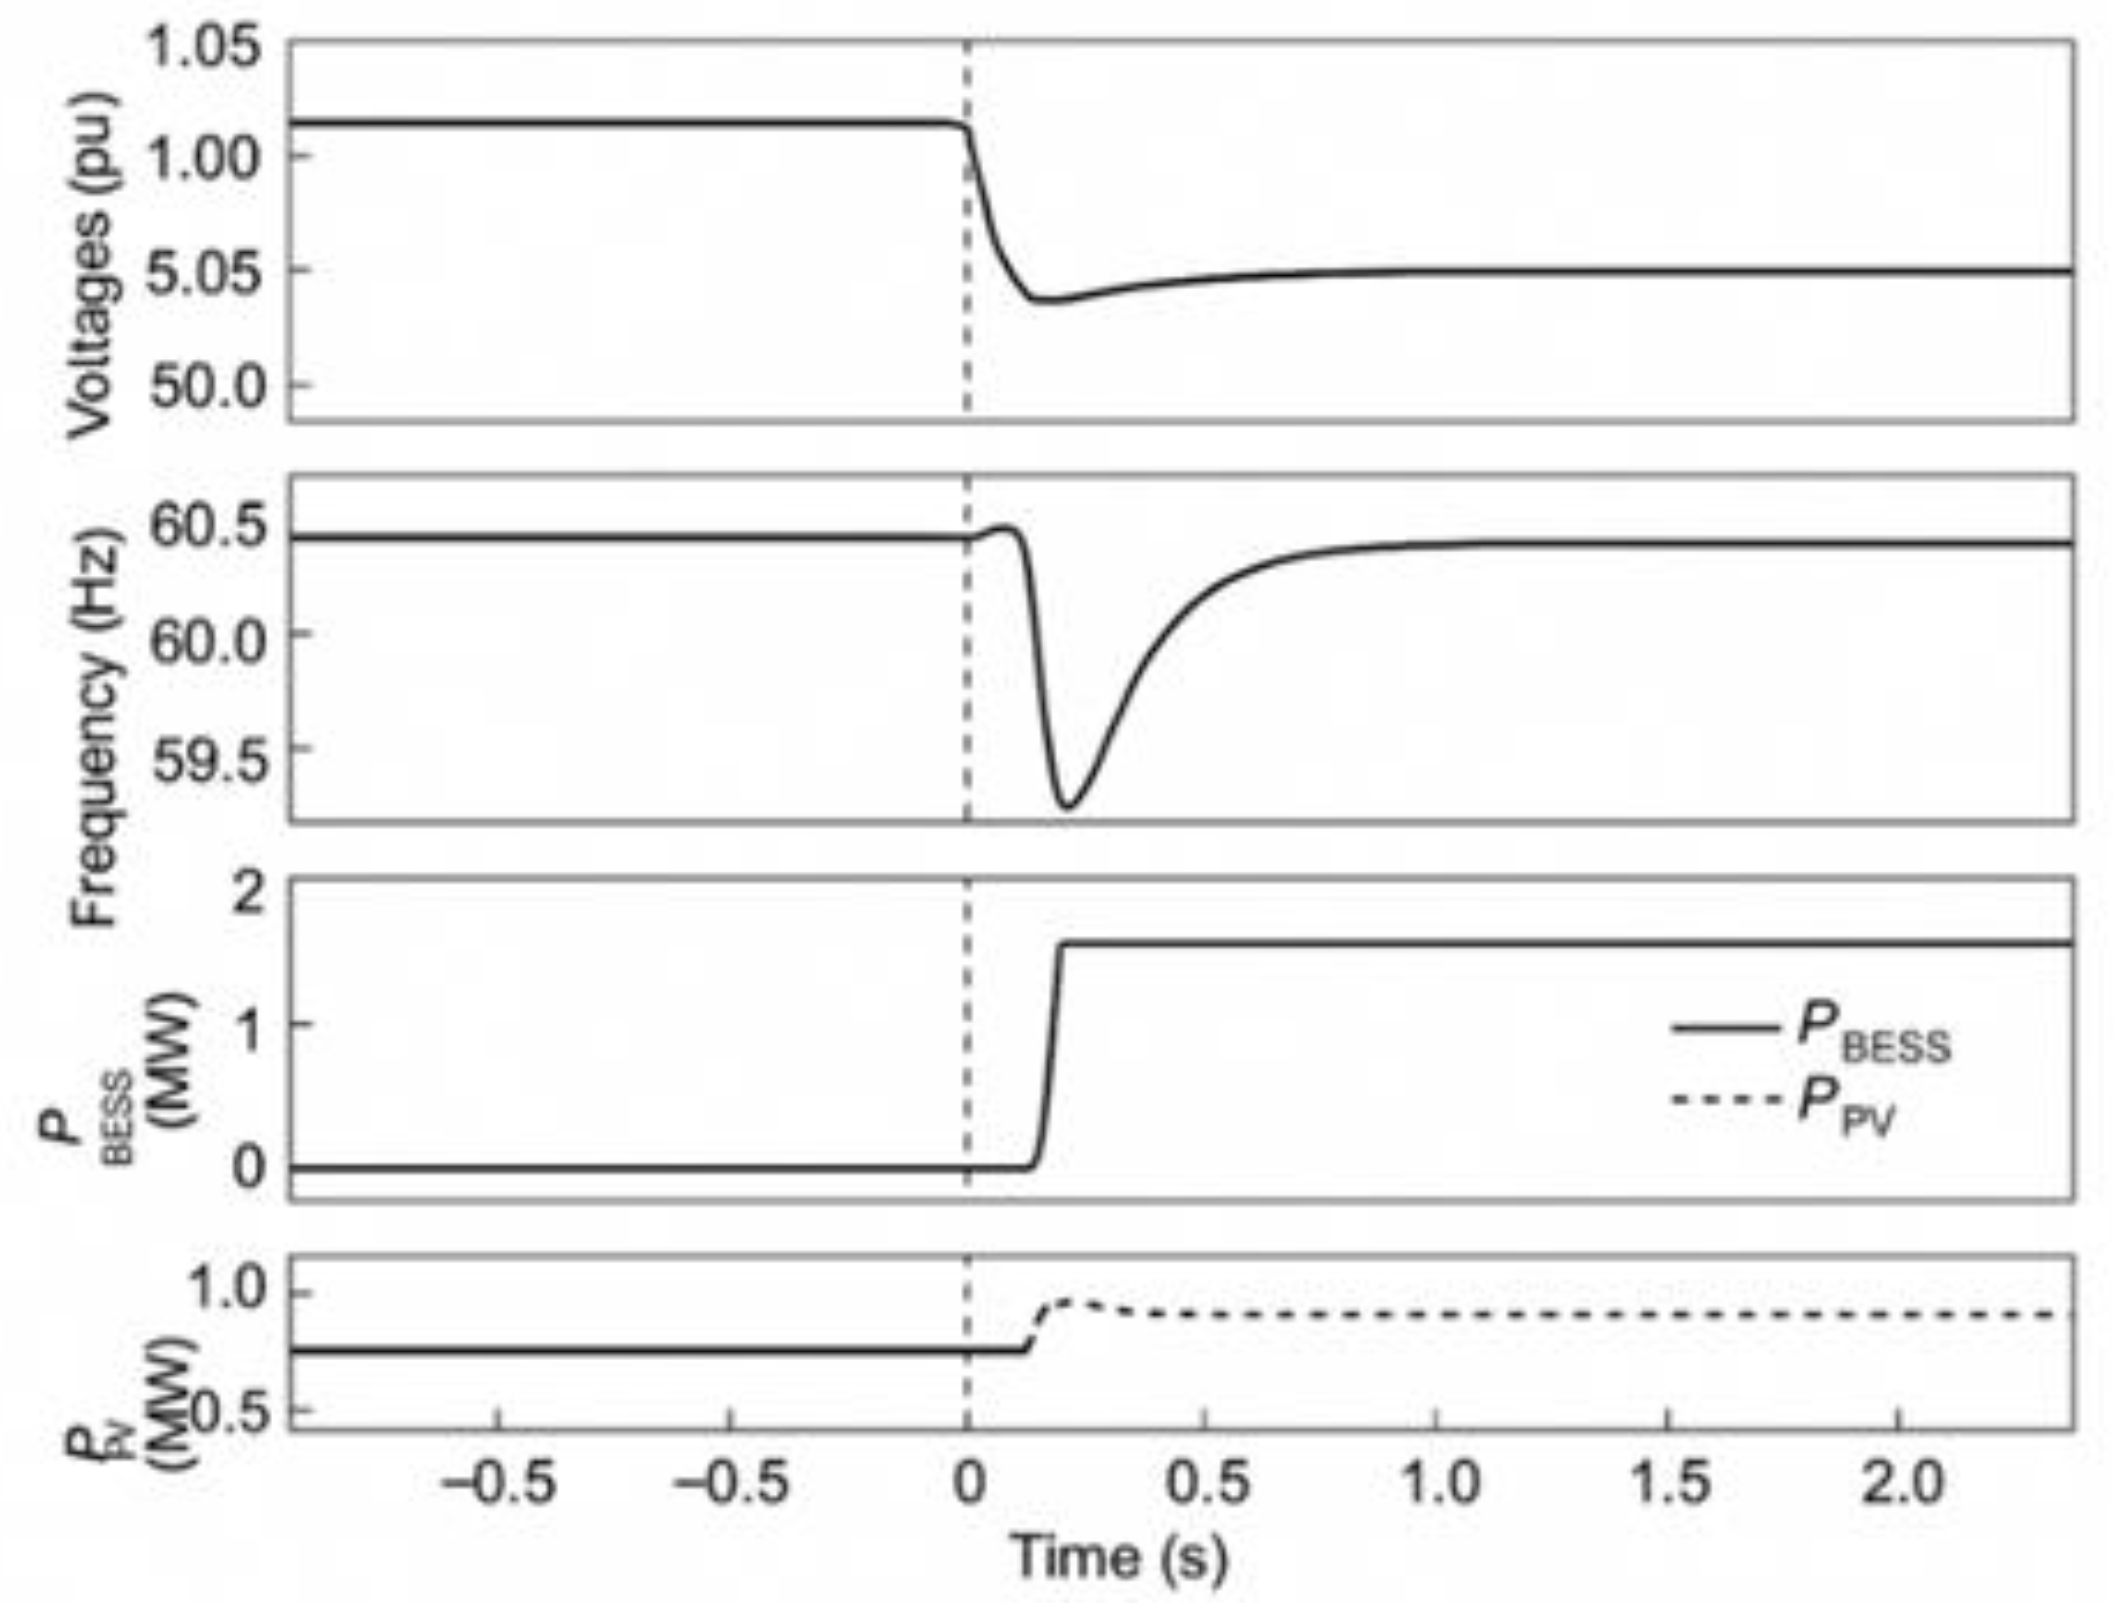
Figure 5.
Timeline of communication loss and transition between control modes.
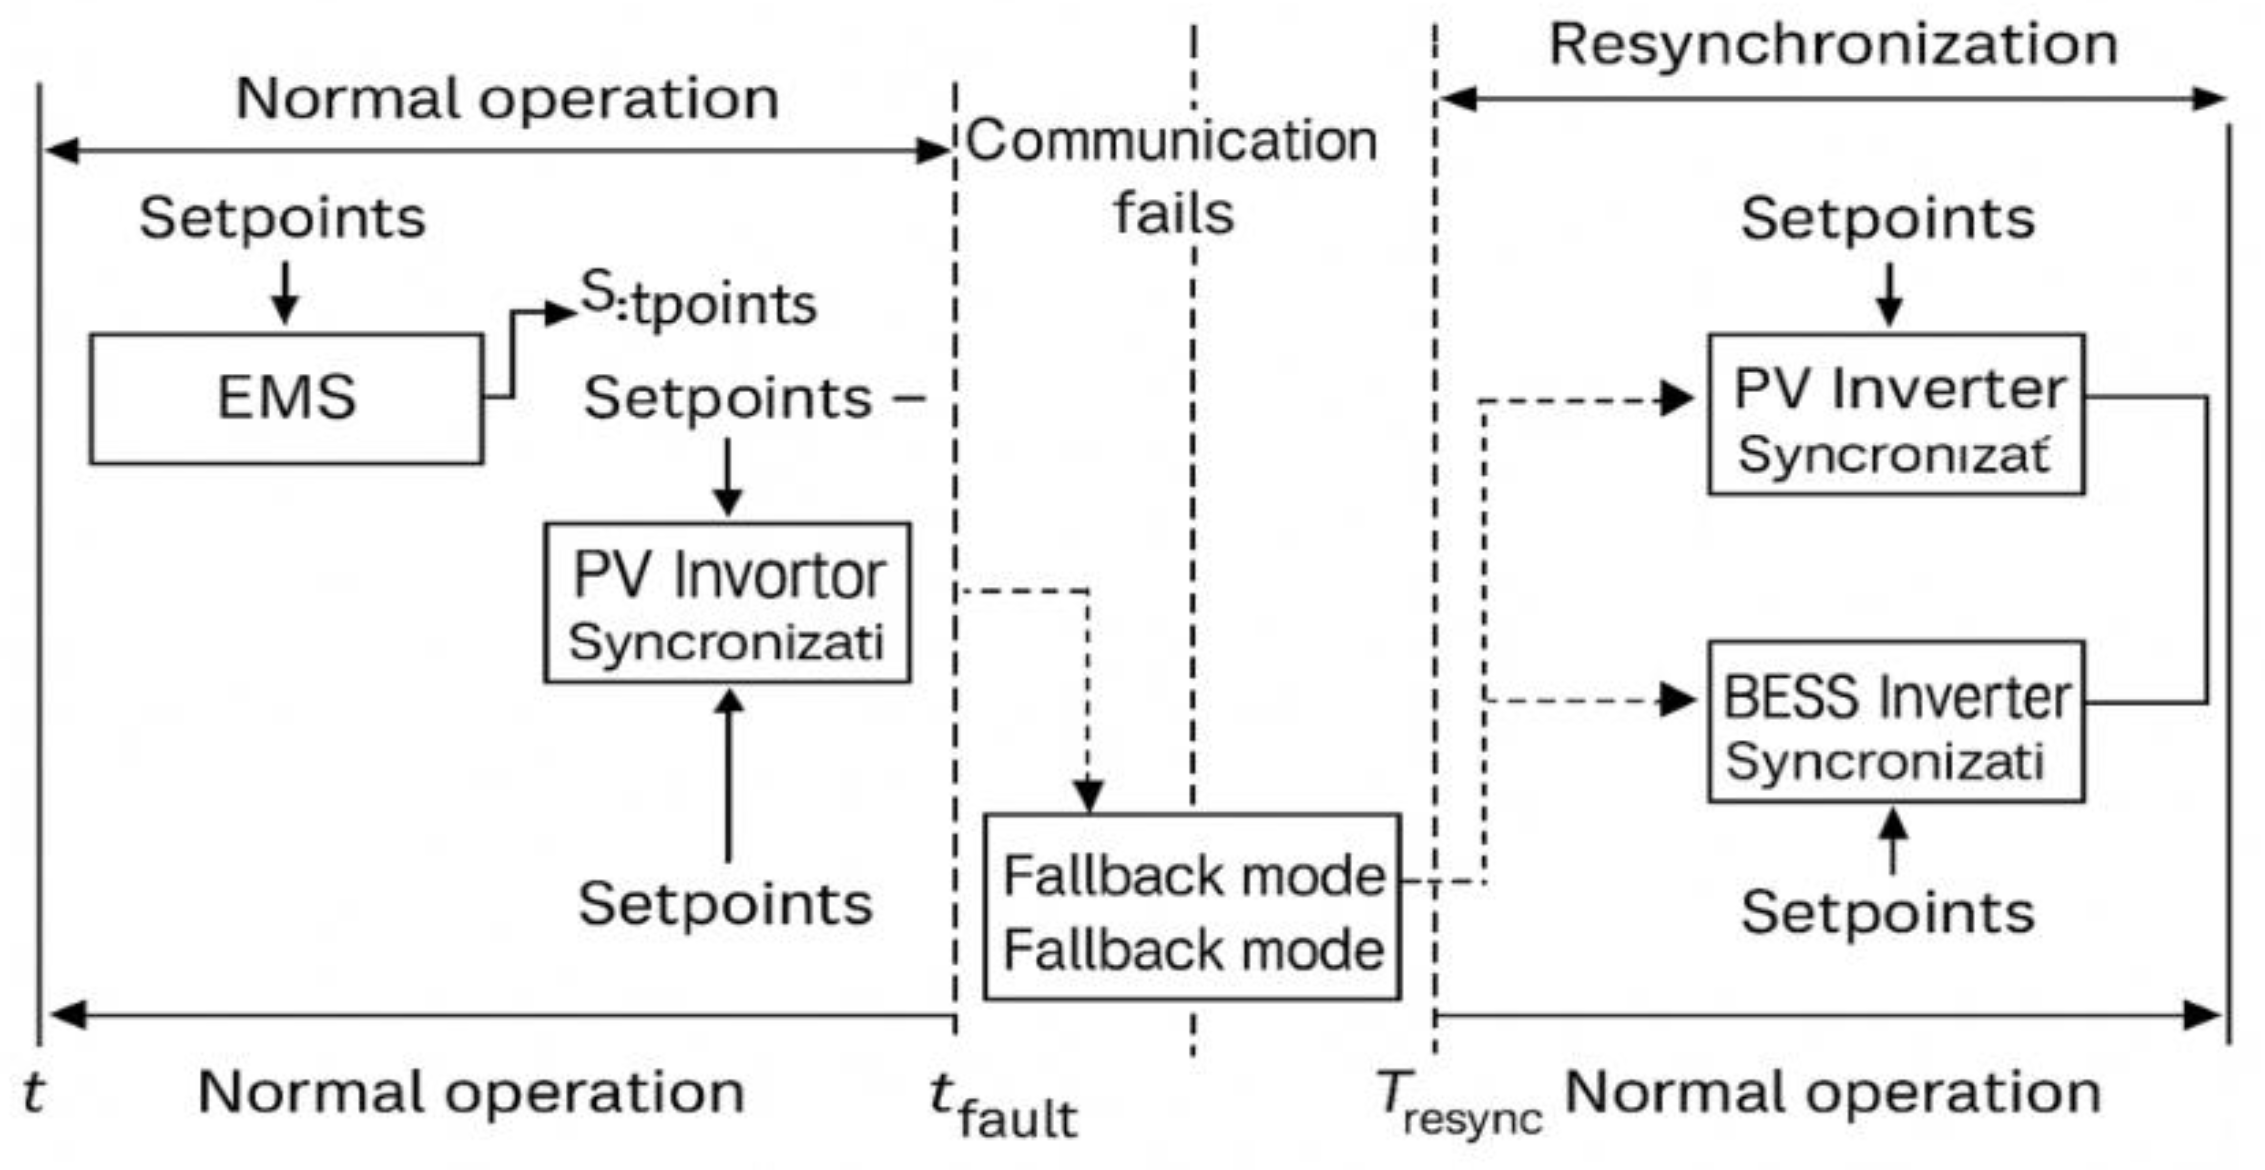
Figure 6.
Profiles: irradiance, load, and SoC baseline day.
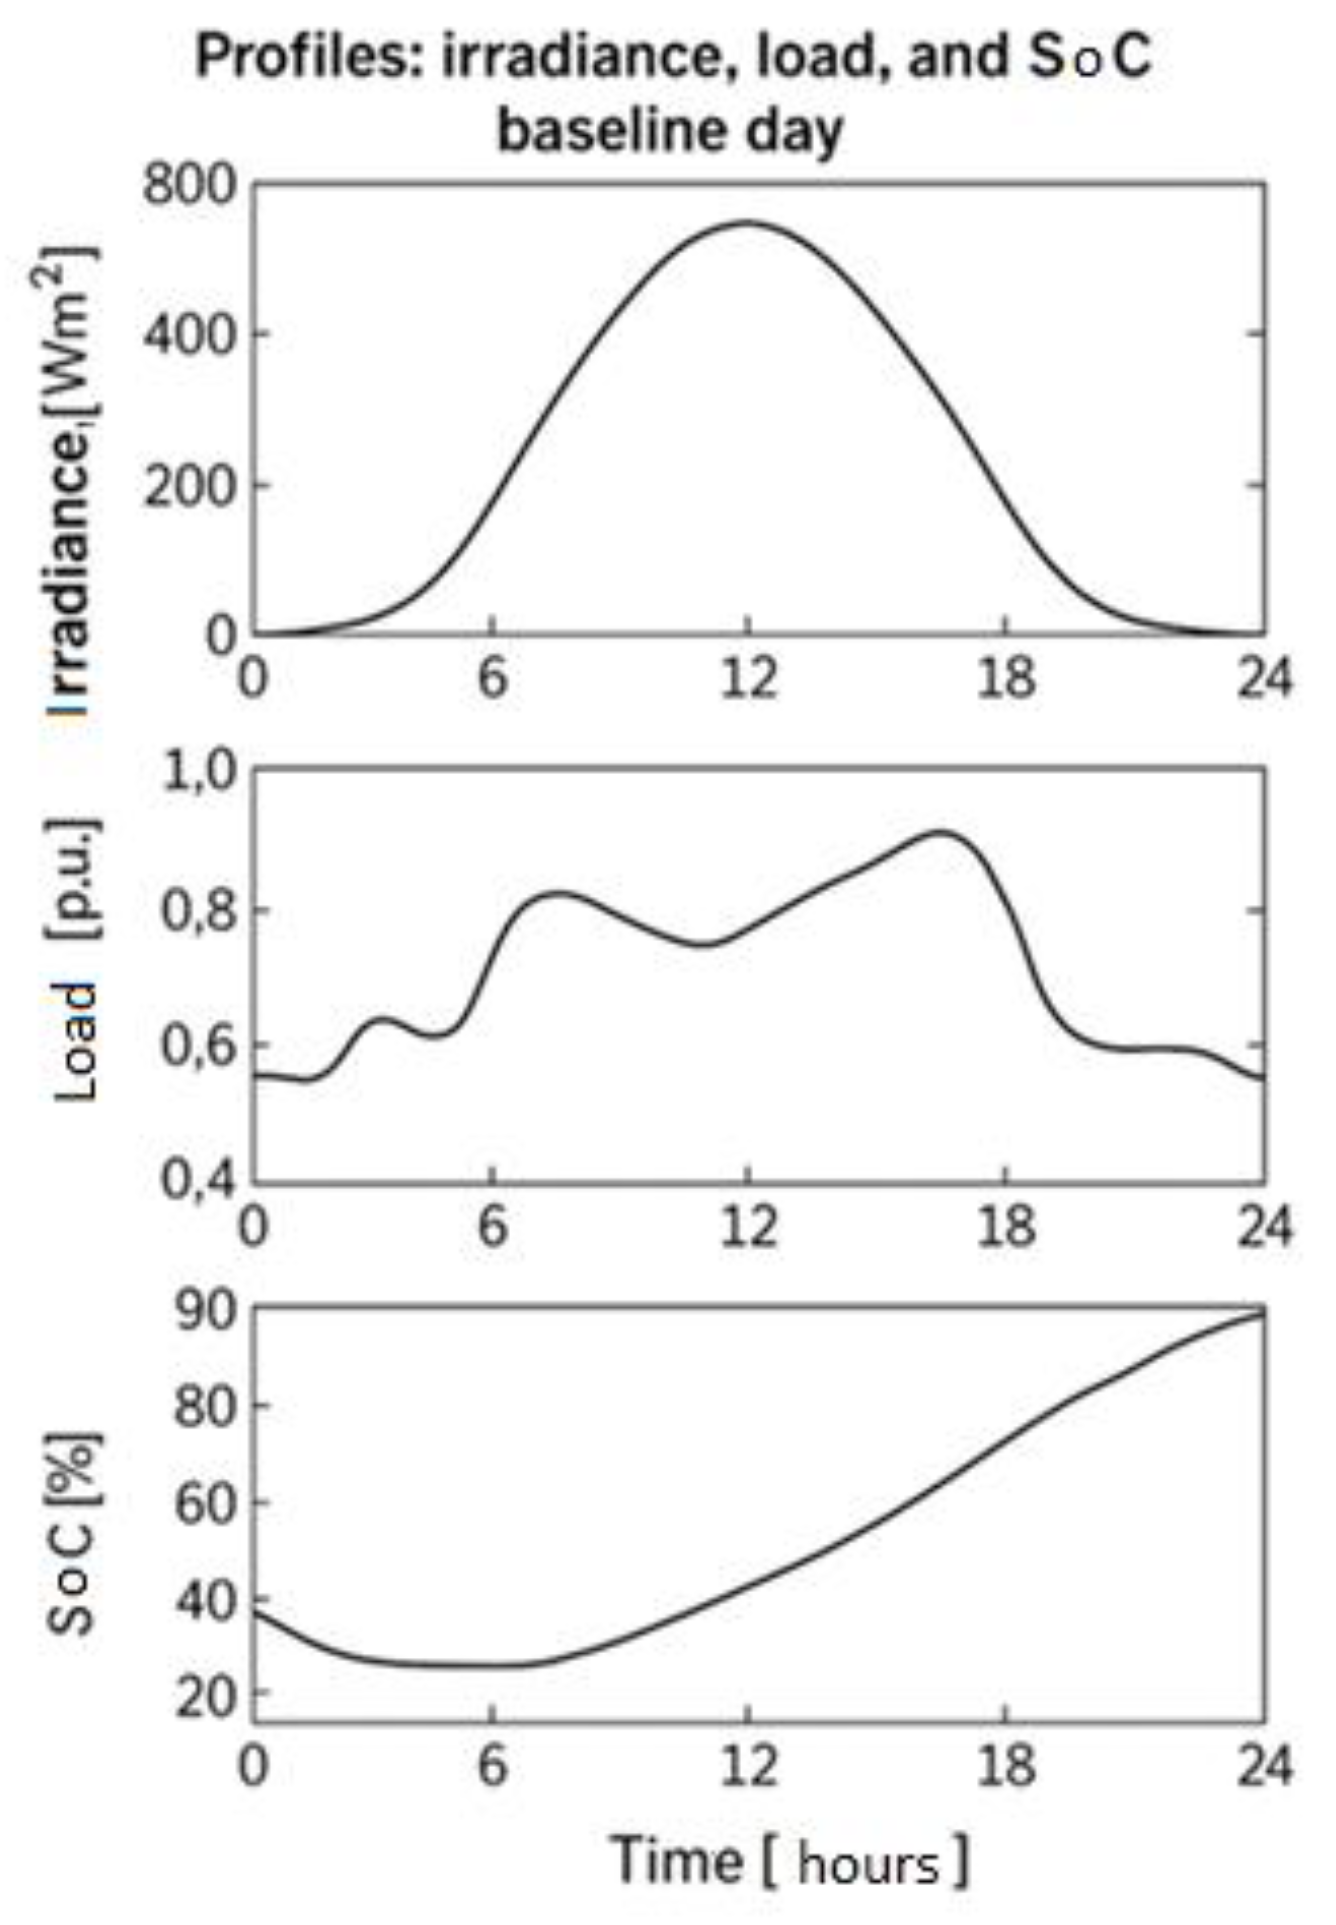
Figure 7.
Timeline of simulation scenarios.
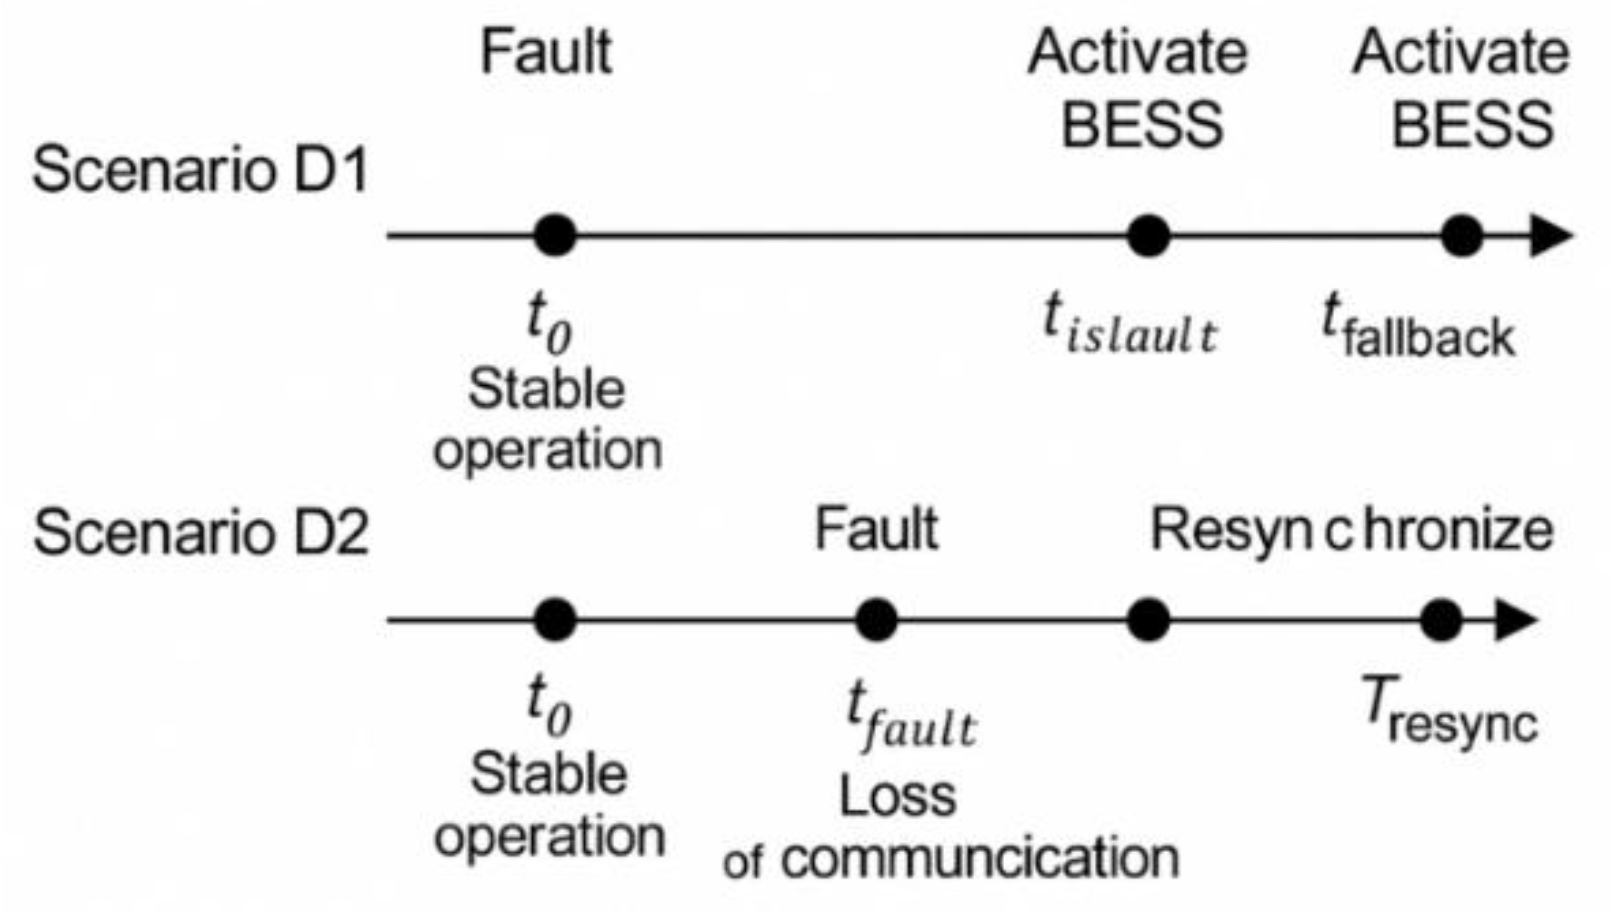
Figure 8.
General Resilience Matrix model, five-level rating scale (1–5) and hypothetical values applied to the IEEE 33-bus microgrid.
Figure 8.
General Resilience Matrix model, five-level rating scale (1–5) and hypothetical values applied to the IEEE 33-bus microgrid.
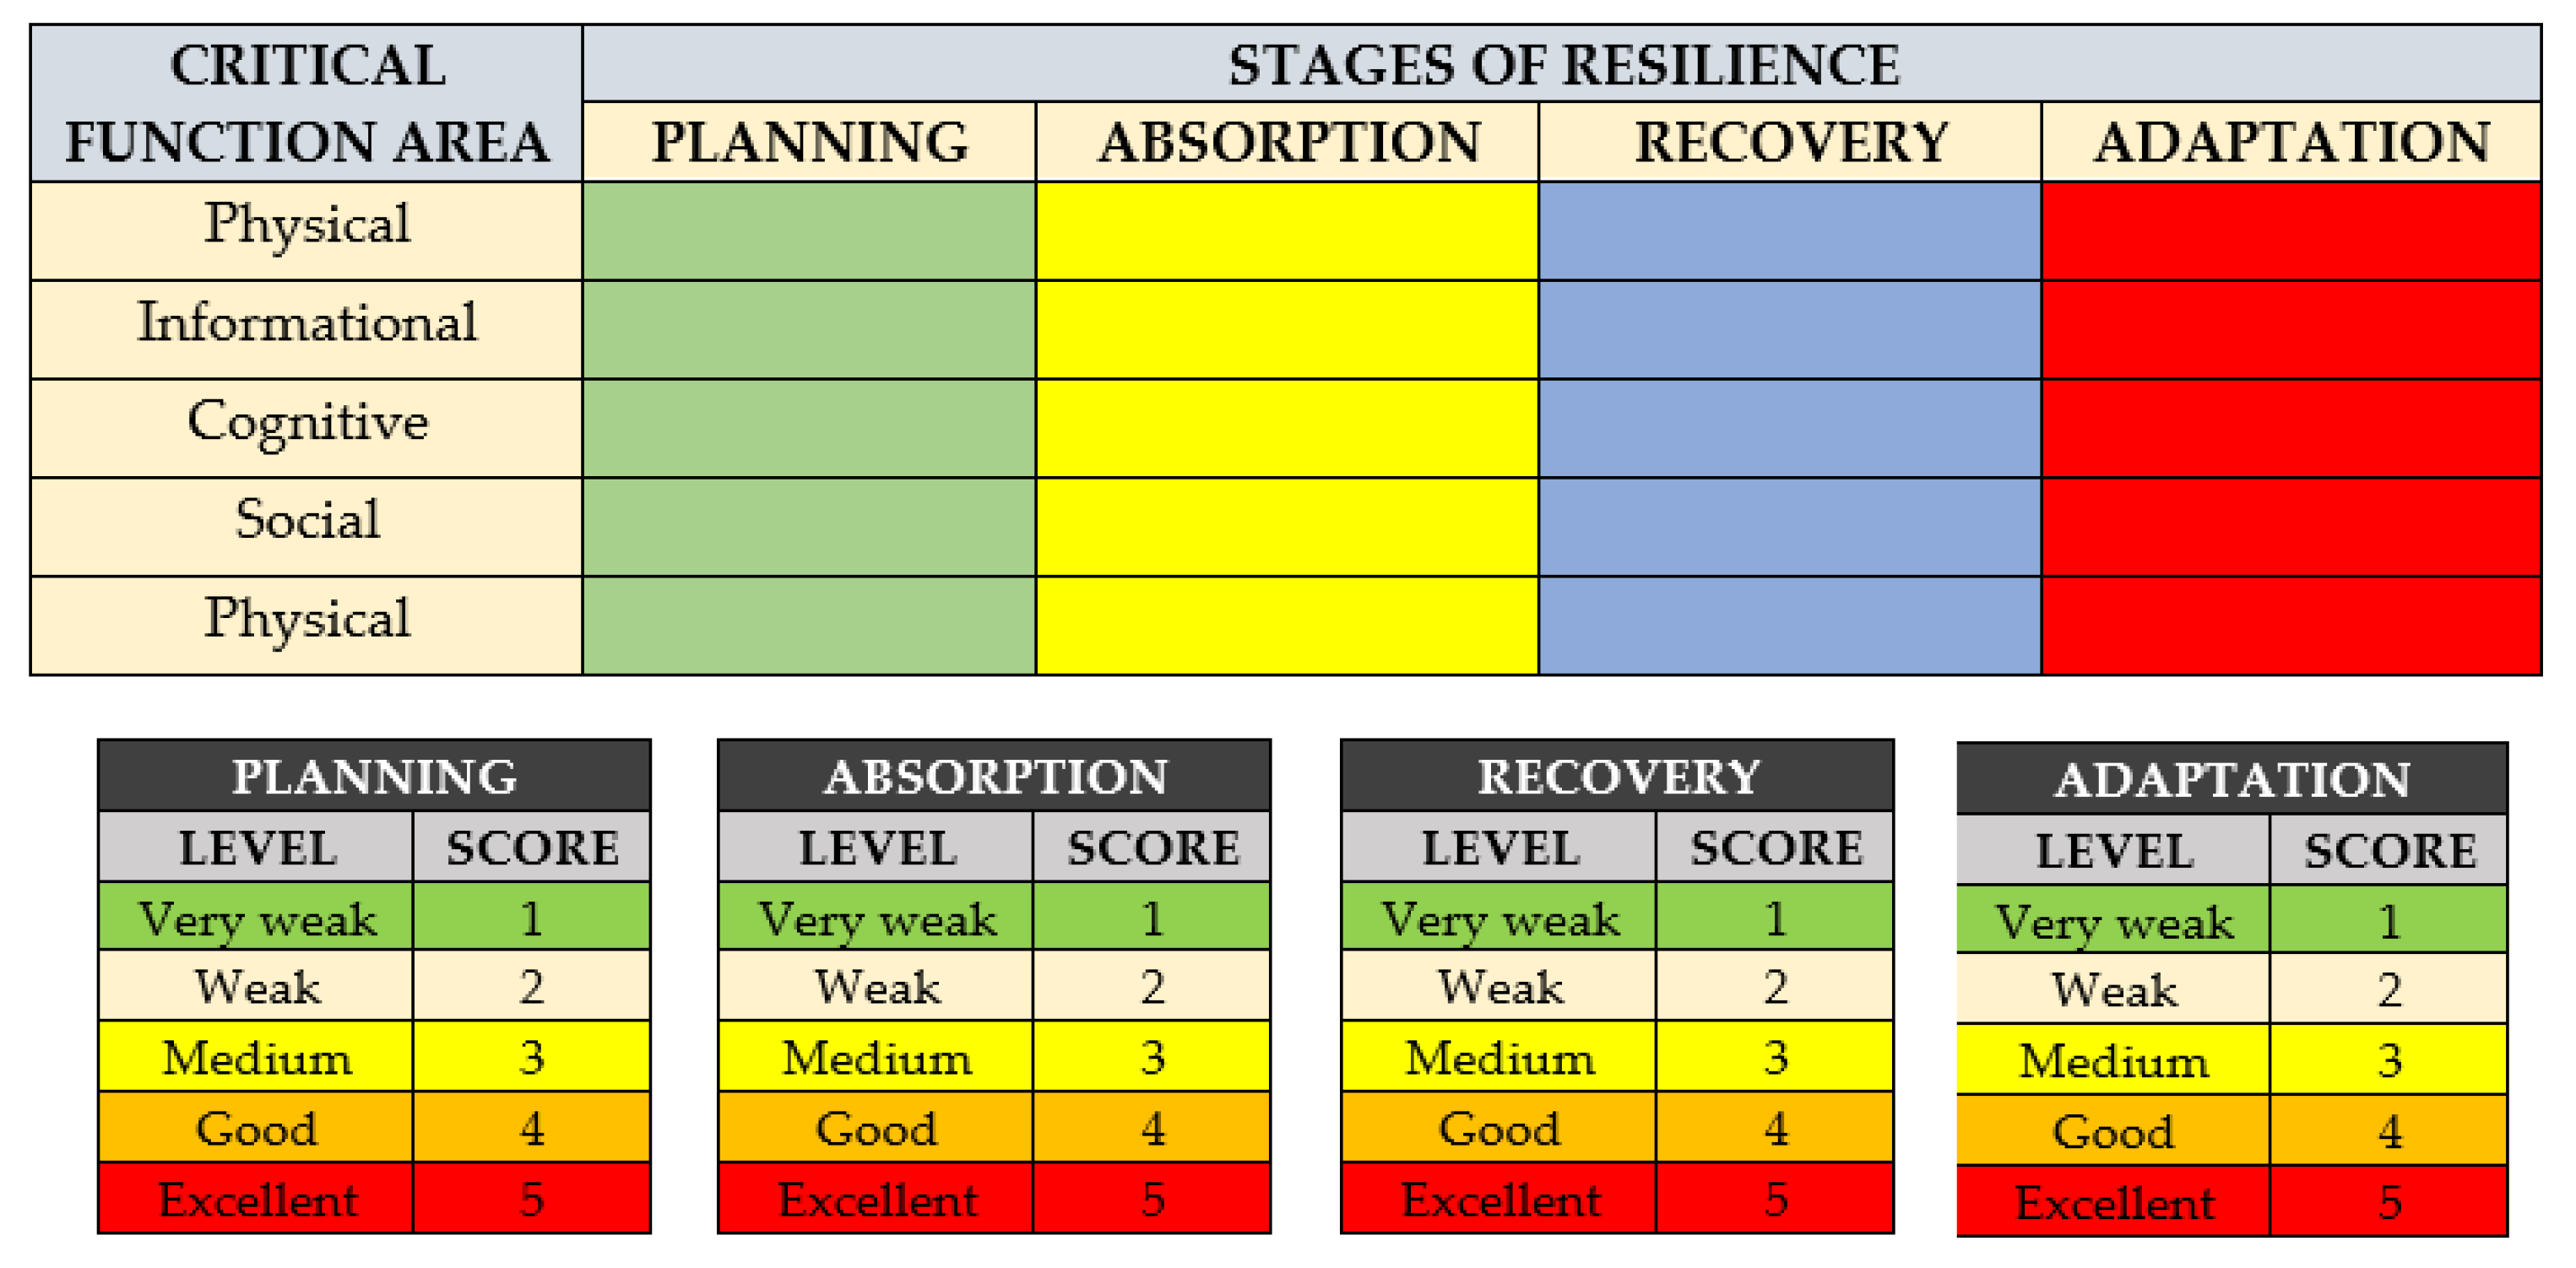
Figure 9.
Steady-state bus voltage profile (IEEE 33-bus microgrid). Voltages are normalized to 1.0 p.u. at bus 1; minimum value occurs at bus 33 (~0.964 p.u.). The presence of PV at bus 6 attenuates the voltage drop in the first half of the network.
Figure 9.
Steady-state bus voltage profile (IEEE 33-bus microgrid). Voltages are normalized to 1.0 p.u. at bus 1; minimum value occurs at bus 33 (~0.964 p.u.). The presence of PV at bus 6 attenuates the voltage drop in the first half of the network.
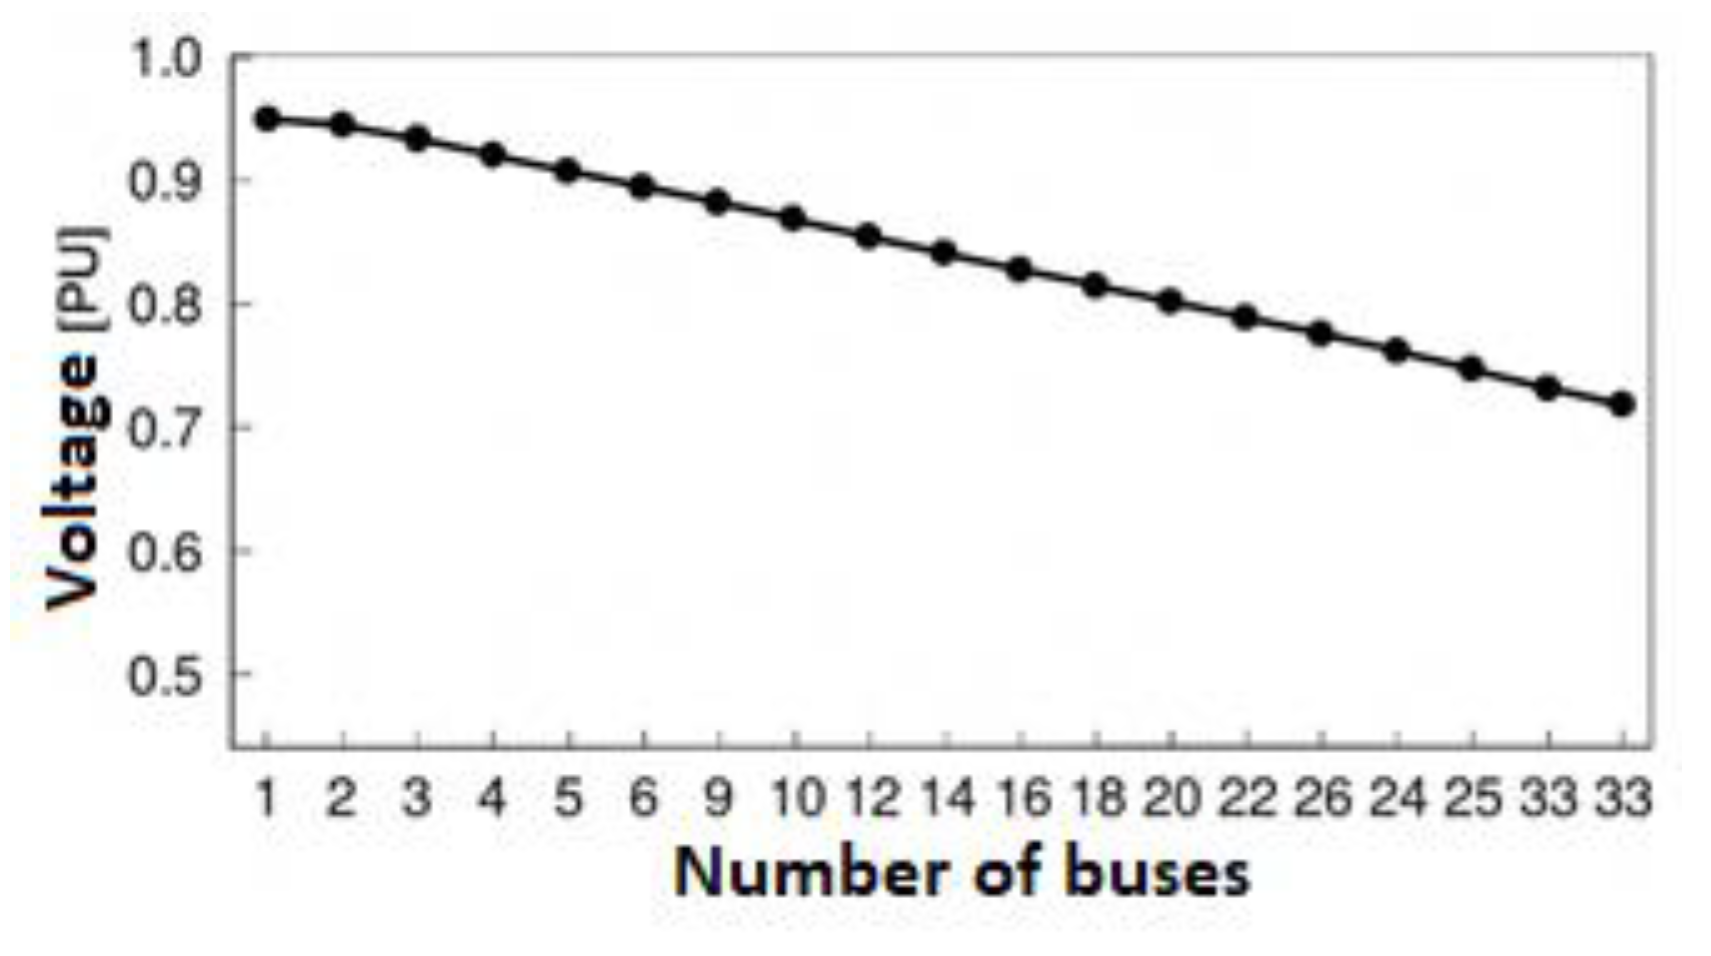
Figure 10.
Transient evolutions of the microgrid in scenario D1: average voltage, frequency, PV active power and BESS active power.
Figure 10.
Transient evolutions of the microgrid in scenario D1: average voltage, frequency, PV active power and BESS active power.
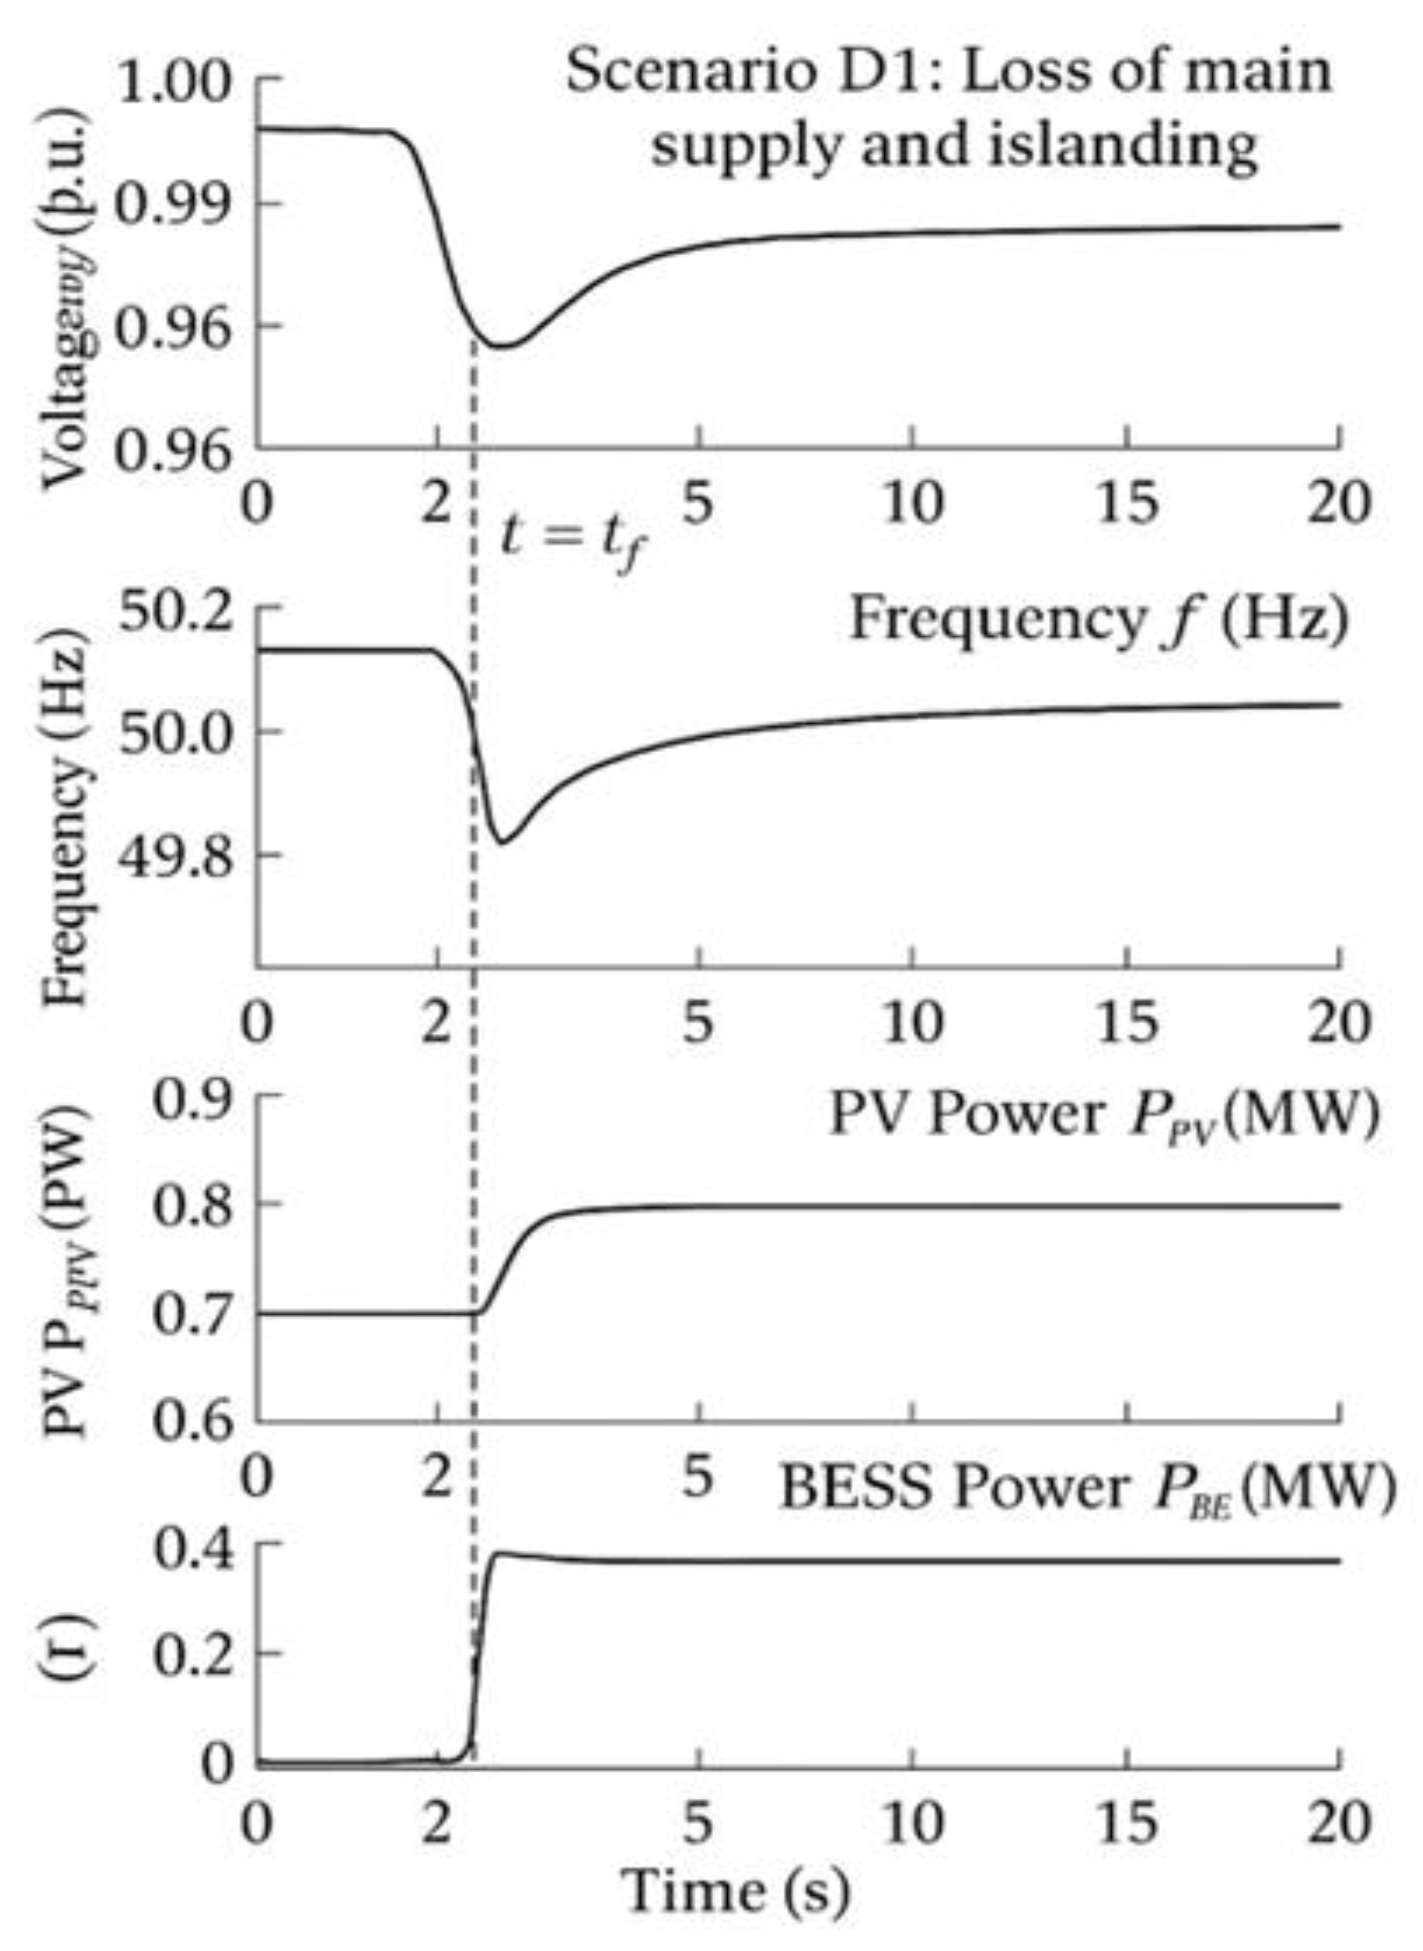
Figure 11.
Diagram of EMS–inverter fallback and resynchronization logic within the microgrid his is a figure.
Figure 11.
Diagram of EMS–inverter fallback and resynchronization logic within the microgrid his is a figure.
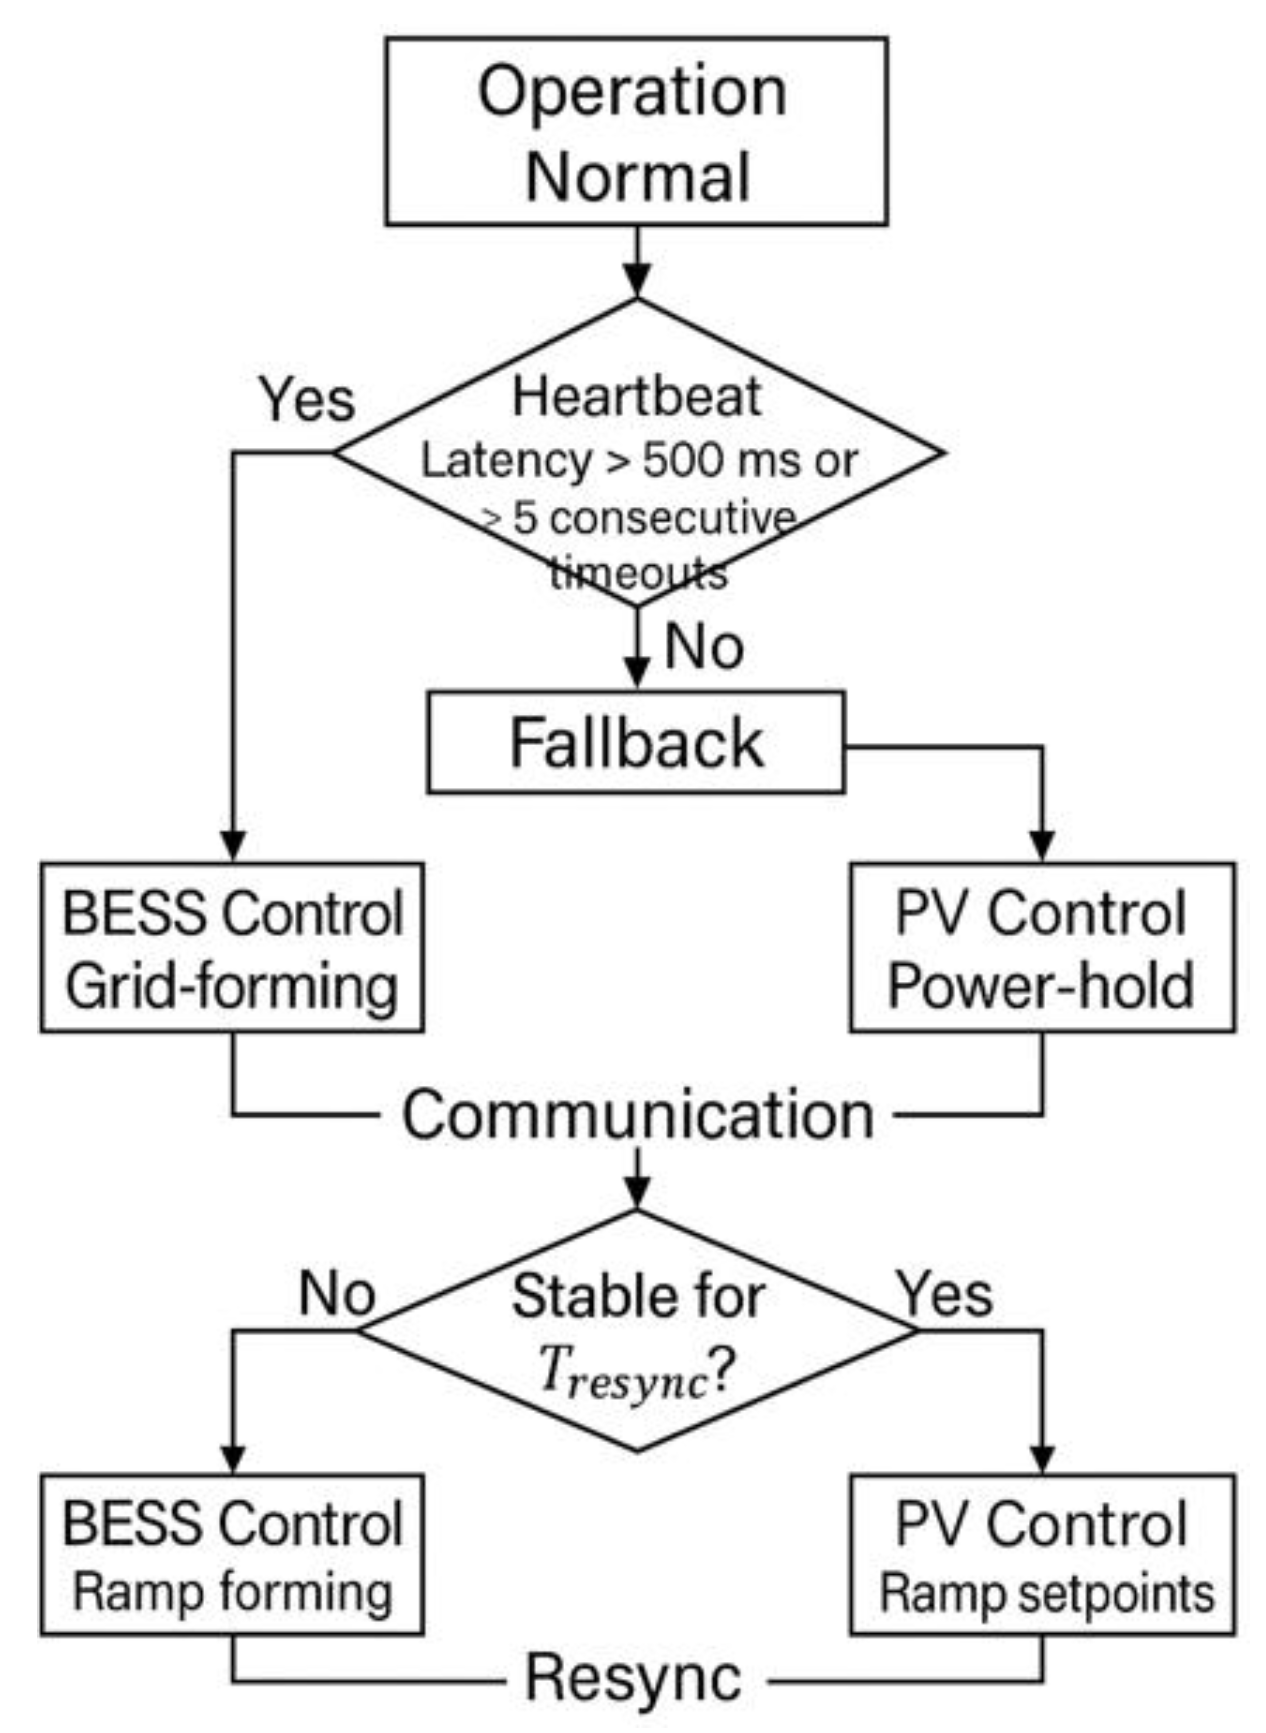
Figure 12.
Dynamic results of the microgrid in scenario D2.
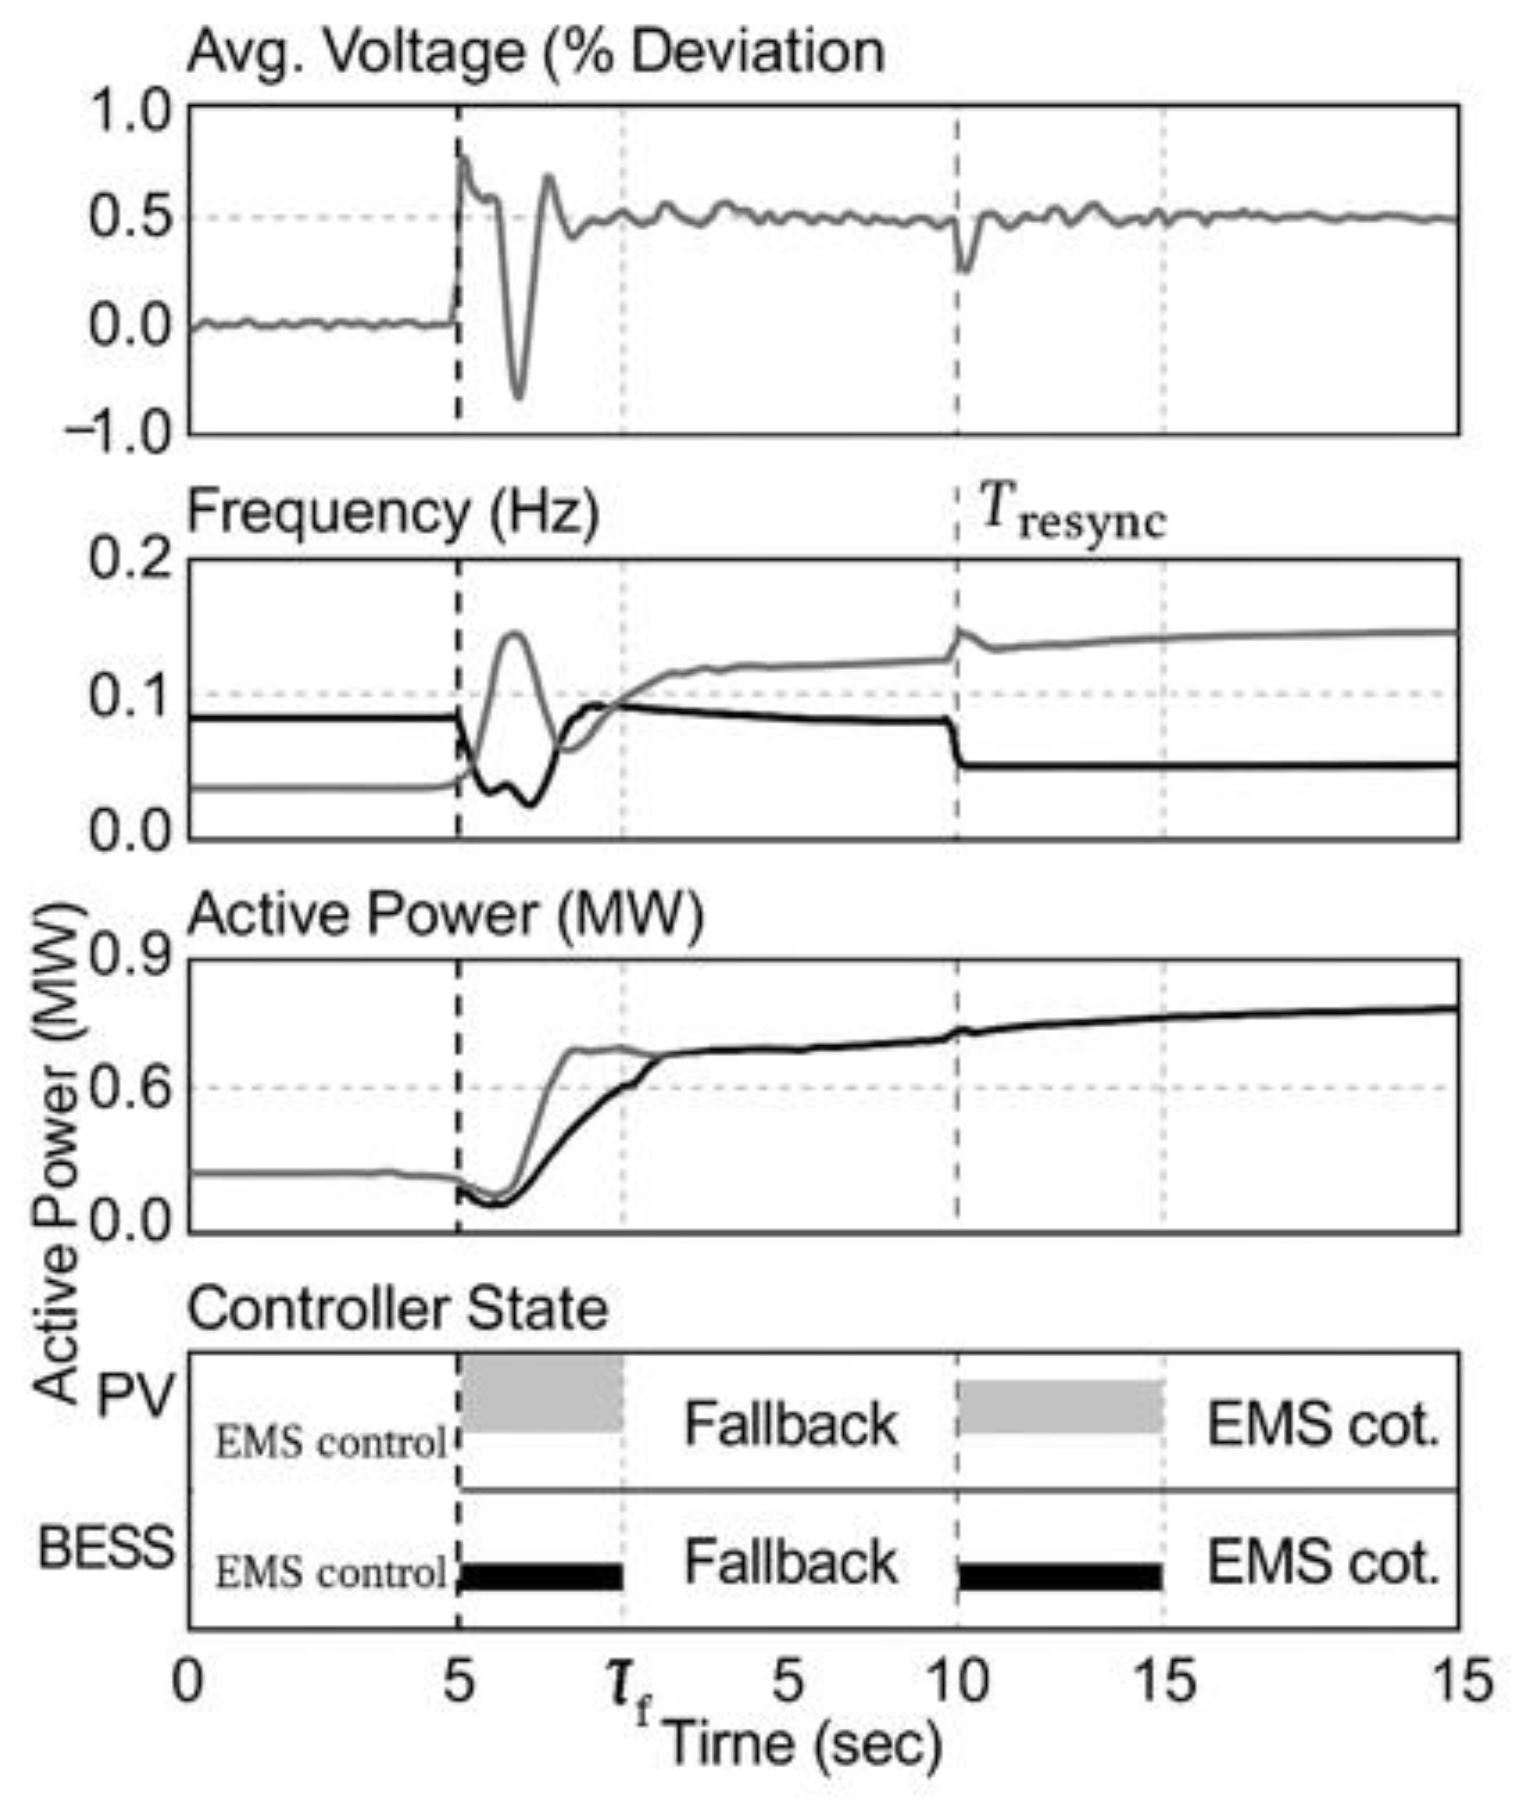
Figure 13.
Normalized voltage and frequency deviations and controller states during scenario D2.
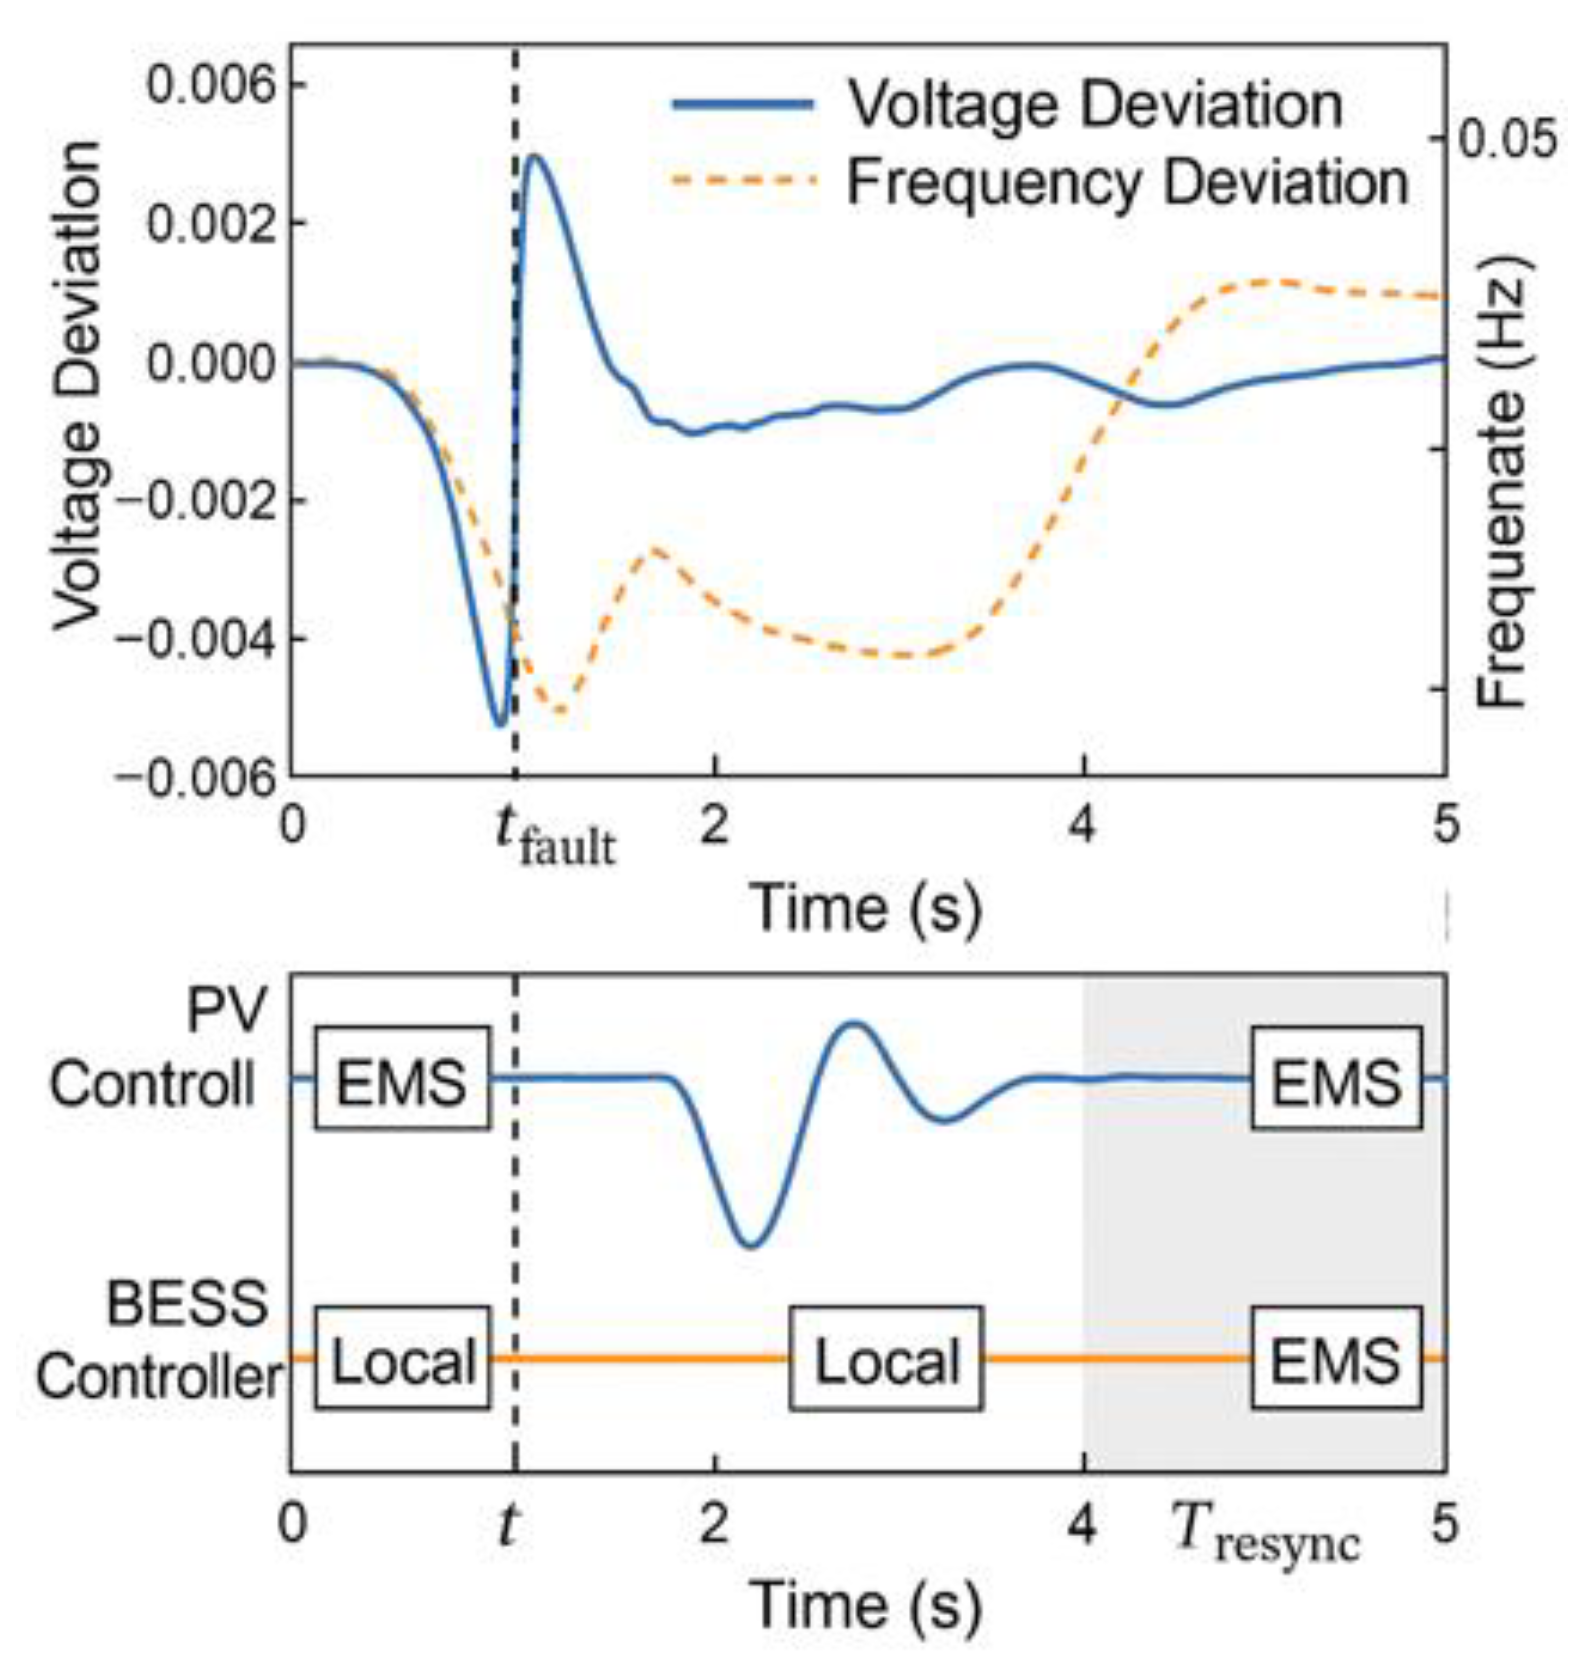
Figure 14.
Graphical summary of the sensitivity analysis: normalized variations of VDI, ENS and GRI indicators depending on PV, BESS, droop and packet loss parameters.
Figure 14.
Graphical summary of the sensitivity analysis: normalized variations of VDI, ENS and GRI indicators depending on PV, BESS, droop and packet loss parameters.

Table 2.
FDI vs LAA in microgrids and DER systems.
| Aspect | FDI | LAA |
| Definition | Adversary tampers with measurements/telemetry or commands so estimators/controllers infer an altered state; in State Estimation (SE) terms, a crafted attack vector a = Hc yields z’ = z + a that can evade residual tests, shifting the estimate to x’ = x + c. | Adversary coordinates many controllable loads/prosumers (or Electric Vehicle Supply Equipment - EVSE) to create a net real-power change ΔP_LAA(t), forcing frequency/voltage excursions and reserve depletion. |
| Primary lever | Data integrity (sensors, meters, Phasor Measurement Units - PMUs, μEMS/DMS commands). | Physical demand (aggregated controllable loads/EV fleet/building automation). |
| Entry points | Intelligent Electronic Device/ Remote Terminal Unit (IED/RTU/PMU) streams, Advanced Metering Infrastructure (AMI)/ DER telemetry, μEMS gateways, market/price signals, setpoint channels. | Home Energy Management System/Internet of Things (HEMS/IoT) loads, Electric Vehicles (EV) chargers, prosumer aggregators, demand-response actuators. |
| Main effects | Wrong estimates/setpoints → mis-dispatch, power-sharing errors, BESS State of Charge (SoC) drift, voltage violations. | Net ±ΔP → RoCoF spikes, frequency/voltage deviations, reserve saturation, protective trips. |
| Detectability | Potentially stealthy when a ∈ col(H); requires physics-based cross-checks and robust/dynamic SE. | Appears as a disturbance; detectable via correlation across load ensembles and temporal signatures. |
| Timescale | Seconds–minutes (reporting/dispatch cycles), but can be faster for direct setpoint tampering. | Sub-seconds–minutes (step/ramp/pulsed coordination). |
| Indicators to monitor | Residuals with robust weighting; Kirchhoff’s Current Law/ Kirchhoff’s Voltage Law (KCL/KVL) parity checks; topology/state plausibility; SoC-power consistency; data provenance/authentication. | RoCoF, Δfpeak, synchronized load changes across feeders, reserve utilization, BESS saturation events. |
| Mitigation (examples) |
IEC 62351 security; authenticated reports/commands; robust SE using Adaptive Iterated Extended Kalman Filter/ Unscented Kalman Filter (AIEKF/UKF); sensor diversity and voting; allow-listed commands with rate limits. | Rate limits and bounds per feeder/aggregator; randomized actuation windows; signed demand-response (DR) signals; fast Under-Frequency Load Shedding (UFLS)/EV throttling; virtual inertia via BESS. |
Table 3.
Main parameters of the IEEE 33-bus feeder and integrated components in the microgrid.
| Component | Parameter | Nominal Value | Unit | Observtions |
| Nominal voltage | — | 12.66 | kV | Medium voltage level |
| Number of buses | — | 33 | — | Radial topology |
| Number of lines | — | 32 | — | Series connections between buses |
| Total load power | Ptot + jQtot | 3,715 + j2,300 | MVA | Typical distribution network |
| PV @ Bus 6 | SPV | 0.9 | MVA | Up to 1,0 MWp DC |
| BESS @ Bus 18 | SBESS | 0.8 | MVA | 1.6 MWh, SoC 20–90% |
| Source transformer | ST | 5.0 | MVA | Bus 1 (main substation) |
Table 5.
The structure of input files used in microgrid simulation (T1a–T1d).
| File name | Main content | Detailed description |
| T1a_lines.csv | Lines parametersr | Includes length [km], resistance [Ω/km], reactance [Ω/km] and susceptance of each section of the distribution network. File structure: (FromBus, ToBus, Length, R, X, B). |
| T1b_transformer.csv | Source transformer parameters | Contains the main interface transformer (Bar 1) data: rated power [MVA], primary/secondary voltages [kV], percentage impedance [%Z], no-load and load losses. |
| T1c_pv.csv | PV source parameters | Includes the characteristics of the PV module and the associated inverter: I–V curve, rated DC power [MWp], inverter efficiency [%], power factor (cos φ), droop slope and reactive limits. |
| T1d_bess.csv | BESS parameters |
Includes total capacity [MWh], rated power [MVA], charging/discharging efficiency [%], SoC limits (min/max) and control constants for droop and EMS. |
Table 6.
Hypothetical resilience scores.
| Resilience Function / Critical Infrastructure | Planning | Absorption | Recovery | Adaptation | Resilience Score (Rj) |
| Generation (solar + batteries) | 4 | 3 | 2 | 4 | 3.25 |
| Distribution (local grid) | 3 | 2 | 2 | 3 | 2.50 |
| Control / SCADA | 2 | 2 | 3 | 2 | 2.25 |
| Communications | 3 | 2 | 3 | 3 | 2.75 |
| Demand Response (DR) | 4 | 4 | 3 | 4 | 3.75 |
| GRI | 2.90 |
Table 7.
Main parameters of the steady state.
| Parameter | Symbol |
Average value |
Unit | Remarks | ||
| Minimum voltage | Vmin | 0.964 | p.u. | Bus 33 | ||
| Maximum voltage | Vmax | 1.000 | p.u. | Bus 1 | ||
| Injected PV power | PPV | 0.85 | MW | Cos φ ≈ 1 | ||
| Active grid losses | Ploss | 0.135 | MW | 3.6% of total | ||
| SoC medium BESS | SOCavg | 70 | % | standby regim | ||
Table 8.
Summary of performance indicators for the D1 scenario (mean values and standard deviations for three runs).
Table 8.
Summary of performance indicators for the D1 scenario (mean values and standard deviations for three runs).
| Indicator |
Bazic Regime |
D1 Scenario | Improvement (%) | Interpretation |
| VDI | 0.094 ± 0.012 | 0.069 ± 0.010 | –26.6 | Improved voltage profiles |
| ENS [kWh] | 18.3 ± 2.1 | 16.1 ± 1.9 | –12.0 | Reducing unsupplied energy |
| GRI | 0.82 ± 0.04 | 0.91 ± 0.03 | +10.9 | Increasing operational resilience |
Disclaimer/Publisher’s Note: The statements, opinions and data contained in all publications are solely those of the individual author(s) and contributor(s) and not of MDPI and/or the editor(s). MDPI and/or the editor(s) disclaim responsibility for any injury to people or property resulting from any ideas, methods, instructions or products referred to in the content. |
© 2025 by the authors. Licensee MDPI, Basel, Switzerland. This article is an open access article distributed under the terms and conditions of the Creative Commons Attribution (CC BY) license (http://creativecommons.org/licenses/by/4.0/).
Copyright: This open access article is published under a Creative Commons CC BY 4.0 license, which permit the free download, distribution, and reuse, provided that the author and preprint are cited in any reuse.


