Submitted:
11 November 2025
Posted:
13 November 2025
You are already at the latest version
Abstract
The assurance of worker safety protocol adherence and secure cargo transit in complex open-channel settings constitutes a cornerstone of operational integrity for port logistics hubs. Yet, traditional supervision methods—manual inspections or passive video monitoring—suffer from high labor costs, limited coverage, and poor real-time responsiveness. These limitations become more severe in complex environments with frequent occlusions, drastic scale variations, and multi-camera transitions, where existing detection and tracking systems often fail, leading to unstable identity association and missed risk events.To overcome these challenges, this paper proposes CSPC-BRS, a lightweight real-time multi-object detection and tracking framework. (CSPC denotes the integrated CASAM, SPPELAN-DW, and CACC modules, and BRS stands for Bounding Box Reduction Strategy). On the detection side, CASAM (Channel and Spatial Attention Module), SPPELAN-DW (a multi-scale aggregation structure with depthwise convolution), and CACC (Convolutional Attention Channel Combination) are integrated into the YOLOv8 backbone to enhance feature extraction and robustness under low-quality imagery and cluttered backgrounds. On the tracking side, a Bounding-box Resizing Strategy (BRS) mitigates target scale distortion, while a Multi-Dimensional Re-identification Scoring (MDRS) mechanism fuses six features—color, texture, shape, motion, size, and time—to achieve reliable cross-camera identity consistency.Experiments on multi-camera port surveillance scenarios confirm that CSPC-BRS achieves high identity preservation and superior occlusion recovery. Compared with baseline models, it improves mAP@0.5 by 2.9%, mAP@0.5:0.95 by 9.6%, and FPS by 21.1%, while reducing false alarms by 59.7%. These results demonstrate that CSPC-BRS balances accuracy and real-time performance, offering a practical and deployable solution for intelligent safety monitoring in industrial logistics environments.
Keywords:
intelligent port surveillance
; multi‐object detection and tracking
; cross‐camera tracking
; YOLOv8
; attention mechanism
; Bounding Box Resizing Strategy (BRS)
; Multi‐Dimensional Re‐ Identification (MDRS)
1. Introduction
In real-world industrial environments, such as port terminals and logistics hubs, ensuring that workers wear protective equipment correctly and that vehicles comply with operational regulations is fundamental to maintaining production safety and operational efficiency [1]. However, current safety supervision methods still rely heavily on manual inspections or passive video review, which are labor-intensive, limited in coverage, and incapable of providing real-time, continuous monitoring. These limitations are further exacerbated in complex open channel scenarios characterized by challenging illumination, frequent occlusions, and highly dynamic interactions between personnel and vehicles. Under such conditions, human supervision often fails to promptly detect safety violations (e.g., unauthorized e-bikes, workers without helmets), necessitating the development of intelligent algorithms capable of performing accurate, real-time multi-object detection and tracking (MOT) to enhance the automation and reliability of industrial safety management.
The computer vision community has made significant strides in object detection and tracking, largely driven by deep learning. Pioneering detection frameworks like Faster R-CNN [2], SSD [3], and the YOLO series [4] have established strong baselines for performance and speed. In particular, YOLOv8 [5] offers an excellent balance of accuracy and efficiency, making it a suitable backbone for real-time applications. Concurrently, attention mechanisms have emerged as a powerful tool to enhance feature representation. As surveyed by Guo et al. [6], these mechanisms, including channel and spatial attention, dynamically modulate feature weights, significantly boosting performance in tasks like image classification and object detection. Techniques such as the Convolutional Block Attention Module (CBAM) [7] and subsequent variants have been successfully integrated into deep networks to suppress irrelevant features and focus on critical regions.
In the pursuit of real-time performance, several studies have focused on optimizing model architecture. For instance, Cho and Kim's Selective Attention Network (SANet) [8] demonstrated robust detection in complex industrial settings, while Zhou's YOLO-NL [9] incorporated a non-local attention mechanism to improve multi-scale detection. To further reduce computational overhead, depthwise separable convolutions [10] have been widely adopted to create more efficient network designs without substantial performance loss.
In the domain of multi-object tracking, methods like DeepSORT [11] and ByteTrack [12] have become benchmarks. DeepSORT enhances the SORT algorithm[13] by integrating appearance descriptors via a deep association metric, improving long-term tracking. ByteTrack demonstrates the importance of associating every detection box, including low-score ones, to reduce identity switches. Other approaches, such as the fusion of 2D LIDAR and camera data [14] or the combination of enhanced kernelized correlation filters with YOLO [15], highlight the trend towards multi-modal and hybrid tracking solutions for improved robustness.
Despite these advancements, critical challenges remain when deploying these technologies in complex, open industrial environments like port bridges. First, while attention mechanisms improve feature extraction, their integration often increases computational complexity, hindering real-time performance [16]. Second, existing detection models still struggle with multi-scale feature fusion under conditions of severe occlusion, lighting variation, and low contrast between targets and background [17]. Third, in tracking, frequent occlusions and the parallel or intersecting motion of multiple targets often lead to persistent issues of target loss and identity (ID) switching [18]. Methods like ByteTrack show progress but can fail when targets undergo significant perspective changes or prolonged occlusion. Finally, there is a notable gap in achieving consistent identity association across multiple camera views in such vast and complex settings, as most tracking algorithms are designed for single-camera scenarios.
To address these multifaceted challenges, this study proposes CSPC-BRS(a framework integrating the CASAM, SPPELAN-DW, and CACC modules with the Bounding Box Reduction Strategy), a novel framework that synergistically combines an enhanced YOLOv8-based detector with an optimized Bot-SORT tracker, specifically designed for the complexities of open channel surveillance. Our key contributions are as follows:
- An Enhanced Detection Architecture: We integrate a Channel and Spatial Attention Module (CASAM) into the YOLOv8 backbone and replace the original SPPF with a Spatial Pyramid Pooling Efficient Layer Aggregation Network with Depthwise Convolution (SPPELAN-DW). This combination strengthens multi-scale feature extraction and fusion under challenging conditions while maintaining high inference speed. Furthermore, we introduce Convolutional Attention Channel Combination (CACC) modules in the neck network to better utilize critical features and suppress background noise.
- A Robust Tracking Strategy with Bounding Box Stabilization: We incorporate an optimized Bot-SORT algorithm enhanced by a novel Bounding Box Reduction Strategy (BRS). This strategy dynamically adjusts bounding box dimensions based on motion prediction and historical data, effectively mitigating target loss and ID switches for fast-moving and intersecting objects.
- A Comprehensive Multi-Dimensional Re-identification Mechanism: To address cross-camera tracking, we propose a Multi-Dimensional Re-Identification Similarity (MDRS) mechanism. It fuses six key attributes—color, texture, shape, motion, size, and temporal consistency—into a weighted similarity score, significantly improving ID consistency across different viewpoints and under occlusion.
2. Approaches
2.1. Processes and Frameworks
To address the challenges of identity switching, scale distortion, and environmental interference in cross-camera tracking within river-port logistics environments, this paper proposes the CSPC-BRS framework, whose overall architecture is illustrated in Figure 1. The framework integrates three core components: an enhanced detection module, a multi-dimensional re-identification module, and an adaptive tracking module. The process begins with the CSPC detection module, which incorporates three key sub-modules—CASAM (Channel and Spatial Attention Module), SPPELAN-DW (Spatial Pyramid Pooling Efficient Layer Aggregation Network with Depthwise Convolution), and CACC (Convolutional Attention Channel Combination)—to achieve robust feature extraction and target localization under challenging conditions such as reflection, low contrast, and adverse weather. The detected objects are then forwarded to the BRS tracking module, which employs a bounding-box rescaling strategy to dynamically adjust for size variations caused by viewpoint changes, thereby maintaining consistent target proportions across different camera views. Simultaneously, the MDRS (Multi-Dimensional Re-Identification Scoring) module computes a similarity score by fusing six feature dimensions: color, texture, shape, motion, size, and time. This score is used for cross-camera identity association, ensuring reliable ID preservation even under occlusion or perspective shift. By synergistically combining detection, re-identification, and tracking, CSPC-BRS achieves high-confidence, low-identity-switch multi-camera object tracking, providing a dependable technological foundation for intelligent safety management in port logistics systems.
2.2. CSPC-BRS Detection Model
The YOLO family of models has revolutionized the computer vision landscape, spurring ongoing efforts to refine and extend their capabilities. Among these, YOLOv8, unveiled by Ultralytics on January 10, 2023, stands out for its exceptional recognition accuracy and remarkable processing speed, surpassing earlier iterations such as YOLOv5, YOLOv6, and YOLOv7. To tailor YOLOv8 for superior performance in open and dynamic environments, we introduce two innovative modules—CASAM and SPPELAN-DW—into its backbone network. Additionally, we optimize the neck network by substituting the conventional Conv modules with our novel CACC modules. This strategic enhancement, illustrated in Figure 2, refines feature extraction and improves the model's contextual understanding, resulting in a more robust and accurate detection system designed for real-world applications.
2.2.1. CASAM Attention Mechanism
The CASAM module represents a tailored attention approach designed to augment the feature extraction prowess of YOLOv8's backbone network. This innovative module integrates multiple attention mechanisms and channel-wise reordering strategies, effectively mitigating the challenges posed by environmental factors like varying lighting conditions, weather patterns, and occlusions in open channels. The visualization of the CASAM module is shown in Figure 3, providing a comprehensive overview of its components.
The channel attention mechanism within CASAM operates globally, aggregating channel-wise feature information through Global Average Pooling (GAP). It then applies two fully connected layers to generate channel-specific attention weights, as formulated in Eq. (1). Unlike traditional channel attention methods such as CBAM, the proposed mechanism employs a more refined weighting strategy and efficient feature fusion, enabling it to selectively enhance discriminative features essential for the target task.
In Eq.(1), represents the input feature map, GAP denotes the Global Average Pooling operation that spatially compresses to produce a channel descriptor vector. W₁ and W₂ are the weight matrices of the two fully connected layers, which first reduce and then restore the channel dimension to capture cross-channel interactions. ReLU is the Rectified Linear Unit activation function, and σ denotes the Sigmoid activation function, which normalizes the output into attention weights between 0 and 1.
Furthermore, the Self-Attention mechanism, illustrated in Eq.(2), bolsters the internal correlations within the feature map by capturing long-range dependencies across different regions. This is achieved by transforming the feature map into a format conducive to Multi-head Self-Attention, enabling the model to comprehend complex feature interactions that may be overlooked by global context-only approaches like GAM[19].
In Eq.(2), Q, K, and V are the Query, Key, and Value matrices, respectively, which are linear projections of the input feature map. The term QKᵀ computes the similarity score between each query and all keys. is the dimensionality of the key vectors, and the scaling factor is used to prevent the softmax function from entering regions of extremely small gradients. The softmax function normalizes the similarity scores to create attention weights, which are then used to generate a weighted sum of the value matrix V.
The Spatial Attention mechanism, as detailed in Eq.(3), refines the spatial representation of the feature map by generating spatial attention weights through a series of convolutional operations. By combining average and max pooling, this mechanism accentuates salient spatial regions, thereby enhancing the model's sensitivity to critical spatial features.
In Eq.(3), is the input feature map. AvgPool and MaxPool denote average-pooling and max-pooling operations applied along the channel axis, respectively, resulting in two 2D spatial feature maps. These maps are then concatenated along the channel dimension, denoted by [·, ·]. Conv represents a standard convolution operation that performs a fusion on the concatenated feature maps. Finally, σ is the Sigmoid function that produces the spatial attention weights.
To further increase the robustness of the learned features, CASAM incorporates a channel reordering module. This module applies a structured, differentiable permutation to the channel groups, effectively acting as a regularizer that mitigates co-adaptation of feature detectors. By compelling the network to learn from a dynamically reconfigured channel arrangement, it fosters the development of more generalized and disentangled representations, thereby improving generalization capability in complex open environments.
While the components of CASAM (channel attention, spatial attention, self-attention) are established individually, our key innovation lies in their novel integration strategy and the introduction of a channel reordering mechanism. Unlike CBAM which applies channel and spatial attention in a sequential manner, CASAM employs a more parallelized and efficient structure. More importantly, the channel reordering operation, performed before the attention computations, is a deliberate design to break the fixed channel dependencies and force the model to learn more robust feature representations. This prevents the network from over-relying on a specific set of channels and enhances feature diversity, which is crucial for handling the high variability in open bridge environments. This specific combination and the reordering strategy are, to the best of our knowledge, novel for the target detection task in complex industrial scenarios.
2.2.2. SPPELAN-DW Aggregation Network
The innovative SPPELAN-DW Aggregation Network, as shown in Figure 4, enhances the YOLOv8 backbone by replacing the traditional SPPF module shown in Figure 4 with a seamless integration of Depthwise Separable Convolution[20] and Spatial Pyramid Pooling (SPP) methodologies[21]. This strategic combination not only improves the model's feature extraction capabilities but also enhances its ability to represent features at multiple scales, all while maintaining impressive real-time performance standards.
The process begins with a careful refinement of input features using depthwise convolution layers. This meticulous approach is designed to reduce computational overhead and the number of parameters while preserving the important details of the input imagery. This initial refinement sets the stage for further enhancements.
Subsequently, a set of interconnected convolutional layers significantly enhances the nonlinear transformation capabilities of the features. These layers perform two rounds of 3x3 depthwise convolutions, refining the initial features into a richer and more complex representation.
The feature map then embarks on a multi-scale journey through three carefully calibrated max-pooling layers, each utilizing different kernel sizes while maintaining a consistent stride. This parallel pooling approach, likened to a symphony of scales, captures the essence of features at various resolutions, enabling the model to discern nuances across diverse scales.
The culmination of this multi-scale journey results in the seamless integration of all pooled feature maps along the bridge dimension, integrating the feature maps to form a unified multi-scale representation. This unified feature map is then processed through a 1x1 convolution layer, where bridge compression and feature fusion work together to distill the essence of the multi-scale features into a compact yet powerful representation.
Our SPPELAN-DW module is an evolution of the SPPF module in YOLOv8, optimized explicitly for real-time performance. The core innovation is the replacement of standard convolutions with Depthwise Separable Convolutions (DWConv) throughout the feature refinement and multi-scale pooling pathways. This design choice directly addresses the trade-off between receptive field and computational cost. By leveraging DWConv, we significantly reduce the number of parameters and floating-point operations (FLOPs) compared to a standard SPP/SPPF module, while maintaining a rich multi-scale feature representation. This makes SPPELAN-DW not just a combination of SPP and DWConv, but a lightweight, efficiency-oriented redesign that is essential for achieving high FPS in our real-time application.
2.2.3. CACC Convolutions
While the neck network in YOLOv8 effectively integrates multi-scale features, its standard convolutions lack a mechanism to dynamically recalibrate channel-wise feature responses. This limits their ability to suppress less relevant channels and amplify critical ones, a function that is essential for mitigating false positives in cluttered open environments where target features are subtle. To address this, we introduce the CACC module.
To address this challenge and bolster YOLOv8's feature fusion prowess and representational capability in challenging scenarios, we propose an innovative substitution: integrating CACC Attention-augmented Convolutional) convolutions into the neck network. This innovative module synergizes convolution operations with a sophisticated approach to channel attention mechanisms, refining the utilization of crucial features and amplifying their representational power.
The CACC's modus operandi commences with a standard convolutional layer, which meticulously processes input features to generate foundational feature maps. This layer operates with meticulous consideration of kernel sizes, strides, padding schemes, grouping factors, and dilation rates, ensuring a nuanced transformation of the input. Subsequently, a Batch Normalization layer refines these preliminary maps, bolstering training stability and enhancing the model's ability to generalize to unseen data.
Following normalization, a non-linear activation function (defaulting to SiLU but configurable as needed) introduces non-linearity, enhancing the model's ability to recognize complex patterns. Central to CACC’s design is its channel attention mechanism, which dynamically assesses the importance of each channel, assigning higher weights to those most relevant for the detection task. This weighting is achieved via global average pooling followed by two fully connected layers, producing a set of calibrated attention weights.
These weights are then multiplied with the initial feature maps, emphasizing informative channels while suppressing less useful ones. This recalibration sharpens the model's focus on task-relevant features and reduces confusion between target and background characteristics, thus lowering false positives and false negatives. The resulting refined feature maps—now incorporating channel-wise emphasis—are combined with the original features through element-wise multiplication, preserving original feature integrity while incorporating attention-guided enhancements.
In essence, the CACC module distinguishes itself from the classic SE-Net [22] and its variants through its deep integration of attention within the convolutional block and its specific role in the network architecture. While SE-Net performs feature recalibration after a convolution, CACC fuses the attention mechanism directly into the convolutional process within the neck network. This creates a more cohesive unit for feature refinement and fusion. Its placement in the neck is strategic; it acts as a "feature filter" right before multi-scale feature maps are combined, effectively suppressing irrelevant background features and amplifying critical target features at different scales. This targeted application for cross-scale feature purification in the neck network, rather than general feature enhancement in the backbone, is a key contribution of our work.
2.3. BRS
In open channels, the dynamic nature of targets—characterized by viewpoint variations, occlusions, and varying velocities—induces significant fluctuations in the apparent size and shape of bounding boxes. These fluctuations are a primary cause of identity switches (ID switches) and tracking failures, particularly when targets intersect or move in parallel. To address this fundamental challenge, we propose a novel Bounding Box Reduction Strategy (BRS) that unifies a Kalman Filter-based motion prediction with a Bayesian inference framework for size adaptation. The core innovation of BRS lies in its treatment of the bounding box dimensions not as direct observations, but as random variables to be estimated based on both predictive motion models and noisy visual measurements.
2.3.1. Kalman Filter for Motion State Prediction
The BRS employs a Kalman filter to maintain a stable estimate of the target's kinematic state, which forms the prior for our subsequent bounding box adjustment. We define the state vector at time as , encompassing the bounding box center coordinates , their velocities , the width and height , and their rates of change .
The standard Kalman filter recursion, as given in Eq.(4), provides the optimal estimate of this state.
Here, is the state transition matrix, and are the process and observation noise covariance matrices, is the Kalman gain, and is the observation matrix. The filter outputs a predicted state and a corresponding covariance , which quantifies the uncertainty of this prediction.
2.3.2. Bayesian Inference for Bounding Box Refinement
The Kalman filter provides a prediction for the entire state, including the bounding box dimensions . However, the raw detection often provides a noisy and unstable estimate of size, especially under occlusion or perspective distortion. We therefore formulate the problem of finding the optimal bounding box size as one of Bayesian inference, where we seek the posterior distribution of the true dimensions given all observed data .
We define the components of Bayes' theorem (Eq.(5)) for our specific task:
Prior : We use the Kalman filter's predicted dimensions from to form a Gaussian prior: . The covariance is extracted from the relevant elements of , encapsulating the prediction uncertainty.
Likelihood :: This term models the probability of observing the current detector's output given a hypothetical true size . We model this as , where is a fixed covariance matrix representing the detector's inherent noise.
Under these Gaussian assumptions, the posterior is also Gaussian. The mean of this posterior, which is the optimal estimate under a minimum mean squared error criterion, is given by a convex combination of the prior mean (Kalman prediction) and the observation (detector output), weighted by their respective precisions (inverse covariances).
2.3.3. The BRS Update Rule
Solving for the posterior mean leads to our final BRS update rule (Eq.(6)). For a single dimension (e.g., width ), the update can be expressed as:
A simplified and highly effective instantiation of this principle, which we empirically validate, is to dynamically blend the previous box size with the predicted size, tempered by a confidence term based on the alignment between the predicted and detected target centers. This leads to our final formulation:
as a size conservation term, anchored to the previous stable estimate . The exponential term is a confidence weight based on the Euclidean distance between the detected center and the Kalman-predicted center . A large discrepancy (indicating potentially unreliable detection, e.g., due to occlusion) reduces the weight of the previous state, allowing the prediction to dominate.
is the innovation term from the Kalman filter's prediction , scaled by the adjustment coefficient . It proactively adjusts the size based on the target's modeled dynamics.
The parameter (0 to 1.0) controls the influence of the motion model, while modulates the sensitivity to localization errors. This formulation is a principled approximation of the Bayesian posterior, ensuring that the bounding box remains stable during unreliable detections while adapting proactively to predictable size changes, thereby directly mitigating the root causes of ID switches.
2.4. MDRS
To achieve robust cross-camera identity consistency in challenging port environments, we propose a Multi-Dimensional Re-identification Similarity (MDRS) mechanism. This mechanism integrates six complementary feature dimensions—color, texture, shape, motion, size, and temporal consistency—to compute a robust matching score between object instances across different camera views. The final similarity score is a weighted fusion of individual similarity scores from each dimension, the weights were initially set based on empirical analysis of feature stability in our environment, and then fine-tuned through a grid search on the validation set to maximize the IDF1 score.
The specific steps include the following steps:
- (1)
- Color similarity: calculates the cosine similarity of multi-channel color features such as RGB, HSV, and grayscale;
- (2)
- Texture similarity: extract grayscale texture and edge texture information (such as Sobel edges);
- (3)
- Shape similarity: use complexity and aspect ratio to model shape consistency;
- (4)
- Motion direction similarity: the consistency of relative direction is calculated based on the center point velocity vector of the front and back frames;
- (5)
- Dimensional similarity: Calculate regional scale consistency based on the difference in aspect ratio;
- (6)
- Time similarity factor: According to the dynamic attenuation effect of time difference, it avoids long-term target mismatch.
This mechanism computes individual similarity scores across each feature dimension and applies a weighted fusion strategy to derive a final confidence score for cross-camera matching. The feature components are extracted from consecutive frames across different camera perspectives, and the matching score is used in the ID association stage of CSPC-BRS.
The final scoring formula is defined as:
where the weights are fixed as , , , , , and . This formula is implemented in Algorithm 1, which outlines the end-to-end process for computing the multi-dimensional similarity between two target observations.
Pseudo-code of the algorithm is presented in Algorithm 1.
| Algorithm1: Multi-Dimensional Re-ID Similarity Mechanism |
| Input: |
| - Feature1, Feature2: Feature vectors of two targets |
| - Motion1, Motion2: Velocity vectors |
| - Size1, Size2: Object sizes (area or diagonal length) |
| - TimeDiff: Frame interval between observations |
| Output: |
| - FinalScore: Aggregated similarity score |
| - ScoreDict: Individual similarity components |
| 1: Initialize ScoreDict = empty dictionary |
| 2: if color features exist: |
| 3: HSVsim = CosineSim(Feature1.color.HSV, Feature2.color.HSV) |
| 4: RGBsim = CosineSim(Feature1.color.RGB, Feature2.color.RGB) |
| 5: Graysim = CosineSim(Feature1.color.Gray, Feature2.color.Gray) |
| 6: ScoreDict["Color"] = Average(HSVsim, RGBsim, Graysim) |
| 7: else: |
| 8: ScoreDict["Color"] = 0 |
| 9: if texture features exist: |
| 10: Graysim = CosineSim(Feature1.texture.Gray, Feature2.texture.Gray) |
| 11: Edgesim = CosineSim(Feature1.texture.Edges, Feature2.texture.Edges) |
| 12: ScoreDict["Texture"] = Average(Graysim, Edgesim) |
| 13: else: |
| 14: ScoreDict["Texture"] = 0 |
| 15: if shape features exist: |
| 16: Complexity = 1 - |C1 - C2| / max(C1, C2, ε) |
| 17: Aspect = 1 - |AR1 - AR2| / max(AR1, AR2, ε) |
| 18: ScoreDict["Shape"] = Average(Complexity, Aspect) |
| 19: else: |
| 20: ScoreDict["Shape"] = 0 |
| 21: if motion features exist: |
| 22: ScoreDict["Motion"] = VectorSim(Motion1, Motion2) |
| 23: else: |
| 24: ScoreDict["Motion"] = 0 |
| 25: ScoreDict["Size"] = min(Size1/Size2, Size2/Size1) |
| 26: TimeFactor = max(0, 1 - TimeDiff / 120) |
| 27: ScoreDict["Time"] = TimeFactor |
| 28: FinalScore = |
| 0.4 * ScoreDict["Color"] + |
| 0.2 * ScoreDict["Texture"] + |
| 0.15 * ScoreDict["Shape"] + |
| 0.15 * ScoreDict["Motion"] + |
| 0.05 * ScoreDict["Size"] + |
| 0.05 * ScoreDict["Time"] |
| 29: return FinalScore, ScoreDict |
2.5. Evaluation Metrics
This comprehensive study meticulously evaluates the performance of the network model by employing a diverse array of metrics, each tailored to assess different aspects of the model's effectiveness. Key among these are recall, precision, and mean Average Precision (mAP@0.5) across multiple categories, offering a nuanced understanding of the model's ability to accurately classify various objects or entities. Additionally, computational complexity is analyzed to gauge the model's efficiency, ensuring practicality for real-world applications.
To further underscore the model's suitability for real-time usage, Frames Per Second (FPS) is utilized as a crucial benchmark. As defined in Eq.(9), FPS quantifies the number of frames the model can process per second, taking into account the cumulative time required for pre_processing, inference, and post_processing. In our experiments, the time for each stage is measured in milliseconds (ms). This holistic approach ensures that not only is the model's accuracy evaluated but also its speed, which is paramount for seamless integration into dynamic environments.
Specifically, precision is calculated as the ratio of true positives (TP) to the sum of true positives and false positives (FP), indicating the model's precision in identifying positive samples. Recall, on the other hand, measures the model's ability to find all positive samples, expressed as the ratio of true positives to the total number of positive samples (including both true positives and false negatives, FN).
Average Precision (AP) integrates precision across varying recall levels, providing a more nuanced view of the model's performance. By averaging AP across all categories (mAP), a single score encapsulates the overall performance across multiple tasks, making it a valuable metric for comparing different models.
Finally, the inclusion of FPS as a performance metric underscores the study's commitment to evaluating the model's practicality for real-time applications. By considering the total time required for pre_processing, inference, and post_processing, the study ensures that the model's speed is assessed holistically, accounting for the full range of operations involved in deploying the model in practice.
In summary, this study employs a rigorous and multifaceted approach to evaluating the performance of the network model, ensuring that both accuracy and real-time capability are thoroughly assessed and validated.
3. Results and Analysis
3.1. Dataset
The dataset employed in this study was specifically constructed to address the challenges of safety monitoring in real-world port logistics environments. It comprises 3,150 real-scene images collected through a collaborative project with a port company in Anhui Province, China. The images were sourced from surveillance videos and historically captured violation records across four distinct open channels, ensuring the data reflects a wide spectrum of actual operational conditions. To build a representative and diverse dataset capable of handling the complexities of the target environment—including significant scale variations, mutual occlusions, varying lighting conditions, and diverse viewpoints—we extracted frames from the video streams and applied data augmentation techniques (e.g., random rotation, brightness adjustment, and noise injection) to enhance the model's robustness and generalization capability.
A rigorous categorization framework was devised, encompassing seven distinct label categories essential for port safety monitoring: helmet, head, person, truck, fake_helmet, tricycle, and bicycle. To ensure a balanced assessment, the dataset was meticulously partitioned into training, validation, and testing subsets following a 7:2:1 ratio, yielding 2,205 images for training, 630 for validation, and 315 for testing.
Figure 5 provides a comprehensive statistical overview of the dataset. The top-left quadrant illustrates the categorical distribution of instances, revealing a notable disparity in the proportion of truck instances, which is attributable to their larger target size and lower frequency in the operational scene. Conversely, the top-right quadrant showcases the distribution of bounding boxes, highlighting the substantial variations in target sizes and the presence of overlaps, which underscores the challenging nature of target representations in this environment.
Furthermore, the scatter plot in the bottom-left corner depicts the distribution of target center positions, demonstrating their relatively even spread across the image space. This even distribution confirms the dataset's ability to represent targets appearing in various locations within the field of view. Lastly, the scatter plot in the bottom-right corner focuses on the width and height distribution of the targets, revealing a preponderance of small- and medium-sized targets. This prevalence poses a unique challenge for accurate detection and localization, further validating the dataset's complexity and practical relevance.
3.2. Experimental Environment and Parameter Settings
The experimental environment configured for this research endeavor is detailed in Table 1, showcasing a robust computing infrastructure tailored for deep learning applications. The system operates seamlessly on the Windows 10 operating system, harnessing the computational prowess of an Intel(R) Core(TM) i5-9300H processor and an NVIDIA GeForce RTX 1650 GPU for accelerated training and inference. The PyTorch 1.13.0 framework serves as the backbone, facilitating the development and deployment of our deep learning models.
To ensure optimal performance, meticulous attention was paid to the parameter settings employed in our experiments, as summarized in Table 2. Leveraging the enhanced feature extraction and fusion capabilities of our model, we were able to achieve swift convergence with a reduced number of training iterations, culminating in exceptional detection and tracking capabilities. Consequently, the training regimen was configured with 100 epochs, ensuring thorough exploration of the dataset while minimizing overfitting risks.
Furthermore, the input image size (imgsz) was meticulously set to 640 pixels, balancing computational efficiency with sufficient resolution for precise target localization. To optimize the learning process, we opted for the Stochastic Gradient Descent (SGD) optimizer, renowned for its robust convergence properties in deep learning tasks. Key hyperparameters were carefully tuned, with an Intersection over Union (IoU) threshold of 0.6 chosen to balance precision and recall, and a momentum of 0.937 employed to accelerate convergence in relevant directions while dampening oscillations.
3.3. Detection Results and Comprehensive Analysis
The loss function, serving as a pivotal metric, quantifies the discrepancy between the model's forecasts and the ground truth values, thereby exerting a direct influence on the overall performance of the detection model. As depicted in Figure 6, a discernible trend emerges during the training and validation phases, where the constituent losses—encompassing box_loss, cls_loss, and dfl_loss—undergo a gradual decline and eventually stabilize. This progression signifies the model's relentless convergence towards optimal parameters, ensuring that the prediction errors are minimized.
Furthermore, the model's Precision and Recall metrics, which are crucial indicators of its detection prowess, exhibit remarkable values nearing 0.9 and 0.95, respectively, at the culmination of the training process. These high figures underscore the model's exceptional ability to accurately identify true positives while minimizing false negatives, thereby demonstrating a robust detection accuracy and recall capability.
To provide a more comprehensive assessment of the model's performance, we also evaluate it using the mean Average Precision (mAP) metric at various Intersection over Union (IoU) thresholds. Specifically, the model achieves an mAP@0.5 score of approximately 0.95, indicating a strong performance in detecting objects with a high degree of overlap with the ground truth. Moreover, the mAP@0.5:0.95 score of approximately 0.6 demonstrates the model's resilience and adaptability across a broader range of IoU thresholds, further validating its comprehensive detection capabilities.
In summary, the consistent decline and stabilization of loss functions, coupled with the impressive Precision, Recall, and mAP scores, collectively attest to the effectiveness and robustness of the proposed detection model. These results not only underscore the model's ability to accurately detect objects but also highlight its potential for real-world applications where high detection accuracy and recall are paramount.
A confusion matrix serves as a comprehensive visualization tool for assessing the algorithmic performance, offering insights into how well the model distinguishes between different classes. In this matrix, each row meticulously represents the actual class distribution, whereas each column portrays the model's predicted class outcomes. Notably, the elements aligned along the main diagonal hold paramount importance, as they signify the number of correctly classified samples, commonly referred to as True Positives (TP).
Delving deeper, the lower-left triangular region of the matrix unveils a crucial aspect of the model's performance—False Negatives (FN). These represent instances where the model fails to detect actual samples, inadvertently misclassifying them as belonging to other categories or overlooking them entirely. This region highlights the model's limitations in recognizing certain targets, potentially leading to unrecognized or mislabeled objects.
Conversely, the upper-right triangular region encapsulates False Positives (FP), instances where the model erroneously classifies background elements or samples from different categories as belonging to the current category. A high density of FP values indicates that the model may suffer from a higher rate of spurious detections, mistakenly identifying non-target objects as belonging to the current class.
As evidenced in Figure 7a, the robust presence of elements along the main diagonal underscores the high degree of accuracy achieved by our detection model across most categories. For instance, the "helmet" category boasts a TP of 323, and the "person" category achieves an impressive TP of 655, testifying to the model's exceptional ability to discern these targets from others. Notably, even in the challenging "fake_helmet" category, characterized by its similarity to "head" and "helmet," the model manages to maintain a relatively low level of both false and missed detections.
Expanding on this analysis, Figure 7b provides a more nuanced view of the model's performance by presenting the accuracy for each category. The "helmet" category achieves an accuracy of 95%, the "person" category surpasses with 96%, and the "truck" category attains a perfect score of 100%, underscoring the model's remarkable performance across these domains. However, a closer inspection of the normalized matrix also reveals nuances in the model's behavior. Specifically, the "background" category experiences a 0.26 probability of being misclassified as "person" and a 0.21 probability of being mislabeled as "head," indicating that ambient noise and background complexities in real-world scenarios can still pose challenges to the model's classification accuracy. Nonetheless, these findings serve as valuable insights for future model refinements and optimizations to further enhance its robustness and performance.
3.3.1. Ablation Experiment
To meticulously assess the individual and collective contributions of our proposed modules—SPPELAN-DW, CASAM, and CACC—to the overall performance of our model, we designed and executed a comprehensive ablation study. By systematically incorporating and excluding these modules within the YOLOv8 framework, we delved into their specific impacts on both detection accuracy, measured by mAP@0.5 and the more stringent mAP@0.5~0.95, and processing speed, quantified by frames per second (FPS). The findings of this rigorous experimentation are summarized in Table 3.
Table 3 presents the ablation study results, where each row represents a unique configuration of the modules. The checkmark (√) signifies the inclusion of a module, whereas the cross (×) denotes its exclusion. The standalone integration of SPPELAN-DW not only elevated the mAP@0.5 to 0.931 but also bolstered the FPS to 129.47, underscoring its pivotal role in enhancing both detection precision and computational efficiency. Similarly, the introduction of CASAM alone significantly improved the mAP@0.5~0.95 to 0.610, emphasizing its effectiveness in boosting accuracy across a broader range of IoU thresholds.
The CACC module, when integrated, demonstrated a dual benefit, elevating both the mAP@0.5 to 0.932 and FPS to 126.54, highlighting its ability to harmoniously optimize both accuracy and speed. The synergistic effect of combining CASAM and CACC was evident, with the mAP@0.5 soaring to 0.938 and FPS achieving an impressive 142.30, despite a marginal dip in mAP@0.5~0.95, which remained at a high level.
The pairing of SPPELAN-DW and CACC yielded an mAP@0.5 of 0.936 coupled with an exceptional FPS of 146.64, showcasing their complementary strengths in accelerating processing while preserving accuracy. Likewise, the combination of SPPELAN-DW and CASAM struck a fine balance between accuracy (mAP@0.5 = 0.935) and speed (FPS = 144.21), further validating the efficacy of our proposed modules.
Ultimately, the harmonious integration of all three modules—SPPELAN-DW, CASAM, and CACC—culminated in the optimal configuration, achieving the highest mAP@0.5 of 0.949, an elevated mAP@0.5~0.95 of 0.625, and a remarkable FPS of 149.35. This outcome underscores the profound impact of our modular design, where each component contributes uniquely yet synergistically to elevate the detection capabilities and processing efficiency of our model in open channels, thereby demonstrating the effectiveness of our approach.
3.3.2. Comparative Experiment
To rigorously evaluate the detection performance of the proposed CSPC-BRS algorithm, we conducted comprehensive comparative experiments against several state-of-the-art detectors, including YOLOv5-n, YOLOv6-n, YOLOv7-n, YOLOv8-n, RT-DETR-R18, PP-YOLOE+-s, and NanoDet-Plus. This systematic evaluation aimed to provide a thorough performance analysis across different architectural paradigms.
Figure 8 illustrates the learning trajectories of all compared models throughout the training process. Our CSPC-BRS model demonstrates rapid convergence in mAP@0.5 during the initial training phase, establishing a strong foundation early on. After approximately 20 epochs, it maintains a stable improvement trajectory, consistently outperforming all other methods. In contrast, while the YOLO series models show reasonable convergence trends, they exhibit noticeable performance fluctuations in later training stages. The CSPC-BRS model ultimately achieves the highest mAP@0.5 of 0.949 within 100 epochs, demonstrating superior training stability and convergence behavior.
As quantitatively demonstrated in Table 4, the proposed CSPC-BRS architecture achieves an optimal balance between computational efficiency and detection accuracy. Compared to the YOLOv8-n baseline, our model shows only a modest increase in computational requirements—parameters increase from 3.0M to 3.6M (20% increase) and FLOPs from 8.1 to 8.6 (6.2% increase)—while delivering substantial performance gains. Most notably, CSPC-BRS achieves a state-of-the-art mAP@0.5:0.95 score of 0.625, representing a significant 9.6% improvement over YOLOv8-n's 0.570.
The comprehensive comparison reveals several important insights. The transformer-based RT-DETR-R18 underperforms in our specific application scenario, achieving lower accuracy than YOLOv8-n despite higher computational costs, suggesting that pure transformer architectures may require further optimization for complex industrial environments. PP-YOLOE+-s shows competitive performance with a 1.6% improvement over YOLOv8-n, but our method maintains a clear 8.0% advantage. Notably, NanoDet-Plus, while extremely efficient, suffers from a substantial 20.7% accuracy drop, rendering it unsuitable for precision-critical applications.
Analysis of computational resource utilization demonstrates that model complexity alone doesn't guarantee performance. YOLOv7-n, with the highest parameter count (6.0M) and computational demand (13.2 GFLOPs), achieves the lowest mAP@0.5:0.95 among the YOLO series. Our CSPC-BRS shows a 40% reduction in parameters and 34.8% decrease in FLOPs compared to YOLOv7-n, while delivering 19.9% superior detection accuracy, highlighting the effectiveness of our architectural design choices.
The real-time performance analysis in Table 5 provides crucial insights for practical deployment. Our CSPC-BRS framework achieves 149.35 FPS, representing a 21.2% improvement over YOLOv8-n (123.25 FPS) and outperforming other detectors including PP-YOLOE+-s (118.34 FPS) and RT-DETR-R18 (106.38 FPS). While NanoDet-Plus achieves the highest FPS (238.10), this comes at the cost of severely compromised accuracy (-20.7% in mAP@0.5:0.95 versus YOLOv8-n), making it impractical for safety-critical applications requiring high detection precision.
The experimental results demonstrate that through systematic integration of enhanced feature extraction (CASAM), efficient multi-scale context aggregation (SPPELAN-DW), and optimized feature fusion (CACC), our CSPC-BRS framework maintains robust performance across varying object scales and complex backgrounds while delivering superior frame rates. This confirms its practical viability for deployment in mission-critical infrastructure inspection systems.
To comprehensively evaluate the robustness and detection performance of the CSPC-BRS algorithm in complex open channel environments, we selected four representative scenarios (a, b, c, d) from the validation set imagery. For visual comparison clarity, we focused on comparing CSPC-BRS against the YOLO series models (YOLOv5-n, YOLOv6-n, YOLOv7-n, and YOLOv8-n), as these architectures share similar design paradigms, enabling more straightforward visual analysis of detection differences.
Figure 9 clearly demonstrates the superior performance of CSPC-BRS across all test scenarios. In scenario (a), characterized by an employee wearing a hat resembling a helmet amidst inclement weather and obstructions, YOLOv5-n and YOLOv6-n failed to detect the "fake_helmet" target entirely. While YOLOv7-n and YOLOv8-n successfully identified the target, both models generated false positives by misclassifying it as a genuine "helmet." In contrast, CSPC-BRS accurately identified the "fake_helmet" with high confidence, effectively eliminating false positives through its refined feature extraction capabilities and the effective Bounding Box Reduction Strategy (BRS).
Scenario (b) presented a challenging situation with overlapping targets, where a "person" was partially occluded by a "tricycle," and a small "helmet" blended with the background. In this case, YOLOv5-n and YOLOv6-n exhibited significant missed detections, failing to identify multiple targets. YOLOv7-n and YOLOv8-n demonstrated improved detection capability but with notably lower confidence scores and less precise bounding box localization compared to CSPC-BRS. Our method achieved significantly higher confidence scores and more accurate bounding boxes, demonstrating its exceptional capability in handling occlusion and detecting small objects.
Scenarios (c) and (d), featuring inadequate lighting conditions and significant target size variations, further revealed the limitations of the baseline models. YOLOv5-n and YOLOv6-n consistently showed the poorest performance with numerous missed detections across these challenging conditions. While YOLOv7-n and YOLOv8-n exhibited comparable detection performance to each other, both suffered from inconsistent confidence scores and occasional false positives. The proposed CSPC-BRS, empowered by its multi-level attention mechanism and optimized feature fusion, maintained robust detection performance with high confidence scores and minimal false positives even under low-light conditions and with varying target sizes.
The visual comparative analysis unequivocally confirms that CSPC-BRS achieves the most stable and reliable detection performance across diverse environmental challenges. While YOLOv5-n and YOLOv6-n suffer from substantial missed detections, and YOLOv7-n/YOLOv8-n exhibit inconsistent performance with false positives, our method consistently outperforms all YOLO variants in terms of both detection accuracy and confidence stability, demonstrating its practical advantage for real-world deployment in complex port environments.
3.3.3. Actual Detection Results
To comprehensively evaluate the robustness and efficacy of our detection model, we conducted a rigorous validation process by randomly selecting 16 representative images from the test set. These images encompassed a broad spectrum of challenging scenarios, including umbrella occlusion, extreme lighting conditions (both overly bright and dim), substantial variations in target sizes, and intricate instances where target features closely resemble those of the background.
As depicted in Figure 10, our detection model triumphantly identified all targets within these intricate images. This remarkable achievement stems from the model's sophisticated feature fusion and expression capabilities, which empower it to dynamically modulate feature intensity and meticulously extract crucial information from multi-scale features. This adaptability enables the model to effectively discern targets from their surroundings, even in the most complex of scenarios.
Furthermore, the integration of multi-scale feature extraction and deep convolutional layers significantly bolstered the model's representational power and computational efficiency. This enhancement allowed the model to seamlessly handle the challenges posed by varying target sizes and intricate environmental factors, ensuring consistent and accurate detections across the board.
In summary, the actual detection results presented in this section underscore the exceptional performance of our detection model in real-world applications. By leveraging advanced techniques such as enhanced feature fusion, multi-scale feature extraction, and deep convolutional processing, our model has demonstrated its ability to overcome even the most daunting of detection challenges, thereby validating its suitability for practical deployment in complex open channels.
3.4. Model Tracking Results and Analysis
3.4.1. MDRS Weight Ablation Experiment
To validate the scientific rationale behind the weight assignment in the Multi-Dimensional Re-identification Similarity (MDRS) mechanism, we conducted a systematic ablation study on the validation set. This experiment aimed to quantitatively evaluate the contribution of each feature dimension to cross-camera target re-identification performance and determine the optimal weight combination through empirical analysis.
A baseline configuration with uniform weights (1/6 ≈ 0.167 for each feature) was established to provide a neutral reference point, where no single feature dimension received preferential treatment. This baseline allows for clear measurement of performance improvements achieved through optimized weight allocation,As shown in Table 6.
The experimental results provide several key insights into feature importance for cross-camera re-identification. Configuration A emerged as the optimal weighting scheme, achieving the highest IDF1 score of 0.829, which represents an 11.9% improvement over the uniform baseline.
The color-only configuration demonstrated that color features alone provide substantial discriminative power (+5.5% over baseline), confirming their status as the most stable and distinctive feature in port environments. However, the superior performance of Configuration A over the color-only approach highlights the importance of complementary features.
Comparative analysis of the configurations reveals the delicate balance required in weight assignment. Configuration B (emphasizing texture) and Configuration C (emphasizing color) both showed respectable improvements (+10.0% and +10.8% respectively) but fell short of the optimal balance achieved in Configuration A. The performance degradation in Configuration D (reduced shape weight) and Configuration E (reduced motion weight) further underscores the importance of maintaining appropriate weights for these complementary features.
The critical role of motion consistency is evident from the 2.9% performance gap between Configuration A and Configuration E, demonstrating that motion features provide essential spatiotemporal context for cross-camera association. Similarly, texture and shape features serve as vital complements to color information, with Configuration A's assignment of 0.20 and 0.15 weights proving optimal.
Size and temporal features function effectively as regularization terms with their low weights (0.05 each). The removal of temporal constraints resulted in a 2.8% performance drop compared to Configuration A, demonstrating their importance in filtering physically implausible associations across extended time intervals.
This systematic ablation study provides empirical justification for our weight selection and confirms that Configuration A establishes an optimal balance that emphasizes the most discriminative features while maintaining complementary support from secondary features and necessary regularization terms. The proposed weighting scheme effectively captures the relative importance of each feature dimension for cross-camera re-identification in complex port environments.
3.4.2. Tracking Results for Vehicles
This section evaluates the tracking performance of our proposed CSPC-BRS framework under both single-camera and cross-camera scenarios. The tracking requirements differ based on vehicle type and operational context: for smaller vehicles like electric bicycles and tricycles, the primary concern is monitoring safety compliance (e.g., helmet usage, unauthorized entry) within localized areas, making single-camera tracking sufficient. However, for trucks involved in cargo transportation, ensuring operational safety requires continuous monitoring across multiple zones, necessitating robust cross-camera identity consistency.
Figure 11 presents a comparative analysis of tracking efficacy in a low-light, backlit open environment, evaluating our CSPC-BRS algorithm against the baseline YOLOv8+BoT-SORT. Under these challenging conditions, our CSPC-BRS framework successfully tracked all targets, including fast-moving bicycles and tricycles, maintaining a stable maximum ID count of 3 without any target loss. In stark contrast, the baseline model not only failed to correctly classify targets—misidentifying a bicycle as a person at frame 57—but also completely lost the trajectory of this target by frame 62. This misclassification and subsequent tracking failure underscore the baseline's limitations in handling complex visual scenarios.
The performance disparity is further evidenced in Figure 12, where the baseline model consistently failed to detect the person target throughout the sequence. Our CSPC-BRS, however, reliably maintained all tracks with high confidence and without any identity switches, even as the tricycle underwent increased occlusion. These results collectively demonstrate the superior robustness of our method in adverse lighting conditions and its enhanced capability for handling rapid motion and partial occlusions.
The superior performance stems from the integrated CASAM attention mechanism, SPPELAN-DW aggregation network, and CACC convolutional modules, which collectively enhance feature extraction and fusion capabilities. Additionally, the BRS strategy dynamically adjusts bounding box dimensions in response to velocity changes, significantly reducing target loss and ID switching.
To evaluate performance in cross-camera scenarios essential for monitoring cargo transportation safety, we designed an experiment tracking a truck across three surveillance cameras with significantly different viewpoints. Two cross-camera routes were established: Route 1 (camera1 to camera3) and Route 2 (camera2 to camera3).
As shown in Figure 13, CSPC-BRS maintained consistent ID assignment (ID=1) for the truck throughout both routes, despite significant viewpoint variations and visual distortions. In Route 1, when the truck re-emerged after temporary occlusion by a gantry crane, the baseline model failed to re-identify the target, assigning new IDs (2-4). In contrast, CSPC-BRS successfully preserved the original identity, demonstrating the effectiveness of its multi-feature Re-ID scoring mechanism and BRS-based scale adaptation.
The baseline algorithm consistently assigned new IDs when the truck appeared in camera3 from both routes, indicating limited capability in handling appearance changes across viewpoints. CSPC-BRS not only maintained ID continuity but also sustained high-confidence bounding boxes throughout the tracking sequence, validating its robust performance in dynamic multi-camera environments.
This experiment confirms the effectiveness of our multi-dimensional Re-ID mechanism in complex cross-view scenarios and demonstrates the BRS module's crucial role in compensating for scale variations, collectively enhancing tracking stability in practical logistics surveillance applications.
3.4.3. Evaluation of Employee Tracking in Open Channels
To quantitatively evaluate the tracking robustness of the proposed CSPC-BRS framework, we conducted a comparative study against the baseline YOLOv8+Bot-Sort under diverse challenging scenarios in open channels, with a focus on identity (ID) preservation and occlusion handling.
The superior performance of our method is vividly demonstrated in Figure 14, which encapsulates tracking outcomes across two representative scenarios. In a scenario with frequent inter-person occlusion, the baseline model exhibited significant fragility. As individuals crossed paths, the baseline system suffered from multiple identity switches, causing its maximum ID count to increase by 33.3% (from 6 to 8), indicating a failure to maintain consistent trajectories. In stark contrast, our CSPC-BRS framework, empowered by the BRS strategy, successfully maintained tracking continuity through the occlusion events, reducing the incidence of identity loss by 50% and demonstrating robust data association.
The advantage of our model becomes even more pronounced in highly complex environments characterized by strong illumination and persistent occlusions. In such demanding conditions, the baseline model struggled severely with both detection and tracking, failing to reliably identify safety helmets and suffering from rampant ID fragmentation. This led to a drastic 100% increase in the maximum ID count (from 12 to 24), rendering the tracking output unusable. Our proposed framework, however, proved highly resilient. It achieved stable detection despite the harsh lighting and, most importantly, successfully re-identified targets after prolonged occlusions (e.g., from frame 88 to 104), thereby limiting the maximum ID count to 13 and ensuring high-fidelity trajectory preservation.
In summary, the experimental results from multiple scenarios conclusively demonstrate that the integrated CSPC-BRS framework significantly enhances tracking stability and reliability. It substantially mitigates the critical challenge of identity switches in complex industrial settings, providing a more dependable solution for real-world safety monitoring applications.
3.5. Comprehensive Analysis of Actual Application Outcomes
To rigorously assess the practical efficacy of the CSPC-BRS algorithm under identical conditions, we conducted a controlled comparative experiment. Both the baseline model (YOLOv8+Bot-Sort) and our proposed CSPC-BRS model processed the same continuous three-month surveillance video footage from four distinct open channels (A, B, C, D). This ensured a direct and fair comparison of their performance over the exact same time period and operational scenarios.
Table 7 presents the comprehensive results. A key observation is that the CSPC-BRS model reported a substantially lower total number of violations across all locations compared to the baseline. For instance, at location A, the baseline model reported 2,122 violations, whereas the CSPC-BRS model identified only 1,797, a reduction of 15.3%. This reduction in the absolute count is not indicative of an increase in missed detections but is instead a direct consequence of the superior precision and tracking stability of our model. The significant reduction in false alarms can be primarily attributed to the CACC module in the neck network, which refines channel-wise features to suppress background noise, and the CASAM module in the backbone, which enhances the model's focus on discriminative target features under cluttered backgrounds. Concurrently, its propensity for identity switches (ID switches) often led to the same physical violation being counted multiple times as a new target. Our CSPC-BRS model, equipped with the CASAM attention mechanism and the BRS strategy, effectively suppresses these false alarms and maintains consistent target identities, thereby providing a more accurate and reliable count of actual violation events.
This interpretation is unequivocally supported by the false capture rate data. The CSPC-BRS model achieved a dramatically lower false capture rate across all locations (e.g., 1.45% at A vs. the baseline's 3.16%), representing an average reduction of 59.7%. This quantitative evidence confirms that the reduction in total violations is primarily due to the elimination of false positives, not the introduction of missed detections. The synergy of multi-level attention mechanisms, sophisticated feature fusion, and adaptive tracking strategies in CSPC-BRS endows the model with unparalleled robustness, enabling it to excel in complex port environments where the baseline model struggles.
4. Conclusions
The study concludes by presenting and validating the CSPC-BRS algorithm, an innovative approach that integrates an enhanced CSPC model with the Bounding Box Reduction Strategy (BRS) for real-time multi-target detection and tracking in open channels. This integration aimed to elevate detection accuracy, speed, and tracking stability, and it has achieved remarkable results in both theoretical and experimental evaluations.
The integration of CASAM, SPPELAN-DW, and CACC modules into the CSPC-BRS model significantly bolstered its feature extraction and fusion capabilities, leading to substantial improvements in detection precision and efficiency. Moreover, the BRS strategy effectively mitigated target loss and ID switching during challenging scenarios like pedestrian parallelism and crossing, enhancing tracking robustness.
Experimental outcomes underscore the CSPC-BRS algorithm's superiority in practical applications, across multiple open channels. Notably, it significantly decreased false capture rates and violation detections while maintaining high accuracy and stability even in low-light conditions, complex backgrounds, and target occlusion. These findings confirm the practical value and necessity of the proposed modules, underscoring the CSPC-BRS model's outstanding performance in complex environments.
Looking ahead, several avenues for future research emerge. Diversifying data augmentation strategies can further strengthen the model's environmental adaptability. Incorporating multimodal data may refine detection and tracking precision and stability. Additionally, exploring lightweight model designs could maintain detection accuracy while enhancing real-time performance and applicability. Lastly, extending the CSPC-BRS model's application to domains like intelligent transportation, autonomous driving, and security surveillance underscores its broad potential and opens up new avenues for practical implementation.
In essence, the CSPC-BRS model stands as a testament to its excellence in real-time multi-target detection and tracking, significantly enhancing accuracy and stability, thereby laying a solid foundation for practical deployments in open channel settings. Ongoing research and development promise to propel this field forward, unlocking even more practical scenarios and applications.
References
- W. Wang, J. Wang and B. Lei, The impact of allocation of hazard management resources in port system on occupational safety, Safety Science 173 (2024) 106430.
- S. Parvathi and S. T. Selvi, Detection of maturity stages of coconuts in complex background using Faster R-CNN model, Biosystems Engineering 202 (2021) 119–132.
- J. Ni et al., An improved SSD-like deep network-based object detection method for indoor scenes, IEEE Transactions on Instrumentation and Measurement 72 (2023) 1–15.
- Apostolidis, K.D.; Papakostas, G.A. Delving into YOLO Object Detection Models: Insights into Adversarial Robustness. Electronics 2025, 14, 1624. [Google Scholar] [CrossRef]
- M. Sohan et al., A review on YOLOv8 and its advancements, in International Conference on Data Intelligence and Cognitive Informatics (Springer, Singapore, 2024).
- M.-H. Guo et al., Attention mechanisms in computer vision: A survey, Computational Visual Media 8(3) (2022) 331–368.
- S. Woo et al., CBAM: Convolutional block attention module, in Proceedings of the European Conference on Computer Vision (ECCV) (2018).
- J. Cho and K. Kim, Detection of moving objects in multi-complex environments using selective attention networks (SANet), Automation in Construction 155 (2023) 105066.
- Y. Zhou, A YOLO-NL object detector for real-time detection, Expert Systems with Applications 238 (2024) 122256.
- F. Chollet, Xception: Deep learning with depthwise separable convolutions, in Proceedings of the IEEE Conference on Computer Vision and Pattern Recognition (2017).
- H. Yang et al., Multi-object tracking using Deep SORT and modified CenterNet in cotton seedling counting, Computers and Electronics in Agriculture 202 (2022) 107339.
- Y. Zhang et al., Bytetrack: Multi-object tracking by associating every detection box, in European Conference on Computer Vision (Springer Nature, Cham, 2022).
- Bewley, A.; Ge, Z.; Ott, L.; Ramos, F.; Upcroft, B. Simple Online and Realtime Tracking. In Proceedings of the 2016 IEEE International Conference on Image Processing (ICIP), Phoenix, AZ, USA, 25-28 September 2016; pp. 3464–3468. [Google Scholar] [CrossRef]
- H. Alai and R. Rajamani, Low-cost camera and 2-D LIDAR fusion for target vehicle corner detection and tracking: Applications to micromobility devices, Mechanical Systems and Signal Processing 206 (2024) 110891.
- D. Cai et al., Multi-objective tracking for smart substation onsite surveillance based on YOLO Approach and AKCF, Energy Reports 9 (2023) 1429–1438.
- Pan, H.; Zou, J.; Long, D.; et al. Efficient Mobile Road Defect Detection with Parameter-Reduced AL-YOLOv8s. In Proceedings of the 2024 China Automation Congress (CAC), Hangzhou, China, 18-20 October 2024; pp. 5066–5071. [Google Scholar] [CrossRef]
- Cao, Y.; Zhang, B.; Wang, C.; et al. Research on Small-Scale Face Detection Methods in Dense Scenes. *Appl. Intell.* **2025**, *55*, 1-14. [CrossRef]
- Lu, W.; Zhou, Z.; Zhang, L.; et al. Multi-Target Tracking by Non-Linear Motion Patterns Based on Hierarchical Network Flows. *Multimed. Syst.* **2019**, *25*, 12. [CrossRef]
- Liu, Y.; Shao, Z.; Hoffmann, N. Global Attention Mechanism: Retain Information to Enhance Channel-Spatial Interactions. *arXiv* **2021**, arXiv:2112.05561. arXiv:2112.05561.
- Chollet, F. Xception: Deep Learning with Depthwise Separable Convolutions. In Proceedings of the 2017 IEEE Conference on Computer Vision and Pattern Recognition (CVPR), Honolulu, HI, USA, 21-26 July 2017; pp. 1800–1807. [Google Scholar] [CrossRef]
- He, K.; Zhang, X.; Ren, S.; Sun, J. Spatial Pyramid Pooling in Deep Convolutional Networks for Visual Recognition. In *Computer Vision - ECCV 2014*; Fleet, D., Pajdla, T., Schiele, B., Tuytelaars, T., Eds.; Lecture Notes in Computer Science, Vol. 8691; Springer: Cham, Switzerland, 2014; pp. 346-361. [CrossRef]
- Hu, J.; Shen, L.; Albanie, S.; Sun, G.; Wu, E. Squeeze-and-Excitation Networks. *IEEE Trans. Pattern Anal. Mach. Intell.* **2020**, *42*, 2011–2023. [CrossRef]
- Jocher, G.; Chaurasia, A.; Stoken, A.; et al. Ultralytics/YOLOv5: v7.0 - YOLOv5 SOTA Real-Time Instance Segmentation. *Zenodo* **2022**. [CrossRef]
- Li, C.; Li, L.; Jiang, H.; et al. YOLOv6: A Single-Stage Object Detection Framework for Industrial Applications. *arXiv* **2022**, arXiv:2209.02976. arXiv:abs/2209.02976.
- Wang, C.-Y.; Bochkovskiy, A.; Liao, H.-Y.M. YOLOv7: Trainable Bag-of-Freebies Sets New State-of-the-Art for Real-Time Object Detectors. In Proceedings of the IEEE/CVF Conference on Computer Vision and Pattern Recognition, Vancouver, BC, Canada, 17-24 June 2023; pp. 7464–7475. [Google Scholar] [CrossRef]
- Jocher, G.; Chaurasia, A.; Qiu, J. YOLO by Ultralytics. 2023. Available online: https://github.com/ultralytics/ultralytics (accessed on 1 January 2024).
- Zhao, Y.; Lv, W.; Xu, S.; et al. DETRs Beat YOLOs on Real-Time Object Detection. *arXiv* **2023**, arXiv:2304.08069. arXiv:abs/2304.08069.
- Xu, R.; Wang, Y.; Wang, F.; et al. PP-YOLOE+: An Evolved Version of PP-YOLOE. *arXiv* **2022**, arXiv:2203.16250. arXiv:abs/2203.16250.
- Lyu, R. NanoDet-Plus: Super Fast and High Accuracy Lightweight Anchor-Free Object Detection Model. *GitHub Repository* **2021**. Available online: https://github.com/RangiLyu/nanodet (accessed on 1 January 2024).
Figure 1.
The CSPC-BRS Detection and Tracking Framework.
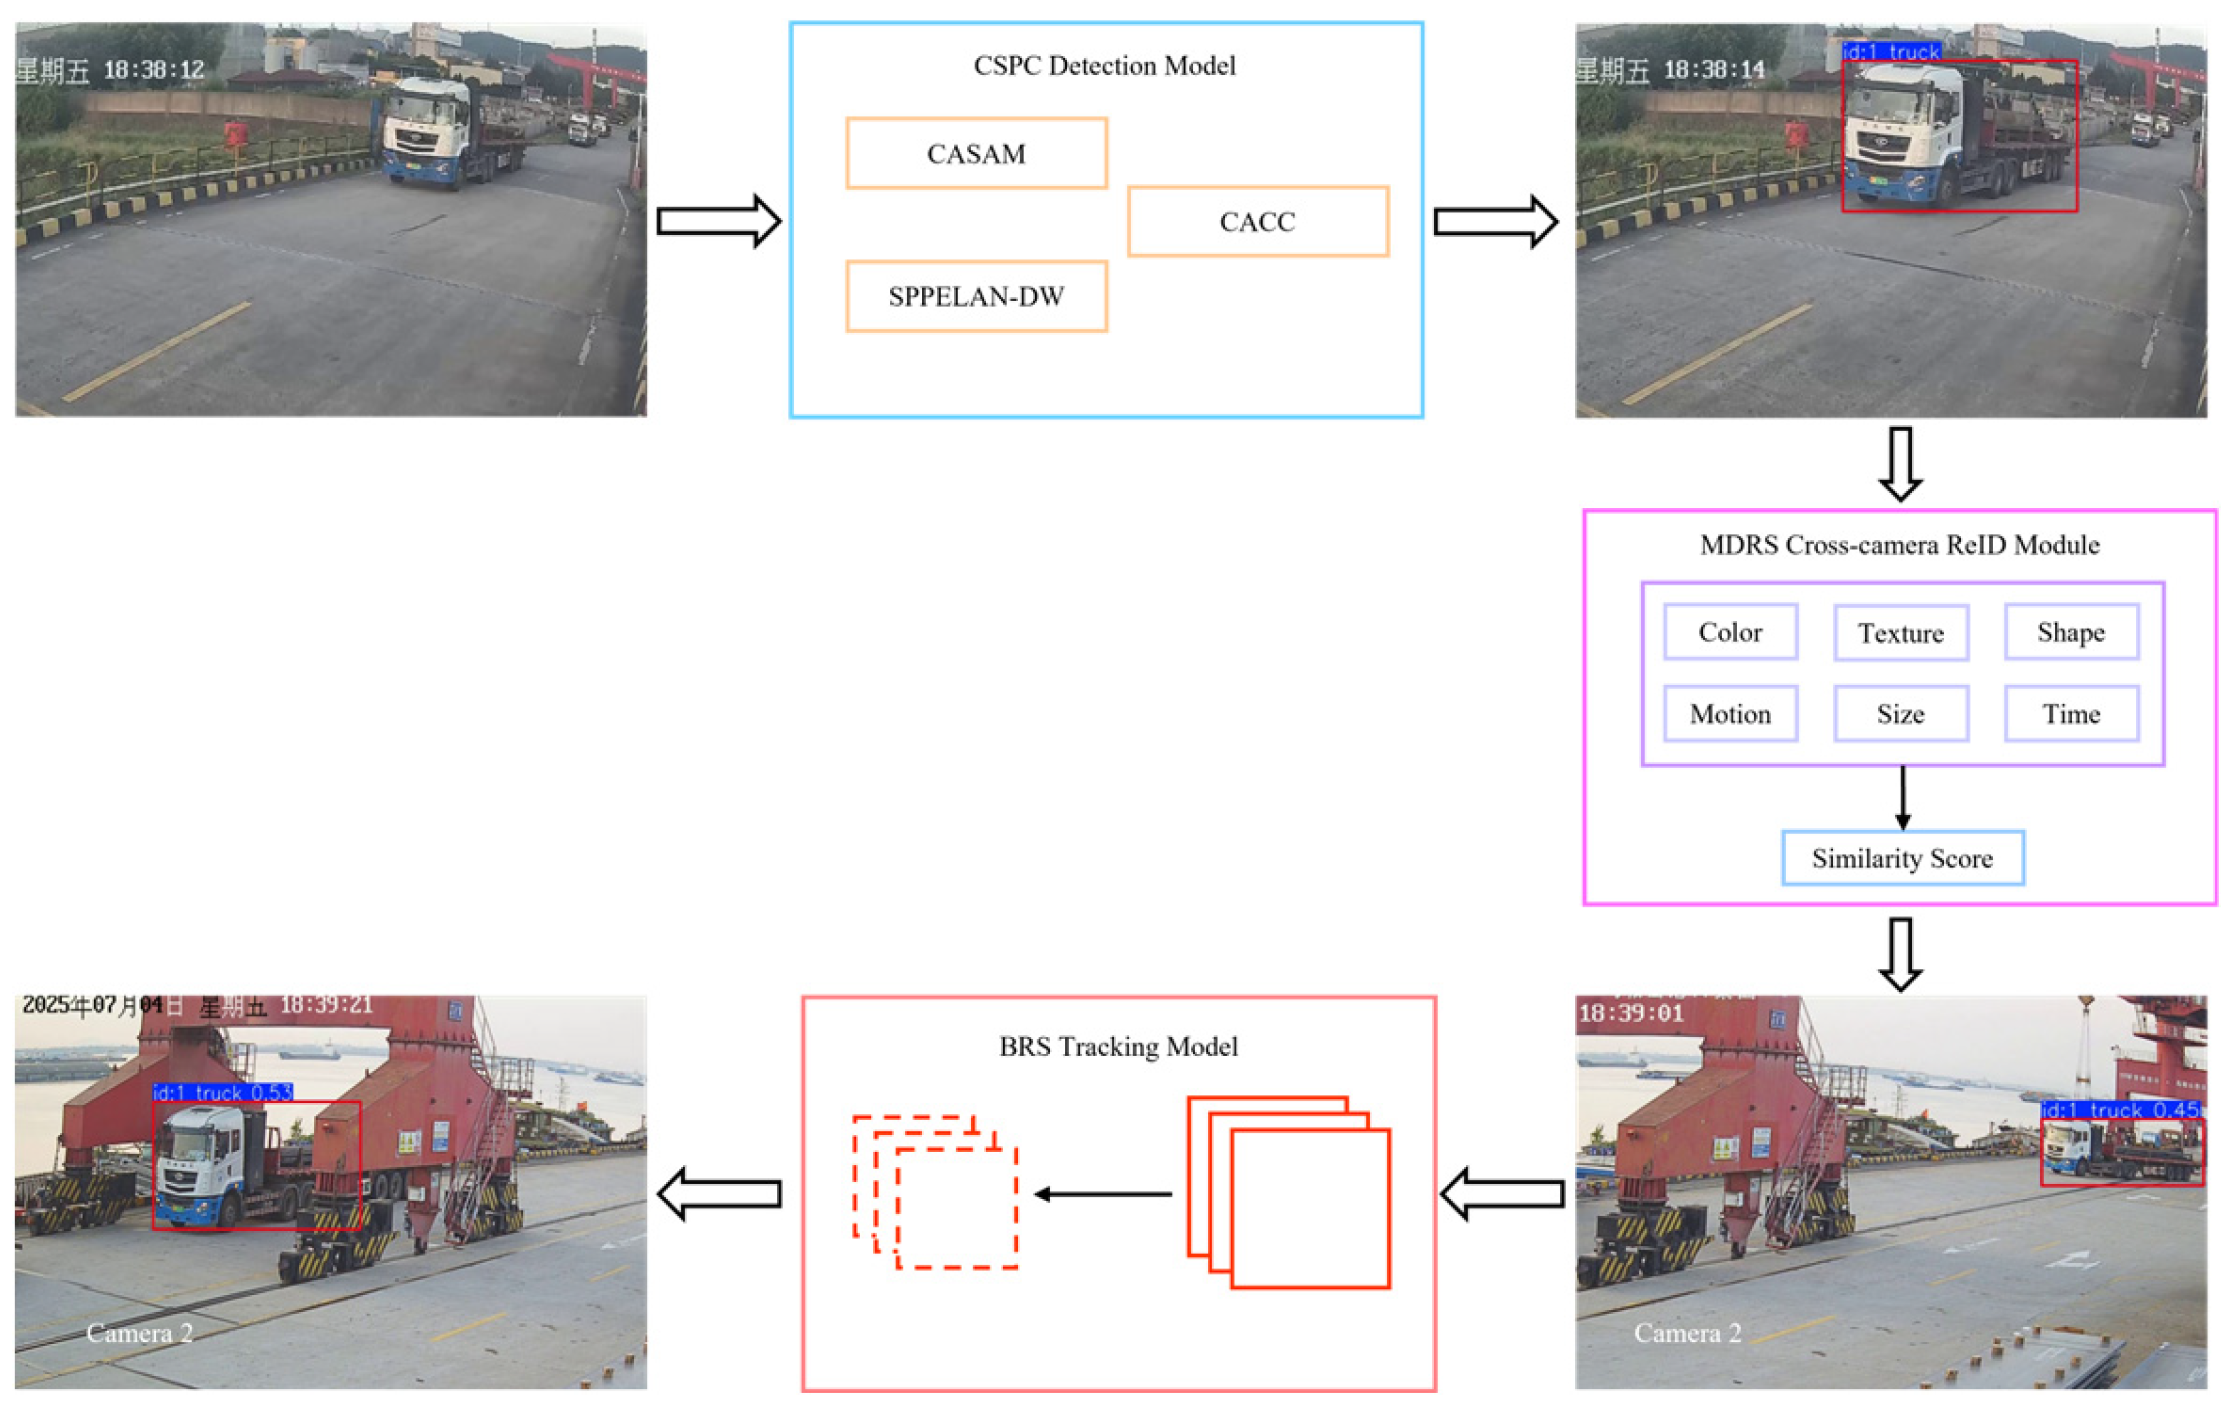
Figure 2.
YOLOv8-CSPC Network Architecture.
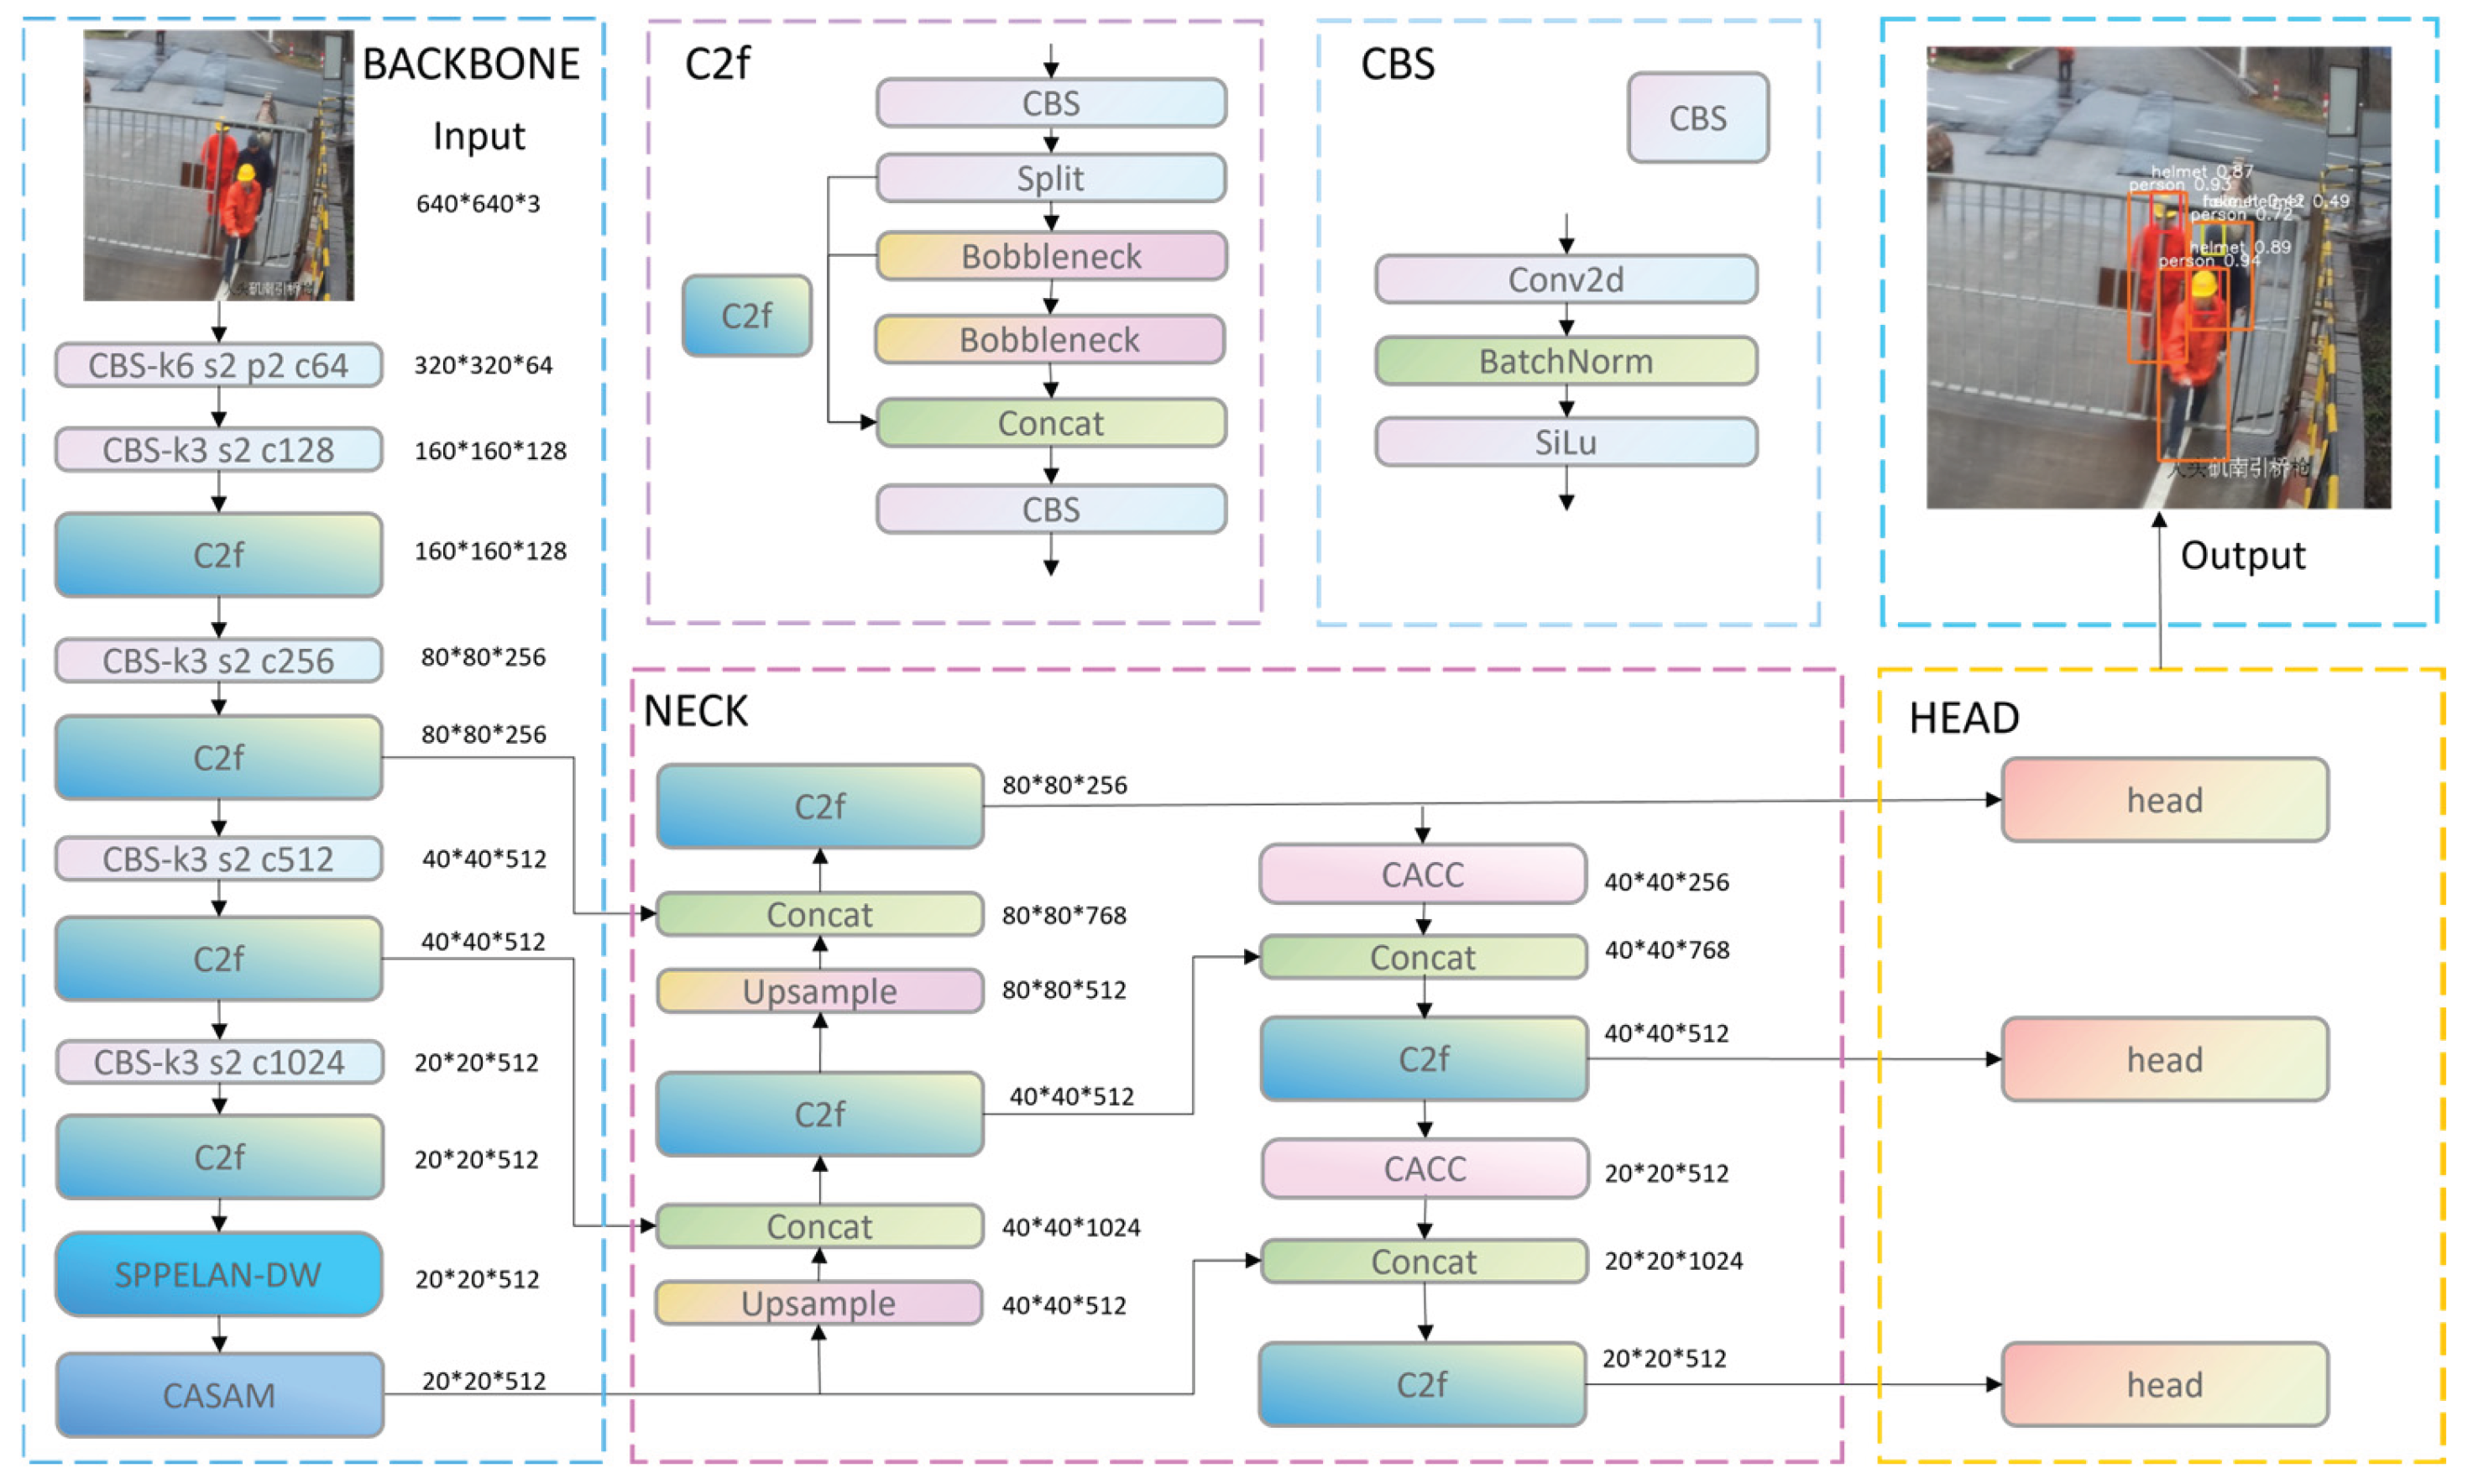
Figure 3.
CASAM Model.
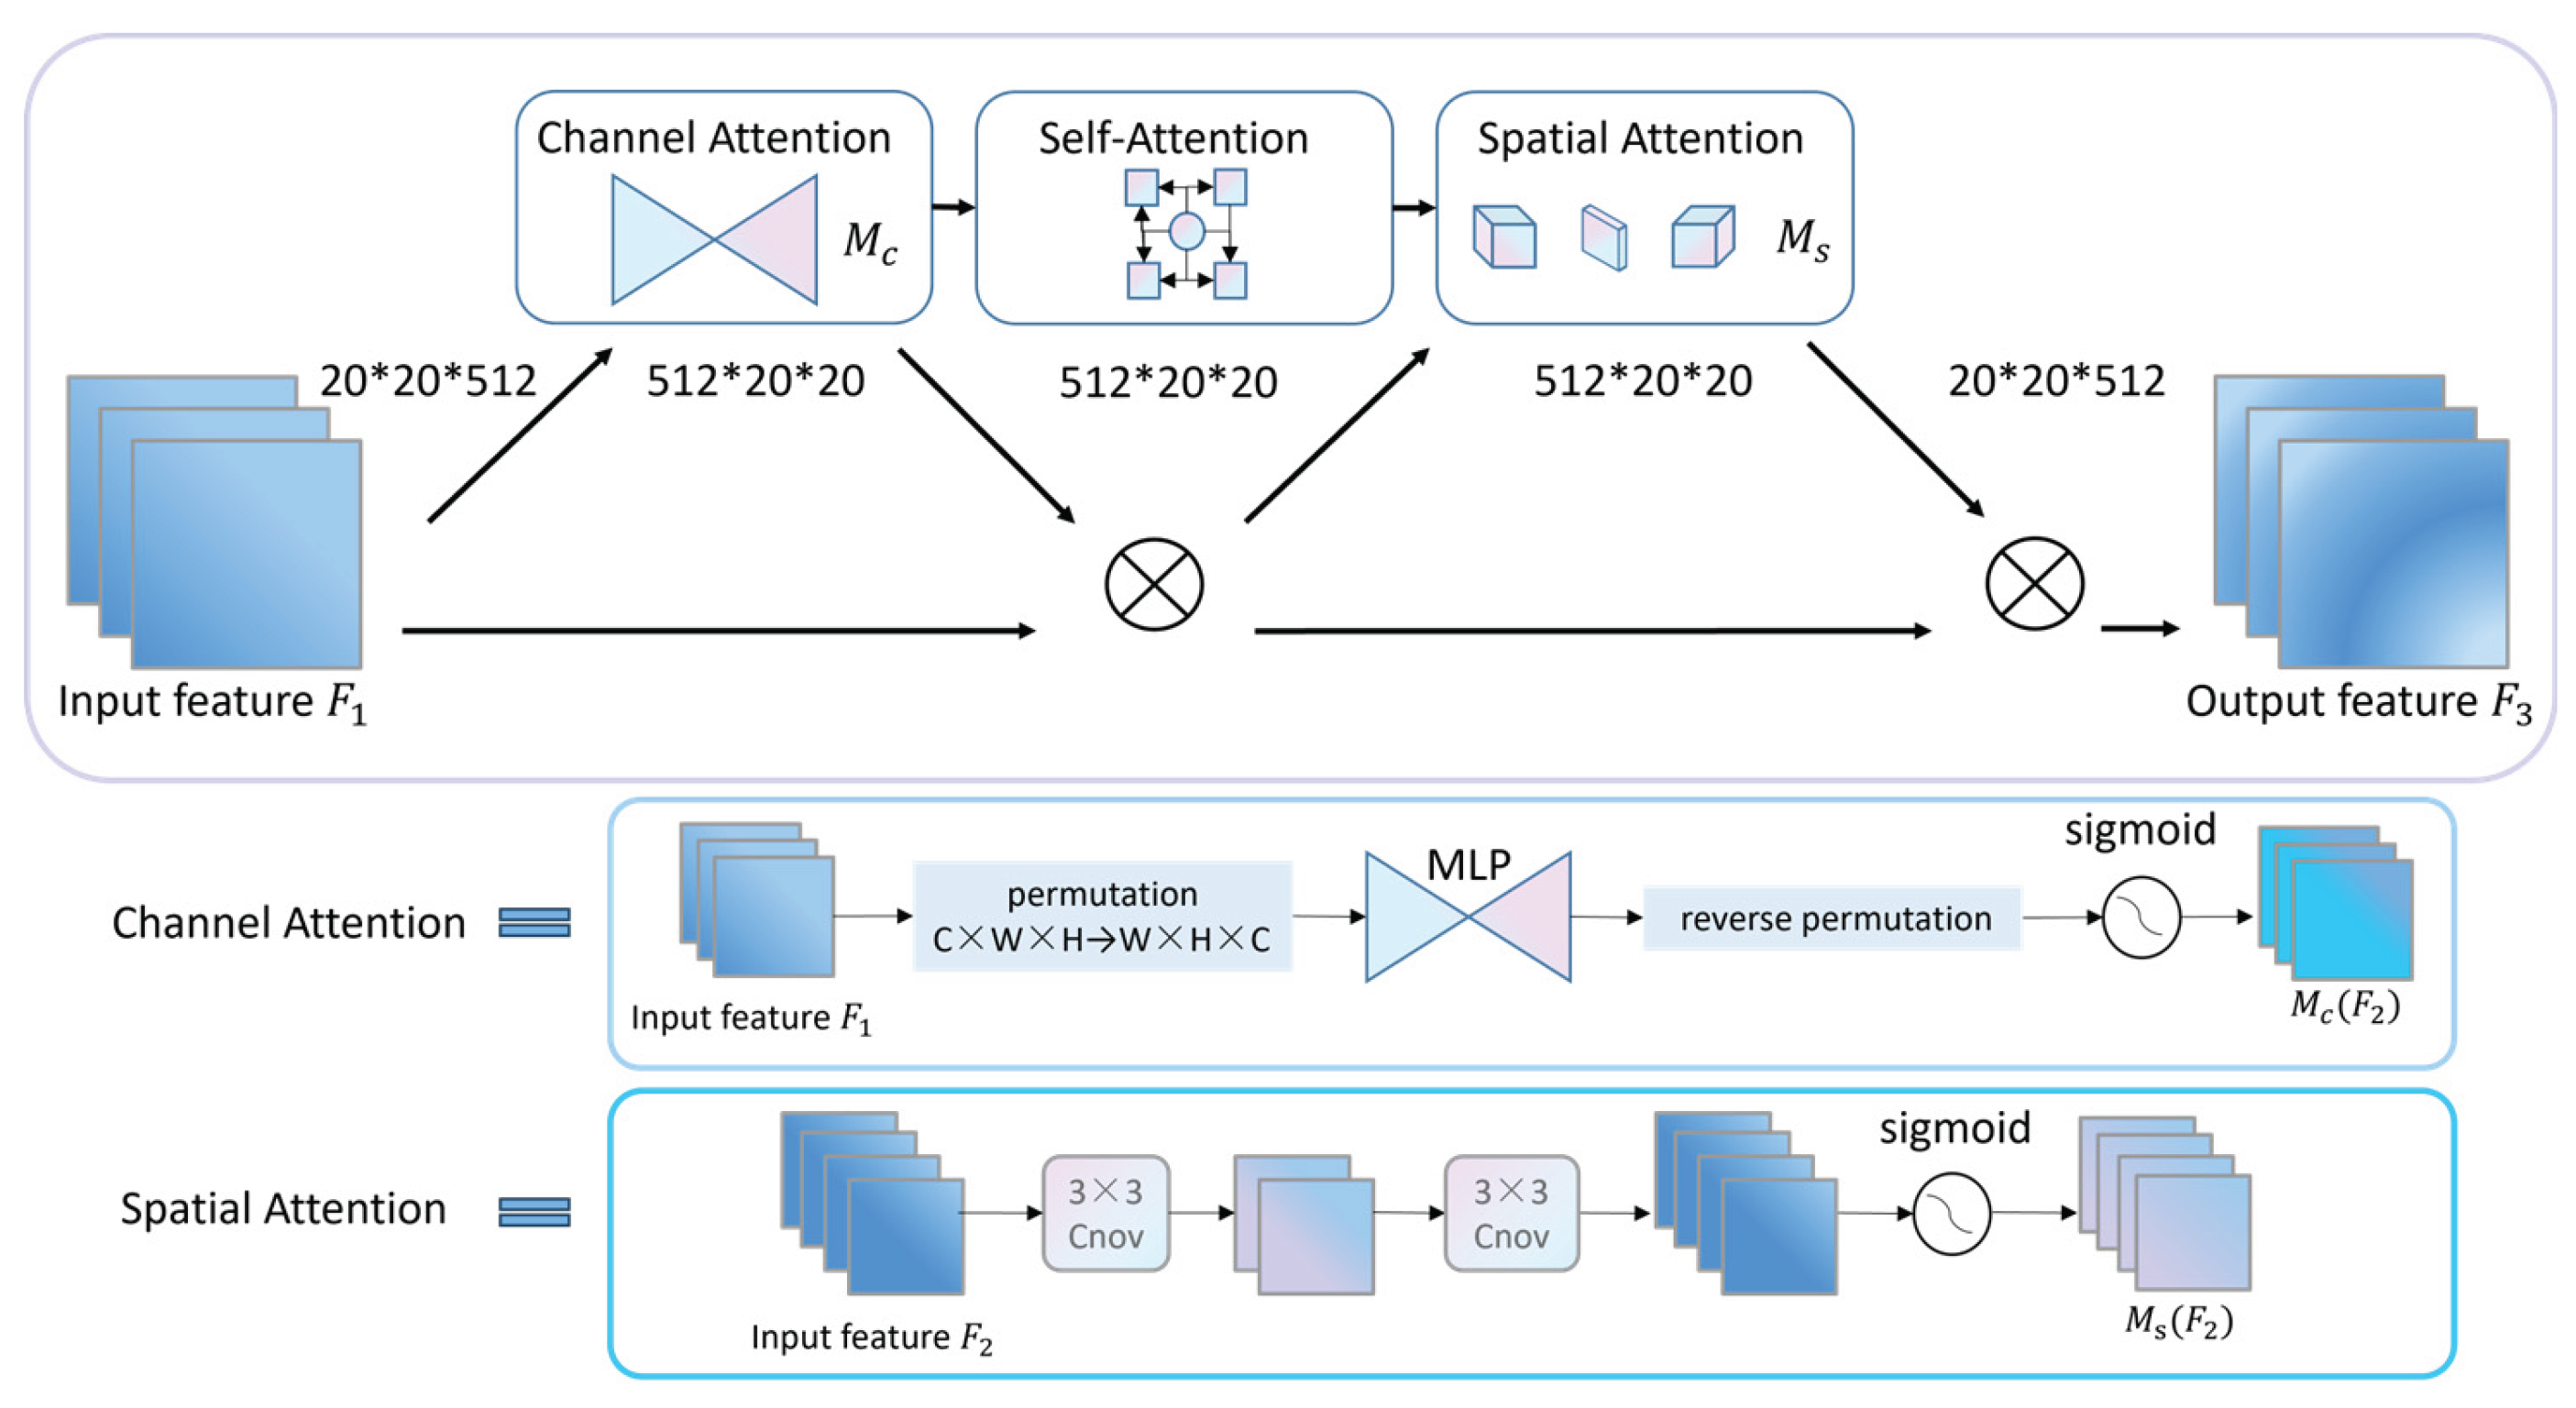
Figure 4.
SPPF and SPPELAN-DW Model.
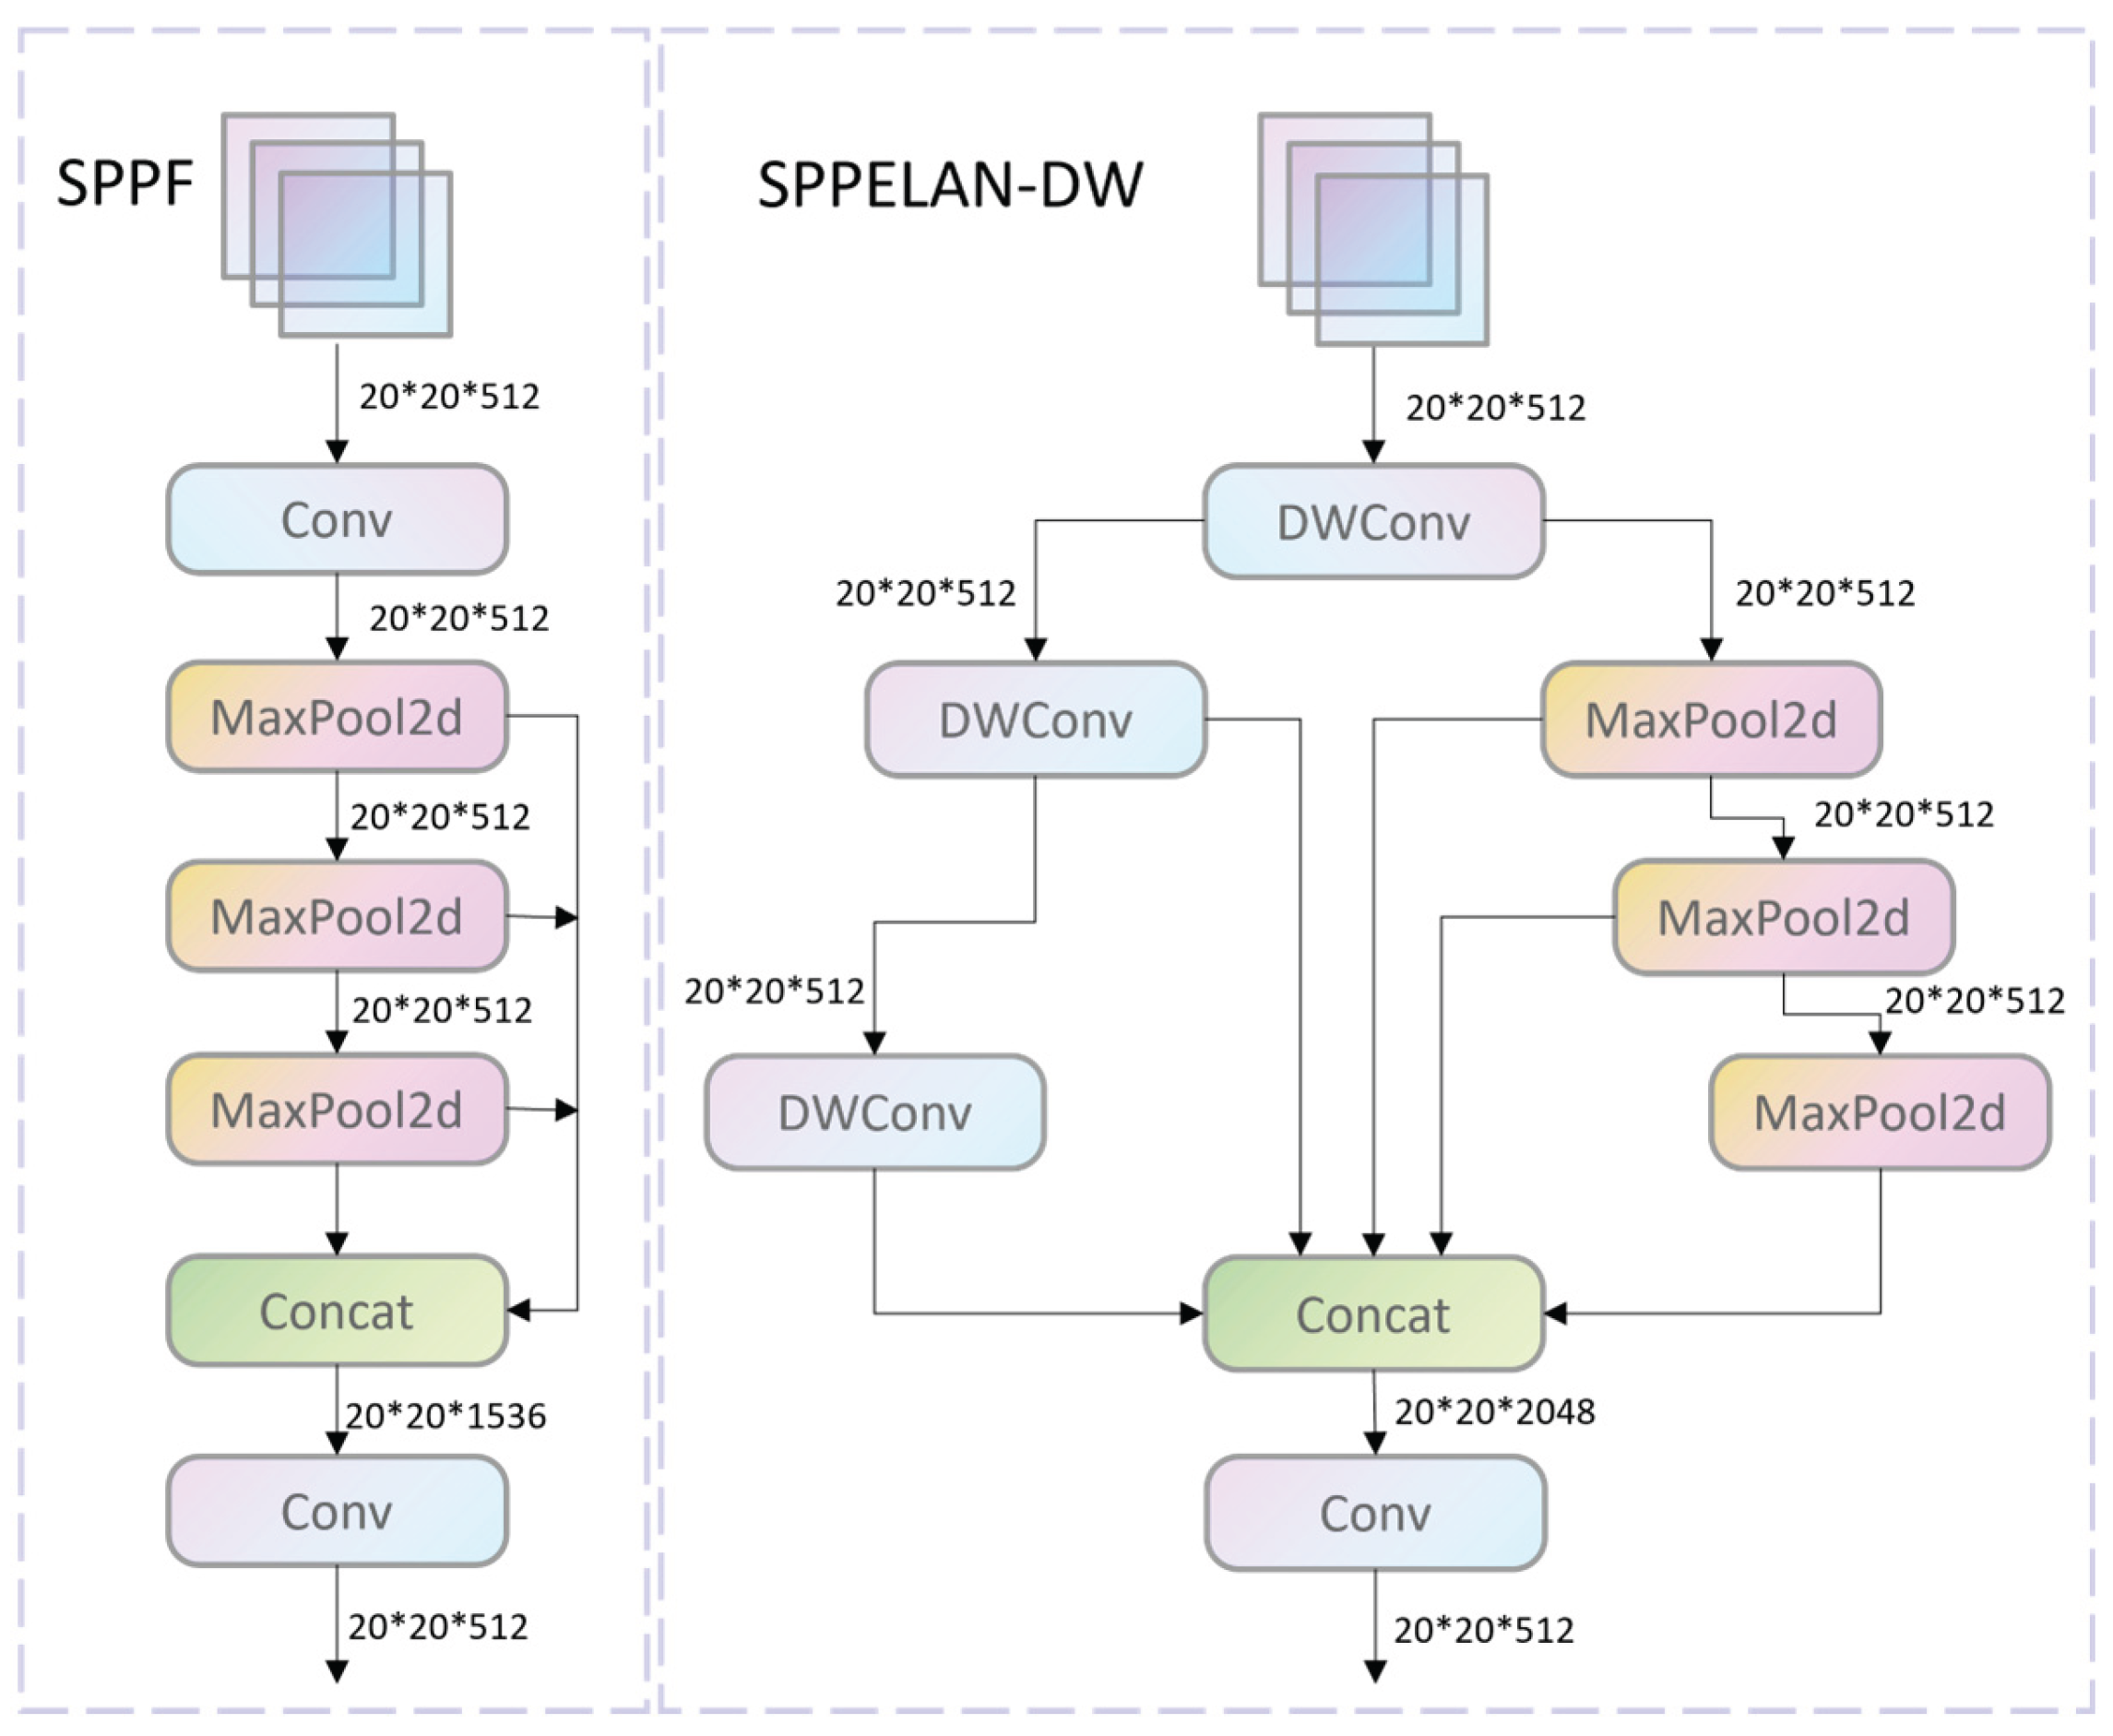
Figure 5.
Dataset Details.
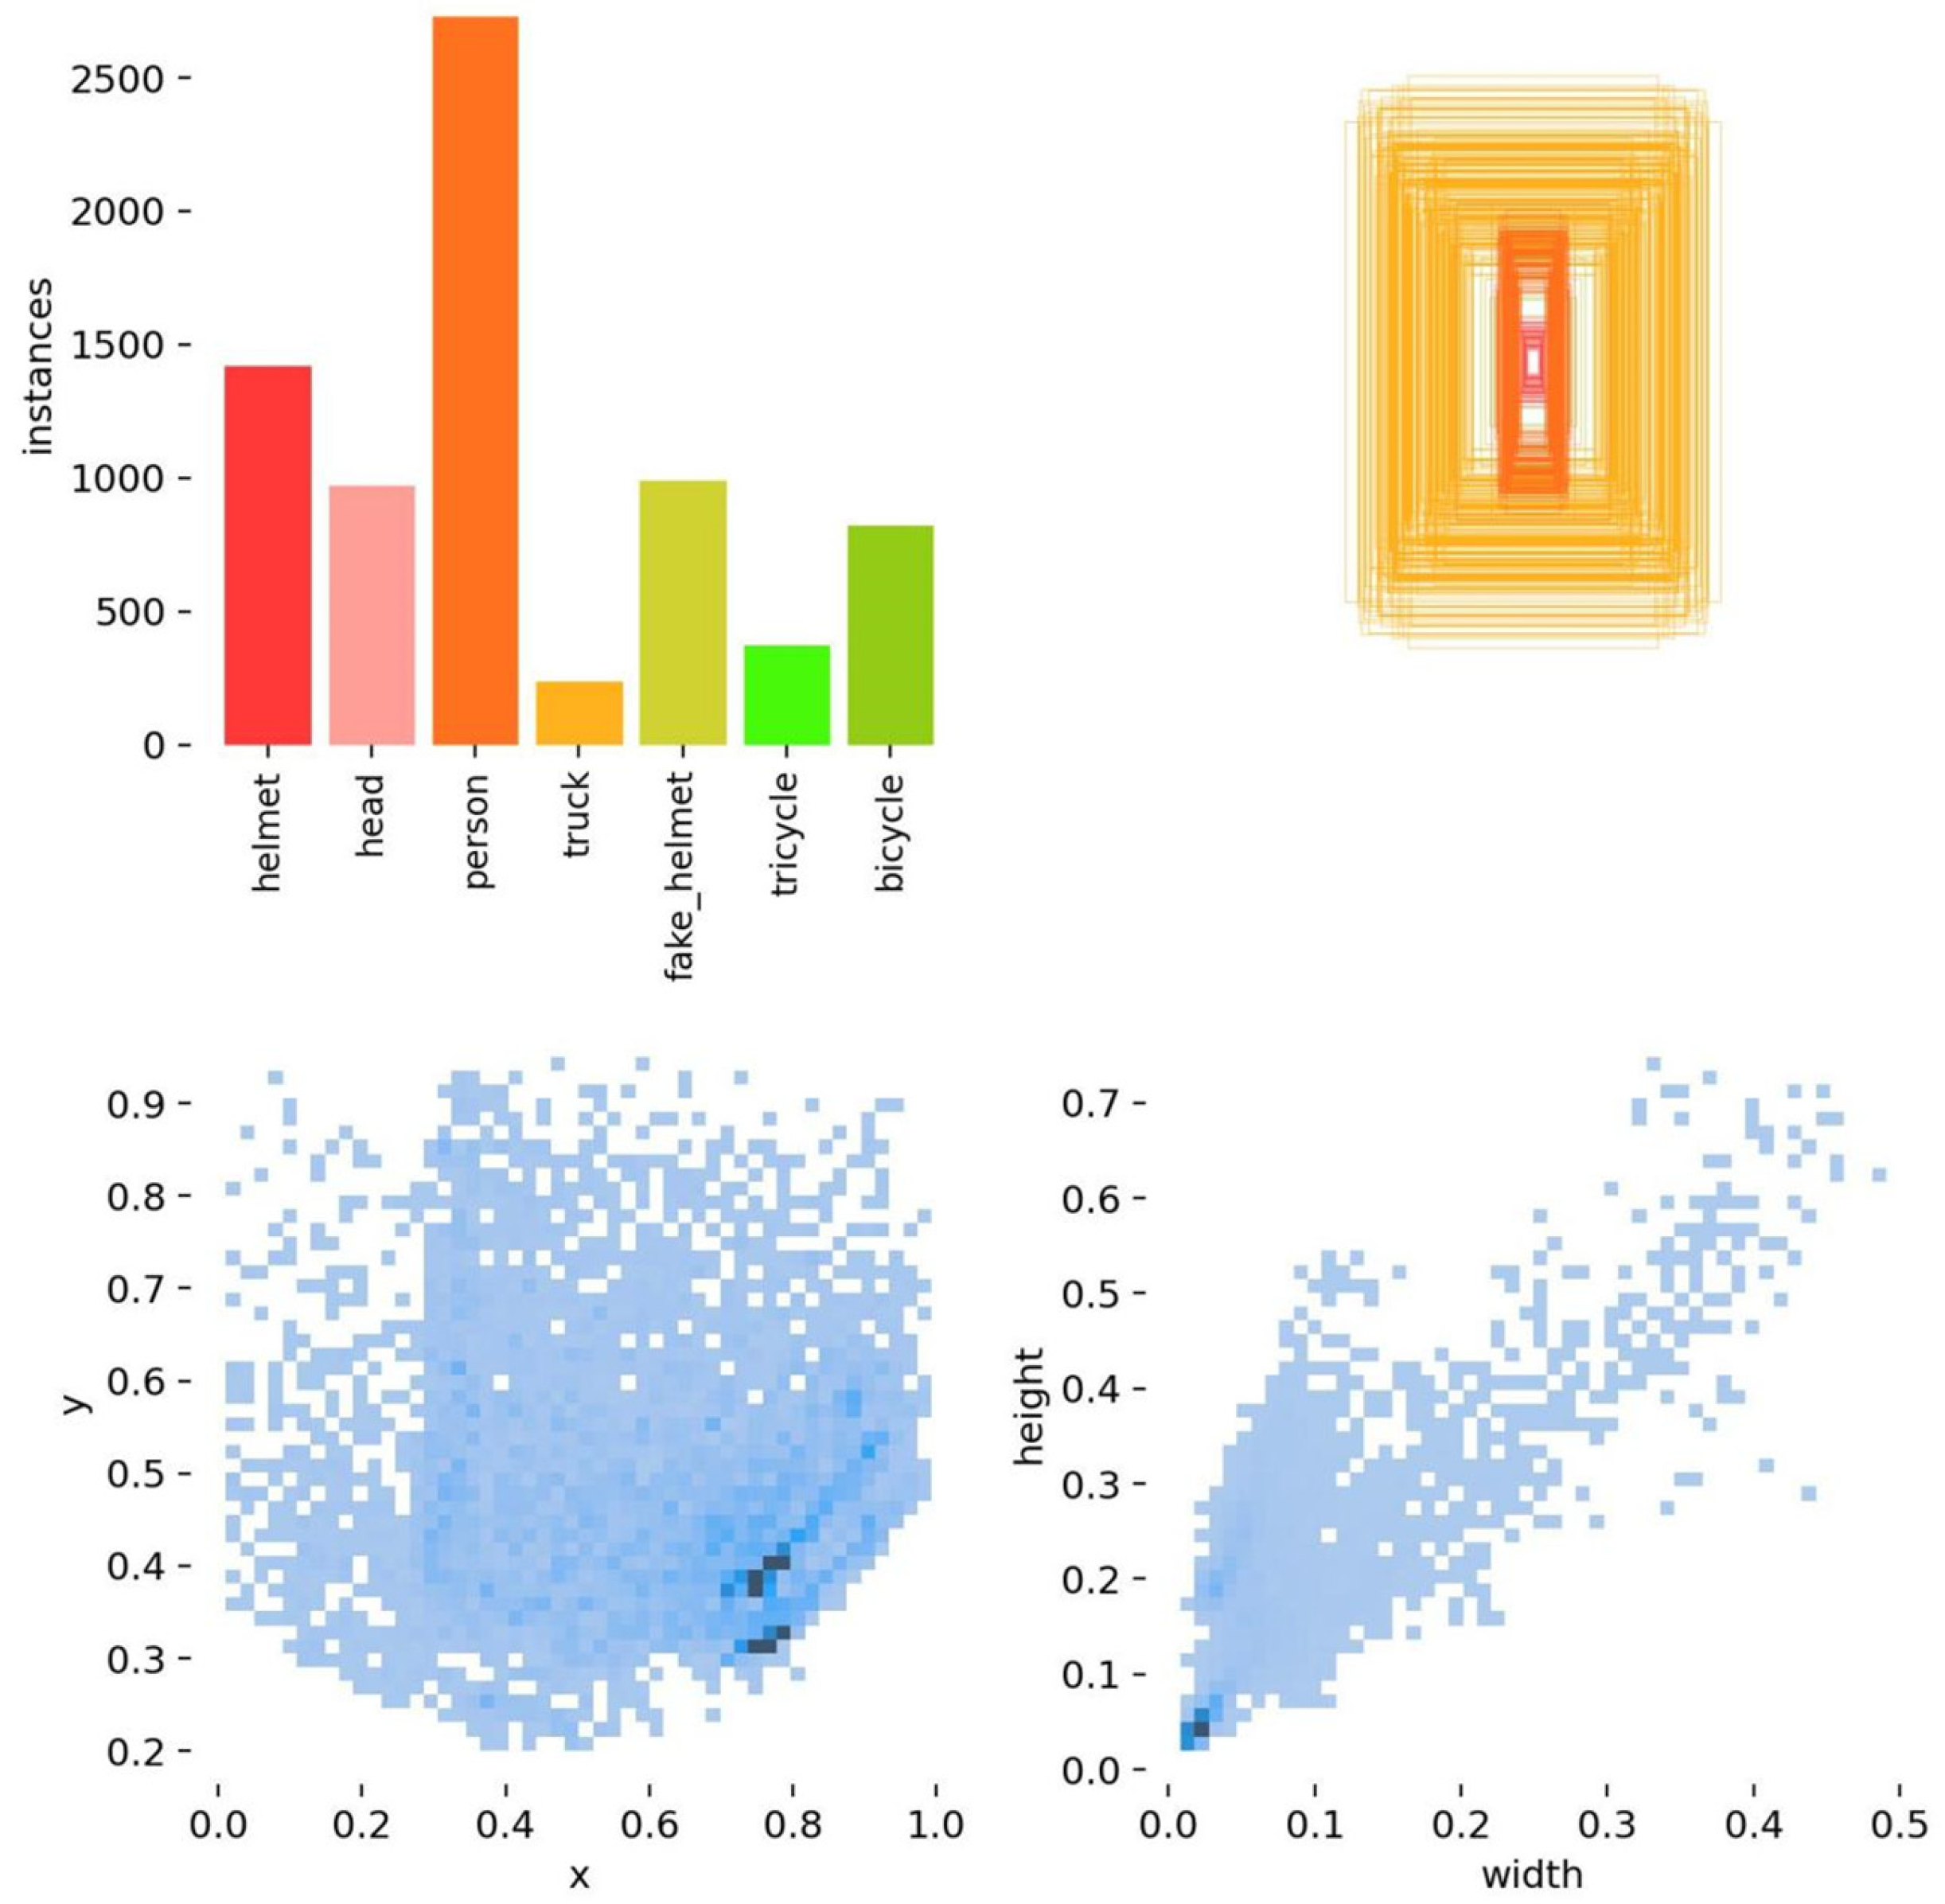
Figure 6.
Evaluation Results of Model Training.
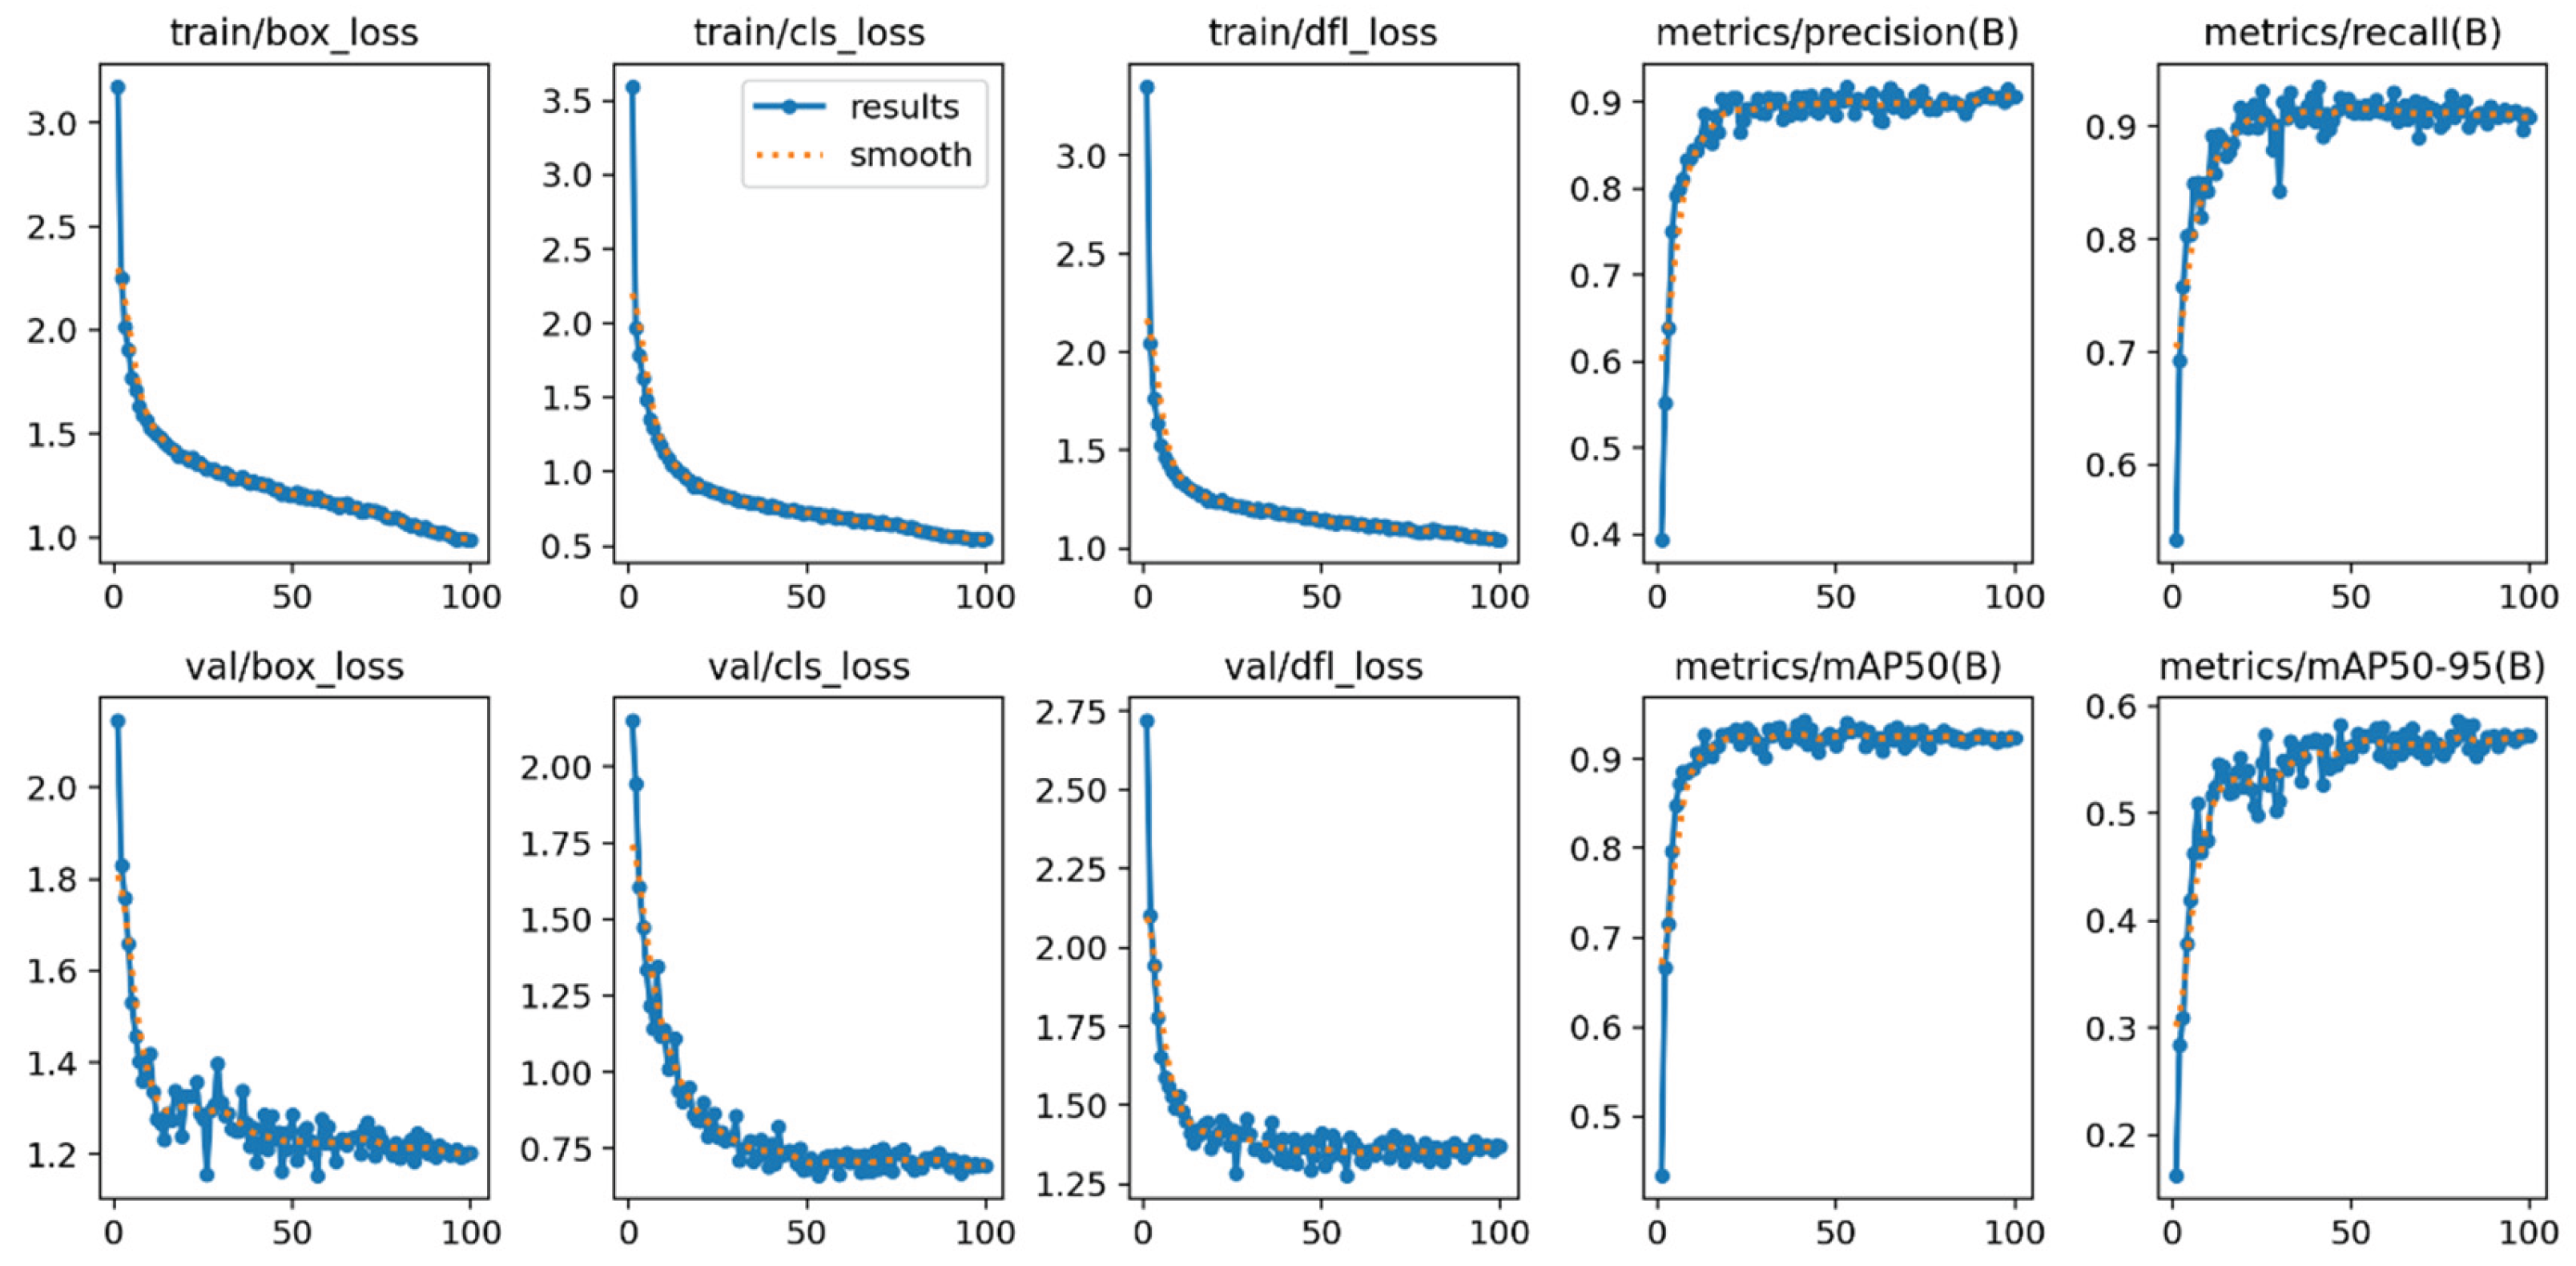
Figure 7.
(a) Confusion Matrix of the Detection Model (b) Normalized Confusion Matrix.
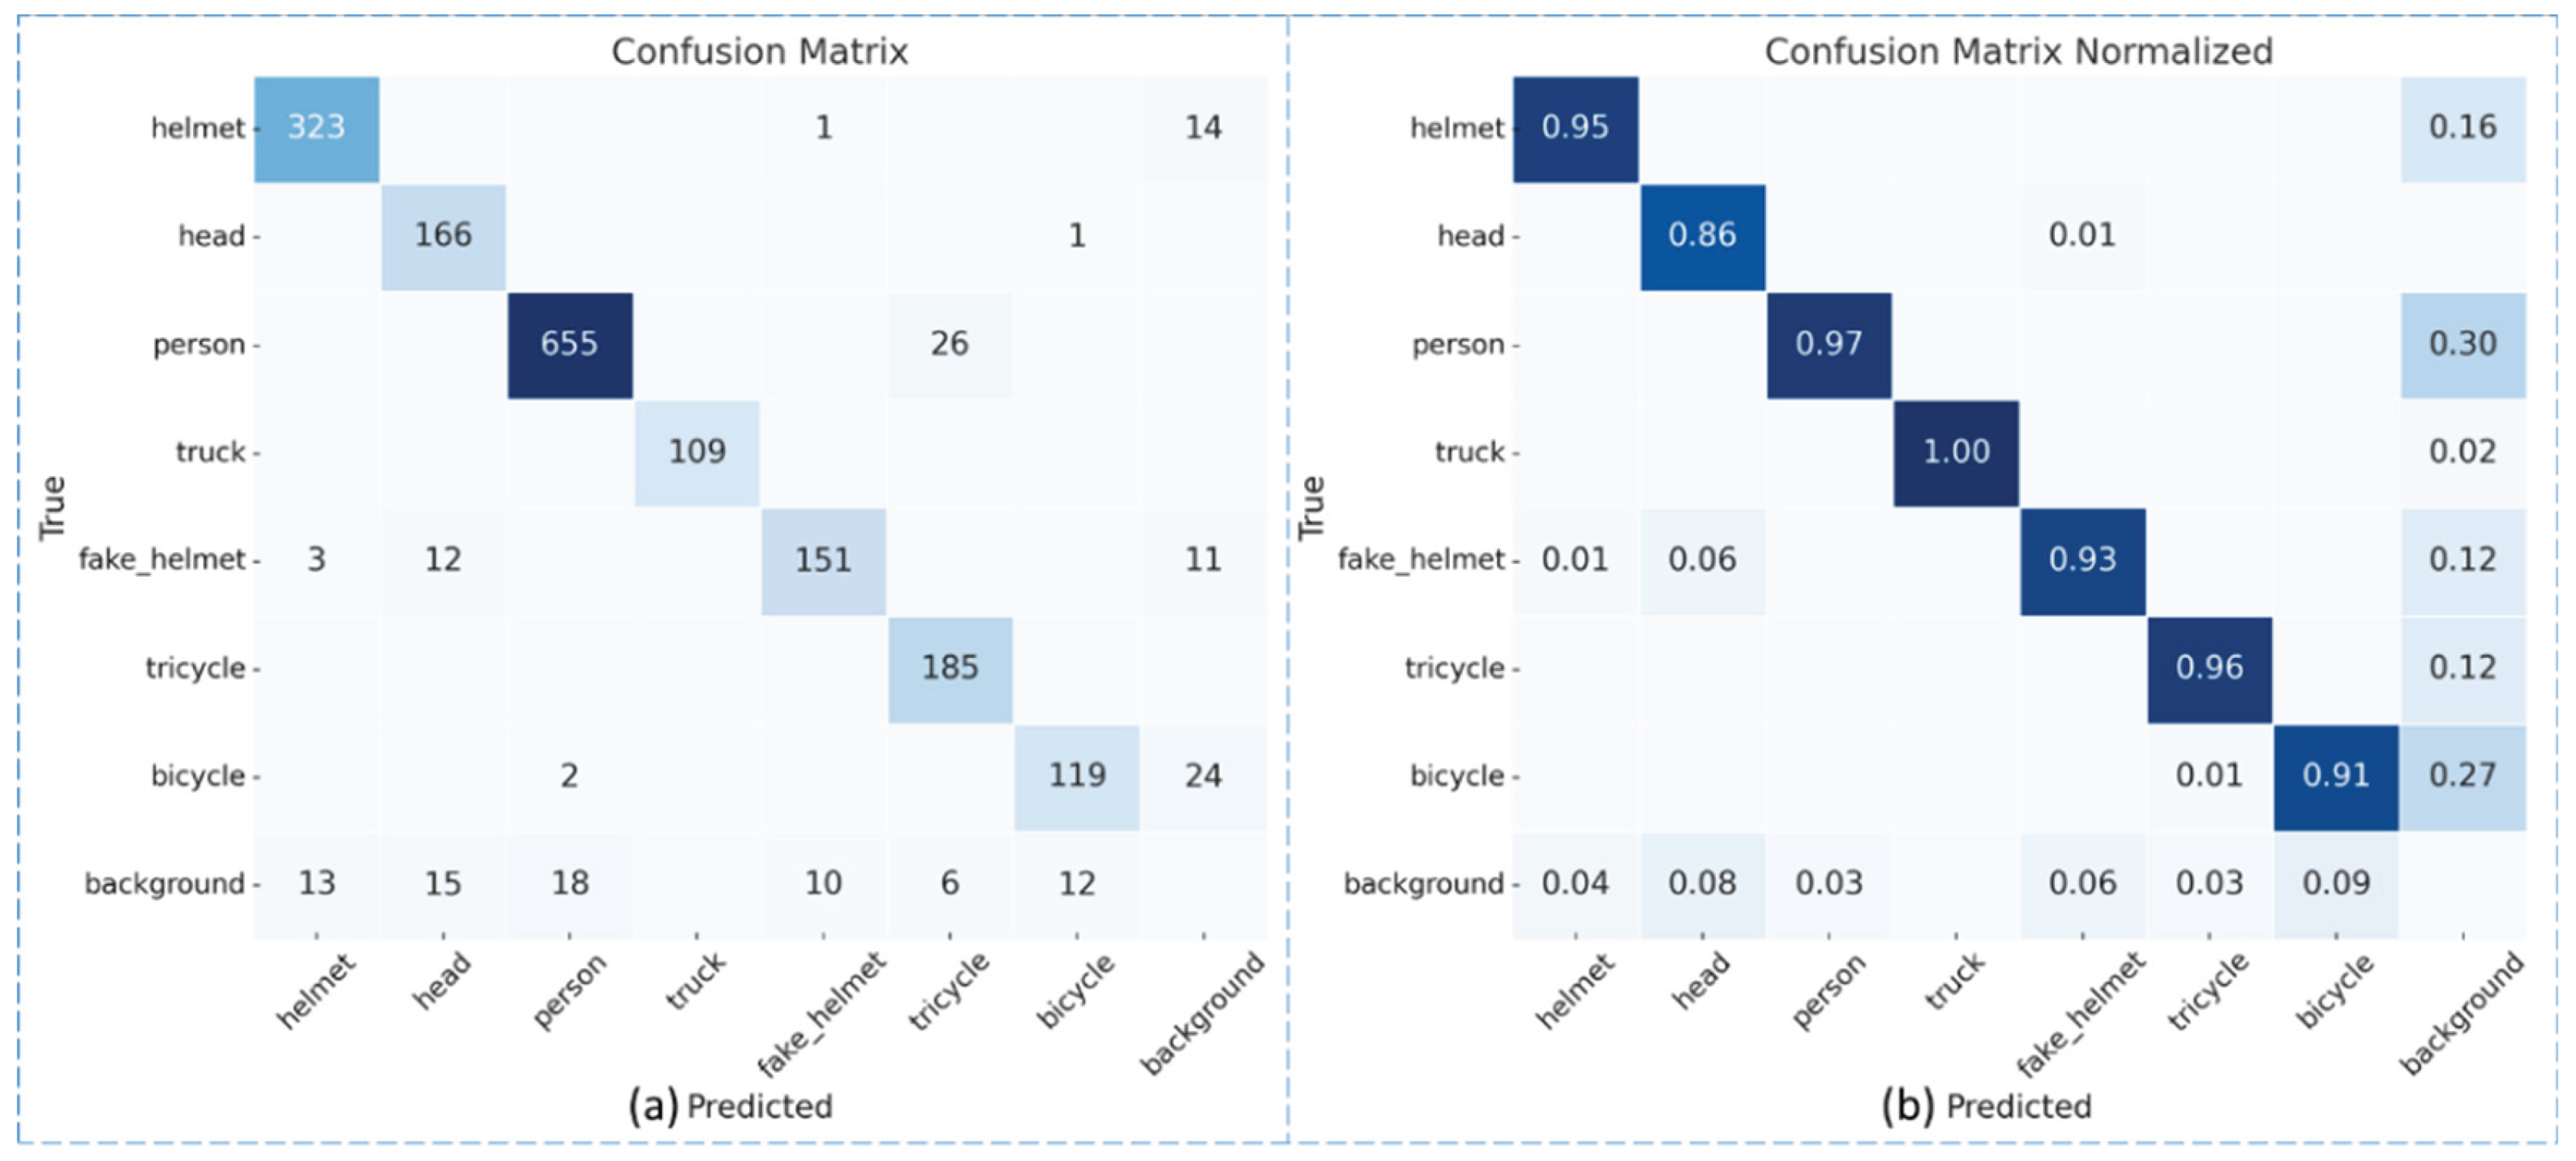
Figure 8.
Comparison of mAP@0.5 Learning Curves Across Different Models.
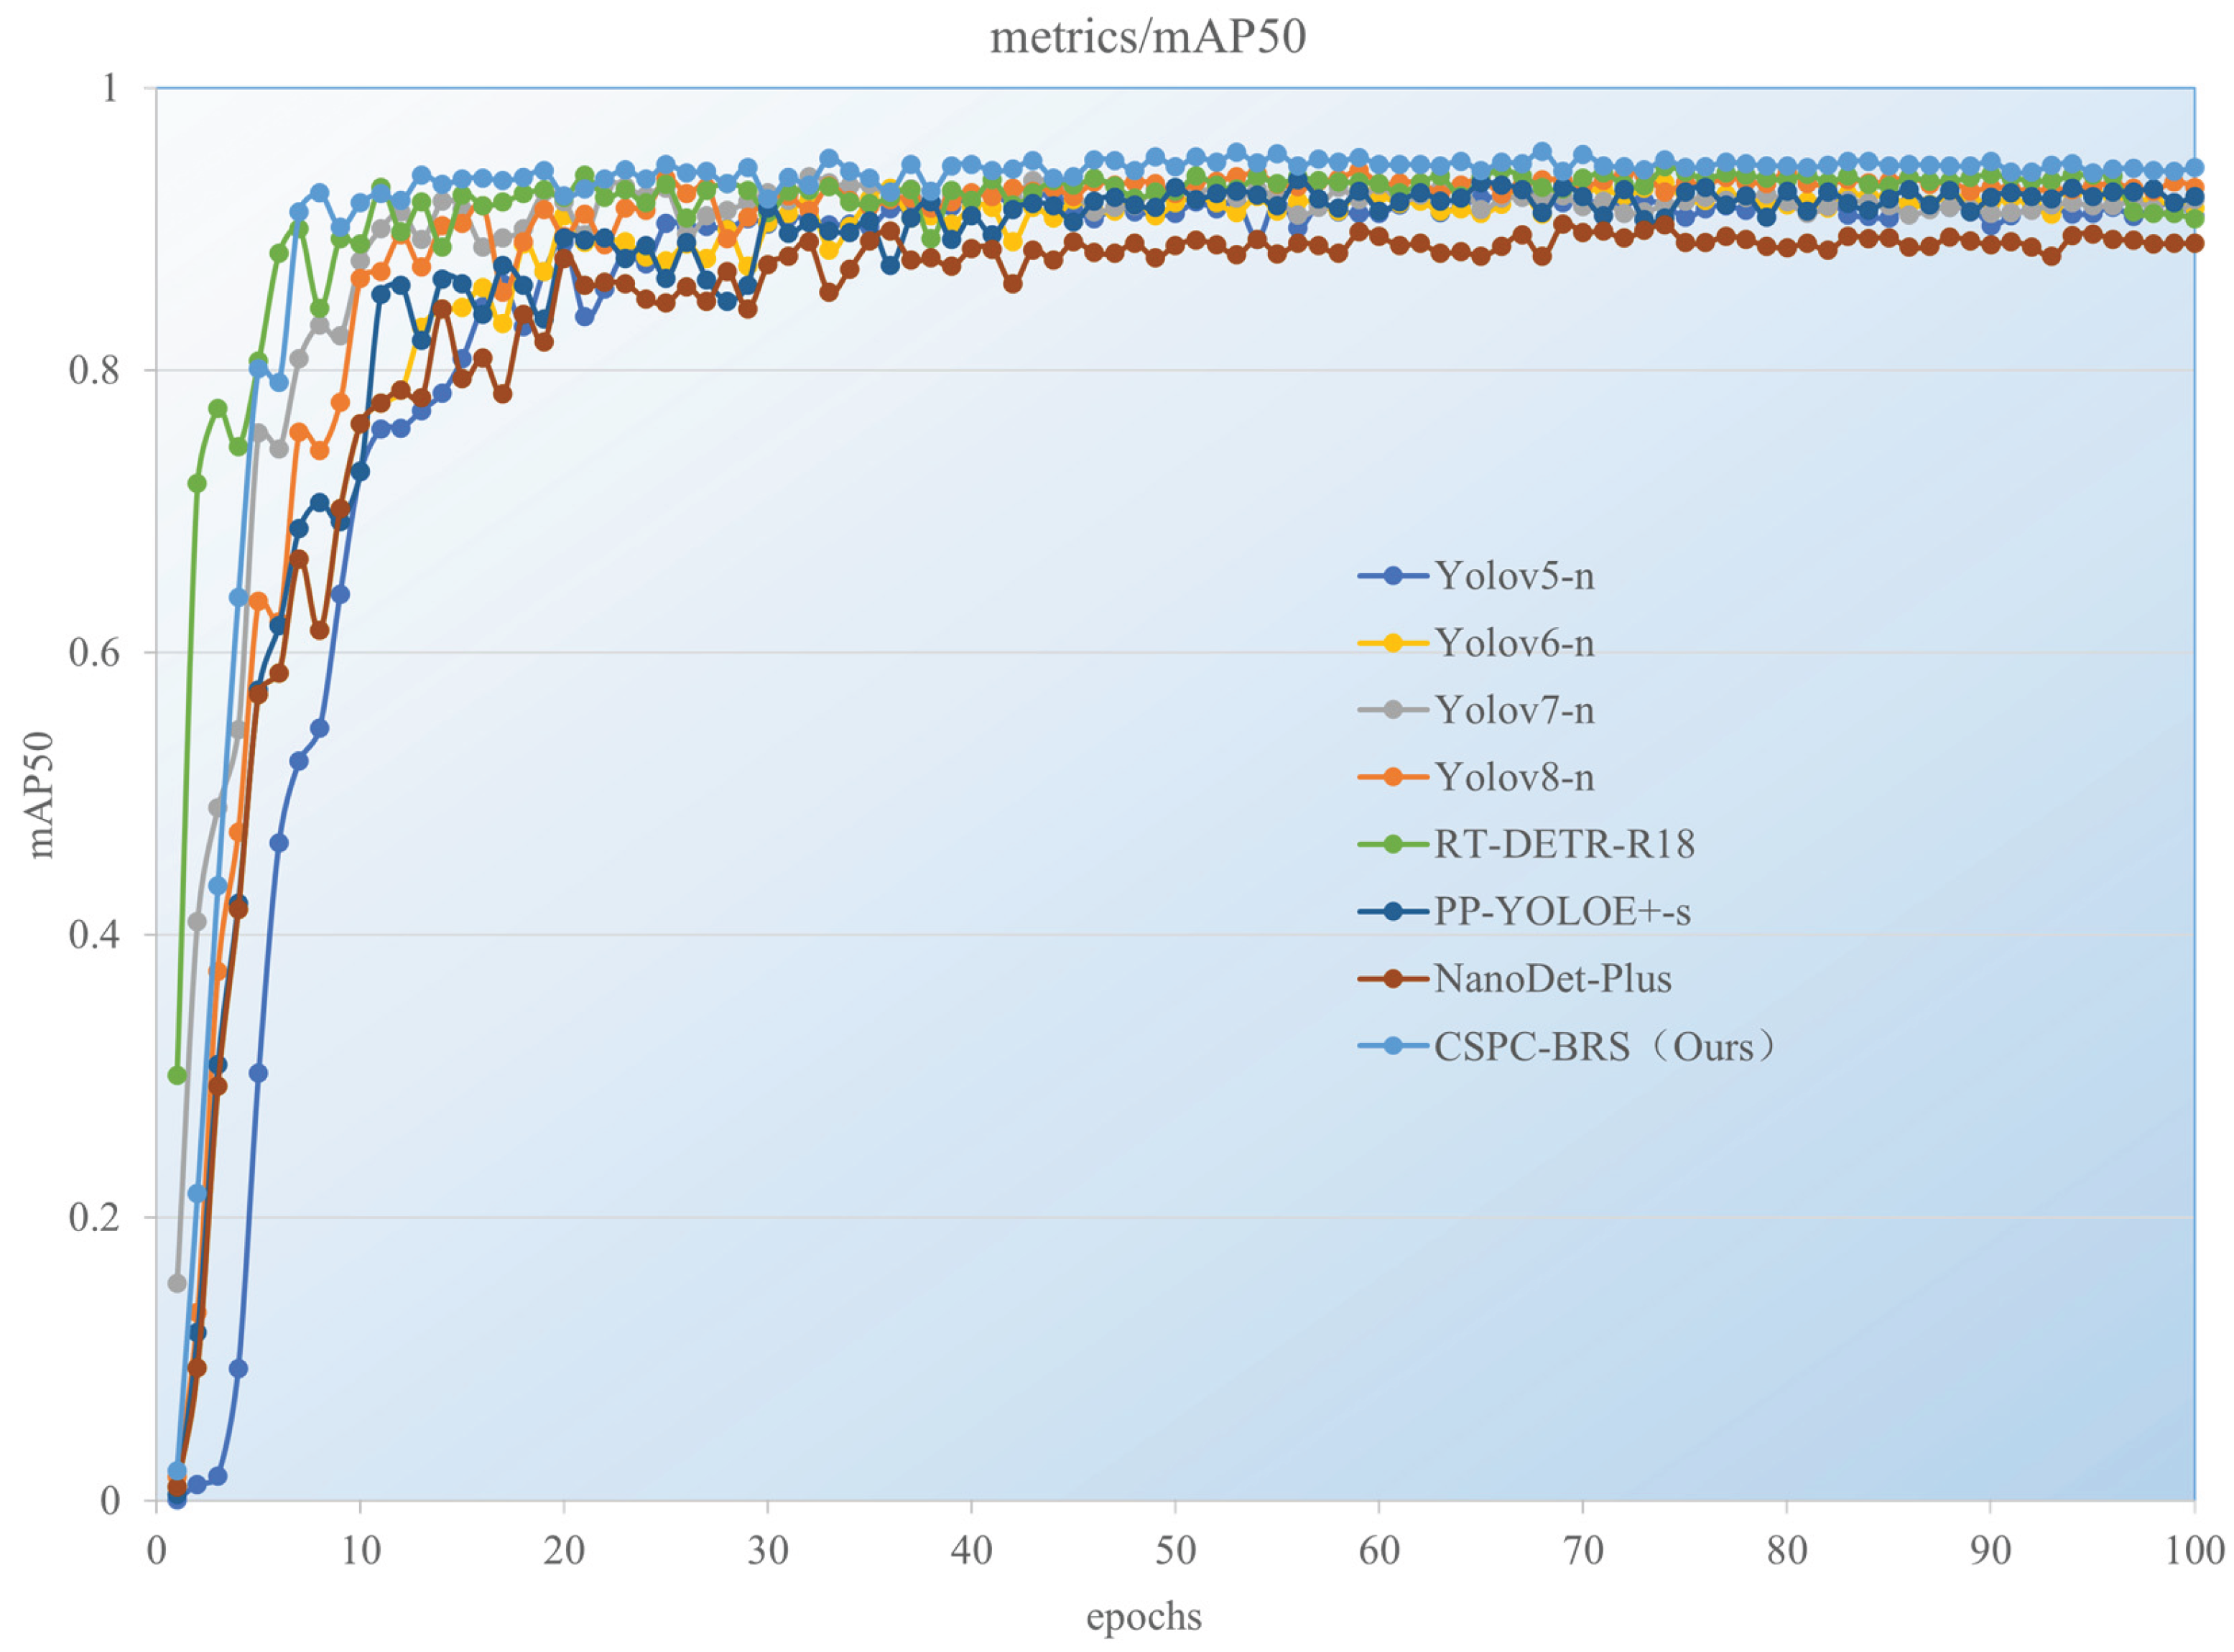
Figure 9.
Detection Performance Comparison in Complex Open Channels.
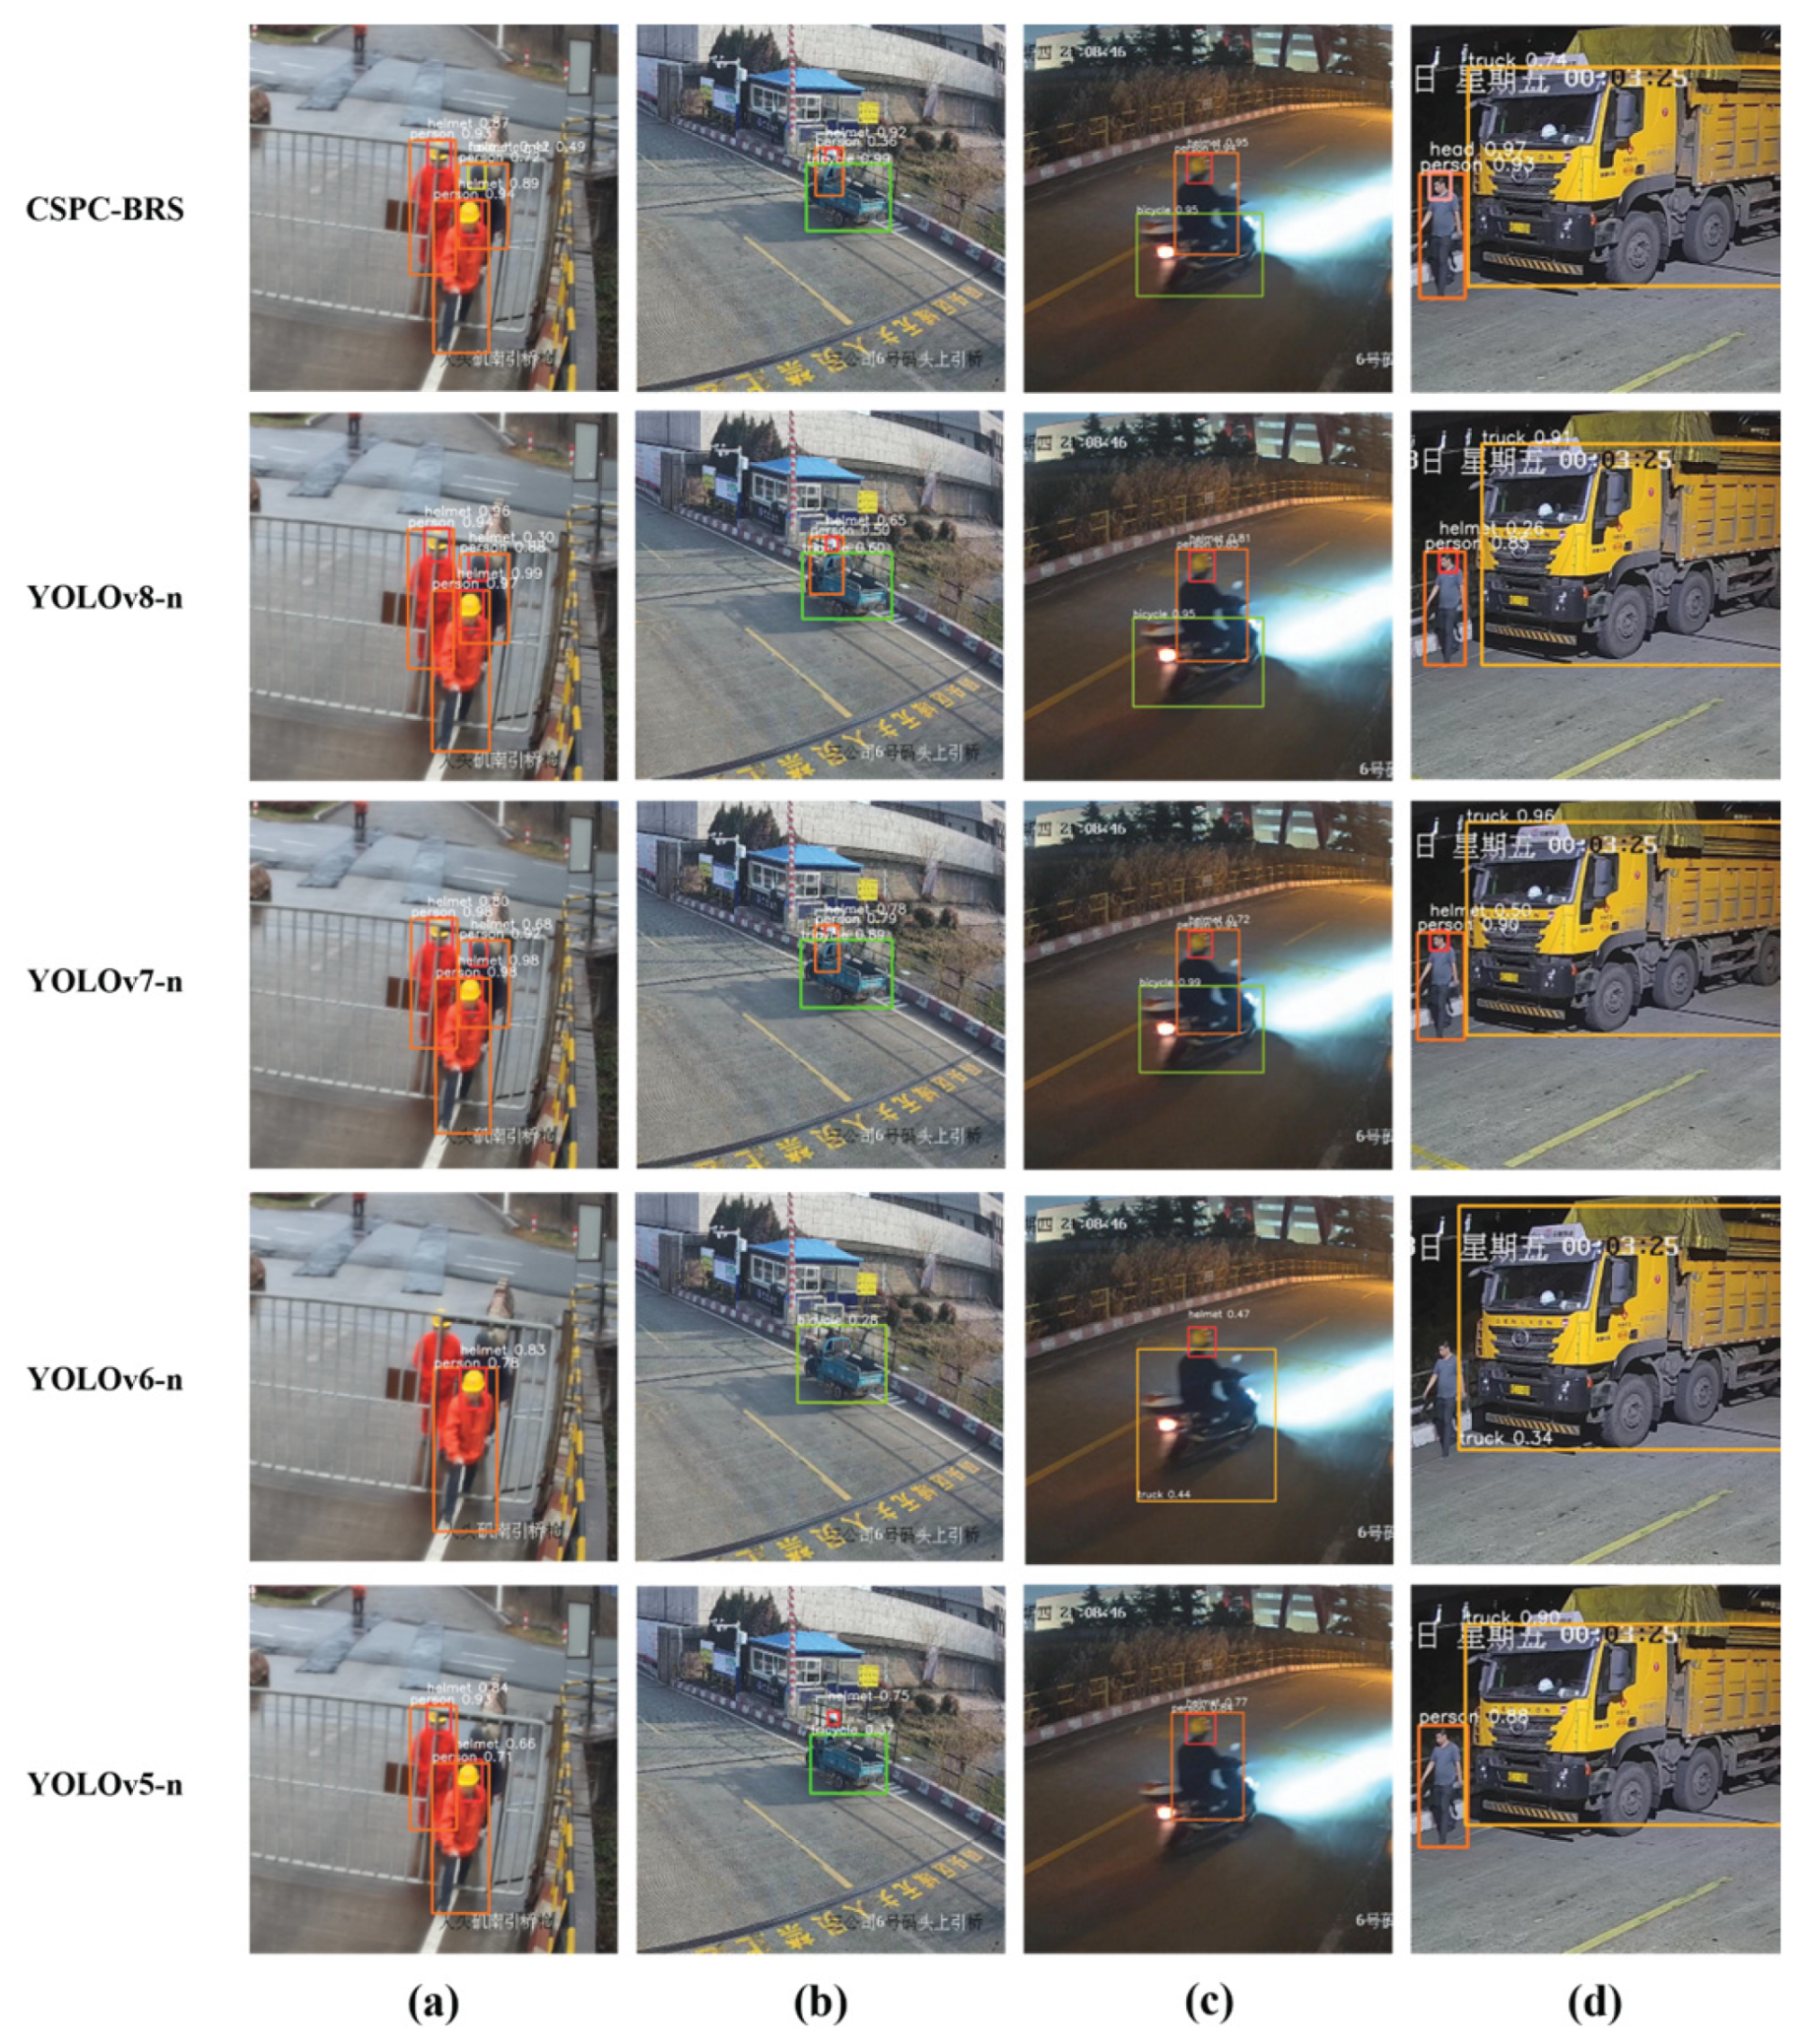
Figure 10.
Actual Detection Performance.
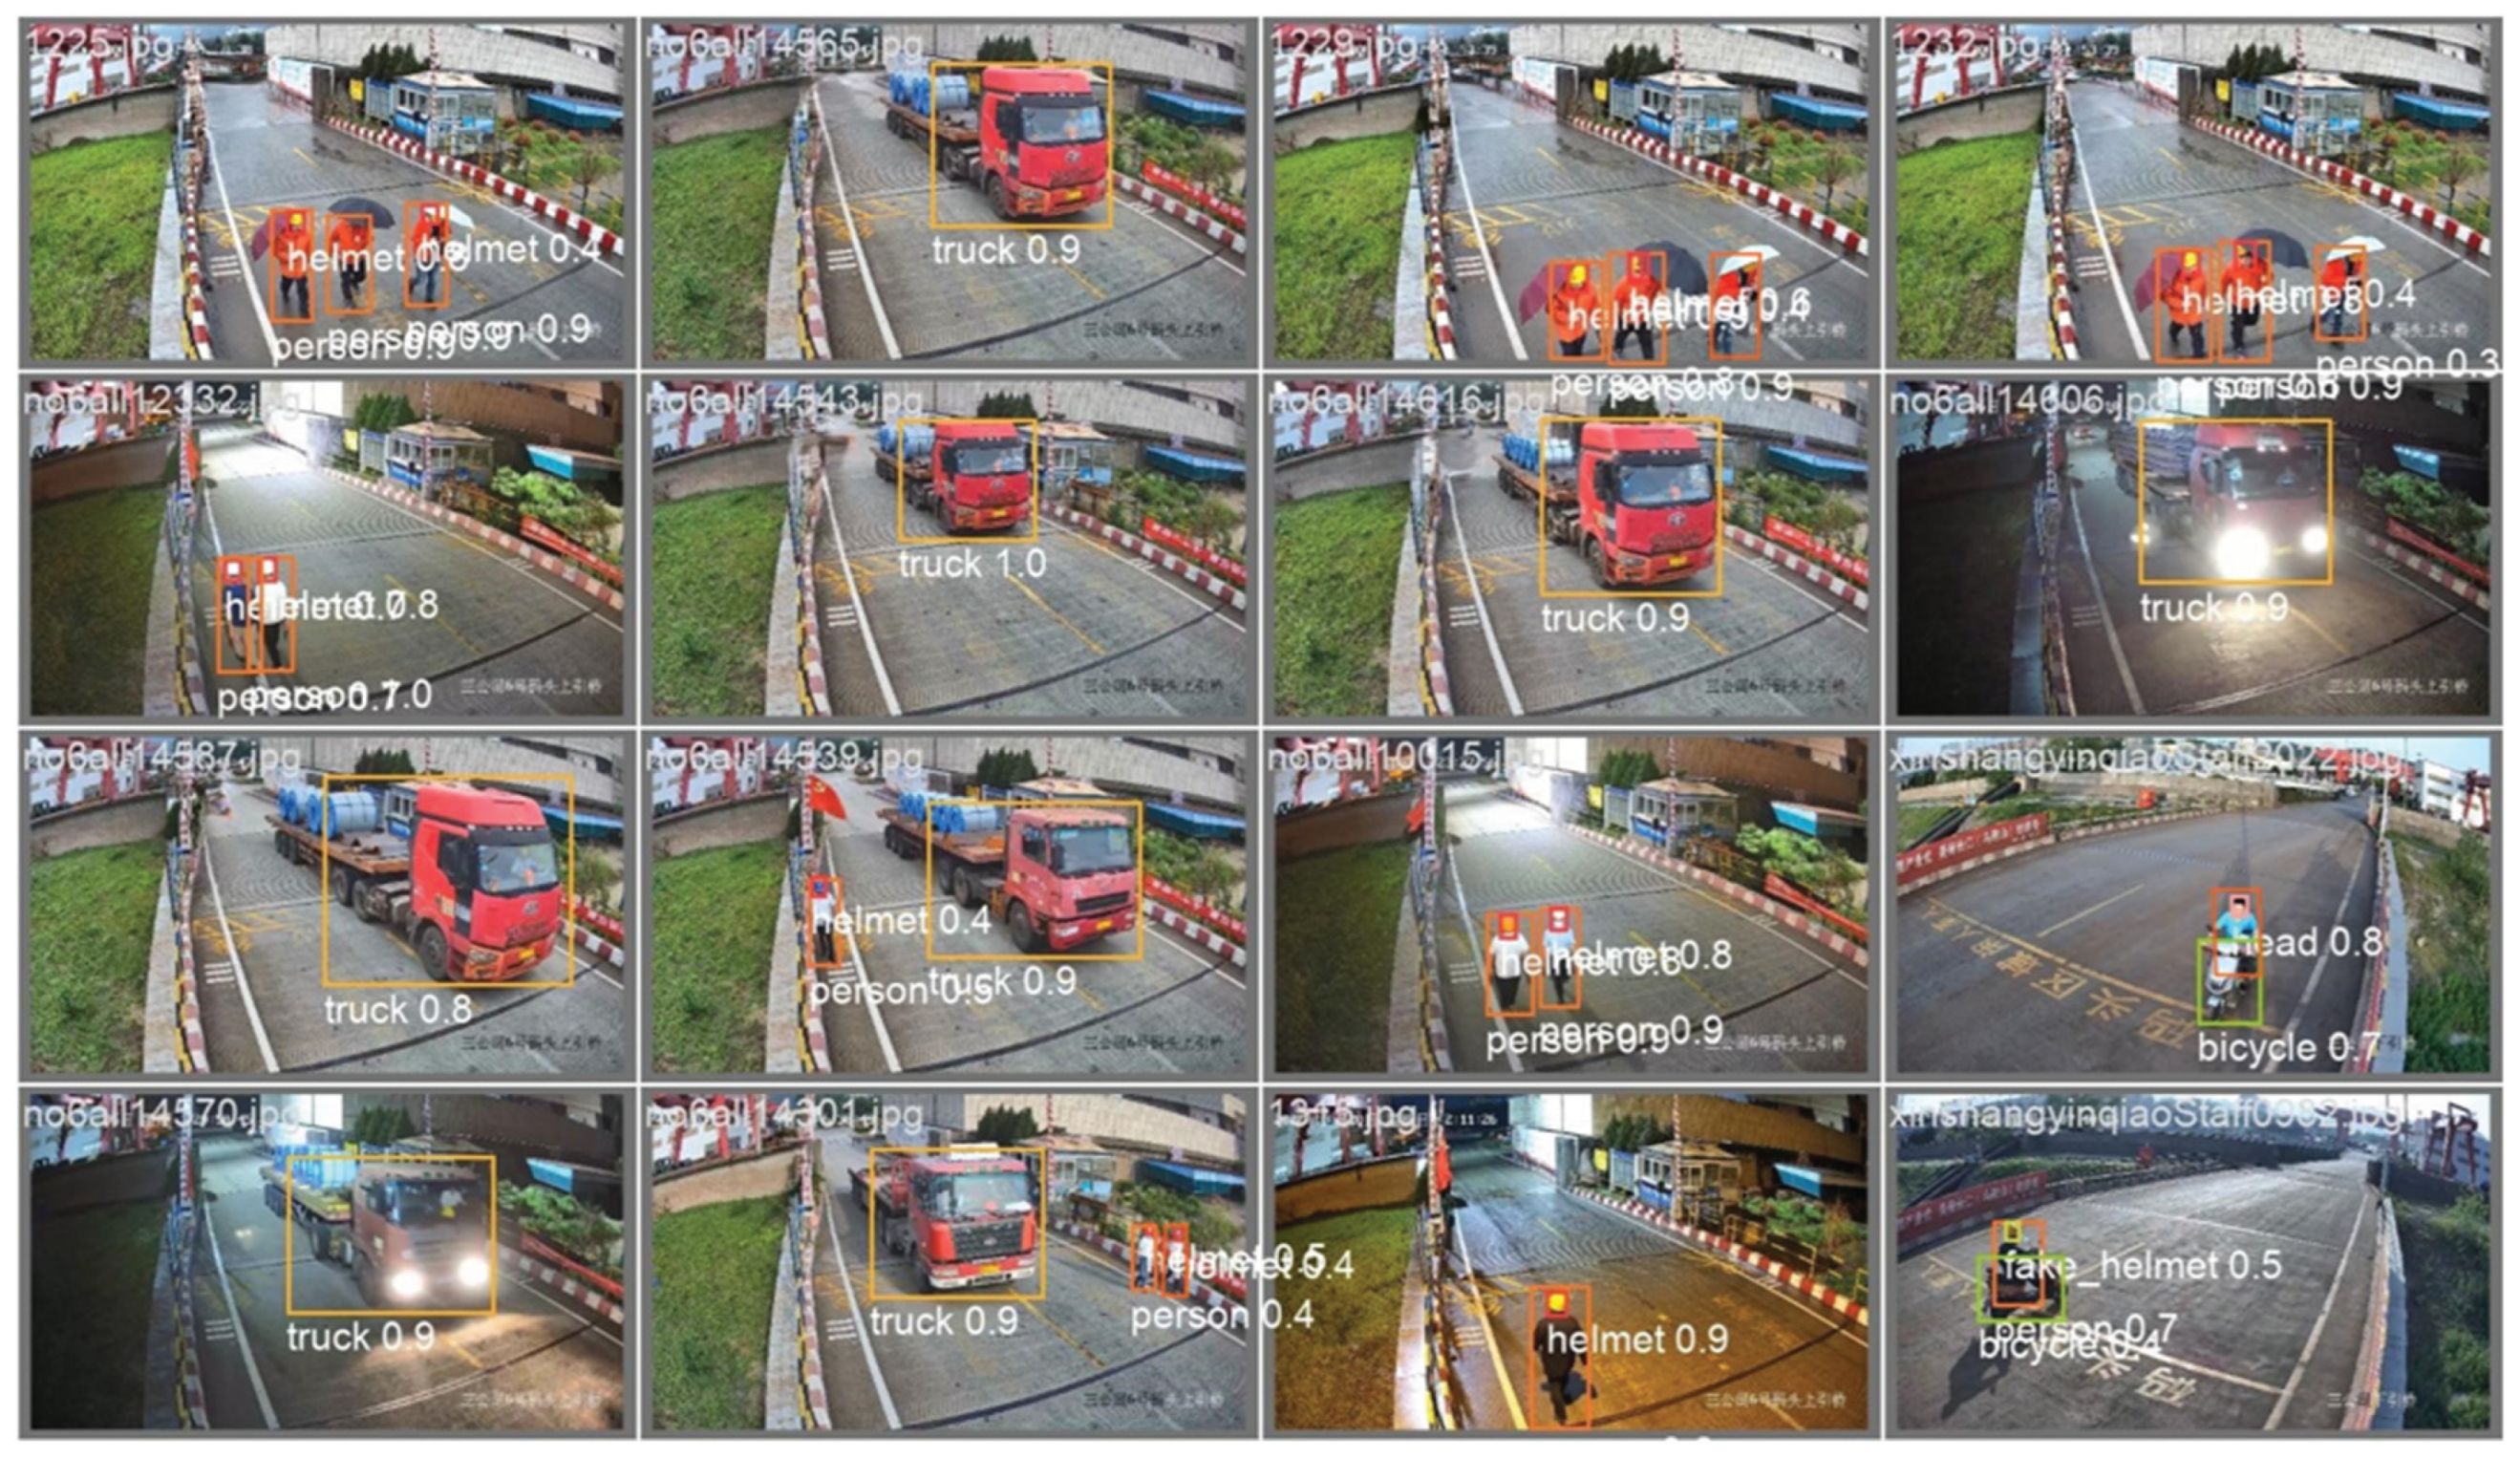
Figure 11.
Tracking Results Comparison for the Labeled Target 'bicycle'.
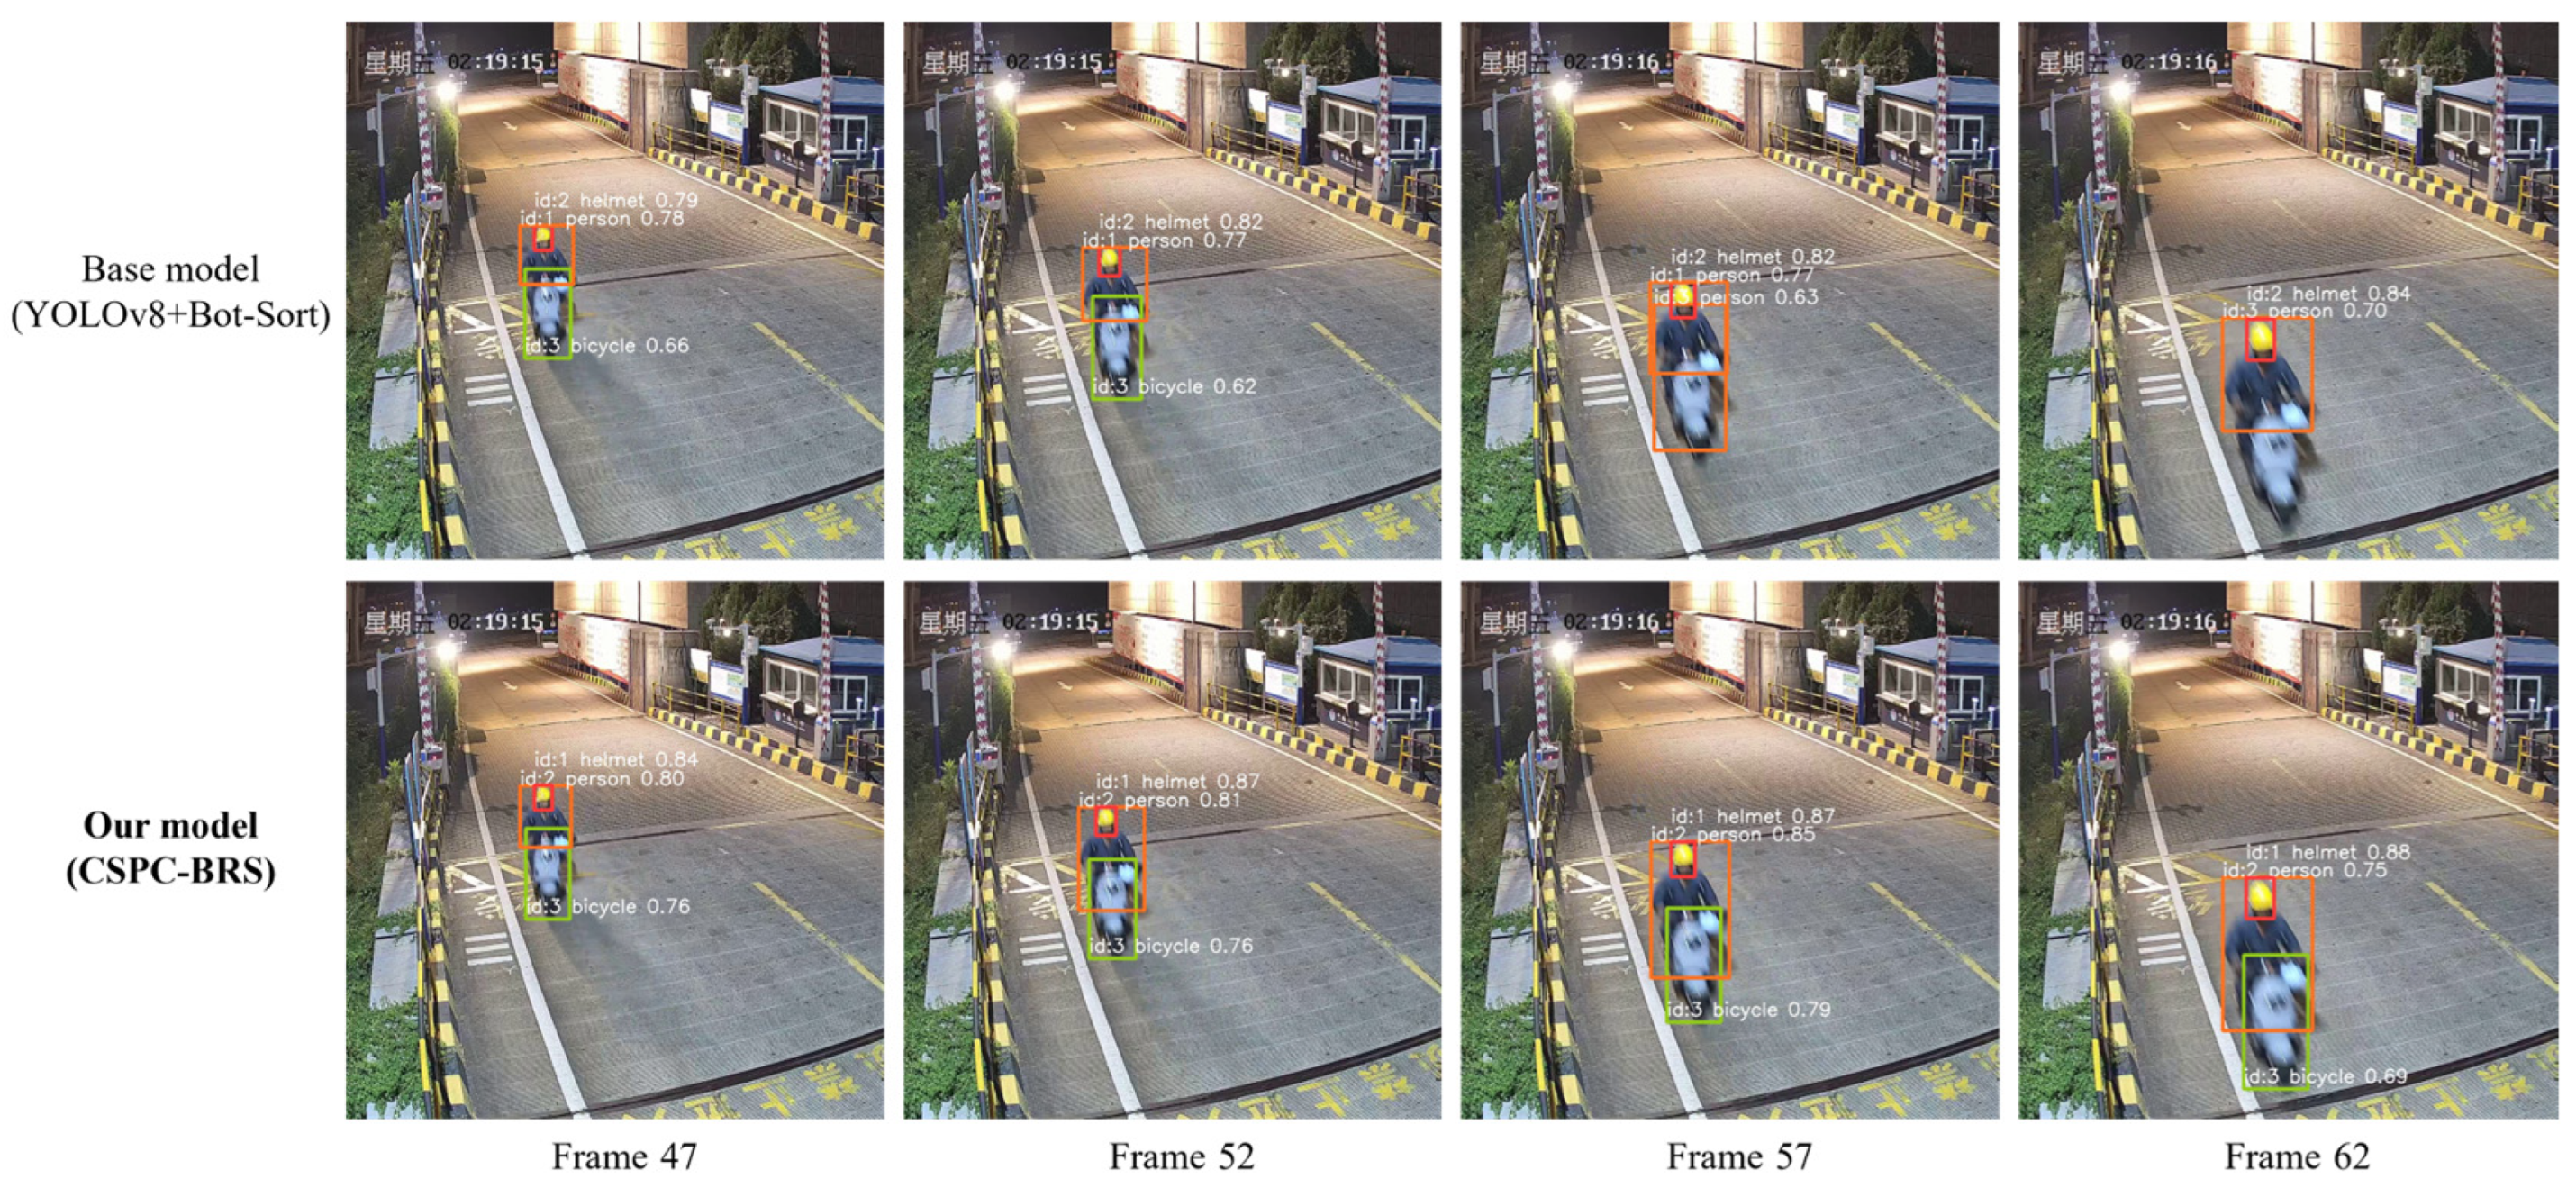
Figure 12.
Tracking Results Comparison for the Labeled Target 'tricycle'.
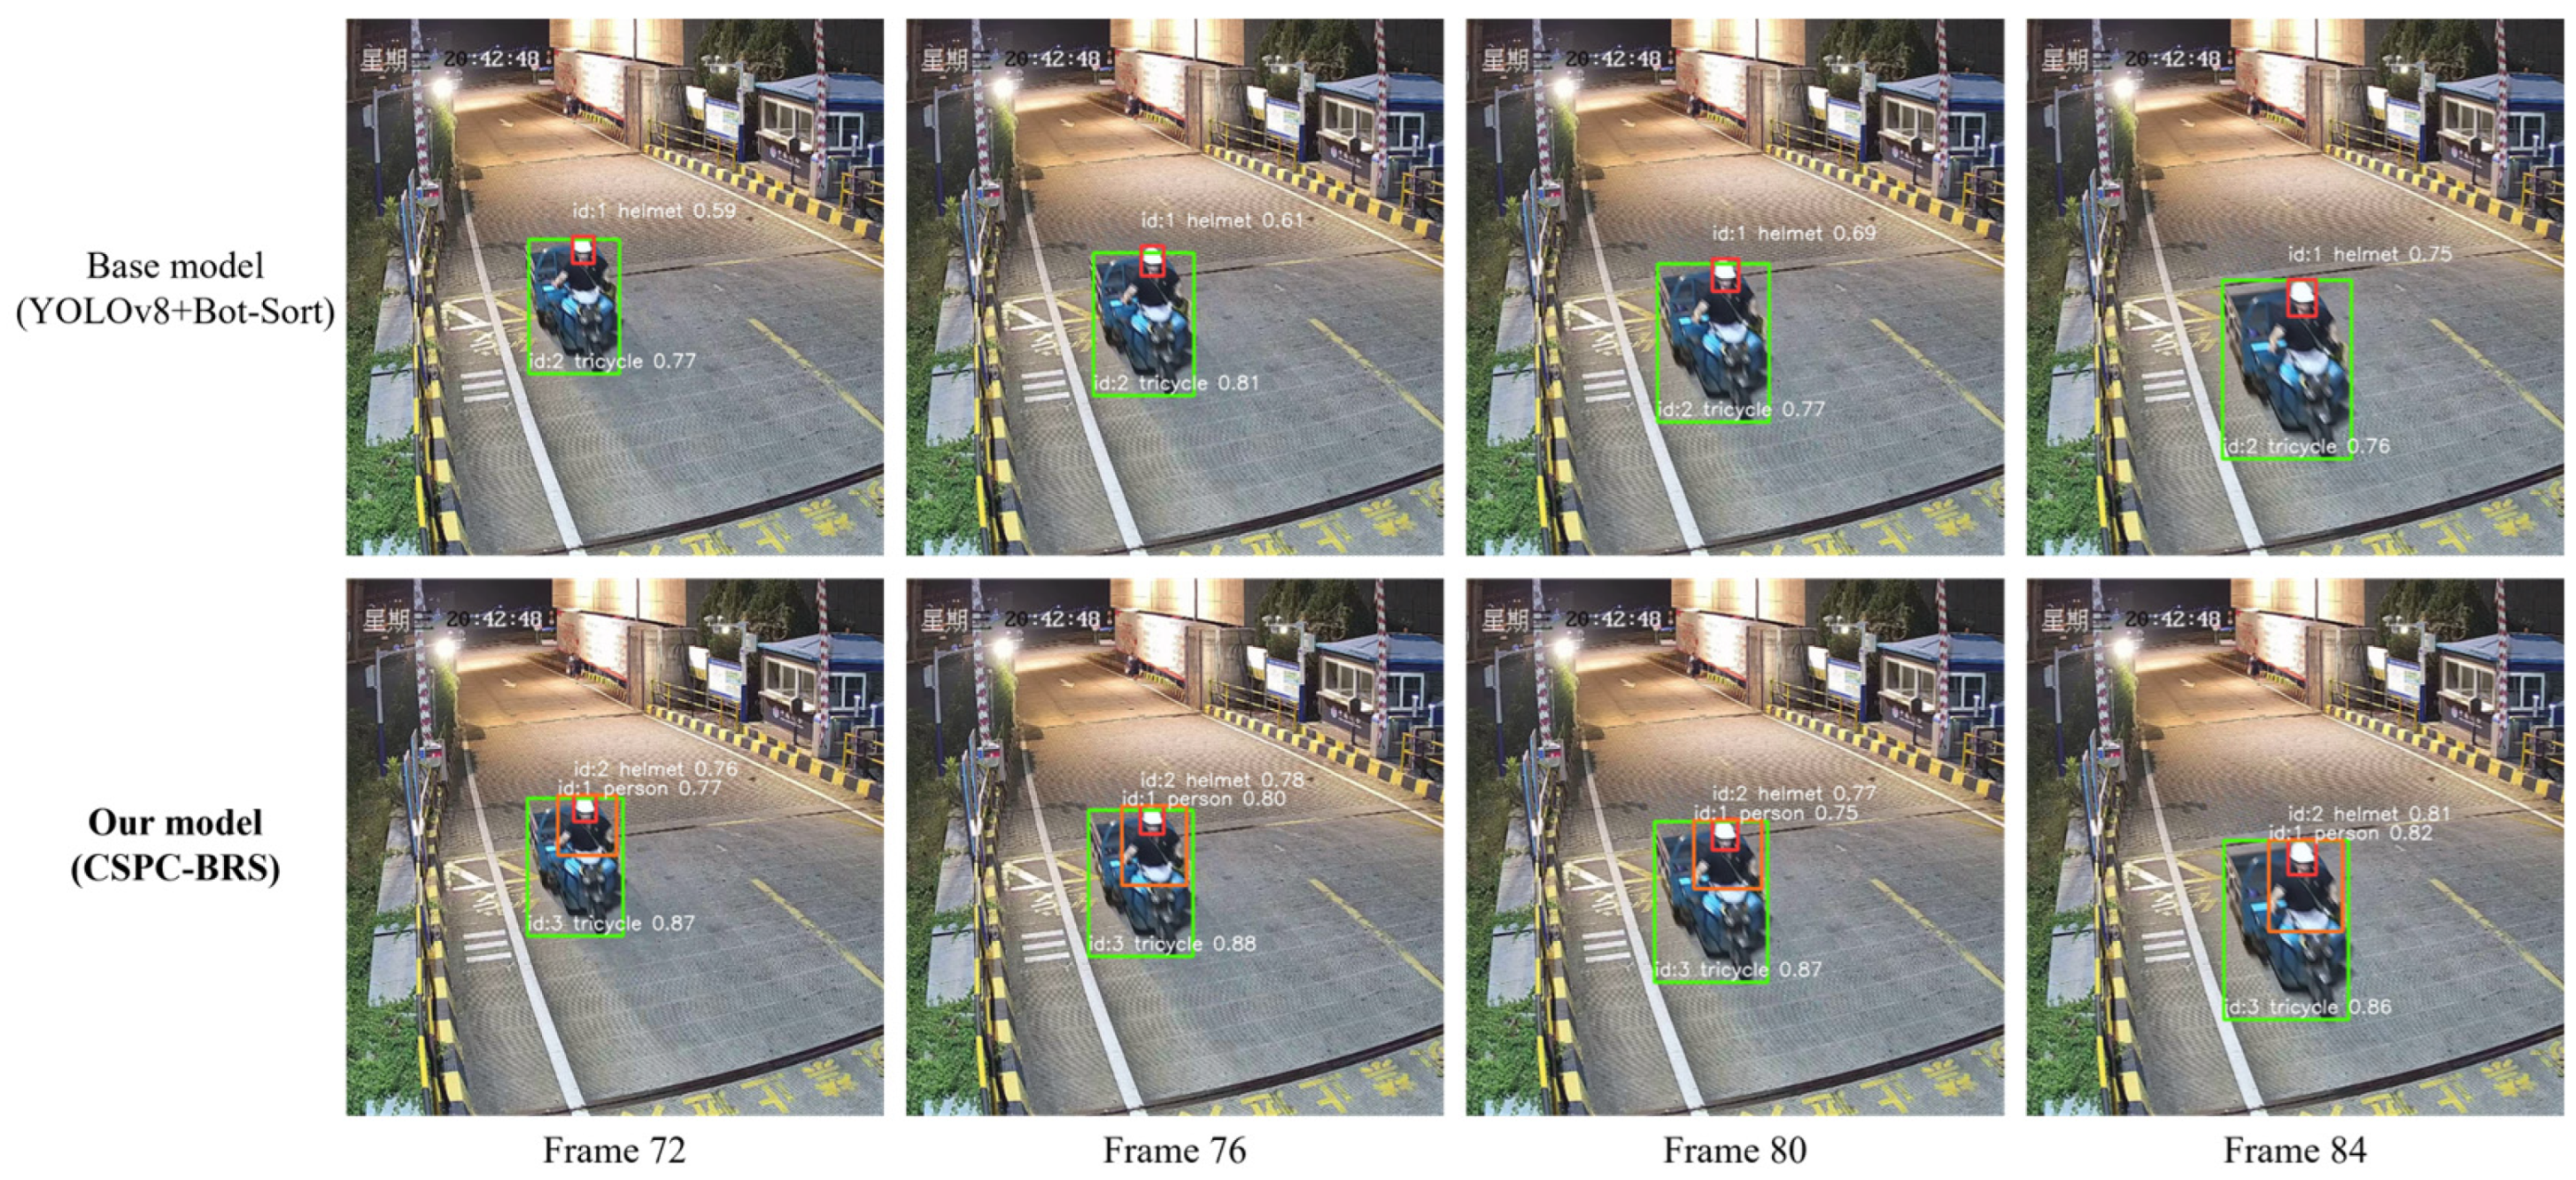
Figure 13.
Tracking Results Comparison for the Labeled Target 'truck'.
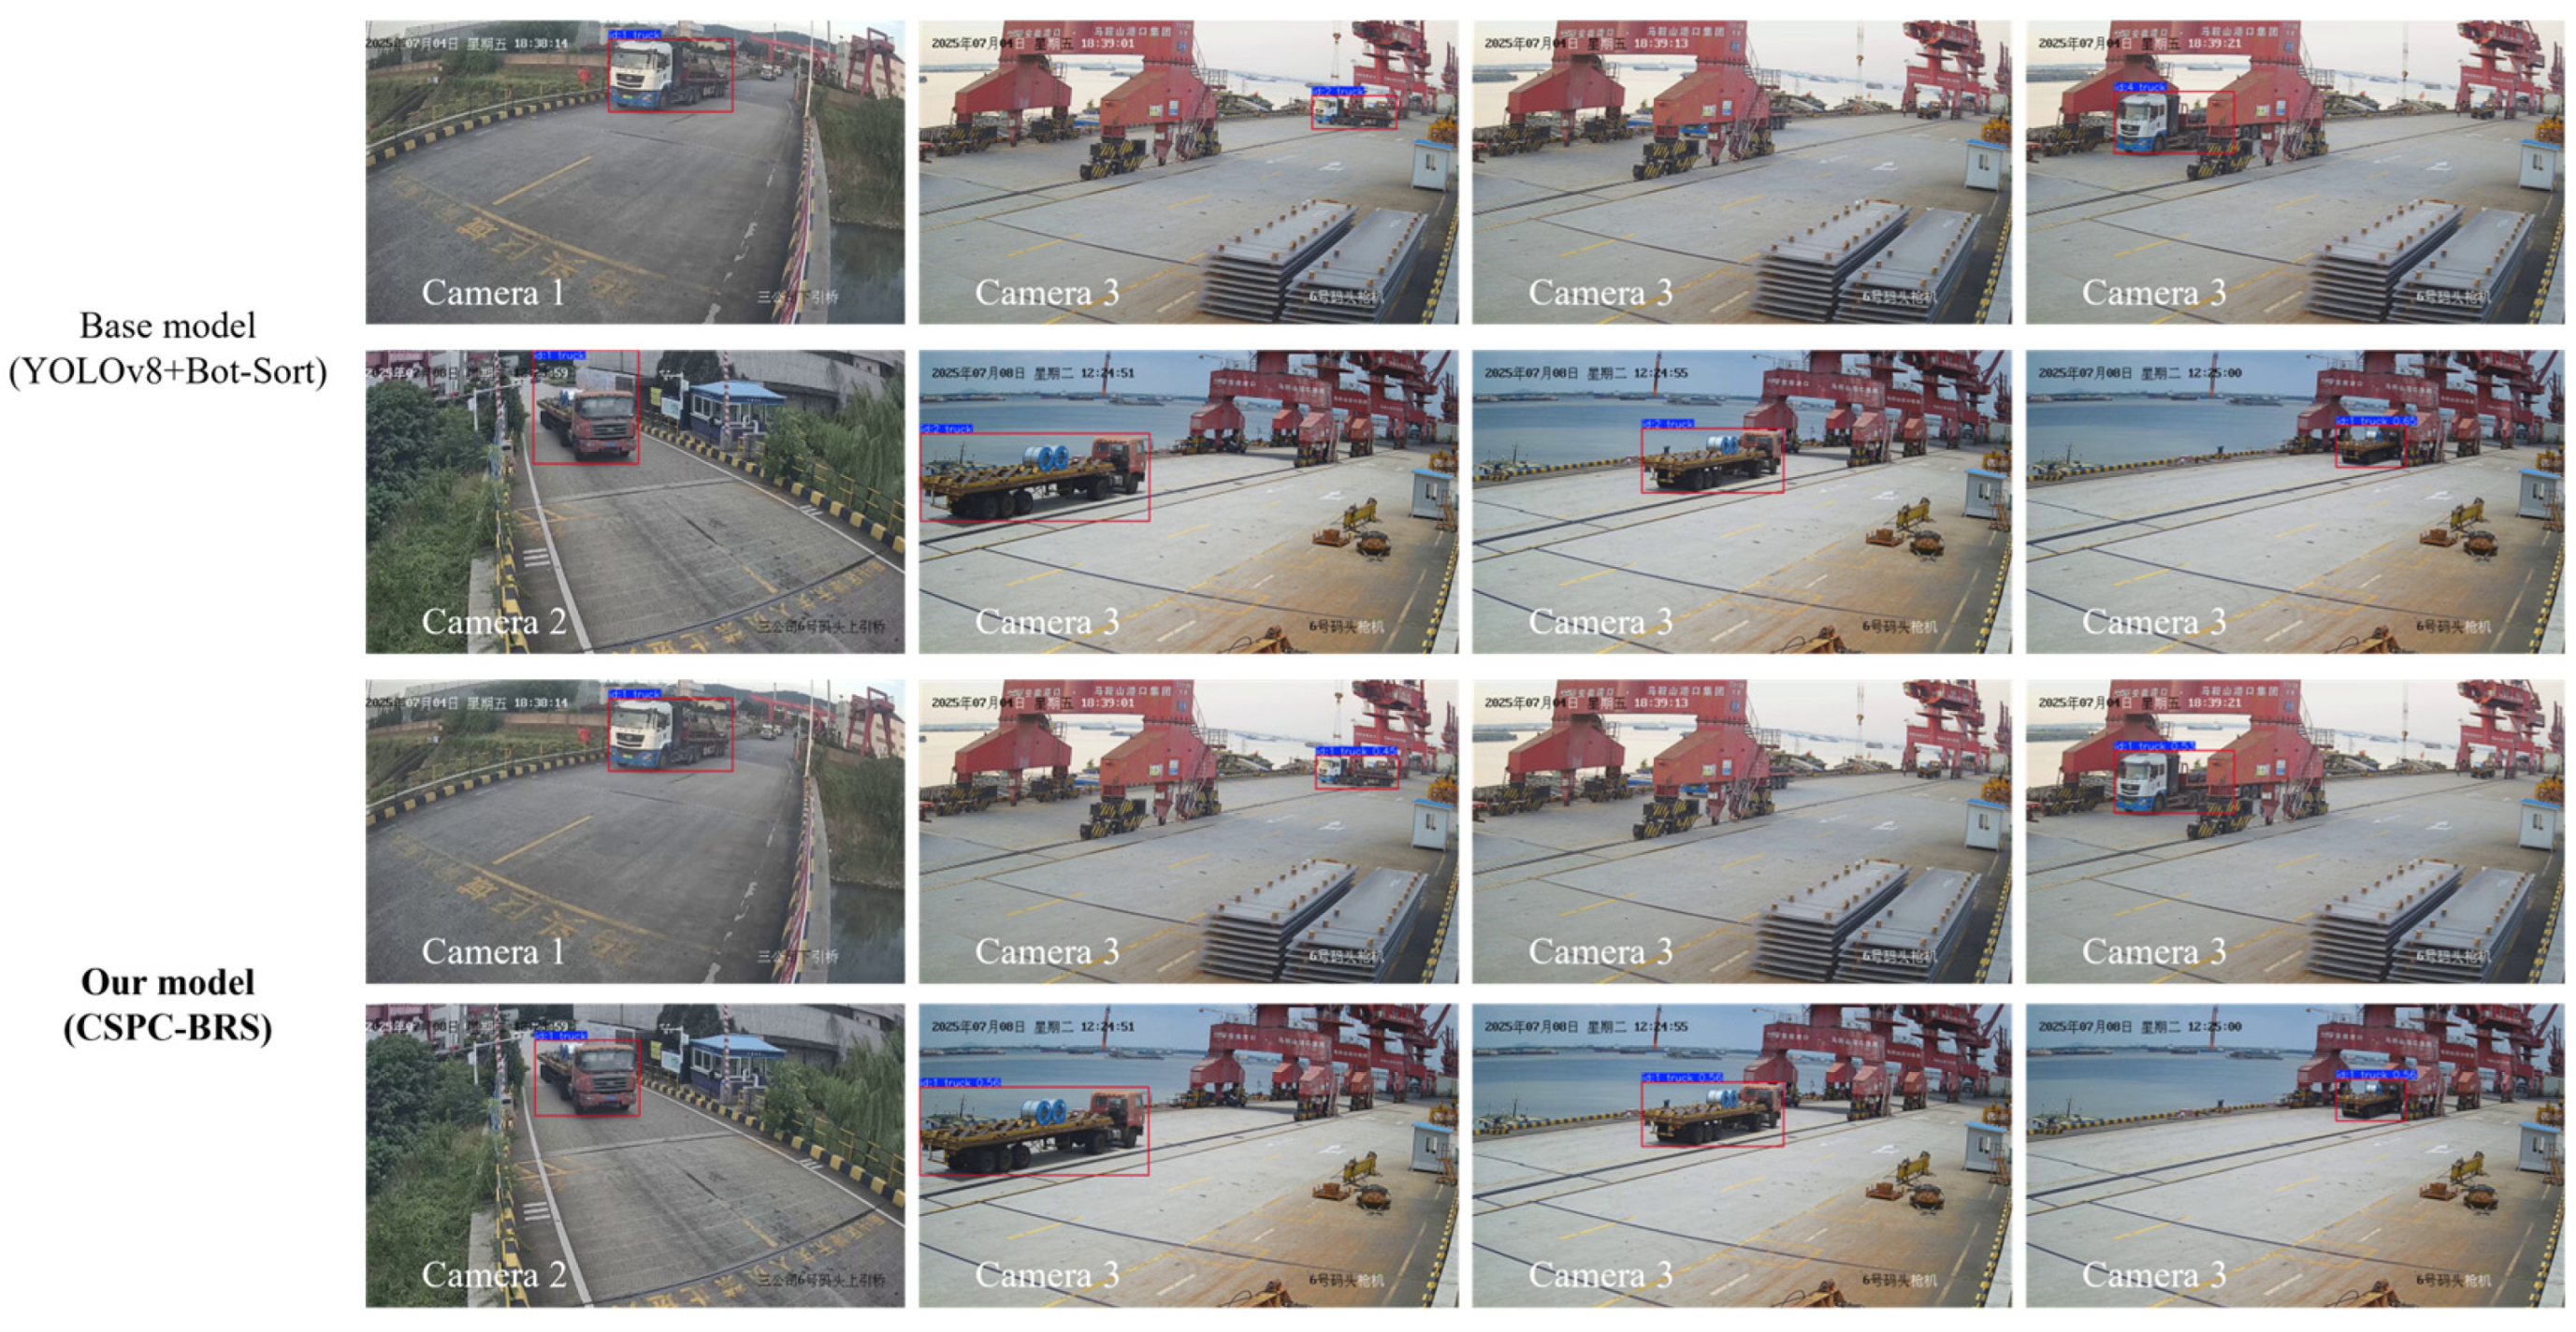
Figure 14.
Visual comparison of tracking performance in complex environments.
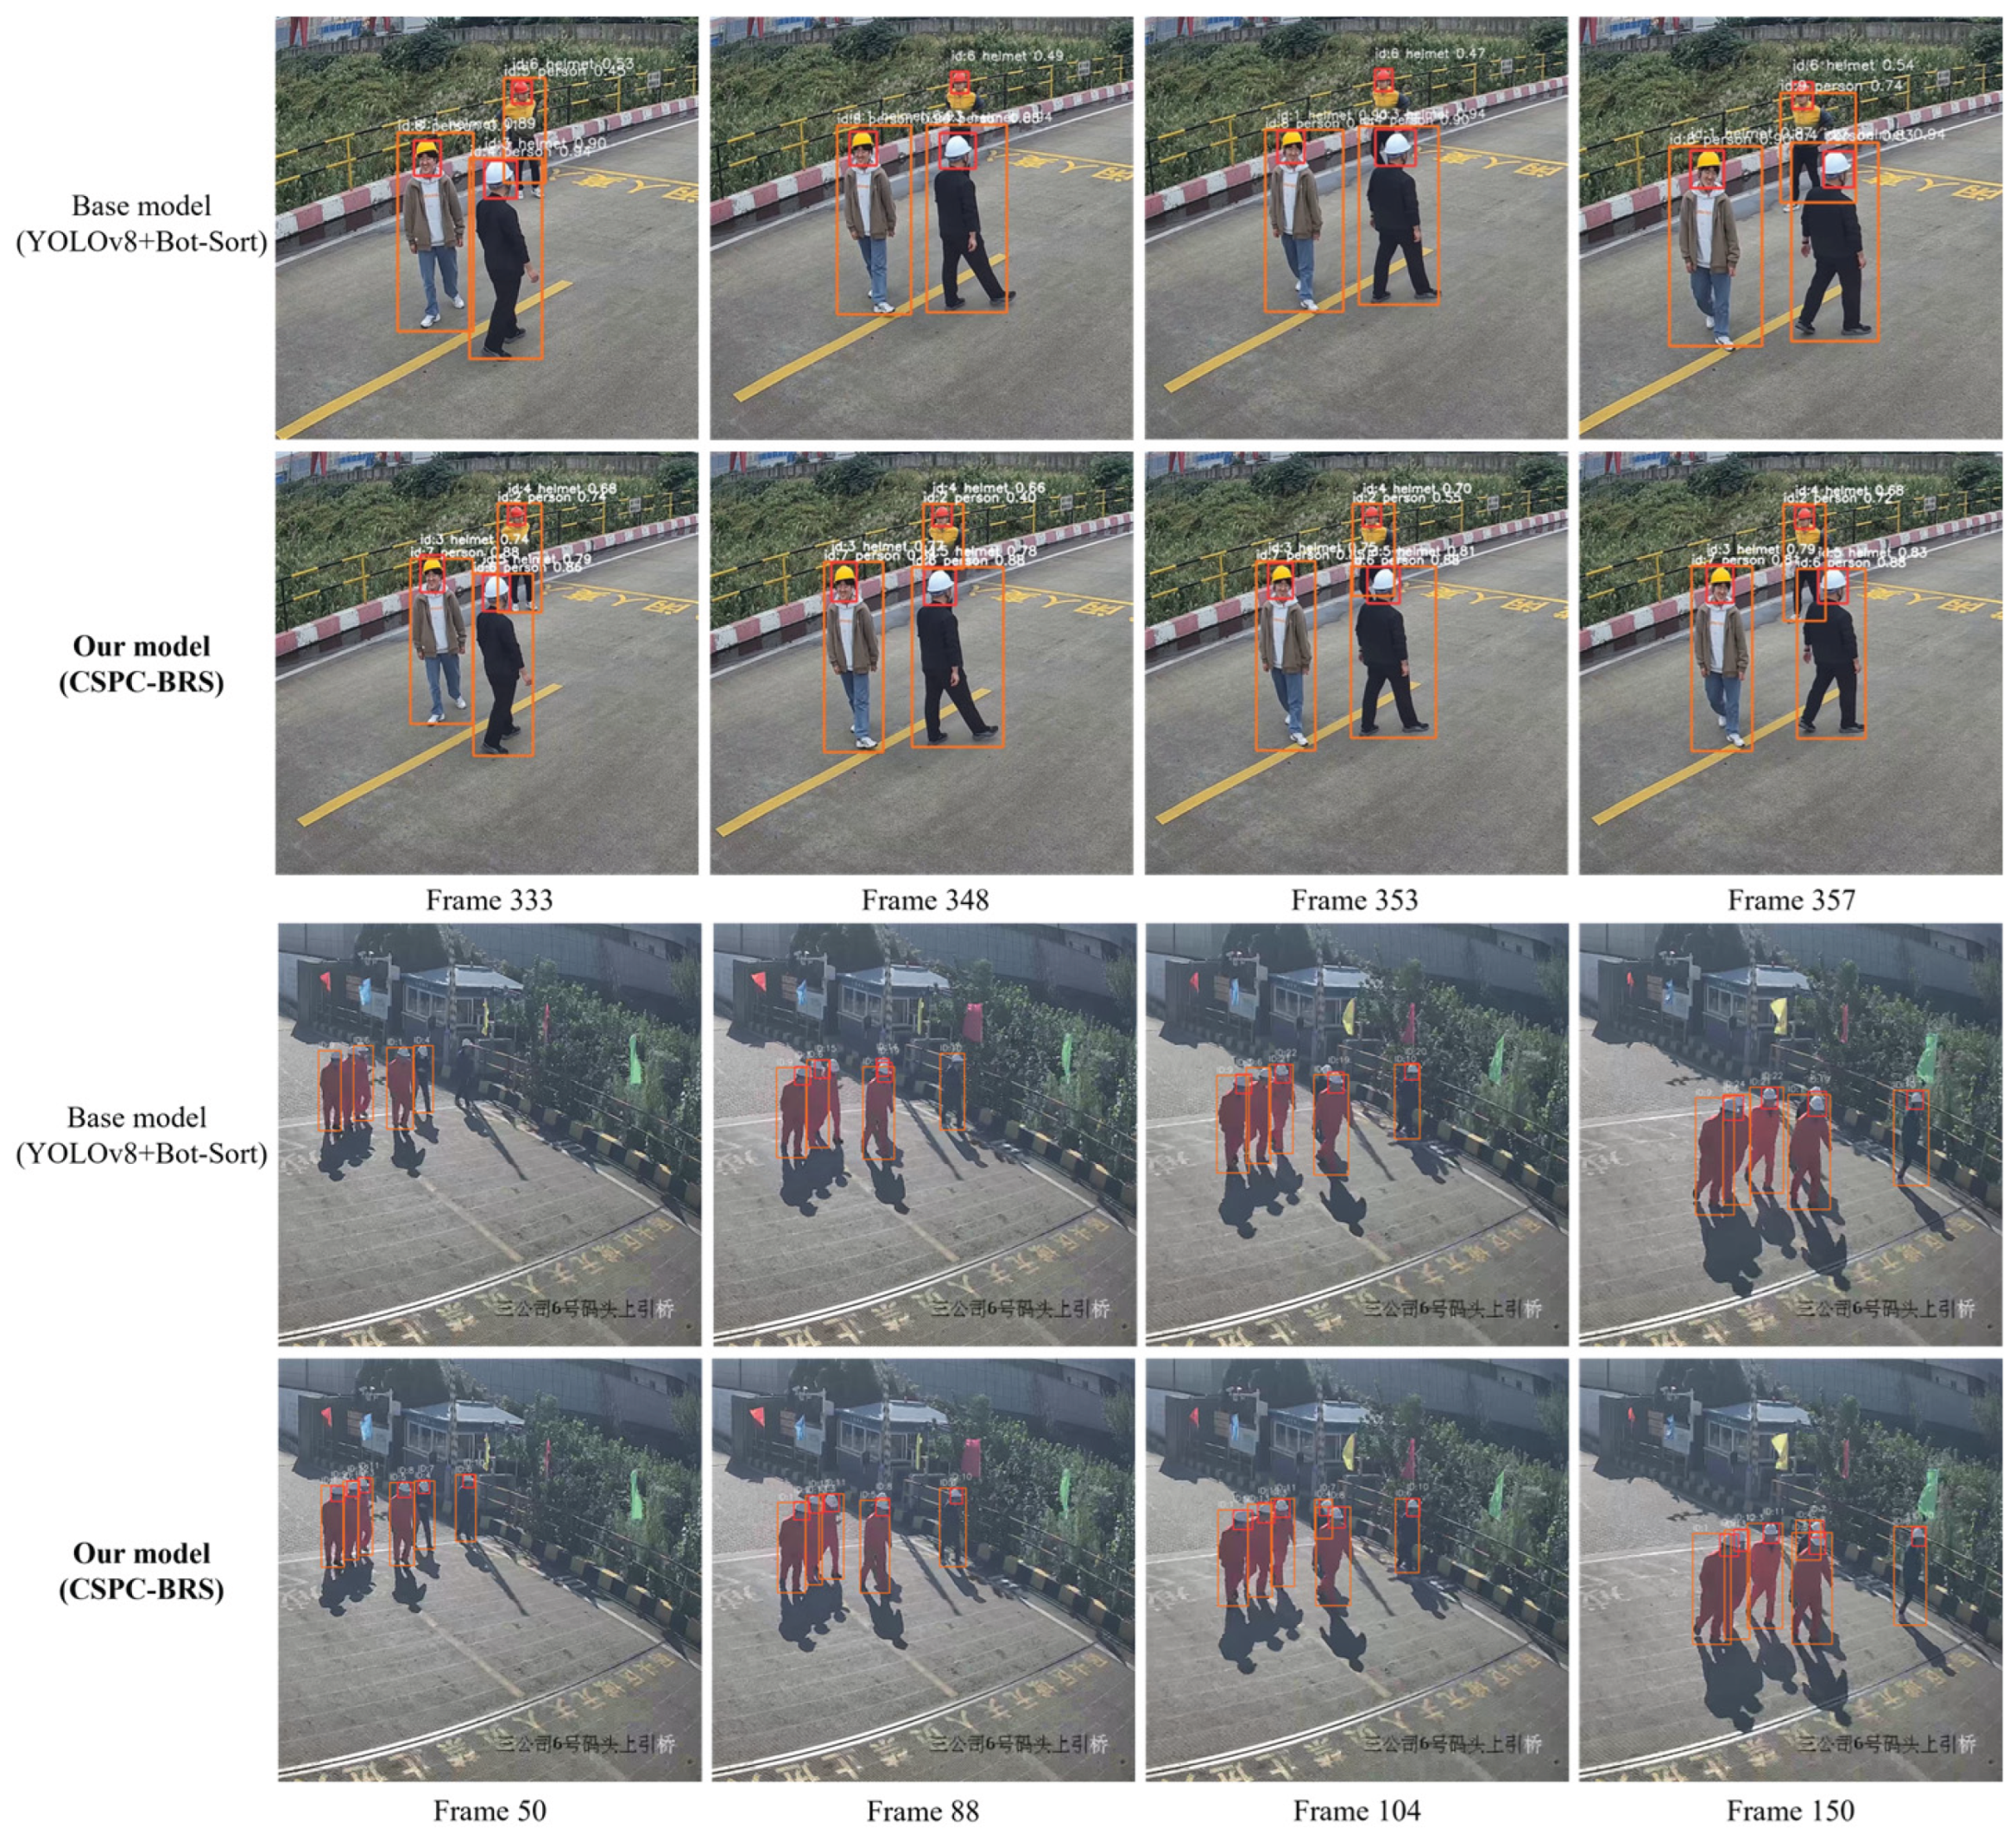

Table 1.
Experimental environment.
| Name | Parameter |
| System | Windows 10 |
| CPU | Intel(R) Core(TM) i5-9300H |
| GPU | NVIDIA GeForce RTX 1650 |
| Framework | Pytorch (1.13.0) |
Table 2.
Experimental Parameter Settings.
| Parameter | Settings |
| epochs | 100 |
| imgsz | 640 |
| optimizer | SGD |
| iou | 0.6 |
| momentum | 0.937 |
Table 3.
Ablation experiment results.
| SPEELAN-DW | CASAM | CACC | mAP@0.5 | mAP@0.5~0.95 | FPS(ms) |
| × | × | × | 0.922 | 0.570 | 123.25 |
| √ | × | × | 0.931 | 0.589 | 129.47 |
| × | √ | × | 0.934 | 0.610 | 127.50 |
| × | × | √ | 0.932 | 0.612 | 126.54 |
| × | √ | √ | 0.938 | 0.599 | 142.30 |
| √ | × | √ | 0.936 | 0.612 | 146.64 |
| √ | √ | × | 0.935 | 0.595 | 144.21 |
| √ | √ | √ | 0.949 | 0.625 | 149.35 |
Table 4.
Comprehensive Comparison of Detection Performance.
| Model | Parameters (M) | GFLOPs | mAP@0.5 | mAP@0.5:0.95 | Improvement vs. YOLOv8 (mAP@0.5:0.95) |
| YOLOv5-n[23] | 1.7 | 4.3 | 0.920 | 0.557 | -2.3% |
| YOLOv6-n[24] | 4.2 | 11.8 | 0.922 | 0.566 | -0.7% |
| YOLOv7-n[25] | 6.0 | 13.2 | 0.909 | 0.521 | -8.6% |
| YOLOv8-n (Baseline) [26] | 3.0 | 8.1 | 0.925 | 0.570 | Reference |
| RT-DETR-R18[27] | 5.9 | 13.1 | 0.915 | 0.568 | -0.4% |
| PP-YOLOE+-s[28] | 3.2 | 8.9 | 0.927 | 0.579 | +1.6% |
| NanoDet-Plus[29] | 1.1 | 0.8 | 0.865 | 0.452 | -20.7% |
| CSPC-BRS (Ours) | 3.6 | 8.6 | 0.949 | 0.625 | +9.6% |
Table 5.
Analysis of Computational Efficiency and Real-Time Performance.
| Model | Pre-Processing (ms) | Inference (ms) | Post-Processing (ms) | FPS |
| YOLOv5-n | 0.3 | 6.2 | 2.2 | 114.94 |
| YOLOv6-n | 0.5 | 5.8 | 3.5 | 101.86 |
| YOLOv7-n | 0.5 | 5.3 | 3.4 | 108.69 |
| YOLOv8-n | 0.4 | 6.9 | 0.9 | 123.25 |
| RT-DETR-R18 | 0.5 | 8.3 | 0.6 | 106.38 |
| PP-YOLOE+-s | 0.4 | 6.5 | 1.5 | 118.34 |
| NanoDet-Plus | 0.3 | 2.1 | 1.8 | 238.10 |
| CSPC-BRS (Ours) | 0.4 | 4.9 | 1.4 | 149.35 |
Table 6.
MDRS Weight Ablation Study Results.
| Configuration | Color | Texture | Shape | Motion | Size | Temporal | IDF1 | Improvement over Baseline |
| Baseline | 0.167 | 0.167 | 0.167 | 0.167 | 0.167 | 0.167 | 0.741 | - |
| Color-only | 1.0 | 0 | 0 | 0 | 0 | 0 | 0.782 | +5.5% |
| No temporal constraint | 0.42 | 0.21 | 0.16 | 0.16 | 0.05 | 0 | 0.801 | +8.1% |
| Configuration B | 0.35 | 0.25 | 0.15 | 0.15 | 0.05 | 0.05 | 0.815 | +10.0% |
| Configuration C | 0.45 | 0.15 | 0.15 | 0.15 | 0.05 | 0.05 | 0.821 | +10.8% |
| Configuration D | 0.40 | 0.20 | 0.10 | 0.20 | 0.05 | 0.05 | 0.812 | +9.6% |
| Configuration E | 0.40 | 0.20 | 0.20 | 0.10 | 0.05 | 0.05 | 0.808 | +9.0% |
| Configuration A (Ours) | 0.40 | 0.20 | 0.15 | 0.15 | 0.05 | 0.05 | 0.829 | +11.9% |
Table 7.
Comparison of Results for Capturing Violation Images in Practical Applications.
| Places | Violations | False Captures | False Captures Rate(%) |
| Base model(YOLOv8+Bot-Sort) | |||
| A | 2122 | 67 | 3.16 |
| B | 1808 | 87 | 4.81 |
| C | 1460 | 78 | 5.35 |
| D | 1246 | 45 | 3.61 |
| Our model(CSPC-BRS) | |||
| A | 1797 | 26 | 1.45 |
| B | 1635 | 31 | 1.89 |
| C | 1320 | 24 | 1.81 |
| D | 1112 | 17 | 1.52 |
Disclaimer/Publisher’s Note: The statements, opinions and data contained in all publications are solely those of the individual author(s) and contributor(s) and not of MDPI and/or the editor(s). MDPI and/or the editor(s) disclaim responsibility for any injury to people or property resulting from any ideas, methods, instructions or products referred to in the content. |
© 2025 by the authors. Licensee MDPI, Basel, Switzerland. This article is an open access article distributed under the terms and conditions of the Creative Commons Attribution (CC BY) license (http://creativecommons.org/licenses/by/4.0/).
Copyright: This open access article is published under a Creative Commons CC BY 4.0 license, which permit the free download, distribution, and reuse, provided that the author and preprint are cited in any reuse.


