Submitted:
11 November 2025
Posted:
13 November 2025
You are already at the latest version
Abstract
This study investigates the spatiotemporal evolution of China’s regular higher education institutions (HEIs) from 1952 to 2023 using ArcGIS spatial analysis to determine spatial patterns and evolutionary trends. By integrating the Geographical Detector and Multi-scale Geographically Weighted Regression (MGWR) models, we analyze the driving factors of—and their spatial heterogeneity in shaping—HEI distribution. Findings reveal that (1) the spatial distribution of China’s HEIs has become increasingly clustered, transitioning from a “point-like” to a “network-like” and finally to a “surface-like” pattern, with its center shifting southwestward. (2) HEIs’ spatial differentiation results from multiple interacting factors, with significant variations in their explanatory power. Key drivers include the number of full-time faculty, regional GDP, national universities’ presence during the Republic of China era, and fiscal expenditure on education. Regional population size also exerts a notable influence. (3) The impact of these factors exhibits significant spatial heterogeneity, with pronounced local imbalances. In short, multi-scale processes operating at different geographical levels have shaped HEIs’ spatial pattern. These findings provide critical insights for optimizing higher education resource allocation, promoting balanced regional development, and advancing the construction of a high-quality education system in China.
Keywords:
regular higher education institutions
; spatiotemporal evolution
; geographical detector
; multi-scale geographically weighted regression
; China
1. Introduction
China’s economy has transitioned from rapid growth to high-quality development, marking a pivotal phase of fiscal transformation and industrial upgradation. In this context, technological innovation has emerged as a core driver of national and regional development [1]. Higher education institutions (HEIs), as primary hubs of knowledge production and talent cultivation, support and lead technological innovation, thereby driving regional socioeconomic progress [2,3]. The National Medium- and Long-Term Education Reform and Development Plan (2010–2020) emphasizes enhancement of higher education quality, optimizes its structural and regional distribution, and promotes equitable access to educational resources. Similarly, the 14th Five-Year Plan and the 2035 Vision Outline promote the construction of a diversified higher education system and improved spatial allocation of higher education resources. Such policy directives underscore the central government’s commitment to addressing regional disparities in higher education and fostering a more balanced and coordinated development of the sector. Since the 18th National Congress of the Communist Party of China, the country’s higher education system has progressed remarkably. By 2023, enrollment in higher education reached 47.63 million, with a gross rate of 60.2%, and the number of regular HEIs increased to 2,820, making China’s higher education system the world’s largest [4,5,6]. However, significant spatial imbalances persist in HEI distribution, raising concerns about regional equity and resource allocation. Systematic analysis of HEIs’ spatiotemporal evolution, coupled with an exploration of the factors driving their spatial distribution, is essential for informing China’s policy decisions and promoting the equitable development of higher education.
Internationally, research on the spatial distribution of educational resources can be traced to the 1950s. Early studies mainly focused on the economic implications of education; for instance, Samuelson applied the market failure theory to analyze the distribution of public service facilities, including educational institutions, around administrative centers [7]. Su emphasized the role of economic development in shaping public funding allocation across educational stages [8], while S. Bowles employed quantitative models to explore factors influencing educational resources’ allocation [9]. More recent studies have examined optimization of higher education resource allocation from an educational economics perspective [10,11] and used GIS-based spatial analysis to model educational facilities’ distribution [12,13]. In China, higher education’s rapid expansion since the 21st century has spurred extensive research on HEIs’ spatial distribution, drawing on theories of spatial layout, resource allocation, and new economic growth. These studies have explored higher education’s spatial patterns [14], its influencing factors [15], and its spatial distribution’s effects [16] by employing such methodologies as mathematical modeling [17], GIS spatial analysis [18], and qualitative analysis [19].
Despite these advances, there are several gaps in the literature. First, as most studies rely on cross-sectional data or short-term observations, they fail to capture the long-term dynamics of HEI distribution. Second, although qualitative approaches have been widely used to explain the mechanisms driving HEI distribution, few studies have employed quantitative models to analyze the spatial heterogeneity of influencing factors. To address these gaps, this study examines 2,820 regular HEIs in China; it uses GIS spatial analysis to explore HEIs’ spatiotemporal evolution and applies the Geographical Detector and MGWR models to identify the factors influencing their distribution and spatial heterogeneity. The findings of the study provide valuable insights for optimizing the spatial allocation of higher education resources and evidence for policy formulation.
2. Data and Methods
2.1. Data Sources and Processing
The list of HEIs in the People’s Republic of China—2,820 institutions, including 1,274 undergraduate colleges and universities and 1,546 specialized colleges and universities (excluding military colleges and universities, Hong Kong, Macao, Taiwan, and other regions)—was obtained from the Ministry of Education (http://www.moe.gov.cn/). HEIs’ coordinates were obtained using the Baidu coordinate picking system (https://api.map.baidu.com/), and errors were corrected using GeoSharp. Administrative districts’ base map data were downloaded from the standard map service website of the State Bureau of Surveying, Mapping and Geographic Information Service (http://bzdt.ch.mnr.gov.cn/; review number GS (2019) 1822); the base maps were not modified. Socioeconomic data were obtained from China’s Urban Statistical Yearbook 2023 and each province’s (city’s) national economic and social development statistical bulletin for that year.
2.2. Research Methodology
2.2.1. Nearest Neighbor Index
The Nearest Neighbor Index (NNI) constitutes a fundamental spatial statistical metric for assessing point-referenced geographical entities’ distribution patterns. This analytical method has been employed extensively to determine HEIs’ spatial agglomeration characteristics through quantitative measurement of their geographical dispersion [20], mathematically formulated as follows:
where R denotes the NNI; mindij is the Euclidean distance between any HEI in the region and its nearest neighboring HEI; n is the total number of HEIs; and A is the study’s geographical area. R>1 indicates HEIs’ dispersed distribution, R<1 indicates their clustered distribution, and R = 1 indicates their random distribution.
2.2.2. Kernel Density Analysis
Kernel density analysis estimates the density of point or line pattern based on moving cells that effectively depict HEIs’ agglomeration [21], with the following formula:
where f(x,y) is HEIs’ density estimation at spatial location (x,y), is the kernel function, di is HEIs’ distance at location (x,y) from the ith observation point, n is the number of sample points, and h is the bandwidth or smoothing parameter.
2.2.3. Center of Gravity Shift and Standard Deviation Ellipse
The center of gravity transfer model can summarize the spatial center of gravity change trajectory of geographic elements; therefore, with this model [22], this study analyzes HEIs’ center of gravity migration direction and distance, using the following formulas:
where X and Y denote the coordinates of HEIs’ center of gravity; Xi and Yi are the coordinates of each research unit; and Wi is the number of HEIs in the ith research unit.
The standard deviation ellipse can well express the distribution range and direction trend of geographic elements in the study area. This paper uses the ellipse to describe HEIs’ spatial distribution profile and dominant direction [23] with the following formulas:
where SDEx and SDEy represent the ellipse’s long and short axes; xi and yi represent the coordinates of college i; X and Y represent all HEIs’ average center; and n is the total number of HEIs.
2.2.4. Geographic Detector
The geographic detector reveals the degree to which influencing factors shape the spatial distribution of HEIs by exploring the relationship between variance and total variance within an attribute layer [24], using the following formula:
where q represents how well an influencing factor detects the spatial pattern of HEIs, the value interval is [0, 1], and a larger q-value indicates the factor’s stronger degree of influence. L is a variable’s stratification; Nh and N are the number of cells in layer h and the whole area, respectively; and and represent the variance of the Y value in layer h and the whole area, respectively.
2.2.5. Multi-scale Geographically Weighted Regression (MGWR)
To test and model spatial heterogeneity, Fotheringham et al. proposed the MGWR model, now widely used to study spatial non-stationarity [25,26] with the following formula:
where yi is the number of HEIs in city i; bwj is the bandwidth of the jth variable; (ui,vi) are the geographic coordinates of city i; Xij is the jth variable of city i; βbwj is the local regression coefficient of the jth variable; and εi is the error term.
2.3. Determination of the Study Period
In 1952, the Chinese government implemented large-scale restructuring in the faculty and departmental settings of HEIs across the country. In 1978, HEIs resumed the college entrance examination, aligning with the economic reform and opening-up in the country; around 2000, the expansion of universities and the merger of colleges and universities were implemented. Then, in 2014, the State Council issued the “Implementing Opinions on Deepening the Reform of Examination and Admission System,” which proposed gradually abolishing enrollment in and three admission batches of HEIs and establishing private colleges and universities on a large scale. Because these years mark significant steps in the development of China’s HEIs and have promoted the overall quality of higher education, this study selected 1952, 1978, 2000, 2014, and 2023 as its time nodes.
3. Results
3.1. Evolutionary Characteristics of General Colleges and Universities’ Spatial Distribution
3.1.1. Spatial Distribution Toward Clusters
In 1952, China’s HEIs underwent large-scale faculty restructuring, thus initiating the basic pattern of China’s higher education system. The number of general HEIs has since evolved through a systematic, diversified development trend from 201 in 1952 to 2,820 in 2023—a significant growth trend. Based on the data of Chinese general HEIs over five time periods from 1952 to 2023, the average NNI was calculated using ArcGIS10.8 software (Table 1). For each type of HEI, the NNI of undergraduate colleges and universities decreased slowly from 0.347 to 0.273, with an average annual decrease of 0.30 percentage points, while that of specialized colleges and universities fluctuated but steadily decreased from 0.380 to 0.258, with an average annual decrease of 0.45 percentage points. The NNI of overall HEIs decreased from 0.290 to 0.169, with an average annual decrease of 0.59 percentage points. Proximity indices of different types and universities as a whole are all less than 1 and show a fluctuating downward trend, with a P-value of less than 0.01 and a confidence level of 99%, indicating that Chinese HEIs’ distribution pattern is not only moving toward clustering but that this trend is gradually increasing.
3.1.2. Evolution of Spatial Distribution Density with a Spreading Trend
To reflect intuitively ordinary HEIs’ spatial agglomeration evolution, the kernel density estimation method was used to visually analyze the overall spatial distribution density and that of various HEI types during different time periods (Figure 1). In general, ordinary HEIs’ distribution is “dense in the southeast and sparse in the northwest” with the Hu Huanyong Line as the boundary. About 93% of ordinary HEIs are distributed to the right of the Hu Huanyong Line, and undergraduate and junior colleges account for about 94% and 92%, respectively. Ordinary HEIs’ overall spatial distribution pattern shows a “point-network-plane” evolution trend, and their scope of agglomeration is gradually expanding. In the early development stages, agglomeration was mainly point-like, but later, agglomeration began to coexist with the diffusion effect. Agglomeration centers are mainly located in the Beijing-Tianjin-Hebei region around the Bohai Sea; the Jiangsu, Zhejiang, and Shanghai Yangtze River Delta region; and the Hubei, Hunan, and Jiangxi Central Triangle region east of the Hu Huanyong Line. Not surprisingly, different types of HEIs exhibit differing spatial distribution and evolution characteristics. Specifically, (1) with the dual core of Beijing-Tianjin-Hebei and Jiangsu, Zhejiang, and Shanghai, undergraduate colleges radiate southwest to Shanxi, Shandong, Hubei, Hunan, and Jiangxi; they continue to extend southward to the intersection of Sichuan-Yunnan-Guizhou and the Pearl River Delta. (2) High-density HEI centers in Shanxi, Hebei, Henan, Jiangsu, Zhejiang, Anhui, Chengdu-Chongqing, Hubei, and Hunan are distributed in a network; the core cluster area spreads from northeast to southwest and coastal areas, eventually forming a multi-point cluster, with a “blooming everywhere” pattern.
3.1.3. Spatial Distribution’s Center of Gravity Shifts Southwest
The standard deviation ellipse can reveal overall directional characteristics of general HEIs’ spatial distribution (Figure 2). As for spatial and temporal distribution’s center of gravity, the average distribution center of general HEIs as a whole varies between 114.536°E–113.782°E and 33.801°N–33.291°N; it is located roughly in the middle of Henan Province, and the layout’s center of gravity shows a migration route westward and southward. In 1999, when the Ministry of Education issued the “Action Plan for Revitalizing Education in the 21st Century,” HEIs’ expansion began. From 1999 to 2023, ordinary HEIs more than doubled, from 1071 to 2820. Further examination of different types of HEIs’ spatial evolution reveals that (1) undergraduate colleges and universities’ spatial distribution shows a northeast–southwest direction, with the turning angle θ decreasing from 34.060° to 29.563° and, generally, a small counterclockwise rotation. This indicates that the number of undergraduate colleges and universities in the northwest and southeast directions has increased, but the overall trend is not significant; (2) specialized colleges and universities’ spatial distribution also shows a northeast–southwest direction, and the turning angle θ increases from 29.661° to 32.480°, with an overall clockwise rotation, reflecting an enhanced northeast–southwest distribution. Meanwhile, the standard deviation ellipse’s short axis is significantly higher than that of undergraduate colleges, indicating that their east–west spatial distribution trend is more obvious than that of undergraduate colleges.
3.2. General Colleges and Universities’ Influencing Factors in Spatial Distribution
3.2.1. Influential Factors’ Selection and Description
General HEIs’ spatial distribution results from a combination of factors. Densely populated areas tend to have greater demand for higher education, and such regions’ population size and potential education demand are the basic conditions for HEIs’ layout. Economically developed regions can provide better financial support for education and scientific research, thus promoting HEIs’ distribution and development. As the macro-control and planning manager of HEIs’ construction and administration, the government plays an important role in regulating and supervising their distribution. Regions with long cultural history have accumulated rich educational resources, and HEIs’ early historical evolution has laid the foundation for later construction in various other locations [27]. Thus, this paper combines colleges and universities’ spatial differentiation characteristics and existing research results [14,27,28]; comprehensively considers scientific, representative, and accessible indicators; and selects 10 independent variable indicators to construct an indicator system from the four dimensions of population size, socioeconomics, policy support, and historical background. Among these, population size is characterized by household population (X1). Socioeconomics is characterized by GDP (X2), GDP per capita (X3), financial expenditure for education (X4), the number of full-time instructors in HEIs (X5), the proportion of nonagricultural industries (X6), end-of-year highway mileage (X7), and the urbanization rate (X8). Policy support is characterized by mention of “colleges and universities” in the government’s annual work report (X8). Finally, historical background is characterized by the number of national universities in the Republic of China (X10). Data obtained for each indicator were categorized into five types according to the natural discontinuity method, so that they were converted from numerical to typological quantities.
3.2.2. Influence Factor Analysis Based on Geodetector
The text takes the number of general HEIs in cities of various grades and above as the detecting factor Y (dependent variable). Table 2 shows detected influencing factors; different factors significantly influence general HEIs’ spatial distribution, and their explanatory power’s magnitude varies. According to the q-value, influencing factors are divided into two levels; the top four of the 10 first-tier indicators (four dimensions) are the number of full-time instructors in HEIs (0.683) > GDP (0.495) > the number of national universities in the R.O.C. (0.433) > the financial expenditure on education (0.419). For general HEIs, economic development dominates spatial distribution; besides, the explanatory power of the number of full-time faculty and GDP ranked first and second, much higher than that of other influencing factors. In regions with higher levels of economic development, government and enterprises better support higher education by providing sufficient financial support for general HEIs, promoting educational quality, attracting more excellent teachers and students, and thus prompting general HEIs’ new construction and expansion. In addition, general HEIs’ construction process is closely related to China’s historical process. In early modern times, the Qing government began to build new-style higher education, and as of 1948, 31 national universities had been built across the country (excepting Hong Kong, Macao, and Taiwan). National universities’ construction in the Republic of China laid an important foundation for New China’s subsequent development of higher education. In regions with better roots, higher education levels were always in the leading position, profoundly impacting the spatial distribution pattern of today’s general HEIs [23].
In influencing factors’ second tier are household population (0.264) > urbanization rate (0.197) > proportion of nonagricultural industry (0.147) > GDP per capita (0.126) > policy support (0.079) > end-of-year road mileage (0.073), with q-values ranging from 0.073 to 0.264— relatively weak influence factors. Among these, population size and urbanization rate are the top two, respectively. This shows that general HEIs’ distribution is inseparable from the population’s support. The strong demand for education in densely populated areas attracts many general HEIs. For example, developed eastern coastal regions such as Beijing, Shanghai, and Guangdong have high population density and high demand for education, leading to more concentrated distribution of general HEIs. In the less populated areas of Xinjiang and Tibet, the number of general HEIs is relatively small, and educational resources are concentrated mainly in provincial capitals and other densely populated locations. At the same time, with the acceleration of urbanization, educational resources (e.g., instructors, funds, facilities) become gradually concentrated in cities, making the number of urban, general HEIs relatively superior in quantity and quality and promoting their further rapid development. Therefore, a combination of economic and demographic factors greatly influence China’s spatial distribution of general HEIs.
3.2.3. Influencing Factors’ Spatial Differentiation Based on MGWR
The further to explore influencing factors’ spatial differentiation characteristics of general HEIs’ distribution pattern, this paper uses the MGWR model, taking the number of general HEIs as the dependent variable, selecting influencing factors with the top four explanatory powers as independent variables, and, from a local perspective, exploring directional differences in the factors’ action and their action’s intensity. Compared with GWR, MGWR has the advantage of allowing the conditional relationship between the independent and dependent variables to vary across differing spatial scales, generating unique optimal bandwidths for each of them. Model results show that the Akaike information criterion AICc was 278.552 and that the adjusted R2 was 0.863, indicating good fit and reflecting the geoprobe results’ plausibility. At the geographic level unit, each influencing factor’s regression coefficients were counted to obtain the mean, standard deviation, minimum, median, and maximum; this shows that each influencing factor had fractional anisotropy on general HEIs’ spatial distribution. As Table 3 shows, the bandwidths of different variables vary substantially. In fact, the bandwidth of the number of full-time HEI instructors is the smallest, at 45, indicating that general HEIs’ distribution is more spatially varied with change in faculty. This is followed by GDP (bandwidth = 110), which reflects a relatively high degree of spatial heterogeneity. Educational expenditure and the number of Republican National Universities have a bandwidth of 290, suggesting that spatial heterogeneity is less significant. Each influencing factor’s effect has spatial non-stationarity, and each factor’s regression results are visualized and expressed through the natural break method (Figure 3).
(1) The GDP regression coefficient is −0.137–0.362, in which 51.20% of the analyzed units positively correlated with HEIs’ distribution, and the difference between the maximum and minimum regression coefficients is 0.499, indicating a big difference in support for construction of general HEIs among various regional governments. As Figure 3a illustrates, regression coefficients are largest in the northeast, the mid-east, and the southeast, and they tend to decrease from the border of Henan and Shaanxi to the west. Economically developed regions are usually able to attract more resources and become regions of general HEI concentration, while more economically backward regions have limited resources, resulting in a smaller number of local general HEIs or a relatively low level of development.
(2) The regression coefficient of the number of full-time instructors in HEIs is 0.286–1.041, which is positively associated with the spatial distribution of general HEIs. As Figure 3b illustrates, the regression coefficient of the number of full-time instructors has significant spatial differentiation and prominent imbalance; moreover, the regression coefficients of all analyzed units correlate positively and are generally larger relative to other influencing factors. In the northwestern Gansu and Xinjiang bordering areas, central Yunnan, Jiangxi, and its regional surrounding parts are characterized by distribution of the number of instructors at more general HEIs. In the Beijing-Tianjin-Hebei and Pearl River Delta area, the remaining regression coefficients are less concentrated. Overall, construction of general HEIs in the central and western regions depends more on the number of full-time instructors.
(3) Regression coefficients for the number of R.O.C. national universities range from 0.033 to 0.045, and the effects on general HEIs’ distribution are all positive in all units of analysis (3c). Overall, regression coefficients decrease in a gradient from southwest to northeast. Their fluctuation is small compared with other variables; the difference between maximum and minimum values is only 0.012, so the difference in spatial effect is weak. This indicates that the degree of reliance on historical schools in the construction of general HEIs in each region does not differ considerably. In fact, other factors exert a greater influence on the differences in general HEIs’ spatial distribution.
(4) Educational expenditures’ regression coefficients are 0.149–0.169, with significant positive influence effects. The difference between their maximum and minimum values is 0.020, indicating little difference in spatial influence effects of educational expenditures on general HEIs’ distribution (3d). The highest regression coefficients are found in the entire regions of Guangdong and Fujian and in some regions of Guangxi, Hunan, Jiangxi, and Zhejiang, indicating that the educational expenditures and the number of general HEIs in these regions remain highly consistent. Overall, most regions are characterized by high educational expenditures and general HEIs’ wide distribution. Educational expenditures determine local government’s scale of investment in higher education, in turn directly impacting general HEIs’ conditions, infrastructure construction, and research funding.
4. Discussion
From a macro perspective, this paper explores the heterogeneity of ordinary universities’ spatial distribution in China. It focuses on ordinary HEIs’ spatial evolutionary pattern and influencing factors’ spatial differentiation, which have practical significance for understanding the spatial pattern and its driving mechanism. Even so, due to limitations of data acquisition, the indicators selected may not be comprehensive; thus, the indicators themselves and their quantification methods should be improved in future studies. Moreover, this study is limited to the spatial differentiation of influencing factors using cross-sectional data. However, influencing factors’ possible temporal heterogeneity has yet to receive sufficient attention. Finally, explanation of the scale effect is difficult in the MGWR model’s application. Although this paper attempts to explain it, this part remains weak from lack of theoretical support—an area to be strengthened in future research.
5. Conclusions
Among other methods, this paper uses GIS spatial analysis to explore characteristics of the spatial evolution pattern of ordinary universities in China from 1952 to 2023. It also uses a geographical detector and the MGWR model to identify influencing factors and spatial differences of the spatial pattern of ordinary universities from global and local spatial scales. The main conclusions are as follows.
(1) From 1952 to 2023, the number of HEIs in China steadily trended upward. The spatial distribution pattern of agglomeration also became increasingly significant, evolving as a “point-network-surface,” with the agglomeration center located mainly to the east of the Hu Huanyong Line. The direction of spatial distribution was northeast–southwest, and the distribution direction was northeast–southwest. The direction of spatial distribution was northeast–southwest, and the center of gravity of distribution generally moved to the southwest.
(2) Results of geographic exploration reveal significant differences in influencing factors’ degrees of explanation of spatial differentiation. Among the factors are the number of full-time instructors, GDP, the number of R.O.C. national universities, and educational expenditures. Year-end highway mileage is a secondary influencing factor. Thus, HEIs’ spatial distribution results from the combined influence of multiple factors.
(3) The results of the MGWR model show that HEIs are concentrated in areas with high GDP levels, and their influence decreases from east to west in a circle. In the northwest and southwest regions, HEI construction relies on faculty strength more strongly than in other regions. The influence of historical background decreases stepwise from the core of the four southwestern provinces (districts) of Yungui–Guizhou–Sichuan–Guangxi to the northeast. Education expenditures significantly and positively impact HEIs’ distribution, especially in the southeast coastal region.
Author Contributions
Conceptualization, J.S.; methodology, J.S.; software, J.S. and M.C.; validation, J.S.; formal analysis, J.S. and J.Z.; resources, J.S. and M.C.; data curation, J.S. and M.C.; writing—original draft preparation, J.S. and J.Z.; writing—review and editing, J.S. and F.Y.; visualization, M.C.; supervision, M.C.; project administration, J.S., J.L., J.C.; funding acquisition, J.S., J.L., J.C. All authors have read and agreed to the published version of the manuscript.
Funding
This research was funded by the National Natural Science Foundation of China (42361028, 42271228), the Humanities and Social Science Fund of Ministry of Education (24YJC630028), the Humanities and Social Science Research Project of Guizhou Provincial Department of Education (24RWZX007).
Institutional Review Board Statement
Informed consent was obtained from all subjects involved in this study
Informed Consent Statement
Not applicable.
Data Availability Statement
The original contributions presented in the study are included in the article; further inquiries can be directed to the corresponding authors.
Conflicts of Interest
We declare that we have no financial and personal relationships with other people or organizations that could interfere with our study.
Abbreviations
The following abbreviations are used in this manuscript:
| HEI | Higher education institutions |
| MGWR | Multi-scale Geographically Weighted Regression |
| NNI | Nearest Neighbor Index |
References
- Gu, H.; Shen, T. Spatial evolution characteristics and driving forces of chinese highly educated talents. Acta Geographica Sinica 2021, 76, 326–340. [Google Scholar]
- Wuyuan, C.; Qingfeng, C.; Zhangji, C. University agglomeration, knowledge spillover and the cultivation of specialized, fined, peculiar and innovative “little giant” enterprises. Educational Research 2022, 43, 47–65. [Google Scholar]
- Xichun, Z.; Zhengying, Y.; Shenghui, L. Spatio-temporal characteristics and knowledge spillover effects of basic research output in Chinese colleges and universities. Economic Geography 2024, 44, 118–126. [Google Scholar]
- Sen, L.; Zhentian, L.; Shijian, C. China’s road to the construction of a powerful country in higher education. Journal of Higher Education Management 2024, 18, 1–23. [Google Scholar]
- Peijun, G. Comprehensive reform of higher education: key points, difficulties and methods. China Higher Education Research 2024, 1–12. [Google Scholar]
- Liguo, L.; Jun, L.; Lan, X. High-quality development of higher education in the context of invigorating China through education (journal articles)-understanding the principles of the national education conference. Journal of Northwestern Polytechnical University (Social Sciences) 1–14.
- Samuelson, P.A. The pure theory of public expenditure. Review of Economics and Statistics 1954, 36, 387. [Google Scholar] [CrossRef]
- Xuejuan, S. Endogenous determination of public budget allocation across education stages[j]. Journal of Development Economics 2006, 438–456. [Google Scholar]
- Bowles, S. The efficient allocation of resources in education. Quarterly Journal of Economics 1967, 81, 189. [Google Scholar] [CrossRef]
- Sallee, J.M.; Resch, A.M.; Courant, P.N. On the optimal allocation of students and resources in a system of higher education[j]. The BE Journal of Economic Analysis & Policy 2008, 8, 11. [Google Scholar]
- Izadi, H.; Johnes, G.; Oskrochi, R.; Crouchley, R. Stochastic frontier estimation of a CES cost function: The case of higher education in Britain. Economics of Education Review 2002, 890–899. [Google Scholar] [CrossRef]
- Ribeiro, A.; Antuens, A.P. A GIS-based decision support tool for public facility planning[j]. Environment and Planning B: Planning and Design. 2002, 29, 553–569. [Google Scholar] [CrossRef]
- Tijs, N.; Tim, S.; Frank, W. Evaluating the temporal organization of public service provision using sapce-time accessibility analysis. Urban Geography 2010, 1039–1064. [Google Scholar]
- Hong, L. The spatial distribution characteristics of china higher education institutions and their influential factors. Journal of Higher Education 2021, 42, 40–47. [Google Scholar]
- Wei, J.; Weidong, G.; Zhang, M. Spatial distribution of higher education in China: Recent changes and influencing factors. Modern University Education 2013, 43–50. [Google Scholar]
- Haoran, T.; Liguo, L. The layout of higher education agglomeration and its effect on regional innovation--An empirical study based on Chinese and American data. Educational Research 2024, 92–107. [Google Scholar]
- Zhenfang, Y. The change and analysis of regional distribution structure of higher education in China-based on the educational statistics from 2009 to 2019. Journal of National Academy of Education Administration 2019, 86–95. [Google Scholar]
- Xiaodong, Z.; Haoying, H.; Shuang, L. Spatial Distribution Characteristics and Influencing Factors of Educational Facilities in China. 2022, 41, 19–25. [Google Scholar]
- Shuncheng, G.; Lijuan, W.; Peng, L. Spatial pattern of regional imbalance of higher education and its causes in China. Areal Research and Development 2020, 39, 12–17. [Google Scholar]
- Xiuwei, W.; Xiaojun, L. Characteristics and influencing factors of the key villages of rural tourism in China. Acta Geographica Sinica 2022, 77, 900–917. [Google Scholar]
- Shu, R.; Xiao, J.; Yang, Y.; Kong, X. The evolution of spatiotemporal patterns and influencing factors of high-level tourist attractions in the Yellow River Basin. Frontiers in Earth Science 2020, 40, 70–80. [Google Scholar] [CrossRef]
- Guoxia, W.; Man, L. The spatial interaction between inter-provincial migration and manufacturing industry transfer. Scientia Geographica Sinica 2019, 39, 183–194. [Google Scholar]
- Zhizhong, N.; Ting, W.; Xuechun, Y. Spatio-temporal evolution of tourist attractions and formation of their clusters in China since 2001. Geographical Research 2020, 39, 1654–1666. [Google Scholar]
- Jinfeng, W.; Chengdong, X. Geodetector: Principle and prospective. Acta Geographica Sinica 2017, 72, 116–134. [Google Scholar]
- Fotheringham, A.S.; Yang, W.; Kang, W. Multiscale geographically weighted regression (MGWR). Annals of the American Association of Geographers 2017, 107, 1247–1265. [Google Scholar] [CrossRef]
- Fengjue, H.; Junqing, T.; Huali, L. Built environment effects on the spatio-temporal distribution of shared bikes based on multi-scale geographic weighted regression. Geographical Research 2023, 42, 2405–2418. [Google Scholar]
- Yichuan, W. The evolution of the spatial distribution pattern of higher education institutions in China and its influencing factors. Jiangsu Higher Education 2022, 39–47. [Google Scholar]
- Guorui, L. The evolution characteristics of China higher education spatial distribution and its development trends. Journal of Higher Education 2019, 40, 1–9. [Google Scholar]
Figure 1.
Evolution of kernel density in Chinese general colleges and universities.
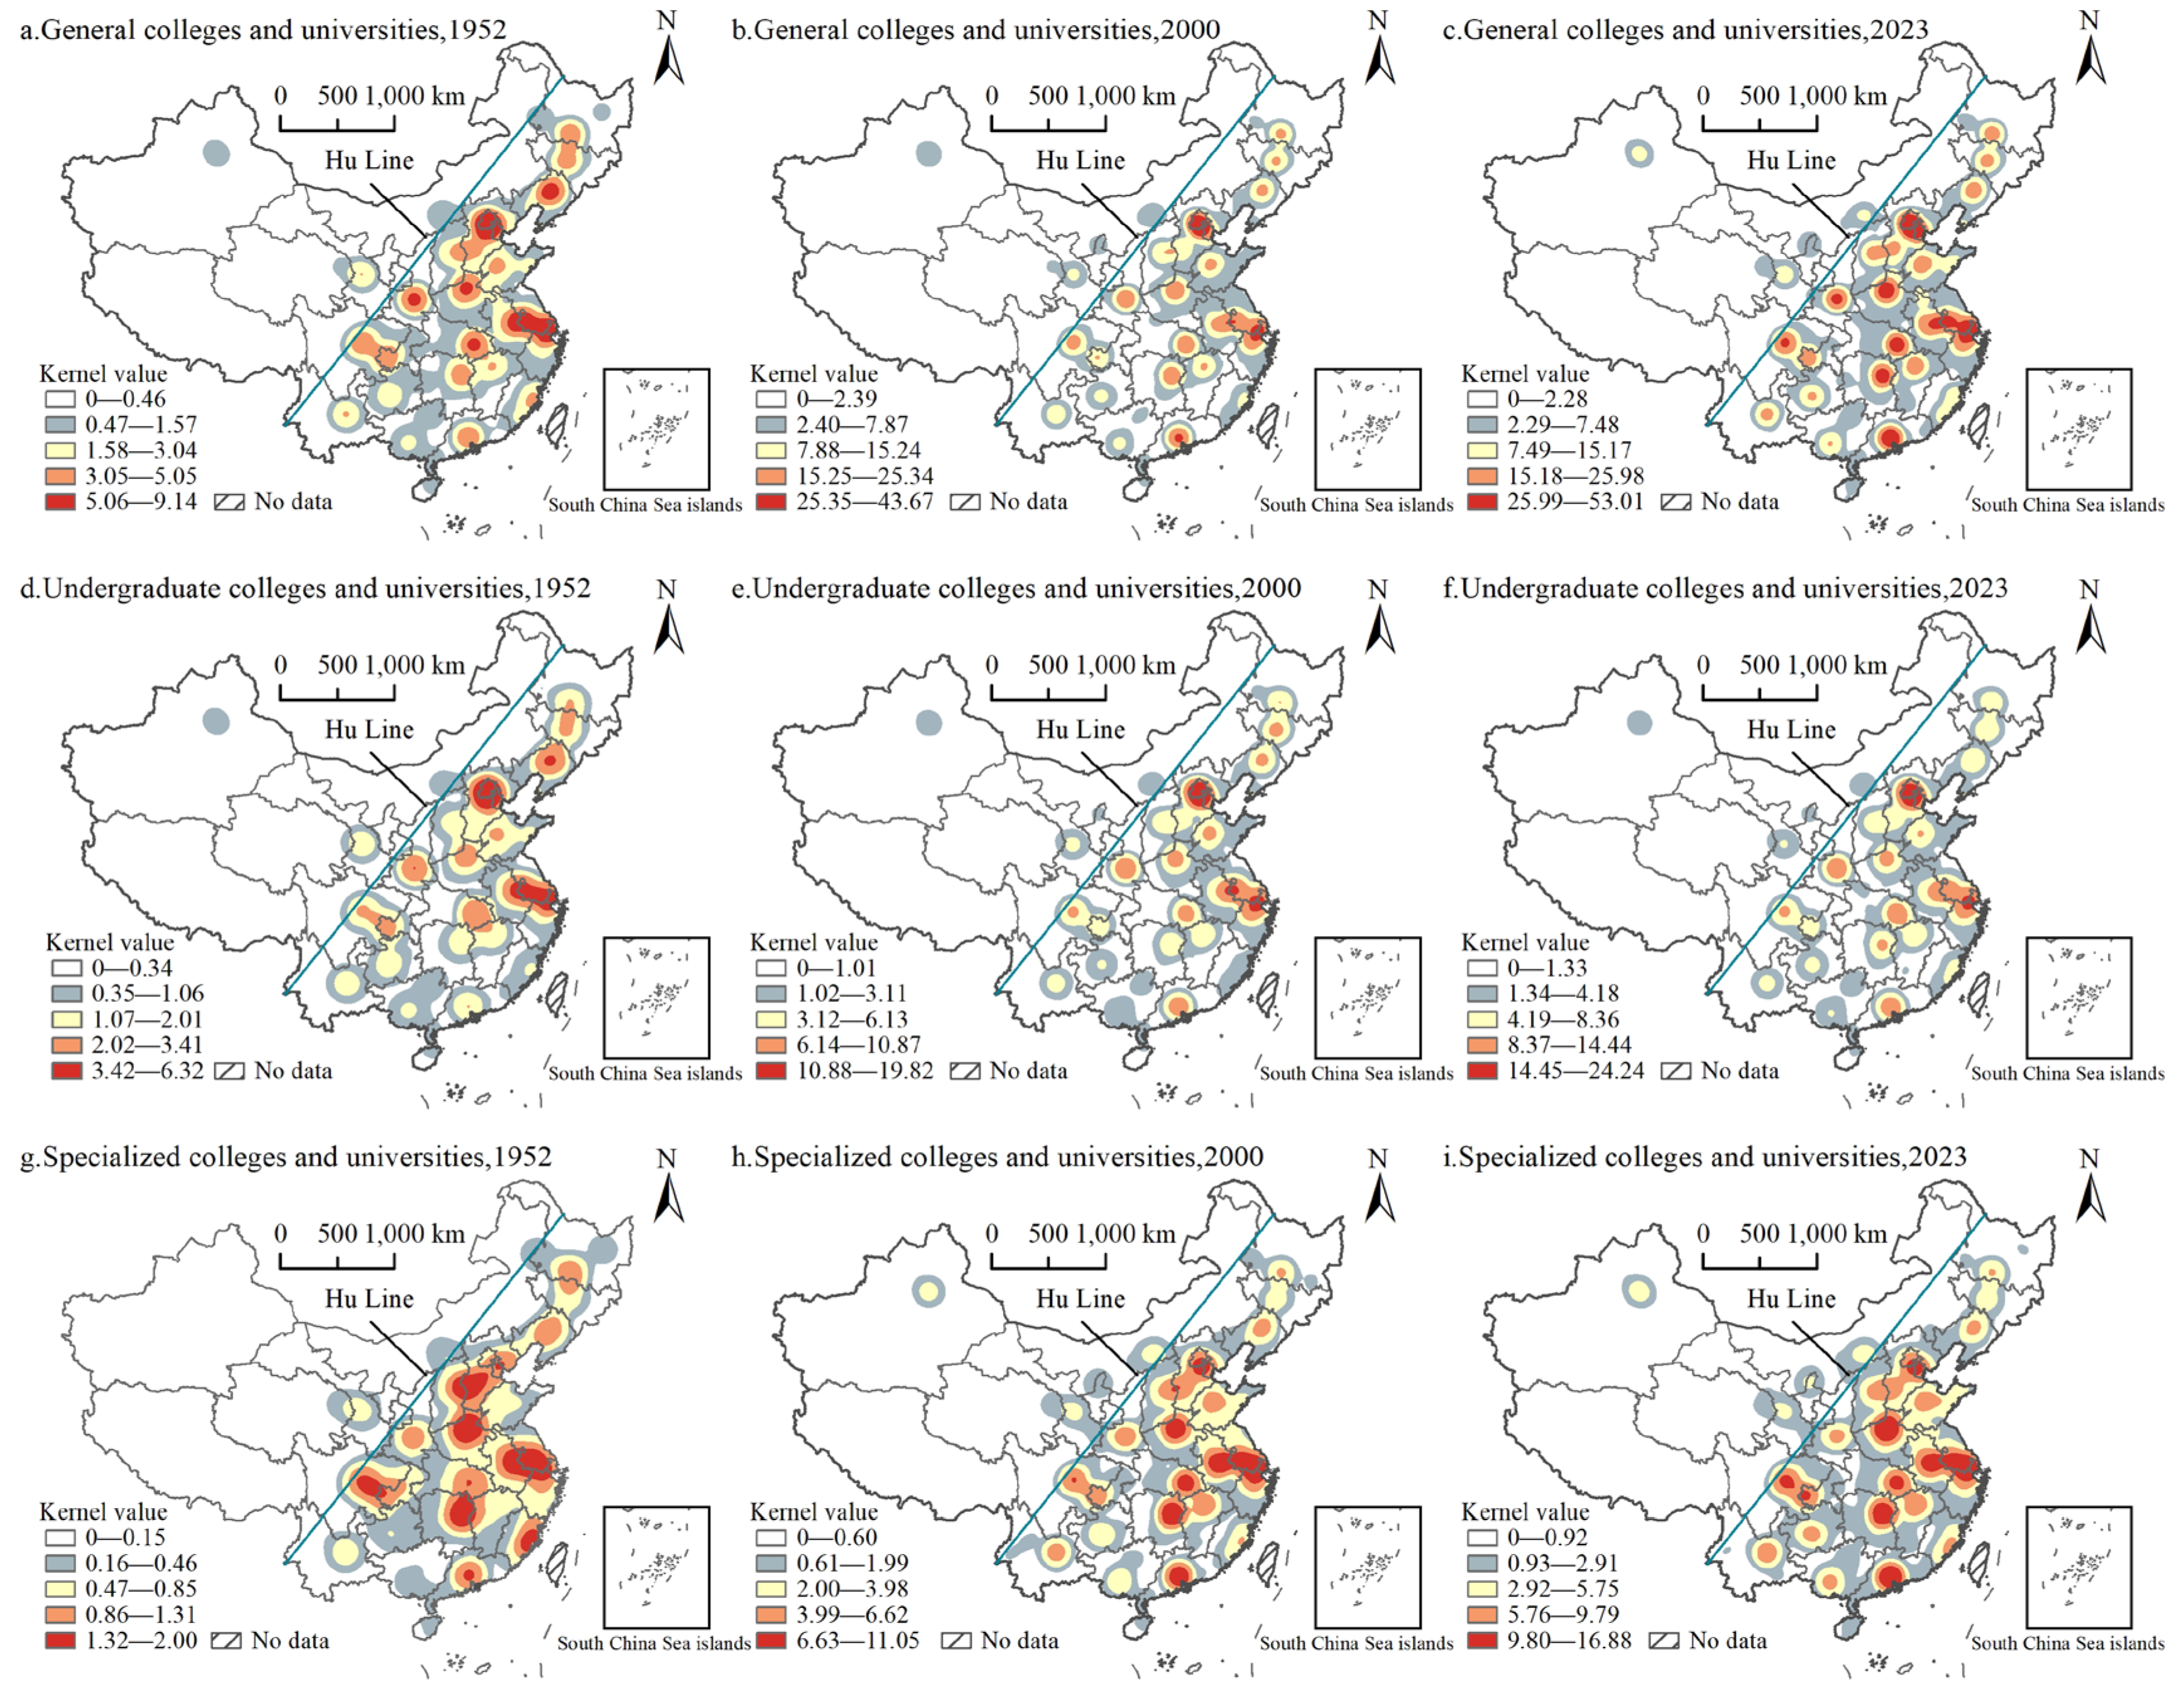
Figure 2.
Evolution of the distribution direction of general colleges and universities in China.
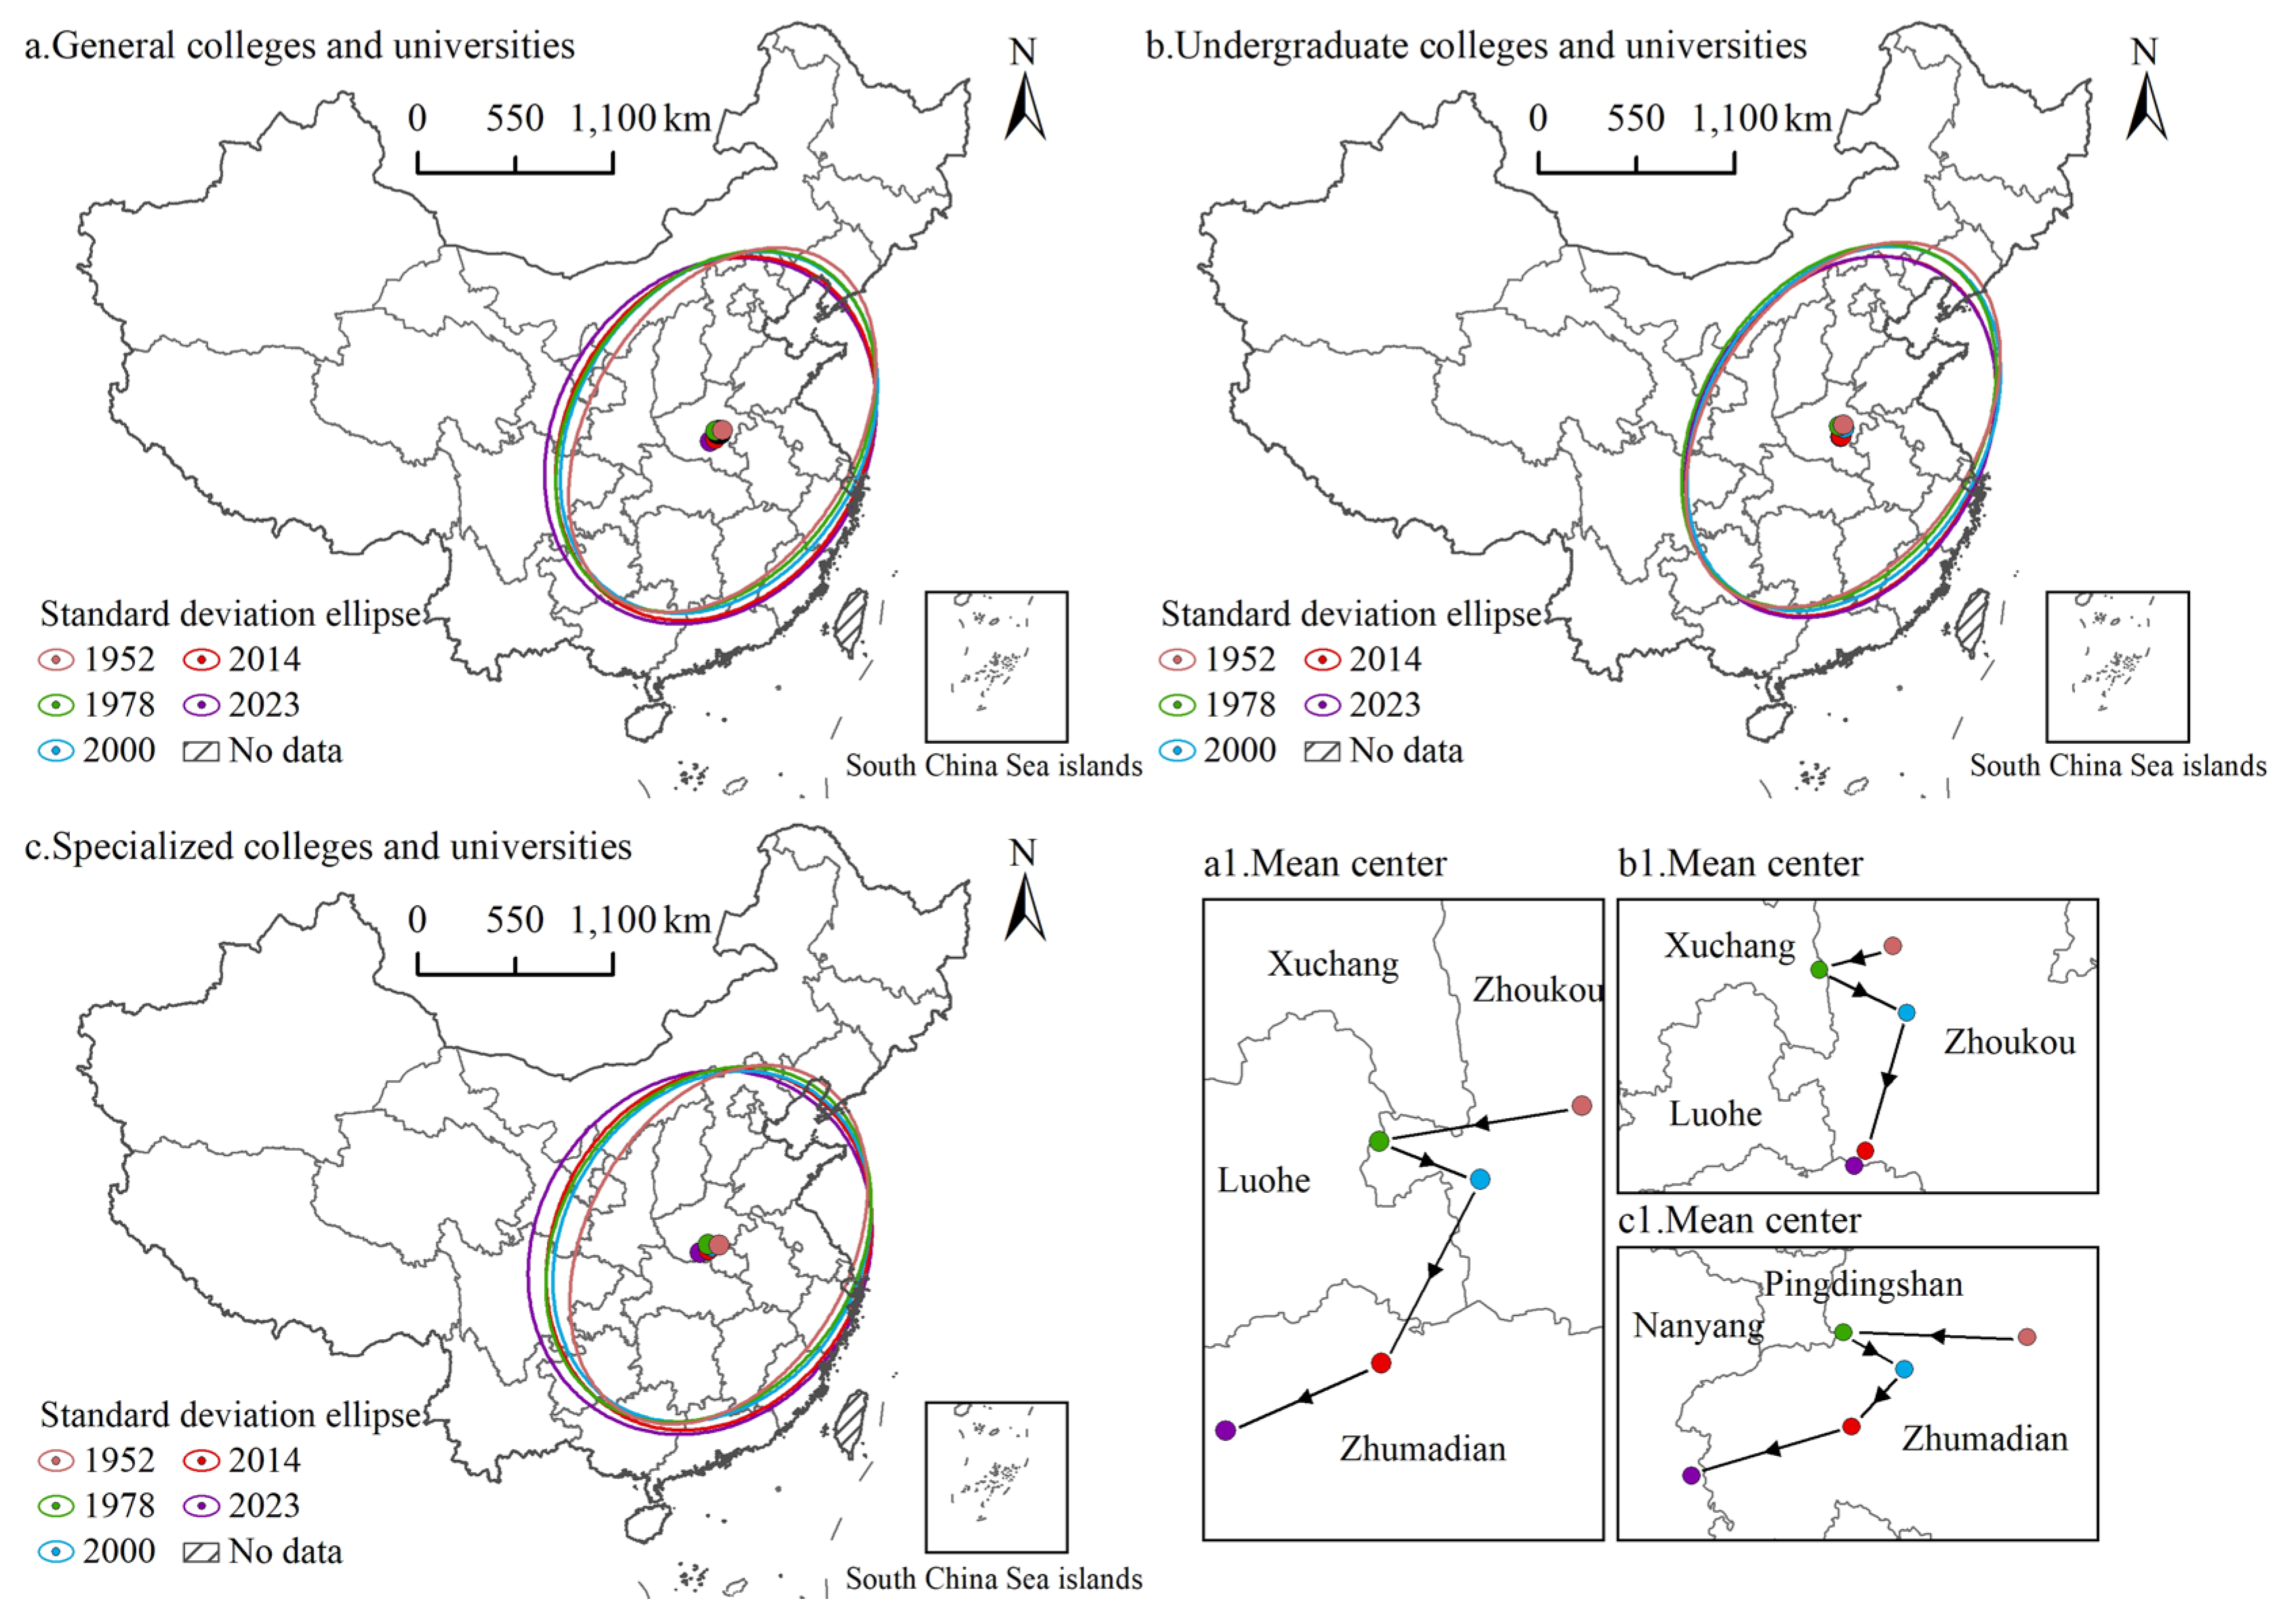
Figure 3.
Spatial distribution of influencing factors’ regression coefficients in the MGWR model.
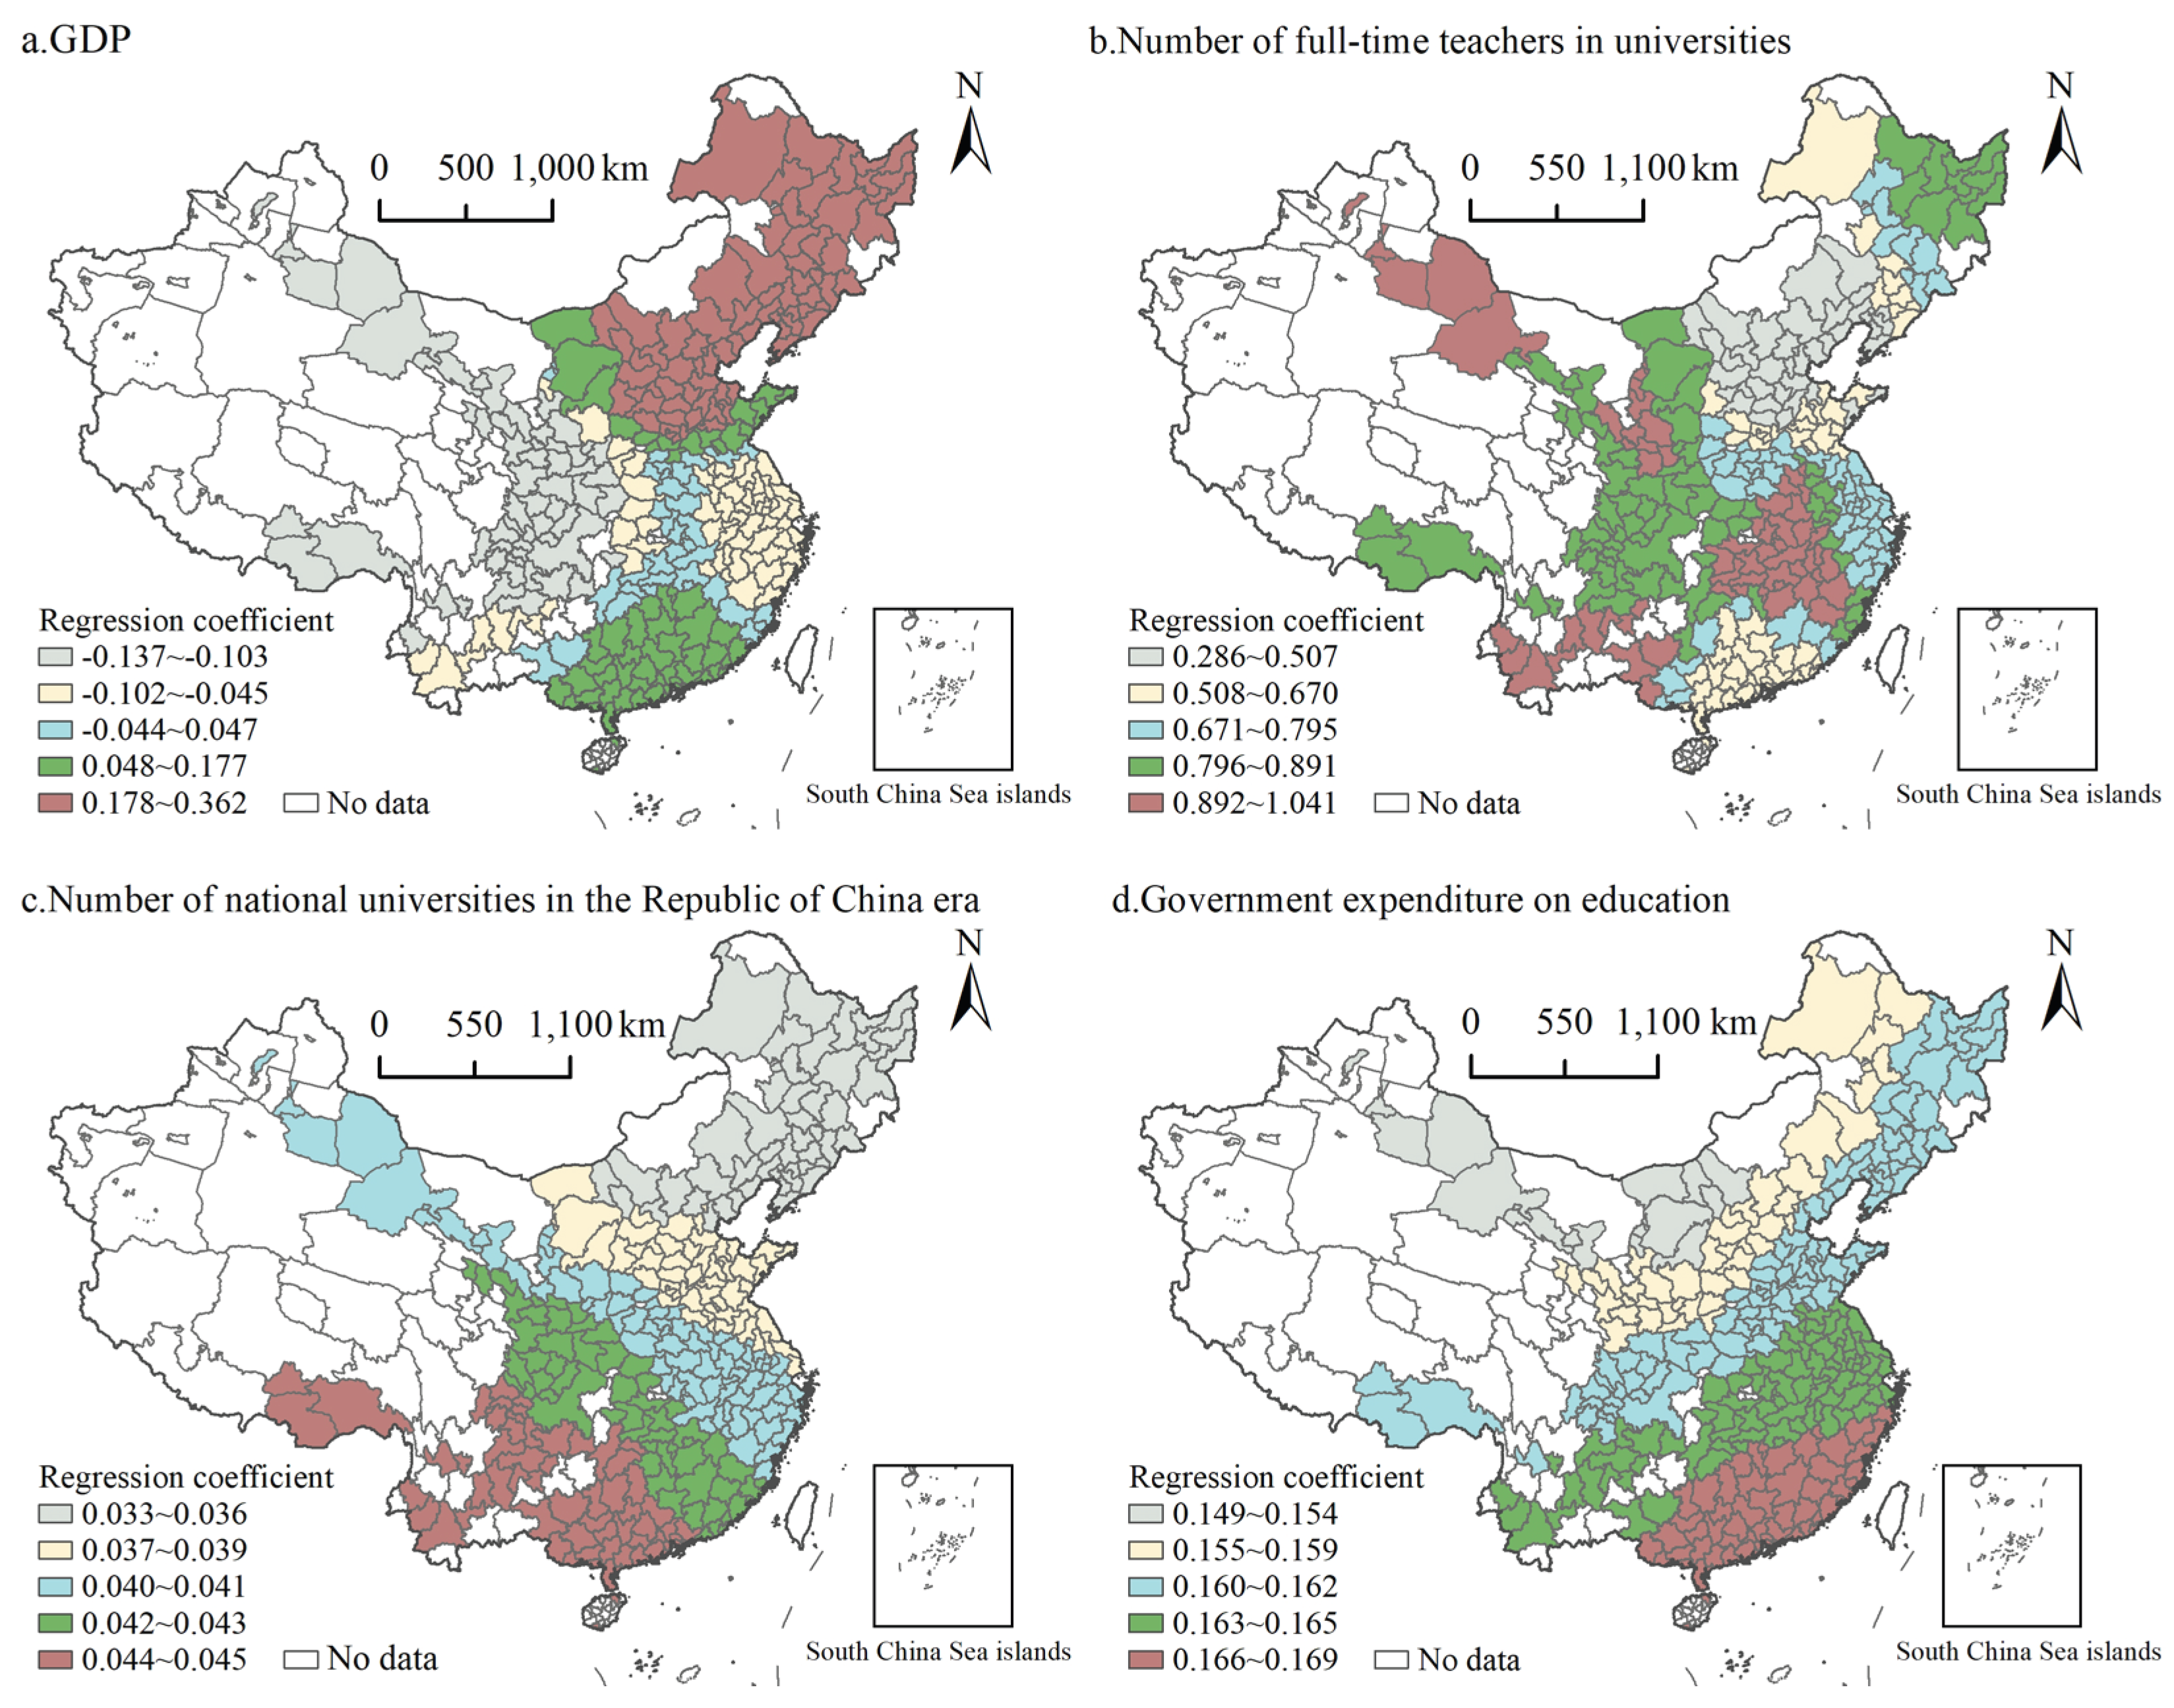

Table 1.
Evolution of the nearest neighbor index of general colleges and universities in China.
| time | 1952 | 1978 | 2000 | 2014 | 2023 |
|---|---|---|---|---|---|
| R本 | 0.347 | 0.330 | 0.296 | 0.270 | 0.273 |
| R专 | 0.380 | 0.287 | 0.240 | 0.270 | 0.258 |
| R总 | 0.290 | 0.194 | 0.173 | 0.166 | 0.169 |
Table 2.
Geodetection results of factors influencing general colleges and universities’ spatial distribution in China.
Table 2.
Geodetection results of factors influencing general colleges and universities’ spatial distribution in China.
| Influencing factors | Factor (Unit) | q-value | p-value | Order of explanatory power |
|---|---|---|---|---|
| Population size | Registered population (persons) | 0.264 | 0.00 | 5 |
| Society and economy | GDP (100 million yuan) | 0.495 | 0.00 | 2 |
| GDP per capita (yuan) | 0.126 | 0.00 | 8 | |
| Government expenditure on education (ten thousand yuan) | 0.419 | 0.00 | 4 | |
| Number of full-time teachers in HEIs (persons) | 0.683 | 0.00 | 1 | |
| Proportion of nonagricultural industries (%) | 0.147 | 0.00 | 7 | |
| Year-end road mileage (km) | 0.073 | 0.40 | 10 | |
| Urbanization rate (%) | 0.197 | 0.00 | 6 | |
| Policy support | Number of references to “colleges and universities” in the Government’s annual work report (times) | 0.079 | 0.01 | 9 |
| Historical background | Number of national universities in the Republic of China era | 0.433 | 0.00 | 3 |
Table 3.
Descriptive statistics of the MGWR model’s regression coefficients.
| Variable | Bandwidth | Mean | Standard deviation | Minimum | Median | Maximum |
|---|---|---|---|---|---|---|
| GDP | 110 | 0.050 | 0.161 | −0.137 | 0.002 | 0.362 |
| Number of full-time teachers in universities | 45 | 0.743 | 0.173 | 0.286 | 0.780 | 1.041 |
| Number of national universities in the Republic of China era | 290 | 0.040 | 0.003 | 0.033 | 0.040 | 0.045 |
| Government expenditure on education | 290 | 0.162 | 0.004 | 0.149 | 0.163 | 0.169 |
Disclaimer/Publisher’s Note: The statements, opinions and data contained in all publications are solely those of the individual author(s) and contributor(s) and not of MDPI and/or the editor(s). MDPI and/or the editor(s) disclaim responsibility for any injury to people or property resulting from any ideas, methods, instructions or products referred to in the content. |
© 2025 by the authors. Licensee MDPI, Basel, Switzerland. This article is an open access article distributed under the terms and conditions of the Creative Commons Attribution (CC BY) license (http://creativecommons.org/licenses/by/4.0/).
Copyright: This open access article is published under a Creative Commons CC BY 4.0 license, which permit the free download, distribution, and reuse, provided that the author and preprint are cited in any reuse.


