
Submitted:
11 November 2025
Posted:
12 November 2025
You are already at the latest version
Abstract
A novel optical fiber sensor, based on a composed-type Sagnac loop for gas pressure sensing, has been introduced and experimentally validated. This sensor consists of a centimeter-scale twin-hole and dual-core fiber (THDCF) sandwiched by two segments of polarization-maintaining fibers (PMFs) via splicing. Given that the pure quartz PMF is insensitive to the variations in gas pressure, it is unsuitable for the gas pressure sensing. To improve the sensitivity, a short piece of THDCF is added to the PMF-based Sagnac loop. Theoretical analysis has demonstrated that the presence of THDCF could significantly amplify the impact of air pressure on birefringence. Experimental results reveal that as the ambient gas pressure rises from 0-1.2 MPa, the interference spectrum exhibits an obvious red-shift with a high sensitivity of 8.381 nm/MPa. The sensor’s reliability has undergone repeated verification by increasing and decreasing the pressure. Attributed to its simple structure, easy fabrication, low cost and high sensitivity, the proposed sensor is particularly suited for development in harsh environments.
Keywords:
optical fiber sensor
; gas pressure
; Sagnac interference
; hole-assisted fiber
1. Introduction
Gas pressure measurement serves as a critically important parameter in numerous meteorological and industrial fields, including air pressure monitoring in aircraft cabins, gas pressure monitoring in reactors, tanks and pipelines in the chemical industry [1,2]. Traditional gas pressure monitoring technologies, such as force-balanced, resonant and piezoresistive methods, exhibit limitations in certain special environments. For instance, in harsh conditions characterized by high temperature, extreme pressure and intense electromagnetic interference, the measurement accuracy, stability and reliability can be significantly affected [3,4,5]. Among these technologies, fiber optic gas pressure sensors offer obvious advantages of compact size, immunity to electromagnetic interference, resistance to high temperatures, and robust chemical stability [6]. These features enable them to fulfill the requirements for precise gas pressure measurement under complex operational conditions, thereby receiving widespread attention [7,8].
Several types of optical fiber sensors, including ones based on fiber Bragg gratings (FBGs) [9,10], Mach-Zehnder interferometers (MZIs) [11] and Fabry-Pérot interferometers (FPIs) [12], have been introduced for gas pressure sensing applications. Sensors utilizing FBGs, whether fabricated in single mode fibers (SMFs) or special fibers, typically exhibit relatively low sensitivities (approximately 0.01 nm/MPa), rendering them unsuitable for multi-megapascal systems [13,14]. In the case of MZI sensors, they leverage the phase difference principle which arises when light travels along distinct paths, thereby generating interference patterns for sensing purposes [15,16]. Nevertheless, their low signal-to-noise ratio (SNR) and significant insertion loss limit both the detection range and the measurement accuracy [17,18]. The Fabry-Pérot cavity design incorporates gas channels [19]. As the gas pressure varies, the refractive index (RI) of the gas and the cavity length change accordingly [20]. However, this structure is susceptible to fragility and instability in response to external factors [21], and its intricate manufacturing process results in high costs [22], all of which hinder the widespread adoption of fiber optic gas pressure sensors. Among them, the Sagnac interferometer, as a unique form of interference, can also be used to detect pressure variations. Owning to its simple structure, stability, high sensitivity, high SNR, and low insertion loss, the Sagnac loop is particularly suitable for physical parameter sensing, despite its inherent and unavoidable limitations [23]. Cho et al. [24] proposed a pressure sensor based on a Sagnac interferometer utilizing polarization maintaining photonic crystal fibers (PM-PCF) with high birefringence, featuring a 58.4-cm fiber length. However, when the length of the PM-PCF is extended, such as 60 cm, the free spectral range (FSR) of the Sagnac interferometer fringe becomes excessively narrow [25]. Although special optical fibers are adopted, the sensor lengths remain relatively long. Bending the sensor can compromise the accuracy of the measurement data, to a certain extent, restrict the sensor’s integration capability. In traditional fiber-optic gas pressure sensing, hole-assisted optical fibers have attracted significant attention due to their distinctive microstructure, which enables a sensitive response to environment changes. Our research group [26] has demonstrated that a specific commercial hole-assisted fiber, such as twin-hole and dual-core fiber (THDCF), can be effectively utilized for gas pressure sensing. Compared with pure quartz fibers, the THDCF exhibits a higher refractive index response of to pressure variations, and the constructed interference structure demonstrates enhanced response sensitivity. However, hole-assisted fibers like single-hole dual-core and dual-hole dual-core fibers have not been applied to Sagnac gas pressure sensing due to their insufficient birefringence to generate Sagnac interferometric effects [27,28,29]. In this paper, a short piece of THDCF was incorporated into a Sagnac loop for gas pressure sensing. A centimeter-long THDCF is splice-fused between two segments of equal length Panda-type PMF, creating a PMF-THDCF-PMF fiber configuration. Note that precise welding control between different types of optical fibers is essential for optimizing the Sagnac interference. The two holes within the THDCF are aligned with the two stress regions of the PMF to amplify the interference of the newly formed Sagnac loop. Experimental findings reveal that this innovative loop exhibits high sensitivity to the gas pressure. Repeated testing further confirms the excellent reliability and repeatability of the proposed sensor design.
2. Sensor Fabrication and Working Principle
The sensor comprises a 1-cm-long THDCF, which is sandwiched between two 5-cm-long PMF segments through splicing, forming a symmetrical structure, as depicted in Figure 1. The 125-µm-thick silicate THDCF, fabricated by Wuhan Guanghe Communication Technology Company, features a central core with a diameter of 7.6 µm and an identical off-axis core positioned 9 µm apart (edge-to-edge). Additionally, a pair of 32-µm-diameter air holes running parallel to the central core, with their edges spaced 7 µm away from the central core’s edge, as illustrated in Figure 2 (a). The PMF (PM1550-XP), supplied by Shanghai Connet Laser Technology Company, is 125 µm thick with a 8.4-µm-diameter core. It incorporates two symmetrical boron-doped stress rods, each with a diameter of 30 µm and an edge-to-edge septation of 26 µm, as shown in Figure 2(b)The refractive index of the cores is 1.464, with a refractive index difference of 0.014 between the cores and the cladding, and a refractive index difference of 0.022 between two stress areas and the cores. The cross-sections of the PMF can be seen in Figure 2(b).
The PMF and THDCF are fused together by a commercial fusion welding machine (Fujikura FSM-100P+). The correction angles for the left and right fibers are precisely set to ensure alignment between the two holes of the THDCF and the two stress regions of the PMF during fusion welding. Additionally, the arc discharge parameters must be carefully configured to prevent the collapse of the holes in the fused THDCF and to guarantee high-quality fusion welding.
Multi-physics field simulations focusing on electric field-pressure interactions, are conducted separately for PMF and THDCF, respectively. Figure 3 illustrates the cross-sectional force profiles of PMF and THDCF, simulated under a gas pressure of 1 MPa. The image reveals the stress distribution patterns following the application of pressure around the fiber’s perimeter. White circles denote the holes, while the blue regions indicate areas of zero stress. Notably, THDCF exhibits a stress distribution predominantly concentrated around the holes, as depicted in Figure 3(a). In contrast, PMF develops stress-induced refractive index variations due to the different thermal expansion coefficients between the rods and the remaining fiber structure during the fabrication process [30]. Consequently, the effective mode indices neff are differentiated for the two principal axes. The stress in PMF is primarily localized within the boron-doped stress rods, as illustrated in Figure 3(b). The disparity in refractive index between the two polarizations is called birefringence and is mathematically defined as:
As an example, the resulting birefringence profiles of THDCF and PMF at a reference pressure range of 0-1 MPa, are displayed in Figure 4. The expected birefringence value for THDCF, calculated at Mpa, turns out to be 4×10⁻⁵, which is consistent with the previous birefringence measurements for this type of fiber. Figure 4(a) displays the simulated birefringence Bm, in the core of THDCF as function of reference pressure ranging from 0-1.2 MPa. As depicted, it increases linearly with gas pressure. In contrast, the birefringence Bm, of PMF remains unchanged, referring to Figure 4(b).
The Sagnac loop constitutes an interferometer, in which the two arms are interconnected, enabling the same beam splitter to act as both the input and output port. In fiber-optic systems, such a device can be realized by fusing two legs of a 3-dB coupler. A fiber Sagnac interferometer is employed to generate interference fringes. Within the fiber loop, when light enters the PMF for transmission, two orthogonal modes, namely and , propagate along the fast and slow axes of the PMF, respectively. These two orthogonal modes accumulate phase differences and subsequently interfere within the 3-dB coupler. Neglecting the losses in the Sagnac loop, the transmission spectrum of the fiber loop can be approximated as a periodic function of the wavelength, as given by [31]
3. Experiments and Discussion
Gas pressure measurements are conducted using a super luminescent diode (SLD, Denselight, 1250~1650 nm) and an optical spectrum analyzer (OSA, Yokogawa, AQ6375) with a resolution of 0.05 nm via a 3-dB coupler. Additionally, a sealed gas pressure chamber serves as an apparatus for generating gas pressure variations, as depicted in Figure 5. Prior to measurement, the sensor is mounted on a slender iron rod before being placed inside the gas chamber to enhance the linearity and robustness of the gas pressure detection. The slender iron rod, made of Ni-Ti alloy, has a diameter of 1 mm and features two side grooves for securing the sensor, as illustrated in the inset of Figure 5. Most notably, the interferometer demonstrates robustness against mechanical and thermal fluctuations. The OSA records the interference spectra, while the gas pressure is incrementally increased to establish a temporal correlation between the gas pressure and the wavelength spectra. Upon reaching the target pressure value, the system maintains this pressure for a certain period to establish stabilization.
The effect of varying lengths of PMF and THDCF on the interference spectrum has been explored. Shorter PMF lengths result in fewer interference peaks within the 1450-1650 nm wavelength band, as depicted in Figure 6. Specifically, the FSR of a 10-cm-long PMF is approximately 29.6 nm near 1550 nm, as illustrated in Figure 6(d). To facilitate the monitoring of the tip shifts in subsequent experiments, a 10 cm PMF length was selected. Regarding different lengths of THDCF, Figure 7 demonstrates that the number of interference fringes remains unaffected within the 1450-1650 nm band. FSR at 1550 nm for different THDCF lengths were 54.2 nm, 57.4 nm, 59.1 nm and 57.9 nm, respectively.
Furthermore, fast Fourier transform (FFT) analysis of the interference spectra in Figure 6 reveals that the frequency decreases as PMF length diminishes, as shown in Figure 8(a). In contrast, THDCF length has a minimal impact on frequency variations, as depicted in Figure 8(b), which is consistent with the prior theoretical predictions. For gas pressure sensing experiements, the fiber sensor is affixed to a metal bar to avoid pre-stressing and minimize the measurement uncertainty. Afterwards, the sensors are sealed within a gas pressure chamber. At a constant room temperature, the internal gas pressure is adjusted by the pump, ranging from 0 MPa to 1.2 MPa and then back down to 0 MPa in increments of 0.2 MPa. After each adjustment, a 5-minute waiting period is allowed for the internal gas pressure of the chamber to be stabilized.
The entire spectrum shifts uniformly with gas pressure variations. By tracking a single spectrum minimum, such as the one around 1550 nm depicted in Figure 10, the gas pressure dependence of the spectral shift can be determined. As shown in Figure 10(a), the spectrum undergoes a significant red-shift as the pressure in the gas chamber increases. Consequently, as the pressure decreases, the spectrum exhibits a notable blue-shift, as seen in Figure 10(b). To verify the sensor’s stability, three additional sets of repetitive gas pressure increase and decrease cycles are conducted, as presented in Figure 11.
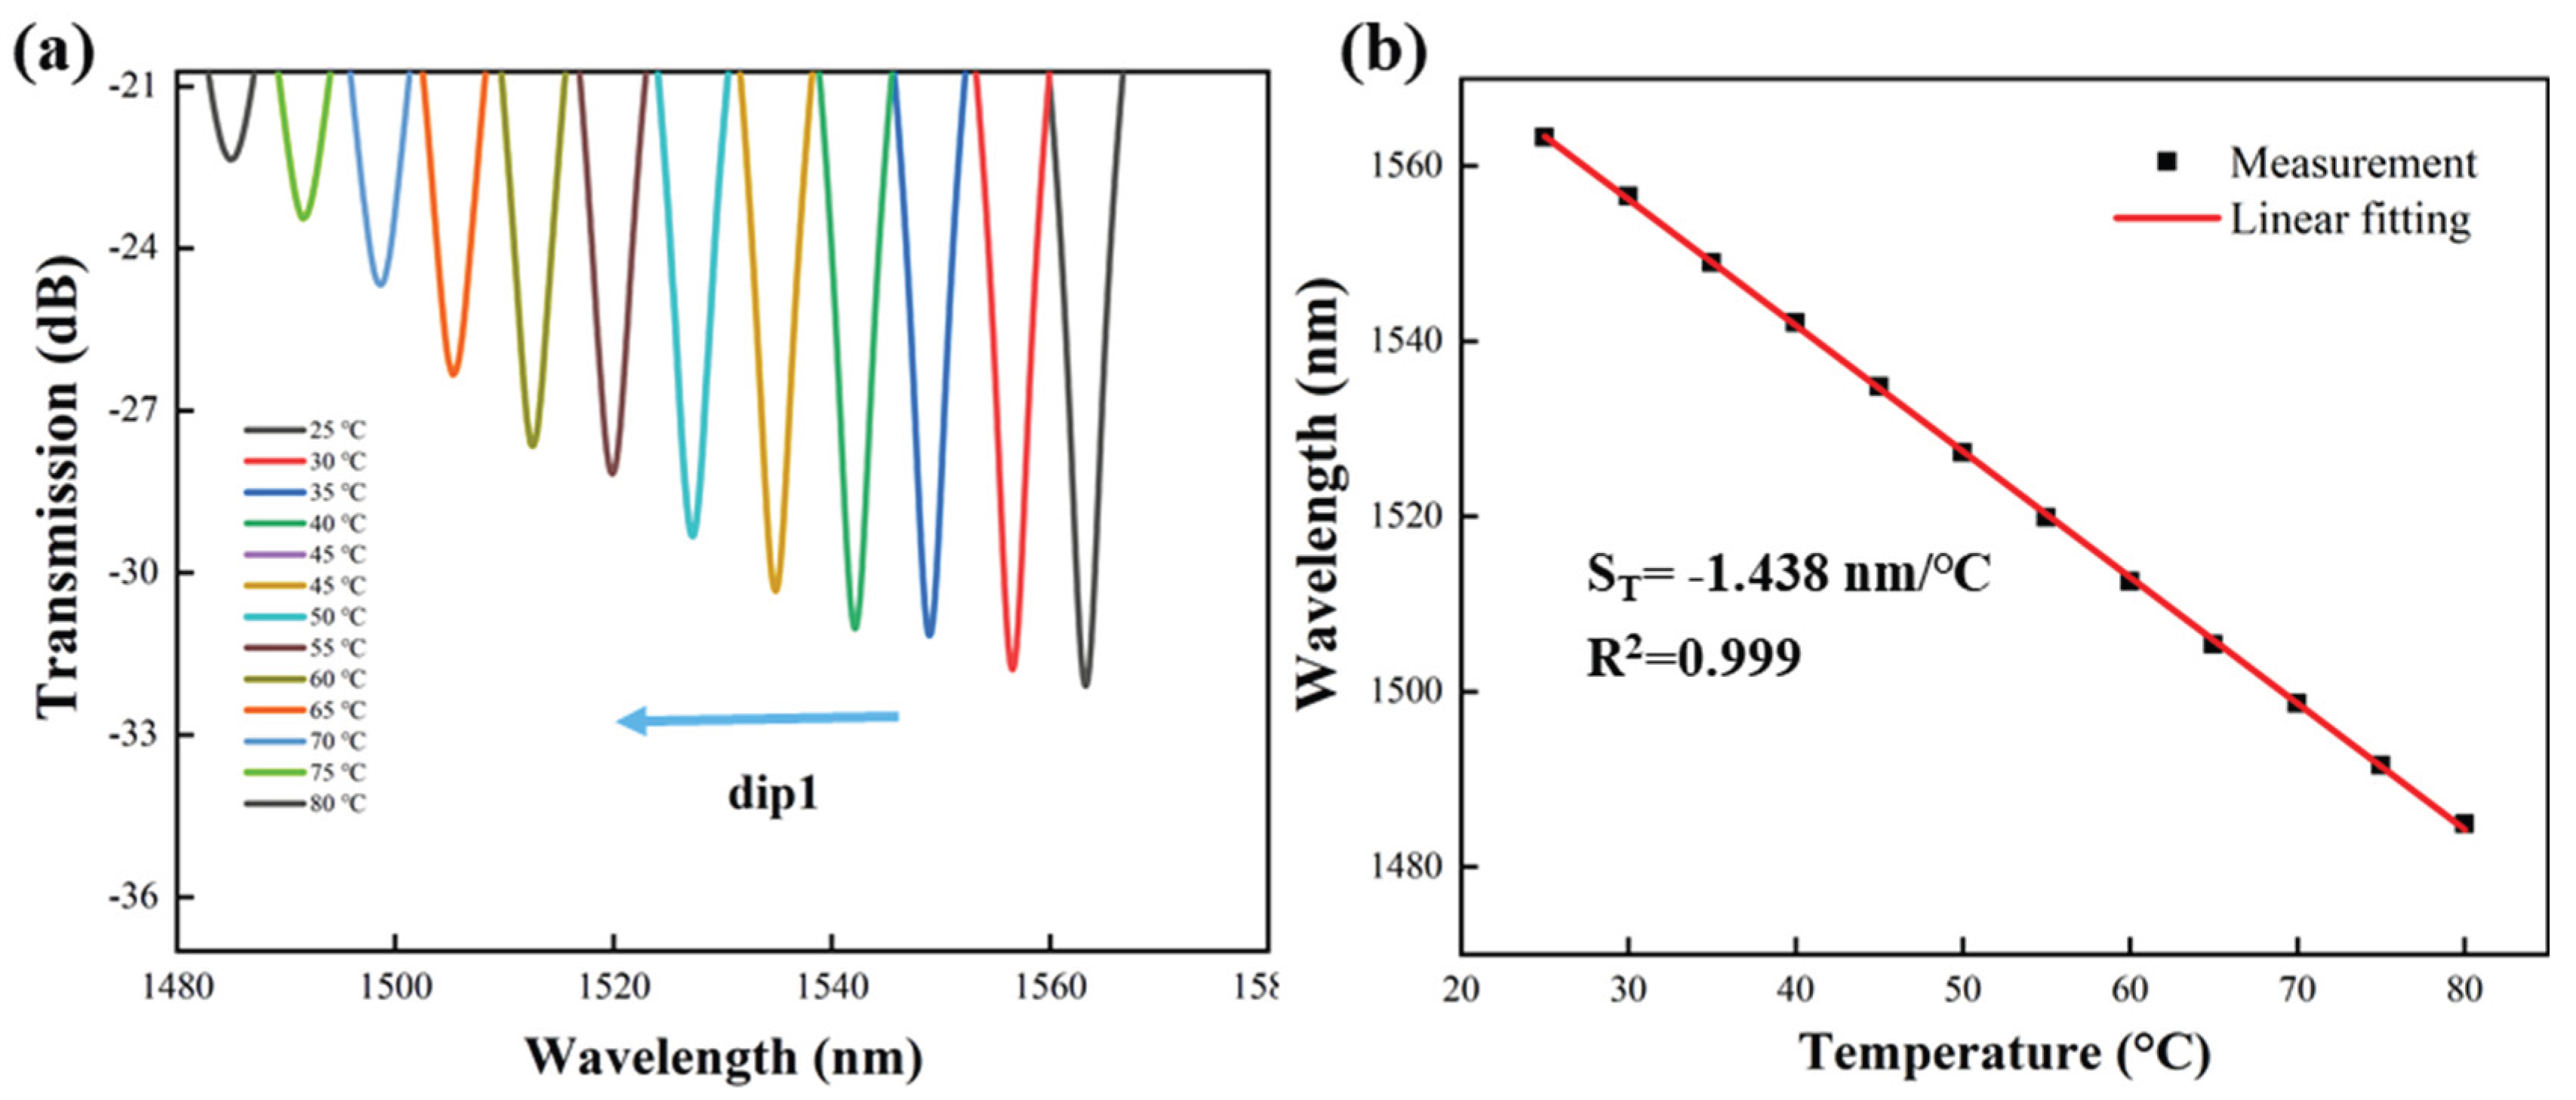
As evident from the figures, the interferogram shifts linearly with gas pressure during the increase from 0 MPa to 1.2 MPa. The slopes obtained from linear fitting for the gas pressure increase and decrease experiments are 8.339 nm and 8.625 nm for the first group (Figure 11(a)), 8.196 nm and 8.268 nm for the second group (Figure 11(b)), and 8.441 nm and 8.196 nm for the third group (Figure 11(c)), respectively. These fitting results of the three replicated experiments demonstrate good linearity. The sensors exhibit a consistent linear response throughout the cycles, with the fitted curves for pressure increase and decrease processes being nearly identical. An error analysis is performed on the results of the three fits, yielding gas pressure sensitivities (denoted by S) of 8.379 nm/MPa for gas pressure increase and 8.381 nm/MPa for gas pressure decreasing, respectively, as shown in Figure 12. As evidenced in Figure 13, the spectral line undergoes blue shifting as temperature increases. Linear fitting of a peak shift near 1560 nm reveals a measured temperature sensitivity (denoted by ST) of -1.438 nm/°C. These results confirm that the proposed sensor has excellent stability and repeatability.
4. Conclusions
A simple, sensitive, and transmissive optic-fiber gas pressure sensor based on a Sagnac loop has been presented. The fiber sensor is mainly composed of a 1-cm-long THDCF sandwiched by two pieces of 5-cm-long PMF. Given that the pure quartz PMF is insensitive to gas pressure changes, the THDCF is integrated into a PMF-based Sagnac loop to facilitate gas pressure sensing. When affixed on a metal rod and positioned within a gas chamber at room temperature for testing across a pressure range of 0-1.2 MPa, the transmission spectra exhibit a red-shift as the gas pressure increases, and a blue-shift as the gas pressure decreases. The linear sensitivities are measured at 8.381 nm/MPa for pressure increasing and 8.379 nm/MPa for pressure decreasing, respectively, with an extinction ratio up to 28 dB. Moreover, the sensor is also capable of temperature sensing, demonstrating a temperature sensitivity of -1.438 nm/°C under a stable gas pressure. The proposed fiber sensor boasts high sensitivity, low cost, and easy fabrication, holding promising sensing application prospects in the future.
Availability of Data and Material
Data underlying the results presented in this paper are not publicly available at this time but may be obtained from the authors upon reasonable request.
Competing Interest
The authors declare that they have no competing interests.
Author Contributions
Lingyu Wang, Yang Li performed the experiments. Lingyu Wang, Yang Li, Qiang Ling, Rujun Zhou analyzed the data. Lingyu Wang, Qiang Ling, Zhangwei Yu, Zuguang Guan and Daru Chen discussed the data and prepared the manuscript. All authors edited, discussed, and approved the whole paper.
Acknowledgments
This work is supported by the Baima Lake Laboratory Joint Fund of the Zhejiang Provincial Natural Science Foundation of China under Grant No. LBMHZ25F050002, the Scientific Research Fund of Zhejiang Provincial Education Department of China under Grant Y202456818.
References
- Lianqing Zhu, Guangkai Sun, Weimin Bao, Structural deformation monitoring of flight vehicles based on optical fiber sensing technology: A review and future perspectives, Engineering 16 (2022) 39-55.
- Xiuquan Yuan, Wenxin Dong, Jinyang Fan, et al., Dynamic gas emission during coal seam drilling under the thermo-hydro-mechanical coupling effect: A theoretical model and numerical simulations, Gas Science and Engineering 131 (2024).
- Victor S. Balderrama, Jesús A. Leon-Gil, David A. Fernández-Benavides, et al., Manuel Bandala-Sánchez MEMS Piezoresistive Pressure Sensor Based on Flexible PET Thin-Film for Applications in Gaseous-Environments, IEEE Sensors Journal 22 (2022) 3.
- Guilherme Lopes, Nunzio Cennamo, Luigi Zeni, et al., Innovative optical pH sensors for the aquaculture sector: Comprehensive characterization of a cost-effective solution, Optics & Laser Technology 171 (2024) 110355.
- Yunzhou Li, Qiang Zhao, Dongying Chen, et al., Hydrological profile observation scheme based on optical fiber sensing for polar sea ice buoy monitoring, Optics Express 32 (2024) 13001-13013.
- Epin Vorathin, Zohari Mohd Hafizi, Nurazima Binti Ismail, et al., Review of high sensitivity fibre-optic pressure sensors for low pressure sensing, Optics & Laser Technology 121 (2020) 105841.
- John W. Berthold III, Fiber Optic Sensors: An Introduction for Engineers and Scientists, Third Edition, Industrial Applications of Fiber Optic Sensors, Chapter 22, First Published: 05 April 2024.
- Xuehui Zhang, Honghu Zhu, Xi Jiang, et al., Distributed fiber optic sensors for tunnel monitoring: A state-of-the-art review, Journal of Rock Mechanics and Geotechnical Engineering 16 (2024) 3841-3863.
- Jitendra Narayan Dash, Xin Cheng, and Hwa-yaw Tam, Low gas pressure sensor based on a polymer optical fiber grating, Optics Letters 46 (2021) 933-936.
- Looh Augustine Ngiejungbwen, Hind Hamdaoui, Mingyang Chen, Polymer optical fiber and fiber Bragg grating sensors for biomedical engineering Applications: A comprehensive review, Optics & Laser Technology 170 (2024) 110187.
- Abdullah Al Noman, Jitendra Narayan Dash, Xin Cheng, et al., Mach-Zehnder interferometer based fiber-optic nitrate sensor, Optics Express 21 (30) (2022) 38966-38974.
- Xiaoguang Mu, Jiale Gao, Yuqiang Yang, Parallel Polydimethylsiloxane-Cavity Fabry-Perot Interferometric Temperature Sensor Based on Enhanced Vernier Effect, IEEE Sensors Journal 22 (2022) 1333-1337.
- Chaluvadi V Naga Bhaskar, Subhradeep Pal, Prasant Kumar Pattnaik, Recent advancements in fiber Bragg gratings based temperature and strain measurement, Results in Optics 5 (2021) 100130.
- Manish Mishra, Prasant Kumar Sahu, Fiber Bragg Gratings in Healthcare Applications: A Review, IETE Technical Review 40 (2022) 202–219.
- Jichao Liu, Yunfei Hou, Jing Wang, et al., Multi-parameter demodulation for temperature, salinity and pressure sensor in seawater based on the semi-encapsulated microfiber Mach-Zehnder interferometer, Measurement 196 (2022) 111213.
- Yunlian Ding, Yao Chen, Si Luo, et al., All-fiber MZI hydrostatic pressure sensor, Optics & Laser Technology 171 (2024) 110414.
- Yong Zhao, Jian Zhao, Xixin Wang, et al., Femtosecond laser-inscribed fiber-optic sensor for seawater salinity and temperature measurements, Sensors and Actuators B: Chemical 353 (2022) 131134.
- Xiaojun Zhu, Haoran Zhuang, Yu Liu, et al., High-sensitivity robust Mach-Zehnder interferometer sensor in ultra-compact format, Measurement 236 (2024) 115051.
- Chaoqun Ma, Donghong Peng, Xuanyao Bai, et al., A Review of Optical Fiber Sensing Technology Based on Thin Film and Fabry-Perot Cavity, Coatings 13 (2023) 1277.
- Yuqiang Hu, Lu Cao, Shaoxiong Nie, et al., MEMS Fabry-Perot sensor for accurate high pressure measurement up to 10 MPa, Optics Express 32 (2024) 37059-37072.
- Jingwei Lv, Wei Li, Jianxin Wang, et al., High-sensitivity strain sensor based on an asymmetric tapered air microbubble Fabry-Pérot interferometer with an ultrathin wall, Optics Express 32 (2024) 19057-19068.
- Xinyu Zhao, Xiwang Ren, Jiandong Bai, et al., Enhanced High-Temperature Gas Pressure Sensor based on a Fiber Optic Fabry-Pérot Interferometer Probe, Journal of Lightwave Technology (2024) 1-7.
- Hamed Arianfard, Saulius Juodkazis, David J. Moss, et al., Sagnac interference in integrated photonics, Applied Physics Reviews, 10 (2023) 011309.
- Loc Hin Cho, Chuang Wu, Chao Lu, et al., A Highly Sensitive and Low-Cost Sagnac Loop Based Pressure Sensor, IEEE Sensors Journal 13 (2013) 3073-3078.
- H. Y. Fu, Chuang Wu, M. L. V. Tse, et al., High pressure sensor based on photonic crystal fiber for downhole application, Applied Optics 49 (2010) 2639-2643.
- Yao Chen, Weixuan Luo, Baobao Jiao, et al., Reflective All-Fiber Integrated Sensor for Simultaneous Gas Pressure and Temperature Sensing, Journal of Lightwave Technology 42 (2024) 463-469.
- Eric Udd, Applications and Development of the Sagnac Interferometer, In Fiber Optic Sensors (eds E. Udd and W.B. Spillman) (2024).
- Pizzaia, João Paulo Lebarck, Shujia Ding, et al., Highly sensitive temperature sensing based on a birefringent fiber Sagnac loop, Optical Fiber Technology 72 (2022) 102949.
- Dhyana C. Bharathan, R. Martijn Wagterveld, Karima Chah, et al., Optical fiber sensor with enhanced strain sensitivity based on the Vernier effect in a three-FBG cascaded Fabry–Perot configuration, Optical Fiber Technology 94 (2025): 104361.
- Yundong Liu, Hailiang Chen, Qiang Chen, et al., Experimental Study on Dual-Parameter Sensing Based on Cascaded Sagnac Interferometers with Two PANDA Fibers, Journal of Lightwave Technology 40 (9) (2022) 3090-3097.
- Chaoyi Liu, Hailiang Chen, Qiang Chen, et al., Sagnac interferometer-based optical fiber strain sensor with exceeding free spectral measurement range and high sensitivity, Optics & Laser Technology 159 (2023) 108935.
- Juan Ruan, Lirui Hu, Anshan Lu, Weiyan Lu, et al., Temperature Sensor Employed TCF-PMF Fiber Structure-Based Sagnac Interferometer, IEEE Photonics Technology Letters, 29 (16) (2017) 1364-1366.
- Qiang Ge, Jianhui Zhu, Yanyan Cui, Fiber optic temperature sensor utilizing thin PMF based Sagnac loop, Optics Communications, 502 (2022) 127417.
Figure 1.
Schematic illustration of the integrated sensor.
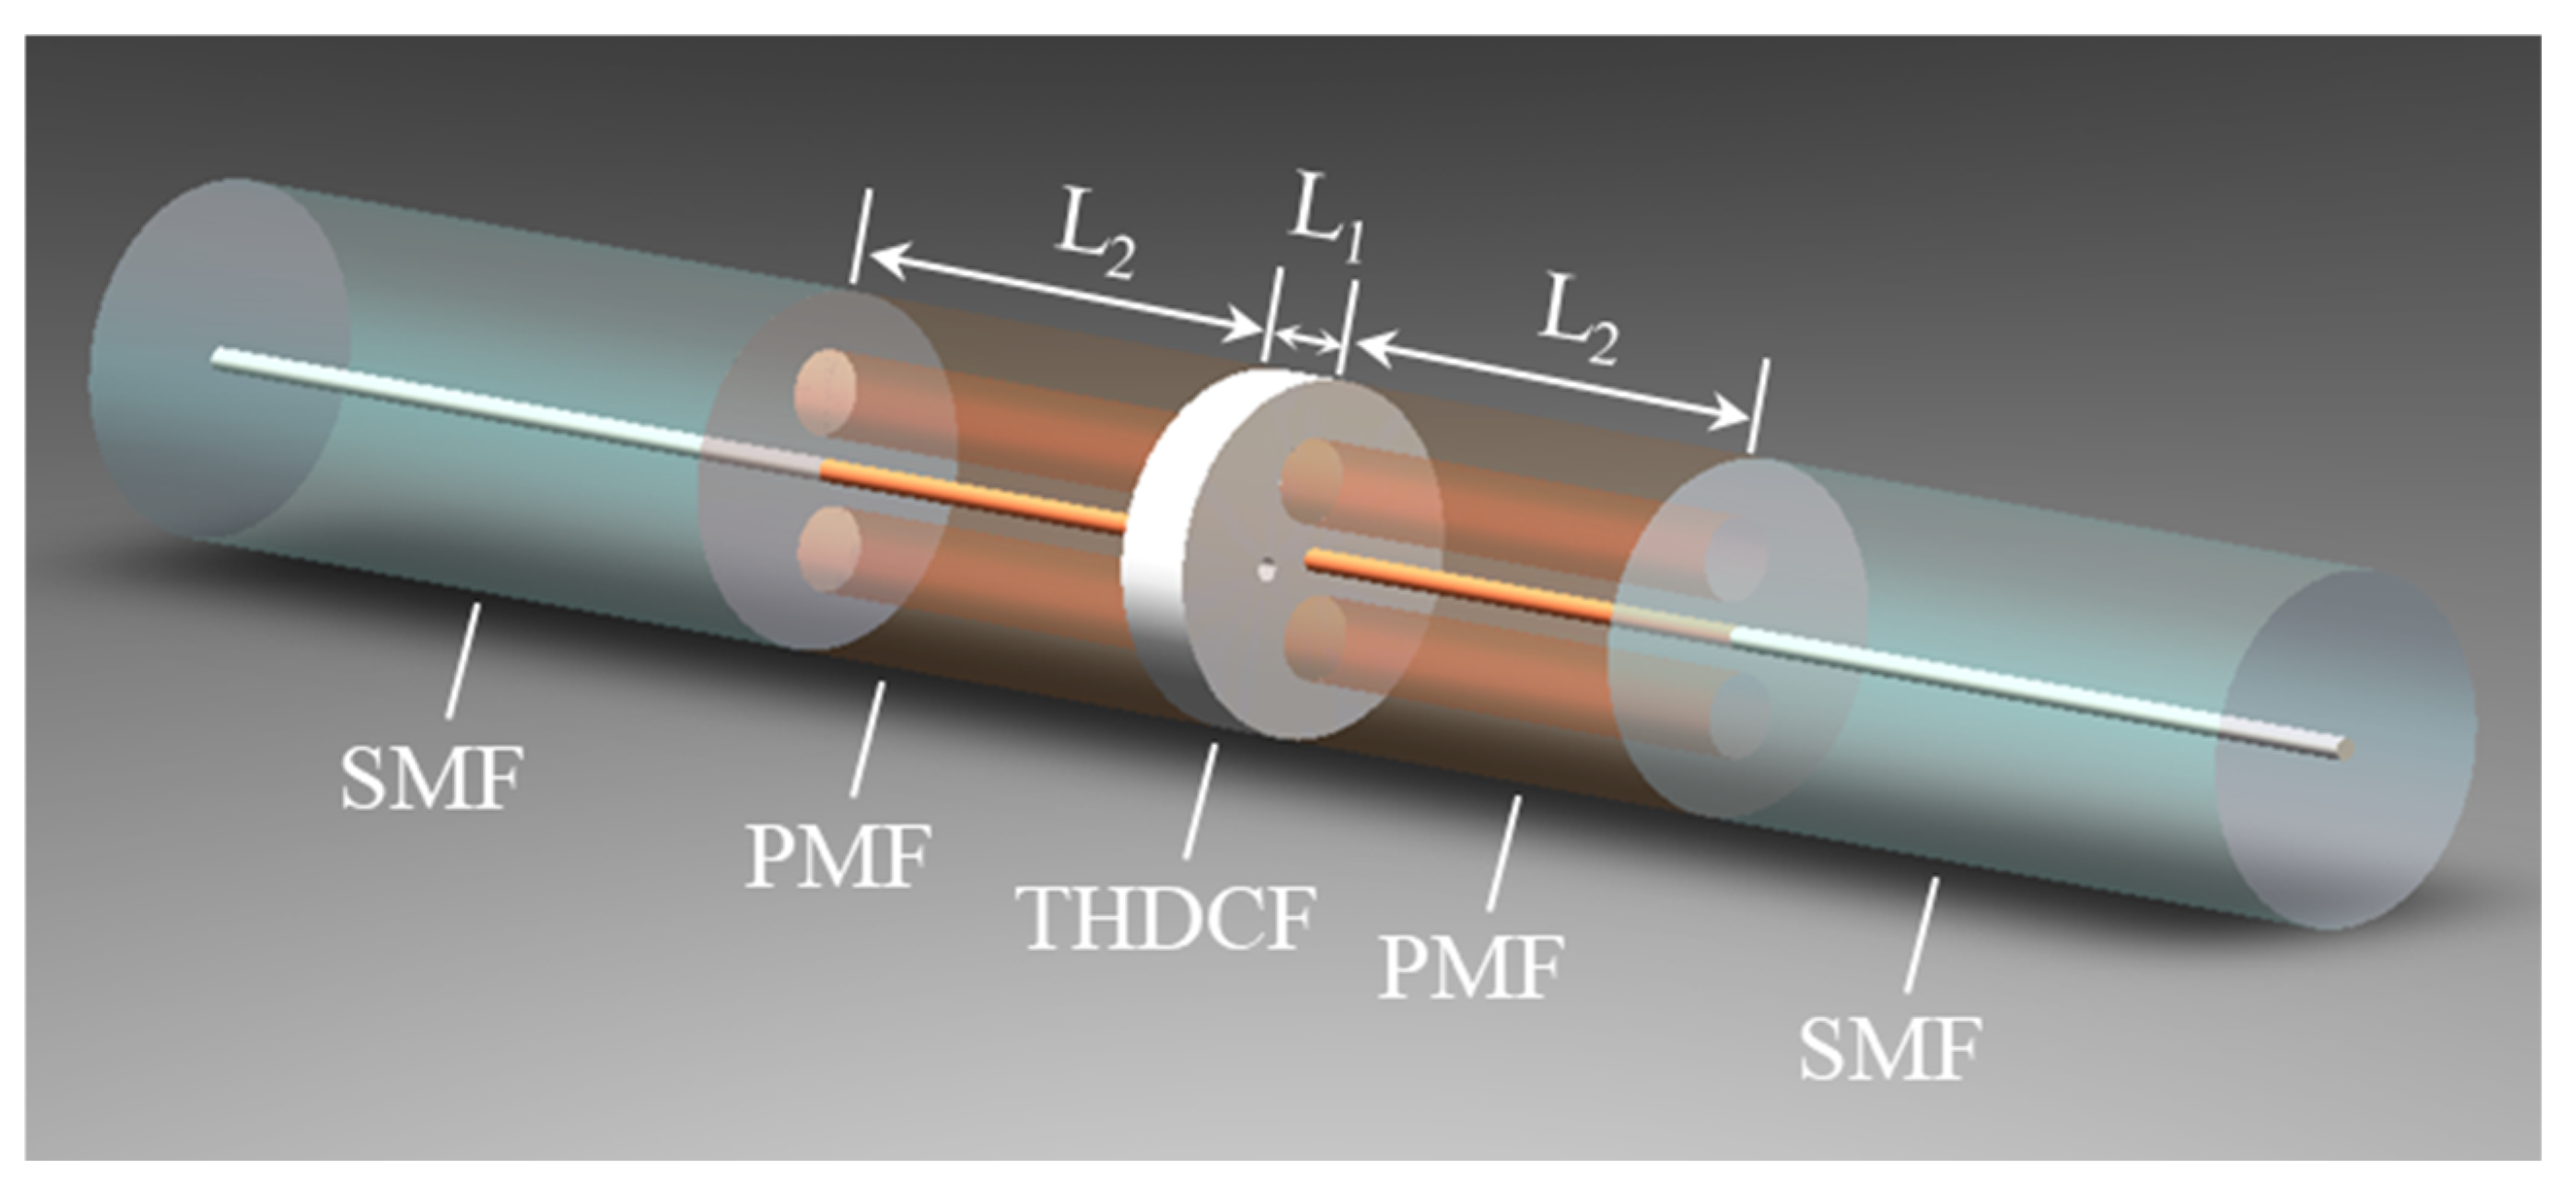
Figure 2.
Images depicting the cross-sectional size of (a) THDCF and (b) PMF.

Figure 3.
The stress distribution under 1 MPa for (a) THDCF and (b) PMF.
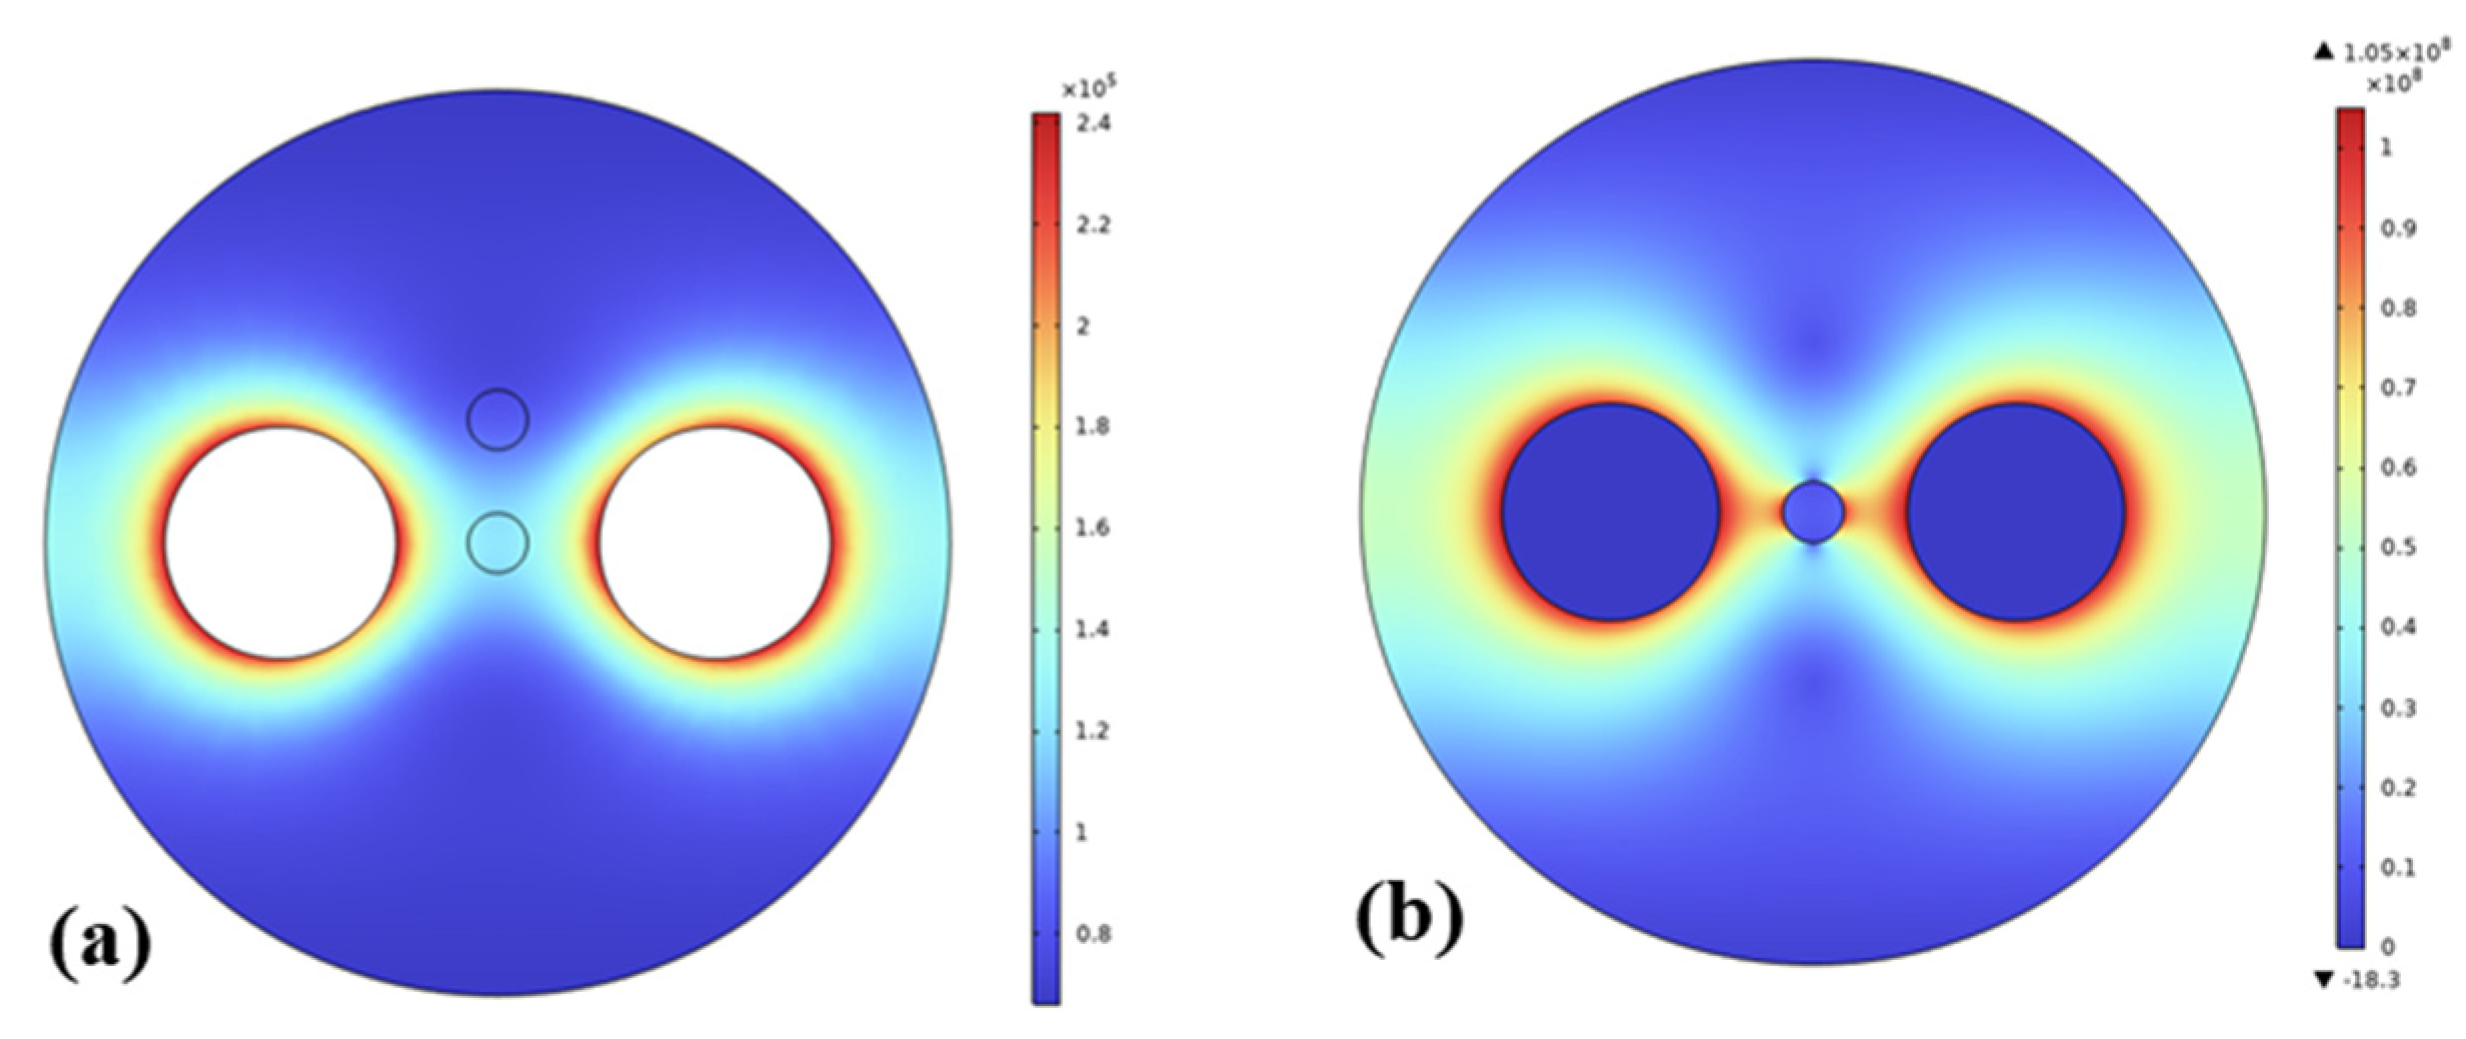
Figure 4.
Simulated birefringence values (nx-ny) within the core of (a) THDCF and (b) PMF as a function of the gas pressure at room temperature 25℃.
Figure 4.
Simulated birefringence values (nx-ny) within the core of (a) THDCF and (b) PMF as a function of the gas pressure at room temperature 25℃.
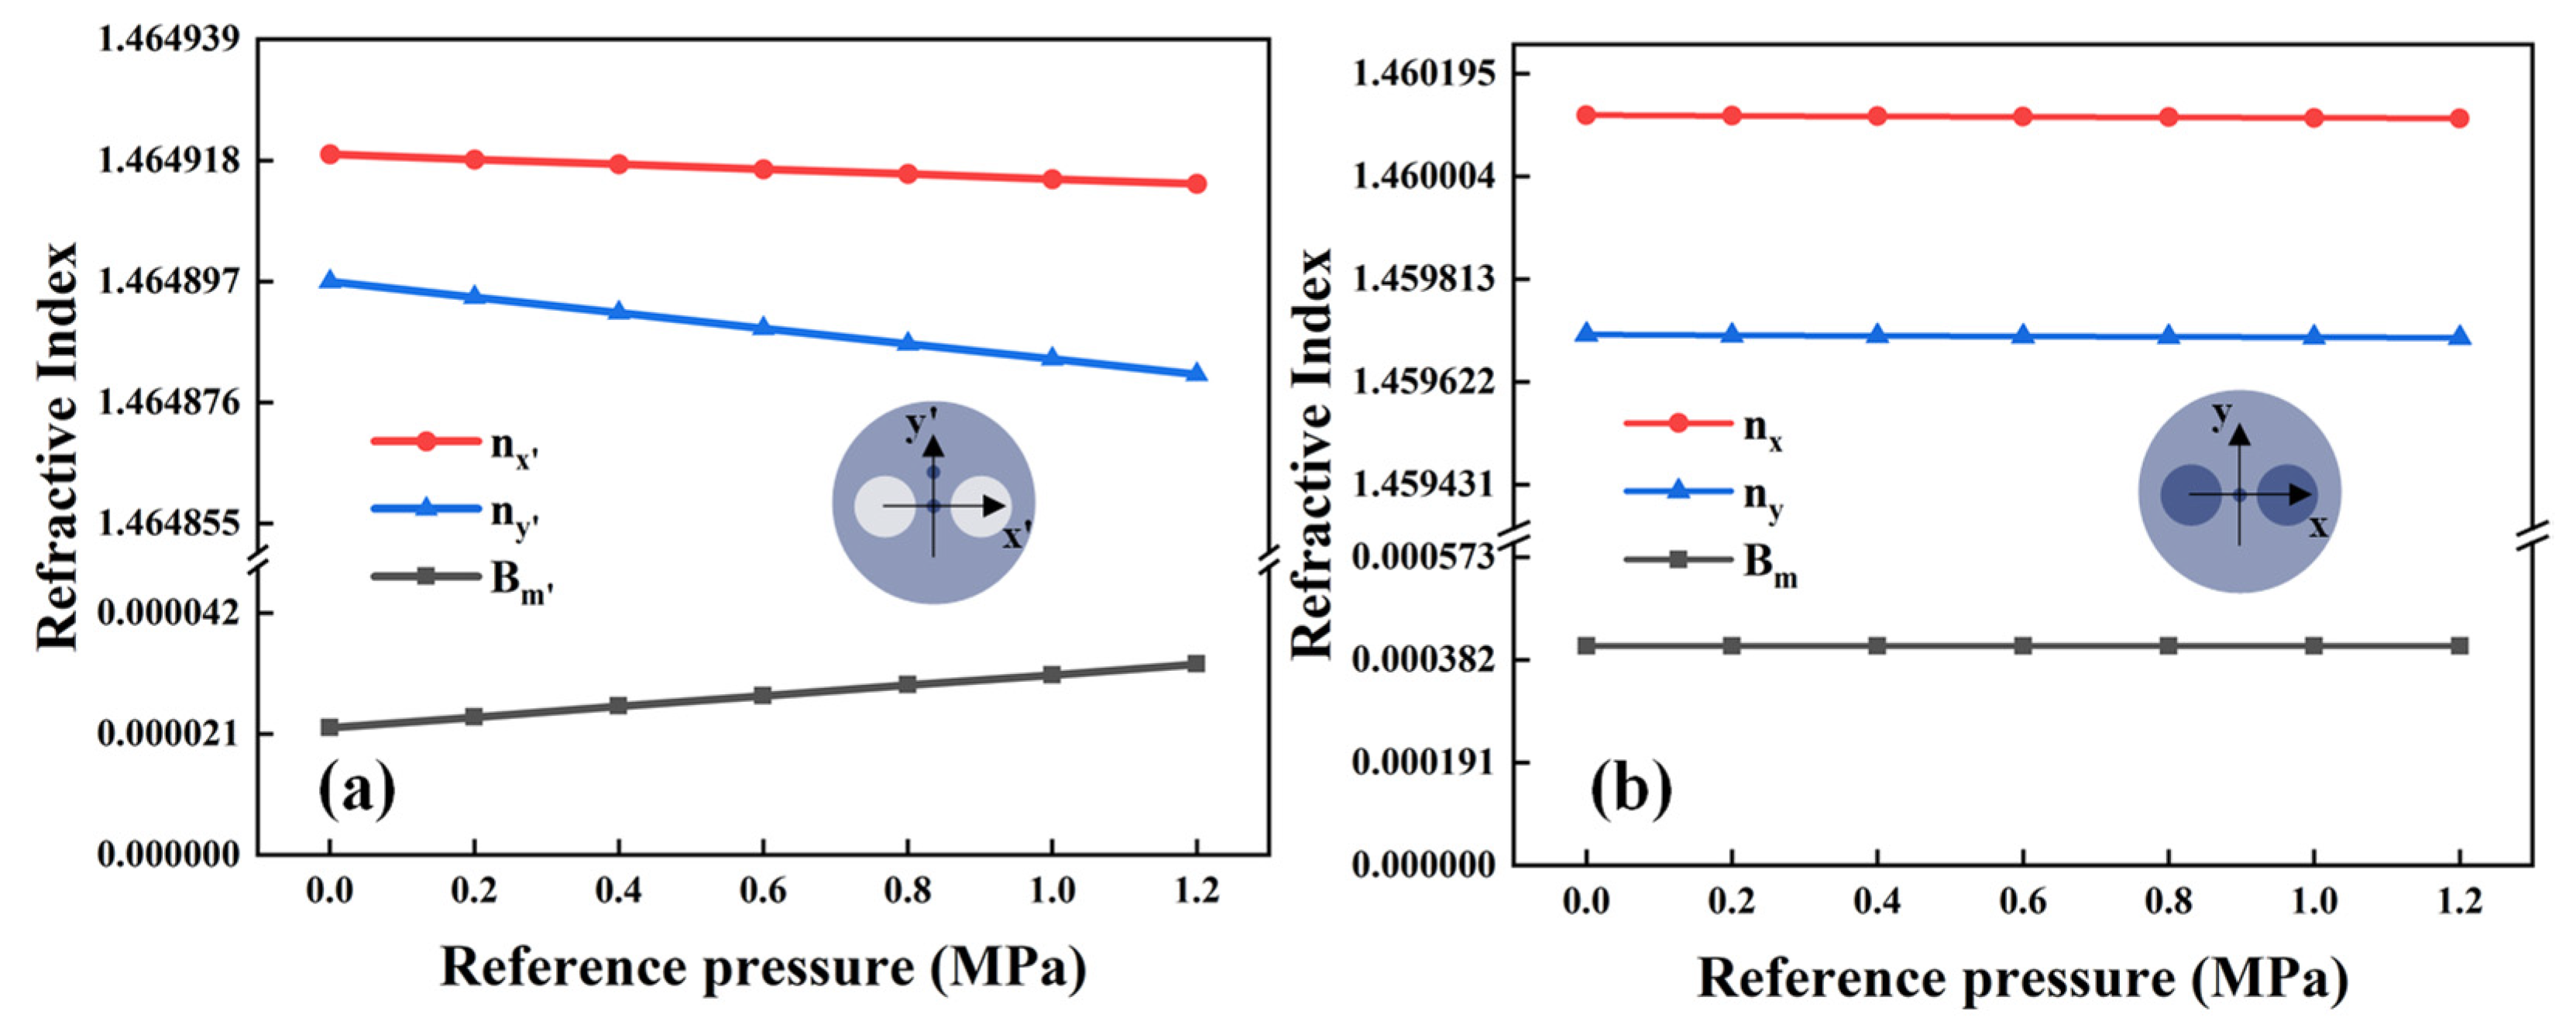
Figure 5.
Schematic diagram of a Sagnac fiber interferometer for gas pressure measurement.
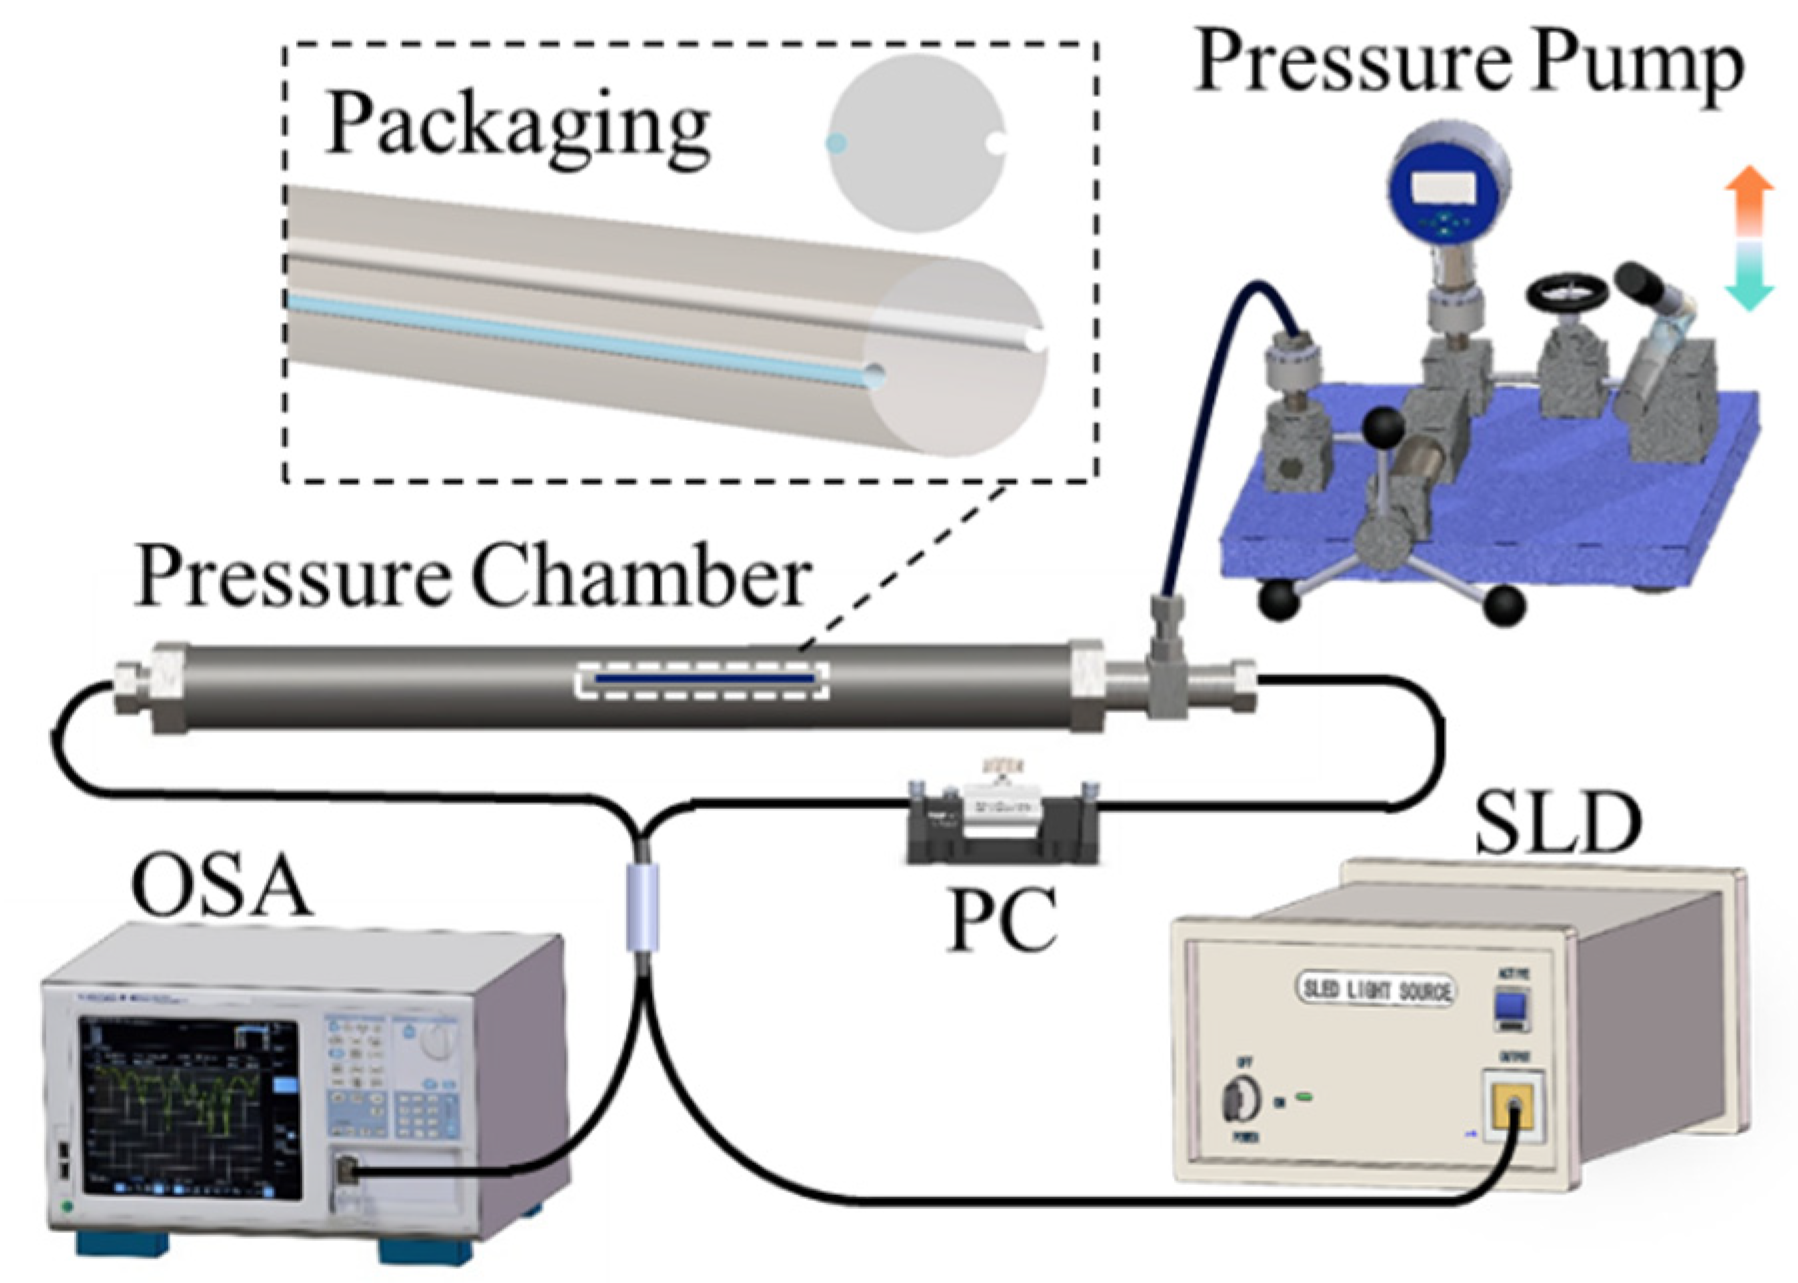
Figure 6.
Interference spectra of PMFs with length of (a) 40 cm, (b) 30 cm, (c) 20 cm, and (d)10 cm.
Figure 6.
Interference spectra of PMFs with length of (a) 40 cm, (b) 30 cm, (c) 20 cm, and (d)10 cm.

Figure 7.
Transmission spectra of PMF-THDCF-PMF with THDCF length of (a) 3 cm, (b) 2 cm, (c) 1 cm, (d) 0 cm.
Figure 7.
Transmission spectra of PMF-THDCF-PMF with THDCF length of (a) 3 cm, (b) 2 cm, (c) 1 cm, (d) 0 cm.
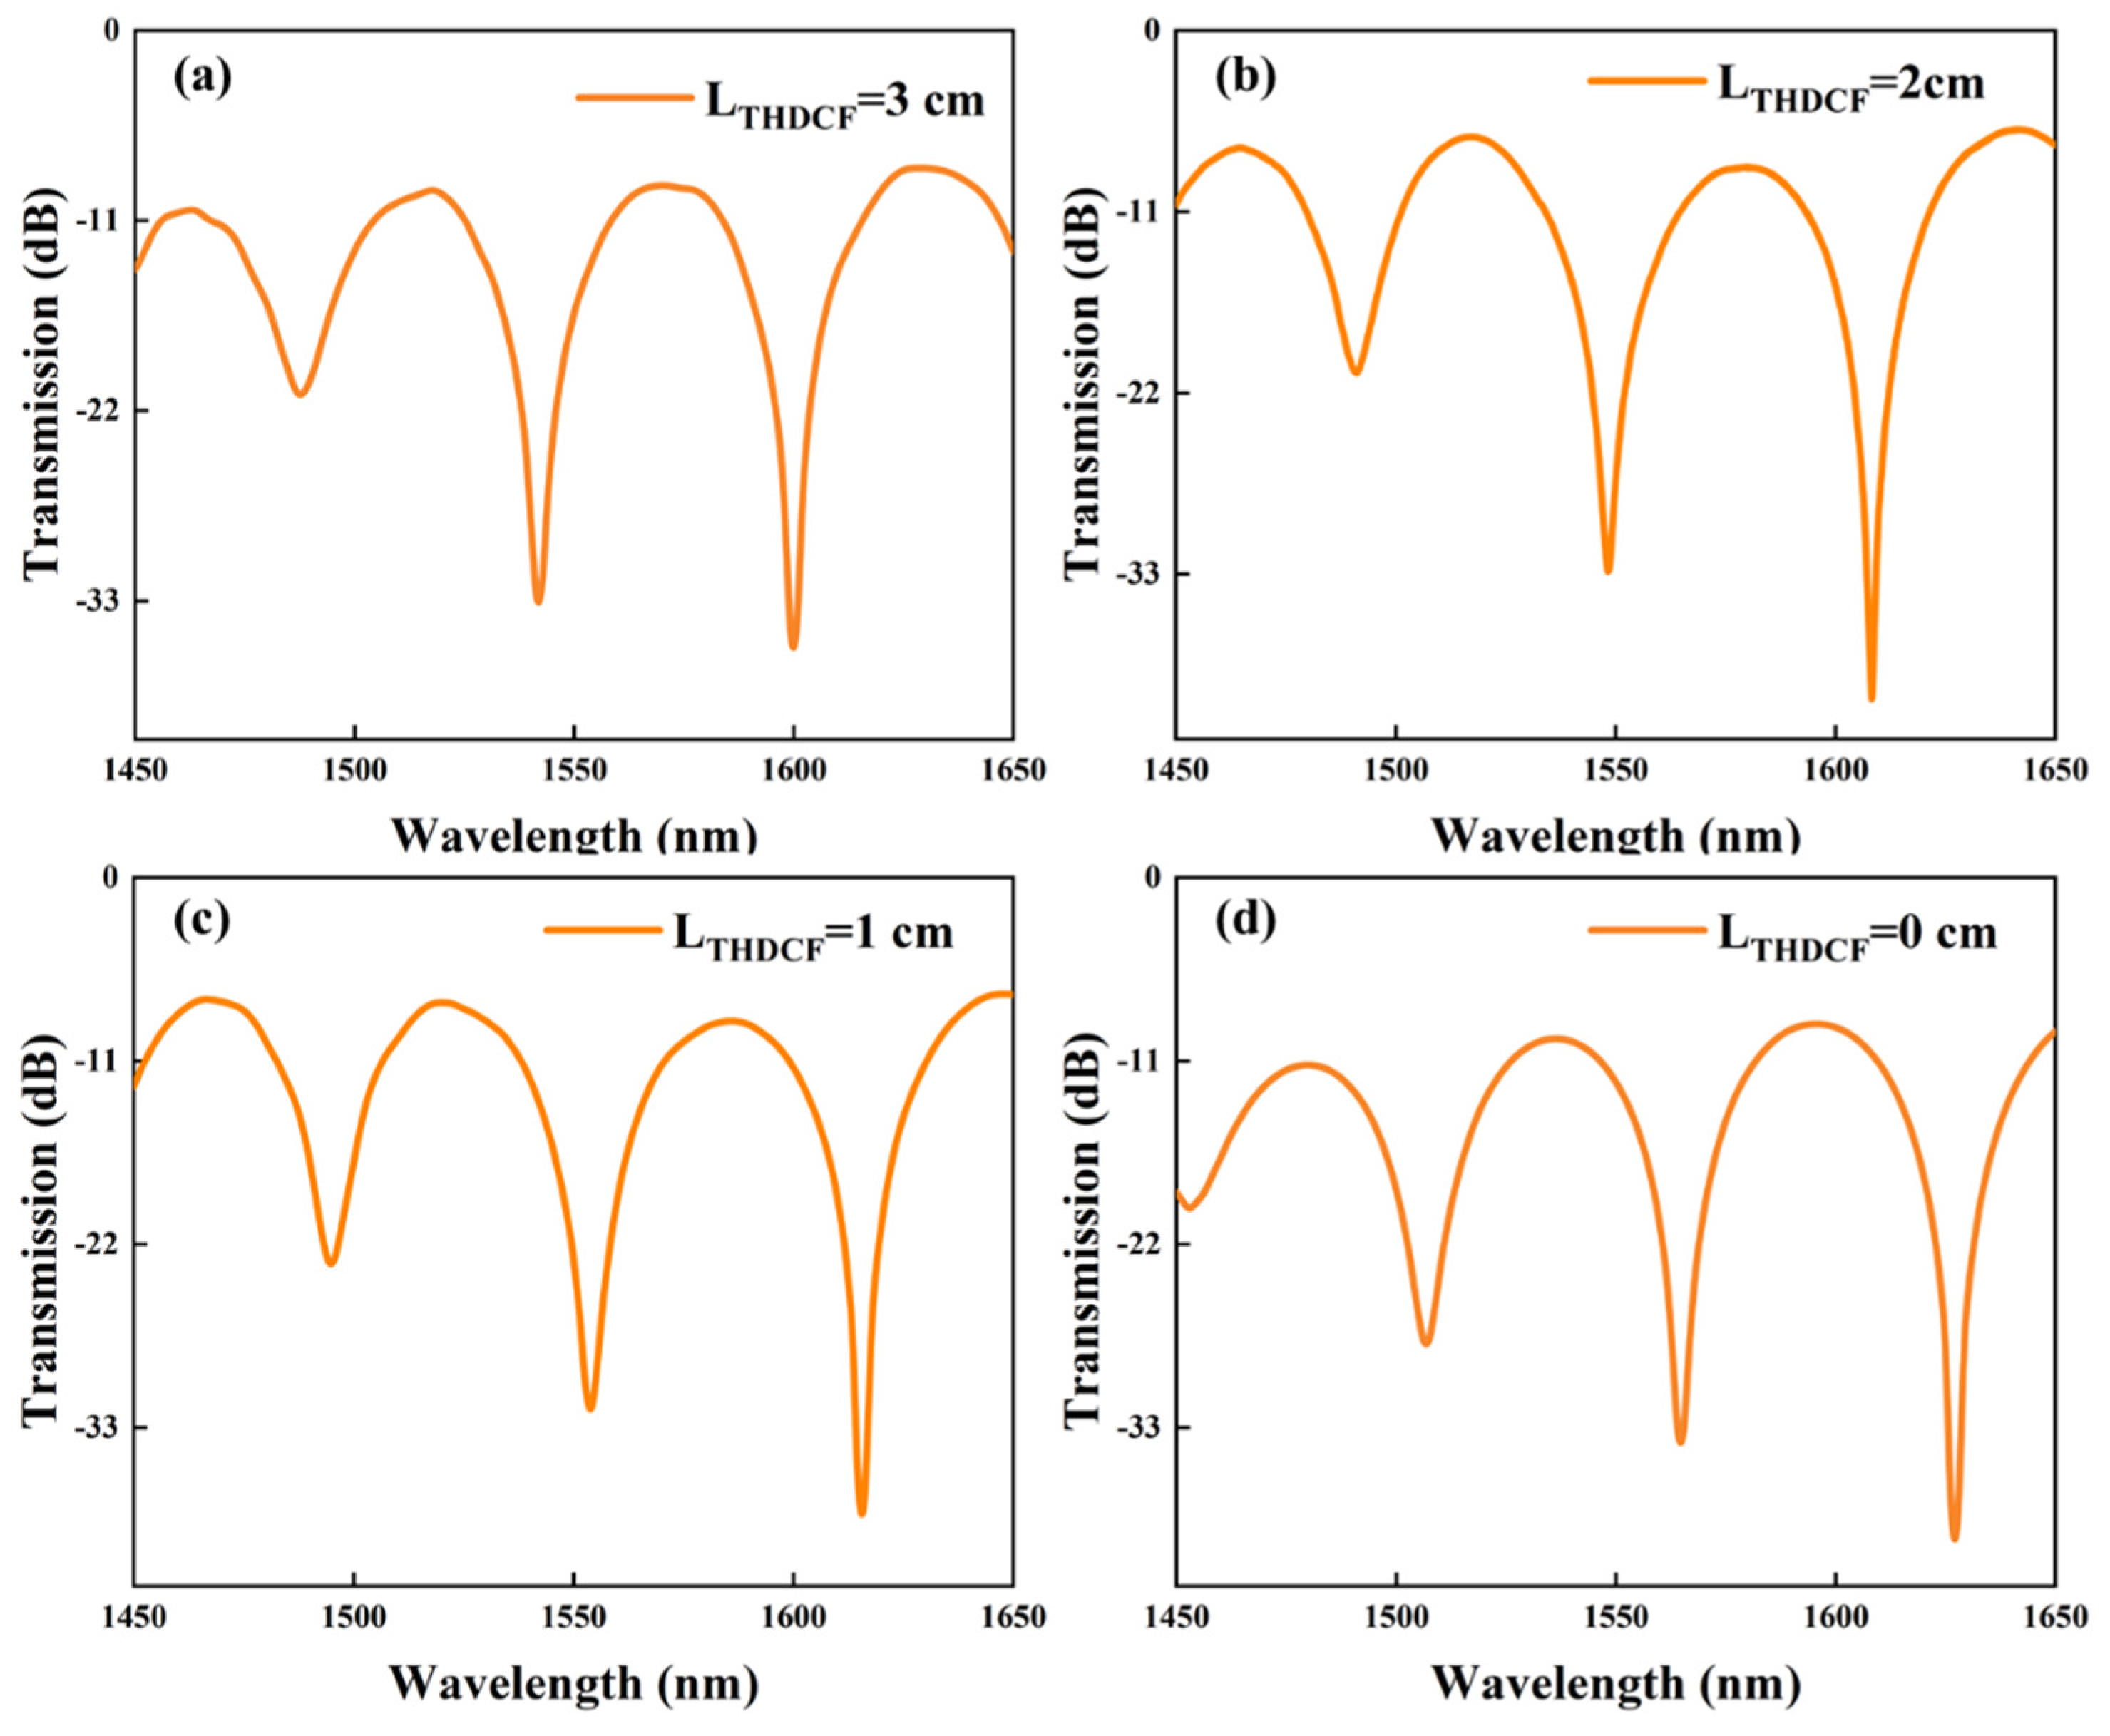
Figure 8.
Frequency spectra of varying lengths of (a) PMF and (b) THDCF.
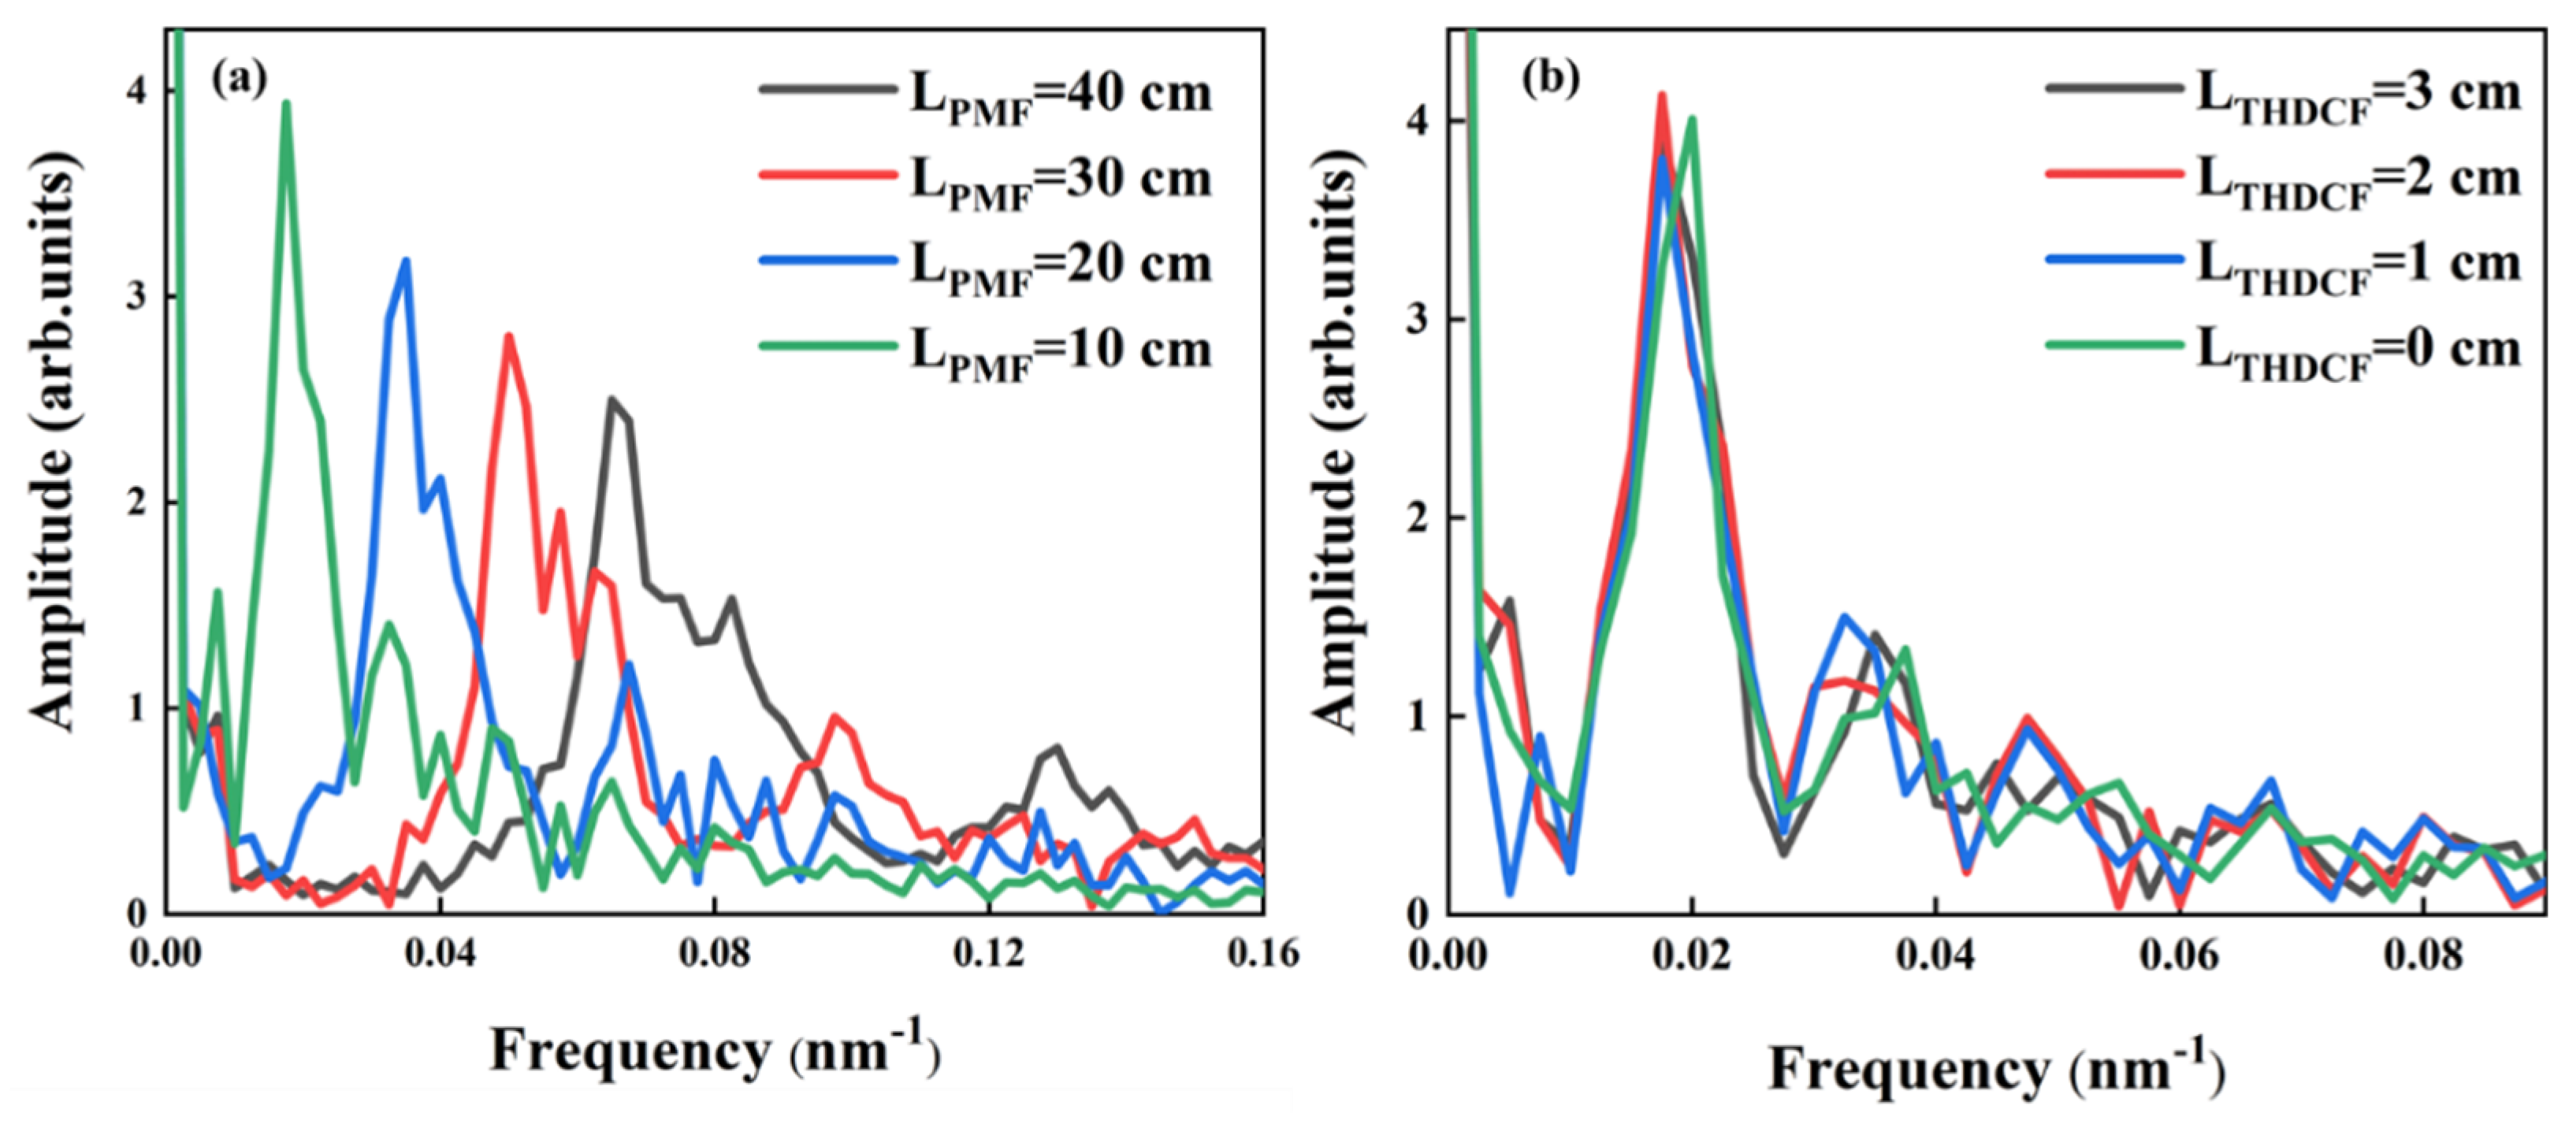
Figure 10.
Spectral shifts under different gas pressure conditions: (a) increasing from 0 MPa to 1.2 MPa and (b) decreasing from 1.2 MPa to 0 MPa.
Figure 10.
Spectral shifts under different gas pressure conditions: (a) increasing from 0 MPa to 1.2 MPa and (b) decreasing from 1.2 MPa to 0 MPa.

Figure 11.
Three gas pressure-increasing and pressure-decreasing measurements (a) Group I, (b) Group II, (c) Group III. Three sets of gas pressure increase and decrease measurements: (a) Group I, (b) Group II, and (c) Group III, with error bars included for each of the three measurement sets.
Figure 11.
Three gas pressure-increasing and pressure-decreasing measurements (a) Group I, (b) Group II, (c) Group III. Three sets of gas pressure increase and decrease measurements: (a) Group I, (b) Group II, and (c) Group III, with error bars included for each of the three measurement sets.

Figure 12.
Error bars for three measurements.
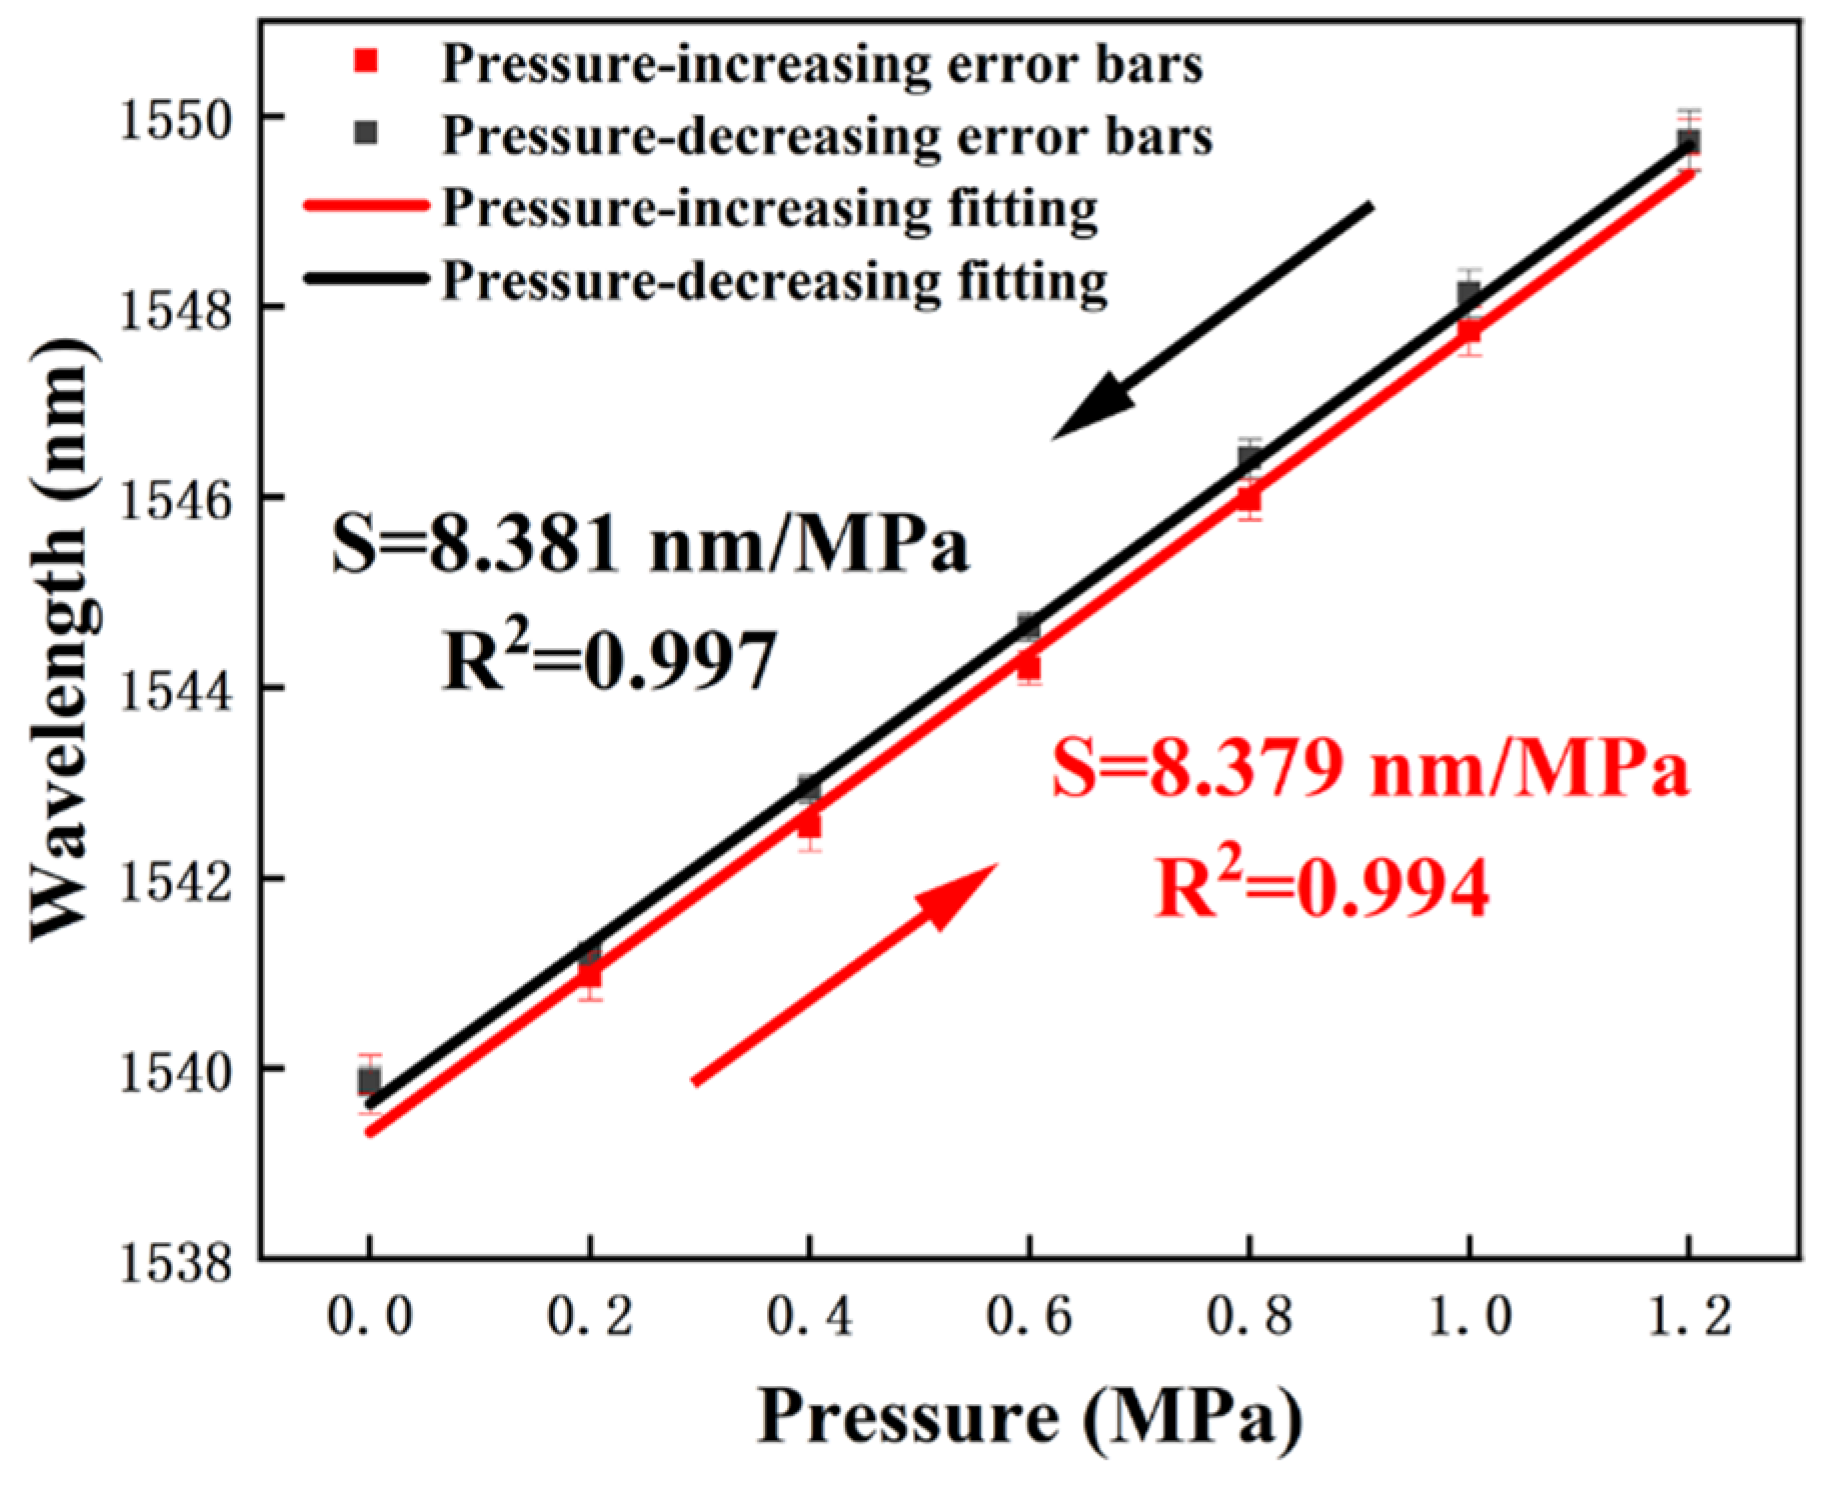
Figure 13.
Temperature sensitivity test. (a) Spectra blue shift, (b) Linear fitting of the dip1 feature at 1550 nm.
Figure 13.
Temperature sensitivity test. (a) Spectra blue shift, (b) Linear fitting of the dip1 feature at 1550 nm.
Disclaimer/Publisher’s Note: The statements, opinions and data contained in all publications are solely those of the individual author(s) and contributor(s) and not of MDPI and/or the editor(s). MDPI and/or the editor(s) disclaim responsibility for any injury to people or property resulting from any ideas, methods, instructions or products referred to in the content. |
© 2025 by the authors. Licensee MDPI, Basel, Switzerland. This article is an open access article distributed under the terms and conditions of the Creative Commons Attribution (CC BY) license (http://creativecommons.org/licenses/by/4.0/).
Copyright: This open access article is published under a Creative Commons CC BY 4.0 license, which permit the free download, distribution, and reuse, provided that the author and preprint are cited in any reuse.


