
Submitted:
12 November 2025
Posted:
13 November 2025
You are already at the latest version
Abstract
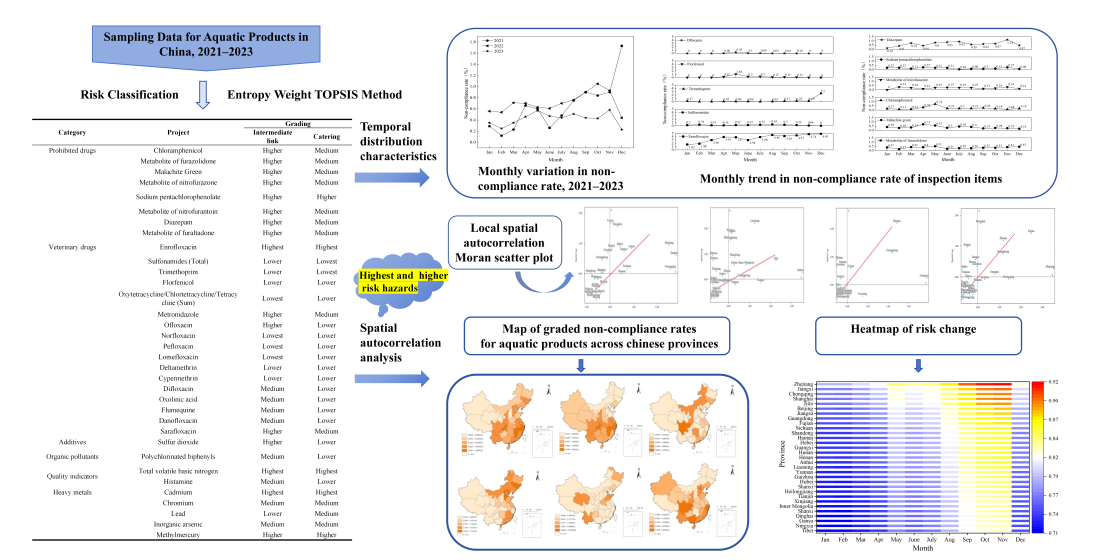
This study investigated the risk classification and spatiotemporal evolution patterns of risk substances in Chinese aquatic products. The entropy weight TOPSIS method was utilized to achieve ranking of risk substances and classify their risk levels. Spatial autocorrelation analysis were conducted to explore the spatial distribution patterns of the highest-risk and higher-risk substances in Chinese aquatic products. Risk adjustment factors were employed to perform dynamic analysis of risks in aquatic products across different temporal and spatial contexts. Research findings indicated that the top three risk substances in aquatic products were cadmium, enrofloxacin, and total volatile basic nitrogen. Cadmium, enrofloxacin, furazolidone metabolites, and chloramphenicol exhibited a significant global spatial autocorrelation.Spatiotemporal analysis found that risks in aquatic products were higher during summer and autumn. It is recommended that regulatory measures and plans be adjusted in light of the findings, thus providing a scientific foundation for the safety supervision of aquatic products.
Keywords:
aquatic products
; risk substances
; risk classification
; entropy weight TOPSIS method
; spatiotemporal analysis
1. Introduction
Aquatic products refer to animals, plants, and microorganisms derived from aquatic sources, as well as various derivative products obtained through industrial processing [1]. As a vital source of protein, aquatic products supply nearly 20% of global animal protein consumption and have become a key component of dietary structures [2,3]. They are important sources of high-quality proteins, essential amino acids, fatty acids, and trace elements [4], characterized by high protein, low fat, easily digestibility, rich minerals, and delicious taste [5]. These products play a critical role in improving cardiovascular and cerebrovascular health, enhancing cognitive function, and promoting neural development, offering particular nutritional benefits for the cardiovascular health in the elderly and the intellectual development in children [6,7,8]. Asia accounts for over 70% of global aquatic product consumption [9]. As a major producer, consumer, and trader of aquatic products worldwide, China achieved a total aquatic product output of 71.1617 million metric tons in 2023, with total imports and exports reaching 10.5605 million metric tons and a total trade value of USD 44.237 billion, while its per capita annual consumption significantly exceeds the global average [10].
Due to the complexity of the aquatic product supply chain, which encompasses aquaculture, fishing, transportation, processing, and dining consumption, it faces multidimensional contamination risks. These risks present a complex feature by the coexistence of traditional and emerging pollutants, along with intertwined biochemical hazards. The quality and safety of aquatic products have attracted widespread attention, with food safety concerns primarily including heavy metal contamination, drug residues, and biological hazards [11,12]. Heavy metals are toxic and potentially carcinogenic. They accumulate in aquatic systems and cause bioaccumulation even at low exposure concentrations, and can damage multiple organs, including the nervous system, liver, lungs, kidneys, stomach, skin, and reproductive system [13]. For example, arsenic can cause reproductive disorders and nervous system damage; lead may impair the nervous system, disrupt brain activity, and impair bone marrow function; cadmium is linked to adverse effects on bones, kidneys, and reproductive systems [14,15]. As aquaculture expands in scale, stocking densities have increased, which in turn leads to frequent outbreaks of various diseases. This has also been coupled with increased overuse of drugs, non-compliant medication, and the use of banned substances, resulting in the residues of these substances in aquatic products and widespread concern [16,17]. Common drug residues in aquatic products primarily include nitrofuran metabolites, chloramphenicol, quinolones, sulfonamides, and tetracyclines [18,19,20]. They pose significant health risks to people, including the development of antibiotic resistance, carcinogenic effects, teratogenic effects, allergic reactions, and disruption of normal gut microbiota [21,22]. In response to the aforementioned risks, scholars have progressively developed a multidimensional assessment framework. Chen et al. [23] comprehensively evaluates heavy metal contamination in aquatic products and associated health risks by integrating single-factor pollution indexes, composite pollution indexes, and safety assessments. Ku et al. [24] proposes a decision tree model for heavy metal hazards to assess the potential health risks of 12 heavy metals in seven categories of aquatic products. The study integrates the statistical data from the fisheries in Taiwan and national food consumption data, and by analyzing heavy metal concentrations in 556 cooking aquatic product samples, it conducts risk assessments using estimated daily intake (EDI) and hazard quotient (HQ). Liu et al. [25]determines indicator weights using the Analytic Hierarchy Process (AHP), and calculates risk indices using comprehensive index and multiplicative synthesis. Taking data from Guangzhou as an example, the annual risk indice and grades are calculated to assess food safety conditions and validate the index methods. The final risk assessment indicator system comprises 5 primary indicators, 13 S-level indicators, and 13 chemical contaminants, covering hazards, vulnerability, monitoring, consumption patterns, public sentiment, and regulatory oversight. However, existing studies are largely limited to static assessments and lack dynamic analysis of spatiotemporal heterogeneity and synergistic effects of pollutants, which constrains the precision of risk warnings.
Therefore, the present study proposed a three-dimensional assessment framework integrating time, space, and risk substances. Based on the supervision data of 1.04 million batches of aquatic products from China's 31 provinces between 2021 and 2023, four categories of indicators were consolidated: non-compliance rate, detection rate, qualification degree, and hazard degree. Methodologically, the entropy weighting method was employed to objectively assign weights, overcoming the limitations of subjective preferences inherent in traditional AHP. By combining the TOPSIS model, the framework quantified the priority of risk substances, and achieved dynamic ranking by calculating the proximity of each sample to the ideal solution. This model aimed to reveal the spatiotemporal distribution patterns of risk substances in aquatic products and the risk transmission pathways within the supply chain. It provides algorithmic support for constructing a comprehensive, intelligent, and dynamic monitoring network spanning the entire chain “from farm to fork”, offering scientific basis for the safety supervision of aquatic products. It drives the transformation of aquatic product safety governance from an experience-driven approach to a data-driven paradigm, facilitating the transition from extensive regulation to precision-based management.
2. Materials and Methods
2.1. Data Sources and Study Methods
The data in this study were sourced from the publicly released supervision and inspection data of aquatic products by the market supervision administrations in various provinces, municipalities, and autonomous regions (excluding Taiwan, Hong Kong, and Macao) between 2021−2023. Based on the research objectives, the supervision and inspection data of aquatic products were organized, and nine items were ultimately retained: sampling location, sampled province, sampling date, sampling stage, regional type of sampled entity, inspection items, sampling results, and determination of sampling results. Four types of indicators were selected: non-compliance rate, detection rate, qualification degree, and hazard degree [26]. The rankings of risk substances were determined using the entropy weight TOPSIS method, and risk classification was performed based on the Pareto principle.
2.2. Analytical Methods
2.2.1. Construction of Risk Classification Model Based on the Entropy Weight TOPSIS Method
The entropy weight TOPSIS model was an integrated approach that combines the entropy weight method with the TOPSIS technique. The entropy weight method determined the weights of various indicators by analyzing the information they provide. Subsequently, the TOPSIS method was used to calculate the distances between each indicator and its ideal solution, thereby assessing the proximity of each evaluation object to the optimal level. This approach mitigated the subjectivity associated with manual weight assignment, reducing the potential for bias from human judgment. Consequently, it yielded evaluation results that were more aligned with objective reality. The model boasted several advantages such as strong interpretability, intuitive geometric interpretation, and flexible computation [27,28].
2.2.1.1. Calculation of Weights by the Entropy Weight Method
For n samples and k indicators, Xij represented the jth indicator for the ith sample (where i = 1, 2, ..., n; j = 1, 2, ..., k), denoted the standardized value of each indicator. The matrix X was obtained from i risk factors and j indicators, as shown in Equation 1.
Perform dimensionless processing on the original matrix to eliminate the impact of differing units of measurement, yielding the matrix (Equation 2). Max (Xj) was the maximum value for each indicator, while min (Xj) was the minimum value. Should zero values appear in the standardised matrix after processing, to ensure meaningful data handling, all dimensionless data shall be shifted by a minimum unit value.
Calculate the feature weight or contribution of the i-th item under the j-th indicator (Equation 3):
The information entropy was calculated (Equations 4 and 5):
The weights were calculated (Equations 6 and 7):
2.2.1.2. Calculation of Relative Proximity Using the TOPSIS Method
Weighted Standardized matrix, multiply matrix Dij by the obtained indicator weights Wj to obtain matrix Uij as shown in Equation 8:
The optimal value vector Ui+ and the suboptimal value vector Ui- for each indicator were determined (Equations 9 and 10):
The distances of each evaluation object from the optimal value vector and the suboptimal value vector were calculated (Equations 11 and 12):
The relative proximity was calculated, with values ranging from [0,1], where a larger value indicated greater risk associated with the hazard. The equation is shown in Equation 13:
2.2.2. Spatial Autocorrelation Analysis
2.2.2.1. Global Spatial Autocorrelation Analysis
Spatial analysis was adopted to identify clustered areas and observe geographic spatial variations. By describing the spatial distribution characteristics of non-compliance rates for high-risk and higher-risk substances in aquatic products, we utilized Moran's I statistic, which ranged between −1 and 1. Values close to 1 indicated positive spatial autocorrelation, values close to −1 indicated negative spatial autocorrelation, and 0 indicated random distribution. Moran's I was calculated and hotspot analysis was performed to determine the location of clusters [29]. Typically, a weight (Wij) was associated with each pair (Xi, Xj) to quantify spatial patterns, as shown in Equation 14:
In the formula, n represented the number of provinces, municipalities, and autonomous regions in China; Xi and Xj denoted the compliance rates of a certain risk factor in regions i and j across the country, respectively; represented the average compliance rates; Wij was the spatial weighting matrix.
2.2.2.2. Local Spatial Autocorrelation Analysis
Local Moran's I was employed to determine local spatial autocorrelation, identifying spatial clusters with similar neighboring characteristics and outliers, as shown in Equation 15:
In the formula, S2 denoted the variance of Xi or Xj, while the other components were interpreted similarly to the global Moran's I.
2.2.3. Spatiotemporal Analysis
Through statistical analysis, the non-compliance rates of aquatic products across provinces and each month were yielded, and thus the risk adjustment factors for different provinces and months were obtained, as shown in Equations 16−18 [30]. In the formula, P was the risk adjustment factor for a province; Pf was the number of non-compliant cases in that province; Qf represented the total number of non-compliant cases for food products; M denoted the risk adjustment factor for a month; Mf signified the total number of non-compliant cases across all provinces for that month. The maximum relative proximity was taken as the baseline risk for the food, to which a risk adjustment factor was added to calculate the final spatiotemporal risk value for the aquatic product.
2.2.4. Statistical Analysis
In this study, the inspection data of aquatic products from 2021 to 2023 were organized by Microsoft Excel 2019. Origin 2021 and ArcGIS 10.8 were used to create maps.
3. Results
3.1. Detection Results of Risk Substances in Aquatic Products
After processing the inspection data of aquatic products from 2021 to 2023, 1,044,312 valid sample data were obtained. The inspection items encompassed six categories: heavy metals, additives, veterinary drugs, prohibited drugs, quality indicators, and organic pollutants, with 34 items in total. These inspections covered both distribution and catering stages. The non-compliance rate, detection rate, qualification degree, and hazard degree for all inspection items across different stages were determined. Using the entropy weight method, the weights for the four indicators—non-compliance rate, detection rate, qualification degree, and hazard degree—were obtained for both the distribution and catering stages. The weight coefficients w for hazard degree, qualification degree, detection rate, and non-compliance rate in the distribution stage were 5.46%, 17.18%, 35.45%, and 41.91%, respectively, while those in the catering stage were 5.72%, 8.14%, 36.89%, and 49.25%, respectively. The TOPSIS model was then employed to comprehensively calculate the proximity of each sample to the ideal solution, achieving the dynamic ranking (Table 1). Among the risk substances in the distribution stage and catering stage, those with higher proximity rankings were cadmium, enrofloxacin, total volatile basic nitrogen.
Relative proximity was classified according to the Pareto principle, with the classification range shown in Table 2, and specific classification results are presented in Table 3. In the distribution stage, cadmium, enrofloxacin, and total volatile basic nitrogen were classified as the highest risk substances; sulfur dioxide, diazepam, methylmercury, malachite green, furazolidone metabolites, chloramphenicol, nitrofurazone metabolites, sodium pentachlorophenolate, metronidazole, nitrofurantoin metabolites, furaltadone metabolites, sarafloxacin, and ofloxacin were categorized as the higher-risk substances; polychlorinated biphenyls, danofloxacin, flumequine, difloxacin, oxolinic acid, inorganic arsenic, chromium and histamine fell into the the medium-risk category; lead, deltamethrin, cypermethrin, trimethoprim, florfenicol, and sulfonamides were categorized as the lower-risk substances; while pefloxacin, oxytetracycline/chlortetracycline/tetracycline (sum), norfloxacin, and lomefloxacin were assigned to the lowest-risk category. In the catering stage, cadmium, enrofloxacin, and total volatile basic nitrogen were classified in the highest-risk category; methylmercury and sodium pentachlorophenolate posed an elevated risk. Inorganic arsenic, chromium, nitrofurazone metabolite, furazolidone metabolite, diazepam, malachite green, chloramphenicol, metronidazole, lead, furaltadone metabolites, nitrofurantoin metabolites, and sarafloxacin were categorized as the medium-risk substances. Ofloxacin, oxolinic acid, difloxacin, pefloxacin, norfloxacin, danofloxacin, flumequine, lomefloxacin, deltamethrin, polychlorinated biphenyls , cypermethrin, florfenicol, oxytetracycline/chlortetracycline/tetracycline (sum), sulfur dioxide, and histamine were considered the lower-risk compounds. Trimethoprim and sulfonamides (total amount) were identified as the lowest-risk substances. Overall, the risk of various risk substances in aquatic products was higher in the distribution stage than that in the catering stage.
An analysis of non-compliant aquatic products (Figure 1) showed that the highest non-compliance rate was observed in seawater crabs (3.19%), followed by other aquatic products (2.25%), and the lowest rate was freshwater crabs (0.04%). An examination was conducted on the non-compliant items detected in different categories of aquatic products. The proportion of each non-compliant item by category is illustrated in Figure 2. The main non-compliant items in freshwater crab were heavy metals and prohibited drugs; in freshwater shrimp, shellfish, and other aquatic products, the main items were heavy metals, veterinary drugs, and prohibited drugs; in seawater fish, heavy metals, veterinary drugs, prohibited drugs, and quality indicators were the primary concerns; seawater shrimp were mainly found to have heavy metals, veterinary drugs, prohibited drugs, and additives; seawater crab was mainly associated with heavy metals; in freshwater fish, veterinary drugs and prohibited drugs were mainly reported. The distribution of non-compliant items detected in different categories of aquatic products is presented in Table 4. For seawater crabs, cadmium was the primary concern, while other aquatic products predominantly showed issues with enrofloxacin, furazolidone metabolites, and nitrofurazone metabolites; for seawater shrimp, it was mainly cadmium and enrofloxacin; freshwater fish was mostly associated with enrofloxacin, diazepam, and malachite green, while shellfish primarily contained chloramphenicol and cadmium; both freshwater shrimp and seawater fish had significant levels of enrofloxacin and furazolidone metabolites, whereas freshwater crabs primarily contained cadmium, nitrofurazone metabolites, and furazolidone metabolites.
An analysis of the non-compliant items in aquatic products revealed that veterinary drugs accounted for the largest proportion at 53.74%, followed by heavy metals at 25.38%. No non-compliant cases were detected for organic pollutants. Based on the risk classification of aquatic products and the non-compliant items in aquatic products (Figure 3), the primary focus should be on veterinary drugs and heavy metals. Among veterinary drugs (Figure 4a), particular attention should be paid to the illegal use of enrofloxacin, which accounted for 92.96% of the non-compliant cases. Regarding heavy metals, only cadmium was found to be non-compliant. In combination with the risk classification, significant attention should be paid to cadmium and methylmercury. The inspection items under prohibited drugs (Figure 4b) all presented relatively high risks and require close attention. Non-compliance in quality indicators was detected for histamine and total volatile basic nitrogen; considering the risk classification, total volatile basic nitrogen requires particular attention. In the category of additives, only sulfur dioxide was found to be non-compliant, which should be closely monitored in light of the risk classification.
3.2. Temporal Distribution of Risky Substances in Aquatic Products
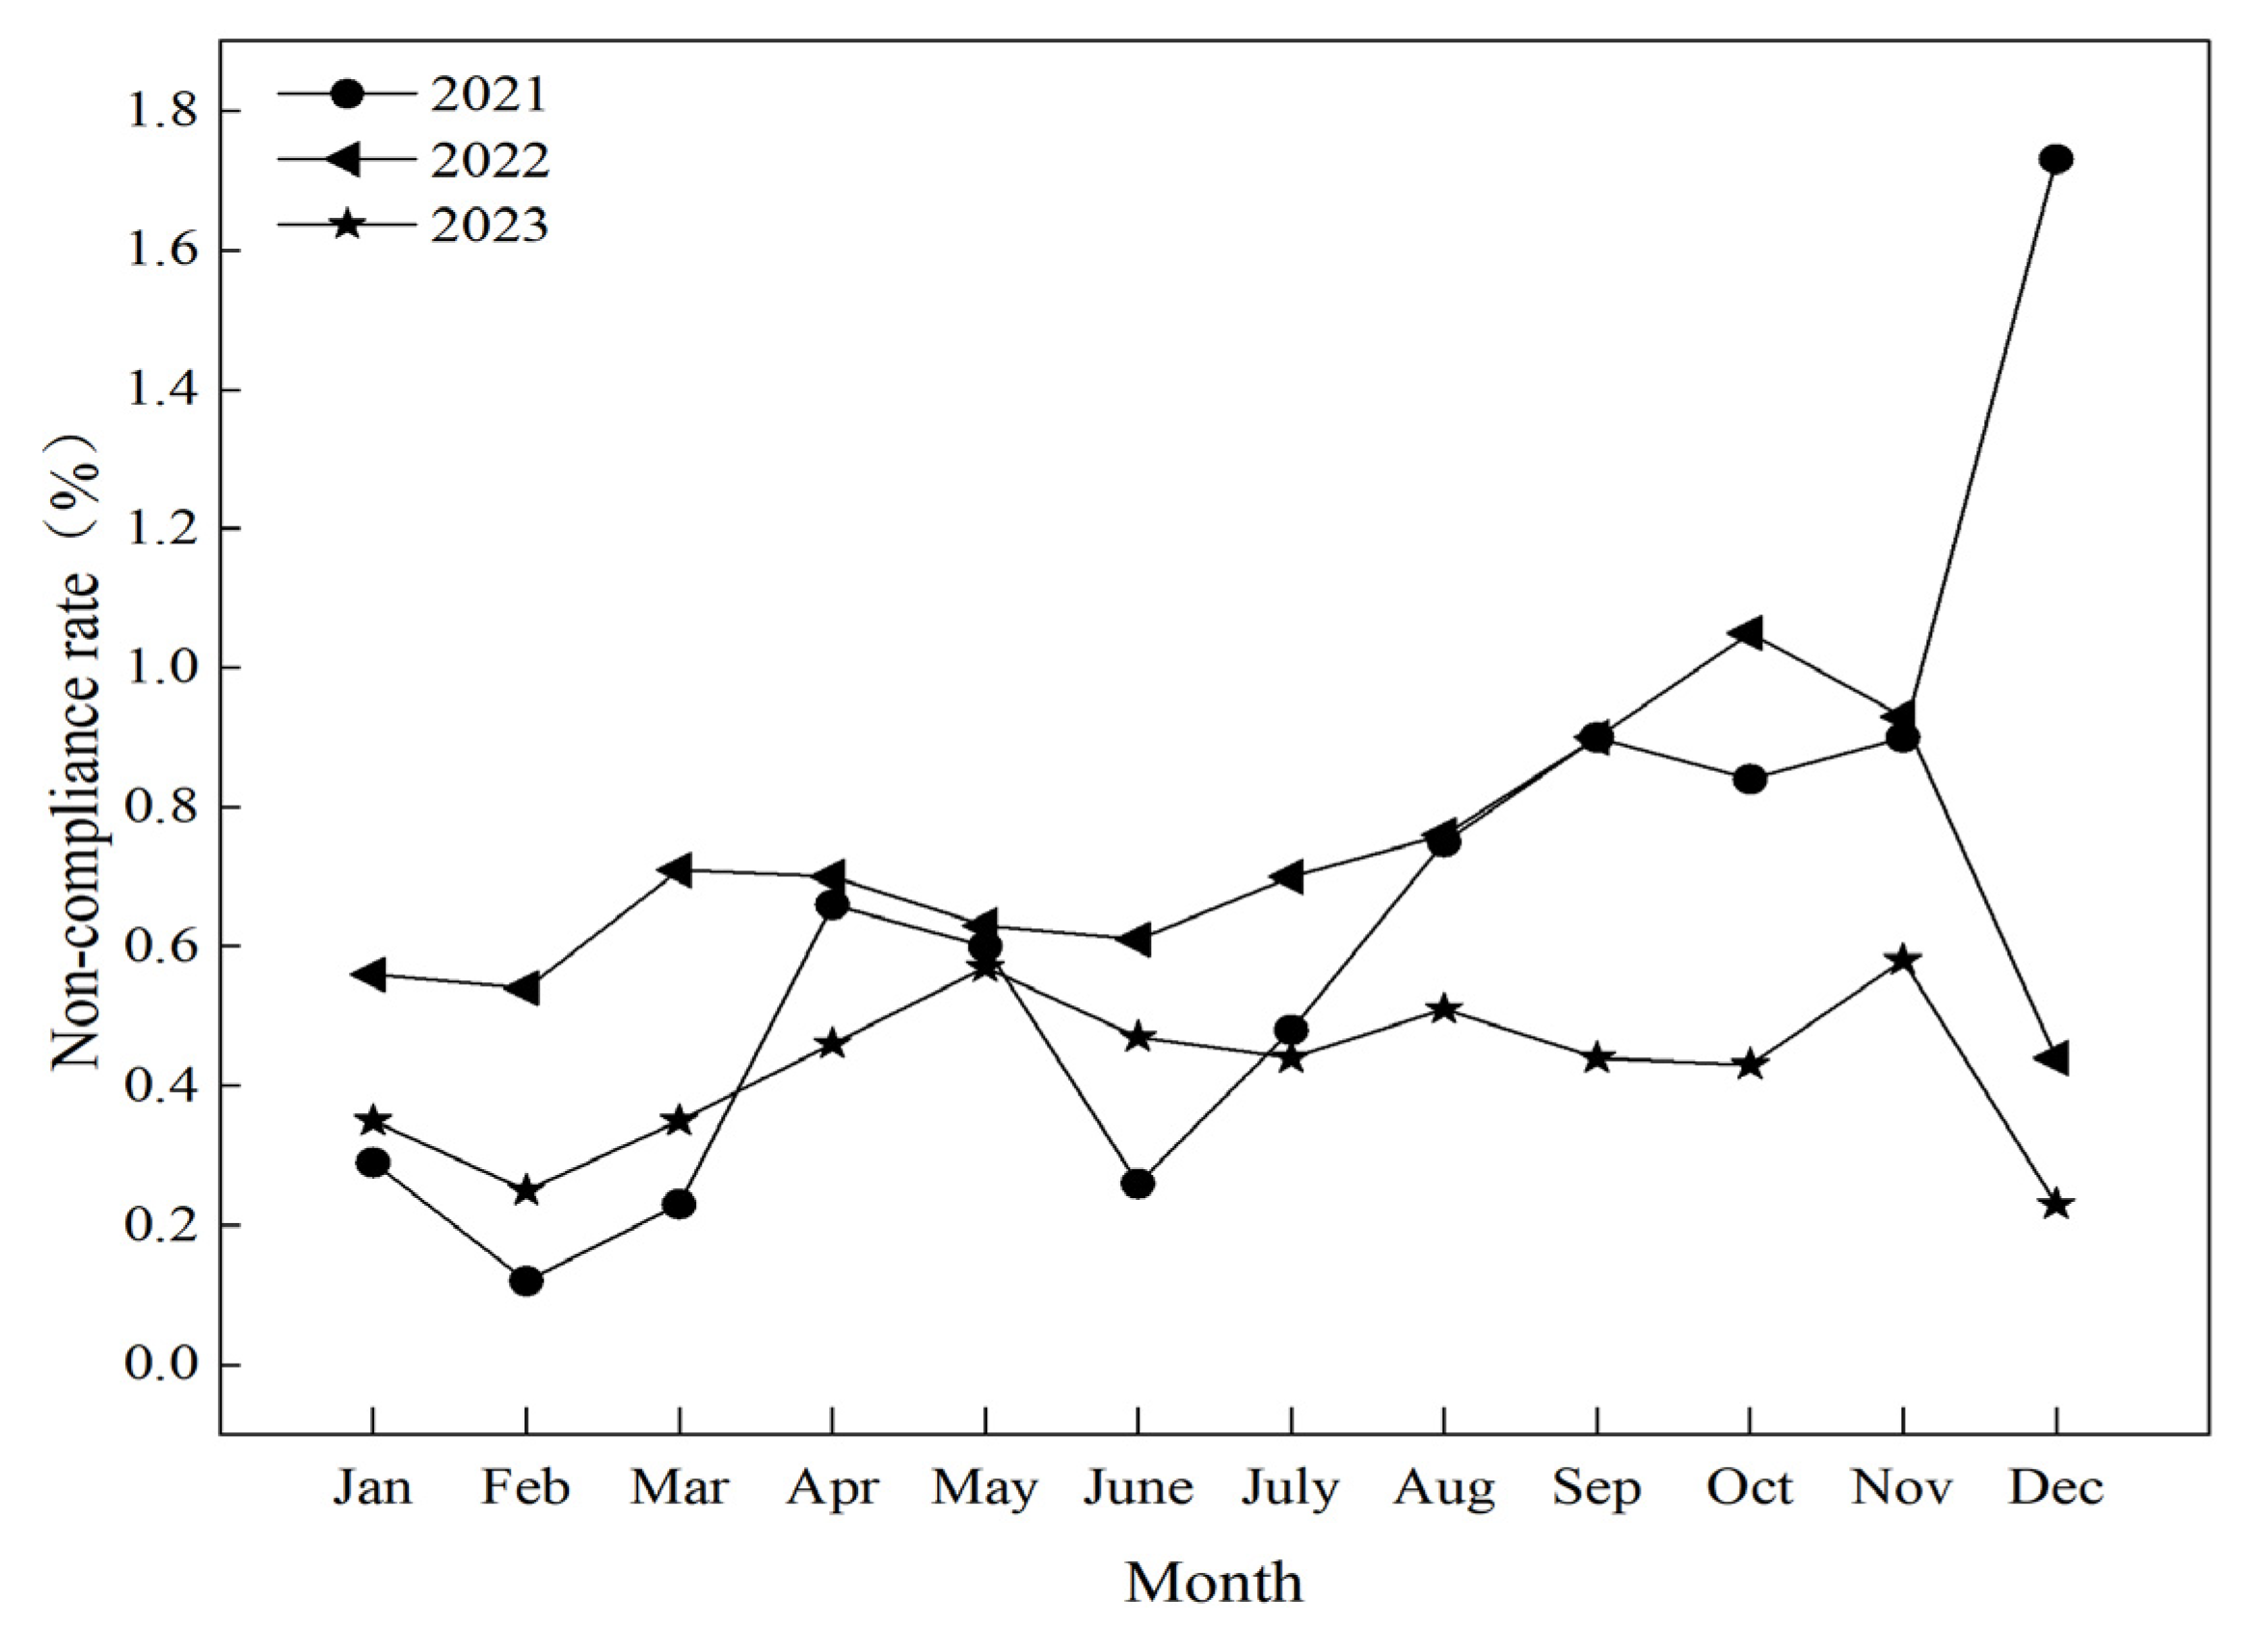
A temporal analysis of the non-compliant cases in the aquatic products from 2021 to 2023 (Figure 4. Non-compliance of inspection tests for veterinary drugs(a) and prohibited drugs (b)) showed a general trend of gradual increase in non-compliance across different months, with a clear seasonal pattern. The non-compliance rate was higher in summer and autumn than in winter and spring. Overall, the non-compliance rate in the second half of the year was higher than that in the first half, exhibiting a gradual upward trend, though the overall fluctuation remained relatively small. In 2021, the lowest non-compliance rate was 0.12% in February, and the highest was 1.73% in December, indicating significant fluctuation. In 2022, the lowest rate was 0.44% in December, and the highest was 1.05% in October. In 2023, the non-compliance rate was lowest in December at 0.23% and highest in November at 0.58%, demonstrating relatively minor fluctuation.
Figure 5.
Changes in the non-compliance rate of aquatic products by month.
3.2.1. Veterinary Drugs
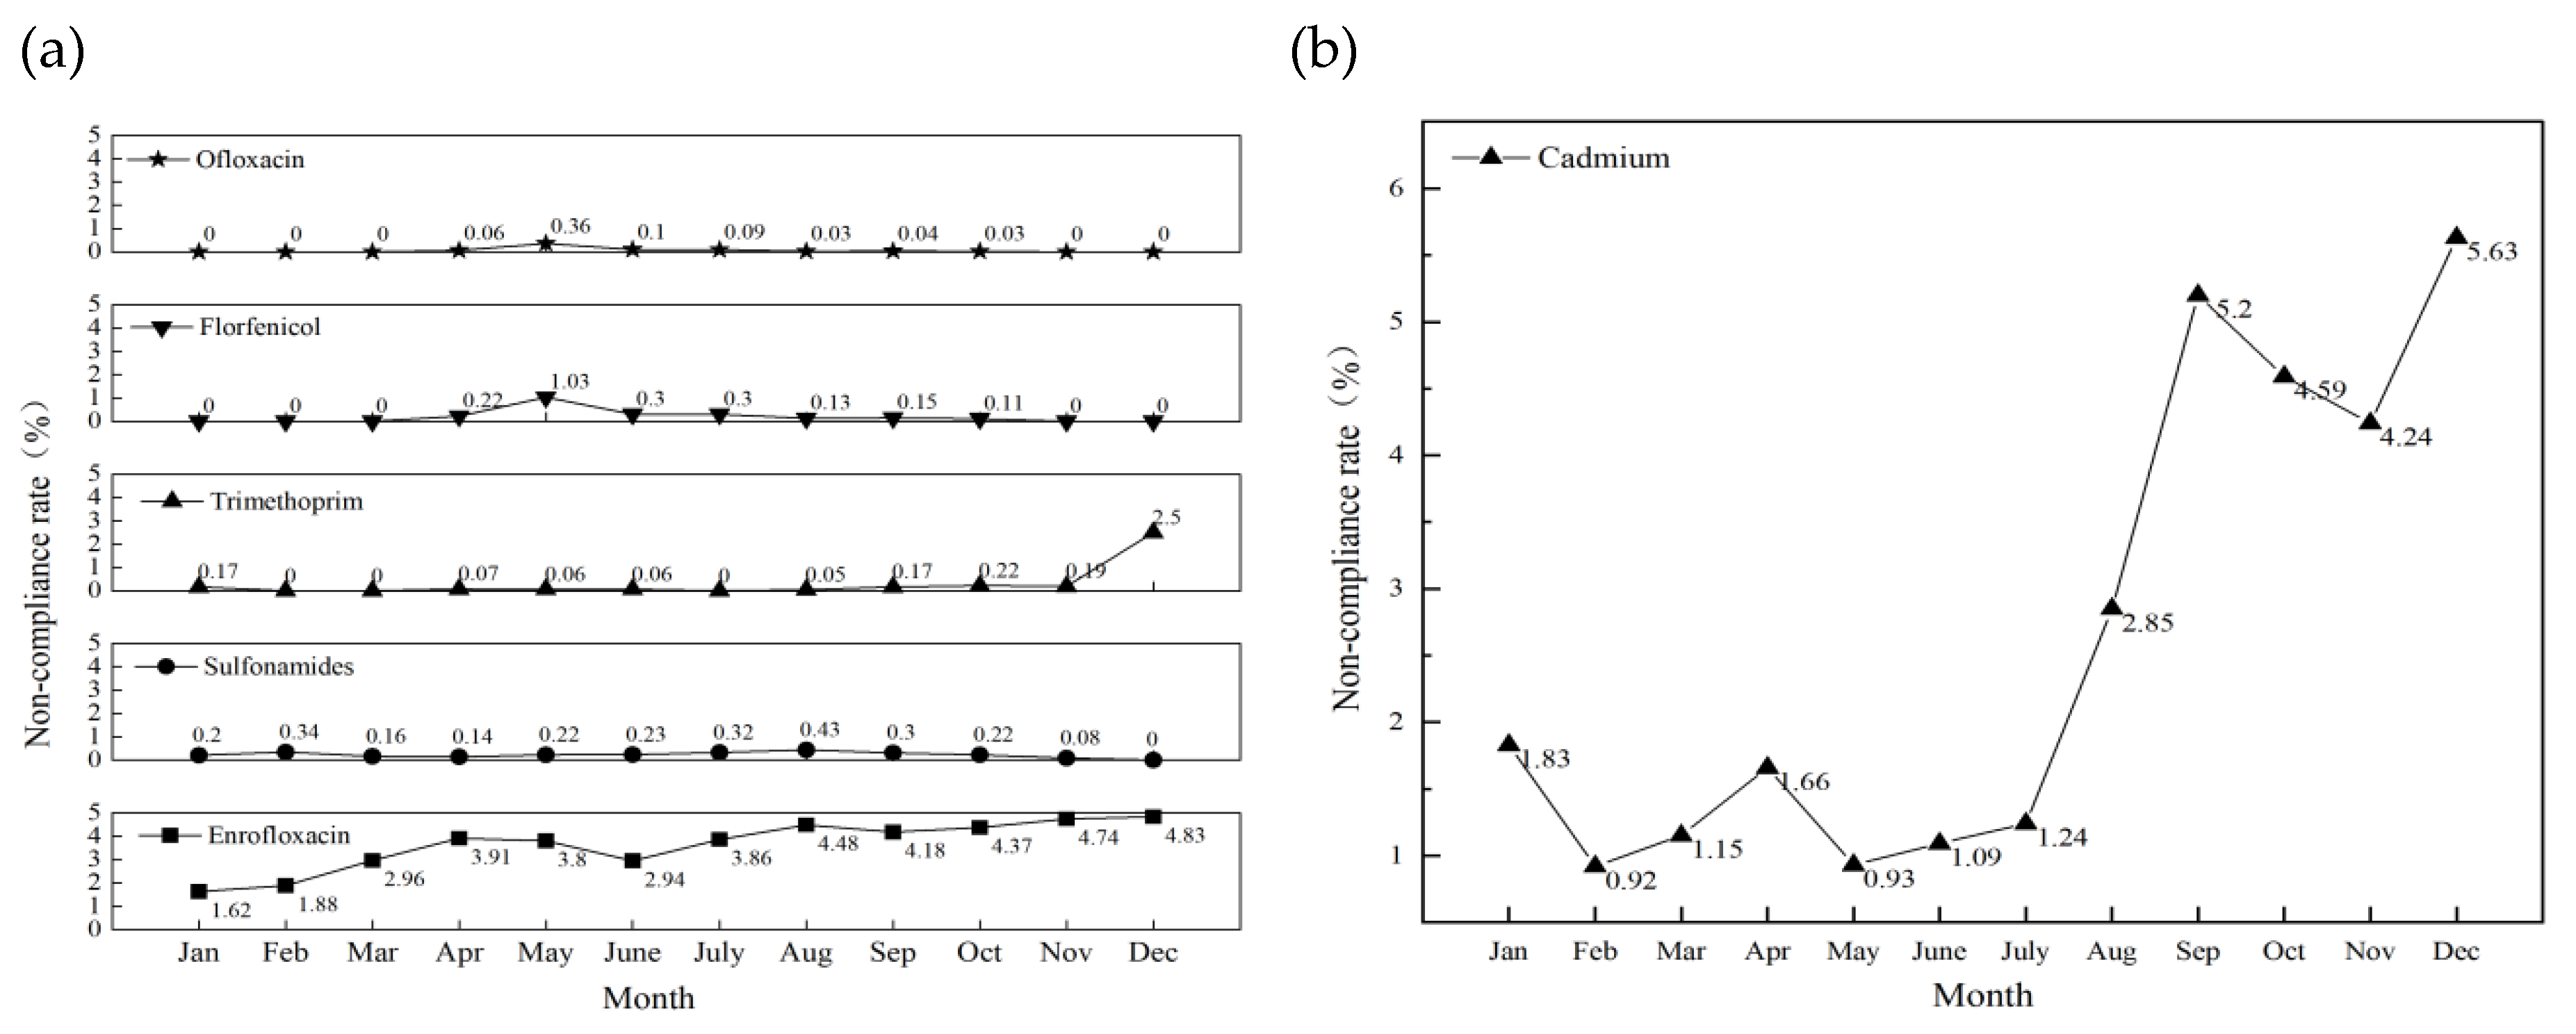
A temporal analysis was conducted on the non-compliance rate of veterinary drugs in aquatic products (Figure a). The main non-compliant substances comprised five categories: enrofloxacin, sulfonamides, trimethoprim, florfenicol, and ofloxacin. Among these, enrofloxacin was non-compliant throughout the entire year, with the highest non-compliance rate observed in December at 4.83%. Trimethoprim also exhibited its peak non-compliance rate of 2.50% in December. Florfenicol reached a non-compliance rate of 1.03% in May, a level that warrants particular attention. Other veterinary drugs demonstrated sporadic non-compliance, with relatively stable non-compliance rates.
3.2.2. Heavy Metals
A temporal analysis of non-compliant cases related to heavy metals in aquatic products (Figure b) indicated that cadmium was the only heavy metal that was non-compliant. The non-compliance rate fluctuated significantly throughout the year, showing an upward trend. It peaked at 5.63% in December and was lowest at 0.92% in February. Continuous attention to cadmium is required.
3.2.3. Prohibited Drugs
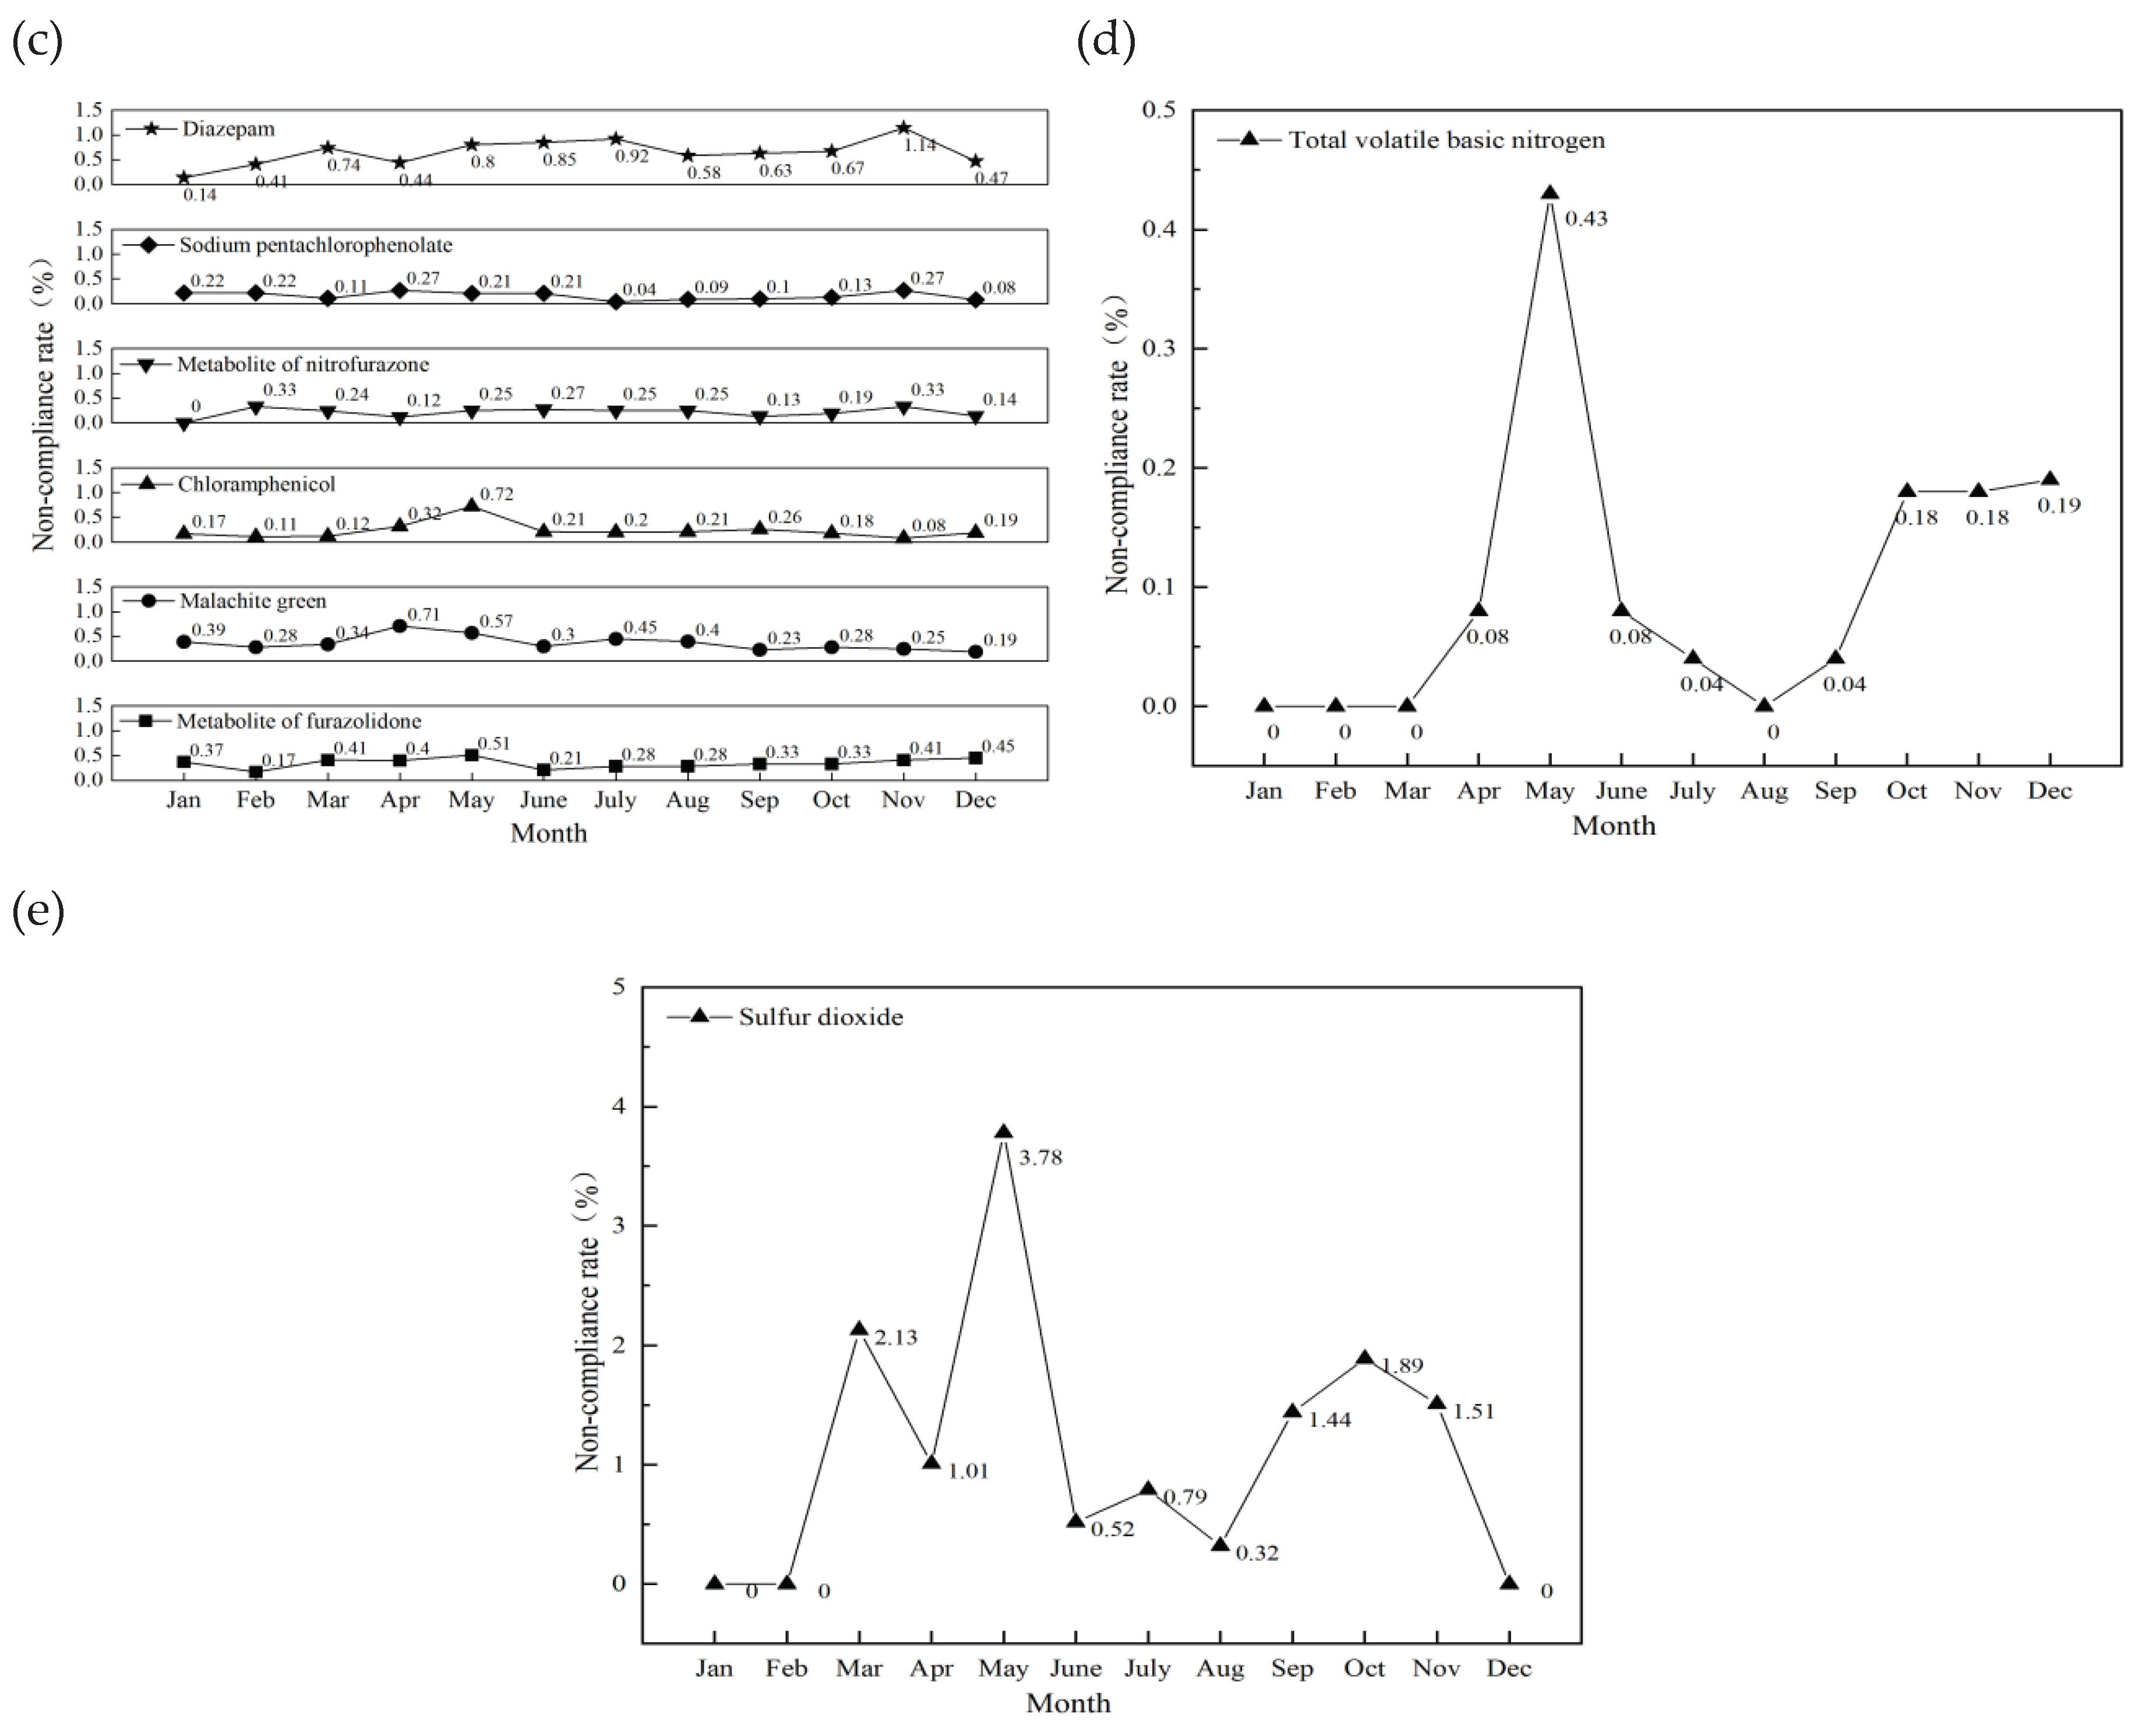
A temporal analysis was conducted on the non-compliance rate of prohibited drugs in aquatic products (Figure c). The main non-compliant substances were furazolidone metabolites, malachite green, chloramphenicol, nitrofurazone metabolites, sodium pentachlorophenolate, and diazepam. Among them, diazepam had the highest non-compliance rate in November at 1.14%; chloramphenicol peaked in May at 0.72%; malachite green reached its highest level of 0.71% in April. Other prohibited drugs showed sporadic non-compliance with relatively stable rates. Overall, the non-compliance of prohibited drugs was minimally influenced by seasonal variations.
3.2.4. Quality Indicators
A temporal analysis was conducted on the non-compliance of quality indicators in aquatic products (Figure d), and the only non-compliant item among the quality indicators was total volatile basic nitrogen. Overall, the risk of non-compliance for total volatile basic nitrogen was relatively low. In May, the highest non-compliance rate was 0.43%, which may be attributed to temperature elevation causing excessively high values in quality indicators, requiring targeted monitoring.
3.2.5. Additives
A temporal analysis of non-compliance related to additives in aquatic products (Figure e) showed that the only non-compliant additive was sulfur dioxide. The non-compliance rate fluctuated significantly, reaching a peak of 3.78% in May. The non-compliance rate remained relatively high from September to November, at 1.44%, 1.89%, and 1.51%, respectively.
Figure 6.
Trend of non-compliance rate of veterinary drugs (a), heavy metals (b), prohibited drugs (c), quality indicators (d), additives (e) in aquatic products.
Figure 6.
Trend of non-compliance rate of veterinary drugs (a), heavy metals (b), prohibited drugs (c), quality indicators (d), additives (e) in aquatic products.
3.3. Spatial Distribution of Risk Substances in Aquatic Products
An analysis was conducted on the non-compliant sample data of aquatic products across provinces during 2021−2023. A classification map of the non-compliance rate was generated using the equal interval method in ArcGIS (Figure 7), illustrating the overall national non-compliance rate of aquatic products (a), and non-compliance rate of heavy metals (b), quality indicators (c), additives (d), veterinary drugs (e), and prohibited drugs (f). In the analysis of the overall non-compliance rate across cities, a general pattern was observed, with higher rates in the east and lower rates in the west, and coastal areas showing higher rates than inland areas. High-risk areas were concentrated in coastal cities of East and South China (such as the Yangtze River Delta and Pearl River Delta), while provinces in the central and western regions (such as Qinghai and Tibet) were classified as low-risk areas. The non-compliance rates in Zhejiang, Chongqing, and Jiangxi were higher than those in other provinces, at 1.66%, 1.52%, and 1.48%, respectively, with Zhejiang being the province with the highest number of non-compliant aquatic products nationwide. An analysis of non-compliance rate of heavy metals across cities indicated that high-risk areas were concentrated in northern cities, medium risk in coastal cities, and low risk in the northwest region. Regarding the non-compliance rate of quality indicators across cities, there was a scattered distribution without significant large-scale clustering. High-risk areas were sporadically distributed in the northeastern industrial zone, the North China Plain, and the Sichuan Basin, while most regions across the country exhibited low risk. For the non-compliance rate of additives across cities, it revealed isolated high-value points without marked large-scale clustering and no evident spatial patterns. By analysis of the non-compliance rate of veterinary drugs across cities, it was found that non-compliance mainly occurred in aquaculture-intensive areas in South and East China (such as Guangdong, Fujian, and Jiangsu), while the risk was relatively low in northern pastoral areas and southwestern mountainous regions. An analysis of the non-compliance rate of prohibited drugs across cities displayed that high-risk areas were identified in provinces (autonomous regions and municipalities) such as Beijing, Sichuan, Guangxi, and Zhejiang, while most cities across the country exhibited relatively low risks.
3.3.1. Spatial Autocorrelation Analysis
According to Table 3 that classifies the risk substances in aquatic products, the hazards with the highest and higher risks were selected as the focus. Among them, there were no non-compliant samples for methylmercury and sarafloxacin; furaltadone metabolites was found to have non-compliance issues only in Jiangxi; nitrofurantoin metabolites showed non-compliance only in Inner Mongolia and Jiangxi. Therefore, we analyzed the spatial distribution patterns of the following risk substances: cadmium, enrofloxacin, total volatile basic nitrogen, sulfur dioxide, diazepam, malachite green, furazolidone metabolites, chloramphenicol, nitrofurazone metabolites, sodium pentachlorophenate, metronidazole, and ofloxacin.
3.3.1.1. Global Spatial Autocorrelation Analysis
A spatial autocorrelation analysis was performed on the non-compliance rate of 12 risk substances in aquatic products across provinces in China. The global Moran's I values for each risk substance in aquatic products were obtained (Table 5), among which the p-values for total volatile basic nitrogen, sulfur dioxide, diazepam, malachite green, nitrofurazone metabolites, sodium pentachlorophenate, metronidazole, and ofloxacin were all greater than 0.05, suggesting no global spatial autocorrelation in the non-compliance rate of these eight risk substances in aquatic products across provinces. However, local spatial correlation may exist. The p-values for cadmium, enrofloxacin, furazolidone metabolites, and chloramphenicol in aquatic products across provinces were less than 0.05, indicating that these four risk substances exhibited global spatial correlation in non-compliance rate across provinces, demonstrating a clustered distribution pattern.
3.3.1.2. Local Spatial Autocorrelation Analysis
When there is a global Moran's I index with statistical significance (p<0.05), further analysis of the local Moran's I index can be conducted to investigate whether there is regional spatial clustering in the study subjects. A local spatial autocorrelation analysis was performed on cadmium, enrofloxacin, furazolidone metabolites, and chloramphenicol in aquatic products across provinces in China. First of all, the p-values of the local Moran's I index were analyzed. If the p-value is less than 0.05, it indicates the presence of a regional spatial correlation; conversely, if the p-value is greater than 0.05, it indicates the absence of spatial correlation (Table 6). A high-high clustering signifies that both the province and its neighboring provinces were at a “high level”; a low−high clustering meant that the province was at a “low level”, but its neighboring provinces were at a “high level”; a low−low clustering indicated that both the province and its neighboring provinces were at a “low level”; a high−low clustering denoted that the province was at a “high level”, but its neighboring provinces were at a “low level”. For the Moran scatter plot, the X-axis (z-score of outliers) represented the distance between data values and the mean; therefore, data points located further to the right indicated higher non-compliance rate. The Y-axis (Spatial Lag) represented the spatial lag value, with higher values indicating that the neighbors (surrounding areas) of the study subject had higher non-compliance rate.
From Figure 8, the compliance rate for cadmiumnon exhibited significant low−low clustering in Chongqing, Sichuan, Guizhou, Yunnan, Tibet, Shaanxi, Gansu, Qinghai, and Xinjiang. In contrast, it showed significant high−high clustering in Beijing, Tianjin, Hebei, Inner Mongolia, Liaoning, Jilin, Heilongjiang, and Shandong. Obvious low−high clustering was observed in Shanxi. For enrofloxacinnon, the compliance rate displayed significant low−low clustering in Hebei, Shanxi, Inner Mongolia, and Liaoning, and significant high−high clustering in Shanghai, Jiangsu, Zhejiang, Anhui, Fujian, Jiangxi, Hubei, and Hunan. Additionally, marked low−high clustering was observed in Guizhou. Regarding the non-compliance rate of furazolidone metabolites, there was remarkable low−low clustering in Hebei, Inner Mongolia, and Jilin, and significant high-high clustering in Fujian, Shanghai, Guangdong, Hainan, and Zhejiang, while remarkable low−high clustering was observed in Jiangxi and Jiangsu. For chloramphenicolnon, significant low−high clustering was detected in Yunnan and Guizhou, significant high−low clustering in Sichuan, and significant high−high clustering in Guangdong and Hainan.
3.3.2. Sampling Location Analysis
The sampling locations for aquatic products included urban areas, township areas, tourist attractions (urban), tourist attractions (townships), vicinity of schools (townships), and vicinity of schools (urban). Non-compliant aquatic product samples were primarily found in urban areas (Figure 9), accounting for 81.34%, while township areas accounted for 16.04%.
3.3.3. Sampling Venue Analysis
Two sampling stages were included in the inspection of aquatic products: distribution and catering. The highest incidence of non-compliance occurred in the distribution stage, accounting for 85.71%, followed by the catering stage, which accounted for 14.29% (Figure 10). An analysis of sampling venue (Figure 11) showed that in the distribution stage, non-compliant cases mainly occurred in farmers' markets and supermarkets, accounting for 38.75% and 26.48%, respectively. Fewer non-compliant cases were found in wholesale markets, other locations, vegetable markets, online purchase, small grocery, and shopping malls, accounting for 10.39%, 11.16%, 5.55%, 5.41%, 1.99%, and 0.27% respectively. Therefore, special attention should be paid to the quality safety of aquatic products in farmers' markets and supermarkets. In the catering stage, nearly half of the non-compliant cases occurred in medium-sized restaurants, accounting for 45.69%. The remaining non-compliant cases occurred in small restaurants, large restaurants, other locations, extra-large restaurants, snack bars, and catering service provider, which accounted for 33.68%, 15.81%, 1.95%, 1.33%, 0.51%, and 1.03%, respectively. Special attention should be given to the quality safety of aquatic products in small restaurants and medium-sized restaurants.
3.4. Spatiotemporal Analysis of Risk Substances in Aquatic Products
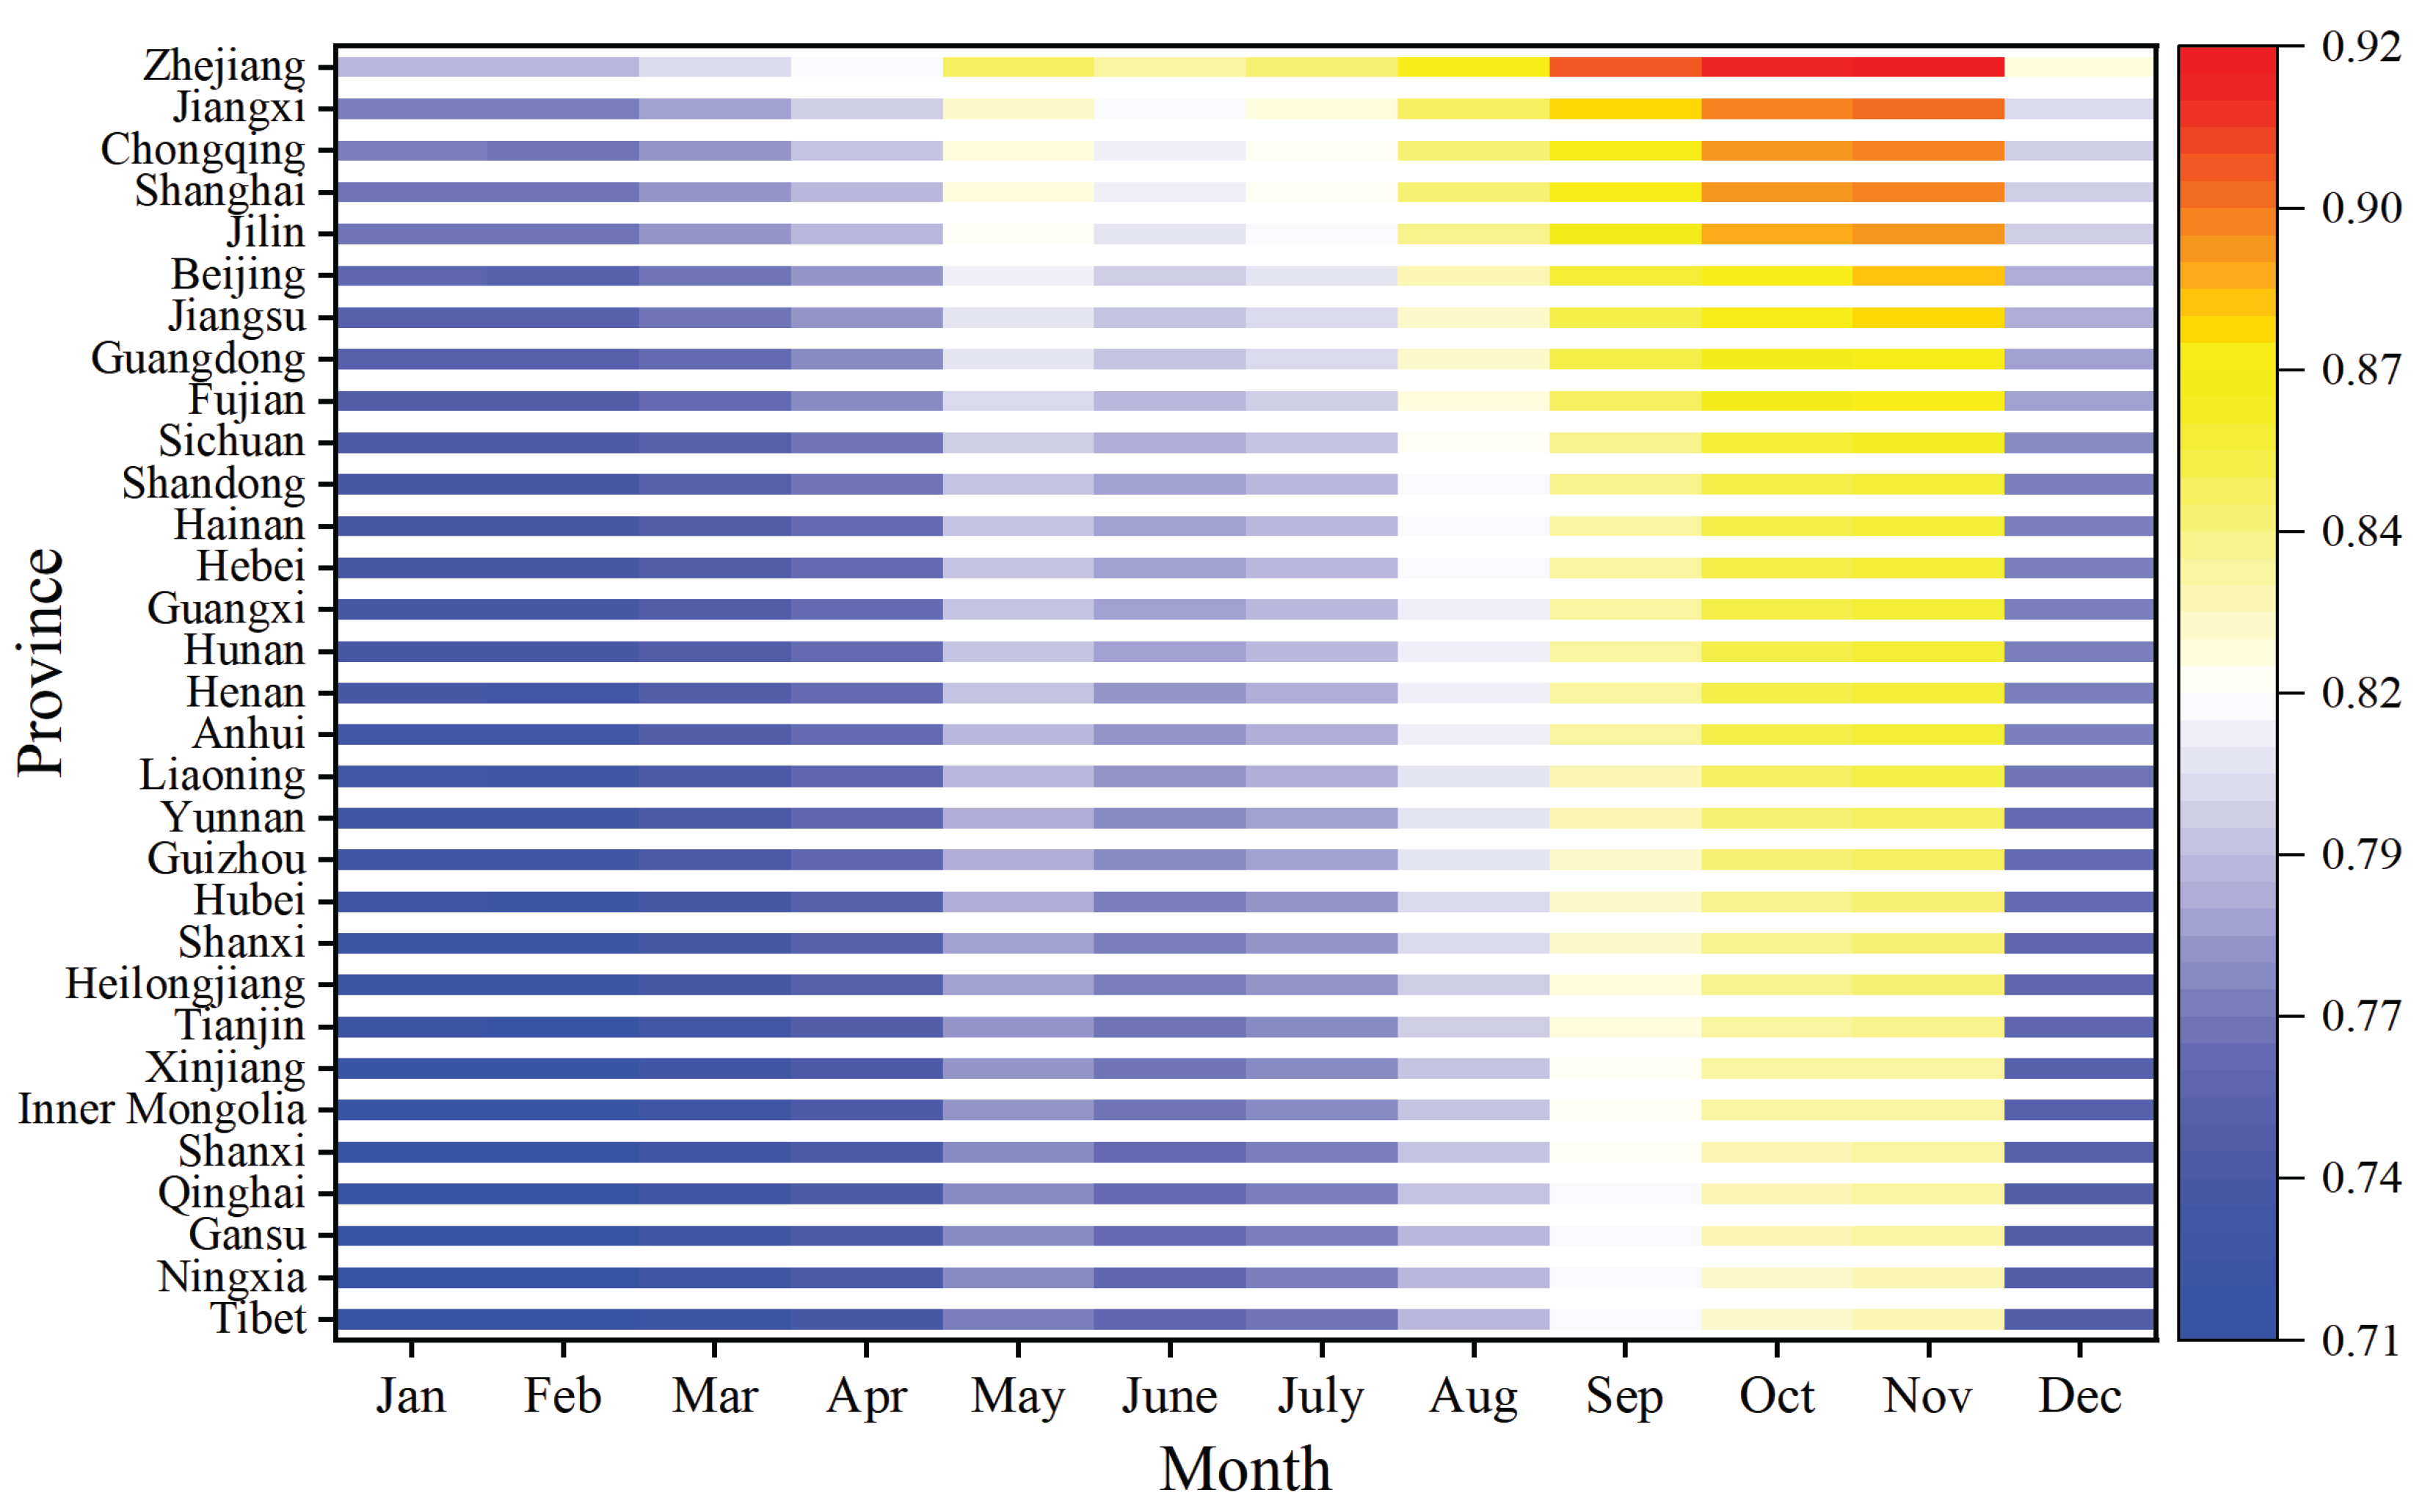
According to the evaluation results by the entropy weight TOPSIS method, the maximum relative proximity value of cadmium was 0.707, which served as the baseline risk for aquatic products. After incorporating the risk adjustment factor, the final spatiotemporal risk values of aquatic products were calculated, as shown in Table 7. Based on the monthly final spatiotemporal risk values for each province, a heatmap(Figure ) was generated to illustrate the risk variations of aquatic products across different provinces and time periods by changes in color intensity, with red indicating high risk and blue indicating low risk. The figure showed that the range of risk values was concentrated between 0.71 (low risk) and 0.92 (high risk), with a relatively narrow span, indicating that while there were regional differences in the risk of aquatic products nationwide, the overall risk was controllable. From August to November, the risks were higher across provinces (municipalities, autonomous regions), while from December to April, the overall risk was lower. Among them, Chongqing, Jiangxi, and Zhejiang exhibited higher risks throughout the year, whereas Tibet, Ningxia, and Gansu demonstrated lower annual risks.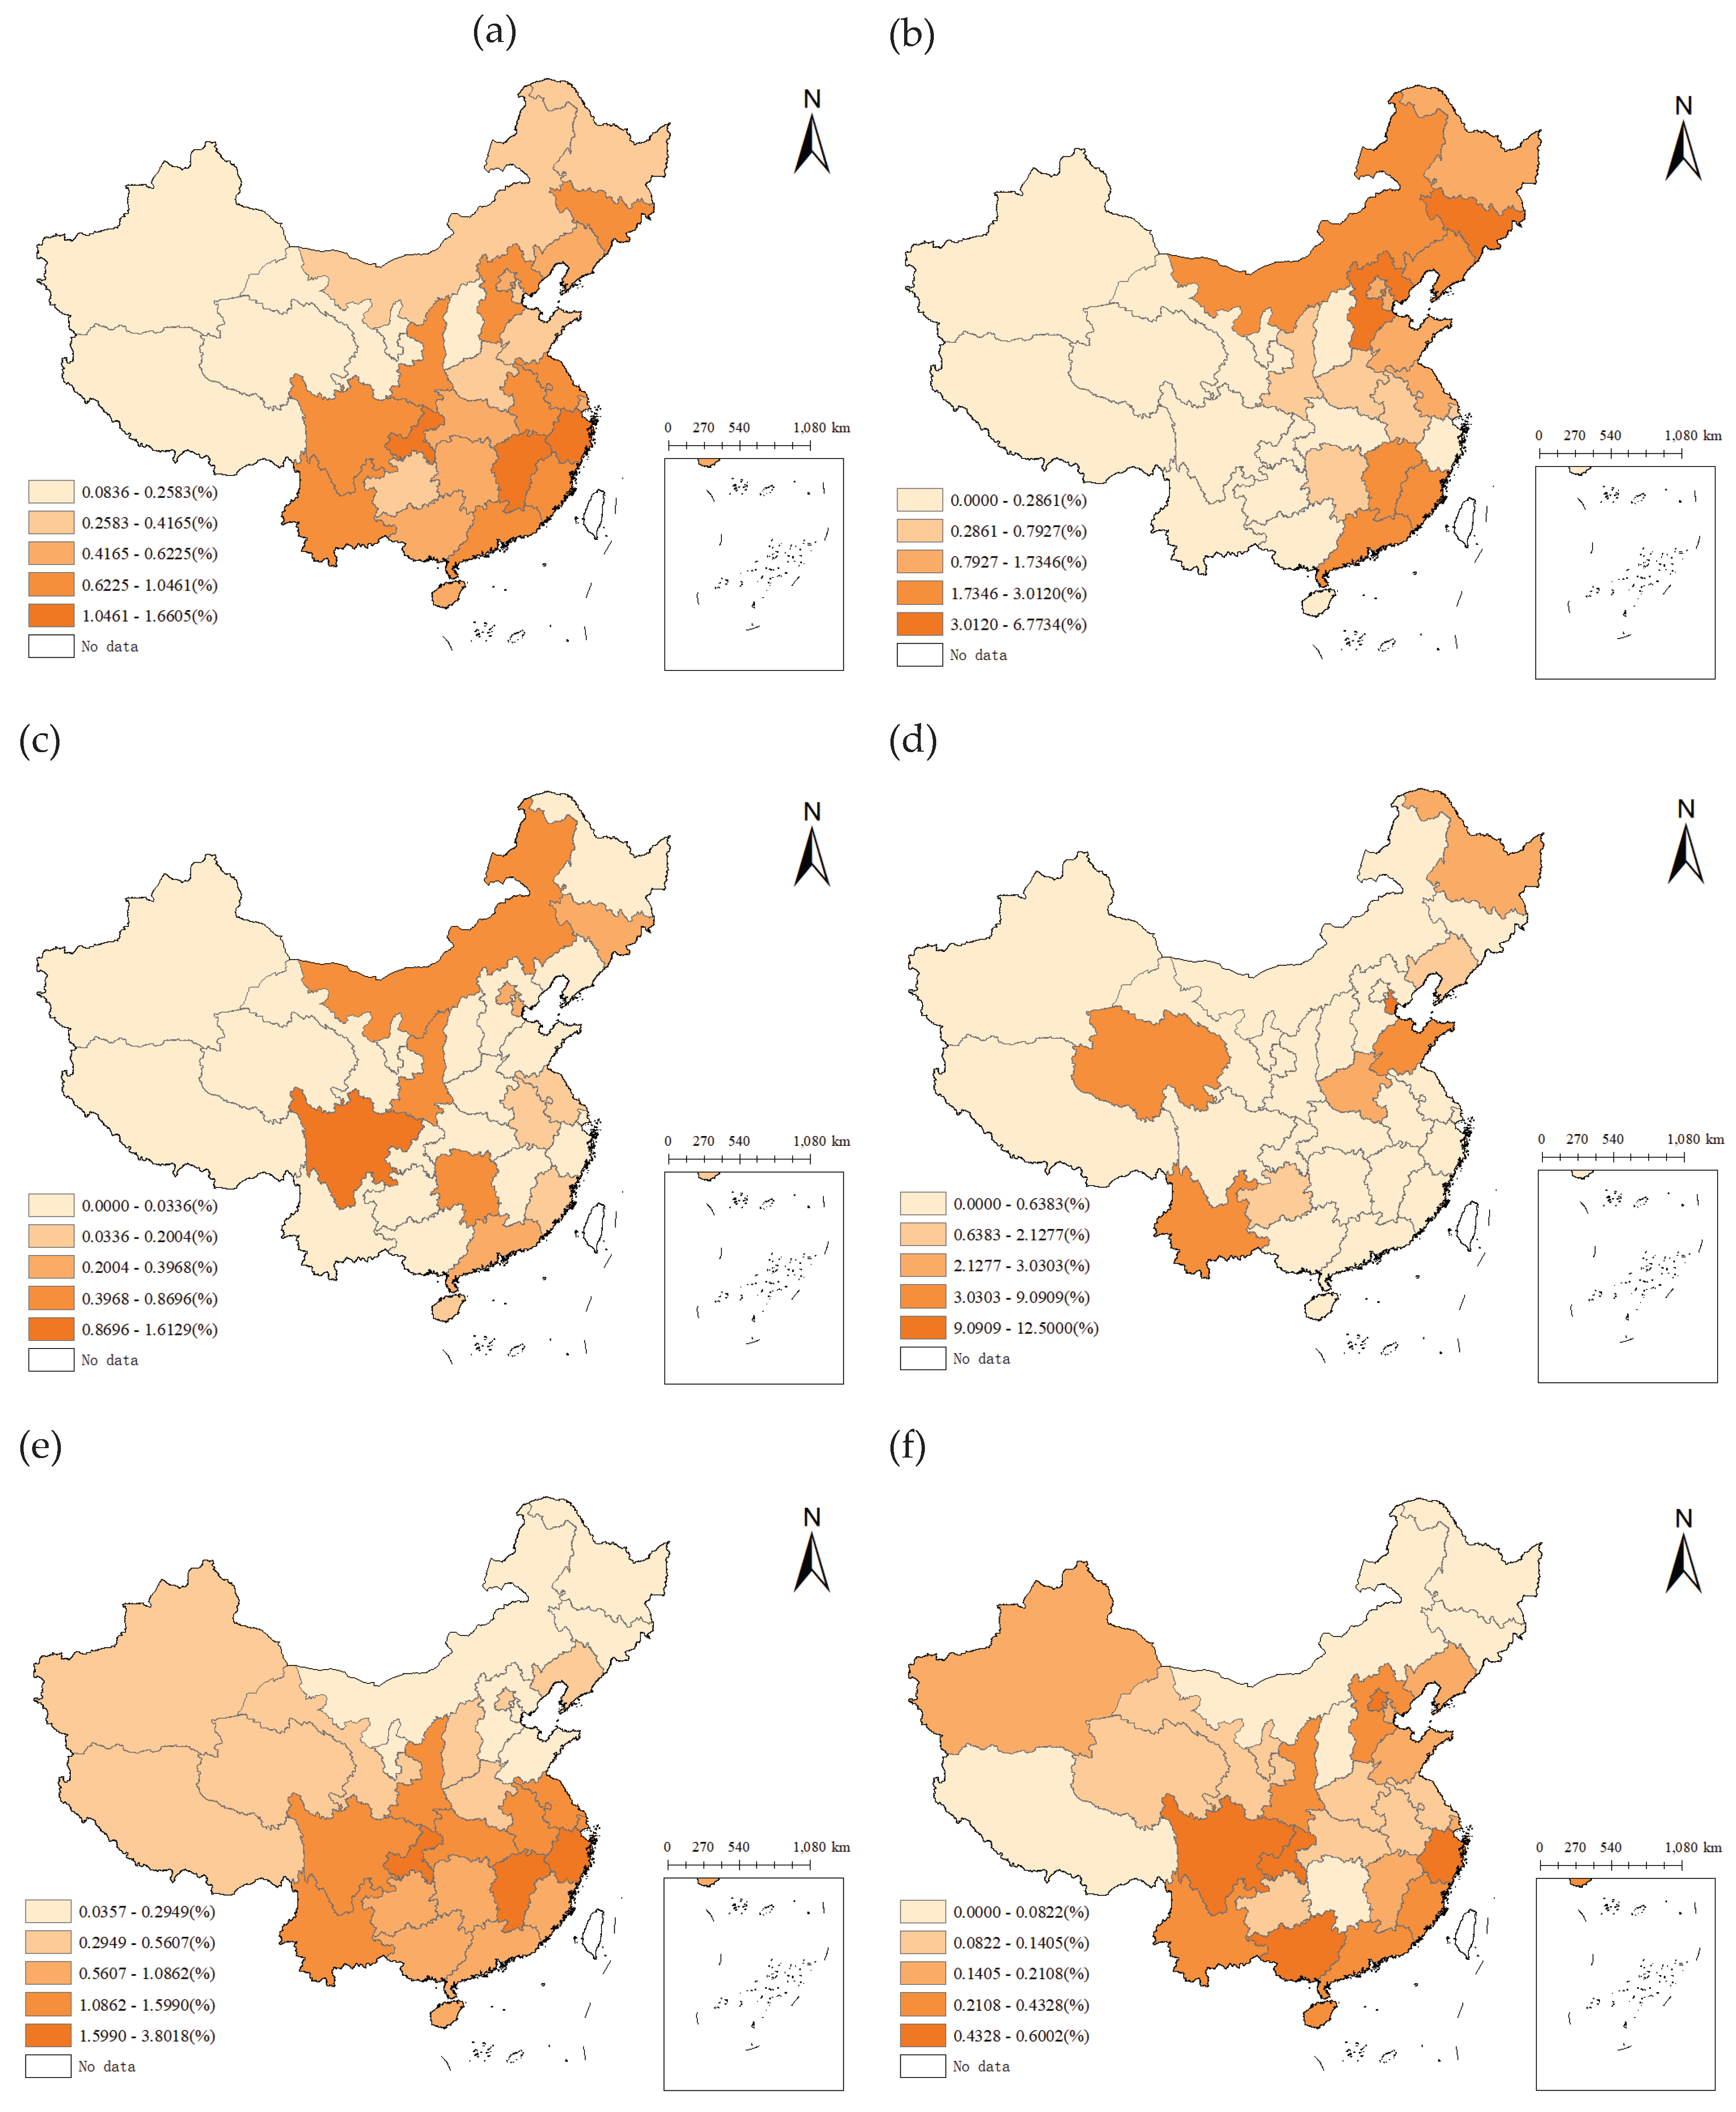
Figure 12.
Heatmap of changes in aquatic products risk in different provinces and months. Note: In the figure, values ranging from 0.71 to 0.92 indicate low−high risk.
Figure 12.
Heatmap of changes in aquatic products risk in different provinces and months. Note: In the figure, values ranging from 0.71 to 0.92 indicate low−high risk.
4. Discussion
4.1. Core Risk Substances and Their Health Risks
This study determined that high-risk substances in aquatic products include cadmium, enrofloxacin, and total volatile basic nitrogen by the entropy weight TOPSIS method. While substances posing higher risks include sulfur dioxide, diazepam, methylmercury, malachite green, nitrofuran compounds, chloramphenicol, sodium pentachlorophenate, metronidazole, sarafloxacin, and ofloxacin. A study analyzing the monitoring data of heavy metals in Chinese aquatic products has found that among different aquatic products-heavy metals combinations, the sea crab-cadmium combination posed the highest risk[31], which aligns with the findings of the present study that seawater crabs had the highest proportion of non-compliance rates, with cadmium posing the highest risk. Ding et al.[32] conducted testing on 300 batches of commercially available aquatic product samples for veterinary drug residues and heavy metals, and revealed that key risk parameters included cadmium, malachite green, enrofloxacin, nitrofurazone metabolite, and ofloxacin, which are consistent with the results of the present study. This confirms the reliability of the aquatic product classification model developed herein. Based on the risk classification, it is essential to enhance inspections for cadmium, enrofloxacin, total volatile basic nitrogen, sulfur dioxide, diazepam, and methylmercury in the distribution stage of aquatic products, and to increase inspections for cadmium, enrofloxacin, volatile basic nitrogen, methylmercury, and sodium pentachlorophenate in the catering stage.
Among heavy metals, cadmium warrants particular attention. Cadmium in the environment exhibits a bioamplification effect, which can accumulate through food sources and subsequently transfer to humans via the food chain. Fish, crustaceans, and bivalves are the most common aquatic products, and are also among the main sources of cadmium exposure[33,34]. These aquatic products can accumulate cadmium in their tissues through body surface permeation and ingestion, and absorb cadmium from water[35]. A study from Laizhou Bay, China, indicates that cadmium is the second most abundant metal and the most easily accumulated element in seafood, with crabs exhibiting a much higher cadmium enrichment capacity than other aquatic products[36]. Heavy metals can move upward along the food chain, posing potential health risks to humans[1]. Since food is an important carrier for the transfer of heavy metals from the environment to the human body, it is crucial to control the content of heavy metals in aquatic products and thus reduce harm to human health. Long-term consumption of high-risk species should be avoided, and it is advisable to choose freshwater fish or small-sized shellfish with low bioaccumulation capacity for heavy metals. Soil and water quality investigations for heavy metal pollution should be conducted in aquaculture areas to trace and remediate agricultural land contamination. Strict limitations should be imposed on the discharge of industrial wastewater and agricultural non-point source pollution to reduce heavy metals in water bodies, thereby lowering the bioaccumulation risk of aquatic products from the source[37].
Among veterinary drugs, enrofloxacin should be a primary focus, while particular attention should be given to high-risk compounds such as diazepam, furazolidone metabolites, malachite green, chloramphenicol, and sodium pentachlorophenate among prohibited substances. Enrofloxacin, due to its broad-spectrum antibacterial properties, excellent pharmacokinetic characteristics, low risk of cross drug resistance, and low cost, is widely used in the prevention and control of diseases in livestock, poultry farming, and aquaculture. It is one of the most frequently detected veterinary drugs in aquatic products[38,39]. The Ministry of Agriculture and Rural Affairs of China has set the maximum residue limit of enrofloxacin in fish meat at 100 μg/kg[40]. Diazepam[41], chloramphenicol[42], malachite green[20], sodium pentachlorophenate[43], and nitrofuran compounds[44] are drugs that have been banned from detection in aquatic products, but illegal use still exists, resulting in the residue or even excessive levels of harmful substances in aquatic products, posing health risks. To reduce the occurrence of veterinary drug residues and non-compliance situations for prohibited drugs in aquatic products, enterprises need to optimize farming management by maintaining water quality, ensuring reasonable feeding practices, and implementing disease prevention strategies, thus reducing drug use, and strictly adhering to withdrawal periods[45].Governments can establish cross-provincial and even cross-border traceability mechanisms to enhance information sharing between production and consumption areas, thereby preventing regulatory gaps. Promoting the aquatic products traceability platforms that record the entire process of medication use in aquaculture, transportation, and sales, will facilitate the rapid recall of problematic products.
Total volatile basic nitrogen should be a key focus in quality indicators. It is the primary indicator reflecting the freshness of aquatic products[46], enabling timely determination of whether aquatic products have been contaminated during transportation, food service, and other stages. It is commonly used as an important monitoring indicator for the freshness and safety of aquatic products, and changes in its concentration can objectively reflect the spoilage and deterioration process of aquatic products[47,48]. To ensure the freshness and quality safety of aquatic products, quality control should be implemented across the entire industry chain. At the raw material stage, a stable and reliable supplier selection mechanism should be established, along with rapid detection of total volatile basic nitrogen during fishing and aquaculture stages to ensure the content does not exceed the standard. At the processing stage, optimizing processing techniques (such as pre-cooling treatment[49,50] and mild processing methods[51]) should be implemented to shorten processing time. Technologies such as modified atmosphere packaging[52] and biological preservation [53] can be adopted to delay spoilage. The logistics end can enhance the cold chain delivery system and equip it with temperature and humidity monitoring devices to ensure temperature control throughout the entire process from catch to retail.
Sulfur dioxide warrants particular attention among food additives. It effectively inhibits microbial growth and delays food spoilage. Some enterprises, to improve the color of aquatic products and extend the shelf life, use excessive amount of additives for bleaching or preservation, which may lead to residues that pose potential health risks. Long-term excessive intake can cause damage to the digestive system and liver function[54]. Therefore, it is necessary to strictly control the amount and residue standards of such additives in aquatic products. Through the synergistic effect of technological alternatives, regulatory reinforcement, and consumer education, the risks of sulfur dioxide and other additives can be systematically reduced, thus ensuring the safety of aquatic products and the sustainable development of the industry.
4.2. Risk Variations Across Different Stages and Their Spatiotemporal Distribution Patterns
Risks associated with aquatic products differ between the distribution stage and catering stage, with distribution posing higher risks than catering. In the distribution stage, risks are primarily concentrated in farmers' markets and supermarkets, where common issues include “failure of cold chain management” and “contamination from multiple-party handling”. Aquatic products requires low temperatures throughout the entire process. However, in farmers’ market, temperature fluctuations often occur in the seafood section due to untimely replenishment of ice packs and frequent opening and closing of refrigerated display cases. Moreover, supermarkets face the risk of damaged packaging during multi-tiered transportation from “production site→distribution center→storefront”. Both scenarios accelerate microbial proliferation and protein degradation, leading to exceedance indicators such as volatile basic nitrogen and total bacterial count. Risks in the catering stage are primarily concentrated in medium-sized and small restaurants. The core reason for the overall low risk in this stage is the immediate sensory feedback from consumers. The freshness of aquatic products can be quickly assessed through appearance, smell, and texture. Consumers reject any abnormal products they detect, which pressures food service businesses to promptly remove non-compliant items. However, risks in the catering stage remain significant and should not be overlooked. Regulatory authorities should focus on key sampling locations such as farmers' markets, supermarkets, and small-to-medium-sized restaurants to reduce the risks associated with aquatic products.
In terms of time, aquatic product risks exhibit significant seasonal variations, with the risk values from August to November being significantly higher than those from December to April. The high temperatures and humidity in summer provide optimal conditions for the proliferation of microorganisms, accelerating protein degradation. Conversely, the low temperatures in winter inhibit microbial activity and slow down the migration of contaminants, thereby reducing risk. Regulatory authorities should optimize sampling strategies for the summer and autumn, enhance the coverage of cold chain transportation during summer, and promote technologies such as chilled packaging to extend the shelf life of aquatic products. In spatial distribution, the risks exhibit a pattern of being higher in eastern regions than western regions and higher in coastal areas than inland areas. Zhejiang, Chongqing, and Jiangxi are classified as high-risk provinces. These areas are either major aquaculture production zones (characterized by high farming density and frequent disease outbreaks) or distribution hubs (involving multiple distribution stages and significant cold chain pressure). Strengthened sampling and inspection efforts should be implemented in high-risk provinces. The distribution of non-compliant heavy metals indicates that northern regions and coastal provinces should be given particular attention. The distribution of non-compliant quality indicators and additives shows scattered occurrences without discernible spatial patterns. Regarding non-compliant veterinary drugs and prohibited substances, coastal and southwestern regions require heightened focus and strengthened supervision and sampling to reduce risks. The global spatial autocorrelation analysis reveals that only cadmium, enrofloxacin, furazolidone metabolites, and chloramphenicol have clustered distribution patterns, while other risk substances show random distribution. The local spatial autocorrelation analysis suggests that inspection efforts for cadmium should be strengthened in Beijing, Tianjin, Hebei, Inner Mongolia, Liaoning, Jilin, Heilongjiang, Shandong, and their surrounding provinces. It is also recommended to strengthen the sampling intensity of enrofloxacin in Shanghai, Jiangsu, Zhejiang, Anhui, Fujian, Jiangxi, Hubei, and Hunan, as well as their neighboring provinces. Sampling intensity for furazolidone metabolites should be diminished in Hebei, Inner Mongolia, Jilin, and their neighboring provinces. While we should increase the sampling intensity for chloramphenicol in Guangdong, Hainan, and their neighboring provinces. These characteristics provide precise targets for “regional, pollutant-specific regulation”.
5. Conclusions
Various hazards are present throughout the entire supply chain of aquatic products, spanning aquaculture, capture, transportation, processing, and food service. However, the risk levels associated with different risk substances vary significantly across stages and spatiotemporal dimensions. This study has clarified the rankings of risk substances in Chinese aquatic products along with their spatiotemporal evolution patterns. While regional variations exist in the risks, the overall situation remains manageable. The top three risk substances in aquatic products are cadmium, enrofloxacin, and total volatile basic nitrogen. Among the high-risk and higher-risk substances in aquatic products across Chinese provinces, cadmium, enrofloxacin, furazolidone metabolites, and chloramphenicol have significant global spatial autocorrelation in non-compliance. Non-compliant aquatic products primarily occur in urban areas in China, with the distribution stage identified as the main process and the primary venues being farmers' markets and supermarkets. Among the sampled provinces, Zhejiang exhibits the highest non-compliance rate. Spatiotemporal analysis found that aquatic products pose higher risks during summer and autumn, while risks are lower in winter and spring. Based on the risk classification and spatiotemporal analysis, future monitoring strategies should be optimized to implement targeted and differentiated inspection of aquatic products, and thus enhance the efficiency of regulatory oversight and mitigate quality and safety risks associated with aquatic products. Additionally, monitoring frequency should be intensified in key high-risk provinces such as Zhejiang, particularly during summer and autumn and prioritizing critical venues including supermarkets and farmers' markets. For major risk substances such as cadmium and enrofloxacin, a comprehensive traceability system covering the entire supply chain—from aquaculture sources to point of sale—should be established. Strengthening cross-departmental collaborative oversight will facilitate the efficiency of the risk warning and response mechanisms. To strengthen comprehensive control across the entire global supply chain, customs authorities should implement differentiated sampling inspections for high-risk product categories and origins, leveraging digital technologies to enhance the precision of port inspections. Furthermore, there is a need to promote the establishment of unified cross-border traceability standards to ensure information traceability throughout the product circulation process from exporting to importing countries. We should, by deepening international regulatory collaboration, construct a transnational risk information-sharing mechanism to promptly exchange global updates on detected risk substances in aquatic products and disease outbreak information. By jointly conducting source risk assessments, it will reduce safety risks associated with aquatic product .
This study conducted risk classification based on the supervision data of aquatic products in China from 2021 to 2023. However, there lacks data from production stage in the findings, which prevents the assessment of risk classification for substances in that stage. Furthermore, the study failed to differentiate risk variations among the subcategories of aquatic products and examine the synergistic effects between different contaminants. Future studies should integrate data across the entire aquatic product supply chain, from aquaculture to consumption.Extending the data collection period, incorporating risk analysis for various aquatic product types, and exploring synergistic mechanisms among different risk substances will better guide the prevention and control of seafood risks.
Author Contributions
Guangcan Tao and Guoyan Li: Funding acquisition, Writing, including original draft preparation, software, form analysis, and investigation. Dingfang Pu and Luolin Bao: Data curation, Methodology. Su Xu: Methodology, Writing - review & editing. Kang Hu: Data curation, Supervision, Writing - review & editing. Hongbo Yang: Conceptualization, Project administration, Resources, Supervision, Validation, Writing - review & editing.
Funding
This work was supported by the National Natural Science Foundation of China (No. 32160071), the Guizhou Provincial Science and Technology Project (QKHPTRC-CXTD [2022] 002), the Education Department of Guizhou Province - Natural Science Research Project (QJJ [2023] 042), the Education Department of Guizhou Province - Youth Science and Technology Talent Development Project (QJJ [2024] 193), the Guizhou Academy of Agricultural Sciences Talent Special Project [grant number (2022-02 and 2023-02)].
Data Availability Statement
Data will be made available on request.
Acknowledgments
In Thanks to all authors for their contributions to this study.
Conflicts of Interest
Declare The authors declare that they have no known competing financial interests or personal relationships that could have appeared to influence the work reported in this paper.
References
- Hu, S.L.; Chen, X.C.; Xue, Y.X.; Zhi, L.Y.; Yang, Y.H.; Zhu, Y.G.; Xue, X.M. Metal (loid) s in aquatic products and their potential health risk. Exposure and Health. 2024, 16, 57–70. [Google Scholar] [CrossRef]
- Zhou, J.X.; Feng, Q.H.; Fu, H.X.; Ren, K.; Shang, W.T.; Li, C.; Zhang, X.S.; Nga, M.T.T.; He, Y.F. Current trends and perspectives on aquatic-derived protein: A focus on structure-technofunctional properties relationship and application for food preservation. Trends in Food Science & Technology. 2024, 104651. [Google Scholar]
- Zhang, L.T.; Li, Q.; Bao, Y.L.; Tan, Y.Q.; Lametsch, R.; Hong, H.; Luo, Y.K. Recent advances on characterization of protein oxidation in aquatic products: A comprehensive review. Critical Reviews in Food Science and Nutrition. 2024, 64, 1572–1591. [Google Scholar] [CrossRef] [PubMed]
- Bi, J.R. Aquatic Food Products: Processing Technology and Quality Control. Foods. 2024, 13, 7. [Google Scholar] [CrossRef] [PubMed]
- Zeng, J.P.; Song, Y.; Cong, P.X.; Cao, Y.R.; Xu, J.; Xue, C.H. A systematic review of drying in aquatic products. Reviews in Aquaculture. 2024, 16, 47–65. [Google Scholar] [CrossRef]
- Smolińska, K.; Szopa, A.; Sobczyński, J.; Serefko, A.; Dobrowolski, P. Nutritional Quality Implications: Exploring the Impact of a Fatty Acid-Rich Diet on Central Nervous System Development. Nutrients. 2024, 16, 1093. [Google Scholar] [CrossRef]
- Kokubun, K.; Nemoto, K.; Yamakawa, Y. Fish intake may affect brain structure and improve cognitive ability in healthy people. Frontiers in aging neuroscience. 2020, 12, 76. [Google Scholar] [CrossRef] [PubMed]
- Du, J.; Xiao, M.; Sudo, N.; Liu, Q.H. Bioactive peptides of marine organisms: Roles in the reduction and control of cardiovascular diseases. Food Science & Nutrition. 2024, 12, 5271–5284. [Google Scholar]
- Budhathoki, M.; Campbell, D.; Belton, B.; Newton, R.; Li, S.; Zhang, W.; Little, D. Factors influencing consumption behaviour towards aquatic food among Asian consumers: a systematic scoping review. Foods. 2022, 11, 4043. [Google Scholar] [CrossRef]
- Affairs, F.a.F.A.B.o.t.M.o.A.a.R. 2023 national fishery economic statistics bulletin. Fishery Science and Technology Information. 2024, 51, 269. [Google Scholar]
- Xia, S.J.; Niu, B.; Chen, J.H.; Deng, X.J.; Chen, Q. Risk analysis of veterinary drug residues in aquatic products in the Yangtze river delta of China. Journal of food protection. 2021, 84, 1228–1238. [Google Scholar] [CrossRef]
- Sheng, L.; Wang, L. The microbial safety of fish and fish products: Recent advances in understanding its significance, contamination sources, and control strategies. Comprehensive Reviews in Food Science and Food Safety. 2021, 20, 738–786. [Google Scholar] [CrossRef]
- Saravanan, P.; Saravanan, V.; Rajeshkannan, R.; Arnica, G.; Rajasimman, M.; Gurunathan, B.; Pugazhendhi, A. Comprehensive review on toxic heavy metals in the aquatic system: sources, identification, treatment strategies, and health risk assessment. Environmental Research. 2024, 119440. [Google Scholar] [CrossRef]
- Wang, X.L.; Wu, J.P.; Yu, B.J.; Dong, K.F.; Ma, D.; Xiao, G.X.; Zhang, C.Z. Heavy metals in aquatic products and the health risk assessment to population in China. Environmental Science and Pollution Research. 2020, 27, 22708–22719. [Google Scholar] [CrossRef] [PubMed]
- Sall, M.L.; Diaw, A.K.D.; Gningue-Sall, D.; Efremova Aaron, S.; Aaron, J.-J. Toxic heavy metals: impact on the environment and human health, and treatment with conducting organic polymers, a review. Environmental Science and Pollution Research. 2020, 27, 29927–29942. [Google Scholar] [CrossRef] [PubMed]
- Jiang, T.Q.; Liu, T.Q.; Dong, W.; Liu, Y.J.; Hao, C.; Zhang, Q.C. Prediction of safety risk levels of veterinary drug residues in freshwater products in China based on transformer. Foods. 2022, 11, 1690. [Google Scholar] [CrossRef] [PubMed]
- Liu, X.; Steele, J.C.; Meng, X.Z. Usage, residue, and human health risk of antibiotics in Chinese aquaculture: A review. Environmental Pollution. 2017, 223, 161–169. [Google Scholar] [CrossRef]
- Zhu, L.; Meng, S.L.; Fang, L.X.; Li, Z.H.; Yang, R.N.; Qiu, L.P.; Zhong, L.Q.; Song, C. Intra-species differences shape differences of enrofloxacin residues and its degradation products in tilapia: A precise risk assessment. Journal of Hazardous Materials. 2024, 476, 135151. [Google Scholar] [CrossRef]
- Kang, H.S.; Lee, S.B.; Shin, D.; Jeong, J.; Hong, J.H.; Rhee, G.S. Occurrence of veterinary drug residues in farmed fishery products in South Korea. Food Control. 2018, 85, 57–65. [Google Scholar] [CrossRef]
- He, J.; Mo, P.; Luo, Y.S.; Yang, P.H. Strategies for solving the issue of malachite green residues in aquatic products: a review. Aquaculture Research. 2023, 2023, 8578570. [Google Scholar] [CrossRef]
- Okocha, R.C.; Olatoye, I.O.; Adedeji, O.B. Food safety impacts of antimicrobial use and their residues in aquaculture. Public health reviews. 2018, 39, 1–22. [Google Scholar] [CrossRef] [PubMed]
- Okeke, E.S.; Chukwudozie, K.I.; Nyaruaba, R.; Ita, R.E.; Oladipo, A.; Ejeromedoghene, O.; Atakpa, E.O.; Agu, C.V.; Okoye, C.O. Antibiotic resistance in aquaculture and aquatic organisms: a review of current nanotechnology applications for sustainable management. Environmental Science and Pollution Research. 2022, 29, 69241–69274. [Google Scholar] [CrossRef] [PubMed]
- Chen, X.X.; Yu, W.X.; Xue, F.; Wu, Y. Characteristics of heavy metal distribution and health risk evaluation of marine products in the sea ares of Wenzhou,China. Acta Agriculturae Zhejiangensis 2025, 37, 1–11. [Google Scholar]
- Ku, H.H.; Lin, P.P.; Ling, M.P. Assessment of potential human health risks in aquatic products based on the heavy metal hazard decision tree. BMC bioinformatics. 2021, 22, 620. [Google Scholar] [CrossRef]
- Liu, Q.Q.; Ou, Y.J.; Florence, M.; Li, Y.; Wang, Y.Y.; Zhang, Y.H.; Liu, L.; Lei, J.B.; Huang, L.L.; Wu, S.X. Exploration of the Development of a Food Safety Risk Index System for Chemical Contamination of Aquatic Products. Food Control. 2025, 111189. [Google Scholar] [CrossRef]
- Liao, S.M.; zhang, Q.H.; Tao, G.C.; Hu, K. Research on the evolutionary patterns of quality and safety ofmeat product in china based on risk ranking technology. Science and Technology of Food Industry. 2024, 45, 232–240. [Google Scholar]
- Ding, L.L.; Zhang, Y.K.; Li, Y. A novel multi-dimensional evaluation framework and spatiotemporal analysis of shipping cities based on entropy-weighted TOPSIS method. Journal of the Knowledge Economy. 2025, 16, 5516–5547. [Google Scholar] [CrossRef]
- Lu, Y.; Ahmad, M.; Zhang, H.T.; Guo, J.X. Effects of science and technology finance on green total factor productivity in China: Insights from an empirical spatial Durbin model. Journal of the Knowledge Economy. 2024, 15, 7280–7306. [Google Scholar] [CrossRef]
- Liao, S.M.; Hu, K.; Xu, S.; Tao, G.C.; Zhang, Q.H. Establishment of dairy product risk rank model based on the perspective of time, space, and potential contaminants. Quality Assurance and Safety of Crops & Foods. 2023, 15, 143–155. [Google Scholar]
- Song, Y.Z. Research on dynamic risk analysis system of imported food based on entropy method. Tianjin University of Science and Technology, China, 2019.
- Ma, N.; Wang, H.; Mao, W.F.; Zhou, P.P. Establishment and application of health risk ranking model for heavy metals in aquatic products. Chinese Journal of Food Hygiene. 2020, 32, 294–300. [Google Scholar]
- Ding, H.L.; Dai, F.; Zhang, S.F.; Zhang, S.Q. Investigation and analysis of veterinary drug residues and heavy metals inanimal aquatic products in Suzhou. Journal of Food Safety & Quality. 2019, 10, 2174–2180. [Google Scholar]
- Qing, Y.; Yang, J.Q.; Zhu, Y.S.; Li, Y.Z.; Ma, W.R.; Zhang, C.; Li, X.; Wu, M.; Wang, H.; Kauffman, A.E. Cancer risk and disease burden of dietary cadmium exposure changes in Shanghai residents from 1988 to 2018. Science of the Total Environment. 2020, 734, 139411. [Google Scholar] [CrossRef]
- Lao, Y.M.; Qu, C.L.; Zhang, B.; Jin, H. Development and validation of single-step microwave-assisted digestion method for determining heavy metals in aquatic products: health risk assessment. Food Chemistry. 2023, 402, 134500. [Google Scholar]
- Bonsignore, M.; Manta, D.S.; Mirto, S.; Quinci, E.M.; Ape, F.; Montalto, V.; Gristina, M.; Traina, A.; Sprovieri, M. Bioaccumulation of heavy metals in fish, crustaceans, molluscs and echinoderms from the Tuscany coast. Ecotoxicology and environmental safety. 2018, 162, 554–562. [Google Scholar] [CrossRef] [PubMed]
- Liu, B.L.; Lv, L.Y.; An, M.; Wang, T.; Li, M.; Yu, Y. Heavy metals in marine food web from Laizhou Bay, China: Levels, trophic magnification, and health risk assessment. Science of The Total Environment. 2022, 841, 156818. [Google Scholar] [CrossRef]
- Aziz, K.H.H.; Mustafa, F.S.; Omer, K.M.; Hama, S.; Hamarawf, R.F.; Rahman, K.O. Heavy metal pollution in the aquatic environment: efficient and low-cost removal approaches to eliminate their toxicity: a review. RSC advances. 2023, 13, 17595–17610. [Google Scholar] [CrossRef] [PubMed]
- Dai, J.X.; Wang, Y.; Lin, H.; Sun, Y.M.; Pan, Y.N.; Qiao, J.-q.; Lian, H.-z.; Xu, C.-x. Residue screening and analysis of enrofloxacin and its metabolites in real aquatic products based on ultrahigh-performance liquid chromatography coupled with high resolution mass spectrometry. Food Chemistry. 2023, 404, 134757. [Google Scholar] [CrossRef]
- Jin, Y.T.; Chen, J.A.; Ren, T.T.; Tang, Y.W.; Wang, X.H.; Wang, S. Recent progress in detection methods of enrofloxacin in foods. Food Science. 2022, 43, 293–299. [Google Scholar]
- China, M.o.A.a.R.A.o.t.P.s.R.o.; China, N.H.C.o.t.P.s.R.o.; Regulation, S.A.f.M. National food safety standard—Maximum residue limits for veterinary drugs in food: GB 31650—2019. 2020.
- Chen, X.; Fang, H.; Li, J.; Shi, S.; Pu, Y.; He, Y.; Liu, Z.; Cheng, L.; Liu, H.; Lin, T. Determination and risk assessment of diazepam residues in aquatic products from China. International Journal of Environmental Analytical Chemistry. 2025, 1–18. [Google Scholar] [CrossRef]
- Luo, L.; Lu, S.; Huang, C.; Wang, F.; Ren, Y.; Cao, H.; Lin, Q.; Tan, Z.; Wen, X. A survey of chloramphenicol residues in aquatic products of Shenzhen, South China. Food Additives & Contaminants: Part A. 2021, 38, 914–921. [Google Scholar]
- Qi, R.C.; Xiao, G.Q.; Miao, J.J.; Zhou, Y.Y.; Li, Z.Y.; He, Z.H.; Zhang, N.; Song, A.M.; Pan, L.Q. Toxicity assessment and detoxification metabolism of sodium pentachlorophenol (PCP-Na) on marine economic species: a case study of Moerella iridescens and Exopalaemon carinicauda. Environmental Science and Pollution Research. 2023, 30, 113587–113599. [Google Scholar] [CrossRef]
- Yang, G.X.; Ding, S.H.; Zhang, J.Y.; Gu, L.; Zhai, W.L.; Kong, C. Research progress on metabolites of nitrofurazone in aquatic products. Heliyon. 2024, 10. [Google Scholar] [CrossRef]
- Khalifa, H.O.; Shikoray, L.; Mohamed, M.-Y.I.; Habib, I.; Matsumoto, T. Veterinary drug residues in the food chain as an emerging public health threat: Sources, analytical methods, health impacts, and preventive measures. Foods. 2024, 13, 1629. [Google Scholar] [CrossRef]
- Zhang, Z.P.; Sun, Y.; Sang, S.Y.; Jia, L.L.; Ou, C.R. Emerging approach for fish freshness evaluation: principle, application and challenges. Foods. 2022, 11, 1897. [Google Scholar] [CrossRef]
- Shao, H.H.; Zhou, X.J.; Xiang, X.W.; Zhang, J.; Song, L.L.; Li, R.X.; Fu, M.N.; Huang, Y.Z. Changes in total volatile basic nitrogen and biogenic amines in 4 kinds of marine products during refrigerated storage. Journal of Food Safety & Quality. 2022, 13, 2794–2801. [Google Scholar]
- Bekhit, A.E.D.A.; Giteru, S.G.; Holman, B.W.; Hopkins, D.L. Total volatile basic nitrogen and trimethylamine in muscle foods: Potential formation pathways and effects on human health. Comprehensive Reviews in Food Science and Food Safety. 2021, 20, 3620–3666. [Google Scholar] [CrossRef] [PubMed]
- Ntzimani, A.; Angelakopoulos, R.; Stavropoulou, N.; Semenoglou, I.; Dermesonlouoglou, E.; Tsironi, T.; Moutou, K.; Taoukis, P. Seasonal pattern of the effect of slurry ice during catching and transportation on quality and shelf life of gilthead sea bream. Journal of Marine Science and Engineering. 2022, 10, 443. [Google Scholar] [CrossRef]
- jing, Z.; Guan, Z.Q.; Li, M. Effect of pre-cooling conditions on fresh-keeping to ice-temperature tilapia fillets. Food & Machinery. 2019, 35, 135–140. [Google Scholar]
- Abel, N.; Rotabakk, B.T.; Lerfall, J. Mild processing of seafood—A review. Comprehensive Reviews in Food Science and Food Safety. 2022, 21, 340–370. [Google Scholar] [CrossRef] [PubMed]
- Zhang, X.; Pan, C.; Chen, S.; Xue, Y.; Wang, Y.; Wu, Y. Effects of modified atmosphere packaging with different gas ratios on the quality changes of golden pompano (Trachinotus ovatus) fillets during superchilling storage. Foods. 2022, 11, 1943. [Google Scholar] [CrossRef]
- Nie, X.G.; Zuo, Z.J.; Zhang, R.C.; Luo, S.; Chi, Y.Z.; Yuan, X.Y.; Song, C.W.; Wu, Y.J. New advances in biological preservation technology for aquatic products. npj Science of Food. 2025, 9, 15. [Google Scholar] [CrossRef] [PubMed]
- Jiang, Y.; Chen, X.; Yu, B.; Liu, S.X.; Han, X.O.; Hua, Z.G. Risk assessment of dietary exposure to sulfur dioxide in some foods in Liaoning province. Journal of Food Safety & Quality. 2021, 12, 9292–9298. [Google Scholar]
Figure 1.
Non-compliance of aquatic product types, 2021−2023.
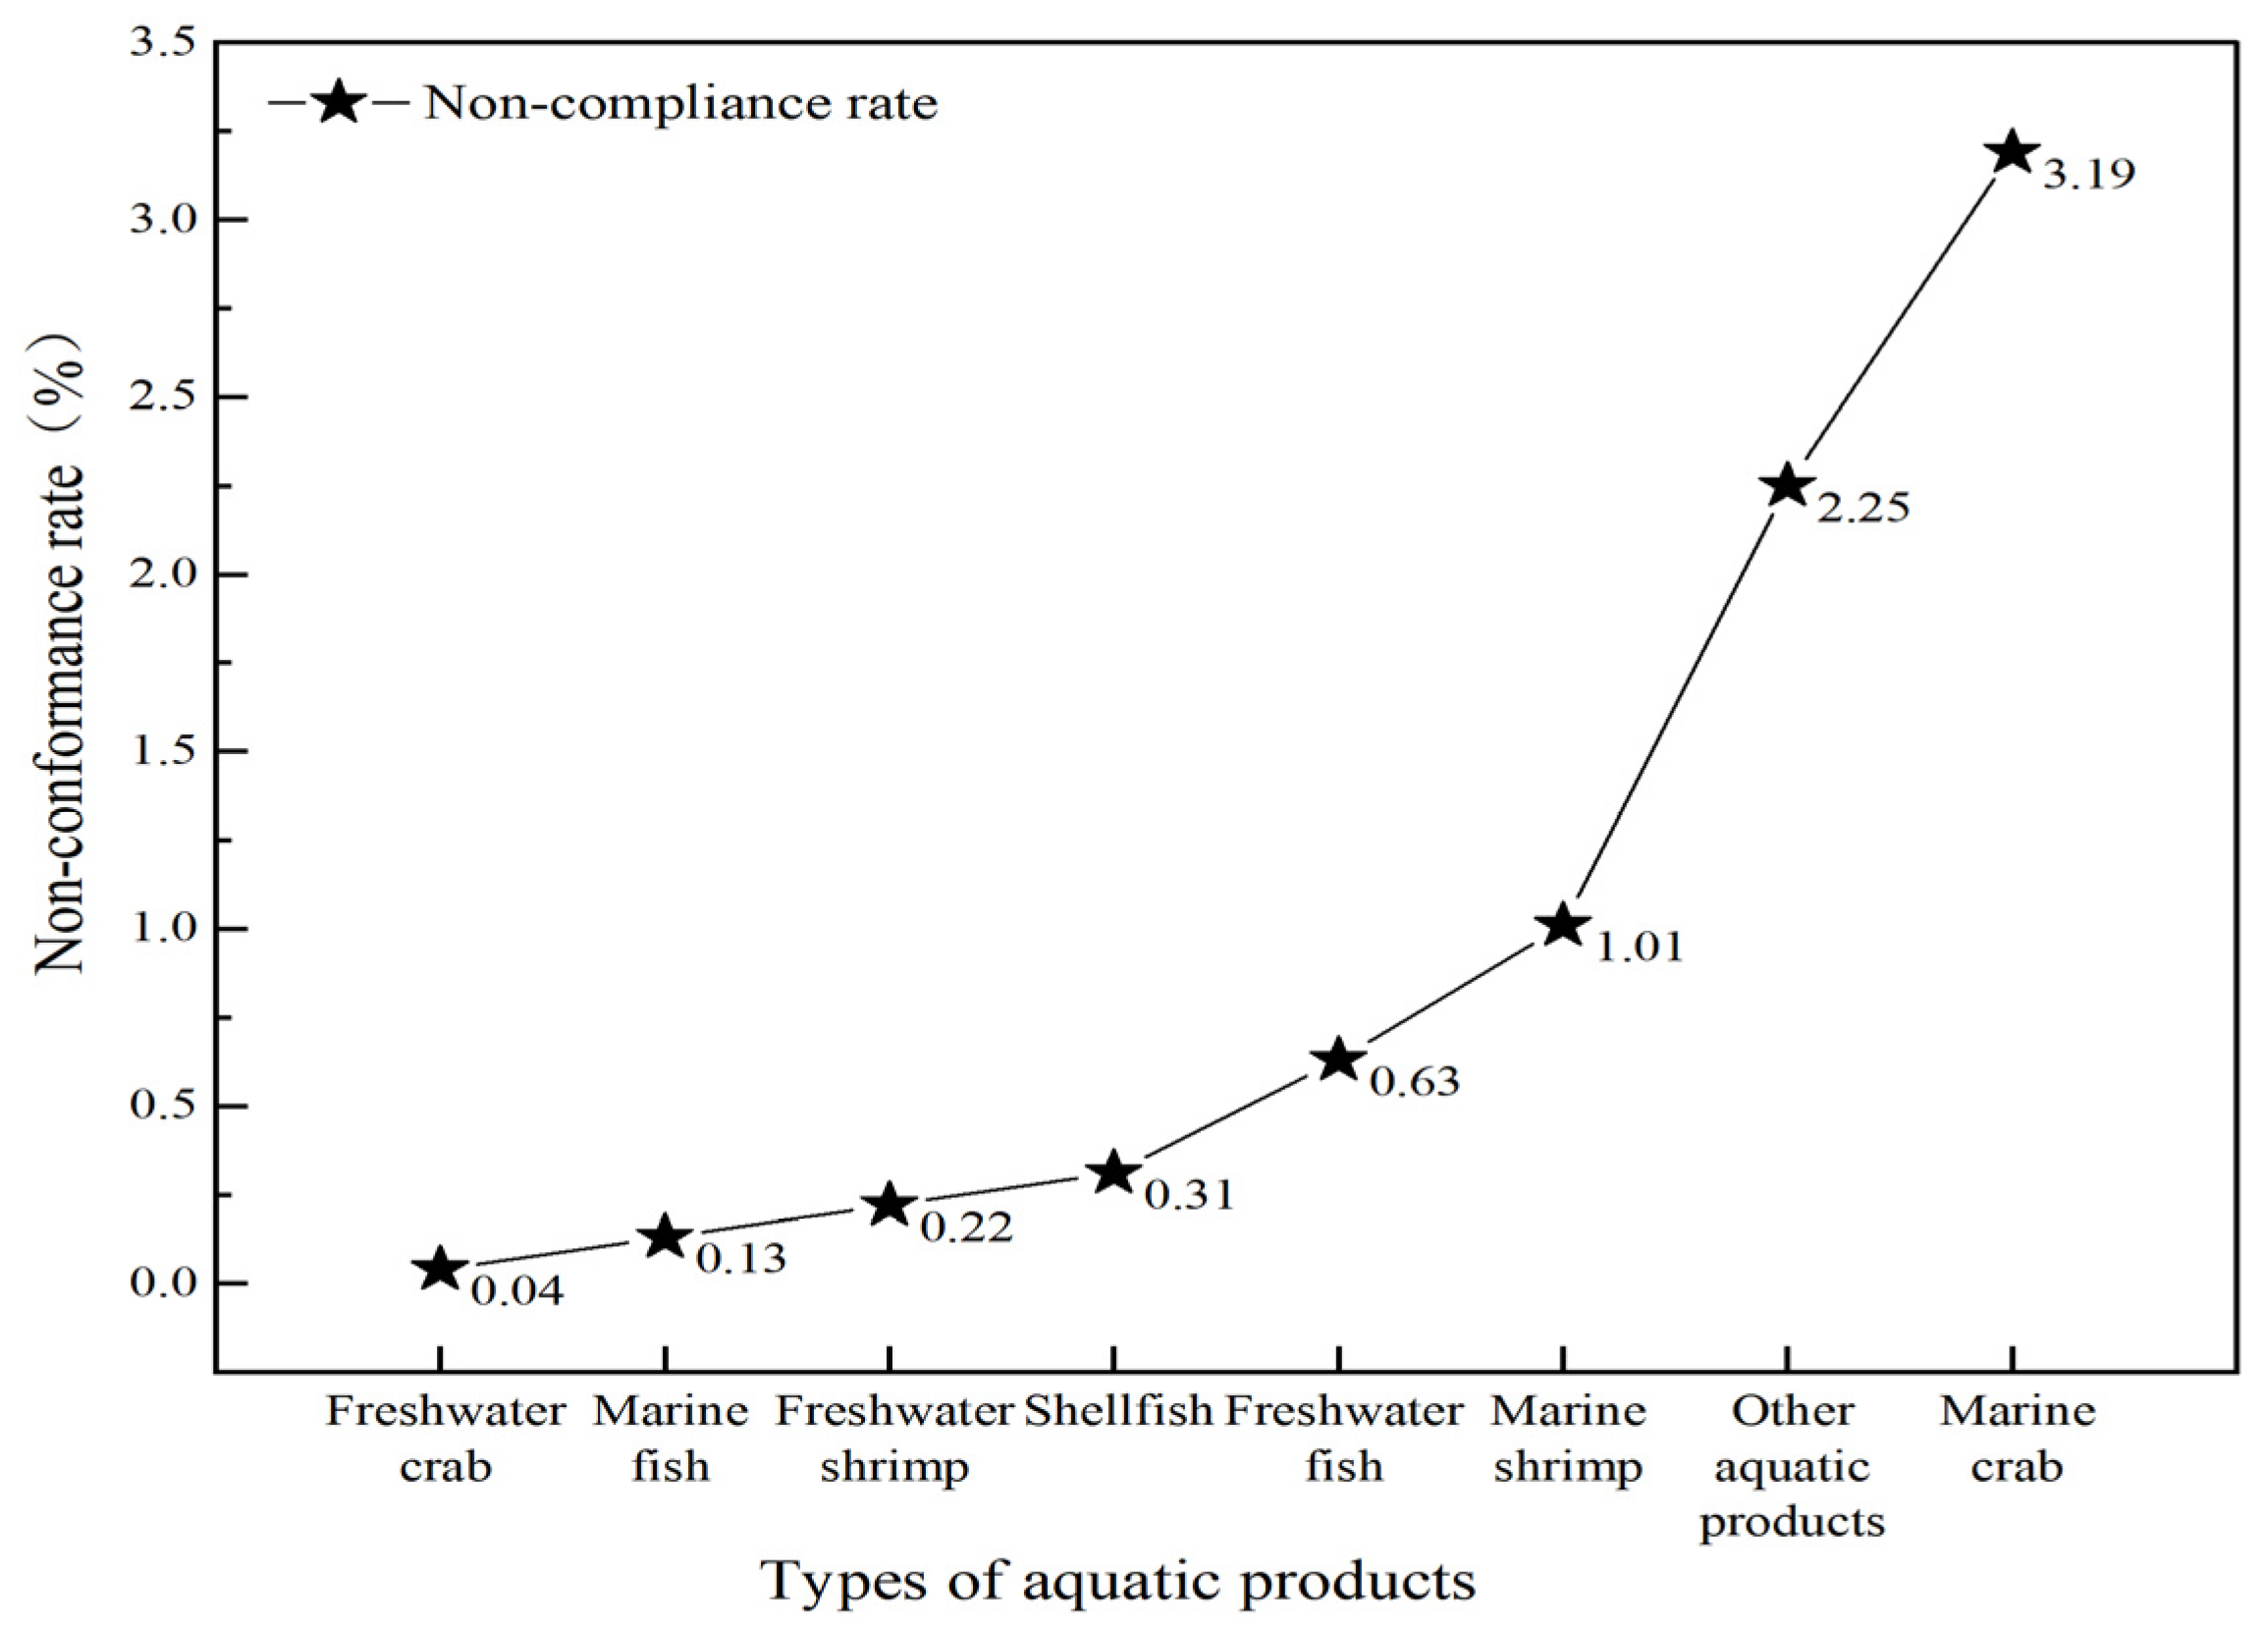
Figure 2.
Percentage of each test item in different types of aquatic products by category.
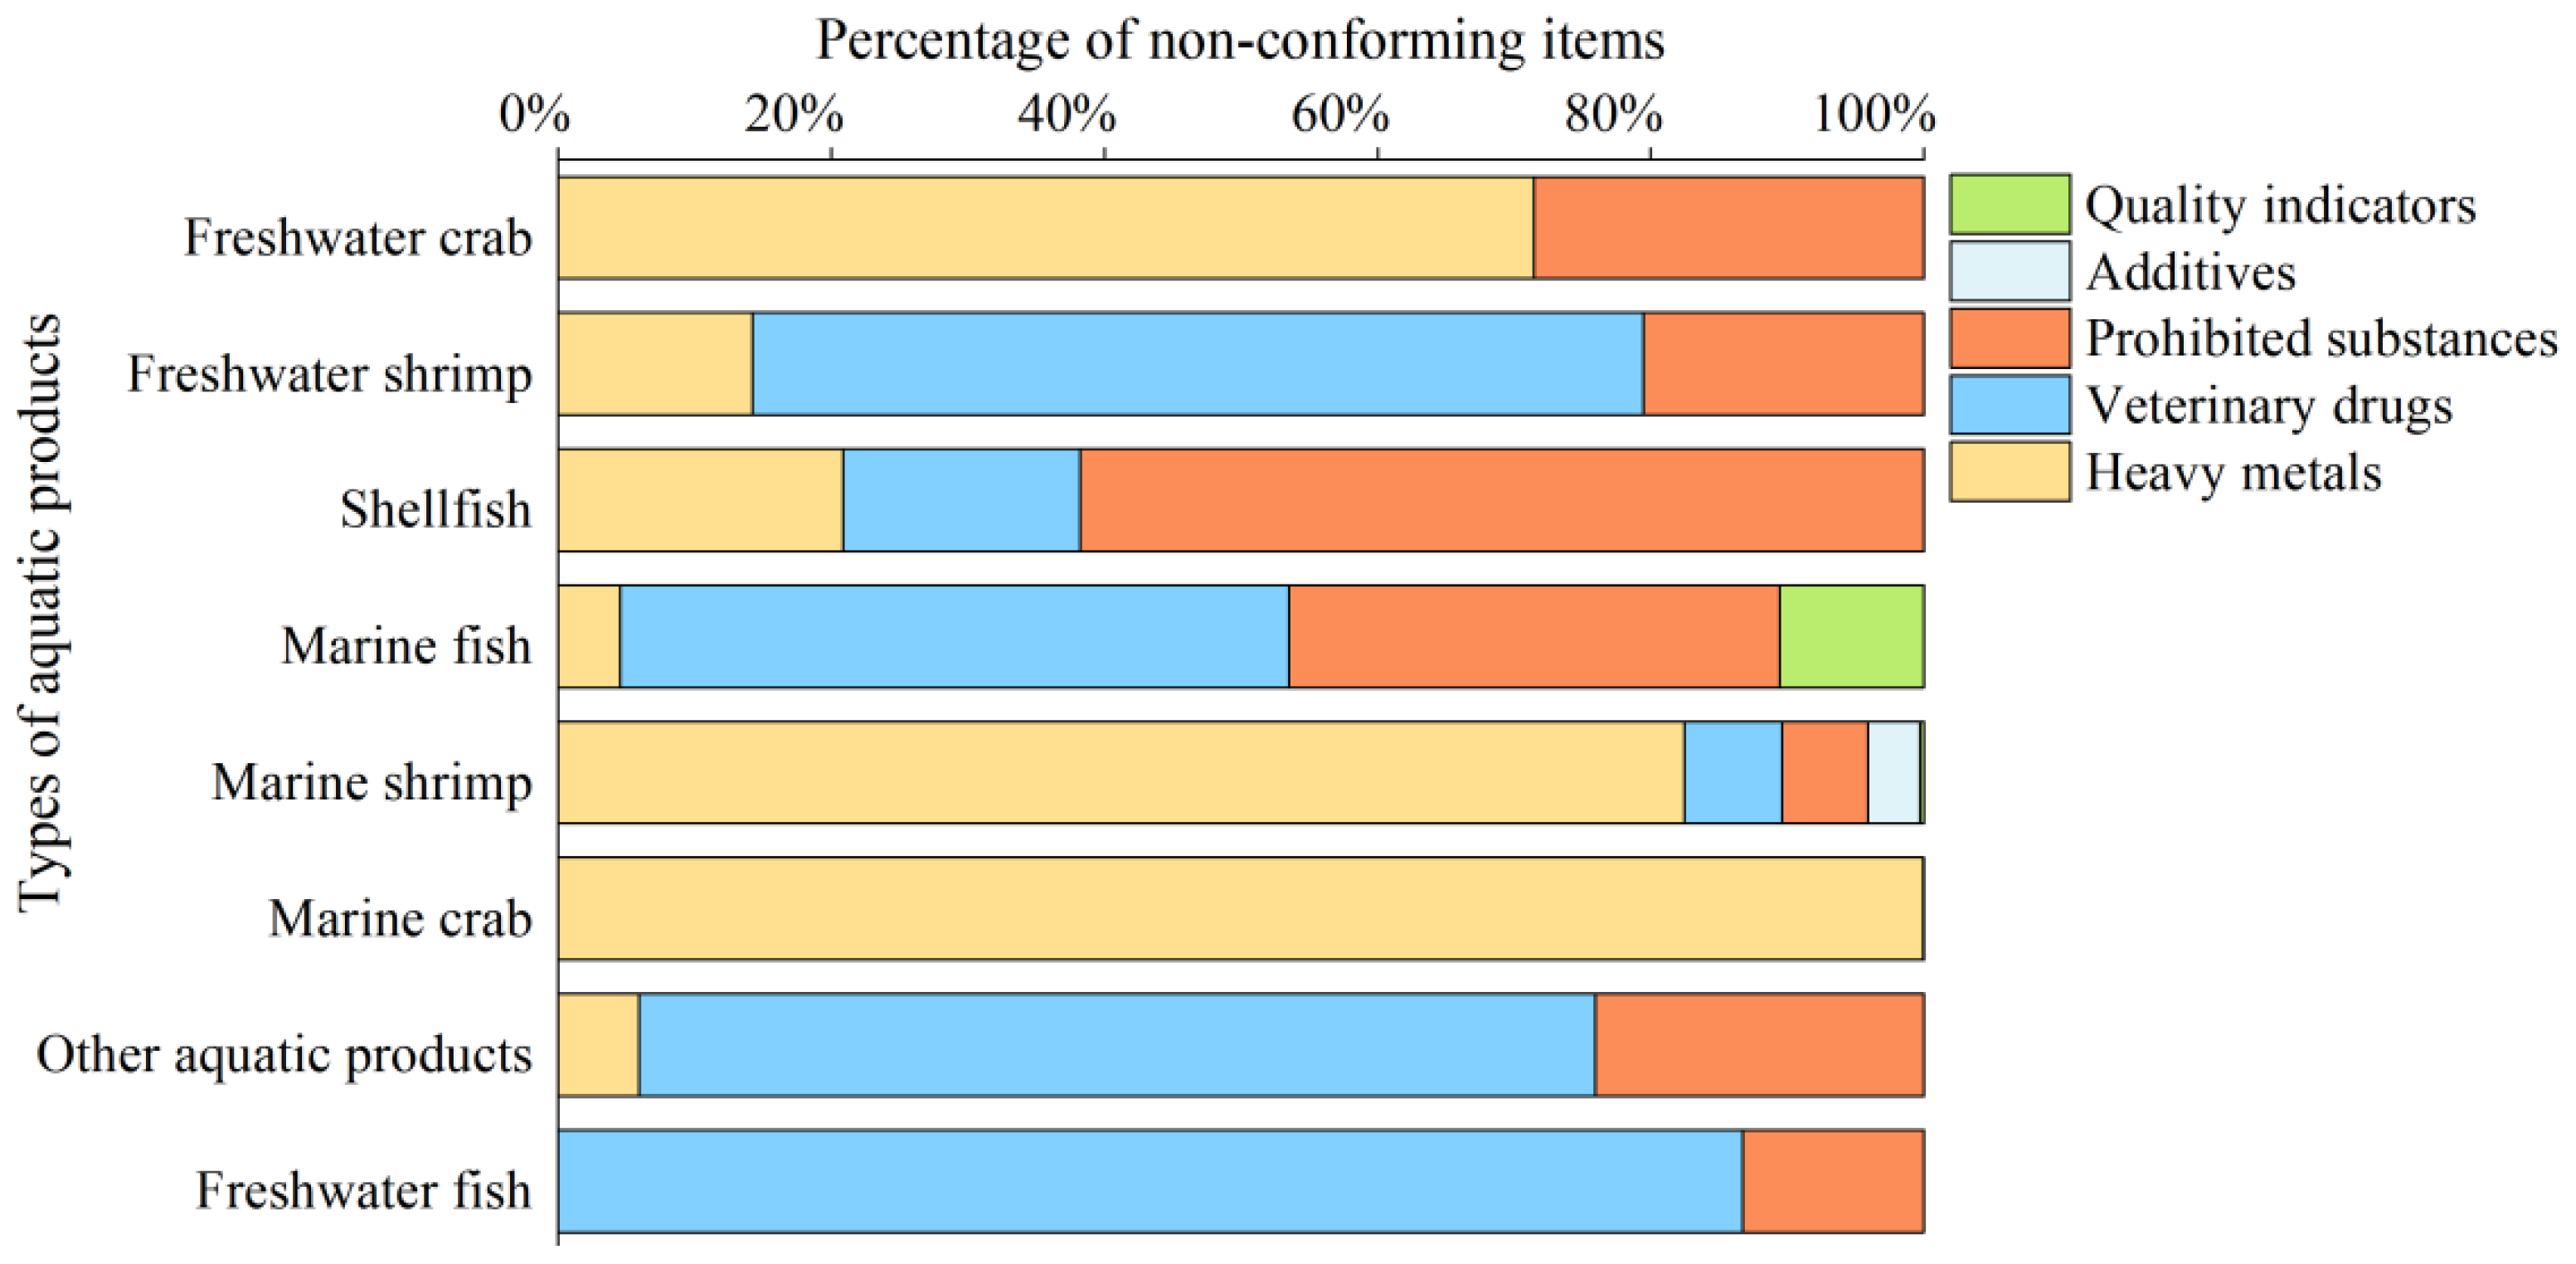
Figure 3.
Distribution of non-compliance items of aquatic products by category.
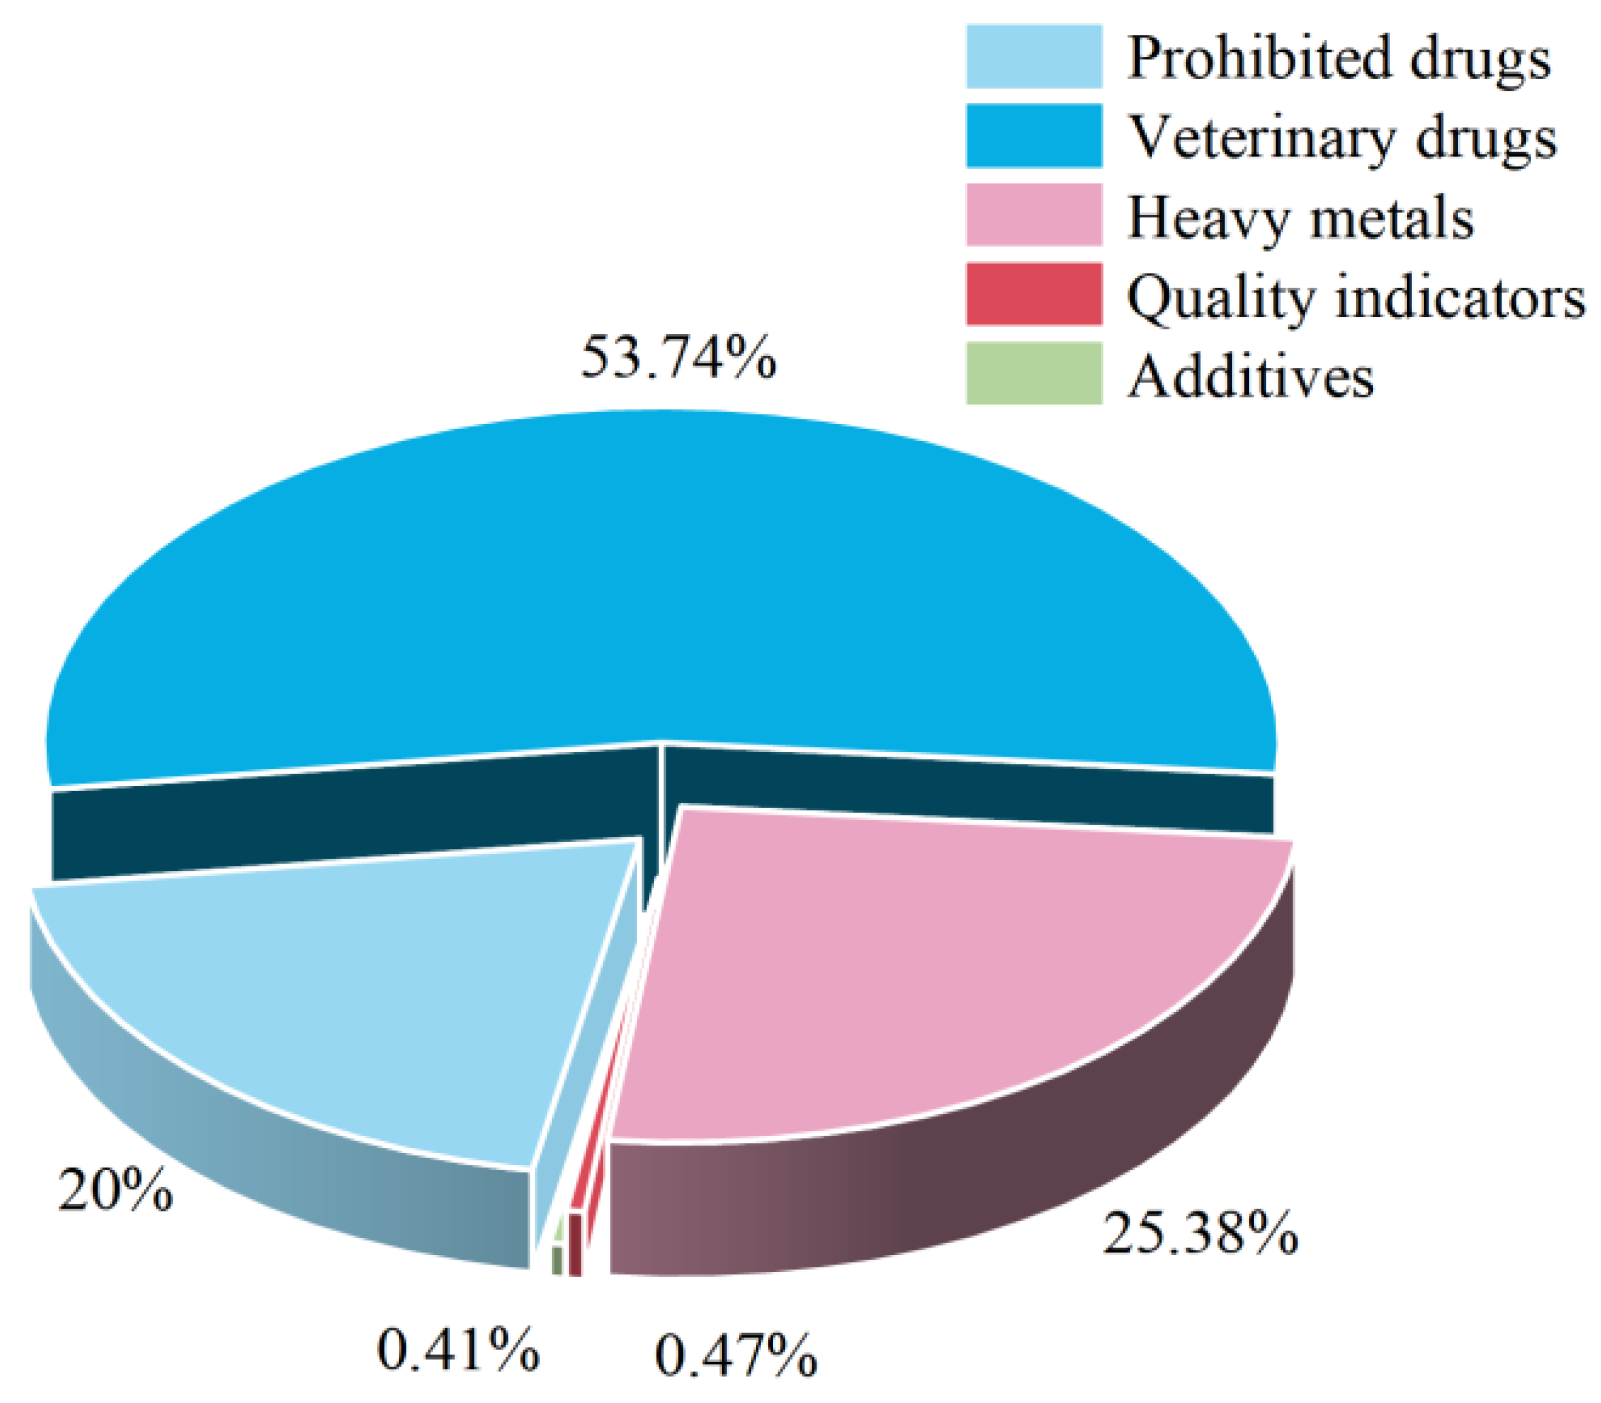
Figure 4.
Non-compliance of inspection tests for veterinary drugs(a) and prohibited drugs (b).
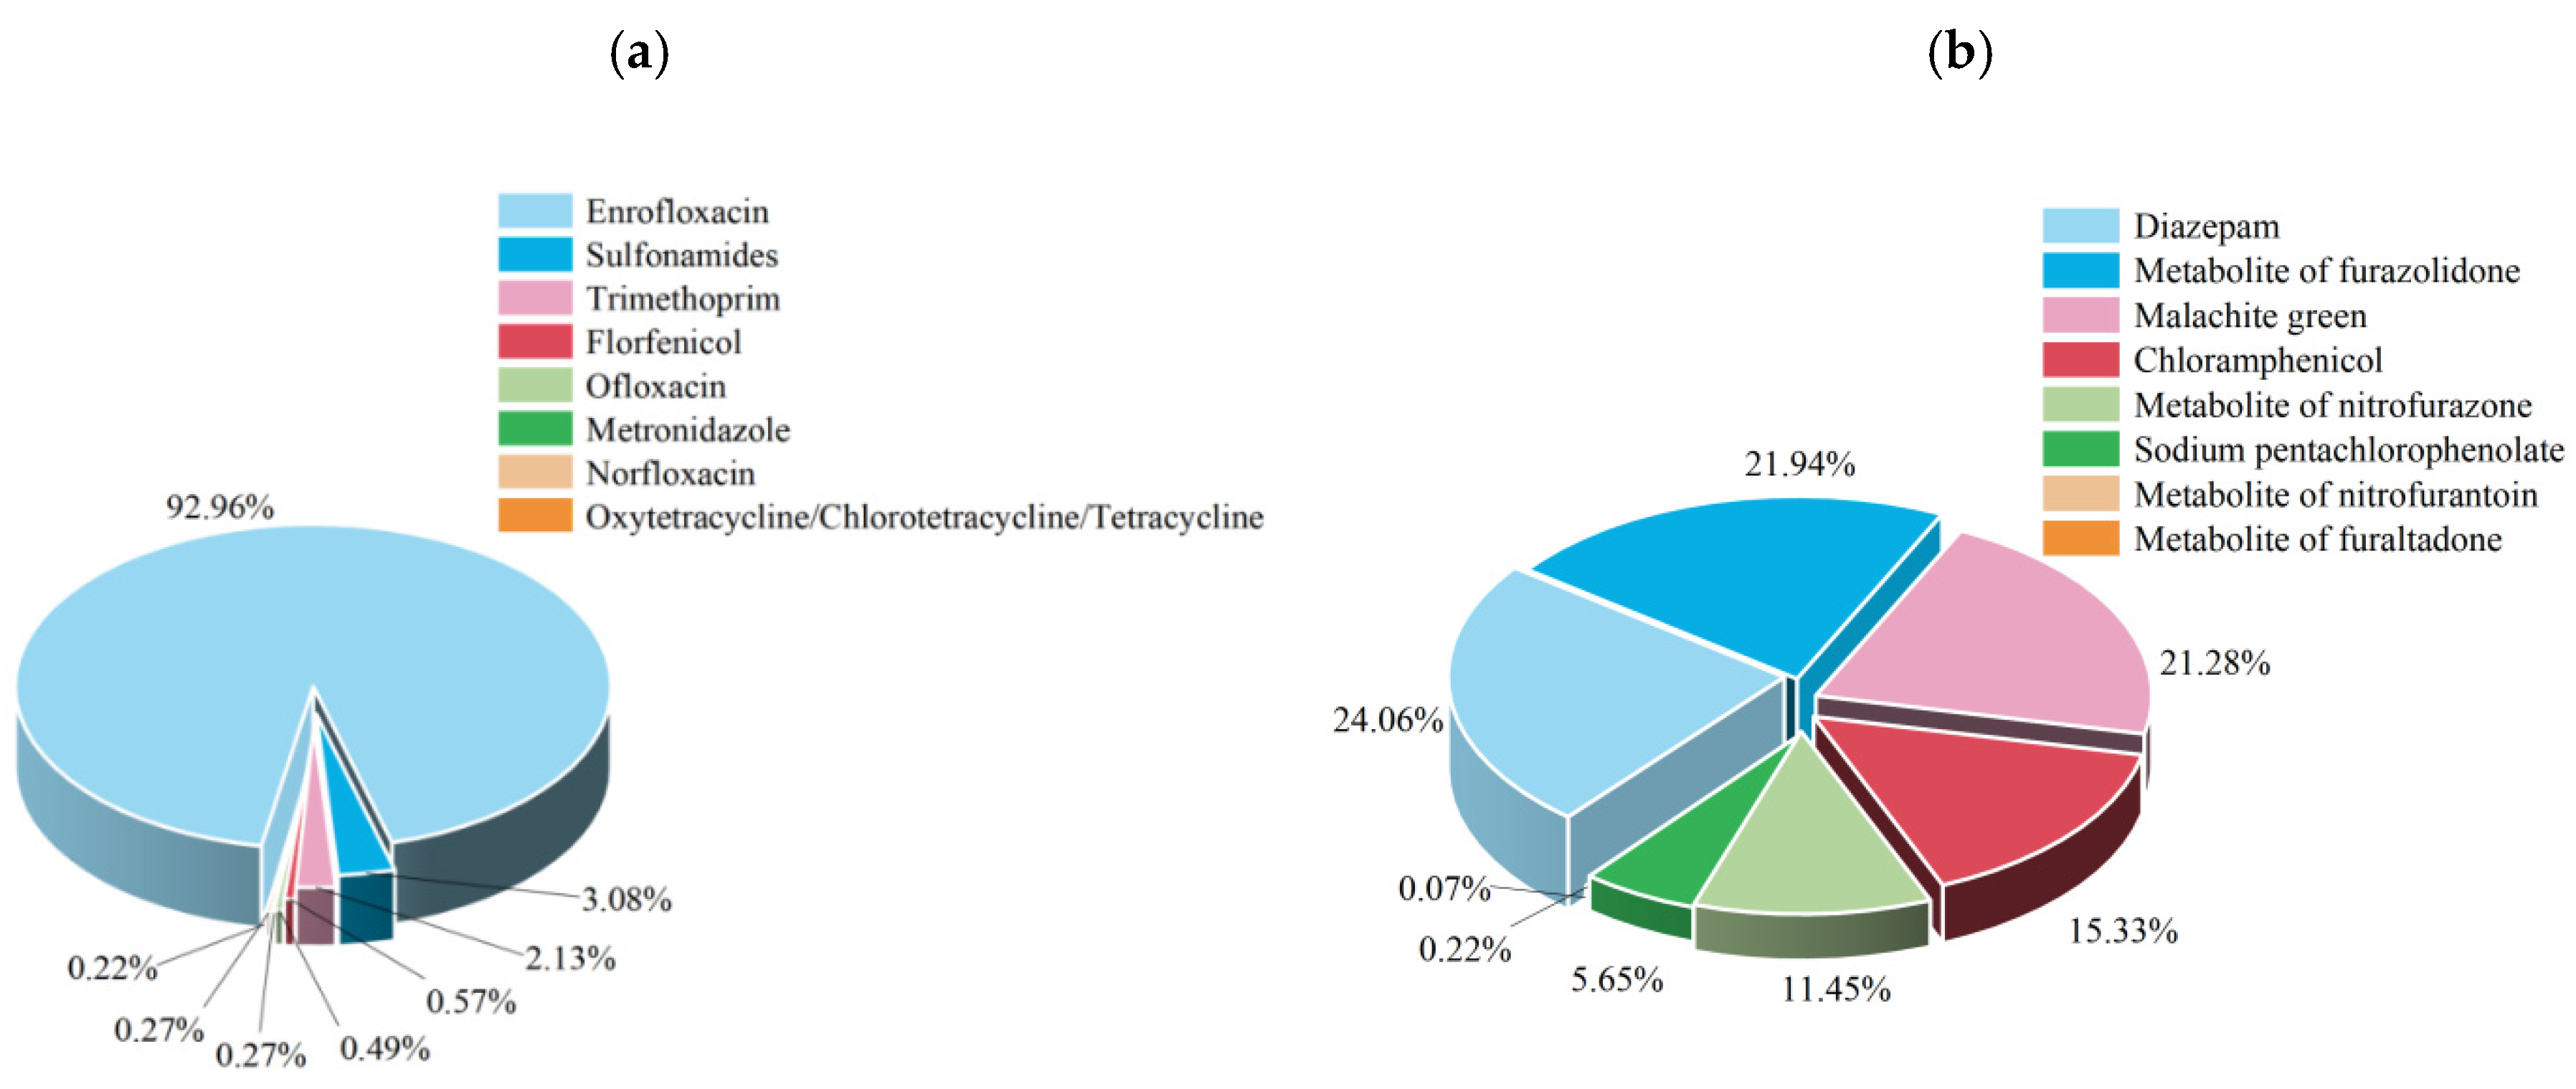
Figure 7.
Total non-compliance rate (a) and non-compliance rates of heavy metals (b), quality indicators (c), additives (d), veterinary drugs (e), and prohibited drugs (f) in aquatic products across province in China.
Figure 7.
Total non-compliance rate (a) and non-compliance rates of heavy metals (b), quality indicators (c), additives (d), veterinary drugs (e), and prohibited drugs (f) in aquatic products across province in China.

Figure 8.
Moran scatter plot of cadmium (a), enrofloxacin (b), furazolidone metabolites (c), chloramphenicol (d) in aquatic products. Note: In the figures, Quadrant Ⅰ denotes positive spatial autocorrelation, representing high-high clustering of non-compliance rates; Quadrant Ⅱ indicates negative spatial autocorrelation, representing low-high clustering; Quadrant Ⅲ corresponds to positive spatial autocorrelation, representing low-low clustering; Quadrant Ⅳ signifies negative spatial autocorrelation, representing high-low clustering.
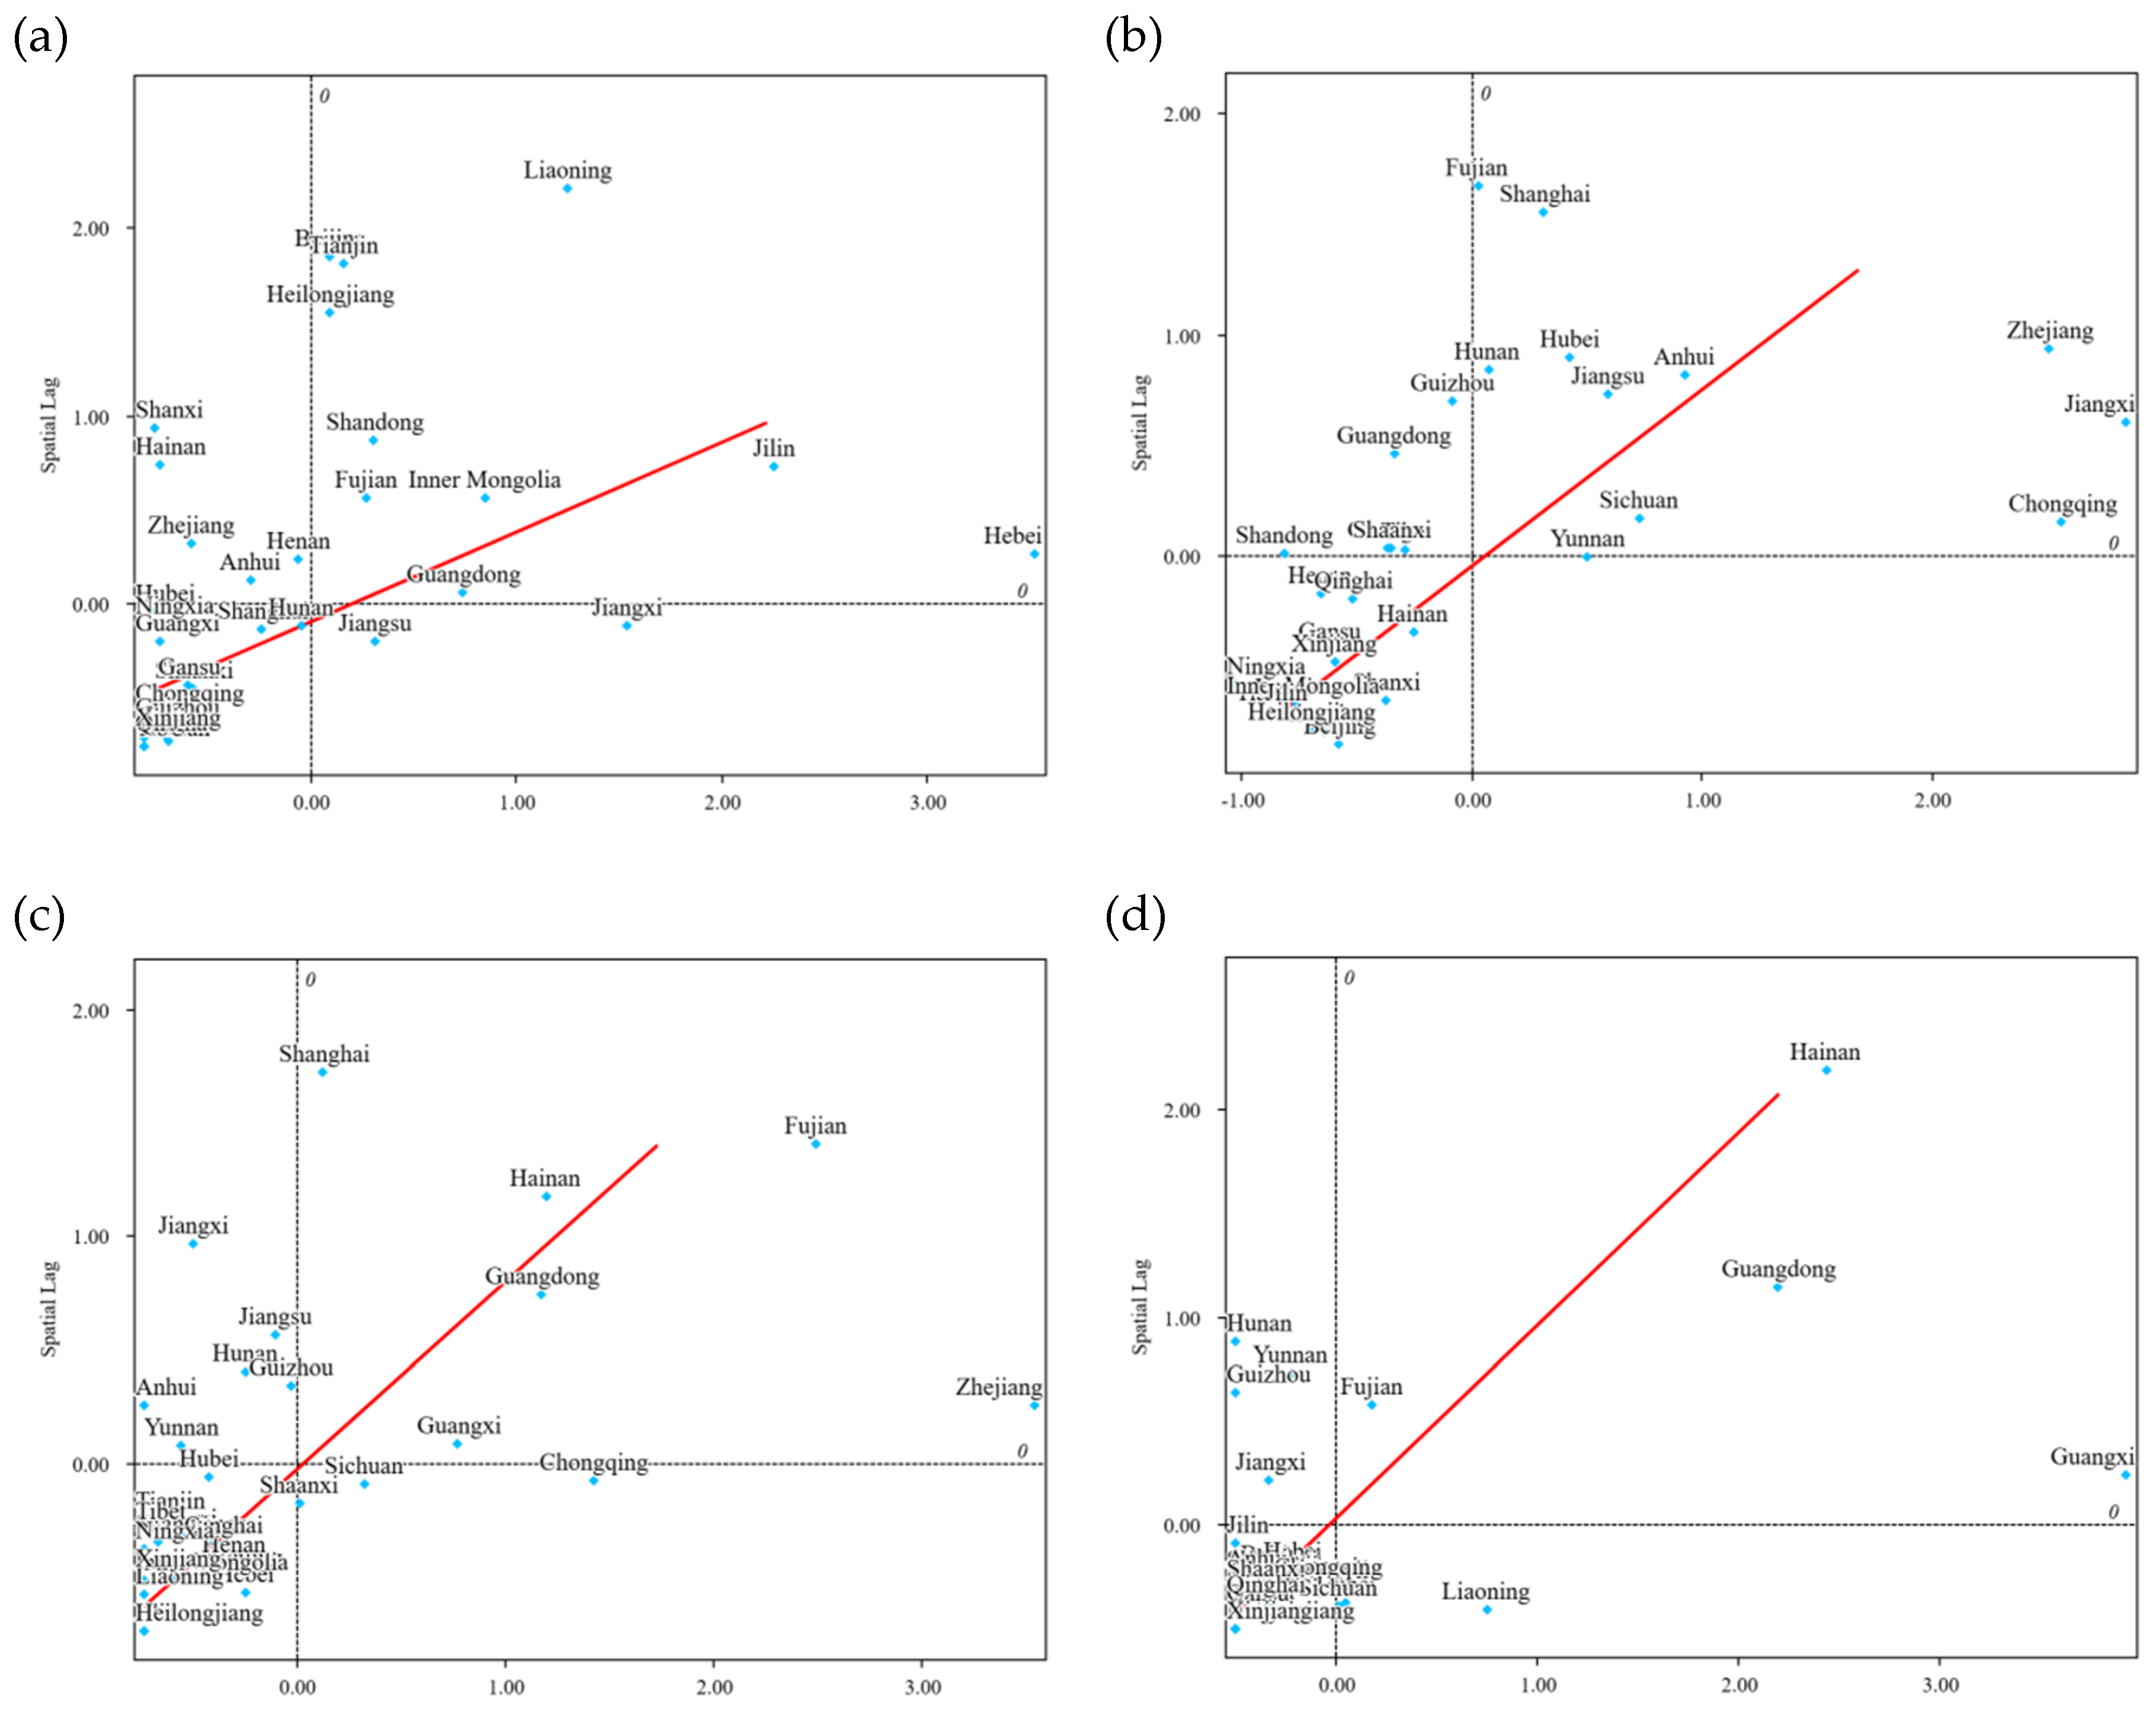
Figure 9.
Types of sampling locations for non-compliant aquatic products in China from 2021 to 2023.
Figure 9.
Types of sampling locations for non-compliant aquatic products in China from 2021 to 2023.
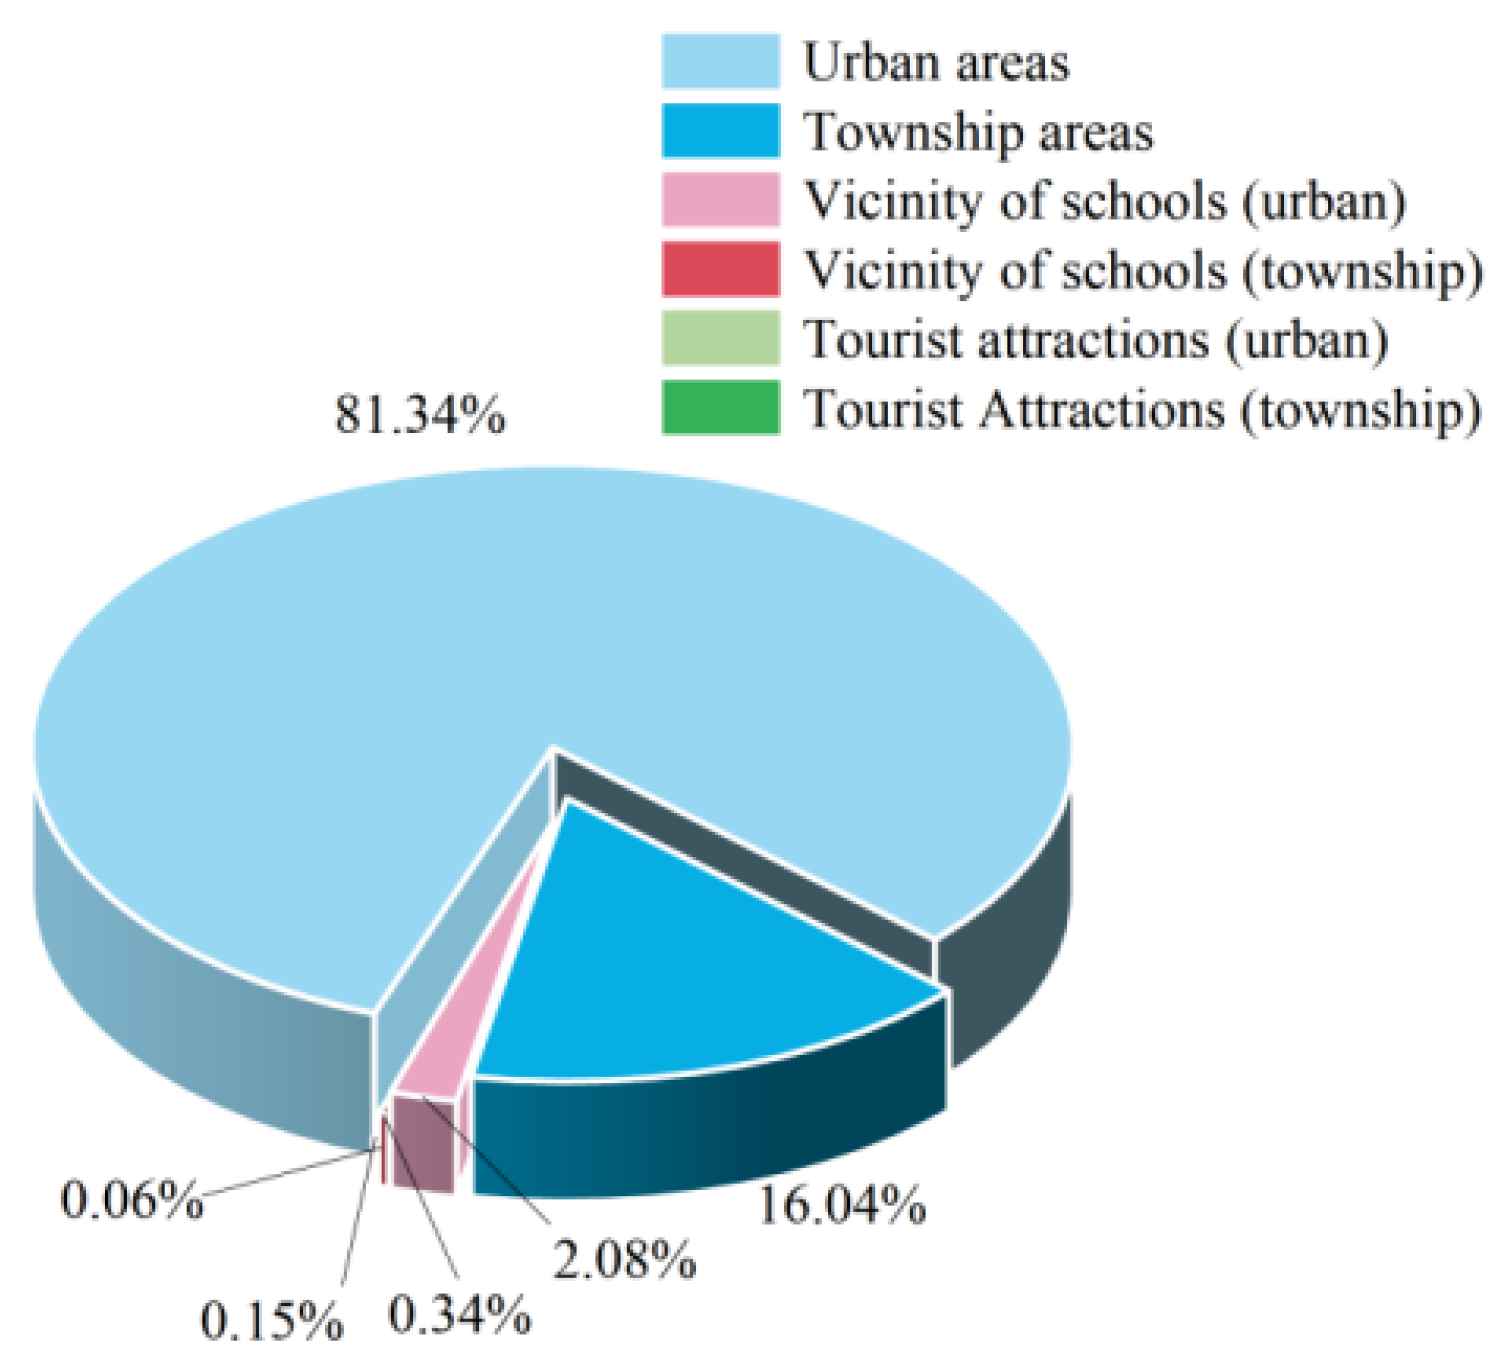
Figure 10.
Sampling stages of non-compliant aquatic products, 2021−2023.
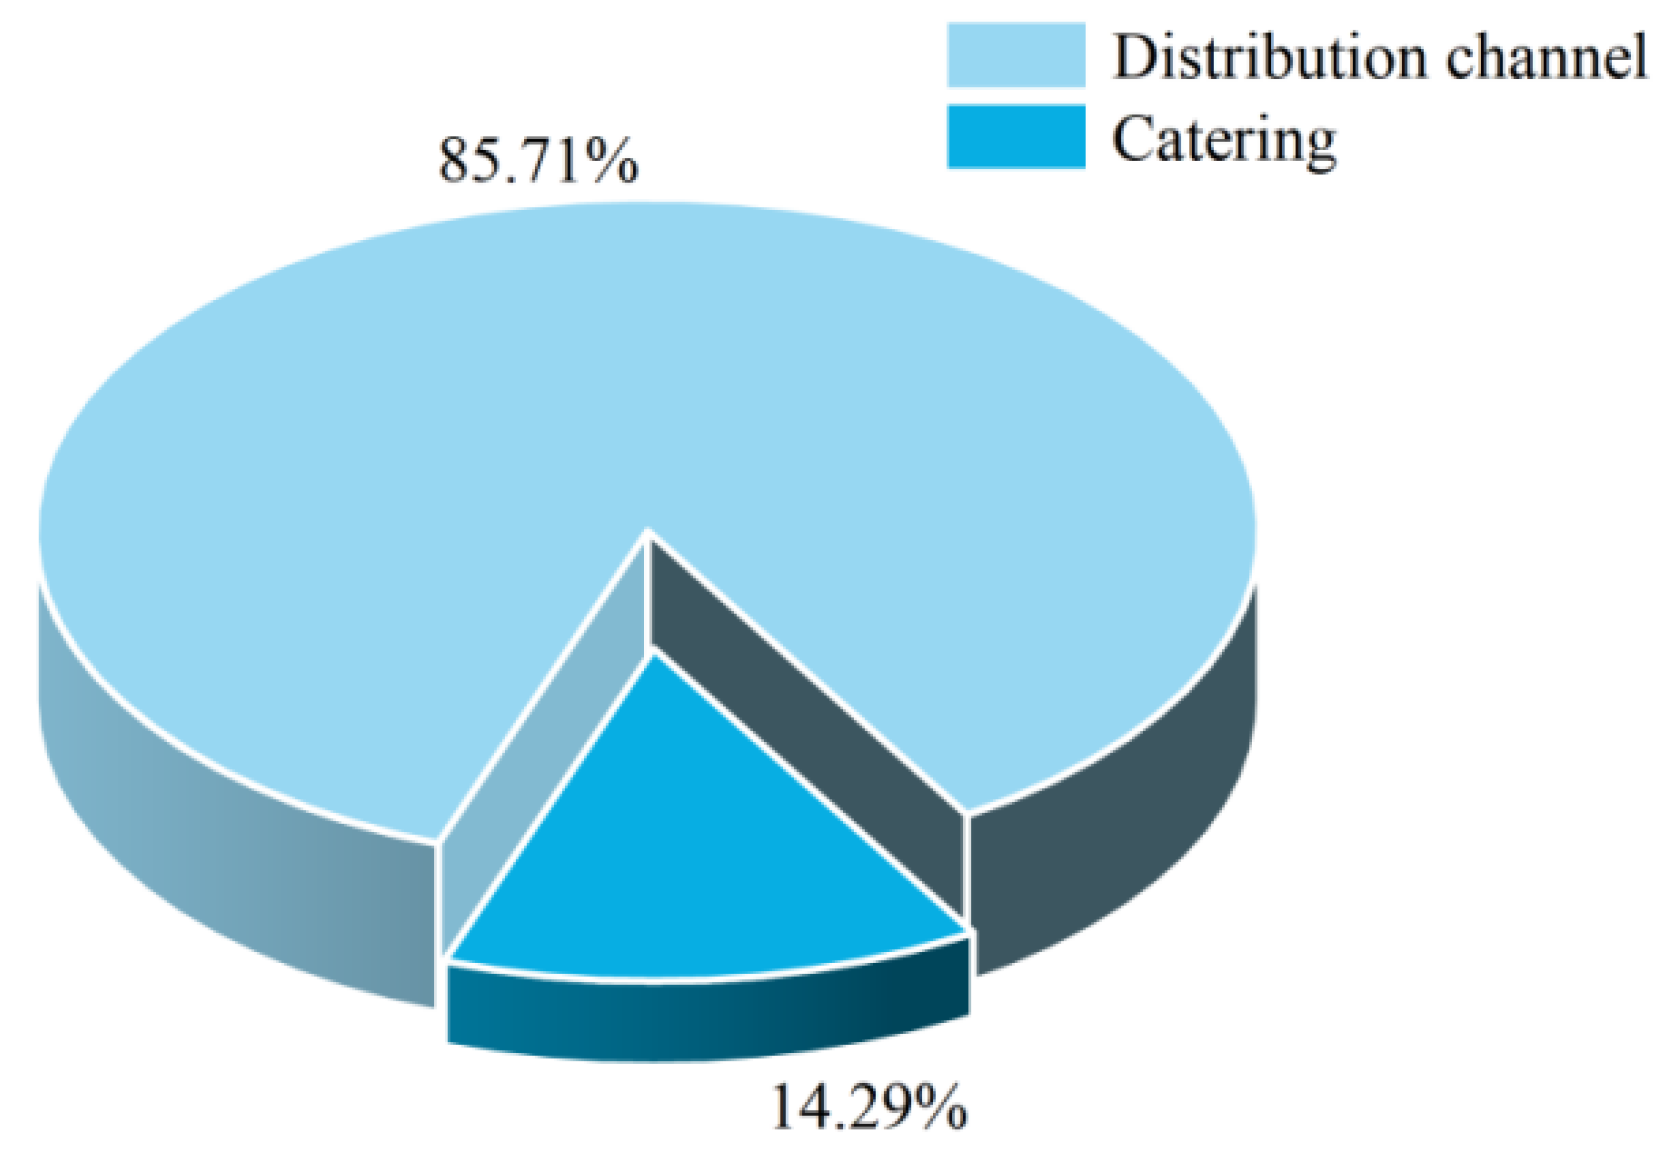
Figure 11.
2021-2023 Sampling places for distribution (a) and catering (b) of unqualified products in aquatic products sampling and testing.
Figure 11.
2021-2023 Sampling places for distribution (a) and catering (b) of unqualified products in aquatic products sampling and testing.
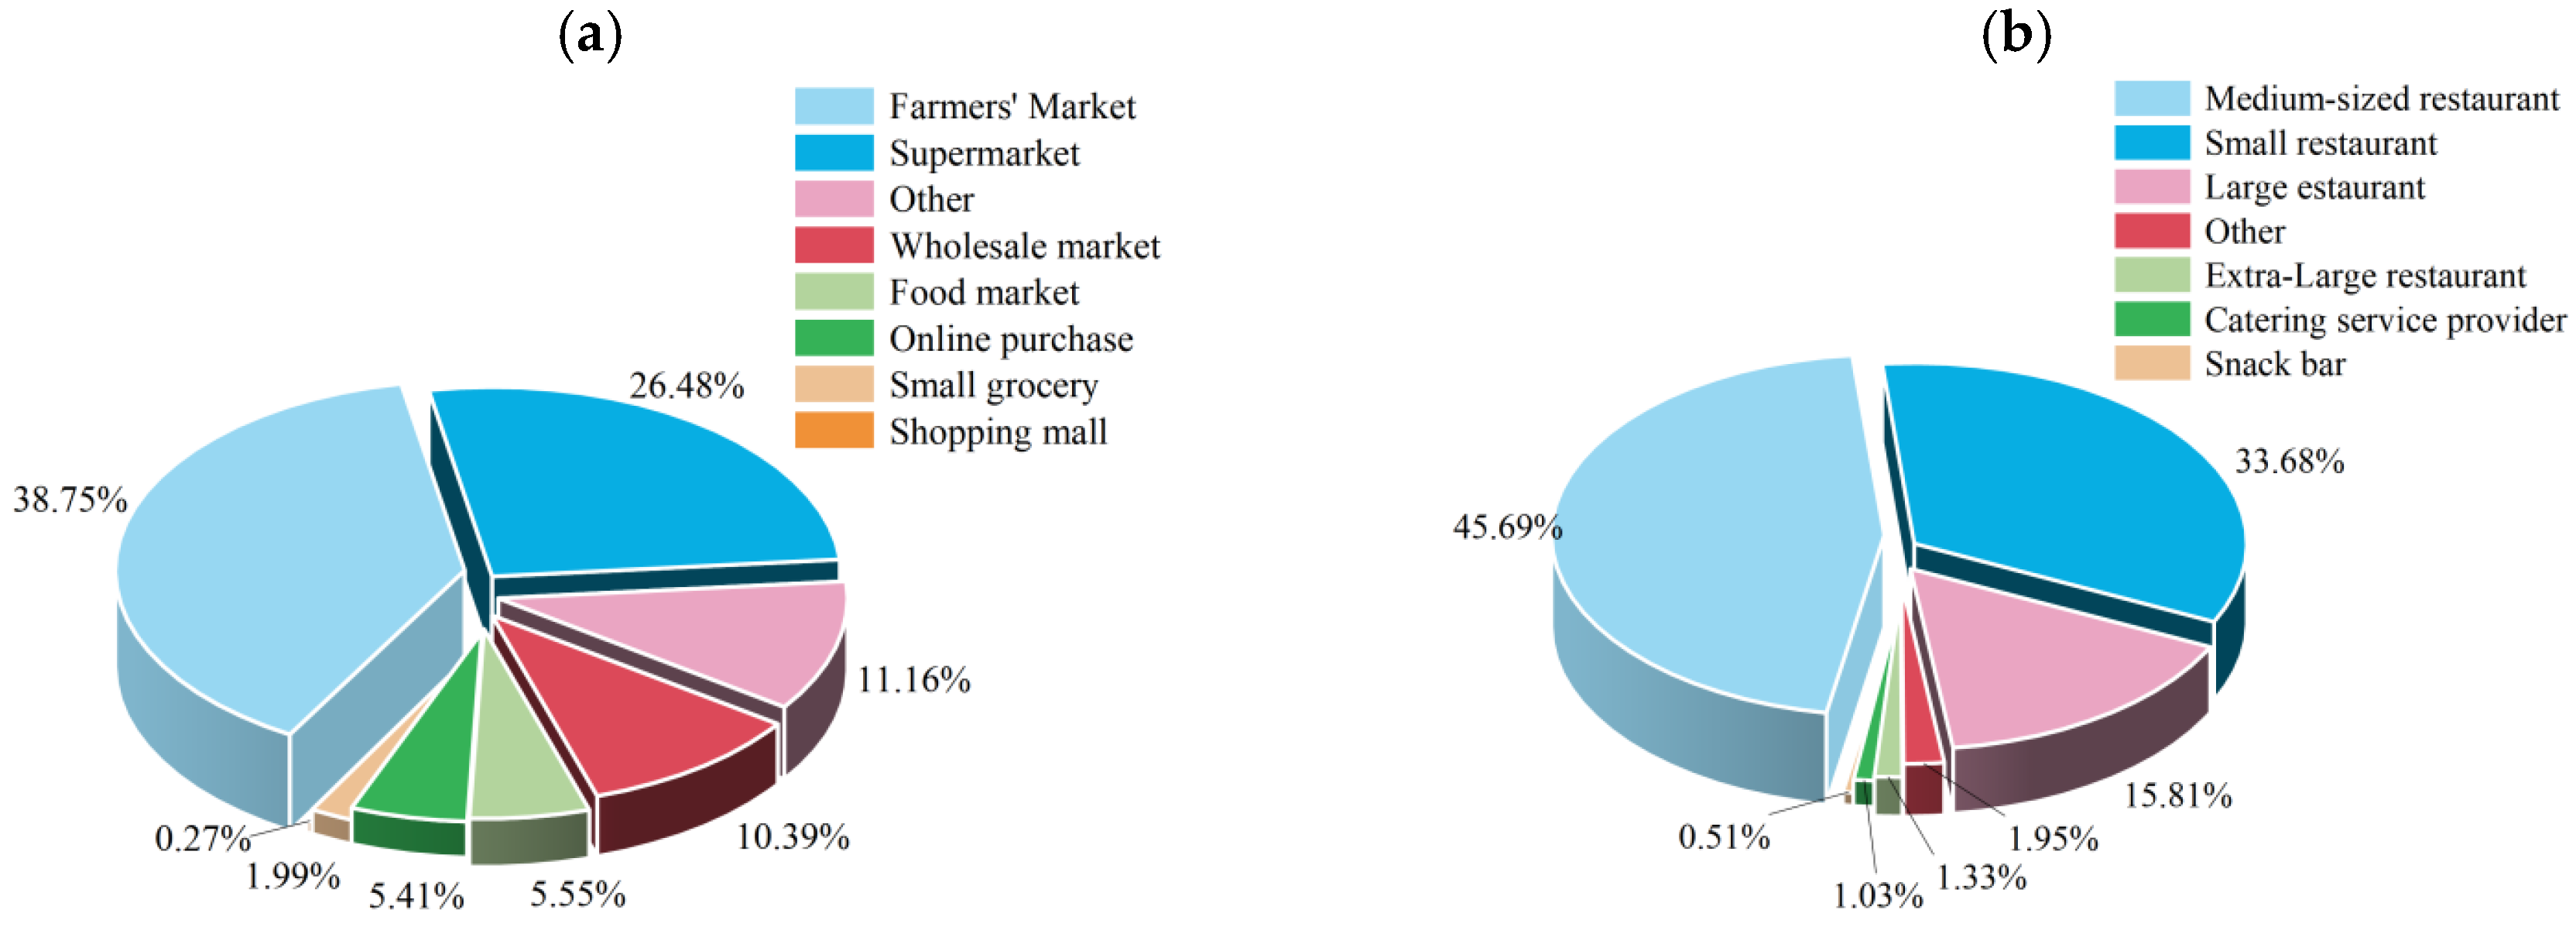

Table 1.
TOPSIS evaluation calculation results.
| Risk substance | Distribution | Catering | ||||||
|---|---|---|---|---|---|---|---|---|
| Sorting | Sorting | |||||||
| Cadmium | 0.254 | 0.374 | 0.595 | 1 | 0.199 | 0.48 | 0.707 | 1 |
| Enrofloxacin | 0.313 | 0.431 | 0.579 | 2 | 0.233 | 0.516 | 0.689 | 2 |
| Total volatile basic nitrogen | 0.434 | 0.355 | 0.45 | 3 | 0.492 | 0.369 | 0.429 | 3 |
| Sulfur dioxide | 0.404 | 0.201 | 0.333 | 4 | 0.589 | 0.06 | 0.092 | 31 |
| Diazepam | 0.485 | 0.199 | 0.291 | 5 | 0.584 | 0.107 | 0.155 | 10 |
| Methylmercury | 0.478 | 0.18 | 0.274 | 6 | 0.518 | 0.23 | 0.308 | 4 |
| Malachite green | 0.52 | 0.184 | 0.261 | 7 | 0.584 | 0.107 | 0.154 | 11 |
| Furazolidone metabolites | 0.523 | 0.183 | 0.26 | 8 | 0.57 | 0.114 | 0.167 | 9 |
| Chloramphenicol | 0.529 | 0.182 | 0.256 | 9 | 0.596 | 0.102 | 0.147 | 12 |
| Nitrofurazone metabolites | 0.535 | 0.181 | 0.253 | 10 | 0.566 | 0.117 | 0.171 | 8 |
| Sodium Pentachlorophenolate | 0.545 | 0.18 | 0.249 | 11 | 0.516 | 0.16 | 0.237 | 5 |
| Metronidazole | 0.546 | 0.18 | 0.248 | 12 | 0.609 | 0.1 | 0.141 | 13 |
| Nitrofurantoin metabolites | 0.548 | 0.18 | 0.247 | 13 | 0.615 | 0.1 | 0.139 | 16 |
| Furaltadone metabolites | 0.549 | 0.18 | 0.247 | 14 | 0.615 | 0.1 | 0.139 | 15 |
| Sarafloxacin | 0.549 | 0.177 | 0.243 | 15 | 0.615 | 0.092 | 0.13 | 17 |
| Ofloxacin | 0.543 | 0.174 | 0.243 | 16 | 0.613 | 0.086 | 0.123 | 18 |
| Polychlorinated biphenyls |
0.539 | 0.169 | 0.239 | 17 | 0.617 | 0.072 | 0.104 | 27 |
| Danofloxacin | 0.55 | 0.172 | 0.238 | 18 | 0.617 | 0.083 | 0.118 | 23 |
| Flumequine | 0.55 | 0.166 | 0.231 | 19 | 0.617 | 0.083 | 0.118 | 24 |
| Difloxacin | 0.549 | 0.162 | 0.228 | 20 | 0.616 | 0.086 | 0.123 | 20 |
| Oxolinic acid | 0.55 | 0.142 | 0.205 | 21 | 0.616 | 0.086 | 0.123 | 19 |
| Inorganic arsenic | 0.512 | 0.128 | 0.2 | 22 | 0.55 | 0.149 | 0.213 | 6 |
| Chromium | 0.511 | 0.117 | 0.186 | 23 | 0.558 | 0.121 | 0.178 | 7 |
| Histamine | 0.523 | 0.092 | 0.15 | 24 | 0.593 | 0.057 | 0.088 | 32 |
| Lead | 0.541 | 0.069 | 0.113 | 25 | 0.578 | 0.094 | 0.14 | 14 |
| Deltamethrin | 0.56 | 0.066 | 0.105 | 26 | 0.607 | 0.071 | 0.104 | 26 |
| Cypermethrin | 0.562 | 0.058 | 0.094 | 27 | 0.605 | 0.063 | 0.095 | 28 |
| Trimethoprim | 0.554 | 0.039 | 0.065 | 28 | 0.618 | 0.029 | 0.045 | 33 |
| Florfenicol | 0.557 | 0.039 | 0.065 | 29 | 0.611 | 0.064 | 0.094 | 29 |
| Sulfonamides (total) | 0.553 | 0.03 | 0.052 | 30 | 0.605 | 0.023 | 0.036 | 34 |
| Pefloxacin | 0.575 | 0.027 | 0.045 | 31 | 0.616 | 0.086 | 0.123 | 21 |
| Oxytetracycline/chlortetracycline/tetracycline (sum) | 0.569 | 0.021 | 0.035 | 32 | 0.616 | 0.063 | 0.093 | 30 |
| Norfloxacin | 0.574 | 0.014 | 0.024 | 33 | 0.603 | 0.084 | 0.123 | 22 |
| Lomefloxacin | 0.576 | 0.014 | 0.023 | 34 | 0.617 | 0.083 | 0.118 | 25 |
Table 2.
Scope of risk classification.
| Risk level | Value range | Grading |
|---|---|---|
| [0, 10%) | [0, 0.0513) | Lowest |
| [10%, 40%) | [0.0513, 0.1272) | Lower |
| [40%, 70%) | [0.1272, 0.2402) | Medium |
| [70%, 90%) | [0.2402, 0.3426) | Higher |
| [90%, 100%] | [0.3426, 0.7070] | Highest |
Table 3.
Classification of risk substances in aquatic products.
| Category | Risk substances | Grading | |
|---|---|---|---|
| Distribution | Catering | ||
| Prohibited drugs | Chloramphenicol | Higher | Medium |
| Furazolidone metabolites | Higher | Medium | |
| Malachite Green | Higher | Medium | |
| Nitrofurazone metabolites | Higher | Medium | |
| Sodium pentachlorophenolate | Higher | Higher | |
| Nitrofurantoin metabolites | Higher | Medium | |
| Diazepam | Higher | Medium | |
| Furaltadone metabolites | Higher | Medium | |
| Veterinary drugs | Enrofloxacin | Highest | Highest |
| Sulfonamides (Total) | Lower | Lowest | |
| Trimethoprim | Lower | Lowest | |
| Florfenicol | Lower | Lower | |
| Oxytetracycline/chlortetracycline/tetracycline (Sum) | Lowest | Lower | |
| Metronidazole | Higher | Medium | |
| Ofloxacin | Higher | Lower | |
| Norfloxacin | Lowest | Lower | |
| Pefloxacin | Lowest | Lower | |
| Lomefloxacin | Lowest | Lower | |
| Deltamethrin | Lower | Lower | |
| Cypermethrin | Lower | Lower | |
| Difloxacin | Medium | Lower | |
| Oxolinic acid | Medium | Lower | |
| Flumequine | Medium | Lower | |
| Danofloxacin | Medium | Lower | |
| Sarafloxacin | Higher | Medium | |
| Additives | Sulfur dioxide | Higher | Lower |
| Organic pollutants | Polychlorinated biphenyls | Medium | Lower |
| Quality indicators | Total volatile basic nitrogen | Highest | Highest |
| Histamine | Medium | Lower | |
| Heavy metals | Cadmium | Highest | Highest |
| Chromium | Medium | Medium | |
| Lead | Lower | Medium | |
| Inorganic arsenic | Medium | Medium | |
| Methylmercury | Higher | Higher | |
Table 4.
Non-compliance items detected in different types of aquatic products.
| Type of aquatic products | Percentage of non-compliant items |
|---|---|
| Seawater crab | Cadmium (99.90%), chloramphenicol (0.10%) |
| Other aquatic products | Enrofloxacin (67.83%), furazolidone metabolites (11.43%), nitrofurazone metabolites (10.67%), cadmium (5.97%), chloramphenicol (1.11%), sulfonamides (total) (0.77%), norfloxacin (0.68%), sodium pentachlorophenolate (0.51%), ofloxacin (0.43%), malachite green (0.34%), metronidazole (0.17%), florfenicol (0.09%). |
| Seawater shrimp | Cadmium (82.47%), enrofloxacin (6.16%), furazolidone metabolites (5.34%), sulfur dioxide (3.84%), oxytetracycline/chlortetracycline/tetracycline (sum) (0.82%), chloramphenicol (0.55%), total volatile basic nitrogen (0.27%), malachite green (0.27%), norfloxacin (0.14%), furaltadone metabolites (0.14%). |
| Freshwater fish | Enrofloxacin (71.35%), diazepam (9.91%), malachite green (7.80%), sulfonamides (total) (2.63%), trimethoprim (2.30%), furazolidone metabolites (1.90%), sodium pentachlorophenolate (1.87%), chloramphenicol (1.54%), ofloxacin (0.39%), nitrofurazone metabolite (0.18%), metronidazole (0.06%), florfenicol (0.03%), cadmium (0.03%). |
| Shellfish | Chloramphenicol (52.44%), cadmium (20.89%), florfenicol (8.44%), enrofloxacin (8.44%), nitrofurazone metabolites (4.89%), furazolidone metabolites (2.22%), malachite green (1.78%), nitrofurantoin metabolites (0.44%), sulfonamides (total) (0.44%). |
| Freshwater shrimp | Enrofloxacin (62.50%), cadmium (14.29%), furazolidone metabolites (9.82%), nitrofurazone metabolites (7.14%), nitrofurantoin metabolites (1.79%), oxytetracycline/chlortetracycline/tetracycline (sum) (1.79%), malachite green (0.89%), norfloxacin (0.89%), sodium pentachlorophenolate (0.89%) |
| Seawater fish | Enrofloxacin (40.49%), furazolidone metabolites (16.20%), total volatile basic nitrogen (9.86%), chloramphenicol (7.75%), malachite green (7.39%), sulfonamides (total) (5.63%), cadmium (4.58%), sodium pentachlorophenolate (2.82%), metronidazole (2.11%), nitrofurazone metabolites (1.76%), histamine (0.70%), trimethoprim (0.70%) |
| Freshwater crab | Cadmium (71.43%), nitrofurazone metabolites (14.29%), furazolidone metabolites (14.29%). |
Table 5.
Global spatial autocorrelation analysis of non-compliance rates for high-risk substances in aquatic products in China (2021-2023).
Table 5.
Global spatial autocorrelation analysis of non-compliance rates for high-risk substances in aquatic products in China (2021-2023).
| Risk substance | Moran's I | Expectation (I) | Standard deviation (I) | Z value | p value |
|---|---|---|---|---|---|
| Cadmium | 0.312 | -0.033 | 0.1 | 2.918 | 0.002 |
| Enrofloxacin | 0.386 | -0.033 | 0.122 | 3.538 | 0.000 |
| Total volatile basic nitrogen | -0.155 | -0.033 | 0.083 | -1.024 | 0.153 |
| Sulfur dioxide | -0.124 | -0.033 | 0.112 | -0.762 | 0.223 |
| Diazepam | 0.141 | -0.033 | 0.117 | 1.473 | 0.07 |
| Malachite green | 0.084 | -0.033 | 0.13 | 0.986 | 0.162 |
| Furazolidone metabolites | 0.319 | -0.033 | 0.1 | 2.971 | 0.001 |
| Chloramphenicol | 0.331 | -0.033 | 0.09 | 3.076 | 0.001 |
| Nitrofurazone metabolites | 0.108 | -0.033 | 0.093 | 1.191 | 0.117 |
| Sodium pentachlorophenolate | -0.04 | -0.033 | 0.107 | -0.054 | 0.479 |
| Metronidazole | 0.002 | -0.033 | 0.096 | 0.301 | 0.382 |
| Ofloxacin | 0.229 | -0.033 | 0.109 | 2.212 | 0.013 |
Table 6.
Local spatial autocorrelation analysis of cadmium, enrofloxacin, furazolidone metabolites, and chloramphenicol.
Table 6.
Local spatial autocorrelation analysis of cadmium, enrofloxacin, furazolidone metabolites, and chloramphenicol.
| Region | Cadmium | Enrofloxacin | Furazolidone metabolites | Chloramphenicol | ||||
|---|---|---|---|---|---|---|---|---|
| Local Moran's I | p value | Local Moran's I | p value | Local Moran's I | p value | Local Moran's I | p value | |
| Beijing | 0.168 | 0.003 | 0.476 | 0.058 | 0.115 | 0.113 | 0.068 | 0.184 |
| Tianjin | 0.282 | 0.003 | 0.596 | 0.078 | 0.174 | 0.161 | 0.064 | 0.179 |
| Hebei | 0.895 | 0.046 | 0.534 | 0.011 | 0.136 | 0.022 | 0.046 | 0.136 |
| Shanxi | -0.687 | 0.024 | 0.234 | 0.048 | 0.168 | 0.114 | 0.198 | 0.081 |
| Inner Mongolia | 0.463 | 0.019 | 0.494 | 0.009 | 0.367 | 0.023 | 0.152 | 0.089 |
| Liaoning | 2.672 | 0.000 | 0.494 | 0.041 | 0.408 | 0.069 | -0.296 | 0.113 |
| Jilin | 1.594 | 0.026 | 0.546 | 0.053 | 0.524 | 0.042 | 0.042 | 0.205 |
| Heilongjiang | 0.142 | 0.002 | 0.529 | 0.064 | 0.524 | 0.071 | 0.246 | 0.105 |
| Shanghai | 0.031 | 0.22 | 0.468 | 0.008 | 0.211 | 0.009 | 0.098 | 0.171 |
| Jiangsu | -0.061 | 0.146 | 0.417 | 0.032 | -0.055 | 0.046 | 0.124 | 0.086 |
| Zhejiang | -0.179 | 0.133 | 2.282 | 0.002 | 0.879 | 0.034 | 0.036 | 0.101 |
| Anhui | -0.035 | 0.202 | 0.73 | 0.004 | -0.185 | 0.103 | 0.123 | 0.097 |
| Fujian | 0.149 | 0.069 | 0.04 | 0.001 | 3.39 | 0.000 | 0.099 | 0.053 |
| Jiangxi | -0.17 | 0.199 | 1.659 | 0.004 | -0.466 | 0.001 | -0.068 | 0.128 |
| Shandong | 0.258 | 0.026 | -0.007 | 0.234 | 0.223 | 0.115 | 0.116 | 0.074 |
| Henan | -0.014 | 0.154 | 0.107 | 0.148 | 0.126 | 0.058 | 0.129 | 0.064 |
| Hubei | 0.031 | 0.196 | 0.369 | 0.005 | 0.023 | 0.223 | -0.018 | 0.055 |
| Hunan | 0.005 | 0.168 | 0.057 | 0.008 | -0.095 | 0.058 | -0.43 | 0.001 |
| Guangdong | 0.042 | 0.243 | -0.153 | 0.072 | 0.847 | 0.015 | 2.42 | 0.000 |
| Guangxi | 0.141 | 0.131 | -0.013 | 0.25 | 0.065 | 0.201 | 0.91 | 0.07 |
| Hainan | -0.526 | 0.08 | 0.083 | 0.176 | 1.364 | 0.026 | 5.168 | 0.005 |
| Chongqing | 0.455 | 0.024 | 0.388 | 0.138 | -0.099 | 0.249 | 0.011 | 0.112 |
| Sichuan | 0.561 | 0.007 | 0.12 | 0.155 | -0.028 | 0.213 | -0.005 | 0.047 |
| Guizhou | 0.419 | 0.017 | -0.06 | 0.029 | -0.01 | 0.099 | -0.309 | 0.033 |
| Yunnan | 0.599 | 0.016 | -0.002 | 0.241 | -0.044 | 0.22 | -0.16 | 0.032 |
| Tibet | 0.597 | 0.017 | -0.008 | 0.249 | 0.208 | 0.141 | 0.149 | 0.114 |
| Shaanxi | 0.254 | 0.032 | -0.011 | 0.221 | -0.002 | 0.174 | 0.146 | 0.068 |
| Gansu | 0.251 | 0.047 | 0.254 | 0.062 | 0.131 | 0.099 | 0.204 | 0.052 |
| Qinghai | 0.491 | 0.02 | 0.098 | 0.162 | 0.118 | 0.133 | 0.183 | 0.092 |
| Ningxia | 0.07 | 0.197 | 0.579 | 0.067 | 0.266 | 0.143 | 0.246 | 0.091 |
| Xinjiang | 0.479 | 0.041 | 0.275 | 0.093 | 0.278 | 0.11 | 0.246 | 0.091 |
Table 7.
Final spatiotemporal risk values for aquatic products.
| Region | Month | |||||||||||
|---|---|---|---|---|---|---|---|---|---|---|---|---|
| Jan | Feb | Mar | Apr | May | June | July | Aug | Sep | Oct | Nov | Dec | |
| Shanghai | 0.765 | 0.764 | 0.777 | 0.790 | 0.823 | 0.809 | 0.819 | 0.845 | 0.871 | 0.887 | 0.891 | 0.798 |
| Henan | 0.736 | 0.735 | 0.747 | 0.760 | 0.792 | 0.778 | 0.787 | 0.813 | 0.838 | 0.853 | 0.858 | 0.768 |
| Beijing | 0.753 | 0.752 | 0.765 | 0.778 | 0.811 | 0.797 | 0.806 | 0.832 | 0.858 | 0.873 | 0.878 | 0.786 |
| Shandong | 0.737 | 0.737 | 0.749 | 0.762 | 0.794 | 0.780 | 0.789 | 0.814 | 0.840 | 0.855 | 0.859 | 0.769 |
| Jiangsu | 0.751 | 0.750 | 0.763 | 0.776 | 0.808 | 0.794 | 0.803 | 0.829 | 0.855 | 0.870 | 0.875 | 0.783 |
| Jilin | 0.763 | 0.762 | 0.775 | 0.788 | 0.821 | 0.807 | 0.816 | 0.843 | 0.869 | 0.884 | 0.889 | 0.796 |
| Hunan | 0.736 | 0.736 | 0.748 | 0.761 | 0.793 | 0.779 | 0.788 | 0.813 | 0.839 | 0.854 | 0.858 | 0.768 |
| Guangxi | 0.736 | 0.736 | 0.748 | 0.761 | 0.793 | 0.779 | 0.788 | 0.813 | 0.839 | 0.854 | 0.858 | 0.769 |
| Guangdong | 0.749 | 0.749 | 0.761 | 0.774 | 0.807 | 0.793 | 0.802 | 0.828 | 0.854 | 0.869 | 0.873 | 0.782 |
| Zhejiang | 0.790 | 0.789 | 0.802 | 0.816 | 0.850 | 0.836 | 0.845 | 0.872 | 0.900 | 0.916 | 0.921 | 0.824 |
| Hainan | 0.737 | 0.736 | 0.748 | 0.761 | 0.793 | 0.780 | 0.788 | 0.814 | 0.839 | 0.854 | 0.859 | 0.769 |
| Fujian | 0.746 | 0.746 | 0.758 | 0.771 | 0.804 | 0.790 | 0.799 | 0.824 | 0.850 | 0.865 | 0.870 | 0.779 |
| Guizhou | 0.729 | 0.728 | 0.740 | 0.753 | 0.785 | 0.771 | 0.780 | 0.805 | 0.830 | 0.845 | 0.849 | 0.760 |
| Jiangxi | 0.770 | 0.769 | 0.782 | 0.796 | 0.829 | 0.815 | 0.824 | 0.850 | 0.877 | 0.893 | 0.897 | 0.803 |
| Heilongjiang | 0.724 | 0.724 | 0.736 | 0.749 | 0.780 | 0.767 | 0.775 | 0.800 | 0.825 | 0.840 | 0.844 | 0.756 |
| Sichuan | 0.740 | 0.740 | 0.752 | 0.765 | 0.797 | 0.783 | 0.792 | 0.818 | 0.843 | 0.858 | 0.863 | 0.773 |
| Chongqing | 0.766 | 0.765 | 0.778 | 0.792 | 0.825 | 0.811 | 0.820 | 0.846 | 0.873 | 0.888 | 0.893 | 0.800 |
| Anhui | 0.735 | 0.734 | 0.747 | 0.760 | 0.791 | 0.778 | 0.787 | 0.812 | 0.837 | 0.852 | 0.857 | 0.767 |
| Liaoning | 0.732 | 0.731 | 0.744 | 0.757 | 0.788 | 0.775 | 0.783 | 0.808 | 0.834 | 0.849 | 0.853 | 0.764 |
| Tianjin | 0.723 | 0.722 | 0.734 | 0.747 | 0.778 | 0.765 | 0.773 | 0.798 | 0.823 | 0.838 | 0.842 | 0.754 |
| Hubei | 0.727 | 0.726 | 0.738 | 0.751 | 0.783 | 0.769 | 0.778 | 0.803 | 0.828 | 0.843 | 0.847 | 0.759 |
| Yunnan | 0.729 | 0.729 | 0.741 | 0.754 | 0.785 | 0.772 | 0.780 | 0.805 | 0.831 | 0.845 | 0.850 | 0.761 |
| Hebei | 0.737 | 0.736 | 0.748 | 0.761 | 0.793 | 0.779 | 0.788 | 0.814 | 0.839 | 0.854 | 0.859 | 0.769 |
| Shanxi | 0.719 | 0.718 | 0.730 | 0.743 | 0.774 | 0.761 | 0.769 | 0.794 | 0.819 | 0.833 | 0.838 | 0.750 |
| Ningxia | 0.716 | 0.715 | 0.727 | 0.740 | 0.771 | 0.757 | 0.766 | 0.791 | 0.815 | 0.830 | 0.834 | 0.747 |
| Shaanxi | 0.726 | 0.725 | 0.737 | 0.750 | 0.781 | 0.768 | 0.777 | 0.802 | 0.827 | 0.841 | 0.846 | 0.757 |
| Inner Mongolia | 0.720 | 0.719 | 0.731 | 0.744 | 0.775 | 0.762 | 0.771 | 0.795 | 0.820 | 0.835 | 0.839 | 0.751 |
| Gansu | 0.717 | 0.716 | 0.728 | 0.741 | 0.772 | 0.758 | 0.767 | 0.791 | 0.816 | 0.831 | 0.835 | 0.748 |
| Qinghai | 0.717 | 0.716 | 0.728 | 0.741 | 0.772 | 0.759 | 0.767 | 0.792 | 0.817 | 0.831 | 0.836 | 0.748 |
| Tibet | 0.715 | 0.714 | 0.726 | 0.739 | 0.769 | 0.756 | 0.765 | 0.789 | 0.814 | 0.829 | 0.833 | 0.746 |
| Xinjiang | 0.720 | 0.719 | 0.731 | 0.744 | 0.775 | 0.762 | 0.771 | 0.795 | 0.820 | 0.835 | 0.839 | 0.751 |
Disclaimer/Publisher’s Note: The statements, opinions and data contained in all publications are solely those of the individual author(s) and contributor(s) and not of MDPI and/or the editor(s). MDPI and/or the editor(s) disclaim responsibility for any injury to people or property resulting from any ideas, methods, instructions or products referred to in the content. |
© 2025 by the authors. Licensee MDPI, Basel, Switzerland. This article is an open access article distributed under the terms and conditions of the Creative Commons Attribution (CC BY) license (http://creativecommons.org/licenses/by/4.0/).
Copyright: This open access article is published under a Creative Commons CC BY 4.0 license, which permit the free download, distribution, and reuse, provided that the author and preprint are cited in any reuse.


